1. Introduction
The television broadcasting transmitted over packet networks has rapidly become an important service for internet service providers (ISP). Network convergence realized during the 1990s allowed the transportation of different types of services (voice, video, and data) via integrated network infrastructure. However, several issues appeared. Packet networks had not been prepared to transmit time-sensitive services. This problem was solved by adopting a prioritization strategy which focuses on the processing of real-time services by routers with guaranteed preference. Widely-used transport protocol for real-time services (often presented by the marketing term triple play services)—UDP—offers unreliable connectionless communication without any guarantee of delivery. This could potentially lead to packet loss, especially within networks with a high utilization level caused by the lack of bandwidth.
For the purposes of our research we’ve defined IPTV as the broadcast of television (TV) channels (content is broadcasted at the same time as via other broadcasting systems). The IP/UDP/RTP protocol stack has been used and streamed to a set-top box directly connected to a TV device (or PC). This requires the use of adequate network infrastructure and support from the streaming technology.
Convergence and digitalization have had a significant impact on the regulatory environment. Worldwide triple play services subscriptions reached over 400 million in 2017, and brought considerable benefit to customers in terms of a reasonable service price. Many countries distinguish between regulation covering the distribution and multimedia content, and therefore there is a tendency to prepare regulatory framework dedicated to the quality of IPTV services [
1]. It is essential to select parameters and their minimal values to secure an accepted level of Quality of Service (QoS), as well as to be able to monitor these parameters, while being aware of the influence on the final end-user quality perception.
For many years, QoS has represented the main evaluation framework, nevertheless, QoS cannot precisely reflect the user´s perception. Thus, the concept of Quality of Experience (QoE) has been created and standardized step by step by the International Telecommunication Union (ITU) [
2,
3].
This concept usually requires real observers for subjective video quality analysis, which is a time-consuming operation. Monitoring of network parameters (e.g., packet loss or overall delay) is relatively easy for network providers, however, these parameters are related to the network behavior rather than to the customer. Disadvantages of subjective testing are reflected in the inability to perform and evaluate the tests continuously and immediately.
Hence, our proposed method implements a form of application (Python programming language—works for Windows and Linux) that is able to predict how the human visual system comprehends video quality and distortions introduced within the transmission chain. It allows correction of the interpretation and transformation of the objective score to a subjective point of view. The voice over IP (VoIP) service, as a part of triple play services, includes a standardized mapping function for QoS to QoE conversion (E-model-R factor to user satisfaction expressed in the MOS—Mean Opinion Score scale. However, a QoS to QoE unified transformation function in video quality analysis is still missing. This may cause difficulties for national regulator authorities in terms of customer complaints handling, because the results obtained from objective metrics related to the network behavior cannot be translated correctly to the end-user perception. In relation to this, the main purpose of our system is to offer an application capable of user satisfaction level prediction (by using a mapping function in the form of neural network classificatory), based on the specific video sequence features and network utilization.
2. State-of-the-Art
Video content has been growing consistently and is becoming the dominant portion of all data traffic sent via packet networks.
Typically, an IPTV broadcasting has a one-way direction (communication with the content provider is non-essential in this case), thus, the network delay does not play a significant role in comparison to the voice service. Packet loss caused by the inadequate dimension of the transmission system may, in particular, be a serious network impairment that impacts the overall video quality [
4].
Two main topics are usually presented in research papers. Firstly, the robustness of video codecs to packet loss within the network. Secondly, the fact that even when a new digital representant of the video signal is announced, researchers test and verify compression efficiency and complexity, which reflects required computed power [
4,
5].
The release of video codecs like VP9 (Google) and H.265 (collaboration between MPEG and ITU-T) started the process of their evaluation and comparison with their predecessors.
As mentioned above, QoS metrics are limited when it comes to characterization of the end-user perceptual experience. Using the results obtained by video quality assessment from QoE instead of QoS appears to be a better solution because (i) increasing QoS does not directly improve QoE, and (ii) improving only QoS can increase operating costs remarkably, consequently decreasing the profit of service providers.
Subjective testing needs real observers, hence, the test performing is a time-consuming and costly activity. This leads to a tendency to substitute the testing by objective metrics, which attempt to simulate human perception. These metrics are based on mathematical models and require the original reference video sequence to compute a score of quality for a degraded video sample.
The main motivation behind this work is to come up with a new method of interconnection between the results obtained from both subjective and objective methods. Subjective tests typically use a MOS scale of 1–5 where 5 is the best. On the other hand, every objective metric uses its own scale, and to this day there is no unified mapping function to interpret objective results into a point of view of subjective score that could be expressed by the MOS scale. The PSQA (pseudo subjective quality assessment) is the first attempt to use a neural network as a tool of artificial intelligence [
6].
In that work, the authors used qualitative video parameters, like packet loss or bitrate, as the input, and a trained neural network for subjective score calculation. Although only an old codec MPEG-2, low resolution (352 × 288), and a small-size test set were used, this paper served as the basic concept for our present work. In the report of D. Valderrama and colleagues [
7], different video attributes were selected. Authors performed the training process of a neural network with inputs such as different length of GOP (group of pictures), prioritization policies (BestEffort and DiffServ), or they created bottlenecks on the testing network topology. Pearson´s coefficient reached more than 0.9, but again, only one low resolution (720 × 480) and several packet loss scenarios (1%, 5%, 10%) were used. Works of research teams led by D. Botia and J. Søgaard [
8,
9] proposed regression functions for video quality calculation. Based on the video content (dynamic or static scenes), the correlation coefficient oscillated between 0.7 and 0.9. The paper of D. Mocanu [
10] provided a summary of applicability for several machine learning tools, and the performed tests showed that the neural network obtained the highest correlation coefficient.
Authors of the papers [
11,
12] used regression functions for subjective score prediction only for the newer video codec H.265 but with UHD resolution absented, and Pearson´s coefficient was over 0.92. The research team of M. Alreshoodi [
13] created their own fuzzy rules to QoE prediction. They extracted specific qualitative video sequence attributes, namely spatial and time information. Their fuzzy interface system allowed them to estimate QoE results in the MOS scale with a correlation of more than 0.95. Software-defined networks (SDN) as a cloud computing technology also serve as a way of multimedia content transport. T Abar et al. [
14] tested several machine learning tools and tried to find the best correlation. They used resolutions ranging from 320 × 240 to 1280 × 720, with several bitrates and packet losses. The best results were obtained by using a decision tree with an M5P algorithm, where there was a correlation coefficient slightly over 0.81.
All the above-mentioned works tried to propose a computational model capable of deriving the subjective perception of video quality from objective parameters. The next section brings a comprehensive view of all video parameters, such as codec and scene type, bitrate, resolution, together with their influence on prediction accuracy.
Section 4 describes the whole process of application making, as well as verification of the predicted outputs. The Discussion and Conclusion section provides a summary of work and future plans related to this topic.
3. Methodology
3.1. Video Processing
TV broadcasting consists of several resolutions, bitrates, and codecs. Nowadays, the most used compression standard presented in a wide spectrum of applications, ranging from mobile video to broadcasting in high definition (HDTV), is MPEG-4 H.264/AVC (MPEG Part 10). This codec improves the key features of its predecessor, such as changeable size of motion compensation blocks, or multiple reference frame motion estimation [
5]. High-Efficiency Video Coding (HEVC), referred to as H.265, offers a similar level of picture quality, with a bitrate of about the half of the size, or it increases the visual quality at the same bitrate as H.264. It supports resolutions up to 8 K UHD (8192 × 4320). The main improvements for HEVC include motion compensated prediction (various coding areas ranging from 16 × 16 to 64 × 64 pixels), better accuracy for motion vectors calculation (up to 35 directions, compared to nine in H.264), or sample adaptive offset, which reduces artifacts at block edges.
The disadvantage of better efficiency is reflected in a higher need for computation power. The complexity of HEVC requires more powerful hardware to encode the same video quality as H.264. [
15].
TV broadcast bitrate typically ranges between 10 and 15 Mbps (better for premium channels), and, according to the tests performed by public service broadcasters, 15 Mbps looks like a standard bitrate for HEVC for the near future [
5,
15].
High-definition (HD) broadcasting provides an image resolution that is at least twice as high as the standard-definition offered by television. HD is the current standard video format for terrestrial and cable TV broadcasting, Blu-ray discs, and streaming videos over the internet. The following resolutions were used: HD (1280 × 720), FullHD (1920 × 1080) and UltraHD (3840 × 2160).
3.2. Video Transmission
To transfer the video files via transmission infrastructure based on IP protocol, basically unreliable protocols are used. Communication between two nodes leaves the sender without feedback regarding the missing parts of data. There are also some exceptions. Some special video streaming services (video on demand—VoD), e.g., Netflix or YouTube, use the reliable transmission protocol TCP instead of the unreliable UDP.
First, the main purpose of these streaming services is not to provide real-time broadcasting. TCP uses an error-check function, and in the case of packet drop, TCP forwards missing packets again. These services also use prefetching and buffering to realize perfect play-out. On the other hand, TV broadcasting is a live streaming during which the process of buffering and waiting for potential retransmission of missing parts adds an undesirable play-out delay in comparison to, for example, terrestrial TV broadcasting. UDP provides only the most basic transport layer functionality, it is used with higher layer protocols such as RTP (real-time transport protocol) or RTCP (RTP control protocol), which secure correct incoming packet ordering or statistical and control information. These VoD platforms also support the streaming technology HTTP-DASH (dynamic adaptive streaming over HTTP), which allows for better adaptation to network congestion and changes the video quality dynamically (e.g., reduction of resolution). HTTP needs reliable communication, which again disqualifies UDP, but it is not appropriate for real-time TV broadcasting [
16].
Packet loss typically takes place when the network is congested. Internal buffers of network elements are full and incoming packets drop. Our previous works proved that packet loss higher than 1% caused significant deterioration of video quality [
4,
17], thus we focused primarily on packet loss as the major network impairment on overall video service quality.
Our research was principally focused on live TV streaming, which needs to be monitored by the national regulation authority. Many countries (e.g., EU countries, New Zealand) differentiate between transmission at the schedule time (subject to broadcasting and content regulations) and VoD platforms enabling a user to select what and when they watch. Quality of service evaluation is likely to be an issue that the regulator will consider. IPTV providers can control QoS because they use their own privately-managed network. It will be important for regulators to define minimal quality criterions and make sure that consumer interests are protected [
18].
Our hybrid system can help with the creation of an IPTV regulatory framework, and it also serves as the baseline for minimal quality standard criteria selection.
3.3. Methods for Video Quality Assessment
At first, we had to select an objective and subjective assessment method. The objective method SSIM offers high correlation with human perception and is widely used. As depicted in
Figure 1, the calculation process is derived from an analysis of contrast, brightness, and structure similarity with the reference video sequence. Results are shown in the form of a quality score for the investigated video, where 0 means no similarity with the reference and 1 means two identical sequences or images.
SSIM is a full-reference metric that improves older techniques based on the ratio between the maximum possible value of a signal and the power of distorting noise, the so-called peak signal-to-noise ratio (PSNR). SSIM calculation differs by evaluating the structural distortion instead of the error rate.
The final SSIM score is a combination of three parameters, with reference signal x and encoded test signal y being defined as follows [
4]:
Element l(x,y) compares the brightness differences between x and y;
Element c(x,y) compares the contrast of the signal;
Element s(x,y) measures the structural similarity;
α > 0, β > 0, γ > 0 measures the weight of individual elements.
ITU-T standardized two subjective methods for video quality assessment. The first one is called the DCR (degradation category rating) method. Sequences are presented in pairs—the first sequence presented in each pair is always the reference video sequence, while the second stimulus is the test video sequence [
2].
The absolute category rating method (ACR) is a category judgment where the test sequences are presented one at a time. This approach requires that after each presentation the observers are asked to evaluate the quality of the sequence shown (MOS scale). The time schedule for the stimulus presentation is illustrated by
Figure 2. The ACR method was selected by us, in order to reflect the real situation where the end-user cannot compare the delivered quality of video with the original video sequence [
2].
4. Making of Testing Video Sequences
In order to create a neural network able to estimate subjective quality based on the objective score and selected video attributes, we needed to prepare testing video sequences in the required quality. None of the mentioned models in State-of-the-art can predict H.264 and H.265 concurrently by one model.
The recommendation by ITU-T P.910 [
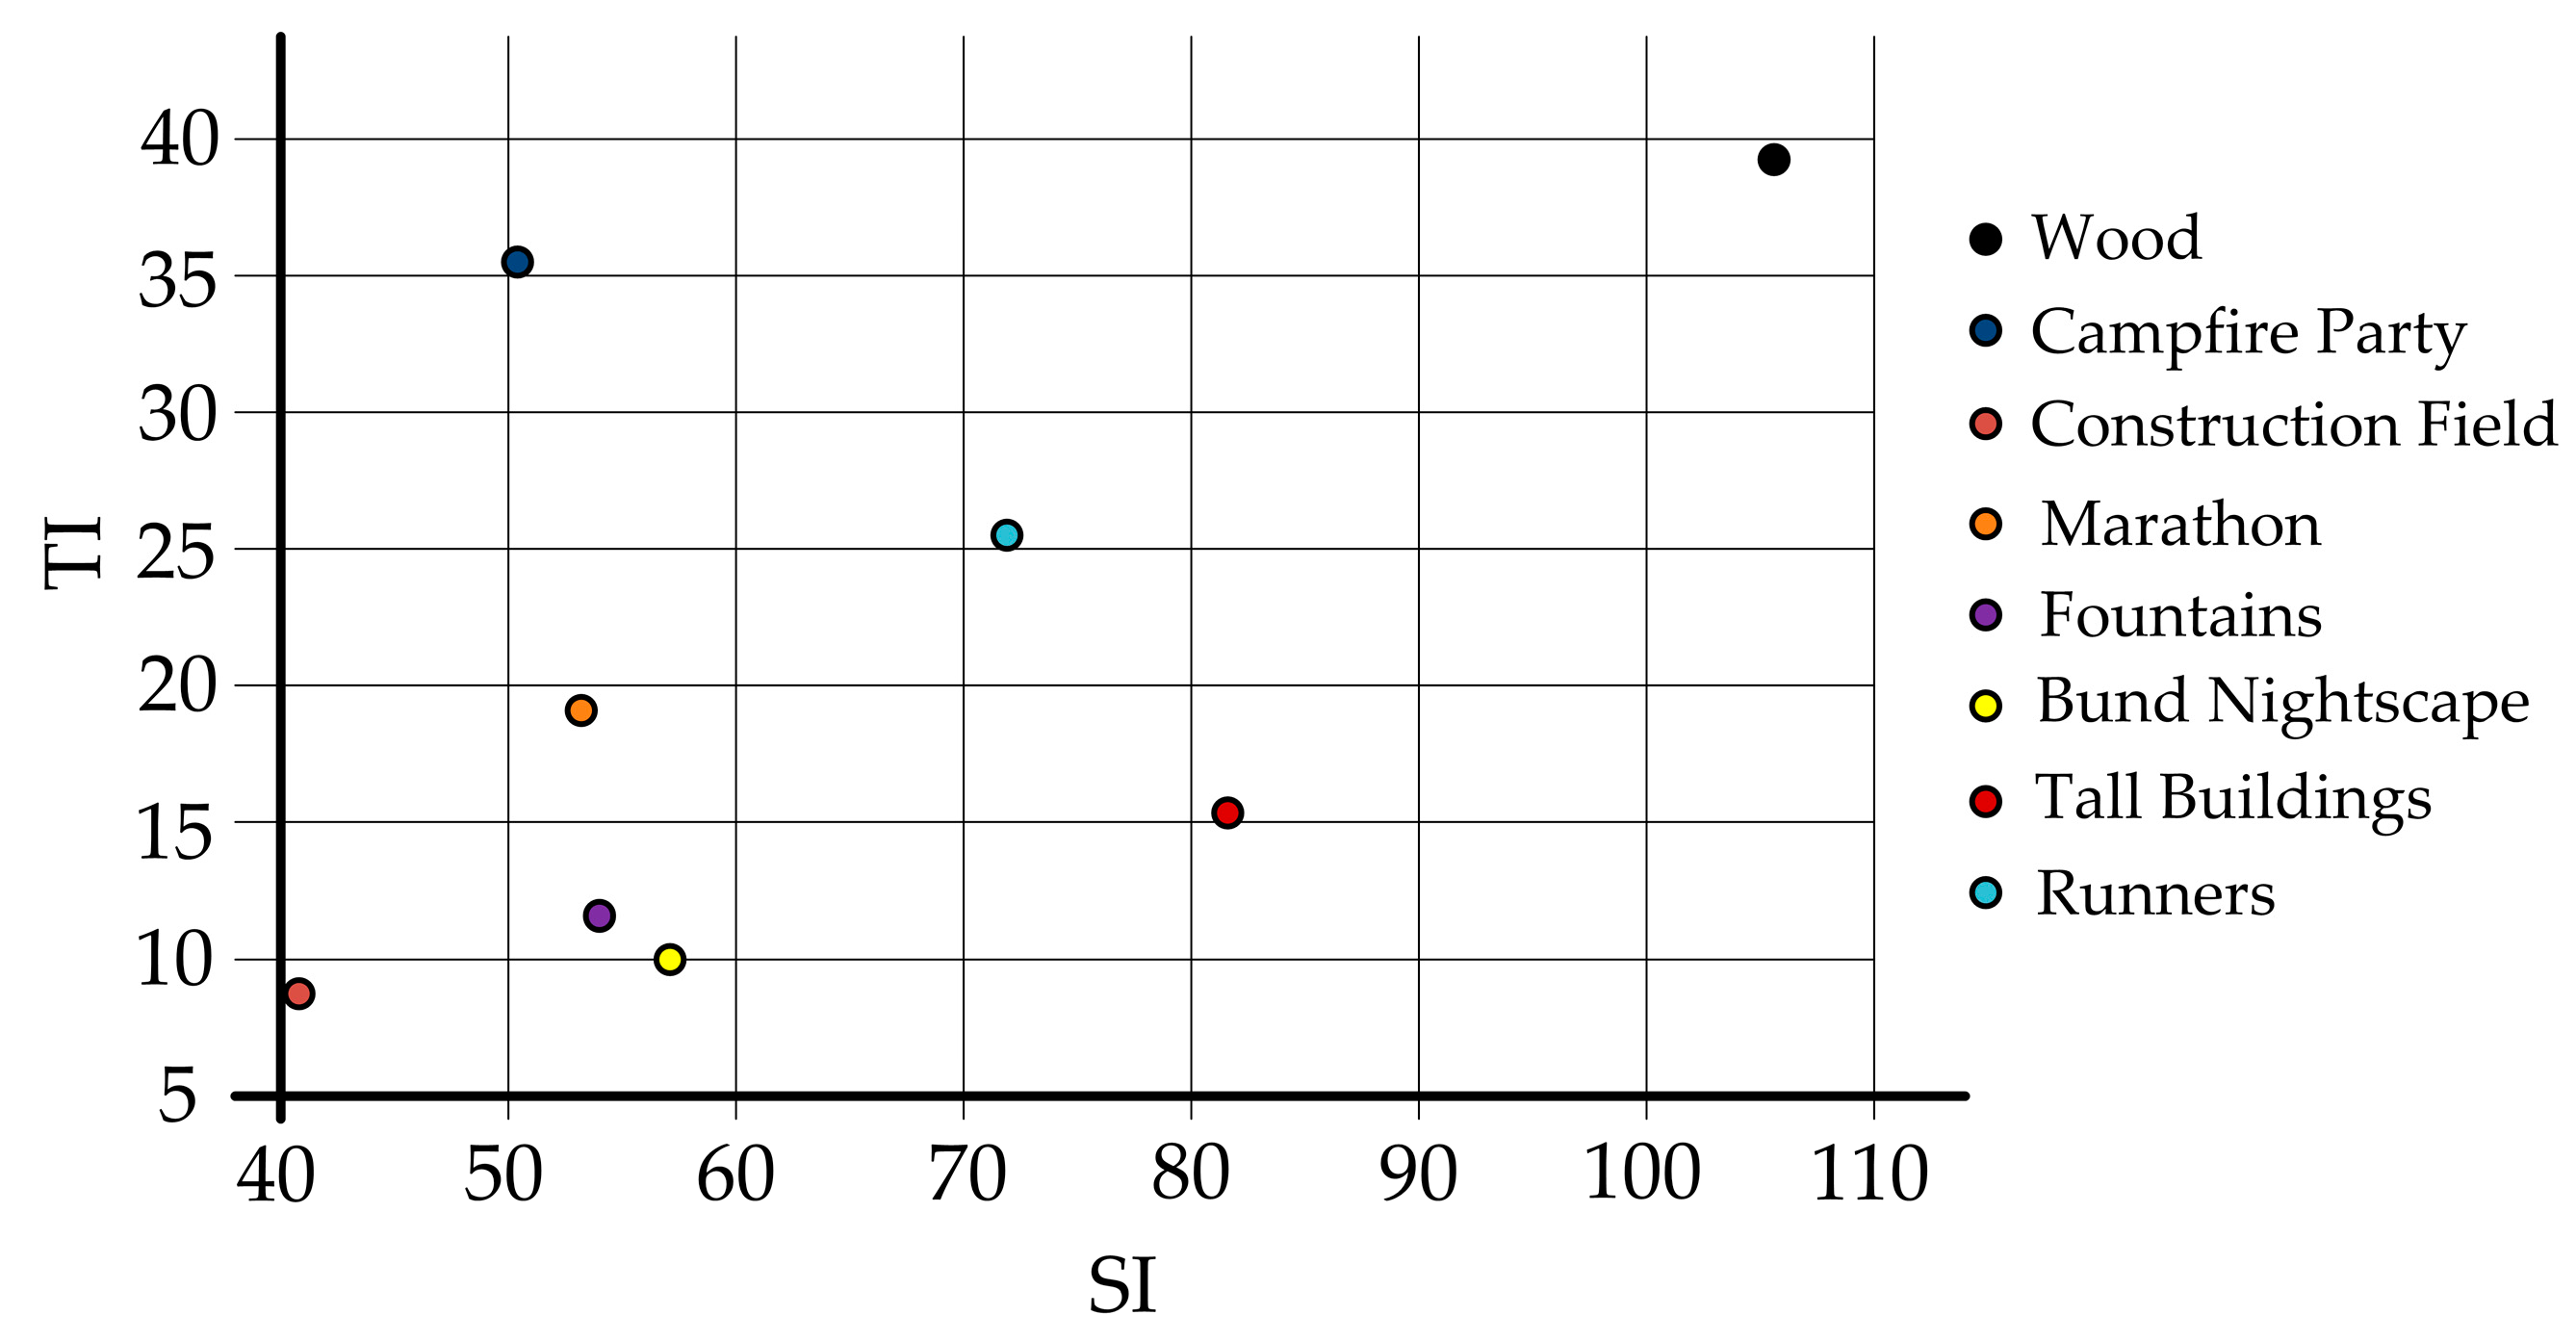
2] defines several categories of video content according to the time and spatial (SI and TI) information. These two parameters describe the character of the scene (e.g., sport, action movie, static TV news).
The temporal perceptual information (TI) is based on the differences in motion expressed by the feature, M
n (i, j), that represent the change between the pixel at the same location in space for following times or frames. M
n (i, j) as a function of time (n) is expressed as:
where F
n (i, j) is the pixel at the i-th row and j-th column of n-th frame in time. The calculation of the temporal information (TI) is computed as the maximum over time (max
time) of the standard deviation over space (std
space) of M
n (i, j) over all (i) and (j):
The spatial perceptual information (SI) is based on the Sobel filter. For each video frame within the time n (F
n), the Sobel filter [Sobel(F
n)] is applied first. The standard deviation over the pixels (std
space) in each Sobel-filtered frame is then calculated. This action is repeated for each frame in the video sequence and results in a time series of spatial information regarding the scene. The maximum value in the time series (max
time) has been selected to characterize the spatial information content of the scene. This method can be represented as follows:
A research team from Shanghai Jiao Tong University released its own uncompressed UHD video sequences in YUV format for testing purposes [
19]. This public database is available to the research community free of charge.
Video sequences are 10 seconds long with frame rate 30, therefore all videos contain 300 frames and offer various scenes in a range of spatial and temporal parameters, as depicted in
Figure 3.
As per the ITU-T recommendation, we decided to use four sequences—one from each of the four quadrants of the spatial–temporal information graph [
2]. Our database was made from these types of video sequences:
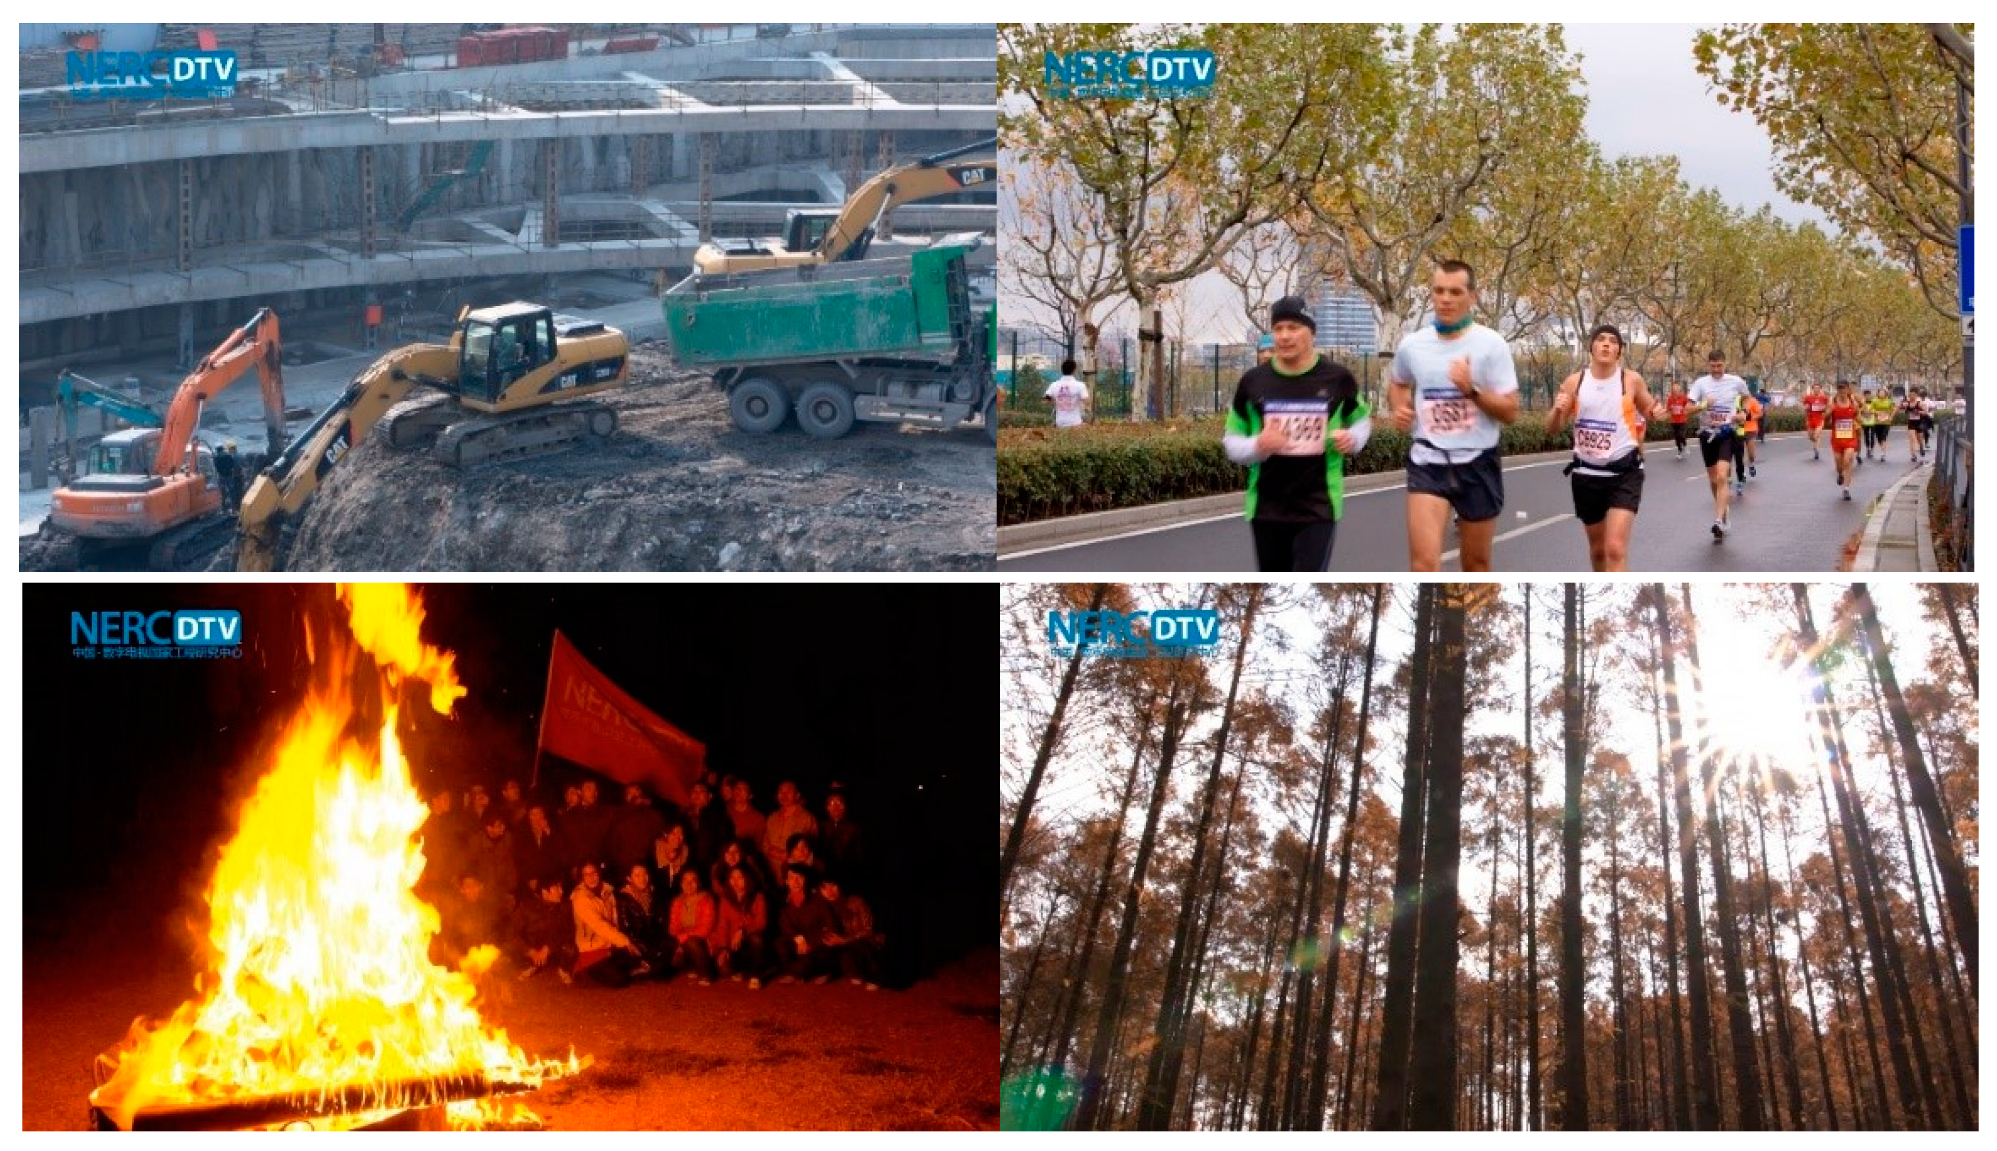
Construction Field—A construction vehicle is surrounded by buildings under construction. Dynamic objects include an excavator and walking workers. The scene is captured as a static shot;
Runners—A marathon race, static shot again, dynamic movement of racers;
Wood—Forest scenery, the dynamic camera is moving from left to right and the motion accelerates in the sequence. The highest values for spatial and temporal information;
Campfire Party—Night scene, relatively static people near the bonfire. Fast change of flame moving.
All sequences have been encoded in the UHD resolution (3840 × 2160); 4:2:0 colour sampling and 8 bits per sample (16.7 million colours) correspond with the typical TV broadcasting profile. The measurement procedure consisted of the following steps.
First, selected sequences were downloaded from the webserver [
19] in YUV format (the uncompressed format) and used as the reference sequences. Afterwards, all video sequences were encoded to both MPEG compression standards, H.264/AVC and H.265/HEVC, via the FFmpeg tool (includes ×264 and ×265 encoders). The target bitrates were set to 5, 10, and 15 Mbps, and the group of picture format (GOP) was set to the half of the framerate, i.e., M = 3, N = 15. Finally, the quality between these sequences (encoded back to YUV format) and the reference (uncompressed) sequence was compared and evaluated. This was done by using the MSU Video Quality Measuring Tool. A simulation of quality disruption by packet dropping was performed by FFmpeg and VLC Player software, the first serving as a streaming server and the second one as playout. We captured and saved the broadcast stream via the local computer interface using VLC Player. During the streaming process, we set the packet loss to 0.1% on the local interface. Then, we repeated this step for packet loss in increments of 0.2%, 0.3%, 0.5%, 0.75%, and 1%. The streaming process was based on the RTP/UDP/IP method with MPEG-TS (Transport Stream), thus we completely adopted the mechanism of IPTV transmission over the IP network [
20]. A total of 432 testing video sequences were created. In order to obtain a reference output for our designed model, we needed to have a subjective evaluation of the testing video sequences. We prepared a testing room with a TV screen, meeting the conditions stated in ITU-T BT.500-13 [
3].
There were 60 observers in the age range 18–35. Men dominated the ratio 38:22. ACR was selected as the subjective assessment method. The whole measuring process is described in
Figure 4.
4.1. Database of Subjective and Objective Tests Results
Subjective evaluation can be affected by high variability. Due to this fact, we needed to verify how precisely the calculated mean represents the subjective perception. For every test sequence, the variation coefficient was calculated. The variation coefficient is defined as the ratio of the standard deviation (σ) to the mean. If the value of this statistical parameter is higher than 50%, the arithmetic average cannot be used for data representative purposes due to its significant dispersion of collected data. We computed the variation coefficient for all obtained subjective evaluations, and discovered that only 50 from a total of 432 testing video sequences had a variation coefficient higher than 35%, and none of them exceeded 40%. All results are shown below in
Figure 5 and
Figure 6.
According to these results, we can make the following deductions:
4.2. Using the Database for Neural Network Modeling
The database of subjective and objective evaluations is used for neural network (NN) inputs, as well as a reference for finding, testing, and validating NN topology and activation function. As can be seen, many scenarios and network situations were performed. Obtained results serve as NN inputs, namely packet loss, resolution, bitrate, codec type, SSIM, and characteristic of the scene (static, dynamic, sport, and night). As an output, the MOS value would be calculated and compared with a reference value obtained from the dataset.
5. The Neural Network as a Classification for Subjective Video Quality Estimation
The artificial neural network is a computing system inspired by the biological neural network. NN currently provides the best solutions to many problems, such as recognition issues (images, emotions), or for the creation of prediction models (e.g., voice/video quality approximation).
5.1. Neural Network Characteristics Modeling
The multi-layer perceptron (MLP) is a feedforward neural network consisting of one input layer, at least one hidden layer, and one output layer. Feedforward means that data move from the input to the output layer. This type of network is trained by the back-propagation learning algorithm. MLPs are widely used for prediction, pattern classification, recognition, and estimation. MLP can resolve problems which are not separable linearly. The principal benefit of neural networks lies in an iterative learning process, in which the dataset is loaded to the network one at a time, and the weights associated with the input values are changed each time. After presenting all cases, the process often starts over again. During this learning stage, the network learns by calibrating the weights, which allows us to predict the proper outcome of input samples. Advantages of neural networks involve their adaptability to noisy data, as well as their capability to classify patterns on which they have not been trained.
Decisions regarding the number of layers and the number of neurons per layer are crucial. These settings to a feedforward, back-propagation topology show the "art" of the network designer. In our case, we tested more than 140 topologies (up to eight layers and a maximum of 230 neurons per layer).
Activation functions are an extremely important feature of the artificial network modeling process. They decide whether a neuron should be activated or not, and whether the information that the neuron is receiving is relevant for the given information or should be ignored. The activation function is the generally non-linear mapping function between inputs and the response variable. Because of this, finding the best fitting activation function is the second step of NN modeling. During the training of the NN, we had set several well-known activation functions (sigmoid, hyperbolic tangent, ReLu), and chosen the best one based on the measured values (correlation, RSME, and computing time).
The proposed model was implemented in Python language that supported several tools for modeling and computation, e.g., library Keras, packages NumPy, Scipy or Theano.
The dataset creation resulted in 25,920 (432 × 60) observations for training, validation, and testing of the neural network. After that, approximately 30% of the randomly chosen observations from the training set formed a validation set, which was then used to confirm the ability of the neural network to estimate the video quality. The training and validation were repeated 10 times. The proposed system achieved a high correlation with Pearson’s Coefficient around 0.989 and RMSE of 0.2155 (MOS), which corresponds to an error of approximately 7% (related to the middle of the MOS scale). More than 73% of all observations lay within 10% relative error, as depicted in
Figure 7. Since packet loss has a great impact on video quality, many of the observations in all sets are below the threshold of 2.5.
Figure 8 shows four testing video sequences [
19].
5.2. Verification of the Proposed Model
The proposed model works with two video codecs, namely H.264 and H.265. The testing dataset which had not participated in the training and validation phase was divided into two equal smaller groups, unique for codecs H.264 and H.265. This step helped us recognize if the prediction accuracy was similar for both codecs. All statistics methods were performed with a significance level of 0.05.
Table 1 shows the comparison (prediction of subjective perception in MOS) of median, modus, confidential intervals, and standard derivation for the reference and testing set for both video codecs. As described, the reference and model datasets were very comparable. Because the Shapiro–Wilk test of normality rejected the hypothesis of the datasets’ normal distribution, a nonparametric test, called the Mann–Whitney–Wilcoxon U test, was selected as the next statistical method. This test could be used to determine whether two independent samples came from the same population. It figured out whether two sample means were equal or not. Calculated values coming from this test are shown in
Table 2. Because the p-value of the Mann–Whitney–Wilcoxon test is higher than the critical value 0.05, it will be assumed that there is no significant difference between the reference and model datasets. Correlation diagrams are depicted in
Figure 9. Error function RMSE is even better for all testing datasets, and the two model outputs greatly correlated with their reference outputs.
The last phase of verification was a comparison with the models published so far. As shown in
Table 3, our prediction model based on a back propagation neural network (BPNN) reached better results in all cases except for the first one (for the nowadays outdated codec MPEG-2) that has created the basis for our research and motivation.
Our model can estimate subjective perceptions of video quality not only for mentioned codecs, but also for the three resolutions, which have not been offered by any of the below-mentioned models.
6. Discussion
In
Table 3 we can see that several machine learning methods were used. Some models do not use any extracted video features (e.g., codec type or bitrate) as an input for mapping function. The high regression value of Pearson´s correlation coefficient indicates how good our proposed model is. The obtained value of more than 0.98 suggests that the neural network has gained a high level of accuracy. Due to the usage of video features and packet loss (major network impairment for video service) we can simulate a high scale of scenarios and adapt service behavior more precisely than any other mentioned model. We plan to continue with research in this field and prepare an extended version of the application. We want to incorporate comments and feedback obtained from real deploying, and add more scenes for accuracy improvement. We are also discussing the implementation of other video codecs, such as VP9, AVI, or MP4, that are not used primarily for IPTV, but which are met by end-users in VoD services. Finally, because smartphones have become a powerful tool, we want to make a version for the Android environment.
Research in this field is still interesting and actual. Authors in [
25] created a video service recovery mechanism that performs network load balancing according to the MOS value. Paper [
26] dealt with picture quality enhancements. Poor quality images evaluated by objective metrics PSNR and SSIM are improved by computer vision techniques and then analyzed again. The proposed framework used a temporal information feature and should be an interesting way of improving video service quality in an unreliable IP environment. In [
27], the research team prepared a subjectively evaluated dataset. As a main video sequence feature, they used SI and TI information. Their video quality assessment dataset should eliminate the need for frequently subjective test performances.
7. Conclusions
This paper described an application that offers a prediction of subjective video quality related to the specific video attributes and objective quality score. Network (content) providers have to monitor and solve problems appearing in transmission infrastructure. They have to know not only the objective score, but also realize the impact of network behavior on subjective customer perceptions of quality. We tested many scenarios, including two codecs, three bitrates and resolutions, four scenes, and packet loss up to 1%. The proposed prediction model, based on machine learning principles, is unique because it offers subjective quality estimation for H.264 and H.265 by one common mapping function. Our monitoring tool aims to be a helpful tool for video quality estimation, and it can serve as a baseline for creating a regulatory framework devoted to QoS for IPTV providers.
Author Contributions
J.F. proposed the system idea and edited the manuscript. J.F., J.N., J.V. and R.M. developed, tested and validated data. J.F. and J.N. wrote the manuscript. J.F. critically evaluated the quality of the research data and experimental methods used to generate/acquire them as well as the soundness/validity of the scientific and engineering techniques, wrote the manuscript, and performed its final edits.
Funding
This article was supported by the Ministry of Education of the Czech Republic (Projects No. SP2019/80, SP2019/85). This article was also supported by the European Regional Development Fund in the Research Centre of Advanced Mechatronic Systems project, project number CZ.02.1.01/0.0/0.0/16_019/0000867 within the Operational Programme Research, Development and Education. This work was supported by the European Regional Development Fund in Research Platform focused on Industry 4.0 and Robotics in Ostrava project, CZ.02.1.01/0.0/0.0/17_049/0008425 within the Operational Programme Research, Development and Education.
Acknowledgments
We appreciate the editors and peer reviewers for their valuable comments and suggestions. The authors would like to thank MDPI Institutional Open Access Program (IOAP) and University of Zilina for membership in this program.
Conflicts of Interest
The authors declare no conflict of interest.
References
- Latal, J.; Wilcek, Z.; Kolar, J.; Vojtech, J. Measurement of IPTV Services on a Hybrid Access Network. In Proceedings of the 20th International Conference on Transparent Optical Networks (ICTON), Bucharest, Romania, 1–5 July 2018. [Google Scholar]
- International Telecommunications Union. ITU-T P.910. Subjective Video Quality Assessment Methods for Multimedia Applications; International Telecommunications Union: Geneva, Switzerland, 2008. [Google Scholar]
- International Telecommunications Union. ITU-T BT.500-13. Methodology for the Subjective Assessment of the Quality of Television Pictures; International Telecommunications Union: Geneva, Switzerland, 2012. [Google Scholar]
- Frnda, J.; Voznak, M.; Rozhon, J.; Mehic, M. Prediction Model of QoS for Triple Play Services. In Proceedings of the 21st Telecommunications Forum (Telfor), Belgrade, Serbia, 26–28 November 2013; pp. 733–736. [Google Scholar]
- Bienik, J.; Uhrina, M.; Kuba, M.; Vaculik, M. Performance of H. 264, H. 265, VP8 and VP9 Compression Standards for High Resolutions. In Proceedings of the 19th International Conference on Network-Based Information Systems (NBiS), Ostrava, Czech Republic, 7–9 September 2016; pp. 246–252. [Google Scholar]
- Mohamed, S.; Rubino, G. A Study of Real-Time Packet Video Quality Using Random Neural Networks. IEEE Trans. Circuits Syst. Video Technol. 2002, 12, 1071–1083. [Google Scholar] [CrossRef]
- Valderrama, D.; Gómez, N. Nonintrusive Method Based on Neural Networks for Video Quality of Experience Assessment. Adv. Multimed. 2016, 2016. [Google Scholar] [CrossRef]
- Botia, D.; Gaviria, N.; Menedez, J.; Jimenez, D. An approach to correlation of QoE metrics applied to VoD service on IPTV using a Diffserv Network. In Proceedings of the 4th IEEE Latin-American Conference on Communications, Cuenca, Ecuador, 7–9 November 2012. [Google Scholar]
- Søgaard, J.; Forchhammer, S.; Korhonen, J. Video quality assessment and machine learning: Performance and interpretability. In Proceedings of the 7th International Workshop on Quality of Multimedia Experience (QoMEX), Pylos-Nestoras, Greece, 26–29 May 2015. [Google Scholar]
- Mocanu, D.C.; Pokhrel, J.; Garella, P.; Seppänen, J.; Liotou, E.; Narwaria, M. No-reference video quality measurement: added value of machine learning. J. Electron. Imaging 2016, 24, 6. [Google Scholar] [CrossRef]
- Cheng, Z.; Ding, L.; Huang, W.; Yang, F.; Qian, L. A unified QoE prediction framework for HEVC encoded video streaming over wireless networks. In Proceedings of the IEEE International Symposium on Broadband Multimedia Systems and Broadcasting (BMSB), Cagliari, Italy, 7–9 June 2017; pp. 1–6. [Google Scholar]
- Anegekuh, L.; Sun, L.; Jammeh, E.; Mkwawa, I.H.; Ifeachor, E. Content-Based Video Quality Prediction for HEVC Encoded Videos Streamed Over Packet Networks. IEEE Trans. Multimed. 2015, 17, 1323–1334. [Google Scholar] [CrossRef]
- Alreshoodi, M.; Adeyemi-Ejeye, A.O.; Woods, J.; Walker, S.D. Fuzzy logic inference system-based hybrid quality prediction model for wireless 4k UHD H.265-coded video streaming. IET Netw. 2015, 4, 296–303. [Google Scholar] [CrossRef]
- Abar, T.; Ben Letaifa, A.; El Asmi, S. Machine learning based QoE prediction in SDN networks. In Proceedings of the 13th International Wireless Communications and Mobile Computing Conference (IWCMC), Valencia, Spain, 26–30 June 2017; pp. 1395–1400. [Google Scholar]
- Tan, T.T.; Weerakkody, R.; Mrak, M.; Ramzan, N.; Baroncini, V.; Ohm, J.R.; Sullivan, G.J. Video Quality Evaluation Methodology and Verification Testing of HEVC Compression Performance. IEEE Trans. Circuits Syst. Video Technol. 2016, 26, 76–90. [Google Scholar] [CrossRef]
- Sayit, M.; Cetinkaya, C.; Yildiz, H.U.; Tavli, B. DASH-QoS: A scalable network layer service differentiation architecture for DASH over SDN. Comput. Netw. 2019, 154, 12–25. [Google Scholar] [CrossRef]
- Frnda, J.; Sevcik, L.; Uhrina, M.; Voznak, M. Network Degradation Effects on Different Codec Types and Characteristics of Video Streaming. Adv. Electr. Electron. Eng. 2014, 12, 377–383. [Google Scholar] [CrossRef]
- ITU News. IPTV: New challenges for regulators. ITU News, October 2008; 31–32ISSN 1020-4148. [Google Scholar]
- Song, L.; Tang, X.; Zhang, W.; Yang, X.; Xia, O. The SJTU 4K video sequence dataset. In Proceedings of the 5th International Workshop on Quality of Multimedia Experience, Klagenfurt am Worthersee, Austria, 3–5 July 2013. [Google Scholar]
- International Telecommunications Union. ITU-T Y.1910. IPTV Functional Architecture; International Telecommunications Union: Geneva, Switzerland, 2008. [Google Scholar]
- Zinner, T.; Abboud, O.; Hohlfeld, O.; Hossfeld, T.; Tran-Gia, P. Towards QoE Management for Scalable Video Streaming. In Proceedings of the 21st ITC Specialist Seminar on Multimedia Applications—Traffic, Performance and QoE, Miyazaki, Japan, 2–3 March 2010. [Google Scholar]
- Adeyemi-Ejeye, A.O.; Alreshoodi, M.; Al-Jobouri, L.; Fleury, M.; Woods, J. Packet loss visibility across SD, HD, 3D, and UHD video streams. J. Vis. Commun. Image Represent. 2017, 45, 95–106. [Google Scholar] [CrossRef]
- Narwaria, M.; Lin, W. Machine Learning Based Modeling of Spatial and Temporal Factors for Video Quality Assessment. In Proceedings of the 18th IEEE International Conference on Image Processing (ICIP), Brussels, Belgium, 11–14 September 2011; pp. 2513–2516. [Google Scholar]
- Singh, G.K.D.; Hadjadj-Aoul, Y.; Rubino, G. Quality of experience estimation for adaptive Http/Tcp video streaming using H.264/AVC. In Proceedings of the 9th Anual IEEE Consumer Communications and Networking Conference Multimedia and Entertaiment Networking and Services, Las Vegas, NV, USA, 14–17 January 2012; pp. 127–131. [Google Scholar]
- Zhang, H.; Wang, R.Y.; Liu, H. Video Service Recovery Mechanism Based on Quality of Experience-Aware in Hybrid Wireless-Optical Broadband-Access Network. Mob. Netw. Appl. 2018, 23, 664–672. [Google Scholar] [CrossRef]
- Jammal, S.; Tillo, T.; Xiao, J. Multiview video quality enhancement without depth information. Signal Process. Image Commun. 2019, 75, 22–31. [Google Scholar] [CrossRef]
- Aldahdooh, A.; Masala, E.; Van Wallendael, G.; Lambert, P.; Barkowsky, M. Improving relevant subjective testing for validation: Comparing machine learning algorithms for finding similarities in VQA datasets using objective measures. Signal Process. Image Commun. 2019, 74, 32–41. [Google Scholar] [CrossRef]
© 2019 by the authors. Licensee MDPI, Basel, Switzerland. This article is an open access article distributed under the terms and conditions of the Creative Commons Attribution (CC BY) license (http://creativecommons.org/licenses/by/4.0/).


