Using Deep Principal Components Analysis-Based Neural Networks for Fabric Pilling Classification


Abstract
:1. Introduction
2. The Pilling Classification of Knitted Fabric
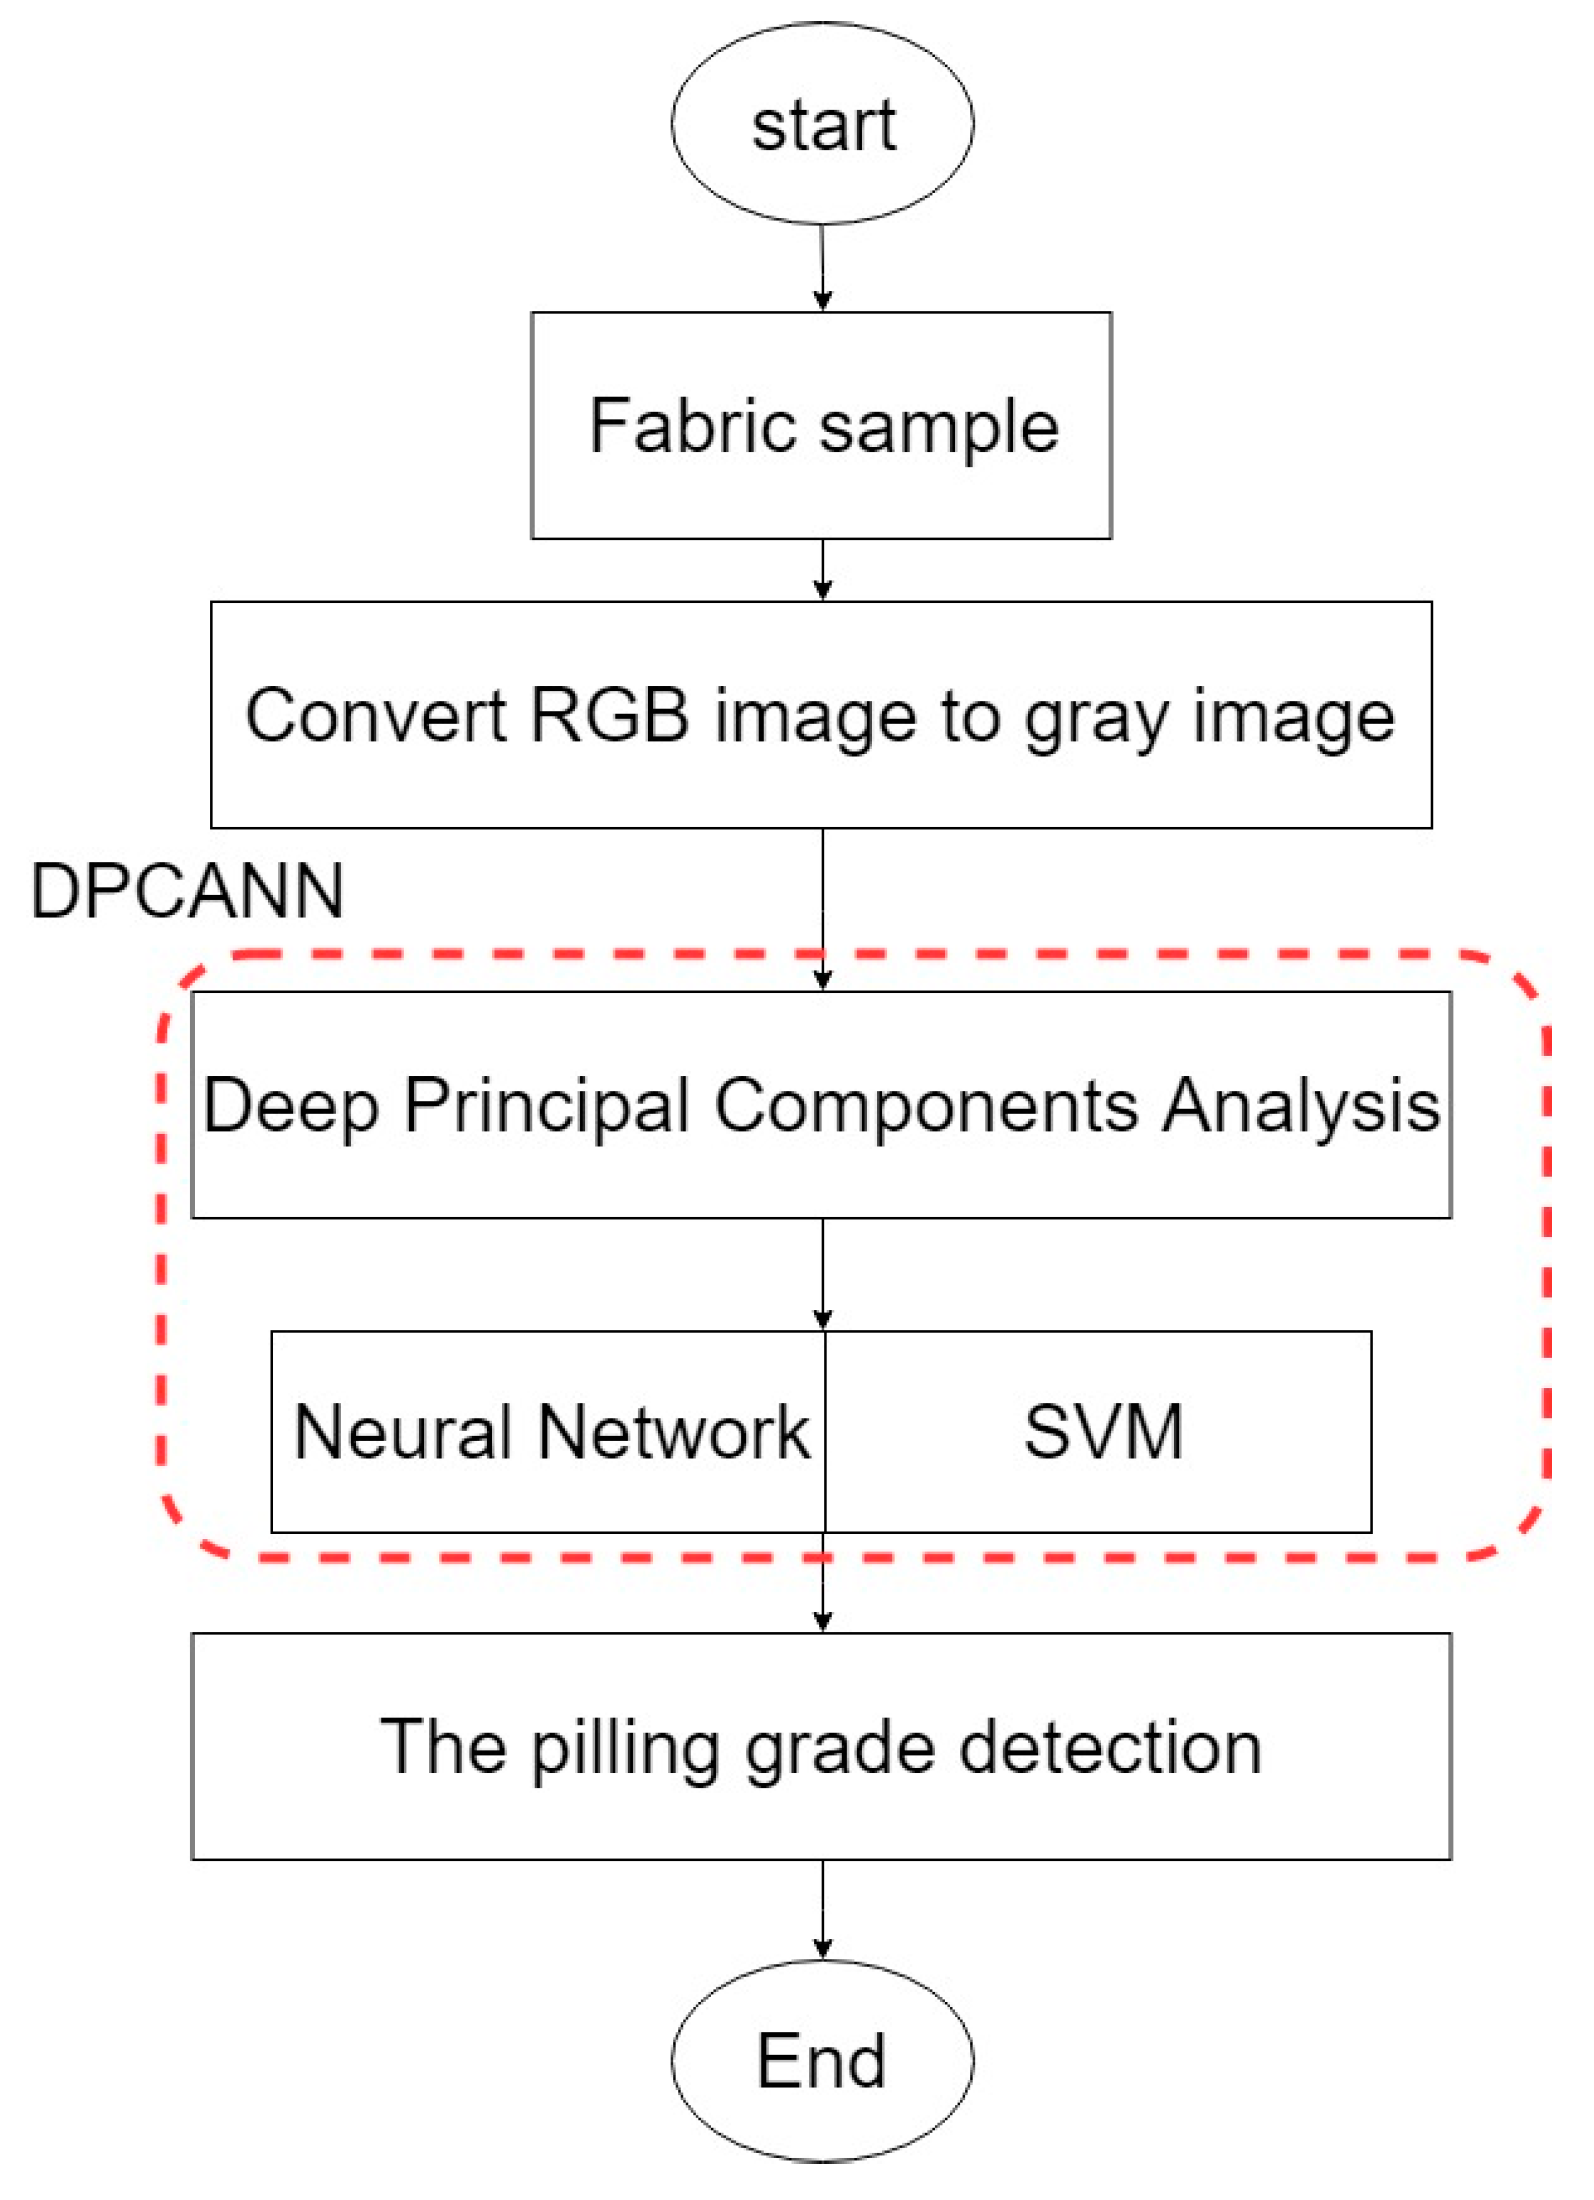
3. The Proposed Method
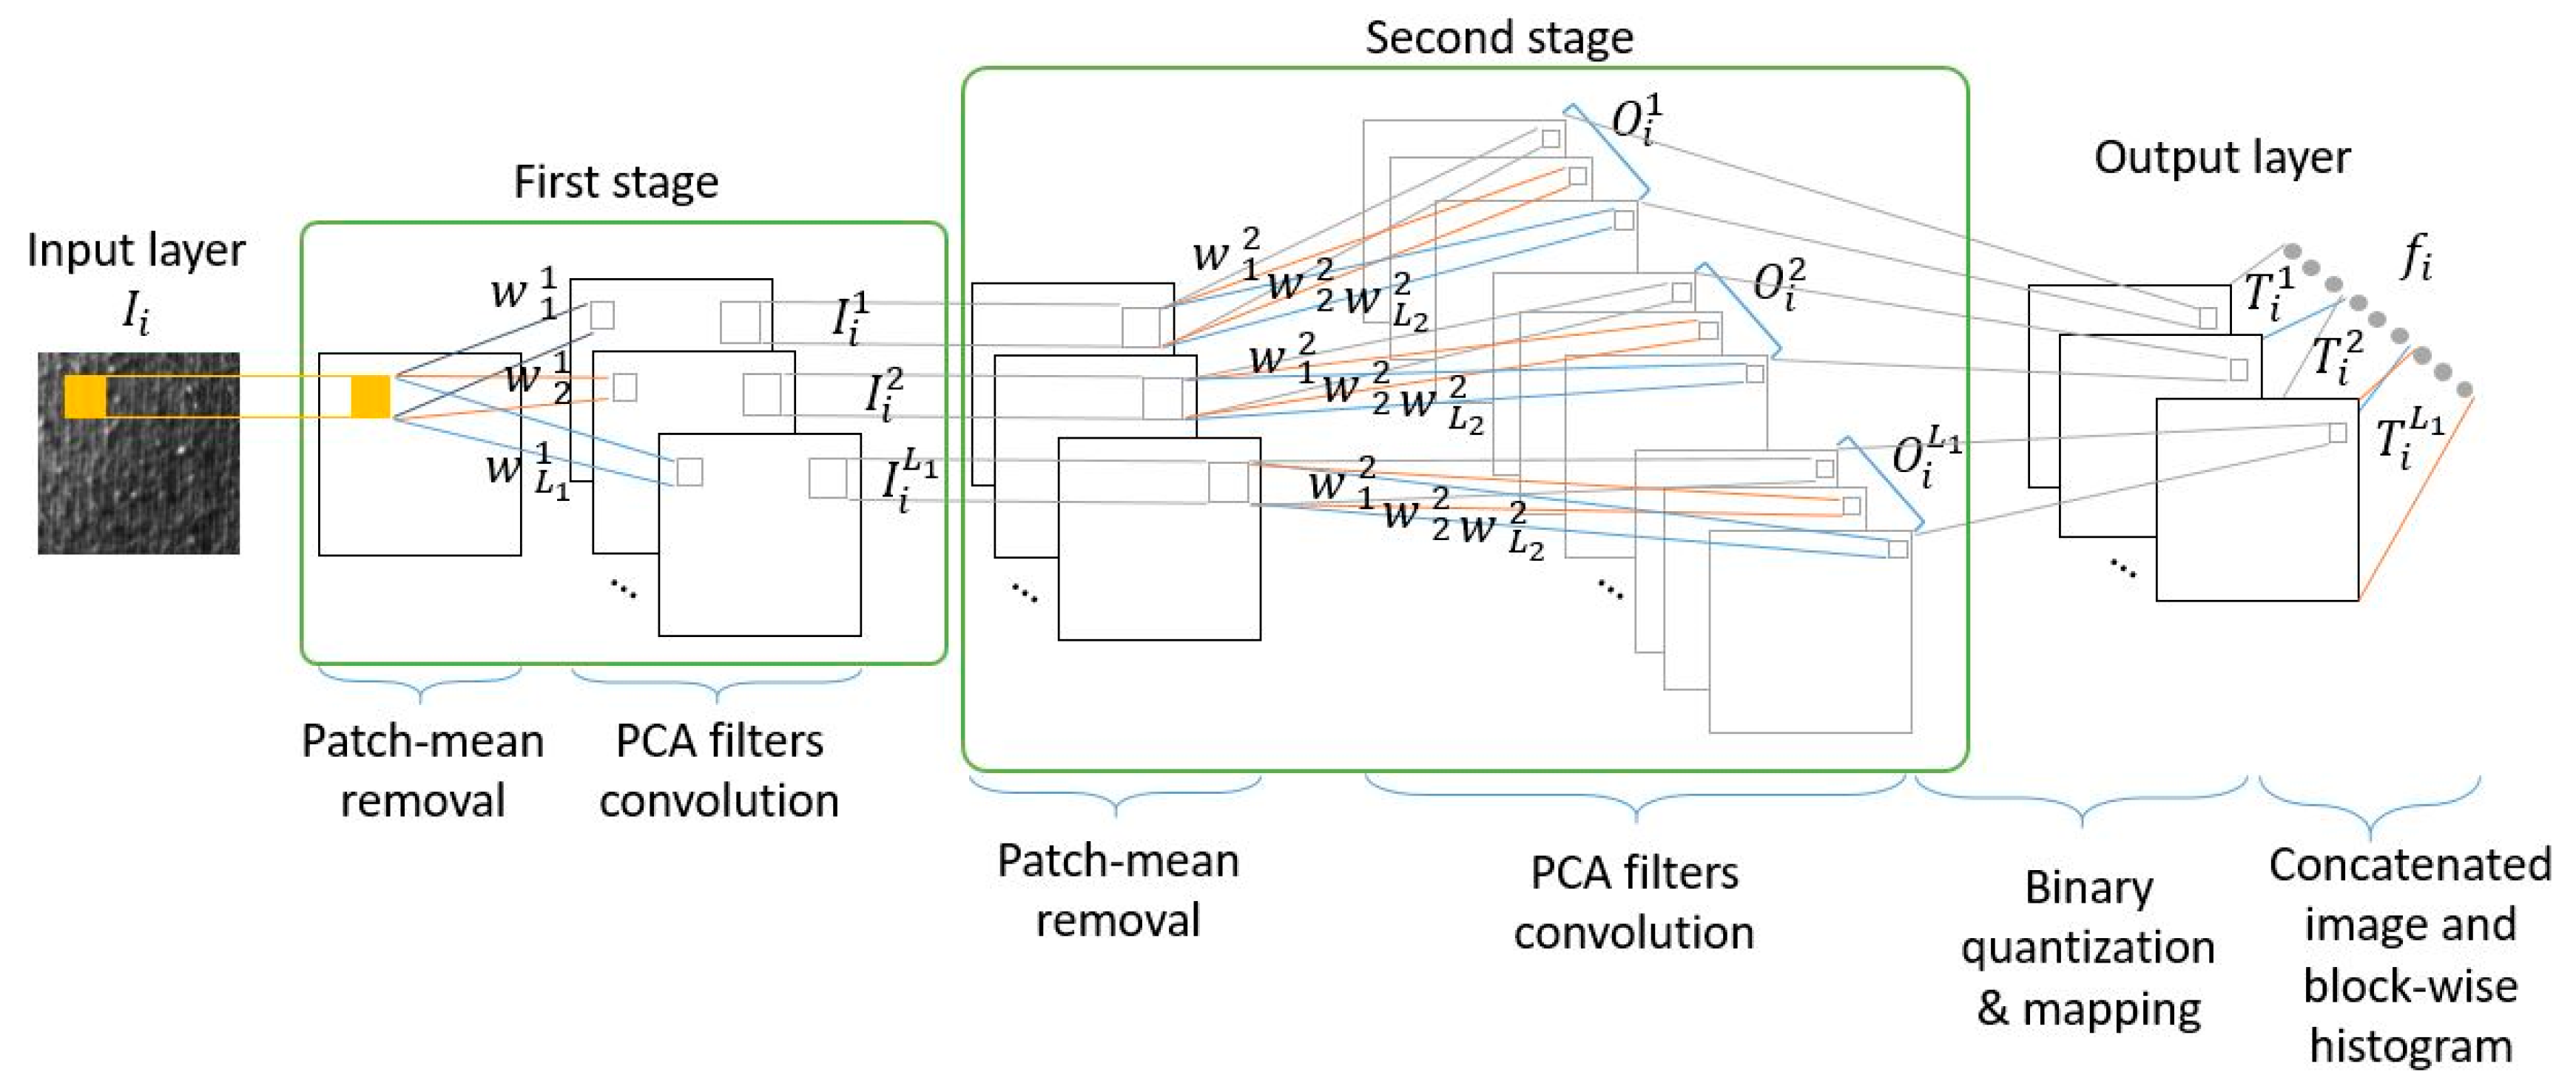
3.1. Deep Principal Components Analysis (DPCA)
3.1.1. The First Stage
3.1.2. The Second Stage
3.1.3. The Third Stage
3.2. Classifier
3.2.1. Neural Network Classifier
- Input Layer: The relationship of the input and the output signals are represented by the following equation.
- Hidden Layer: The input signal at node k is expressed as:where wij, i = 1, 2, …, NI, j = 1, 2, …, NH represents the weights between the input and the hidden layers.A sigmoid transfer function transferred the input to the output of the hidden layer. Hence, the output at node k is expressed as:
- Output Layer: The operation in the output layer is given as:where wjl, l = 1, 2, …, NO, represents the weights between the hidden and the output layers. The output is expressed as:
4. Support Vector Machine (SVM)
- Linear: When the data was linearly separable, mapping it to a high dimensional space was not needed. The core formula used was:
- Polynomial: For a polynomial core, the number of polynomials was equal to d, and . When , the polynomial core is equivalent to a linear kernel heart. The core formula used was:
- Radial Basis Function (RBF): The RBF core function is the most commonly used core of SVM. According to some experimental data, the classification ability of RBF is better than other core functions. For this study, the core formula used was:
- Sigmoid
5. Experimental Results
6. Conclusions
Author Contributions
Funding
Conflicts of Interest
References
- Deng, Z.; Wang, L.; Wang, X. An Integrated Method of Feature Extraction and Objective Evaluation of Fabric Pilling. J. Text. Inst. 2010, 102, 1–13. [Google Scholar] [CrossRef]
- Saharkhiz, S.; Abdorazaghi, M. The Performance of Different Clustering Methods in the Objective Assessment of Fabric Pilling. J. Eng. Fibers Fabr. 2012, 7, 35–41. [Google Scholar] [CrossRef]
- Eldessouki, M.; Hassan, M.; Bukhari, H.A.; Qashqari, K. Integrated Computer Vision and Soft Computing System for Classifying the Pilling Resistance of Knitted Fabrics. Fibres Text. East. Eur. 2014, 22, 106–112. [Google Scholar]
- Furferi, R.; Carfagni, M.; Governi, L.; Volpe, Y.; Bogani, P. Towards Automated and Objective Assessment of Fabric Pilling. Int. J. Adv. Robot. Syst. 2014, 11. [Google Scholar] [CrossRef]
- Yun, S.Y.; Kim, S.; Park, C.K. Development of an Objective Fabric Pilling Evaluation Method: Characterization of Pilling Using Image Analysis. Fibers Polym. 2013, 14, 832–837. [Google Scholar] [CrossRef]
- Techniková, L.; Tunák, M.; Janáček, J. Pilling Evaluation of Patterned Fabrics based on a Gradient Field Method. Indian J. Fibre Text. Res. 2016, 41, 97–101. [Google Scholar]
- Techniková, L.; Tunák, M.; Janáček, J. New Objective System of Pilling Evaluation for Various Types of Fabrics. J. Text. Inst. 2017, 108, 123–131. [Google Scholar] [CrossRef]
- LeCun, Y.; Bottou, L.; Bengio, Y.; Haffner, P. Gradient-based Learning Applied to Document Recognition. Proc. IEEE 1998, 86, 2278–2323. [Google Scholar] [CrossRef]
- Krizhevsky, A.; Sutskever, I.; Hinton, G.E. ImageNet Classification with Deep Convolutional Neural Networks. Adv. Neural Inf. Process. Syst. 2012, 1–9. [Google Scholar] [CrossRef]
- Lin, M.; Chen, Q.; Yan, S. Network in Network. In Proceedings of the ICLR Conference, Scottsdale, AZ, USA, 2–4 May 2013; pp. 1–10. [Google Scholar]
- Szegedy, C.; Liu, W.; Jia, Y.; Sermanet, P.; Reed, S.; Anguelov, D.; Erhan, D.; Vanhoucke, V.; Rabinovich, A. Going Deeper with Convolutions. In Proceedings of the 2015 IEEE Conference on Computer Vision and Pattern Recognition (CVPR), Boston, MA, USA, 7–12 June 2015; pp. 1–9. [Google Scholar]
- He, K.; Zhang, X.; Ren, S.; Sun, J. Deep Residual Learning for Image Steganalysis. Multimed. Tools Appl. 2017, 77, 10437–10453. [Google Scholar]
- Lin, H.Y.; Lin, C.J. Using a Hybrid of Fuzzy Theory and Neural Network Filter for Single Image Dehazing. Appl. Intell. 2017, 47, 1099–1114. [Google Scholar] [CrossRef]
- Pal, M.; Foody, G.M. Feature Selection for Classification of Hyperspectral Data by SVM. IEEE Trans. Geosci. Remote Sens. 2010, 48, 2297–2307. [Google Scholar] [CrossRef]
- Huang, M.L.; Fu, C.C. Applying Image Processing to the Textile Grading of Fleece Based on Pilling Assessment. Fibers 2018, 6, 73. [Google Scholar] [CrossRef]
- Lee, C.L.; Lin, C.J. Integrated Computer Vision and Type-2 Fuzzy CMAC Model for Classifying Pilling of Knitted Fabric. Electronics 2018, 7, 367. [Google Scholar] [CrossRef]
- Fu, C.C. Apply Image Processing Methods in Fabrics Objective Grading. Master’s Thesis, National Chin-Yi University of Technology, Taichung, Taiwan, 2017. [Google Scholar]
- Nguyen, B.P.; Tay, W.L.; Chui, C.K. Robust Biometric Recognition from Palm Depth Images for Gloved Hands. IEEE Trans. Hum. Mach. Syst. 2015, 45, 799–804. [Google Scholar] [CrossRef]
- Jing, J.; Zhang, Z.; Kang, X.; Jia, J. Objective Evaluation of Fabric Pilling Based on Wavelet Transform and the Local Binary Pattern. Text. Res. J. 2012, 82, 1880–1887. [Google Scholar] [CrossRef]
- Eldessouki, M.; Hassan, M. Adaptive Neuro-fuzzy System for Quantitative Evaluation of Woven Fabrics’ Pilling Resistance. Expert Syst. Appl. 2015, 42, 2098–2113. [Google Scholar] [CrossRef]

| Sample | 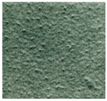 | 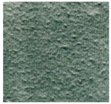 | 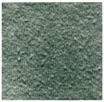 |  | 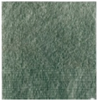 |
| Surface pilling | Very Serious | Serious | Medium | Light | N/A |
| Grades | One | Two | Three | Four | Five |
| DPCA | Neural Network | SVM | ||||
|---|---|---|---|---|---|---|
| Number of Filters | Patch Size | Number of Hidden Nodes | Learning Rate | Momentum | Epoch | Linear |
| 8 | 5*5 | 200 | 0.1 | 0.8 | 250 | |
| Data Sets | Accuracy Rate | |
|---|---|---|
| Neural Network | SVM | |
| Data set 1 | 93.75% | 96.87% |
| Data set 2 | 96.87% | 100% |
| Data set 3 | 100% | 100% |
| Data set 4 | 100% | 100% |
| Data set 5 | 100% | 100% |
| Data set 6 | 95.31% | 100% |
| Data set 7 | 100% | 100% |
| Data set 8 | 100% | 100% |
| Data set 9 | 100% | 100% |
| Data set 10 | 100% | 100% |
| Average accuracy rate | 98.6% | 99.7% |
| Data Sets | Accuracy Rate | |
|---|---|---|
| Neural Network | SVM | |
| Data set 1 | 100% | 100% |
| Data set 2 | 98.5% | 100% |
| Data set 3 | 99.25% | 100% |
| Data set 4 | 98.93% | 100% |
| Data set 5 | 97.18% | 99.06% |
| Data set 6 | 98.93% | 100% |
| Data set 7 | 98.75% | 100% |
| Data set 8 | 98.43% | 100% |
| Data set 9 | 98.37% | 100% |
| Data set 10 | 98.45% | 99.38% |
| Average accuracy rate | 98.68% | 99.84% |
| Methods | Average Accuracy Rate |
|---|---|
| Saharkhiz and Abdorazaghi [2] | 96.8% |
| Eldessouki et al. [3] | 87.5% |
| Furferi et al. [4] | 94.3% |
| Huang and Fu [15] | 96.6% |
| Lee and Lin [16] | 97.3% |
| Jing et al. [19] | 95.0% |
| Eldessouki and Hassan [20] | 85.8% |
| Fu [17] using k-NN | 96.8% |
| Fu [17] using enhanced k-NN [18] | 97.1% |
| Proposed method using k-NN | 98.4% |
| Proposed method using enhanced k-NN [18] | 98.8% |
| Proposed method using neural network | 98.6% |
| Proposed method using SVM | 99.7% |
© 2019 by the authors. Licensee MDPI, Basel, Switzerland. This article is an open access article distributed under the terms and conditions of the Creative Commons Attribution (CC BY) license (http://creativecommons.org/licenses/by/4.0/).
Share and Cite
Yang, C.-S.; Lin, C.-J.; Chen, W.-J. Using Deep Principal Components Analysis-Based Neural Networks for Fabric Pilling Classification. Electronics 2019, 8, 474. https://doi.org/10.3390/electronics8050474
Yang C-S, Lin C-J, Chen W-J. Using Deep Principal Components Analysis-Based Neural Networks for Fabric Pilling Classification. Electronics. 2019; 8(5):474. https://doi.org/10.3390/electronics8050474
Chicago/Turabian StyleYang, Chin-Shan, Cheng-Jian Lin, and Wen-Jong Chen. 2019. "Using Deep Principal Components Analysis-Based Neural Networks for Fabric Pilling Classification" Electronics 8, no. 5: 474. https://doi.org/10.3390/electronics8050474
APA StyleYang, C.-S., Lin, C.-J., & Chen, W.-J. (2019). Using Deep Principal Components Analysis-Based Neural Networks for Fabric Pilling Classification. Electronics, 8(5), 474. https://doi.org/10.3390/electronics8050474