Visible Light Communication System Based on Software Defined Radio: Performance Study of Intelligent Transportation and Indoor Applications


Abstract
1. Introduction
2. Experimental Setup
- Carrier frequency: max 30 MHz
- Bandwidth
- Sample width
- Number of states: max 4096-QAM
- Message symbols
- Used TX filter
- TX gain
- RX gain
- TX device IP address
- RX device IP address
Evaluation Parameters
3. A Feasibility Study on Indoor Visible Light Communication
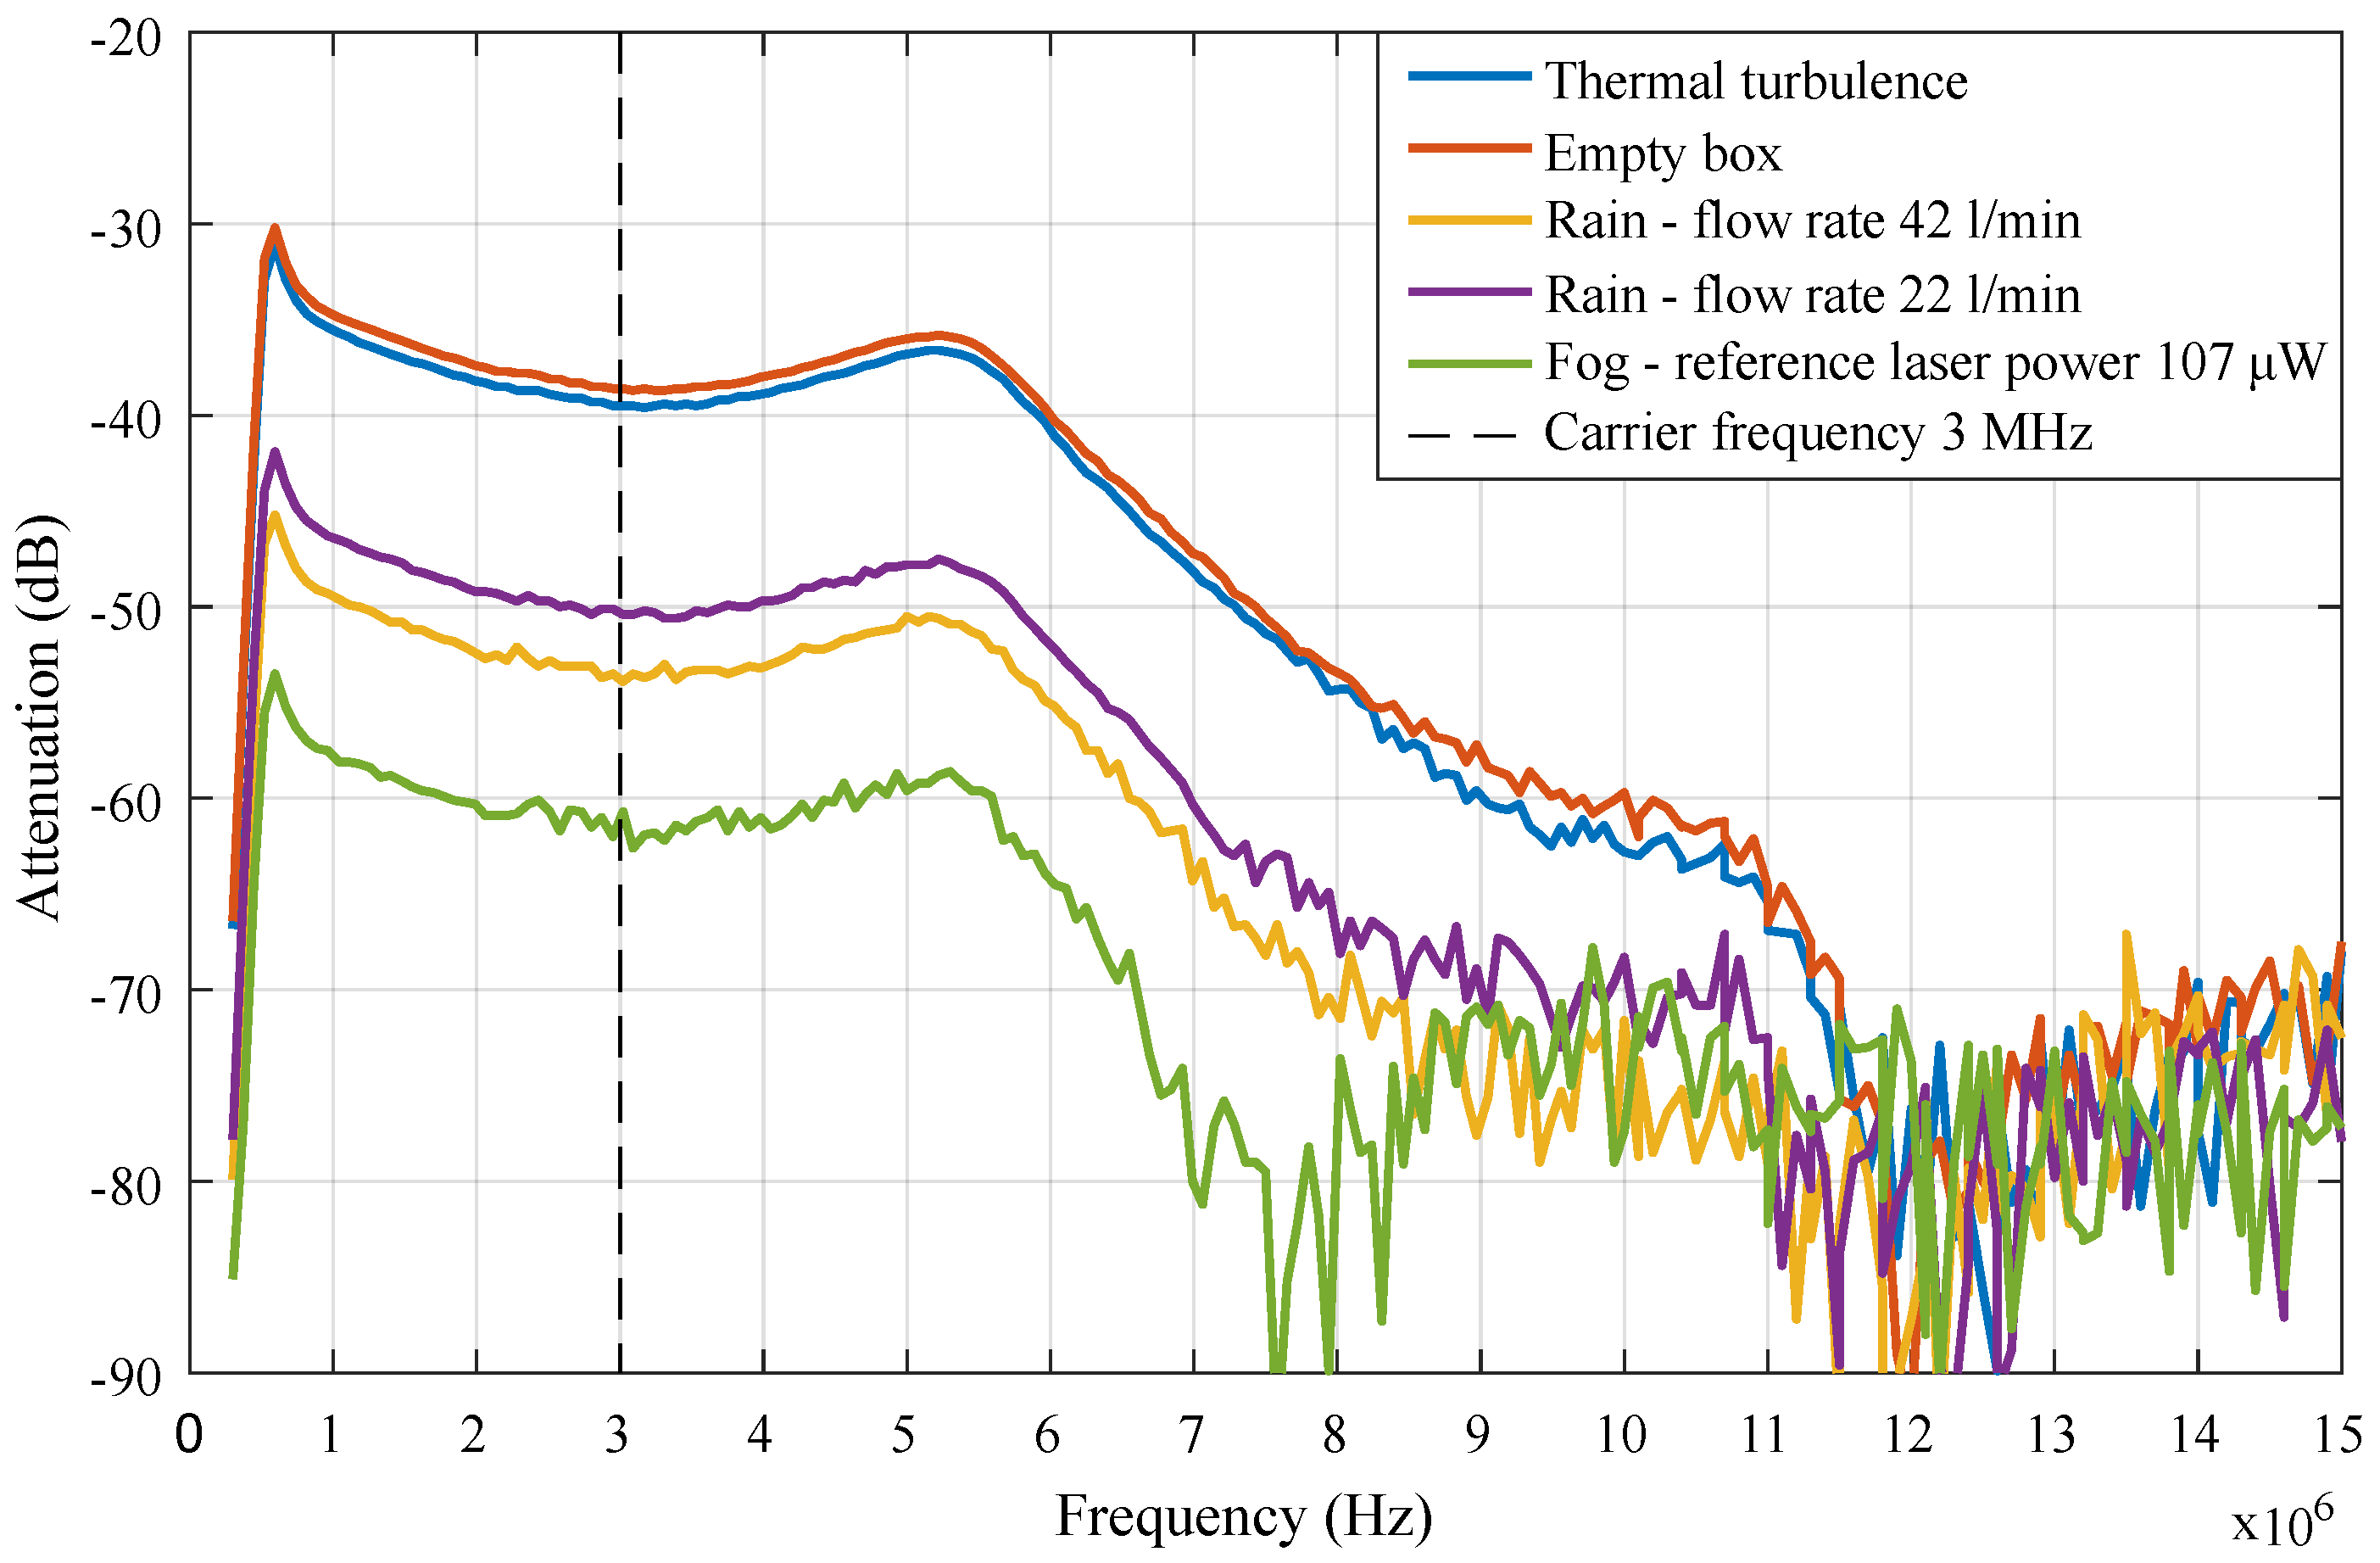
- Carrier frequency: 3 MHz
- Bandwidth: 1–4 MHz
- Modulation type: M-QAM
- TX/RX gain: 0 dB
- Message symbols: 10,000
- Tx filter: root raised cosine
- Sample width: 16-bit
- Receiver-transmitter distance: 202 cm
- Measured distance: 0–350 cm (step of 25 cm)
- Photodetector without planoconvex lens → more suitable for this scenario
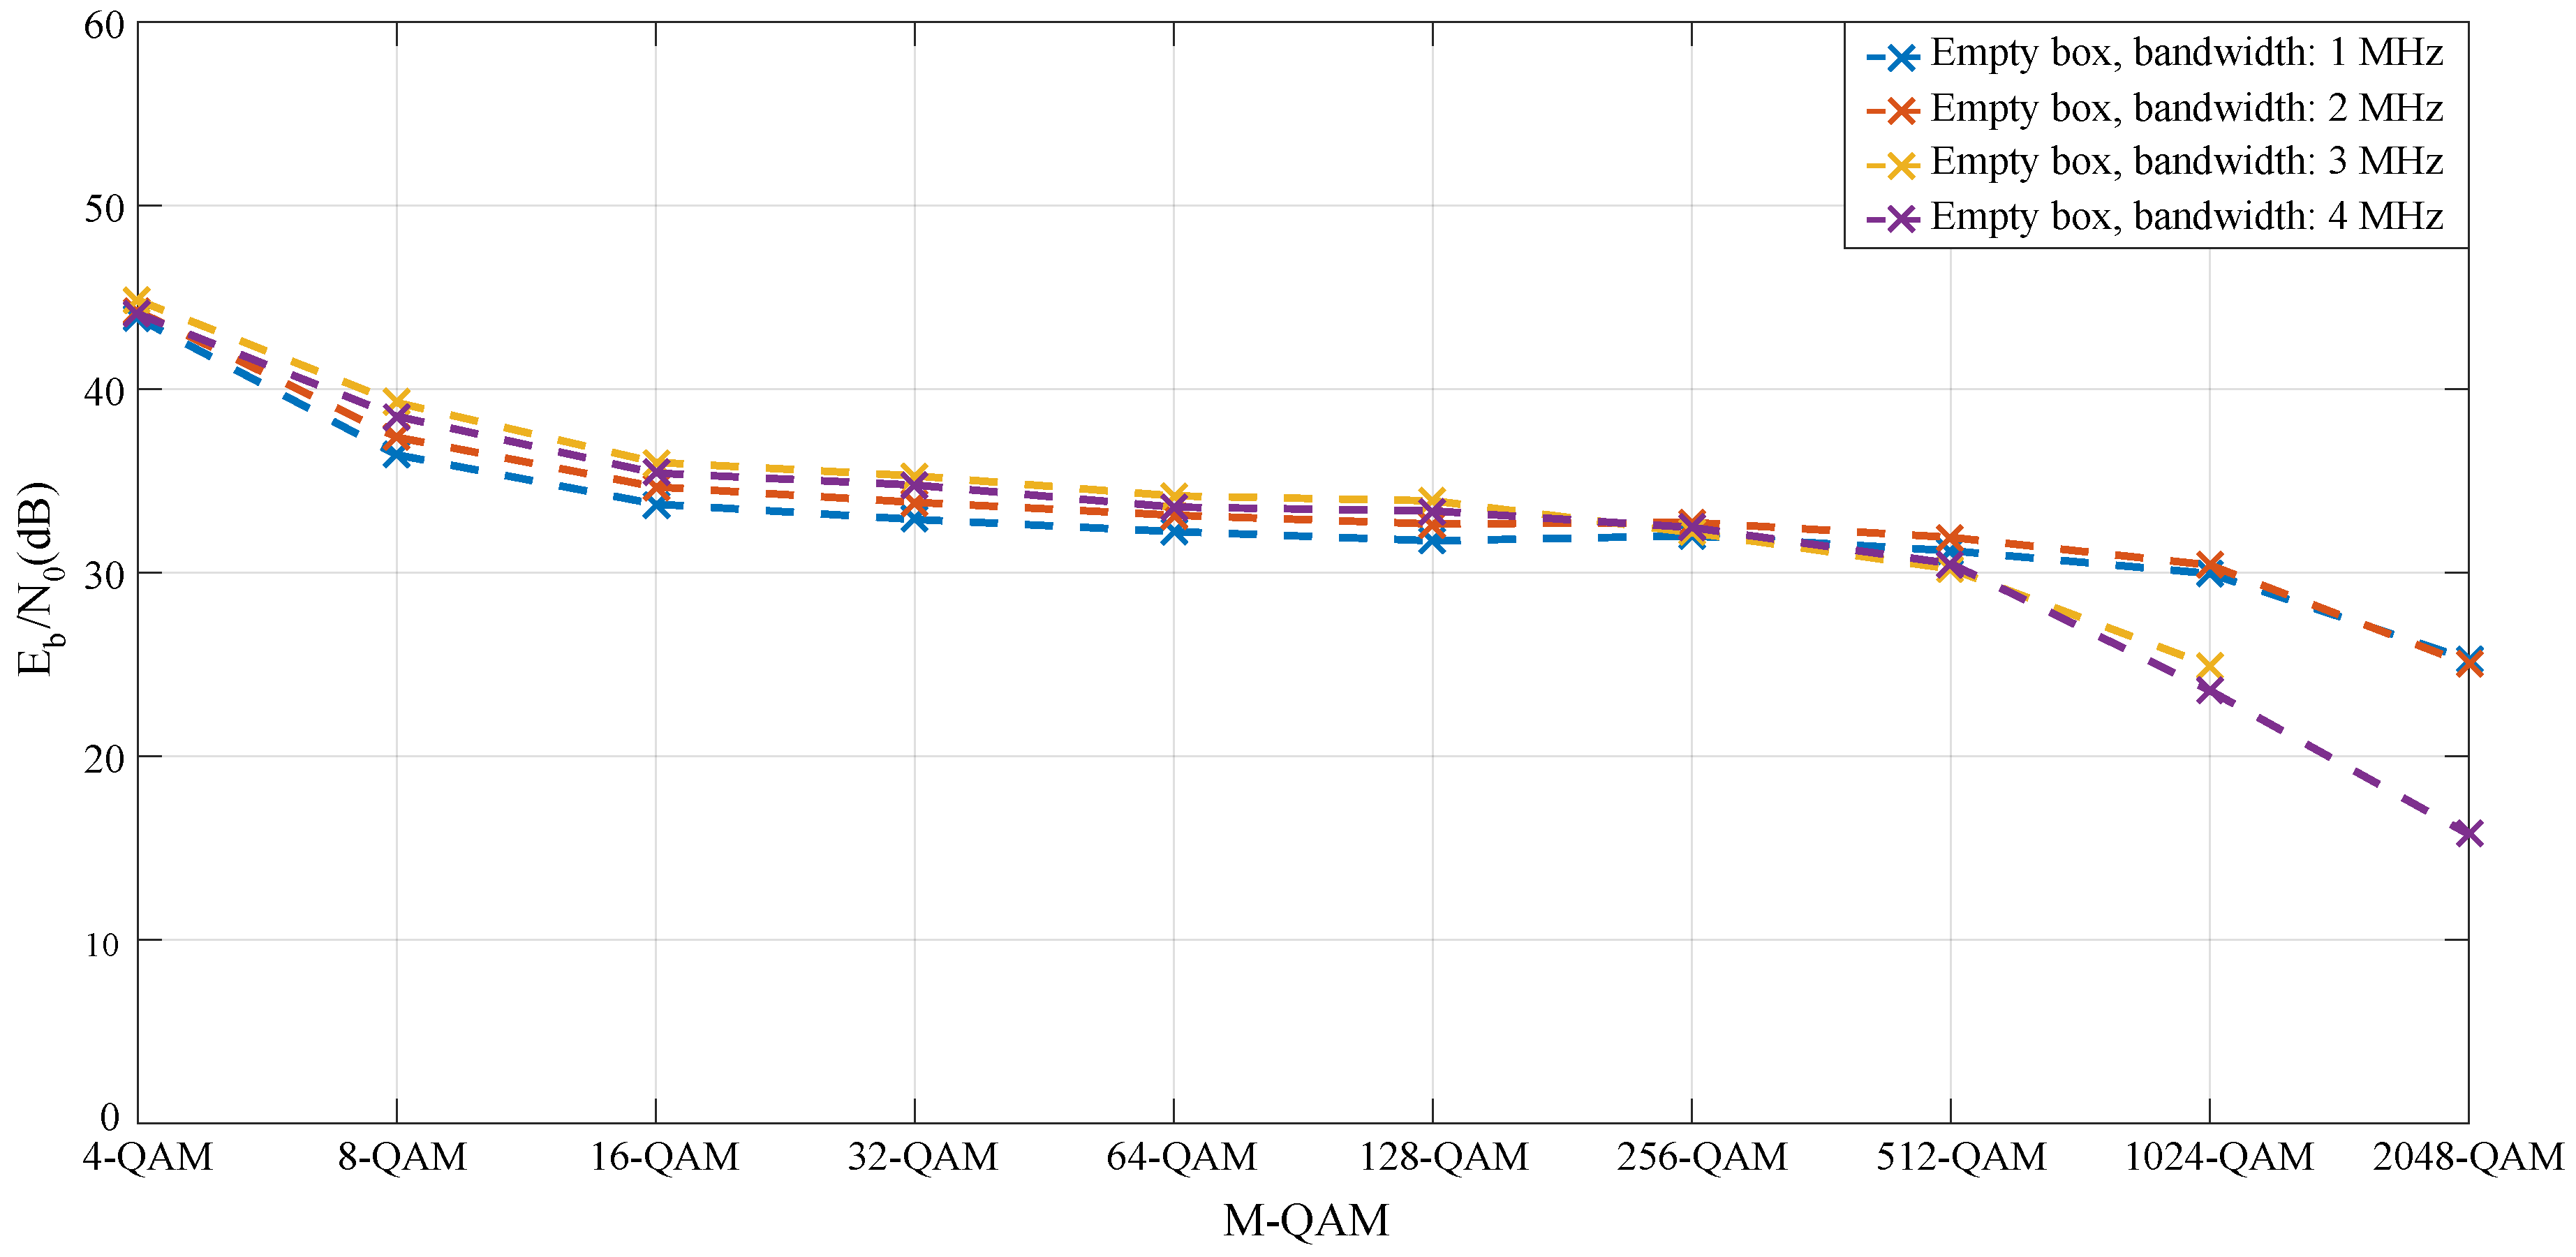
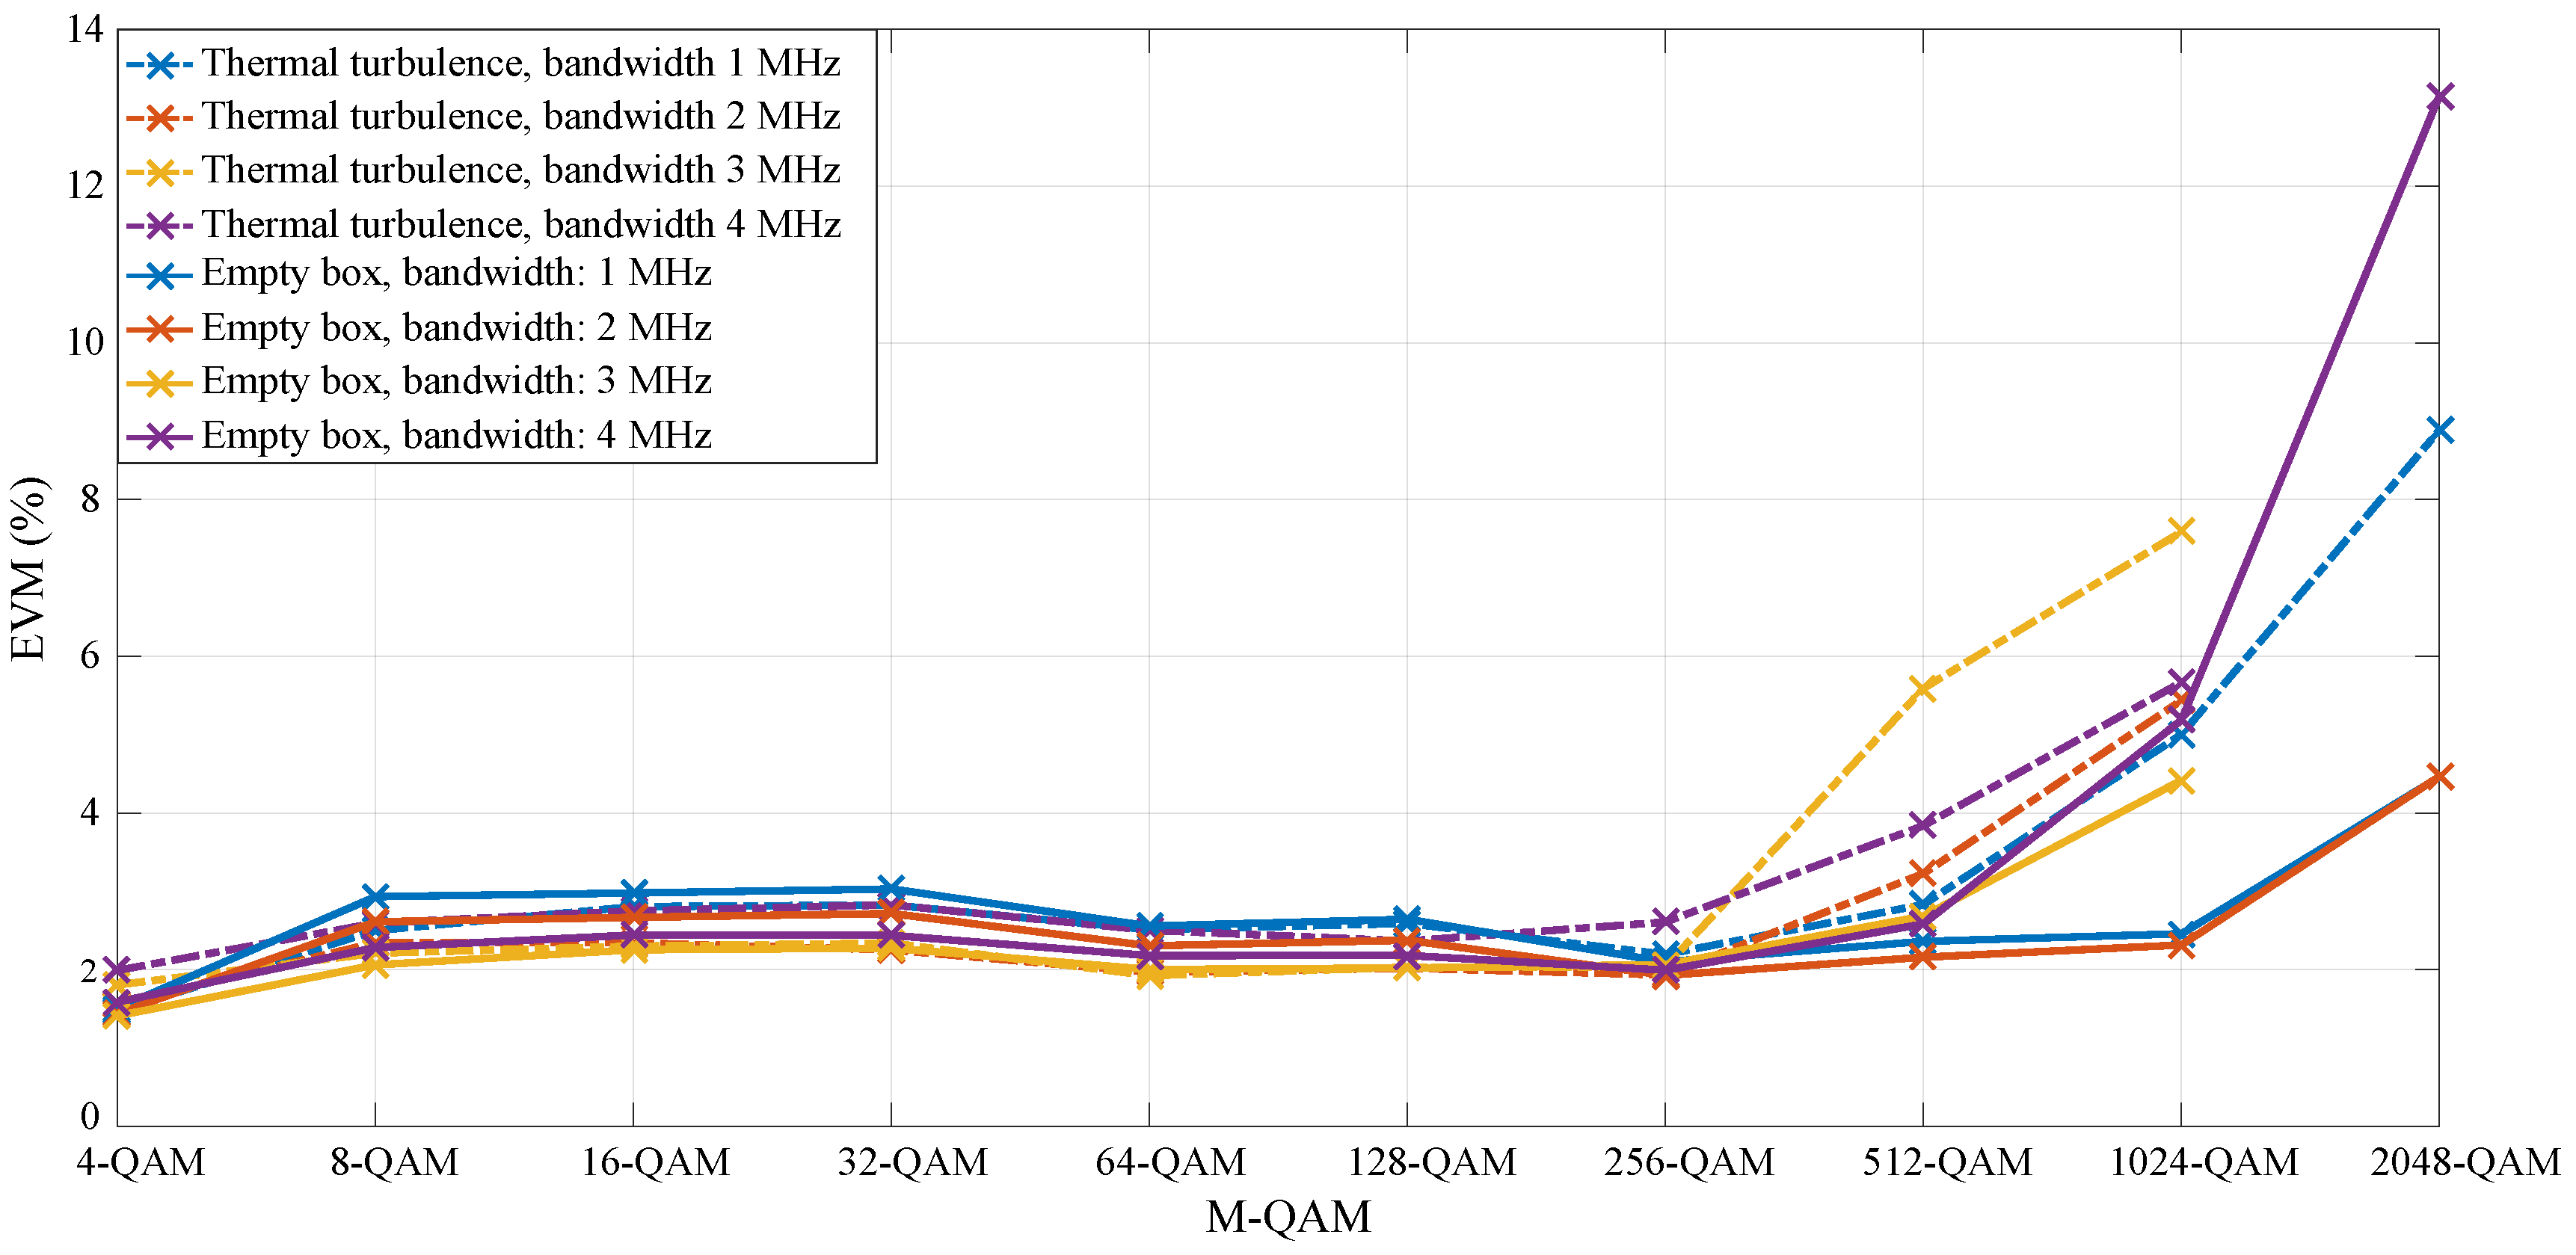
- Measured parameters: E/N, BER, EVM and MER
4. A Feasibility Study on Outdoor Visible Light Communication: Car Tail-Light
- Carrier frequency: 3 MHz
- Bandwidth: 1–4 MHz
- Modulation type: M-QAM
- TX/RX gain: 0 dB
- Message symbols: 10,000
- Tx filter: root raised cosine
- Sample width: 16-bit
- Receiver-transmitter distance: 550 cm
- Measured distance: 0–350 cm (step of 25 cm)
- Photodetector with planoconvex lens → more suitable for this scenario
- Measured parameters: E/N, BER, EVM, MER
4.1. Scenario 1-Empty Box
4.2. Scenario 2-Thermal Turbulence
4.3. Scenario 3-Rain 42 L/min
4.4. Scenario 4 -Rain 22 L/min
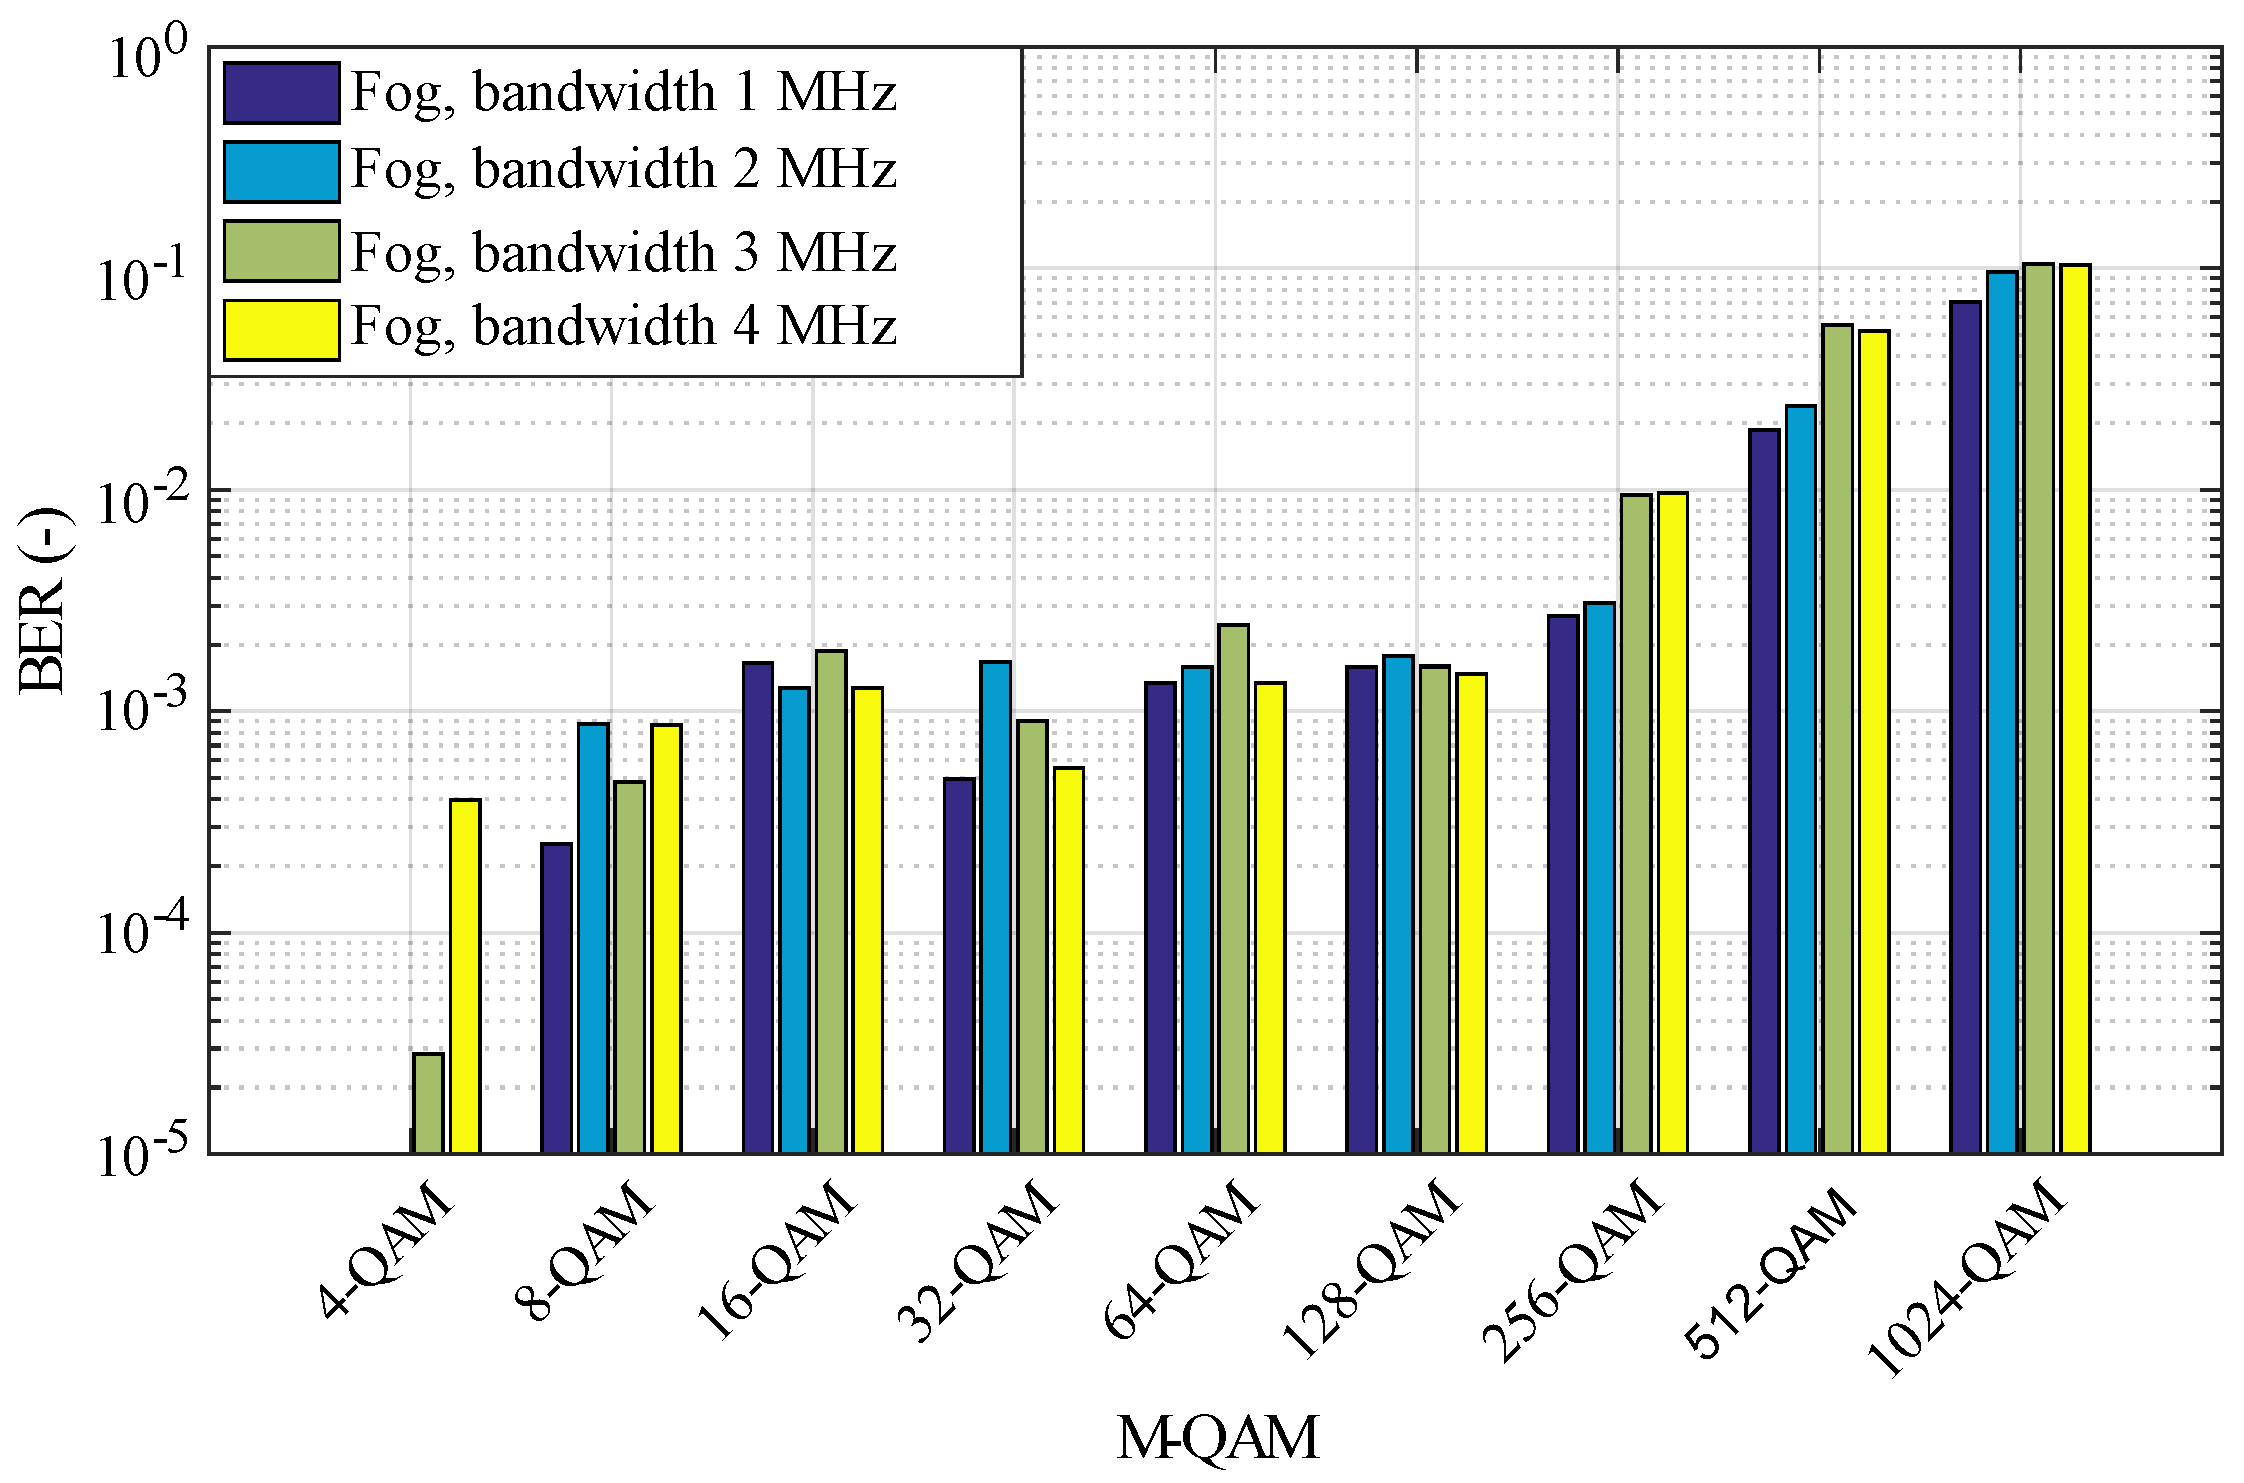
4.5. Scenario 5-Fog
5. Future Research and Discussion
6. Conclusions
Author Contributions
Funding
Conflicts of Interest
References
- Rajagopal, S.; Roberts, R.D.; Lim, S.K. IEEE 802.15. 7 visible light communication: Modulation schemes and dimming support. IEEE Commun. Mag. 2012, 50, 72–82. [Google Scholar] [CrossRef]
- Le Minh, H.; O’Brien, D.; Faulkner, G.; Zeng, L.; Lee, K.; Jung, D.; Oh, T.; Won, E.T. 100-Mb/s NRZ visible light communications using a postequalized white LED. IEEE Photonics Technol. Lett. 2009, 21, 1063–1065. [Google Scholar] [CrossRef]
- Biton, C.; Arnon, S. Improved multiple access resource allocation in visible light communication systems. Opt. Commun. 2018, 424, 98–102. [Google Scholar] [CrossRef]
- Cailean, A.M.; Dimian, M. Current challenges for visible light communications usage in vehicle applications: A survey. IEEE Commun. Surveys Tutor. 2017, 19, 2681–2703. [Google Scholar] [CrossRef]
- Bekhrad, P.; Leitgeb, E.; Ivanov, H. Benefits of visible light communication in car-to-car communication. In Proceedings of the of the Fiber Lasers and Glass Photonics: Materials through Applications, Swansea, UK, 22–26 April 2018; Volume 10683, p. 106833A. [Google Scholar] [CrossRef]
- Singh, G.; Srivastava, A.; Bohara, V.A. On Feasibility of VLC Based Car-to-Car Communication Under Solar Irradiance and Fog Conditions. In Proceedings of the 1st International Workshop on Communication and Computing in Connected Vehicles and Platooning, New Delhi, India, 29 October 2018; pp. 1–7. [Google Scholar] [CrossRef]
- Matus, V.; Maturana, N.; Azurdia-Meza, C.A.; Montejo-Sanchez, S.; Rojas, J. Hardware design of a prototyping platform for vehicular VLC using SDR and exploiting vehicles CAN bus. In Proceedings of the of the 2017 First South American Colloquium on Visible Light Communications (SACVLC), Santiago, Chile, 13 November 2017; pp. 1–4. [Google Scholar] [CrossRef]
- Luo, P.; Ghassemlooy, Z.; Le Minh, H.; Bentley, E.; Burton, A.; Tang, X. Fundamental analysis of a car to car visible light communication system. In Proceedings of the of the 2014 9th International Symposium on Communication Systems, Networks & Digital Sign (CSNDSP), Manchester, UK, 23–25 July 2014; pp. 1011–1016. [Google Scholar] [CrossRef]
- Kim, J.Y.; Park, B.S.; Choi, H.S.; Kim, S.E.; Moon, I.; Lee, C.G. Effect of interferences on indoor visible light car-to-car communication systems. In Proceedings of the Optical Modelling and Design IV, Brussels, Belgium, 3–7 April 2016; Volume 9889, p. 98891U. [Google Scholar] [CrossRef]
- Arnon, S. Optimised optical wireless car-to-traffic-light communication. Trans. Emerg. Telecommun. Technol. 2014, 25, 660–665. [Google Scholar] [CrossRef]
- Jeong, J.; Lee, C.G.; Moon, I.; Kang, M.; Shin, S.; Kim, S. Receiver angle control in an infrastructure-to-car visible light communication link. In Proceedings of the 2016 IEEE Region 10 Conference (TENCON), Marina Bay Sands, Singapore, 22–25 November 2016; pp. 1957–1960. [Google Scholar] [CrossRef]
- Deng, P.; Kavehrad, M. Real-time software-defined single-carrier QAM MIMO visible light communication system. In Proceedings of the 2016 Integrated Communications Navigation and Surveillance (ICNS), Herndon, VA, USA, 19–21 April 2016; pp. 5A3-1–5A3-11. [Google Scholar] [CrossRef]
- Tsonev, D.; Videv, S.; Haas, H. Light fidelity (Li-Fi): Towards all-optical networking. In Proceedings of the Broadband Access Communication Technologies VIII, San Francisco, CA, USA, 1–6 February 2014; p. 900702. [Google Scholar] [CrossRef]
- Saini, H. Li-Fi (Light Fidelity)-The future technology In Wireless communication. J. Comput. Appl. 2016, 7, 13–15. [Google Scholar]
- Bao, X.; Yu, G.; Dai, J.; Zhu, X. Li-Fi: Light fidelity-a survey. Wireless Netw. 2015, 21, 1879–1889. [Google Scholar] [CrossRef]
- Haas, H.; Yin, L.; Wang, Y.; Chen, C. What is lifi? J. Lightwave Technol. 2016, 34, 1533–1544. [Google Scholar] [CrossRef]
- Sharma, R.R.; Sanganal, A. Li-Fi Technology: Transmission of data through light. Int. J. Comput. Technol. Appl. 2014, 5, 150. [Google Scholar]
- Nivrutti, D.V.; Nimbalkar, R.R. Light-Fidelity: A Reconnaissance of Future Technology. Int. J. Adv. Res. Comput. Sci. Softw. Eng. 2013, 3. [Google Scholar]
- Sarkar, A.; Agarwal, S.; Nath, A. Li-fi technology: Data transmission through visible light. Int. J. Adv. Res. Comput. Sci. Manag. Stud. 2015, 3. [Google Scholar]
- Haas, H. LiFi: Conceptions, misconceptions and opportunities. In Proceedings of the 2016 IEEE Photonics Conference (IPC), Waikoloa, HI, USA, 2–6 October 2016; pp. 680–681. [Google Scholar] [CrossRef]
- Jaiswal, N.S.; Chopade, P.S. Review of Li-Fi technology: New future technology-light bulb to access the internet! Int. J. Sci. Eng. Res. 2013, 4, 36–40. [Google Scholar]
- Shen, W.H.; Tsai, H.M. Testing vehicle-to-vehicle visible light communications in real-world driving scenarios. In Proceedings of the 2017 IEEE Vehicular Networking Conference (VNC), Torino, Italy, 27–29 November 2017; pp. 187–194. [Google Scholar] [CrossRef]
- Stewart, R.W.; Barlee, K.W.; Atkinson, D.S.; Crockett, L.H. Software Defined Radio Using MATLAB & Simulink and the RTL-SDR; Strathclyde Academic Media: Glasgow, UK, 2015. [Google Scholar]
- Al Wohaishi, M.; Zidek, J.; Martinek, R. Analysis of M state digitally modulated signals in communication systems based on SDR concept. In Proceedings of the 6th IEEE International Conference on Intelligent Data Acquisition and Advanced Computing Systems, Prague, Czech Republic, 15–17 September 2011; pp. 171–175. [Google Scholar] [CrossRef]
- Rahaim, M.; Miravakili, A.; Borogovac, T.; Little, T.D.C.; Joyner, V. Demonstration of a software defined visible light communication system. In Proceedings of the 17th Annual International Conference on Mobile Computing and Networking, Mobicom2011, Las Vegas, NV, USA, 19–23 September 2011. [Google Scholar]
- Hussain, W.; Ugurdag, H.F.; Uysal, M. Software defined VLC system: Implementation and performance evaluation. In Proceedings of the 2015 4th International Workshop on Optical Wireless Communications (IWOW), Istanbul, Turkey, 7–8 September 2015; pp. 117–121. [Google Scholar] [CrossRef]
- Philips. Philips Fortimo LED Downlight Module System. Phillips Fortimo DLM 300 44 W/840 Gen3 Datasheet. Available online: http://media.futureelectronics.com/semiconductors/lighting-solutions/led-light-modules/fortimo_dlm_twist.pdf?m=Q3SoAq.pdf (accessed on 28 February 2019).
- Thorlabs. PDA36A Operating Manual-Switchable Gain, Amplified Silicon Detector. PDA36A-EC Datasheet. Available online: http://physics-astronomy-manuals.wwu.edu/Thorlabs%20PDA36A%20Detector%20Manual.pdf (accessed on 28 February 2019).
- Masini, B.; Bazzi, A.; Zanella, A. A survey on the roadmap to mandate on board connectivity and enable V2V-based vehicular sensor networks. Sensors 2018, 18, 2207. [Google Scholar] [CrossRef] [PubMed]
- Goto, Y.; Takai, I.; Yamazato, T.; Okada, H.; Fujii, T.; Kawahito, S.; Shintaro, A.; Tomohiro Yendo, T.; Kamakura, K. A new automotive VLC system using optical communication image sensor. IEEE Photonics J. 2016, 8, 1–17. [Google Scholar] [CrossRef]
- Raza, N.; Jabbar, S.; Han, J.; Han, K. Social vehicle-to-everything (V2X) communication model for intelligent transportation systems based on 5G scenario. In Proceedings of the 2nd International Conference on Future Networks and Distributed Systems, Amman, Jordan, 26–27 June 2018; p. 54. [Google Scholar] [CrossRef]
- Kinoshita, M.; Yamazato, T.; Okada, H.; Fujii, T.; Arai, S.; Yendo, T.; Kamakura, K. Motion modeling of mobile transmitter for image sensor based I2V-VLC, V2I-VLC, and V2V-VLC. In Proceedings of the 2014 IEEE Globecom Workshops (GC Wkshps), Austin, TX, USA, 8–12 December 2014; pp. 450–455. [Google Scholar] [CrossRef]
- Kim, B.W.; Jung, S.Y. Vehicle positioning scheme using V2V and V2I visible light communications. In Proceedings of the 2016 IEEE 83rd Vehicular Technology Conference (VTC Spring), Nanjing, China, 20 September 2015; pp. 1–5. [Google Scholar] [CrossRef]
- Vaezi, M.; Ding, Z.; Poor, H.V. Multiple Access Techniques for 5G Wireless Networks and Beyond; Springer: Berlin, Germany, 2019. [Google Scholar]
- Boban, M.; Kousaridas, A.; Manolakis, K.; Eichinger, J.; Xu, W. Connected roads of the future: Use cases, requirements, and design considerations for vehicle-to-everything communications. IEEE Veh. Technol. Mag. 2016, 13, 110–123. [Google Scholar] [CrossRef]
- Cailean, A.M.; Cagneau, B.; Chassagne, L.; Popa, V.; Dimian, M. A survey on the usage of DSRC and VLC in communication-based vehicle safety applications. In Proceedings of the 2014 IEEE 21st Symposium on Communications and Vehicular Technology in the Benelux (SCVT), Delft, The Netherlands, 10 November 2014; pp. 69–74. [Google Scholar] [CrossRef]
- Kim, Y.H.; Cahyadi, W.A.; Chung, Y.H. Experimental demonstration of LED-based vehicle to vehicle communication under atmospheric turbulence. In Proceedings of the 2015 International Conference on Information and Communication Technology Convergence (ICTC), Jeju Island, Korea, 18–30 October 2015; pp. 1143–1145. [Google Scholar] [CrossRef]
- Campolo, C.; Molinaro, A.; Scopigno, R. From today’s VANETs to tomorrow’s planning and the bets for the day after. Veh. Commun. 2015, 2, 158–171. [Google Scholar] [CrossRef]
- Yamazato, T. Overview of visible light communications with emphasis on image sensor communications. In Proceedings of the 2017 23rd Asia-Pacific Conference on Communications (APCC), Perth, WA, Australia, 11–13 December 2017; pp. 1–6. [Google Scholar] [CrossRef]
- Yamazato, T. Image Sensor Communications for future ITS. In Proceedings of the Signal Processing in Photonic Communications (pp. SpW2G-6). Optical Society of America, Zurich, Switzerland, 2–5 July 2018. [Google Scholar] [CrossRef]
- Tsado, Y.; Lund, D.; Gamage, K.A. Resilient communication for smart grid ubiquitous sensor network: State of the art and prospects for next generation. Comput. Commun. 2015, 71, 34–49. [Google Scholar] [CrossRef]
- Tareen, W.U.K.; Mekhilef, S.; Nakaoka, M. A transformerless reduced switch counts three-phase APF-assisted smart EV charger. In Proceedings of the 2017 IEEE Applied Power Electronics Conference and Exposition (APEC), Tampa, FL, USA, 26–30 March 2017; pp. 3307–3312. [Google Scholar] [CrossRef]
- Roche, R.; Berthold, F.; Gao, F.; Wang, F.; Ravey, A.; Williamson, S. A model and strategy to improve smart home energy resilience during outages using vehicle-to-home. In Proceedings of the 2014 IEEE International Electric Vehicle Conference (IEVC), Florence, Italy, 17–19 December 2014; pp. 1–6. [Google Scholar] [CrossRef]
- Turker, H.; Bacha, S. Optimal Minimization of Plug-in Electric Vehicle Charging Cost with Vehicle-to-Home and Vehicle-to-Grid concepts. IEEE Trans. Veh. Technol. 2018, 67, 10281–10292. [Google Scholar] [CrossRef]
- Yamazato, T. V2X communications with an image sensor. J. Commun. Inf. Netw. 2017, 2, 65–74. [Google Scholar] [CrossRef]
- Mare, R.M.; Marte, C.L.; Cugnasca, C.E. Visible light communication applied to intelligent transport systems: An Overview. IEEE Latin Am.Trans. 2016, 14, 3199–3207. [Google Scholar] [CrossRef]
- Kim, Y.H.; Cahyadi, W.A.; Chung, Y.H. Experimental demonstration of VLC-based vehicle-to-vehicle communications under fog conditions. IEEE Photonics J. 2015, 7, 1–9. [Google Scholar] [CrossRef]
- Kinoshita, M.; Yamazato, T.; Okada, H.; Fujii, T.; Arai, S.; Yendo, T.; Kamakura, K. Channel fluctuation measurement for image sensor based I2v-VLC, V2i-VLC, and V2v-VLC. In Proceedings of the 2014 IEEE Asia Pacific Conference on Circuits and Systems (APCCAS), Okinawa, Japan, 17–20 November 2014; pp. 332–335. [Google Scholar] [CrossRef]
- Arena, F.; Pau, G. An Overview of Vehicular Communications. Future Internet 2019, 11, 27. [Google Scholar] [CrossRef]
- Goldman-Shenhar, C.V.; Friedland, Y.S.; Riess, E.; Philosof, T.; Tsimhoni, O. Vehicle-to-Pedestrian-Communication Systems and Methods for Using the Same. U.S. Patent No. 9,881,503, 30 January 2018. [Google Scholar]
- Viriyasitavat, W.; Boban, M.; Tsai, H.M.; Vasilakos, A. Vehicular communications: Survey and challenges of channel and propagation models. IEEE Veh. Technol. Mag. 2015, 10, 55–66. [Google Scholar] [CrossRef]
- Wang, Y.; Sheikh, O.; Hu, B.; Chu, C.C.; Gadh, R. Integration of V2H/V2G hybrid system for demand response in distribution network. In Proceedings of the 2014 IEEE International Conference on Smart Grid Communications (SmartGridComm), Venice, Italy, 3–6 November 2014; pp. 812–817. [Google Scholar] [CrossRef]
- Zhao, L.; Aravinthan, V. Strategies of residential peak shaving with integration of demand response and V2H. In Proceedings of the 2013 IEEE PES Asia-Pacific Power and Energy Engineering Conference (APPEEC), Kowloon, Hong Kong, 11 December 2013; pp. 1–5. [Google Scholar] [CrossRef]
- Guille, C.; Gross, G. A conceptual framework for the vehicle-to-grid (V2G) implementation. Energy Policy 2009, 37, 4379–4390. [Google Scholar] [CrossRef]
- Ota, Y.; Taniguchi, H.; Nakajima, T.; Liyanage, K.M.; Baba, J.; Yokoyama, A. Autonomous distributed V2G (vehicle-to-grid) satisfying scheduled charging. IEEE Trans. Smart Grid. 2012, 3, 559–564. [Google Scholar] [CrossRef]
- Alam, M. Vehicle-to-Everything (V2X) Technology Will Be a Literal Life Saver But What Is It? 2016. Available online: http://eecatalog.com/automotive/2016/05/19/vehicle-to-everything-v2x-technology-will-be-a-literal-life-saver-but-what-is-it/ (accessed on 28 February 2019).
- Ng, X.W.; Chung, W.Y. VLC-based medical healthcare information system. Biomed. Eng. Appl. Basis Commun. 2012, 24, 155–163. [Google Scholar] [CrossRef]
- Ding, W.; Yang, F.; Yang, H.; Wang, J.; Wang, X.; Zhang, X.; Song, J. A hybrid power line and visible light communication system for indoor hospital applications. Comput. Ind. 2015, 68, 170–178. [Google Scholar] [CrossRef]
- An, J.; Chung, W.Y. A novel indoor healthcare with time hopping-based visible light communication. In Proceedings of the 2016 IEEE 3rd World Forum on Internet of Things (WF-IoT), Reston, VA, USA, 12–14 December 2016; pp. 19–23. [Google Scholar] [CrossRef]
- Song, J.; Ding, W.; Yang, F.; Yang, H.; Wang, J.; Wang, X.; Zhang, X. Indoor hospital communication systems: An integrated solution based on power line and visible light communication. In Proceedings of the 2014 IEEE Faible Tension Faible Consommation, Monaco, Monaco, 4–6 May 2014; pp. 1–6. [Google Scholar] [CrossRef]
- Tagliaferri, D.; Capsoni, C. SNIR predictions for on-aircraft VLC systems. In Proceedings of the 2016 International Conference on Broadband Communications for Next Generation Networks and Multimedia Applications (CoBCom), Graz, Austria, 14–16 September 2016; pp. 1–7. [Google Scholar] [CrossRef]
- Png, L.C.; Lim, S.X.; Rajamohan, A.; Chan, B.W.; Hazman, F.A. Designs of VLC transceiver circuits for reading light transmission of high-quality audio signals on commercial airliners. In Proceedings of the 2014 IEEE International Conference on Consumer Electronics-Taiwan, Taipei, Taiwan, 26–28 May 2014; pp. 97–98. [Google Scholar] [CrossRef]
- Burchardt, H.; Serafimovski, N.; Tsonev, D.; Videv, S.; Haas, H. VLC: Beyond point-to-point communication. IEEE Commun. Mag. 2014, 52, 98–105. [Google Scholar] [CrossRef]
- Kumar, A.; Mihovska, A.; Kyriazakos, S.; Prasad, R. Visible light communications (VLC) for ambient assisted living. Wirel. Pers. Commun. 2014, 78, 1699–1717. [Google Scholar] [CrossRef]
- Varghese, A.; Tandur, D. Wireless requirements and challenges in Industry 4.0. In Proceedings of the 2014 International Conference on Contemporary Computing and Informatics (IC3I), Mysore, India, 27–29 November 2014; pp. 634–638. [Google Scholar] [CrossRef]
- Cwikla, G.; Foit, K. Problems of integration of a manufacturing system with the business area of a company on the example of the Integrated Manufacturing Systems Laboratory. In Proceedings of the MATEC Web of Conferences, Brasov, Romania, 3–4 November 2016; Volume 94, p. 06004. [Google Scholar] [CrossRef]
- Cerruela Garcia, G.; Luque Ruiz, I.; Gomez-Nieto, M. State of the art, trends and future of bluetooth low energy, near field communication and visible light communication in the development of smart cities. Sensors 2016, 16, 1968. [Google Scholar] [CrossRef]
- Brena, R.F.; Garcia-Vazquez, J.P.; Galvan-Tejada, C.E.; Munoz-Rodriguez, D.; Vargas-Rosales, C.; Fangmeyer, J. Evolution of indoor positioning technologies: A survey. J. Sens. 2017. [Google Scholar] [CrossRef]
- Memedi, A.; Tsai, H.M.; Dressler, F. Impact of realistic light radiation pattern on vehicular visible light communication. In Proceedings of the GLOBECOM 2017-2017 IEEE Global Communications Conference, Singapore, 4–8 December 2017; pp. 1–6. [Google Scholar] [CrossRef]
- Chen, L.; Wang, W.; Zhang, C. Coalition formation for interference management in visible light communication networks. IEEE Trans. Veh. Technol. 2017, 66, 7278–7285. [Google Scholar] [CrossRef]
- Varanva, D.J.; Prasad, K.M. LED to LED communication with WDM concept for flash light of Mobile phones. Edit. Preface 2013, 4. [Google Scholar] [CrossRef]
- Cui, Z.; Yue, P.; Ji, Y. Study of cooperative diversity scheme based on visible light communication in VANETs. In Proceedings of the 2016 International Conference on Computer, Information and Telecommunication Systems (CITS), Kunming, China, 6–8 July 2016; pp. 1–5. [Google Scholar] [CrossRef]
- Mare, R.M.; Cugnasca, C.E.; Marte, C.L.; Gentile, G. Intelligent transport systems and visible light communication applications: An overview. In Proceedings of the 2016 IEEE 19th International Conference on Intelligent Transportation Systems (ITSC), Rio de Janeiro, Brazil, 1–4 November 2016; pp. 2101–2106. [Google Scholar] [CrossRef]
- Alam, K.M.; Saini, M.; El Saddik, A. Toward social internet of vehicles: Concept, architecture, and applications. IEEE Access. 2015, 3, 343–357. [Google Scholar] [CrossRef]
- Nitti, M.; Girau, R.; Floris, A.; Atzori, L. On adding the social dimension to the internet of vehicles: Friendship and middleware. In Proceedings of the 2014 IEEE international black sea conference on communications and networking (BlackSeaCom), Odessa, Ukraine, 27–30 May 2014; pp. 134–138. [Google Scholar] [CrossRef]
- Maglaras, L.; Al-Bayatti, A.; He, Y.; Wagner, I.; Janicke, H. Social internet of vehicles for smart cities. J. Sens. Actuator Netw. 2016, 5, 3. [Google Scholar] [CrossRef]
- Yoo, J.H.; Jang, J.S.; Kwon, J.K.; Kim, H.C.; Song, D.W.; Jung, S.Y. Demonstration of vehicular visible light communication based on LED headlamp. Int. J. Automot. Technol. 2016, 17, 347–352. [Google Scholar] [CrossRef]
- Uysal, M.; Ghassemlooy, Z.; Bekkali, A.; Kadri, A.; Menouar, H. Visible light communication for vehicular networking: Performance study of a V2V system using a measured headlamp beam pattern model. IEEE Veh. Technol. Mag. 2015, 10, 45–53. [Google Scholar] [CrossRef]
- Turan, B.; Narmanlioglu, O.; Ergen, S.C.; Uysal, M. Physical layer implementation of standard compliant vehicular VLC. In Proceedings of the 2016 IEEE 84th Vehicular Technology Conference (VTC-Fall), Montreal, Canada, 8–21 September 2016; pp. 1–5. [Google Scholar] [CrossRef]
- Costanzo, A.; Loscri, V.; Costanzo, S. Software Defined Platforms for Visible Light Communication: State of Art and New Possibilities. IEEE Commun. Soc. Multim. Commun. Tech. Committee 2017, 12, 14–18. [Google Scholar]
- Bhunia, S.; Sengupta, S. Implementation of interface agility for duplex dynamic spectrum access radio using USRP. In Proceedings of the MILCOM 2017–2017 IEEE Military Communications Conference (MILCOM), Baltimore, MD, USA, 23–25 October 2017; pp. 762–767. [Google Scholar] [CrossRef]
- Baranda, J.; Henarejos, P.; Gavrincea, C.G. An SDR implementation of a visible light communication system based on the IEEE 802.15. 7 standard. In Proceedings of the ICT 2013, Litva, Czech Republic, 6–8 November 2013; pp. 1–5. [Google Scholar] [CrossRef]
- Deng, P.; Kavehrad, M. Adaptive real-time software defined MIMO visible light communications using spatial multiplexing and spatial diversity. In Proceedings of the 2016 IEEE International Conference on Wireless for Space and Extreme Environments (WiSEE), Aachen, Germany, 26–29 September 2016; pp. 111–116. [Google Scholar] [CrossRef]
- Deng, P. Real-Time Software-Defined Adaptive MIMO Visible Light Communications. In Visible Light Communications; IntechOpen: London, UK, 2017. [Google Scholar] [CrossRef]
- Tsonev, D.; Chun, H.; Rajbhandari, S.; McKendry, J.J.; Videv, S.; Gu, E.; Haji, M.; Watson, S.; Kelly, A.E.; Faulkner, G.; et al. A 3-Gb/s Single-LED OFDM-Based Wireless VLC Link Using a Gallium Nitride μLED. IEEE Photonics Technol. Lett. 2014, 26, 637–640. [Google Scholar] [CrossRef]
- Bandara, K.; Niroopan, P.; Chung, Y.H. PAPR reduced OFDM visible light communication using exponential nonlinear companding. In Proceedings of the 2013 IEEE International Conference on Microwaves, Communications, Antennas and Electronic Systems (COMCAS 2013), Tel Aviv, Israel, 21–23 October 2013; pp. 1–5. [Google Scholar] [CrossRef]
- Khalid, A.; Asif, H.M. NI cDAQ based software-defined radio for visible light communication system. In Proceedings of the 2017 2nd Workshop on Recent Trends in Telecommunications Research (RTTR), Palmerston North, New Zealand, 10 February 2017; pp. 1–5. [Google Scholar] [CrossRef]
- Tsiropoulou, E.E.; Gialagkolidis, I.; Vamvakas, P.; Papavassiliou, S. Resource allocation in visible light communication networks: NOMA vs OFDMA transmission techniques. In Proceedings of the International Conference on Ad-Hoc Networks and Wireless, Lille, France, 4–6 July 2016; Springer: Cham, Switzerland; pp. 32–46. [Google Scholar] [CrossRef]
- Kizilirmak, R.C.; Rowell, C.R.; Uysal, M. Non-orthogonal multiple access (NOMA) for indoor visible light communications. In Proceedings of the 2015 4th International Workshop on Optical Wireless Communications (IWOW), Istanbul, Turkey, 7–8 September 2015; pp. 98–101. [Google Scholar] [CrossRef]
- Yapici, Y.; Guvenc, I. Non-orthogonal multiple access for mobile VLC networks with random receiver orientation. arXiv, 2018; arXiv:1801.04888. [Google Scholar]
- Saito, Y.; Kishiyama, Y.; Benjebbour, A.; Nakamura, T.; Li, A.; Higuchi, K. Non-orthogonal multiple access (NOMA) for cellular future radio access. In Proceedings of the 2013 IEEE 77th vehicular technology conference (VTC Spring), Dresden, Germany, 2–5 June 2013; pp. 1–5. [Google Scholar] [CrossRef]
- Lin, B.; Ye, W.; Tang, X.; Ghassemlooy, Z. Experimental demonstration of bidirectional NOMA-OFDMA visible light communications. Opt. Express. 2017, 25, 4348–4355. [Google Scholar] [CrossRef]
- Tsiropoulou, E.E.; Vamvakas, P.; Papavassiliou, S. Resource Allocation in Multi-tier Femtocell and Visible-Light Heterogeneous Wireless Networks. In Resource Allocation in Next-Generation Broadband Wireless Access Networks; IGI Global: Hershey, PA, USA, 2017. [Google Scholar] [CrossRef]
- Singhal, C.; De, S. (Eds.) Resource Allocation in Next-Generation Broadband Wireless Access Networks; IGI Global: Hershey, PA, USA, 2017. [Google Scholar]
- National Instruments. Universal Software Radio Peripheral. NI USRP-2920/2921/2922 Datasheet. Available online: http://www.ni.com/pdf/manuals/376358a.pdf (accessed on 28 February 2019).
- Mini-Circuits. Coaxial Bias-Tee. ZX85-12G-S+ Datasheet. Available online: https://www.minicircuits.com/pdfs/ZX85-12G-S+.pdf (accessed on 28 February 2019).
- Welch, T.B.; Shearman, S. Teaching software defined radio using the USRP and LabVIEW. In Proceedings of the 2012 IEEE International Conference on Acoustics, Speech and Signal Processing (ICASSP), Kyoto, Japan, 25–30 March 2012; pp. 2789–2792. [Google Scholar] [CrossRef]
- Marriwala, N.; Sahu, O.P.; Vohra, A. LabVIEW based design implementation of M-PSK transceiver using multiple forward error correction coding technique for software defined radio applications. J. Electrical Electron. Eng. 2014, 2, 55–63. [Google Scholar] [CrossRef]
- Haigh, P.A.; Burton, A.; Werfli, K.; Le Minh, H.; Bentley, E.; Chvojka, P.; Popoola, W.O.; Papakonstantinou, I.; Zvanovec, S. A multi-CAP visible-light communications system with 4.85-b/s/Hz spectral efficiency. IEEE J. Sel. Areas Commun. 2015, 33, 1771–1779. [Google Scholar] [CrossRef]
- Urick, V.J.; Qiu, J.X.; Bucholtz, F. Wide-band QAM-over-fiber using phase modulation and interferometric demodulation. IEEE Photonics Technol. Lett. 2004, 16, 2374–2376. [Google Scholar] [CrossRef]
- Schmogrow, R.; Nebendahl, B.; Winter, M.; Josten, A.; Hillerkuss, D.; Koenig, S.; Meyer, J.; Dreschmann, M.; Huebner, M.; Koos, C.; et al. Error vector magnitude as a performance measure for advanced modulation formats. IEEE Photonics Technol. Lett. 2012, 24, 61–63. [Google Scholar] [CrossRef]
- Alonso, D.E. Wireless Data Transmission for the Battery Management System of Electric and Hybrid Vehicles; KIT Scientific Publishing: Karlsruhe, Germany, 2017; Volume 15. [Google Scholar]
- Hamamatsu. Operates an APD with Single 5 v Supply (Standard Type, Short-Wavelength Type). Singh2018702 Datasheet. Available online: https://www.hamamatsu.com/resources/pdf/ssd/Singh2018702series_kacSingh201814e.pdf (accessed on 28 February 2019).
- Hamamatsu. Detects Opcial Signals at 1 GHz, with High Sensitivity. Shen2017658 Datasheet. Available online: https://www.hamamatsu.com/resources/pdf/ssd/Shen2017658_kacLuo201423e.pdf (accessed on 28 February 2019).
- Elamassie, M.; Karbalayghareh, M.; Miramirkhani, F.; Kizilirmak, R.C.; Uysal, M. Effect of fog and rain on the performance of vehicular visible light communications. In Proceedings of the 2018 IEEE 87th Vehicular Technology Conference (VTC Spring), Porto, Portugal, 3–6 June 2018; pp. 1–6. [Google Scholar]
- Hossain, F.; Afroze, Z. Eliminating the effect of fog attenuation on FSO link by multiple TX/RX system with travelling wave semiconductor optical amplifier. In Proceedings of the 2013 2nd International Conference on Advances in Electrical Engineering (ICAEE), Dhaka, Bangladesh, 19–21 December; pp. 267–272. [CrossRef]
- Kim, I.I.; McArthur, B.; Korevaar, E.J. Comparison of laser beam propagation at 785 nm and 1550 nm in fog and haze for optical wireless communications. In Proceedings of the Optical Wireless Communications III, Boston, MA, USA, 6 February 2001; Volume 4214, pp. 26–38. [Google Scholar] [CrossRef]
- Ebrahim, K.J.; Al-Omary, A. Sandstorm Effect on Visible Light Communication. In Proceedings of the 2017 9th IEEE-GCC Conference and Exhibition (GCCCE), Manama, Bahrain, 8–11 May 2017; pp. 1–7. [Google Scholar] [CrossRef]
- Luo, P.; Ghassemlooy, Z.; Le Minh, H.; Khalighi, A.; Zhang, X.; Zhang, M.; Yu, C. Experimental demonstration of an indoor visible light communication positioning system using dual-tone multi-frequency technique. In Proceedings of the 2014 3rd International Workshop in Optical Wireless Communications (IWOW), Funchal, Madeira Island, Portugal, 17 September 2014; pp. 55–59. [Google Scholar] [CrossRef]
- Zhang, W.; Chowdhury, M.S.; Kavehrad, M. Asynchronous indoor positioning system based on visible light communications. Opt. Engineering 2014, 53, 045105. [Google Scholar] [CrossRef]
- Ganti, D.; Zhang, W.; Kavehrad, M. VLC-based indoor positioning system with tracking capability using Kalman and particle filters. In Proceedings of the 2014 IEEE International Conference on Consumer Electronics (ICCE), Las Vegas, NV, USA, 4–6 January 2014; pp. 476–477. [Google Scholar] [CrossRef]
- Lin, B.; Tang, X.; Ghassemlooy, Z.; Lin, C.; Li, Y. Experimental demonstration of an indoor VLC positioning system based on OFDMA. IEEE Photonics J. 2017, 9, 1–9. [Google Scholar] [CrossRef]
- Yamaguchi, S.; Mai, V.V.; Thang, T.C.; Pham, A.T. Design and performance evaluation of VLC indoor positioning system using optical orthogonal codes. In Proceedings of the 2014 IEEE Fifth International Conference on Communications and Electronics (ICCE), Danang, Vietnam, 30 July–1 August 2014; pp. 54–59. [Google Scholar] [CrossRef]
- Huynh, P.; Yoo, M. VLC-based positioning system for an indoor environment using an image sensor and an accelerometer sensor. Sensors 2016, 16, 783. [Google Scholar] [CrossRef]
- Blinowski, G. Security issues in visible light communication systems. IFAC-PapersOnLine 2015, 48, 234–239. [Google Scholar] [CrossRef]
- Martinek, R.; Zidek, J. The real implementation of ANFIS channel equalizer on the system of software-defined radio. IETE J. Res. 2014, 60, 183–193. [Google Scholar] [CrossRef]
- Martinek, R.; Zidek, J. The real implementation of NLMS channel equalizer into the system of software defined radio. Adv. Electr. Electron. Eng. 2012, 10, 330–336. [Google Scholar] [CrossRef]
- Martinek, R.; Konecny, J.; Koudelka, P.; Zidek, J.; Nazeran, H. Adaptive optimization of control parameters for feed-forward software defined equalization. Wirel. Pers. Commun. 2017, 95, 4001–4011. [Google Scholar] [CrossRef]
- Martinek, R.; Vanus, J.; Bilik, P.; Al-Wohaishi, M.; Zidek, J.; Wen, H. The implementation of equalization algorithms for real transmission channels. In Proceedings of the 2016 IEEE International Instrumentation and Measurement Technology Conference Proceedings, Taipei, Taiwan, 23–26 May 2016; pp. 1–6. [Google Scholar] [CrossRef]
- Martinek, R.; Vanus, J.; Kelnar, M.; Bilik, P.; Zidek, J. Application of recursive least square algorithm to adaptive channel equalization. In Proceedings of the XXI IMEKO World Congress Measurement in Research and Industry, Prague, Czech Republic, 30 August–4 September 2015; IMEKO-International Measurement Federation Secretariat: Budapest, Hungary, 2015; pp. 1–4. [Google Scholar]
- Martinek, R.; Razera, G.; Kahankova, R.; Zidek, J. Optimization of the training symbols for minimum mean square error equalizer. In Proceedings of the International Afro-European Conference for Industrial Advancement, Marrakesh, Morocco, 21–23 November 2016; Springer: Cham, Switzerland, 2016; pp. 272–287. [Google Scholar] [CrossRef]
- Yamazato, T.; Takai, I.; Okada, H.; Fujii, T.; Yendo, T.; Arai, S.; Andoh, M.; Harada, T.; Yasutomi, K.; Kagawa, K.; et al. Image-sensor-based visible light communication for automotive applications. IEEE Commun. Mag. 2014, 52, 88–97. [Google Scholar] [CrossRef]
- Imai, Y.; Ebihara, T.; Mizutani, K.; Wakatsuki, N. Performance evaluation of high-speed visible light communication combining low-speed image sensor and polygon mirror in an outdoor environment. In Proceedings of the 2016 Eighth International Conference on Ubiquitous and Future Networks (ICUFN), Vienna, Austria, 5–8 July 2016; pp. 51–55. [Google Scholar] [CrossRef]
- Yamazato, T.; Kawagita, N.; Okada, H.; Fujii, T.; Yendo, T.; Barai, S.; Kamakura, K. The uplink visible light communication beacon system for universal traffic management. IEEE Access 2017, 5, 22282–22290. [Google Scholar] [CrossRef]


| Initial lumens | 3000 lm |
| Color rendering index | 80 |
| Correlated color temperature | 4000 K |
| System input power | 46.0 W |
| System efficiency | 68.0 Lm/W |
| Input voltage | 220–240 V |
| Max. vitality | 5000 h |
| dc | 80 V |
| Max operating temperature | 65 C |
| 40 W |
| Type of detector | Si PIN |
| Active area | 3.6 × 3.6 mm (13 mm) |
| Wavelength range | 350–1100 nm |
| Gain adjustment range | 70 dB |
| Gain step | 8 × 10 dB |
| Operating temperature | 0–40 C |
| Max output current | 100 mA |
| Technology | InGaAlP Thinfilm |
| Viewing angle at 50 % IV | 120 (Lambertian Emitter) |
| Color | Red (623 nm) |
| Optical efficiency | 56 lm/W |
| Operating temperature | from –40 to 110 C |
| Max surge current | 1000 mA |
| Max current | 140 mA |
| Typical voltage | 2.1 V |
| M-QAM | Bandwidth | |||
|---|---|---|---|---|
| - | 1 MHz | 2 MHz | 3 MHz | 4 MHz |
| 4-QAM | 101 W | 95 W | 97 W | 93 W |
| 8-QAM | 112 W | 135 W | 175 W | 189 W |
| 16-QAM | 154 W | 205 W | 250 W | 276 W |
| 32-QAM | 275 W | 308 W | 463 W | 550 W |
| 64-QAM | 525 W | 780 W | 930 W | 951 W |
| 128-QAM | 905 W | 1.095 mW | 1.399 mW | 1.550 mW |
| 256-QAM | 2.180 mW | 2.394 mW | 2.545 mW | 2.585 mW |
| 512-QAM | 2.475 mW | 2.522 mW | 2.735 mW | 2.930 mW |
| 1024-QAM | 2.640 mW | 2.955 mW | 3.120 mW | 3.172 mW |
| Year | Main Author | Source | Distance | Detector | Modulation Type | Transmit Speed |
|---|---|---|---|---|---|---|
| 2016 | Wen-Hsuan Shen [22] | Tail-light 1157 (12 V, red LED) | 45 m | Photodiode Thorlabs PDA100A (10 mm × 10 mm) | PWM (OFDM) | 45–55 Mbps |
| 2016 | Yuki Goto [30] | Red LED matrix (4 × 5; 0.72 V, 14.5 MHz) | 1.5 m | OCI camera (Focal distance of the lens 50 mm) | 4-256 QAM (OFDM) | 45 Mbps 50 Mbps 55 Mbps |
| 2014 | Isamu Takai [122] | Red LED matrix (10 × 10; 4 W, 55 MHz) | 7.78 m | High-speed camera (Focal distance of the lens 12.5 mm) | Pulse Width modulation (PWM) | 10 Mpbs |
| 2014 | Takaya Yamazato [122] | Red LED matrix (32 × 32) | 45 m | High-speed camera (CMOS sensor) | Pulse Width modulation (PWM) | 10 Mpbs |
| 2016 | Yoshihito Imai [123] | Red LED (OS5RKA5B61P) | 1–8 m | High-speed camera XCG-V60E, SONY (Focal distance of the lens 8–48 mm) | Pulse Width modulation (PWM) | 84 bps |
| 2017 | Takaya Yamazato [124] | Red LED matrix (32 × 32) | 30–70 m | High-speed image sensor and OCI sensor | Pulse Width modulation (PWM) | 55 Mbps |
| 2019 | Radek Martinek | Phillips Fortimo DLM 300 44 W/840 Gen3 | 3.25 m from center | Thorlabs PDA-36A | QAM modulation | 2 Mbps |
| 2019 | Radek Martinek | Skoda Octavila Tail-light | 5.5 m | Thorlabs PDA-36A | QAM modulation | 28 Mbps |
© 2019 by the authors. Licensee MDPI, Basel, Switzerland. This article is an open access article distributed under the terms and conditions of the Creative Commons Attribution (CC BY) license (http://creativecommons.org/licenses/by/4.0/).
Share and Cite
Martinek, R.; Danys, L.; Jaros, R. Visible Light Communication System Based on Software Defined Radio: Performance Study of Intelligent Transportation and Indoor Applications. Electronics 2019, 8, 433. https://doi.org/10.3390/electronics8040433
Martinek R, Danys L, Jaros R. Visible Light Communication System Based on Software Defined Radio: Performance Study of Intelligent Transportation and Indoor Applications. Electronics. 2019; 8(4):433. https://doi.org/10.3390/electronics8040433
Chicago/Turabian StyleMartinek, Radek, Lukas Danys, and Rene Jaros. 2019. "Visible Light Communication System Based on Software Defined Radio: Performance Study of Intelligent Transportation and Indoor Applications" Electronics 8, no. 4: 433. https://doi.org/10.3390/electronics8040433
APA StyleMartinek, R., Danys, L., & Jaros, R. (2019). Visible Light Communication System Based on Software Defined Radio: Performance Study of Intelligent Transportation and Indoor Applications. Electronics, 8(4), 433. https://doi.org/10.3390/electronics8040433