Article

Passive Multiple Target Indoor Localization Based on Joint Interference Cancellation in an RFID System

School of information science and engineering, Shandong University, Qingdao 266237, China
*
Authors to whom correspondence should be addressed.
Electronics 2019, 8(4), 426; https://doi.org/10.3390/electronics8040426
Submission received: 12 March 2019 / Revised: 2 April 2019 / Accepted: 4 April 2019 / Published: 11 April 2019
(This article belongs to the Special Issue Advanced RFID Technology and Applications)

Abstract

:
Radio frequency identification (RFID) provides a simple and effective solution to the passive indoor localization. The conventional wisdom about RFID localization is using reference tags. It performs well in tag or passive single target localization. However, in the passive multiple target scenario, reference tag based localization suffers from some limitations, including the array aperture, mutual coupling of reference tags, and coherent superimposition signals. These problems are harmless and ignored in tag or passive single target localization, but degrade the performance severely in passive multiple target scenario. Therefore, in this paper, the authors propose a joint interference cancellation method to mitigate the effect of these limitations. Uniform circular array (UCA) of reference tags were used to reduce the interference of the array aperture. A carefully designed relative position of adjacent reference tags and a modified channel model were combined to reduce the mutual coupling. A virtual distributed reader antenna array was used to reduce the false positive and false negative estimations. The system was evaluated in real indoor environment using noodles and colas as targets and can work well in a smoky environment that is similar to some real industrial environments. The accuracy of target number estimation is 97.5%. The spatial resolution is about 30 cm, and the median error of 2-D multiple target localization is about 5.5 cm.

1. Introduction

Passive indoor localization has been researched for many years [1,2,3,4]. The goal of this challenging problem is to estimate the coordinates of targets that do not carry any auxiliary devices. The radio frequency identification (RFID) technology presents an efficient and low-cost solution [5,6,7]. The pioneers mostly focused on the localization methods for RFID reader [8], tags [9], or single tag-free target. These kind of methods are excellent but unsuitable for the passive multiple target scenario. There are two main problems. One is the interference that came from the array and among targets. The other is how to distinguish the coherent signals, in other words, to estimate the number of targets from the superimposed received signal. Some traditional methods such as the akaike information criterion (AIC) and gerschgorin disks estimation (GDE) [10] are invalid for these coherent signals. The sub-space methods, like space smoothing (SS) MUSIC algorithm [11], can distinguish the multiple incident coherent signals efficiently under the far field assumption but become almost invalid in the near field indoor environment.
Antenna array is an efficient way that obtains the spatial information of multiple passive targets. One of the traditional methods is beamforming [12] that uses the phase shifts to obtain constructive interference in particular angles. Then co-located multiple-input multiple-output (MIMO) radar [13] was introduced by researchers. The elements of co-located MIMO array have the ability to transmit linearly independent signal simultaneously. Thus, the backscatter signals of targets are linearly independent with each other, and some methods for direction of arrival (DOA) [14] could be applied. Some researcher also focused on multi-static radar [15] or widely distributed MIMO radar [16]. This widely distributed radar has the ability to break the Rayleigh resolution limit of the transmit/receive arrays [17]. The inherent spatial diversity of transmitter/receiver brings the enhanced resolution and the stable measured radar cross-section (RCS). However, the synchronization of multiple antennas is usually difficult.
Recently, for the passive multiple target localization, channel blocking [18] or shadowing loss [19] was used. The transmitters and receivers were deployed densely as the uniform linear arrays to make the measured area almost full of the line of sight (LOS) propagation. The changes of channel parameters indicate the information of positions. Radio tomographic imaging (RTI) method [20], which is inspired from medical and geophysical imaging systems, is also based on shadowing loss. The measured area was divided into small pixel and the shadowing loss is approximated as a weighted summation of attenuation of each pixel [21]. The ellipsoid weighted model [22] was used to determine the weight of each link. However, the “interest range” of channel blocking is small. The target, which is too far away from the LOS path, will almost have no effect on the received signal strength (RSS) [23]. This means a large number of transceiver nodes to ensure the coverage of LOS in the measured area. Besides, the method based on channel blocking also need to match the paths with targets, and this process is usually computational infeasible [24].
The reflected signals of targets are also important information for multiple target indoor localization. Liu et al. [25] used the reflected signal to detect one person behind the wall, and Hidden Markov Model was used to predict the trace. Then the reflected signal based method was expanded to 3D localization for both tag and tag-free targets with higher accuracy [26]. Ma et al. [27] accelerated the optimization and constructed a “smart wall” to detect the person. These methods just focused on single target, and the multiple target indoor localization using reflected signal is still need to study.
There are also some other feasible and innovative methods. Compressive sensing [28] and Sparse Representation-based method [29] were introduced by using the sparse nature of multiple target locations in the spatial domain. However, the construction of over-complete dictionary is complicated such as the RSS fingerprint-based method [30].
Against this background, we propose a passive multiple target localization using the diffuse reflection of the targets. Neither broadband signal nor complicated equipment is used in our system. Spatial spectrum was calculated by 2-Dimensional maximum likelihood function and a joint interference cancellation method was introduced to make spatial spectrum work well. Uniform circular array (UCA) of reference tags were deployed instead of a uniform linear array (ULA) to reduce the aperture limitation. A carefully designed relative position of adjacent reference tags and a modified channel model were combined to reduce the mutual coupling. At last, virtual reader antenna array was constructed to reduce false positive and false negative estimations.
The remainder of this paper is organized as follows. The signal extraction and modeling are shown in Section 2. The details of the main design and technique are overviewed in Section 3. The implementation and evaluation are elaborated in Section 4, and the conclusion is in Section 5.

2. Signal Extraction and Modeling

The RFID localization system mainly consists of reader antenna (A), reference tags (R), surrounding obstacle (O), and target (T). The signal propagation of one reference tag is shown in Figure 1. It should be noted that the number of reflections of the plotted paths in Figure 1 are all less than or equal to two times that is, it is assumed that the paths with more than two reflections are weak enough to be ignored. The signal sent from the antenna can be represented as a complex number:
s = α e j ω ,
where α is the amplitude, ω is the phase and j is the imaginary number. The channel parameter h is also regarded as a complex number.
h = β e j δ ,
where β is the attenuation factor and δ is the phase factor.
Consider M targets and an array of L reference tags. The RFID system can be regarded as linear time-invariant, and the measured signal of lth reference tag received by the reader can be written as:
x l = m = 1 M h l ( θ m ) s + n l ,
where s is the source signal, n l donates the additive noise of circuits of reader and tag, θ m is the coordinates of mth target, and h l ( θ m ) indicates the channel parameter associated with the lth reference tag and mth target:
h l ( θ m ) = h l A R A + h l A O R A + h l A T R A ( θ m ) ,
where h l A R A , h l A O R A , and h l A T R A ( θ m ) indicate the channel parameters of lth reference tag’s three paths as shown in Figure 1: A→R→A, A→O→R→A, and A→T →R→A. Equation (3) can be rewritten as:
x l = ( h l A R A + h l A O R A + m = 1 M h l A T R A ( θ m ) ) s + n l .
The parameter h l A T R A ( θ m ) is the only one channel that contains the information of mth target. Therefore, the unrelated parts h l A R A and h l A O R A should be eliminated from the received signal. Fortunately, all these unrelated parts can be obtained from the initial state that the target is not present. Only a simple one-click operation is needed to measure the initial state of reference tags when deploying the system at first time. The initial received signal is denoted as x l ˇ and can be written as:
x ˇ l = ( h l A R A + h l A O R A ) s + n ˇ l
The difference between measured signals x l and x l ˇ can be denoted by Δ x l :
Δ x l = x l x l ˇ = m = 1 M h l A T R A ( θ m ) s + Δ n l ,
where Δ n l is also the additive noise. These superimposed signals can be rewritten in matrix form:
Δ x = h A T R A ( θ ) s + Δ n ,
where s , θ , Δ x , and Δ n l are complex vectors:
s = s [ 1 ,   1 ,   ,   1 ] 1 × M T ,
θ = [ θ 1 ,   θ 2 ,   ,   θ m ,   ,   θ M ] T ,
Δ x = [ Δ x 1 ,   Δ x 2 ,   , Δ x l ,     Δ x L ] T ,
Δ n = [ Δ n 1 ,   Δ n 2 ,   ,   Δ n l ,   ,   Δ n L ] T ,
and h A T R A ( θ ) is a L × M complex matrix:
h A T R A ( θ ) = [ h 1 A T R A ( θ ) ,   h 2 A T R A ( θ ) ,   ,   h l A T R A ( θ ) ,   ,   h L A T R A ( θ ) ] T ,
where h l A T R A ( θ ) is given by:
h l A T R A ( θ ) = [ h l A T R A ( θ 1 ) ,   h l A T R A ( θ 2 ) ,   ,   h l A T R A ( θ m ) ,   ,   h l A T R A ( θ M ) ] .
This situation is almost completely different from the conventional DOA estimation because the source signals are fully coherent and the steering matrix is nonlinear.

3. Proposed Method

In this section, we first calculate the spatial spectrum using the signal model. Then we present a joint method to reduce the interference in the spatial spectrum.

3.1. Spatial Spectrum Calculation

As the assumption that the signal propagates in the isotropic case [31], the approximated relationship between the received power P r and the distance d can be expressed as:
P r = P t A e / 4 π d 2 ,
where P t is the transmitted power of the reader antenna, and A e is the RCS. The relationship of ideal phase δ of the received signal and the distance d is:
δ = 2 π d / λ ,
where λ is the wavelength of RF continuous wave. Combined (15) and (16), the channel parameter h l A T R A ( θ m ) can be expressed as:
h l A T R A ( θ m ) = 1 / d l 2 ( θ m ) exp ( 2 π j d l ( θ m ) / λ ) ,
where j is the imaginary number and d l ( θ m ) is the distance of the path A→T→R→A. In (8), the noise Δ n can be considered as Gaussian noise: Δ n ~ N ( 0 ,   σ 2 I ) . The complex likelihood function is specified by:
L ( θ , s , σ 2 ) = ( 2 π σ 2 ) L / 2 exp ( i = 1 L | | Δ x h i A T R A ( θ ) s | | 2 / 2 σ 2 ) .
For simplicity, the log ( L ( θ , s , σ 2 ) ) is expressed as:
L log ( θ , s , σ 2 ) = L / 2 log ( 2 π ) L / 2 ln ( σ 2 ) 1 / ( 2 σ 2 ) i = 1 L | | Δ x h i A T R A ( θ ) s | | 2 .
Before searching for θ that maximizes (19), s and σ 2 need to be estimated. At first, θ and σ 2 are treated as constants, and it needs to find the s that maximizes the (19). This is equivalent to minimizing i = 1 L | | Δ x h i A T R A ( θ ) s | | 2 . The estimated s ^ should be:
s ^ = h A T R A ( θ ) + Δ x ,
where h A T R A ( θ ) + = ( h A T R A ( θ ) H h A T R A ( θ ) ) 1 h A T R A ( θ ) H and ( · ) H denotes the conjugate transposition. Combined (19) and (20), and the log ( L ( θ , s , σ 2 ) ) can be rewritten as:
L log ( θ , s , σ 2 ) = L / 2 log ( 2 π ) L / 2 ln ( σ 2 ) 1 / ( 2 σ 2 ) i = 1 L | | Δ x h i A T R A ( θ ) h i A T R A ( θ ) + Δ x | | 2 .
Then, θ is treated as constant and it needs to find the σ 2 that maximizes (21). The derivative of (21) can be expressed as:
L log ( θ , s , σ 2 ) / σ 2 = 1 / 2 σ 2 + 1 / 2 σ 4 i = 1 L | | Δ x h i A T R A ( θ ) h i A T R A ( θ ) + Δ x | | 2 .
So the estimated σ 2 ^ is the value that makes (22) equal to zero:
σ 2 ^ = i = 1 L | | Δ x h A T R A ( θ ) h A T R A ( θ ) + Δ x | | 2 .
Merging (21) and (23), and the maximum likelihood is equivalent to maximizing cost function J ( θ ) :
max θ   L log ( θ , s , σ 2 ) equivalent max θ   J ( θ ) = 1 / tr ( I h A T R A ( θ ) h A T R A ( θ ) + R ) ,
where I is unit matrix and R = Δ x Δ x H .
This basic maximum likelihood approach is just suitable for the single target application. In multiple target scenario, the unknown number of parameters and the intensive computation of multi-dimension search make it almost infeasible. However, this cost function still has the ability to detect the targets. To avoid the above problems, we make a 2-D search of measured area using (24) to construct a spatial spectrum. We placed two instant noodles in the measured area and the spatial spectrum is shown in Figure 2. Positions A and B are the ground truth of two targets’ coordinates. The preliminary spatial spectrum does not work well and we present a joint interference cancellation method to make it work.

3.2. Avoiding the Limitation of Array Aperture

One problem is the anomalous enhancement as the section C shown in Figure 2. This comes from the interference between two targets at A and B, and the basic reason is the aperture limitation of the linear array. A linear array can improve resolution in the plane containing the array, except for the direction orthogonal to the array. For every target position in the spatial spectrum, this aperture limitation brings a chain of peaks along the vertical direction of the linear array. The section C in Figure 2 is the superimposition of the chains of peaks of targets at A and B. This is not an isolated case. The linear synthetic aperture radar (SAR) localization method also suffers from this aperture limitation [32]. To avoid this aperture limitation, we considered the uniform circular array, which has balanced aperture in different directions. However, the problem of mutual coupling of adjacent reference tags still needs to be solved.

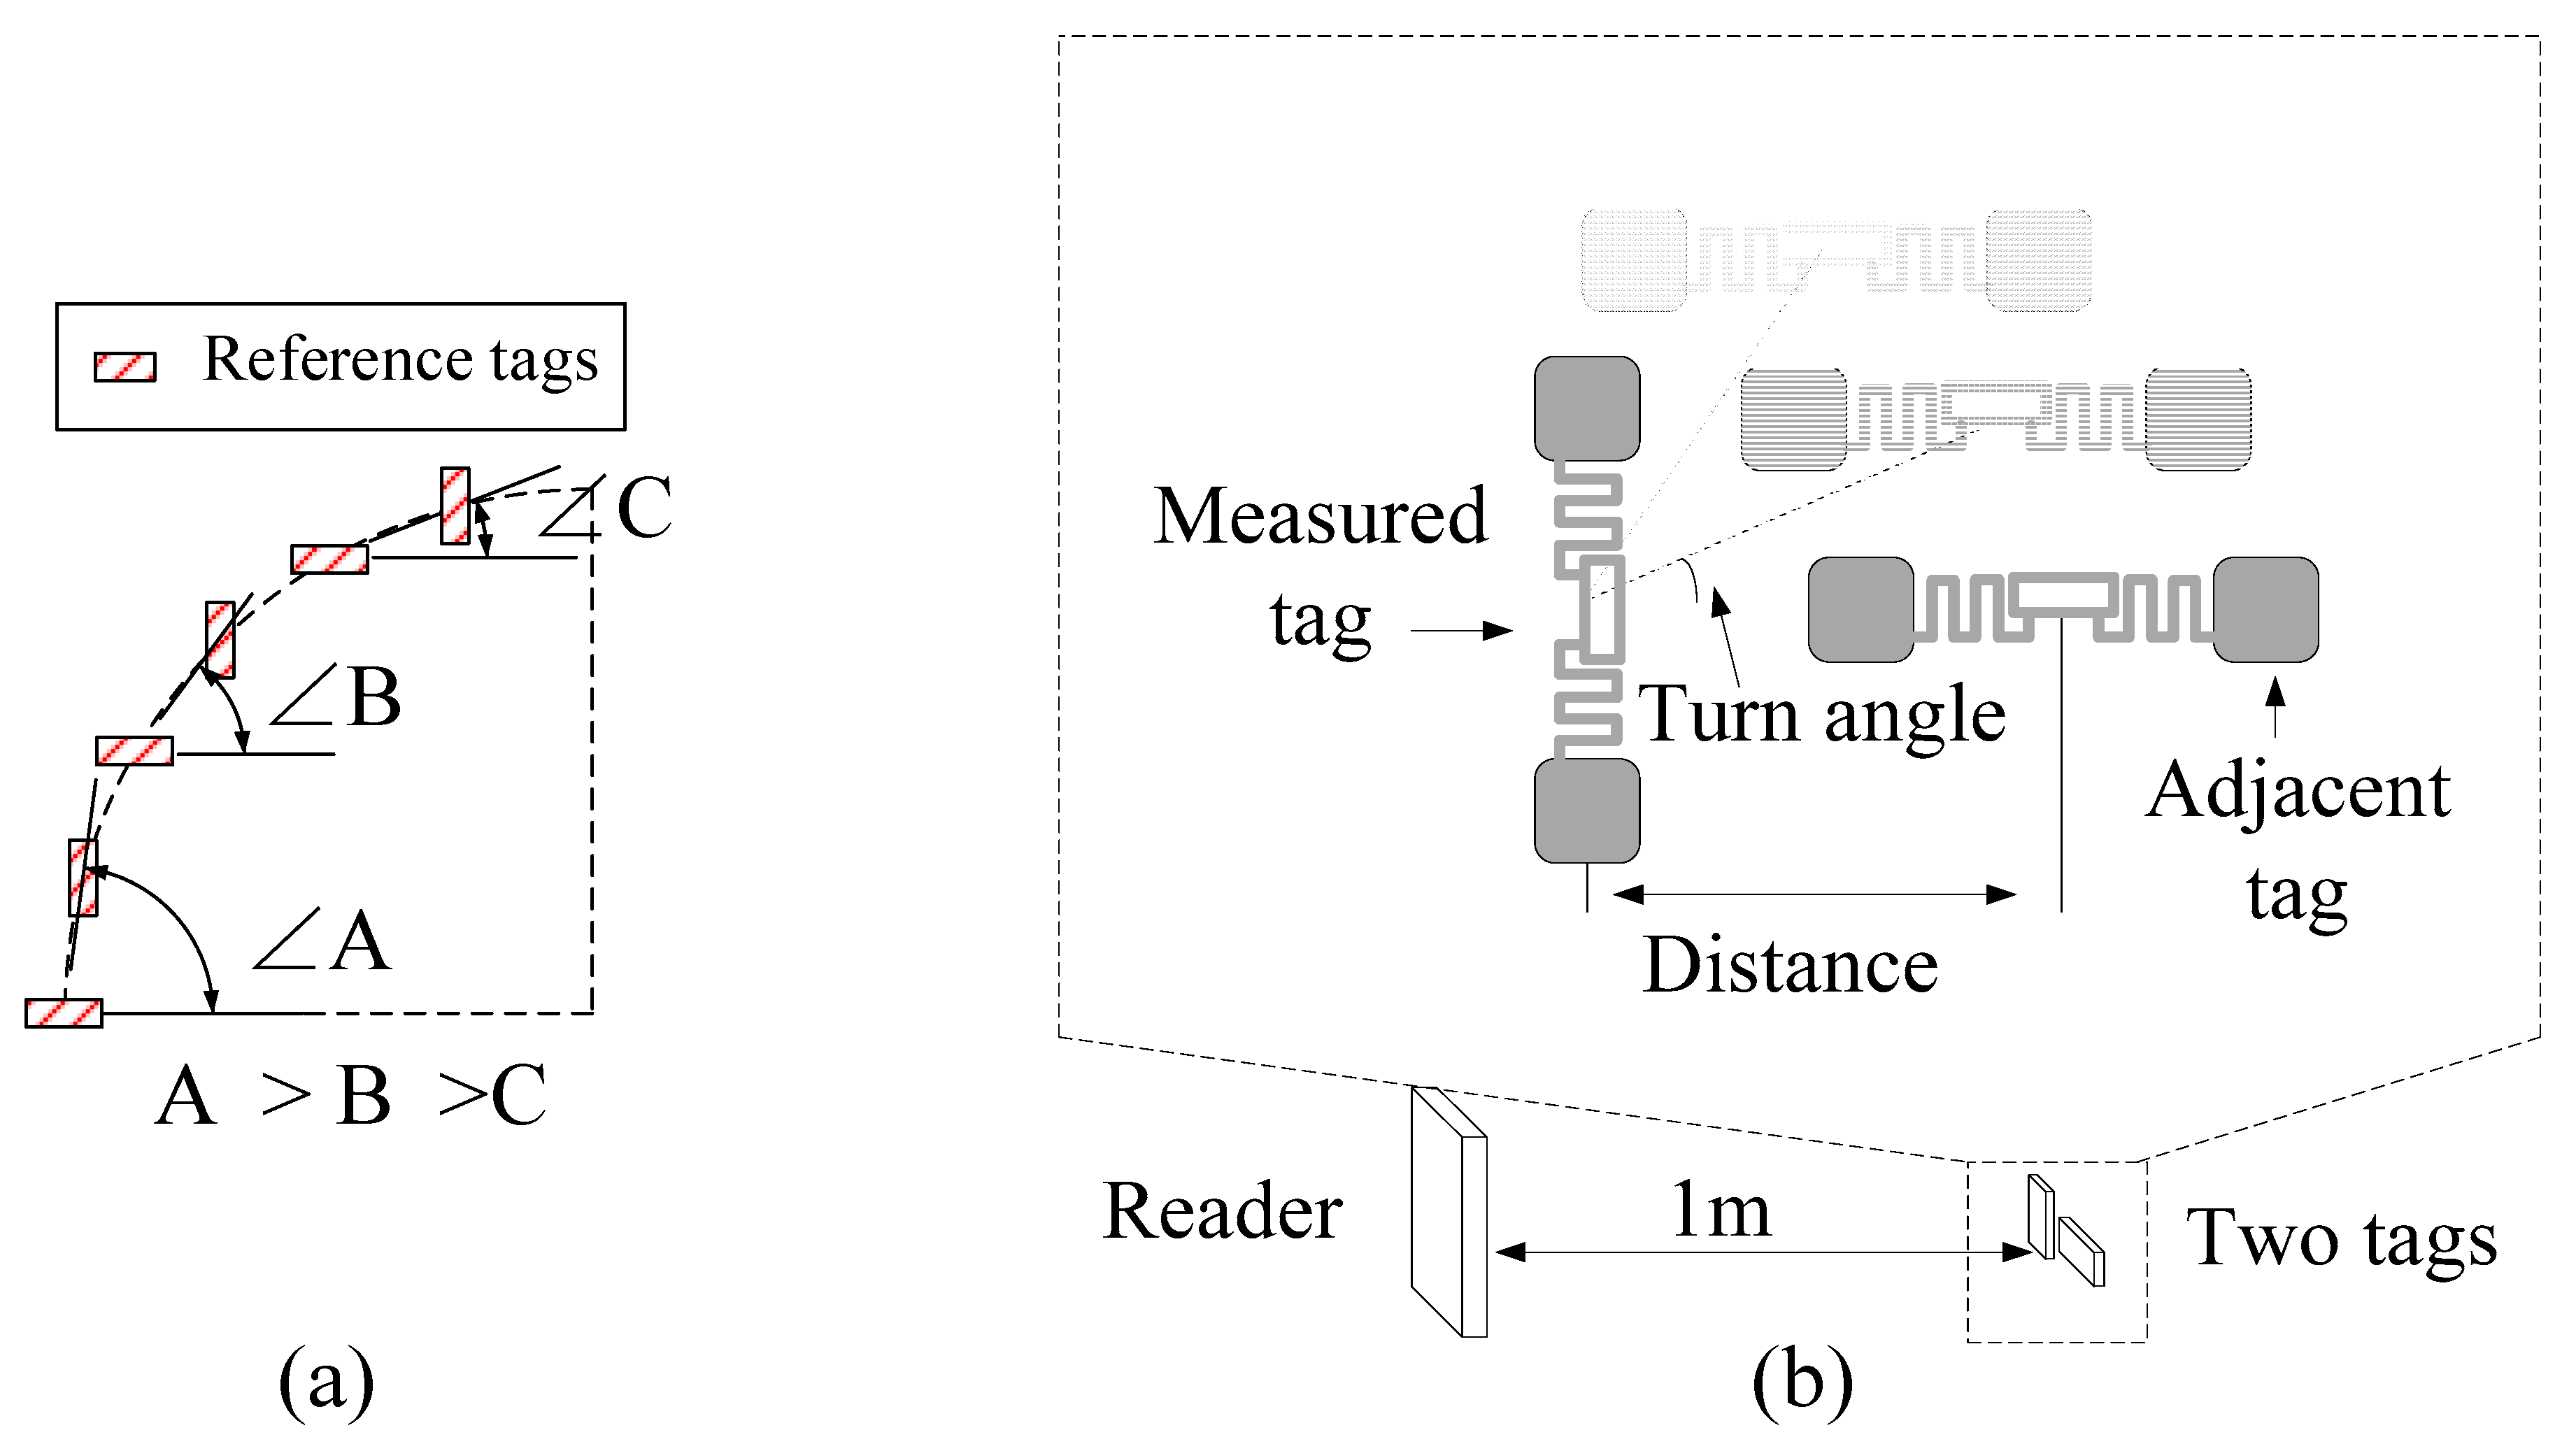
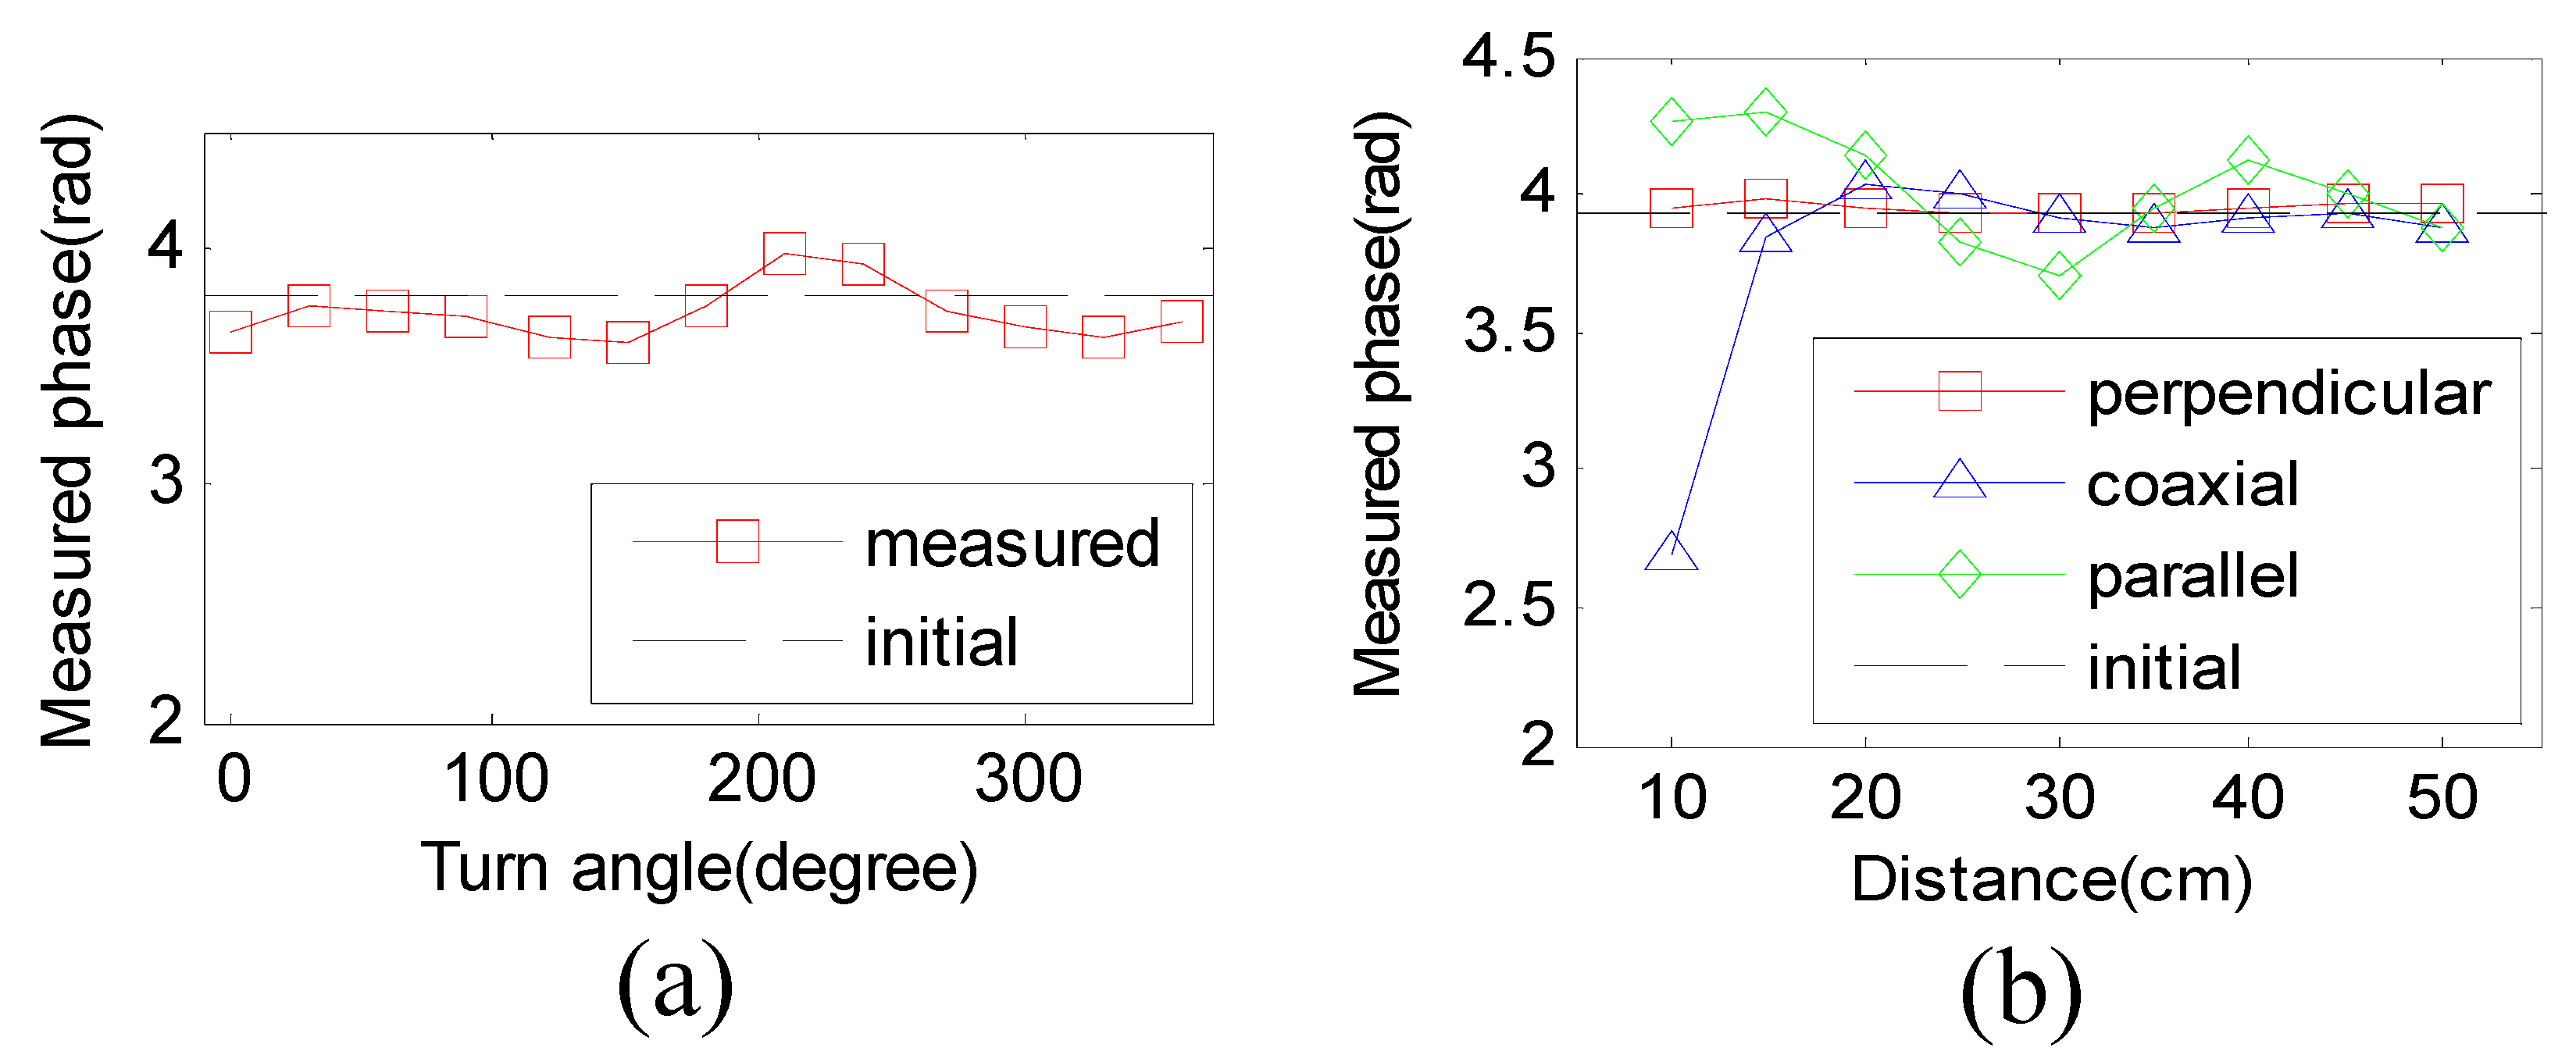
3.3. Avoiding the Effect of Mutual Coupling

Mutual coupling of adjacent tags can result in the changes of RSS and phase [33]. In some extreme cases, the coupled tags will become inactive. The tags that used in this paper are approximately the dipole structure. The relative orientation and distance of adjacent tags of the UCA have great influence on the mutual coupling. The intuitive idea is that the adjacent reference tags should be placed perpendicularly to each other. However, this idea is invalid for UCA because that the relative orientation of the adjacent tag is different with each other as shown in Figure 3a. We made similar measurements as shown in Figure 3b. It is shown that this change of relative orientation is destructive. Two tags were perpendicular and the interval is fixed at 15 cm. The turn angle is ranging from 0° to 360° with a step of 30°. The reader reads from 1 m away and the phase changes of measured tag are shown in Figure 4a. The change of relative orientation results in a counter-intuitive situation that the mutual coupling still has drastic fluctuation while the tags are mutually perpendicular. The possible reason should come from the meander or tip-loading structure of tag antenna.
We further evaluated the effect of relative distance to mutual coupling using three kinds of placements: parallel, perpendicular, and coaxial. The turn angle is fixed to zero, and the distance is ranging from 10 cm to 50 cm with a step of 5 cm. The measured phases are shown in Figure 4b. The mutual coupling of parallel placement is still strong at the distance of 40 cm. This also makes the perpendicular placement invalid because the two tags separated by one tag are parallel.
According to these evaluations, to reduce the mutual coupling, each reference tag should have the same relative position with adjacent tags, and should be the coaxial type of placement. Therefore, we introduced a type of placement as shown in Figure 5. Each reference tag has the same relative position, and is almost in the zero-power coaxial direction of the adjacent tags.

3.4. Signal Model Modification

Due to the linear polarization of tag’s antenna, the designed relative position as shown in Figure 5 will lead to different polarization directions of reference tags. The placements of reference tags are fixed, so the phase changes that came from different polarization directions are also fixed. We introduced a modified channel parameter model that considers the polarization directions of reference tags. The (17) can be rewritten as:
h l A T R A ( θ m ) = 1 / d l 2 ( θ m ) exp ( 2 π j d l ( θ m ) / λ + φ l ) ,
where φ l is a phase factor of the polarization direction of the lth reference tag. As the evaluations in our previous work [26], this factor can be calculated by:
φ l = 4 π l / L .
where L is the total number of reference tags. After solving the problems of aperture limitation and mutual coupling, the spatial spectrum is shown in Figure 6a. It is obvious that this method is useful for two targets. However, it will become invalid with the increasing number of the targets. Especially in the symmetric type of placement, the results deteriorate obviously. The spatial spectrum of five targets is shown in Figure 6b. The false positive and false negative estimations need to be solved.

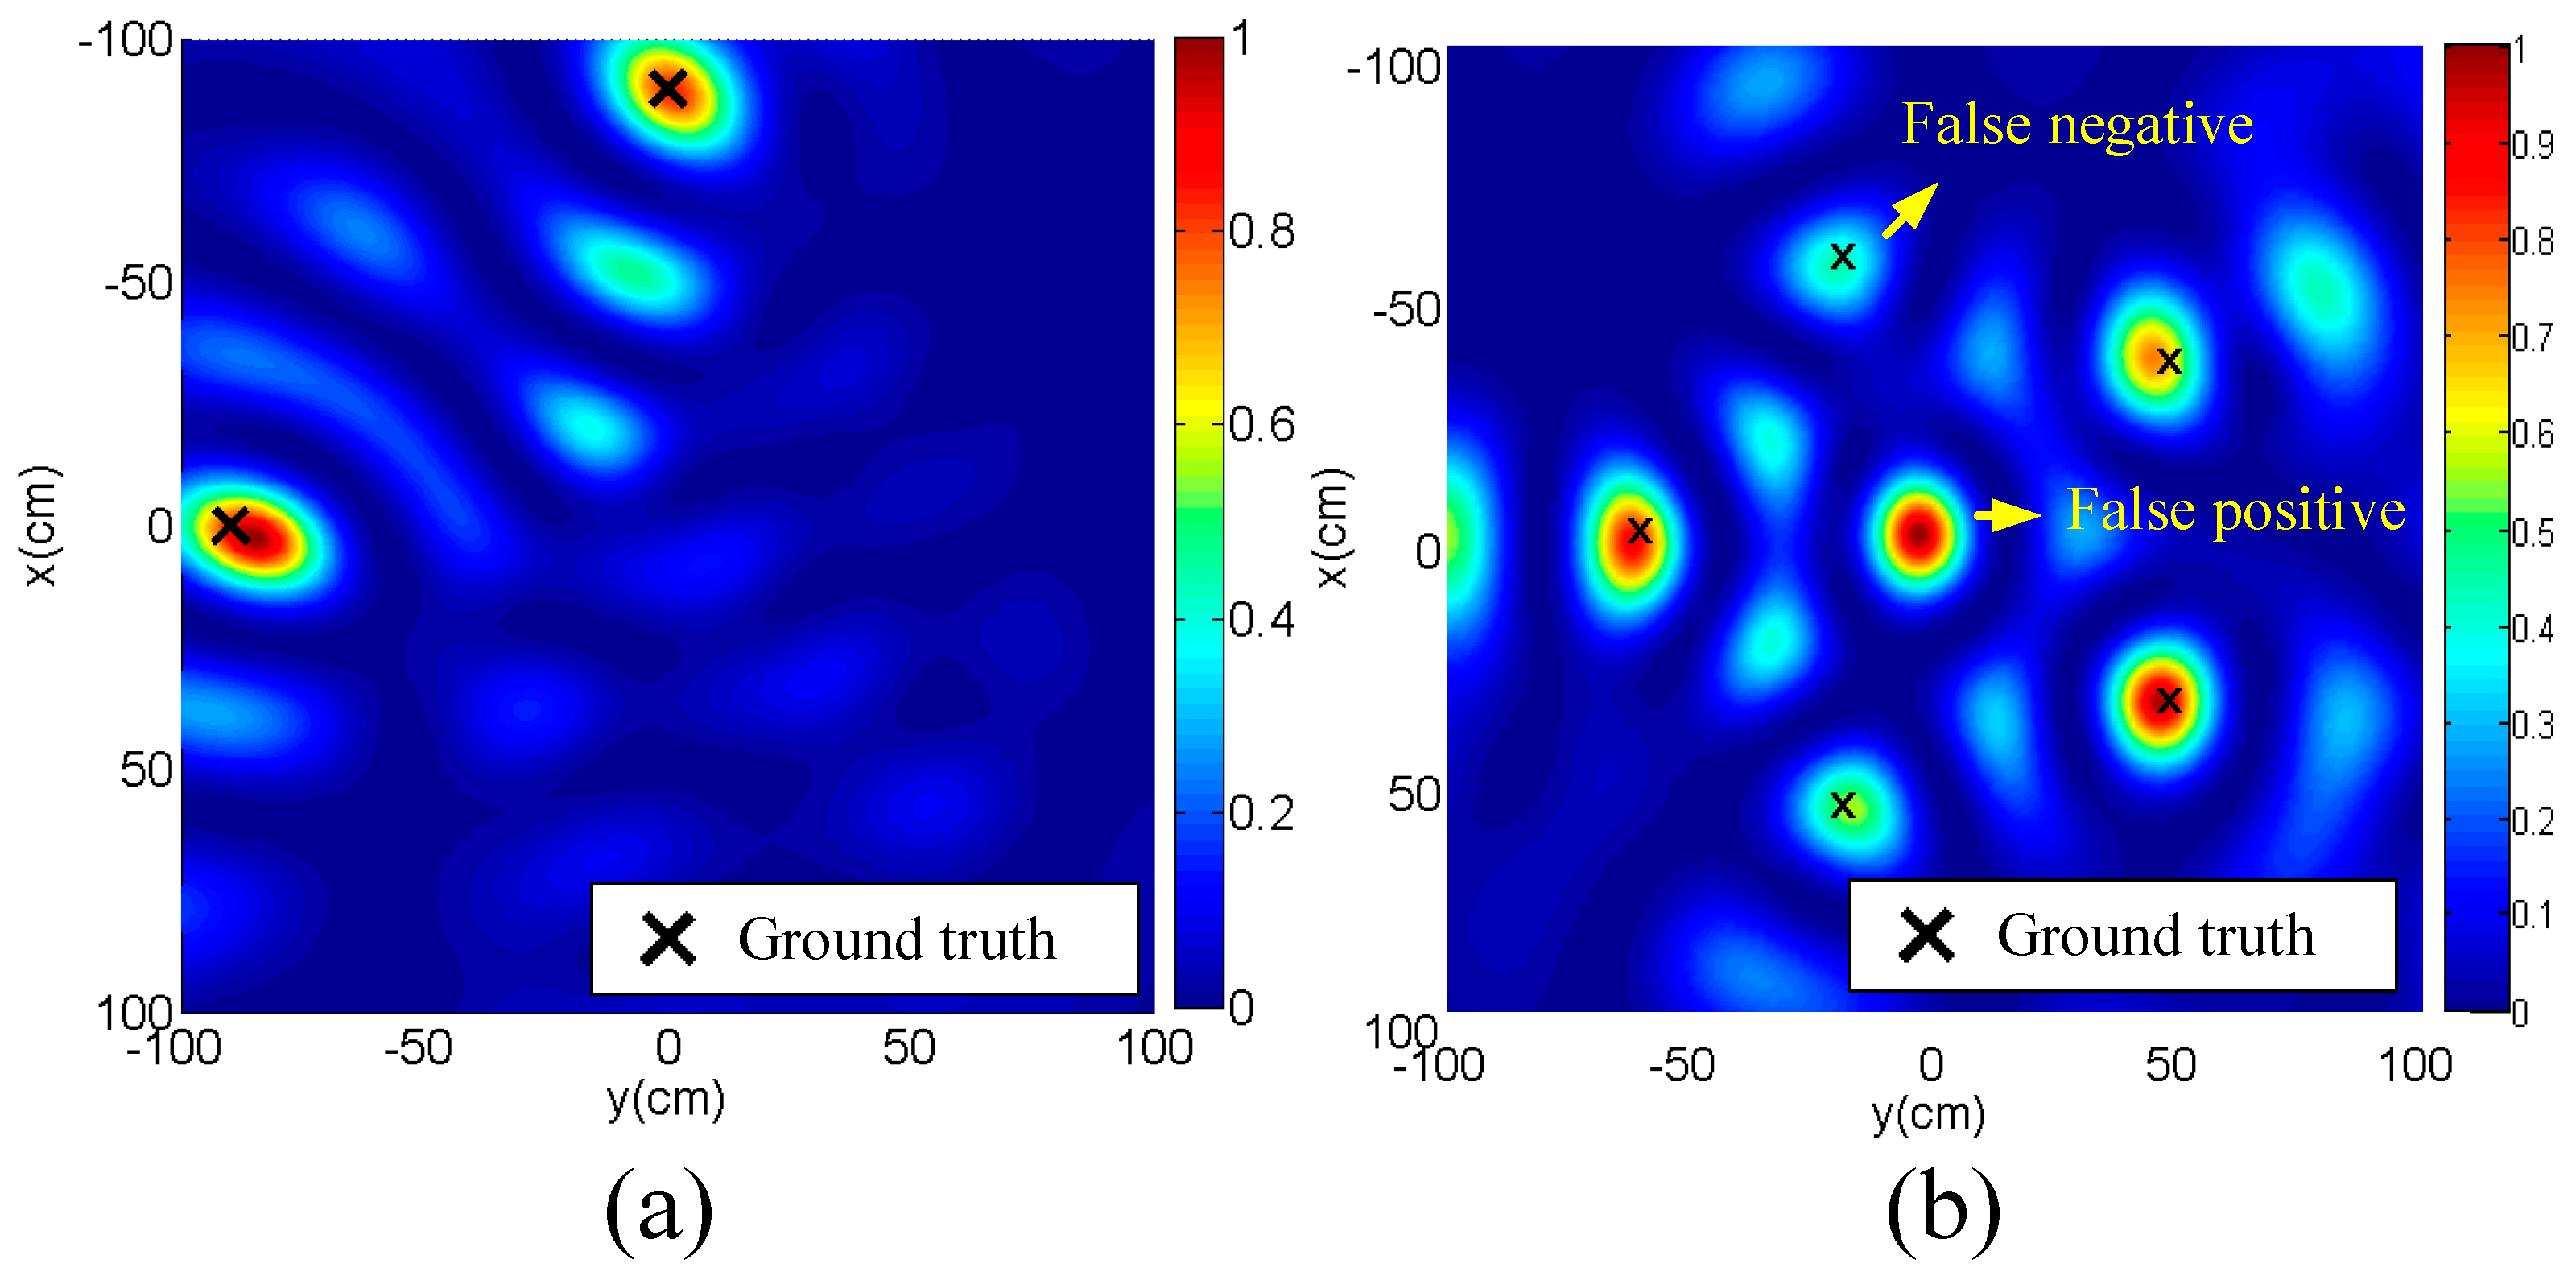
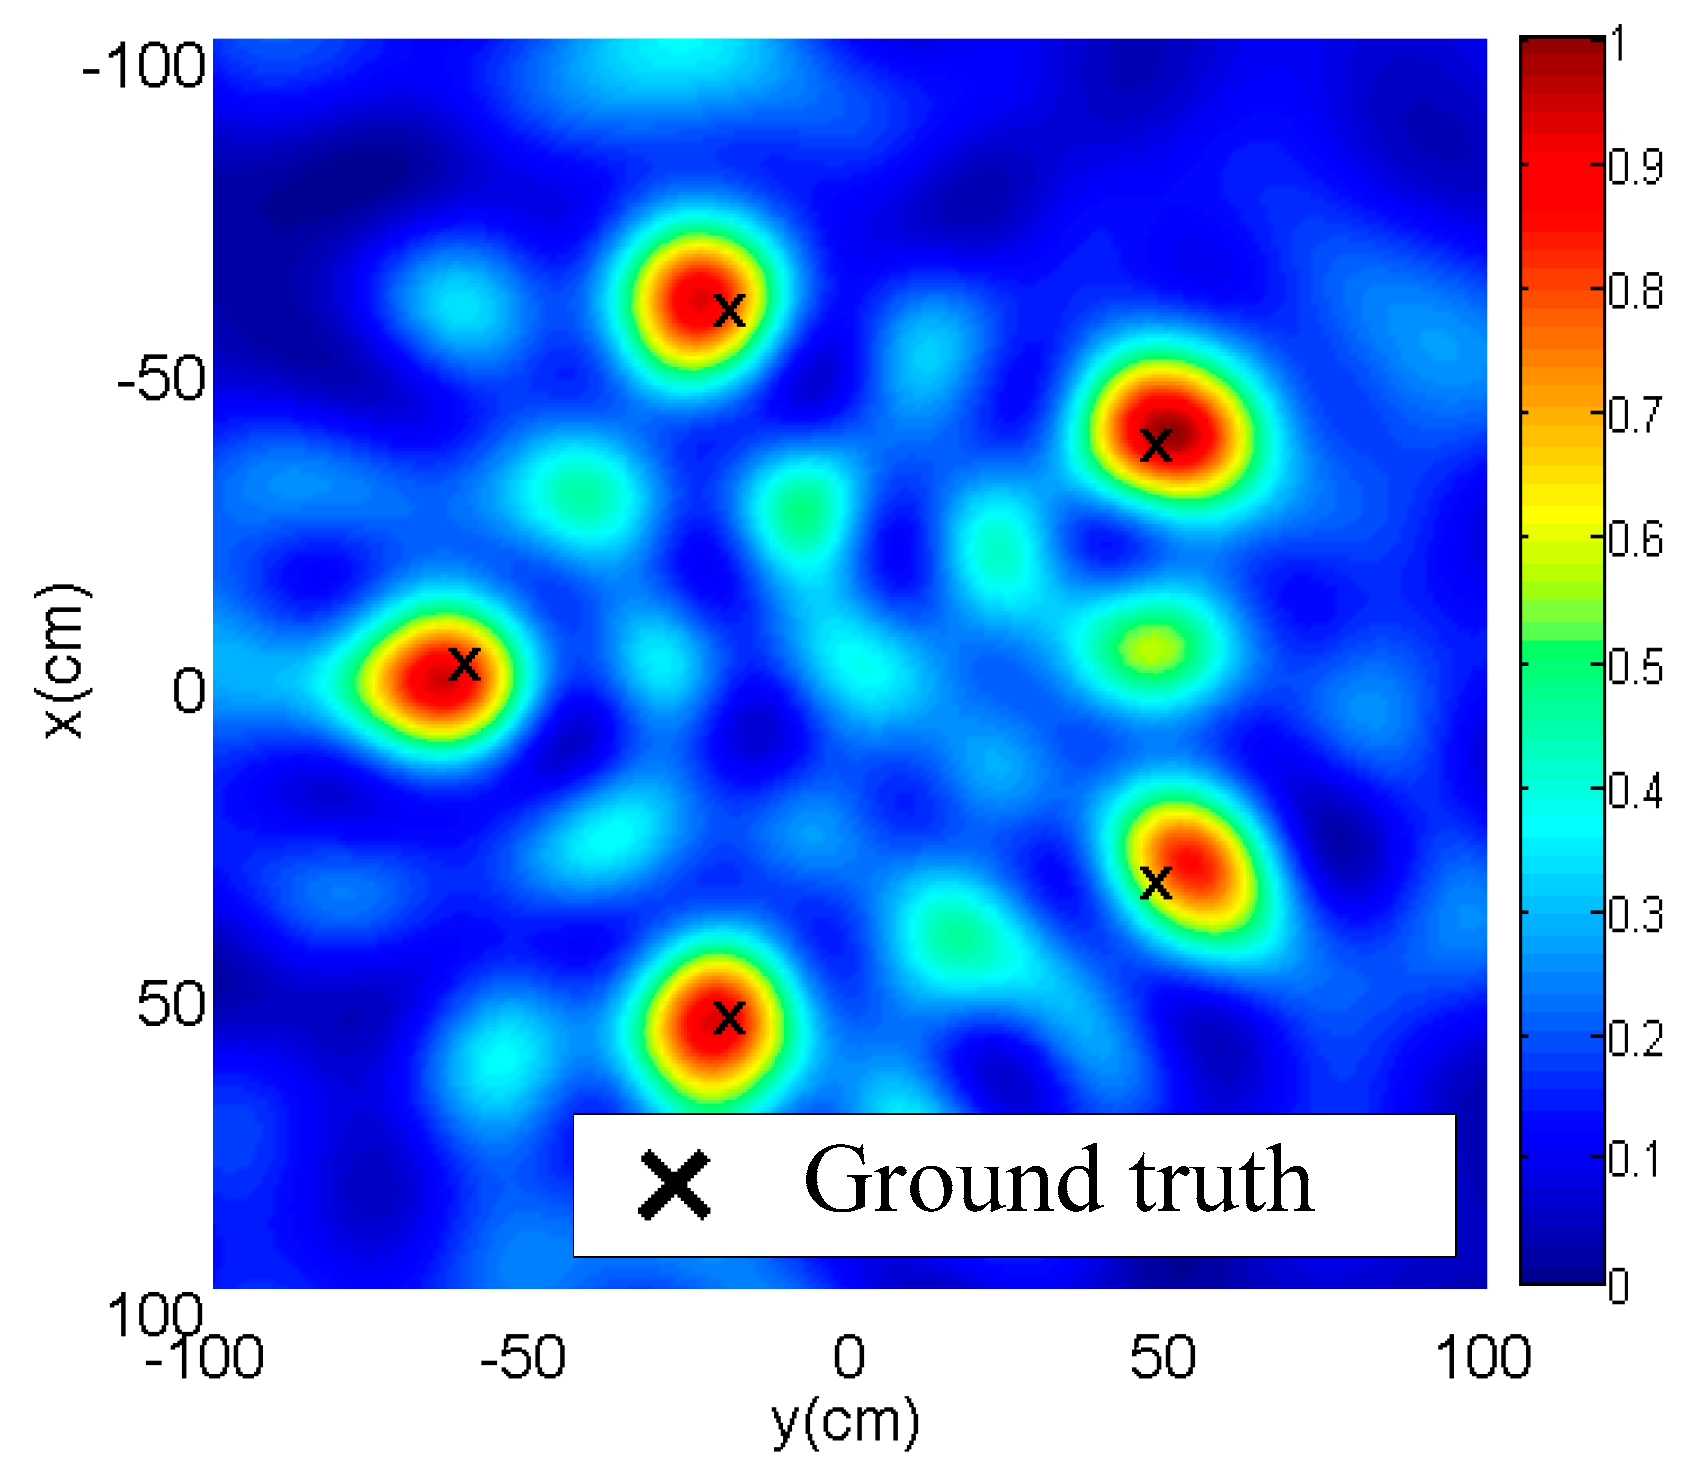
3.5. Avoiding the Effect of Interference of Targets

The reason for the false negative estimation should be the too small power of diffuse reflection of the target in some incident angles. The power of diffuse reflection is various in different incident directions and is difficult to predict. The false positive should come from the coherent superimposition of multiple targets. To solve these two problems, we took inspiration from distributed antennas and used a moving reader antenna to approximate a virtual distributed antenna array. Assume that the reader antenna array has Q elements, and the weighted spatial averaging of spatial spectrum could be written as:
J ( θ ) = 1 / Q 1 Q w / tr ( I h A T R A ( θ ) h A T R A ( θ ) + R ) ,
where w is the weight of cost functions and its value is designed according to the number of close peaks of spatial spectrum. The distance threshold that decides whether the two peaks are close or not is the spatial resolution that evaluated in Section 4.4. It is shown that the spatial resolution is about 30 cm, so the peaks of spatial spectrum with Euclidean distance less than 30 cm are very likely to be false positive. If there are no close peaks, the w should be equal to one, and the more close peaks, the closer w is to zero. So w is designed as a sigmoid function:
w = 1 1 / ( 1 + exp ( 2 ( 1 2 p ) ) ) ,
where p is the number of close peaks that the Euclidean distance is less than 30 cm. The spatial spectrum calculated by (27) is shown in Figure 7. It is obvious that the false negative and false positive estimations have been eliminated. After the normalization, the extremum points that exceed a threshold 0.5 were regarded as targets’ position in our evaluation.

4. Results and Evaluation

The prototype of our localization method was carried out in an indoor environment as shown in Figure 8. It mainly consists of reader (Impinj R420 assembled in Penang, Malaysia), antenna (Laird s9028PCR made in Shanghai, China), and tags (ALIEN AZ9662 made in Shanghai, China). The antenna was fixed to the roof of 250 cm height, and the designed UCA was made up on the ground by 40 reference tags. The radius of the UCA is about 95.5 cm and the interval of reference tags is 15 cm. Both antenna and reference tags have fixed coordinates. For effective reading, reference tags were stuck on corrugated paper. The frequency of signal sent from R420 reader is 920.625MHz and the transmitted power is 32.5 dBm. The element positions of the virtual reader antenna array are as the black points shown in the lower right corner of Figure 8 and the interval is 30 cm. To reduce the impact of accidental errors, the average of five measurements is used as an input. The target items used in our experiment were instant noodles and colas, and their shapes are approximately cylindrical with the sizes of π × ( 6   cm ) 2 × 11   cm and π × ( 2.5   cm ) 2 × 24   cm respectively. The targets were fixed on PVC tube and tested in a 2 m × 2 m square.

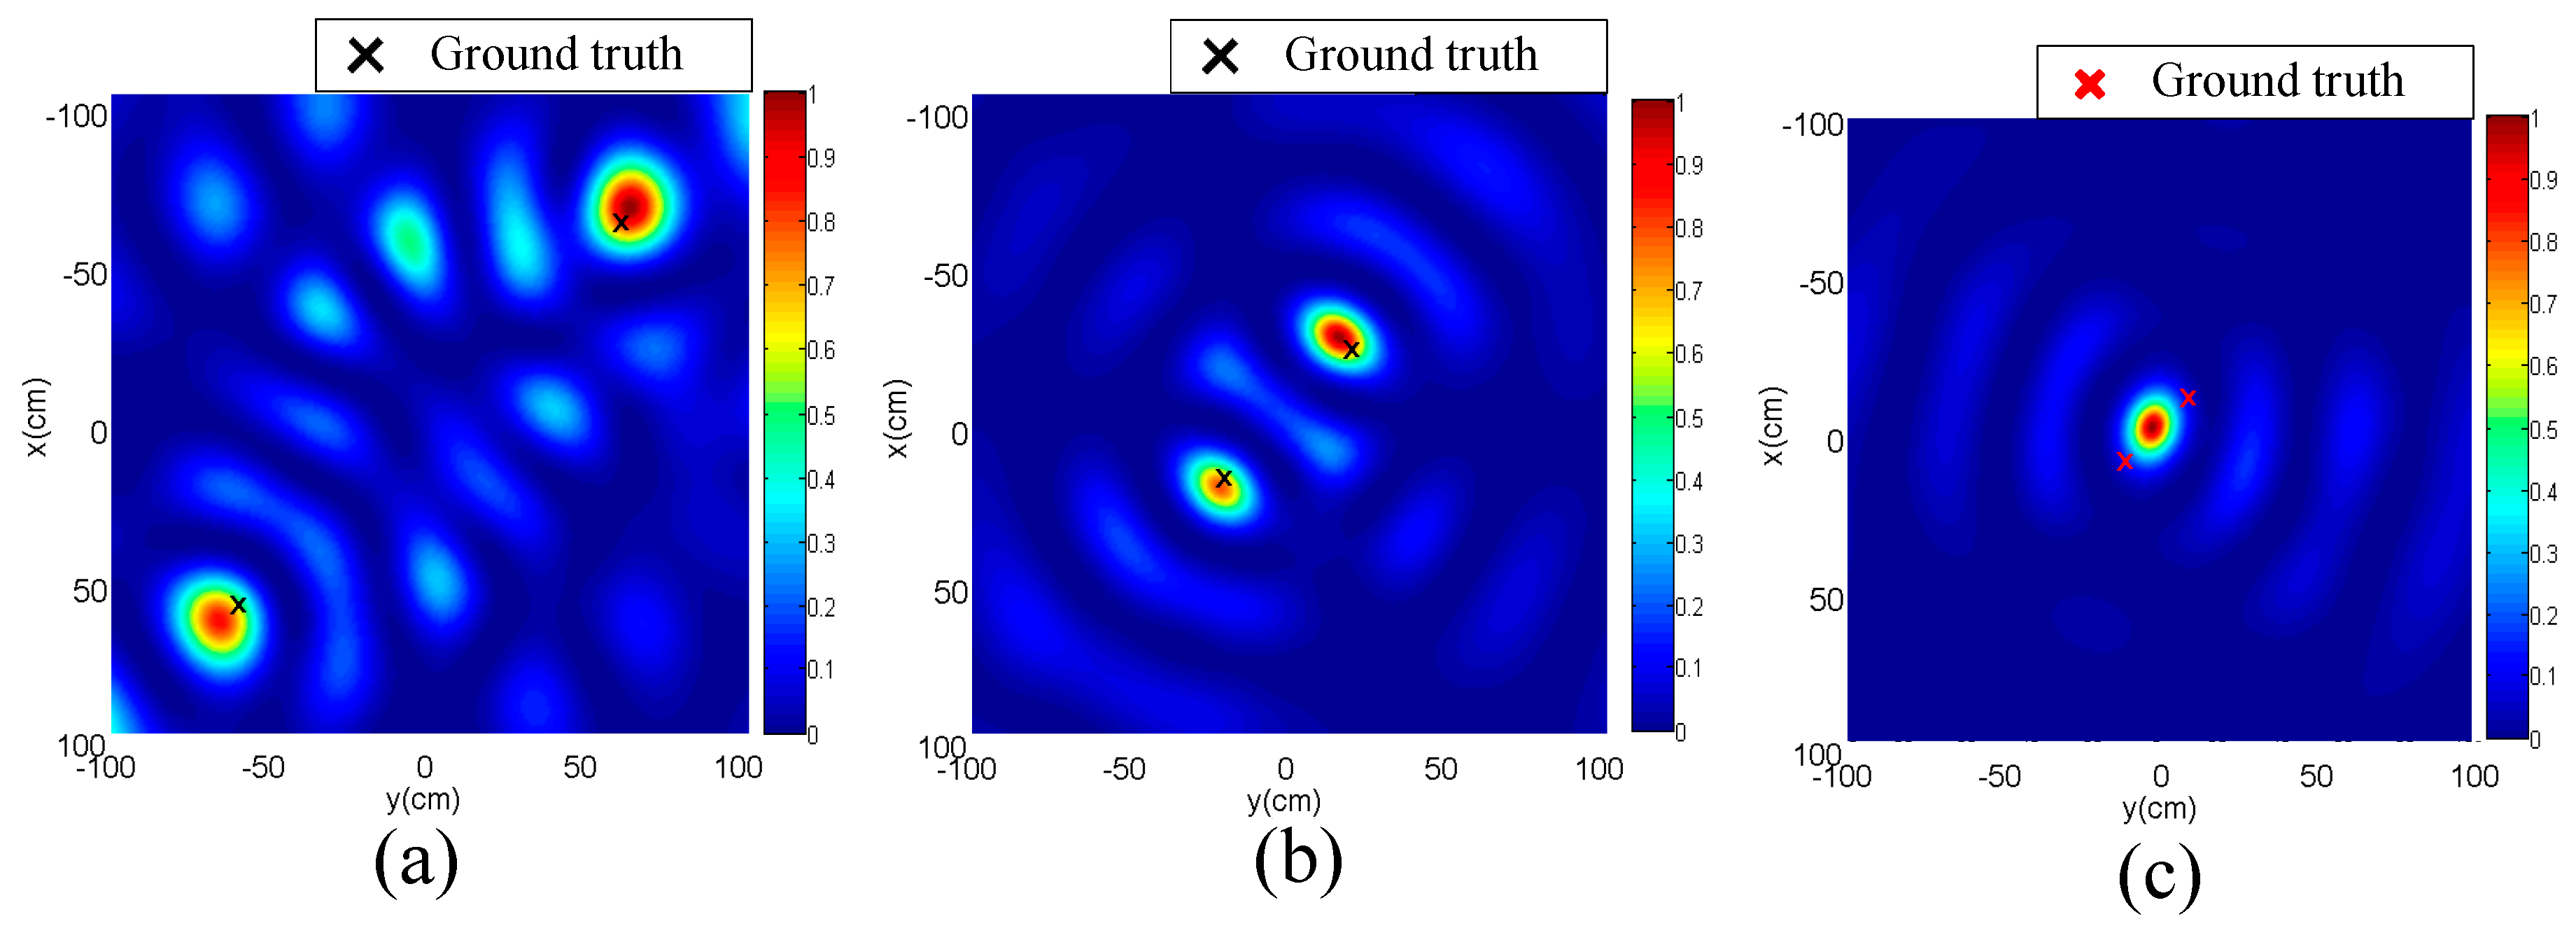
4.1. Two-Dimensional Localization Measurements

The single target was fixed on a PVC tube at a fixed height of 160 cm. The height of target can be any other values, and this 2-D localization method can be easy expanded to 3-D localization. We repeated 100 times of each localization. The single target localization results (sixteen test positions), the five targets localization results, and the cumulative distribution functions (CDFs) of localization errors are shown in Figure 9a–c respectively.
The median errors (ME), standard deviation (SD), and root mean square error (RMSE) of 2-D single target localization are shown in Table 1.
In multiple target 2-D localization, the ME, SD, and RMSE of localization, and the accuracy of target number estimation (ATNE) are shown in Table 2.

4.2. Localization Accuracy of Different Number of Targets

We evaluated our method using different number of instant noodles ranging from one to five, and the median errors of are shown in Figure 10. All the median errors are less than 5.4 cm, and it is probably the larger error with more targets. The reason of this trend should come from the signal propagation between targets. The more targets, the more interference signal. This factor is unpredictable, and hard to be included in the signal model.

4.3. Range of Detection

We placed the target at different distances from the center of reference tag array. The localizations errors and estimation accuracy of target’s number are shown in Figure 11. The system works well when the target is less than 120 cm away from the center of array. Then the error and the estimation accuracy of target’s number deteriorate when the targets are outside of 120 cm. This detection range should limited by the beam width of reader antenna. The reader antenna used in this method is Larid 9028PCR with the −3dB beam width of 70°. When the target is outside the beam, the reflected energy becomes small and the target becomes hard to be detected. This limitation can be alleviated by an omnidirectional reader antenna.

4.4. Multiple Target Spatial Resolution

Two instant noodles were placed with different intervals to test the spatial resolution. The spatial spectrums that do not use weighted spatial averaging are shown in Figure 12. The intervals of the test positions are about 170 cm, 50 cm and 30 cm. It is obvious that the two targets could be detected when the interval is larger than 50 cm. When the interval of two targets is less than 50 cm, the targets cannot be detected.
Weighted spatial averaging has the ability to enhance this resolution. All the initial spatial spectrums of 21 elements of virtual reader antenna array are shown in Figure 13a. Most of them have obvious interference and cannot obtain right results. The spatial spectrum using weighted spatial averaging method is shown in Figure 13b. It is obvious that the two targets with 30 cm interval can be distinguished. Hence, the weighted spatial averaging can improve the resolution to 30 cm.

4.5. Impact of Reference Tags

Reference tags have significant impact on system performance. The important factor is the number of reference tags that is related to both the accuracy and resolution capability. The accuracy of target number estimation and localization errors using different number of reference tags are shown in Table 3. With the increasing reference tags, the accuracy of target number estimation increases and the error of localization decreases.

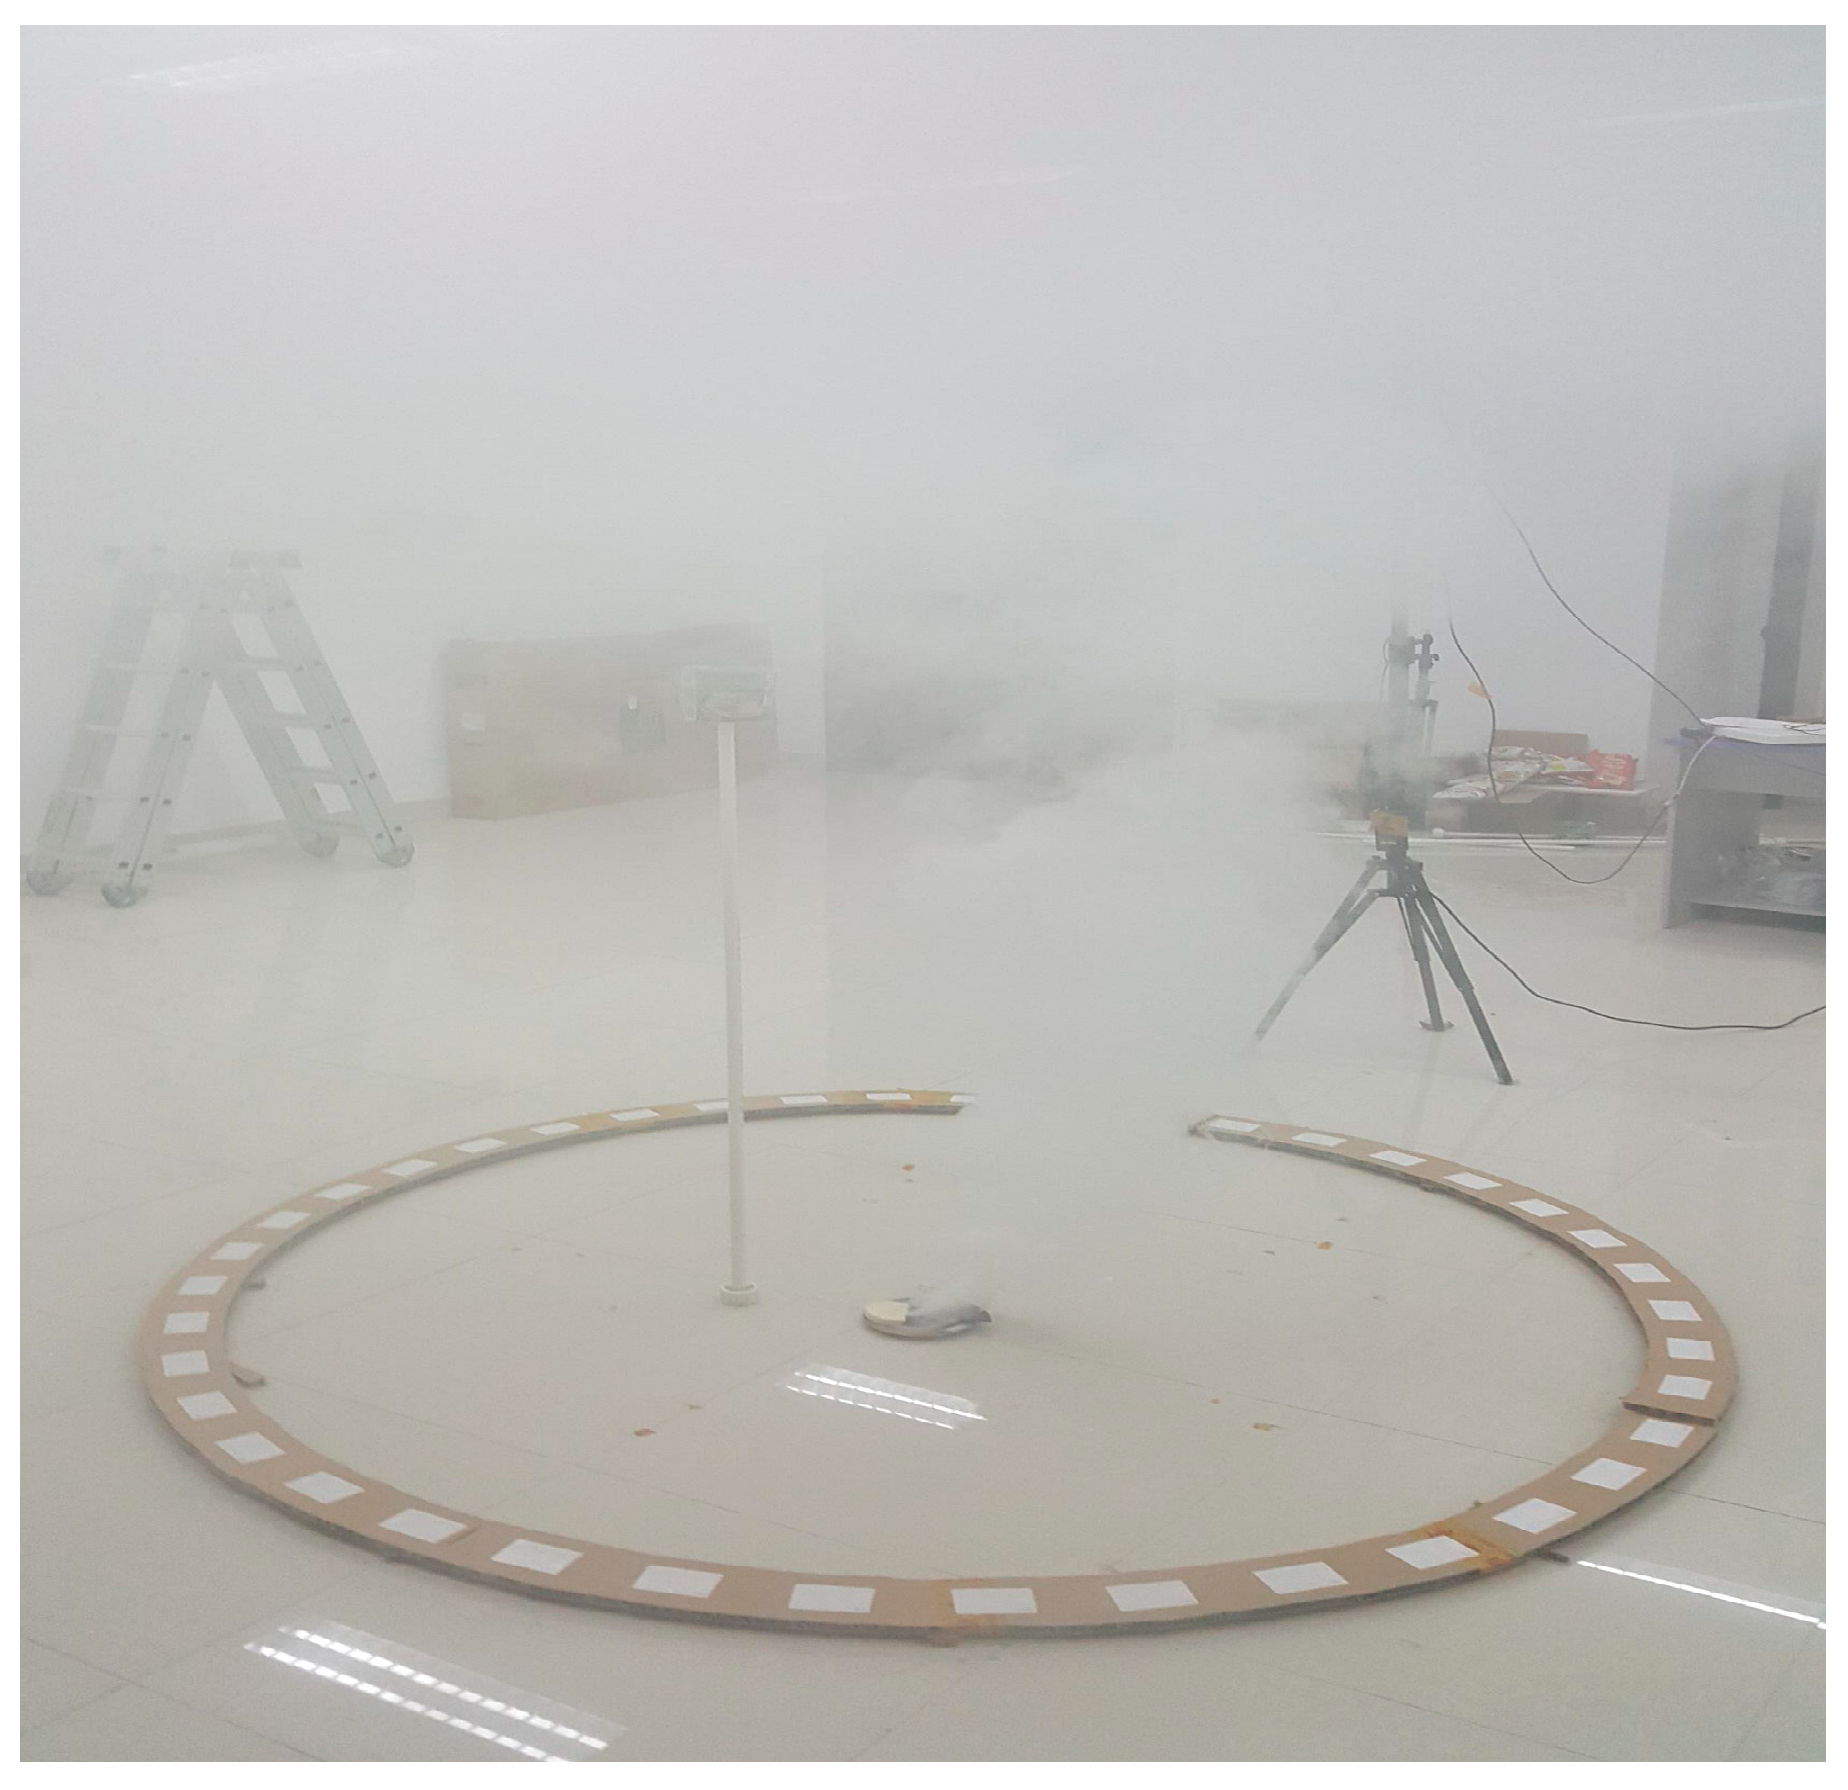
4.6. The Results in Smoky Environment

In some industrial environment, the targets may be blocked by the smoke or fog. To test our method in this environment, we constructed a sight-blocked environment using smoke as shown in Figure 14. We place two instant noodles as targets and the indoor localization was repeated 100 times. The median error of localization is 2.0 cm and all the 100 measurement obtain the right targets’ number as shown in Table 4. This shows that our method can be applied in similar industrial environment where visibility is blocked by smoke.

4.7. Comparison with Recent Works

The performance of this paper and some other methods were compared. ARTI [21] and D-Watch [19] are efficient passive localization methods that presented recently. The comparison of ARTI, D-Watch, and this paper is shown in Table 5.
The measured data and corresponding codes are available in the IEEE DataPort with DOI: 10.21227/b8j8-6r18. We hope that these will be of great use to others.

5. Conclusions

In this paper, passive multiple target indoor localization relying on diffuse reflection is proposed. More explicitly, the aperture limitation was reduced by using a uniform circular array of reference tags. Mutual coupling of reference tags was avoided by the carefully designed relative position of adjacent tags and a modified channel parameter model. The false positive and false negative estimations were eliminated by a virtual distributed reader antenna array. This method can distinguish the coherent signal of the targets and obtain the corresponding positions. We demonstrated this method in the real indoor environment. The accuracy of the estimated number of the target is about 97.5%, the spatial resolution of multiple targets is about 30 cm, and the median error of multiple target localization is about 5.5 cm.

Author Contributions

Conceptualization, M.L. and H.W.; methodology, M.L. and Y.Y.; software, M.L.; validation, L.M., N.W., and Y.Z.; writing—original draft preparation, M.L.; writing—review and editing, H.W. and Y.Y.

Funding

This research was funded by the National Key R&D Program of China, grant number 2018YFF01014304.

Conflicts of Interest

The authors declare no conflict of interest.

References

  1. Pastina, D.; Colone, F.; Martelli, T.; Falcone, P. Parasitic Exploitation of Wi-Fi Signals for Indoor Radar Surveillance. IEEE Trans. Veh. Technol. 2015, 64, 1401–1415. [Google Scholar] [CrossRef]
  2. Shi, S.; Sigg, S.; Chen, L.; Ji, Y. Accurate Location Tracking From CSI-Based Passive Device-Free Probabilistic Fingerprinting. IEEE Trans. Veh. Technol. 2018, 67, 5217–5230. [Google Scholar] [CrossRef]
  3. Luo, C.; Cheng, L.; Chan, M.C.; Gu, Y.; Li, J.; Pallas, Z.M. Self-Bootstrapping Fine-Grained Passive Indoor Localization Using WiFi Monitors. IEEE Trans. Mob. Comput. 2017, 16, 466–481. [Google Scholar] [CrossRef]
  4. Vega, M.T.; Kooonen, A.M.J.; Liotta, A.; Famaey, J. Fast Millimeter Wave Assisted Beam-Steering for Passive Indoor Optical Wireless Networks. IEEE Wirel. Commun. Lett. 2018, 7, 278–281. [Google Scholar] [CrossRef]
  5. Han, J.; Qian, C.; Wang, X.; Ma, D.; Zhao, J.; Xi, W.; Jiang, Z.; Wang, Z. Twins: Device-free object tracking using passive tags. IEEE/ACM Trans. Netw. 2016, 24, 1605–1617. [Google Scholar] [CrossRef]
  6. Zhang, D.; Jingyu, Z.; Minyi, G.; Jiannong, C.; Tianbao, L. TASA: Tag-free activeity sensing using RFID tag arrays. IEEE Trans. Parallel Distrib. Syst. 2011, 22, 558–570. [Google Scholar] [CrossRef]
  7. Zhou, C.; Griffin, J.D. Accurate phase-based ranging measurements for backscatter RFID tags. IEEE Antennas Wirel. Propag. 2012, 11, 152–155. [Google Scholar] [CrossRef]
  8. Yang, P.; Wu, W. Efficient particle filter localization algorithm in dense passive RFID tag environment. IEEE Trans. Ind. Electron. 2014, 61, 5641–5651. [Google Scholar] [CrossRef]
  9. Yang, L.; Chen, Y.; Li, X.; Xiao, C.; Li, M.; Liu, Y. Tagoram: Real-time tracking of mobile RFID tags to high precision using COTS devices. In Proceedings of the 20th annual international conference on Mobile computing and networking, Maui, HI, USA, 7–11 September 2014; pp. 237–248. [Google Scholar]
  10. Wu, H.; Yang, J.; Chen, F. Source number estimators using transformed Gerschgorin radii. IEEE Trans. Signal Process. 1995, 43, 1325–1333. [Google Scholar]
  11. Pham, G.; Loubaton, P.; Vallet, P. Performance analysis of spatial smoothing schemes in the context of large arrays. IEEE Trans. Signal Process. 2016, 64, 160–172. [Google Scholar] [CrossRef]
  12. Peng, Z.; Ran, L.; Li, C. A K-band portable FMCW radar with beamforming array for short-range localization and vital-Doppler targets discrimination. IEEE Trans. Microw. Theory Tech. 2017, 65, 3443–3452. [Google Scholar] [CrossRef]
  13. Yan, J.; Pu, W.; Liu, H.; Jiu, B.; Bao, Z. Robust chance constrained power allocation scheme for multiple target localization in colocated MIMO radar system. IEEE Trans. Signal Process. 2018, 66, 3946–3957. [Google Scholar] [CrossRef]
  14. Basikolo, T.; Arai, H. APRD-MUSIC algorithm DOA estimation for reactance based uniform circular array. IEEE Trans. Antennas Propag. 2018, 66, 4976–4985. [Google Scholar] [CrossRef]
  15. Nguyen, N.H.; Doğançay, K. Optimal geometry analysis for multistatic TOA localization. IEEE Trans. Signal Process. 2016, 64, 4180–4193. [Google Scholar] [CrossRef]
  16. Liang, J.; Leung, C.S.; So, H.C. Lagrange programming neural network approach for target localization in distributed MIMO radar. IEEE Trans. Signal Process. 2016, 64, 1574–1585. [Google Scholar] [CrossRef]
  17. Haimovich, A.M.; Blum, R.S.; Cimini, L.J. MIMO radar with widely separated antennas. IEEE Signal Process. Mag. 2018, 35, 16–27. [Google Scholar] [CrossRef]
  18. Li, X. RSS-based location estimation with unknown pathloss model. IEEE Trans. Wirel. Commun. 2006, 5, 3626–3633. [Google Scholar] [CrossRef]
  19. Wang, J.; Xiong, J.; Jiang, H.; Chen, X.; Fang, D. D-Watch: Embracing “bad” multipaths for device-free localization with COTS RFID devices. IEEE/ACM Trans. Netw. 2017, 25, 3559–3572. [Google Scholar] [CrossRef]
  20. Wilson, J.; Patwari, N. Radio tomographic imaging with wireless networks. IEEE. Trans. Mob. Comput. 2010, 9, 621–632. [Google Scholar] [CrossRef]
  21. Kaltiokallio, O.; Jantti, R.; Patwari, N. ARTI: An adaptive radio tomographic imaging system. IEEE Trans. Veh. Technol. 2017, 66, 7302–7316. [Google Scholar] [CrossRef]
  22. Patwari, N.; Agrawal, P. Effects of correlated shadowing: Connectivity localization and RF tomography. In Proceedings of the 7th International Conference on Information Processing in Sensor Networks, St. Louis, MO, USA, 22–24 April 2018; pp. 82–93. [Google Scholar]
  23. Guo, Y.; Huang, K.; Jiang, N.; Guo, X.; Li, Y.; Wang, G. An exponential-Rayleigh model for RSS-based device-free localization and tracking. IEEE Trans. Mob. Comput. 2015, 3, 484–494. [Google Scholar] [CrossRef]
  24. Aditya, S.; Molisch, A.F.; Rabeah, N.; Behairy, H.M. Localization of multiple targets with identical radar signatures in multipath environments with correlated blocking. IEEE Trans. Wirel. Commun. 2018, 1, 606–618. [Google Scholar] [CrossRef]
  25. Yang, L.; Lin, Q.; Li, X.; Liu, T.; Liu, Y. See through walls with COTS RFID system. In Proceedings of the 21st Annual International Conference on Mobile Computing and Networking, Paris, France, 7–11 September 2015; pp. 487–499. [Google Scholar]
  26. Liu, M.; Wang, H.; Yang, Y.; Zhang, Y.; Ma, L.; Wang, N. RFID 3-D indoor localization for tag and tag-free target based on interference. IEEE Trans. Instrum. Measurement. in press. [CrossRef]
  27. Ma, L.; Liu, M.; Wang, H.; Yang, Y.; Wang, N.; Zhang, Y. WallSense: Device-free indoor localization using wall-mounted UHF RFID tags. Sensors 2019, 19, 68. [Google Scholar] [CrossRef]
  28. Wang, J.; Fang, D.; Yang, Z.; Jiang, H.; Chen, X.; Xing, T.; Cai, L. E-HIPA: An energy-efficient framework for high-precision multi-target-adaptive device-free localization. IEEE Trans. Mob. Comput. 2016, 16, 716–729. [Google Scholar] [CrossRef]
  29. Liu, T.; Luo, X.; Liang, Z. Enhanced sparse representation-based device-free localization with radio tomography networks. J. Sen. Actuator Netw. 2016, 64, 1574–1585. [Google Scholar] [CrossRef]
  30. Savazzi, S.; Sigg, S.; Nicoli, M.; Rampa, V.; Kianoush, S.; Spagnolini, U. Device-free radio vision for assisted living: Leveraging wireless channel quality information for human sensing. IEEE Signal Process. Mag. 2018, 33, 45–48. [Google Scholar] [CrossRef]
  31. Dobkin, D.M. Radio basics for UHF RFID. The RF in RFID: Passive UHF RFID in Practice, 1st ed.; Newnes: Burlington, MA, USA, 2007; pp. 51–101. [Google Scholar]
  32. Buffi, A.; Pino, M.R.; Nepa, P. Experimental validation of a SAR-based RFID localization technique exploiting an automated handling system. IEEE Antennas Wirel. Propag. Lett. 2017, 16, 2795–2798. [Google Scholar] [CrossRef]
  33. Ding, H.; Han, J.; Qian, C.; Xiao, F.; Wang, G.; Yang, N.; Xi, W.; Xiao, J. Trio: Utilizing tag interference for refined localization of passive RFID. In Proceedings of the IEEE INFOCOM, Honolulu, HI, USA, 16–19 October 2018; pp. 828–836. [Google Scholar]
Figure 1. Signal propagation of a reference tag.
Electronics 08 00426 g001
Figure 2. The preliminary 2-D spatial spectrum.
Electronics 08 00426 g002
Figure 3. Analyses of mutual coupling: (a) part of UCA using perpendicularly placed tags and (b) measurement setup.
Electronics 08 00426 g003
Figure 4. The measured phase of (a) different turn angles and (b) different distances.
Electronics 08 00426 g004
Figure 5. Part of UCA using the optimized relative position.
Electronics 08 00426 g005
Figure 6. The spatial spectrum after cancelling aperture limitation and mutual coupling: (a) two targets and (b) five targets.
Electronics 08 00426 g006
Figure 7. The final spatial spectrum.
Electronics 08 00426 g007
Figure 8. Experimental setup in indoor environment.
Electronics 08 00426 g008
Figure 9. The localization results: (a) single target localization results of 16 test positions, (b) five-target localization results, and (c) CDFs of 2-D localization.
Electronics 08 00426 g009
Figure 10. The median errors of different number of targets.
Electronics 08 00426 g010
Figure 11. The results with different distances between the target and the center of reference tags array: (a) the errors and (b) estimation accuracy of targets’ number.
Electronics 08 00426 g011
Figure 12. The results without weighted spatial averaging: (a) 170 cm, (b) 50 cm, and (c) 30 cm interval.
Electronics 08 00426 g012
Figure 13. Weighted spatial averaging process: (a) the initial 21 spatial spectrums, and (b) the spatial spectrum after spatial averaging.
Electronics 08 00426 g013
Figure 14. Smoky environment.
Electronics 08 00426 g014
Table 1. Statistics of single target localization results.
TargetME (cm)SD (cm)RMSE (cm)
Instant Noodles2.31.83.9
Cola3.23.76.4
Mean2.82.85.2
Table 2. Statistics of multiple target localization results.
TargetME (cm)SD (cm)RMSE (cm)ATNE
Instant Noodles5.41.0315.095%
Cola5.51.014.7100%
Mean5.51.014.997.5%
Table 3. The results using different number of reference tags.
Number of Reference Tags10203040
Accuracy of target number estimation23%51%72%95%
Median error(cm)10.08.89.05.4
Table 4. The results in smoky environment.
EnvironmentNormalSmoky
Accuracy of target number estimation100%100%
Median error(cm)1.92.0
Table 5. Comparison with recent works.
MethodsMaximum Number of Targets that can be EstimatedMedian Error of Positions Estimation
ARTI [21]One7.6
D-Watch [19]Three5.8
This paperFive5.4

