Article

Compact UV LED Lamp with Low Heat Emissions for Biological Research Applications

1
Faculty of Electrical Engineering, University of Ljubljana, Tržaška 25, SI-1000 Ljubljana, Slovenia
2
National Institute of Chemistry, Hajdrihova 19, SI-1001 Ljubljana; Slovenia
3
Faculty of Medicine, University of Ljubljana, Vrazov trg 2, SI-1000 Ljubljana, Slovenia
*
Author to whom correspondence should be addressed.
Electronics 2019, 8(3), 343; https://doi.org/10.3390/electronics8030343
Submission received: 27 February 2019 / Revised: 18 March 2019 / Accepted: 19 March 2019 / Published: 21 March 2019
(This article belongs to the Section Microelectronics)

Abstract

:
Much biomedical research focuses on the effects of UV light on human cells. UV light sources are a prerequisite for such research. This paper presents the design and achieved performance of a UVA (Ultraviolet A: 320–400 nm) and a UVB (Ultraviolet B: 290–320 nm) LED-based lamp suitable for use in bioassays, as well as inside an incubator. Numerical simulations were used to optimise the number, layout and output power of LEDs to achieve good irradiance homogeneity while maintaining low costs. Design was optimised for the efficient transfer of generated heat away from the irradiated samples through the heatsink at the back of the lamps. The average irradiance of the target surface by the UVA lamp was 70.1 W/m2 with a maximum deviation of 4.9%, and the average irradiance by the UVB lamp was 3.1 W/m2 with a maximum deviation of 4.8%. With the UVA and UVB lamps, the temperature of samples undergoing irradiation in the incubator rises from 37 to 42 °C within 40 and 67 min, respectively. This by far exceeds the required UV irradiation time in most cases. Tests on Jurkat and HEK-293 cell cultures confirmed the suitability of our lamps for biomedical research.

Graphical Abstract

1. Introduction

Focusing on the field of medicine and human health, ultraviolet light (UV) is the most prominent and universal environmental human carcinogen. Research shows that as many as 90% of skin cancers are due to UV radiation [1]. Other unwanted UV effects include sunburn, immunosuppression, eye damage and skin ageing [2]. On the other hand, there are many known positive effects and uses of UV light, including its therapeutic effects (e.g., in treating infants suffering from jaundice [3]; in treating skin, sleep, mood and seasonal affective disorders [4]; in treating vitamin D deficiency [5]; wound healing [6]) and further applications in medicine, such as its use in air ventilation systems in hospitals, in air/water purification, in disinfection in surgery, and much more [7,8].
Since UV light has such a vast variety of effects on the human body, a significant amount of biomedical research focuses on it. Exposing in vitro cell cultures of selected tissue origin to UV radiation is a very convenient option for researching human body responses to UV irradiation. The responses triggered by UV irradiation are wavelength and dose dependent. The UVA (320 nm to 400 nm) and UVB (290 nm to 320 nm) ranges of the UV spectrum are of particular interest because the intensities they reach on the earth’s surface are often harmful. On the other hand, the UVC (100 nm to 290 nm) part of the solar spectrum is, for all intents and purposes, completely absorbed by the earth’s atmosphere [9]. Therefore, reliable light sources emitting light in the UVA and UVB ranges adapted to the cell culture environment are indispensable research tools.
In the past, researchers have used a wide variety of solutions for UV illumination, ranging from home solarium lamps to state-of-the-art solar simulators. By far the most common source of UV light is a lamp with one or more fluorescent tubes [10,11,12,13,14], ranging from simple hand-held lamps [14] or home solariums [10] to UV-crosslinkers [12] and therapeutic illuminators designed for medical use [13]. The second most common type of UV light sources for medical research are solar simulators [15,16,17], which usually employ a high-power Xenon arc lamp with an optical output spectrum very similar to that of natural sunlight. However, their large size and high heat output make them less suitable for bioassays. Even fluorescent tubes, which are still among the more efficient light sources, emit approximately 90% of their energy in the form of heat [18]. Researchers combat the problem of excessive heat dissipation with ventilation [10], ice blocks [11], cooling blocks connected to a thermostated bath [16], etc.
In the last few decades, remarkable progress has been achieved in the field of light emitting diodes (LEDs) [19], which have already proven to be very suitable for biomedical research applications [20,21,22,23]. In the last decade, UV LEDs have progressed significantly as well. These now include UVA, UVB and UVC LEDs with emission peaks reaching all the way down to 210 nm [24]. LEDs have already surpassed all other illumination technologies in terms of conversion efficiencies [25], making them potentially an ideal replacement for current solutions. Unfortunately, UV LEDs have not yet reached the same level of maturity as white LEDs, but they are nevertheless becoming an attractive option because of their ability to operate at low temperatures, their long lifespan, almost instant on/off times, and because they do not require high voltages to operate.
Up until now, the best available option for bioassays has been a purpose-built petri dish or microtiter plate UV illuminator like Vilber Bio-sun [26], with highly uniform illumination and a built-in cooling system, which is usually based on fluorescent tubes. However, such light sources still require that the samples are taken out of the incubator for the duration of illumination, risking other environmental influences like atmosphere, temperature and humidity changes that may influence the effects of the UV illumination experiment. These influences may be especially prominent when simulating long-term UV exposure. An alternative would be a handheld UV lamp, which is about the right shape and size to be placed inside an incubator. However, we couldn’t find one which would be uniform enough and designed to operate in extreme humidity environments such as an incubator.
In this work, we demonstrate the development and use of UVA and UVB LED-based light sources designed for cell culture research inside an incubator. A preliminary report on the UVA lamp has already been presented at the 53rd MIDEM conference [27]. We show bottom-up illumination, applicable for microtiter plates, cell culture flasks and Petri dishes. This approach enables homogenous irradiation of the surface with flexible and precise settings of irradiance and time. Low heat emission reduces the risk of unwanted thermal effects on cell cultures. The low operating voltage and compact design allow its use in a 100% relative humidity environment inside a cell culture incubator. These achievements, along with the foreseeable further development of UV LEDs, will likely lead to a close to ideal UV irradiation source for cell culture research with the potential for a variety of other applications.

2. UV Lamp Design

2.1. UV Lamp Requirements and Optical Design

A lamp intended to operate in an incubator needs to be small, it has to have a very limited heat output, and it has to be able to operate in a 100% relative humidity environment. The desired illumination area was 155 mm × 87 mm, which would accommodate the illumination of samples in various containers with sizes up to the size of the T75 cell culture flasks. The desired illumination inhomogeneity was less than ±5%, which would be a slight improvement over the stated ±7% inhomogeneity of Vilber’s Bio-sun [26].
An ideal UV light source for biomedical research would have a sufficiently large illumination area, which would emit light uniformly. LEDs are just the opposite—light sources concentrated into a tiny dot. To achieve homogenous illumination, many LEDs have to be arranged in a two-dimensional array. Although the prices of white and blue LEDs have by now become very low, and even the prices of UVA LEDs are quite reasonable, the prices of UVB LEDs were, at the time of this writing, still very high, ranging from USD 30 up to USD 160 for a single LED. To keep the price of the lamp within reasonable limits, the number of LEDs had to be as low as possible.
The minimum number of LEDs was determined by numerical simulations of irradiance of the desired target area at different distances from the LEDs and with different sizes of the LED array. The density of the LED array and the power output of individual LEDs within the array were varied.
Normalised irradiance at each point of the target area was calculated by summing up the contributions of all the LEDs and normalizing the results with the maximum calculated value:
E j = 1 E max i P i · R R P ( θ i , j ) cos ( θ i , j ) · r i , j 2 ,
where Emax is the maximum irradiance in any of the target points Tj, P is the output power of an LED normalised to its maximum possible output power, RRP is the relative radiation profile in the direction from the LED to the target point, r is the distance between the LED and the target point, and θ is the LED light beam’s outbound polar angle. The geometry of the simulated problem is shown in Figure 1.
Simulations were performed using the RRP (Figure 2) of the selected UVA LEDs LTPL-C034UCH365 [28] by Lite-on Technology Corp. (Taipei, Taiwan, China). The RRP of the selected UVB LEDs, UF1HA-0F001 by Dowa Electronics Materials Co., Ltd. (Tokyo, Japan), was not available at the design stage; therefore, the simulations were only performed for the UVA lamp, and the results were applied to both lamps. The typical maximum optical output power of the UVA LED is 690 mW at an injected current of 500 mA and the typical maximum optical output power of the UVB LED is 13 mW at 100 mA.
The optimum configuration determined by the simulations consists of an array of 3 by 6 LEDs, at a distance of 30 mm from the target area. The distance between the 3 rows of LEDs is 34 mm with 31 mm between the 6 columns. The distance between rows is slightly larger than the distance between columns in order to achieve a slightly wider illumination area without having to add another row of LEDs. The relative output power of the individual LEDs for achieving homogenous illumination is given in Table 1 and varies from 55% to 100%.

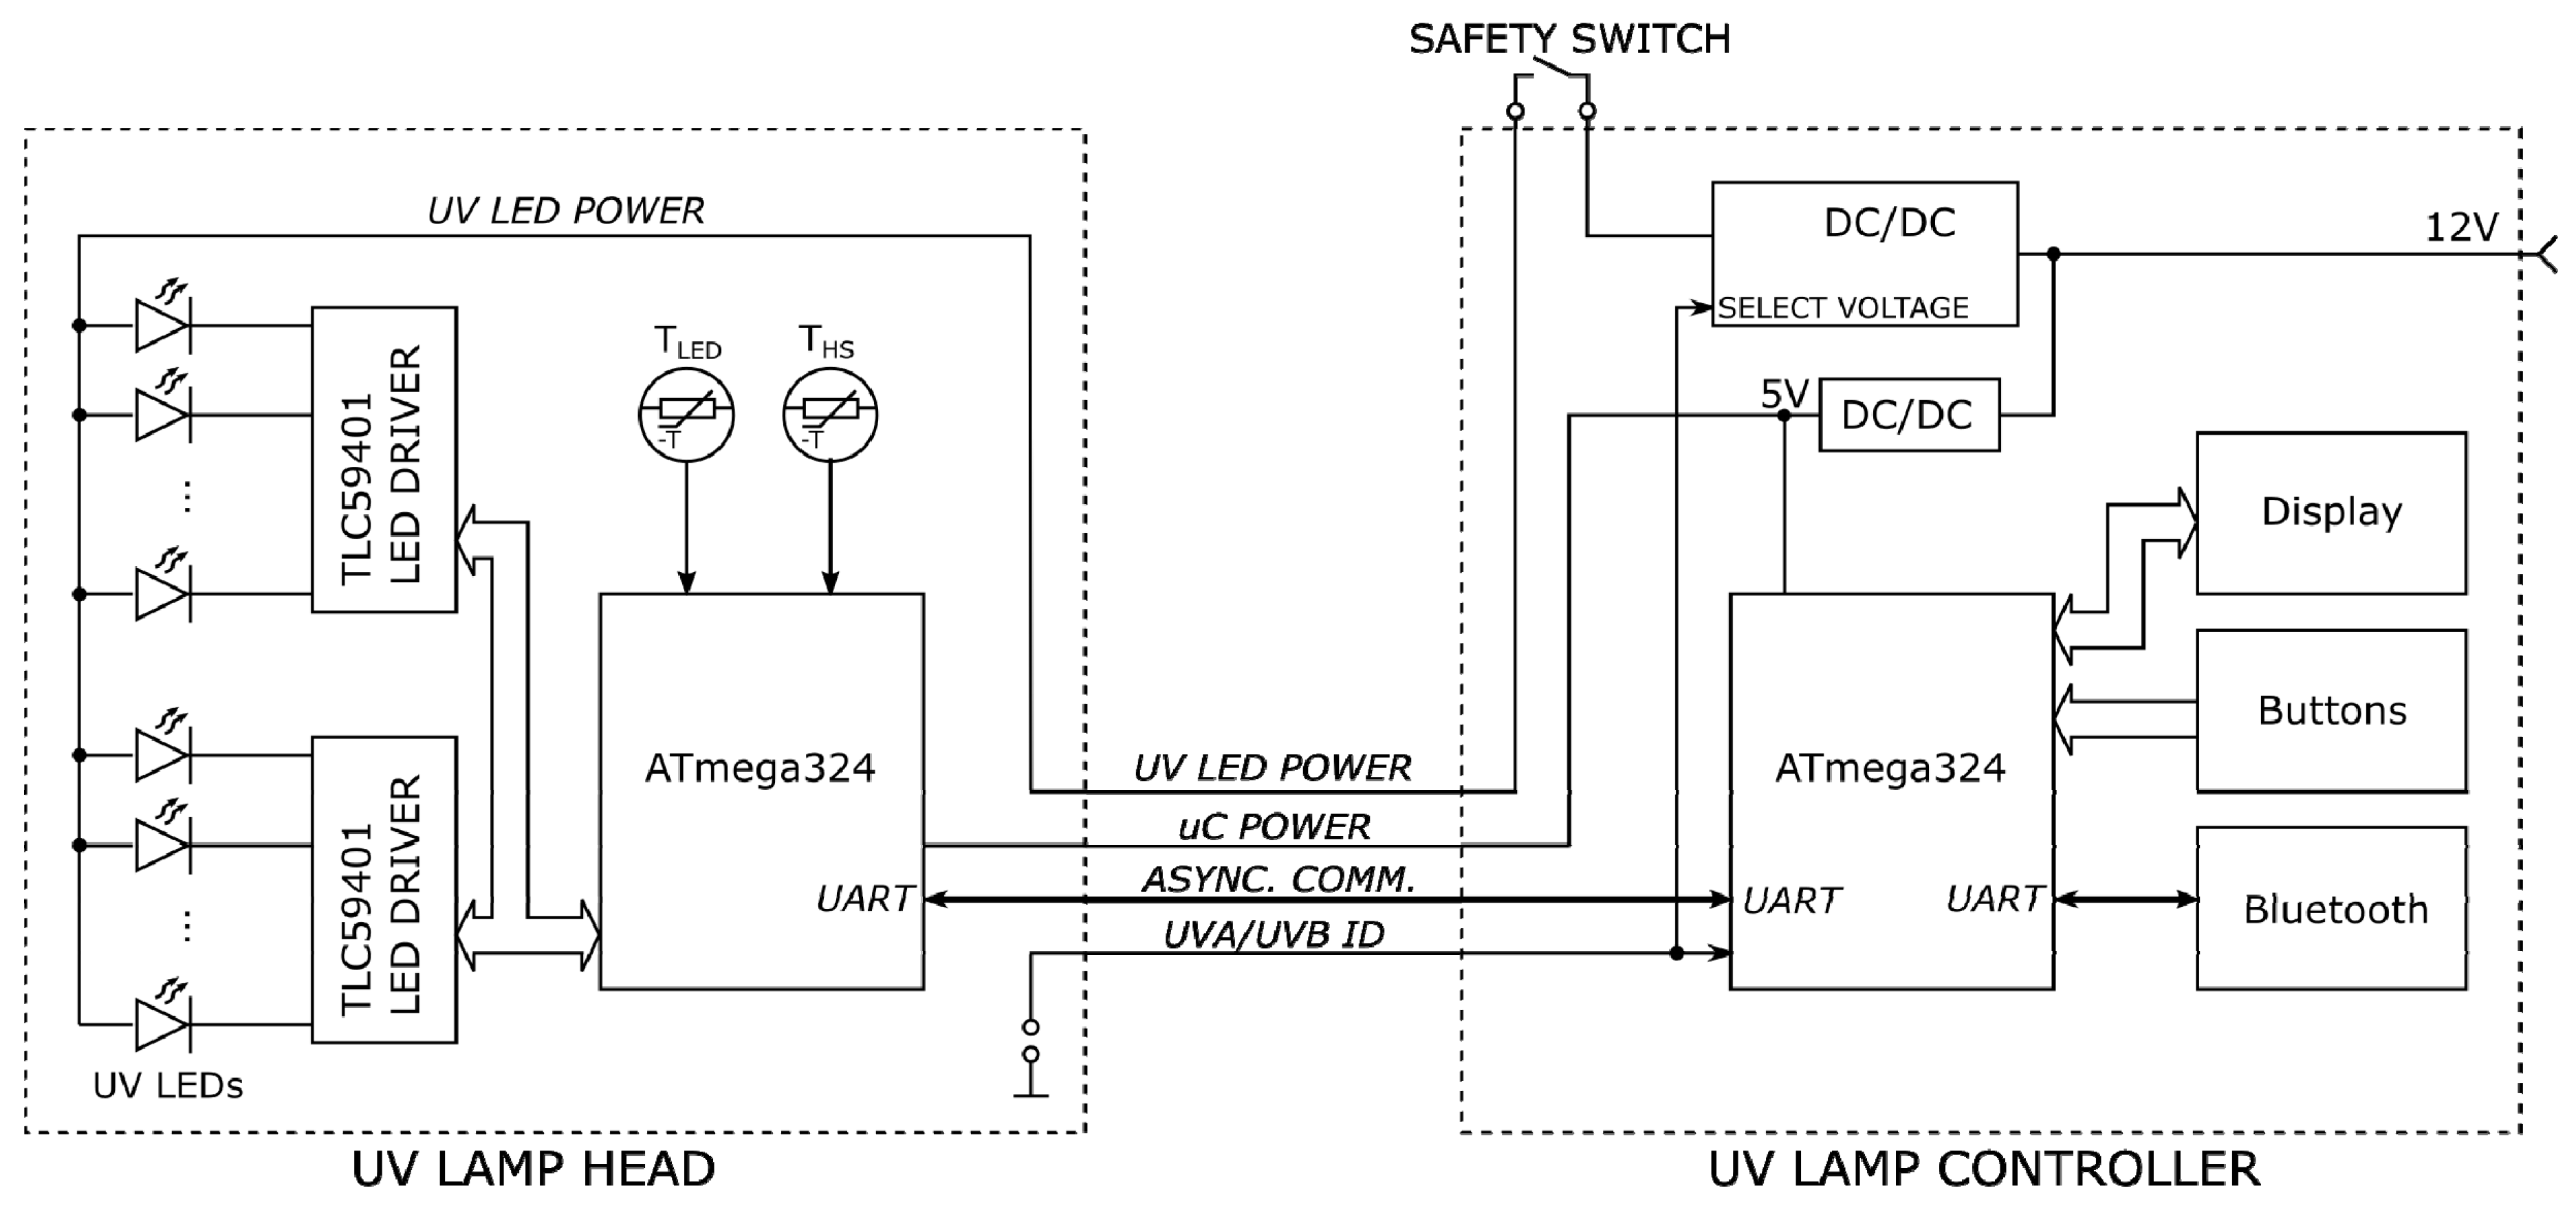
2.2. Electrical Design

Given the optical simulation results summarised in Table 1, it would be theoretically possible to achieve satisfactorily homogenous illumination with five or even only four different LED driving currents. In reality, though, every LED has a different initial efficiency, which means that every LED has to have its own adjustable current source. This challenge was overcome by two TLC59401 (Texas Instruments Inc., Dallas, TX., USA) integrated circuits (IC), which have 16 individually controlled outputs each, whereby each output has 64-step linear current control and an additional 4096 steps using pulse-width modulation (PWM). These ICs were originally designed for driving large-panel LED displays, which suffer from the same problem of varying LED efficiencies.
Since the lamp needs to be controlled from outside of the incubator, the control module was designed as a separate unit connected to the lamp head by a flat cable, which can be easily inserted through a crack in the closed door of an incubator. A block diagram of the lamp is shown in Figure 3, and the complete schematics, along with the source code, are available in the Supplementary Materials.
The lamp head contains a microcontroller ATmega324 (Microchip Technology Inc., Chandler, AZ., USA), which controls the LED driving ICs, monitors temperature, holds calibration data and logs usage time. The TLC59401 LED drivers are connected to the microcontroller via a serial interface which is compatible with the Serial Peripheral Interface (SPI). The TLC59401 ICs employ constant current sink LED drivers with 64-step linear current control and an additional 4096-step PWM brightness control. The PWM function was not used in this case in order to exclude any potential uncertainties in the biomedical research conducted with regard to pulsed UV illumination. The maximum output current per channel is set by an external resistor and is set to 120 mA for the UVA lamp and to 100 mA for the UVB lamp. The TLC59401 ICs also detect open LED events (LED disconnected), or over-temperature events, which are then signalled to the microcontroller.
The on-board microcontroller measures temperature in two places using negative temperature coefficient resistors (NTC): on one of the aluminium LED carrying substrates as close to the LED as possible (TLED in Figure 3), to get an estimation of the LED temperature; and on the heatsink (THS in Figure 3) accessed through a hole in the printed circuit board (PCB), to evaluate the average temperature of the UV lamp head.
The control module provides the required power to the lamp head, allows the lamp to be turned on and off, shows the current status of the lamp, including potential errors, shows the illumination time and radiation dose weighted with the reference action spectrum for erythema in human skin CIE1987 (Commission Internationale de l’Éclairage 1987) [29]. It also includes a safety switch, which is intended to be mounted onto the incubator door, to prevent accidental exposure to UV radiation.
The heart of the control module is an ATmega324 microcontroller which communicates with the lamp head via the universal asynchronous receiver-transmitter (UART). Its function is to receive commands from the keyboard or the Bluetooth module and relay them to the lamp head and to display the status of the lamp to the user. All other functions, like measuring illumination time, calculating the illumination dose, measuring usage time, etc., are performed by the lamp head. This makes the control modules of different lamps interchangeable.
UVA and UVB LEDs require different voltages to operate. It is important that the voltage drop on the TLC59401 ICs is as low as possible, because it translates directly into excess heat. To keep this voltage drop as low as possible, the voltage provided for the LEDs by the lamp controller has to be tailored for each of the two lamps. This is achieved by changing the output voltage feedback divider ratio of the switching power supply for the LEDs. The feedback divider ratio is controlled by the UVA/UVB ID line which is either closed to ground (UVB) or left floating (UVA) within the lamp head. A short circuit was selected for the UVB lamp so that in case of bad connection or similar error, the lower voltage, which cannot damage either lamp head, will be generated. Before the LED voltage is provided to the lamp head, it is fed through the safety switch, which has to be mounted onto the incubator door, to prevent accidental exposure to UV illumination.
Since the LED power supply voltage is tailored for each of the two types of UV LEDs, the power supply voltage for all other components is provided by a separate 5 V switching power supply. The whole system is powered from an external 12 V power supply.
The control module on its own only allows the lamp to be turned on and off and displays basic status information. All other functionality, like setting the container transparency factor, time countdown, dose countdown, temperatures check, and usage statistics, requires a Bluetooth connection. The Bluetooth connection is facilitated by a Bluetooth module with a Serial Port Profile (SPP) connected to the microcontroller via a UART. An android application for control of the lamps over a Bluetooth connection is provided online in the Supplementary Materials.

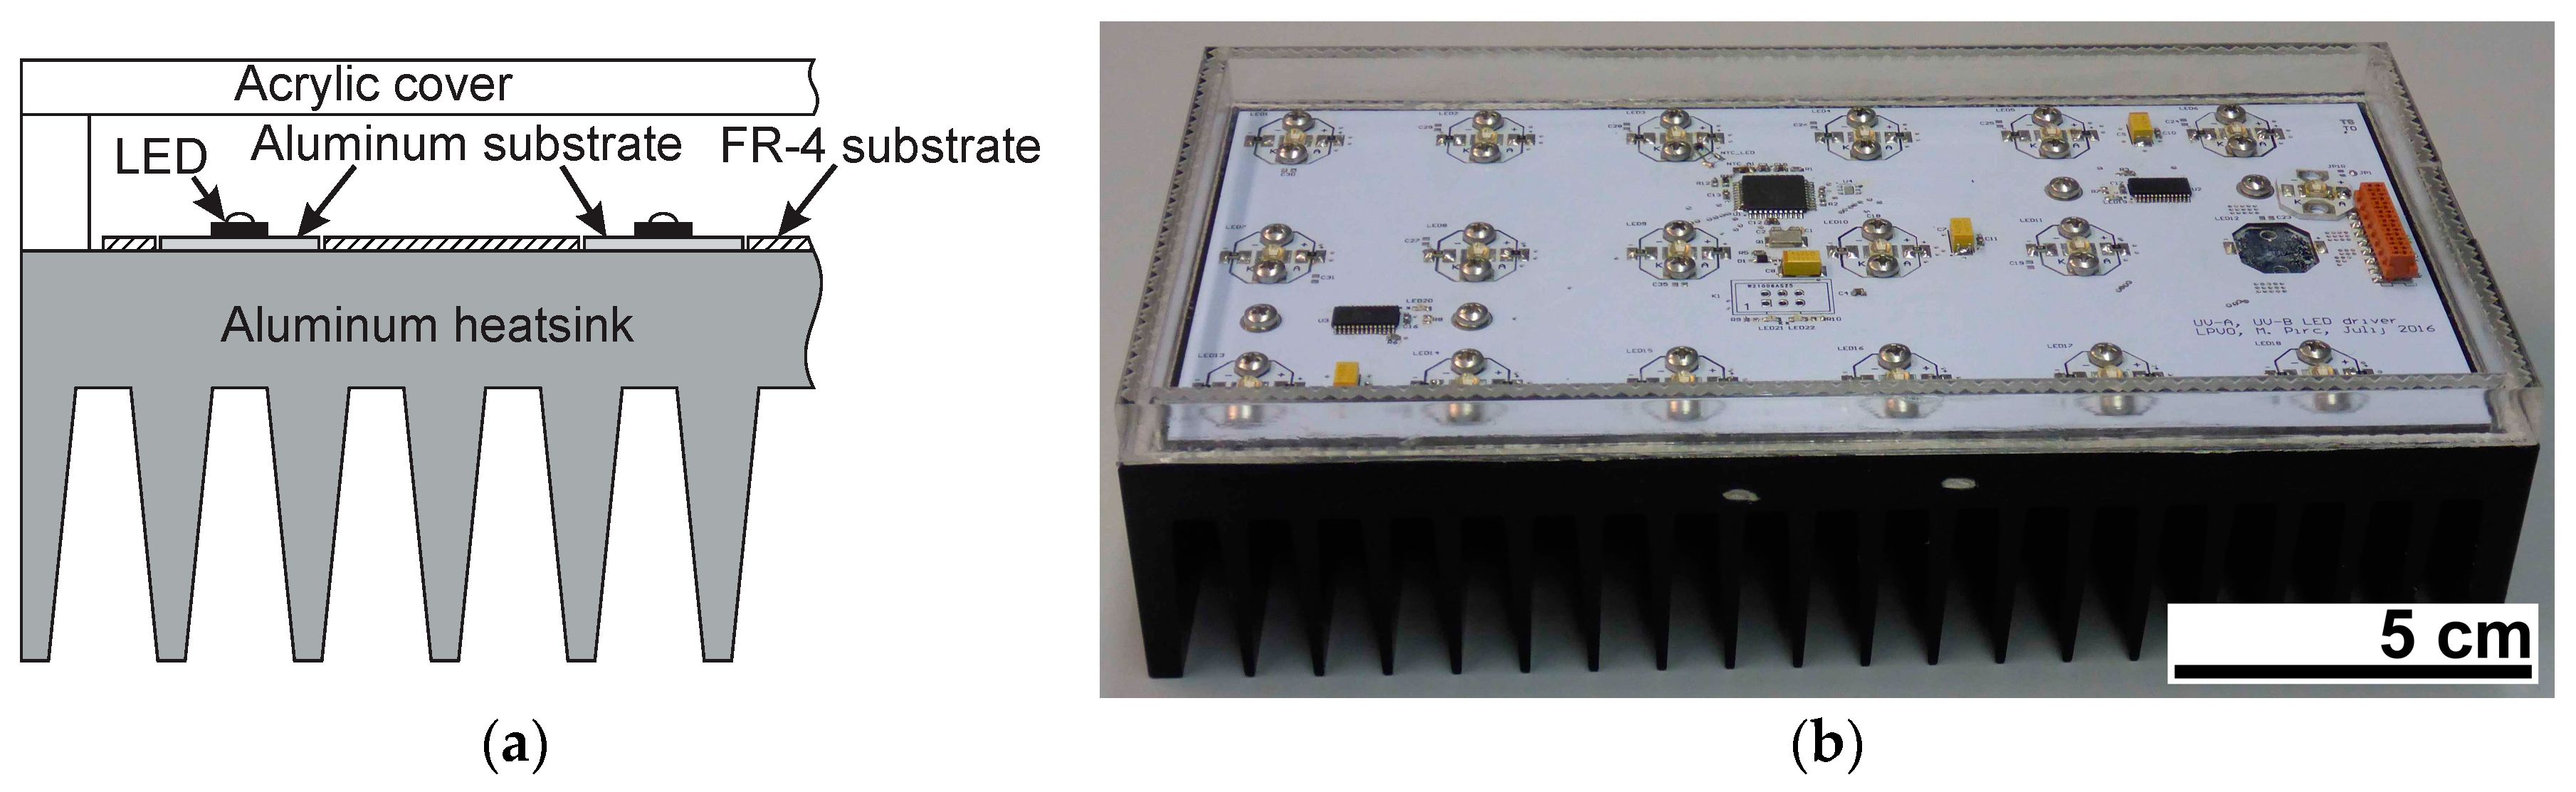
2.3. Mechanical Design

One of the important considerations in biological research is the temperature of the sample and its immediate environment. Although LEDs are efficient power to light converters, they still emit heat. However, in contrast to other light sources, LEDs are more efficient at lower temperatures and can be effectively cooled through the structure they are mounted on.
To maximise cooling efficiency, each LED was mounted on an aluminium substrate, which was in turn mounted onto a large aluminium heatsink which doubles as the body of the enclosure. The LED driver circuit with a microcontroller was manufactured on a standard fibre glass (FR-4) PCB substrate and mounted onto the same aluminium heatsink. The driver circuit PCB has cut-outs for the LED carrying aluminium substrates. Electrical connection between each of the aluminium substrate PCBs and the main PCB was achieved with 0 Ω resistors. The cover of the lamp is made from a UV-transparent acrylic sheet ACRISUNPLUS made by Plastidite S.p.A. (Trieste, Italy), otherwise used in solariums as protective covering for UV lights. A cross-section of the UV lamp and a photograph of the lamp are shown in Figure 4.

3. Materials and Methods

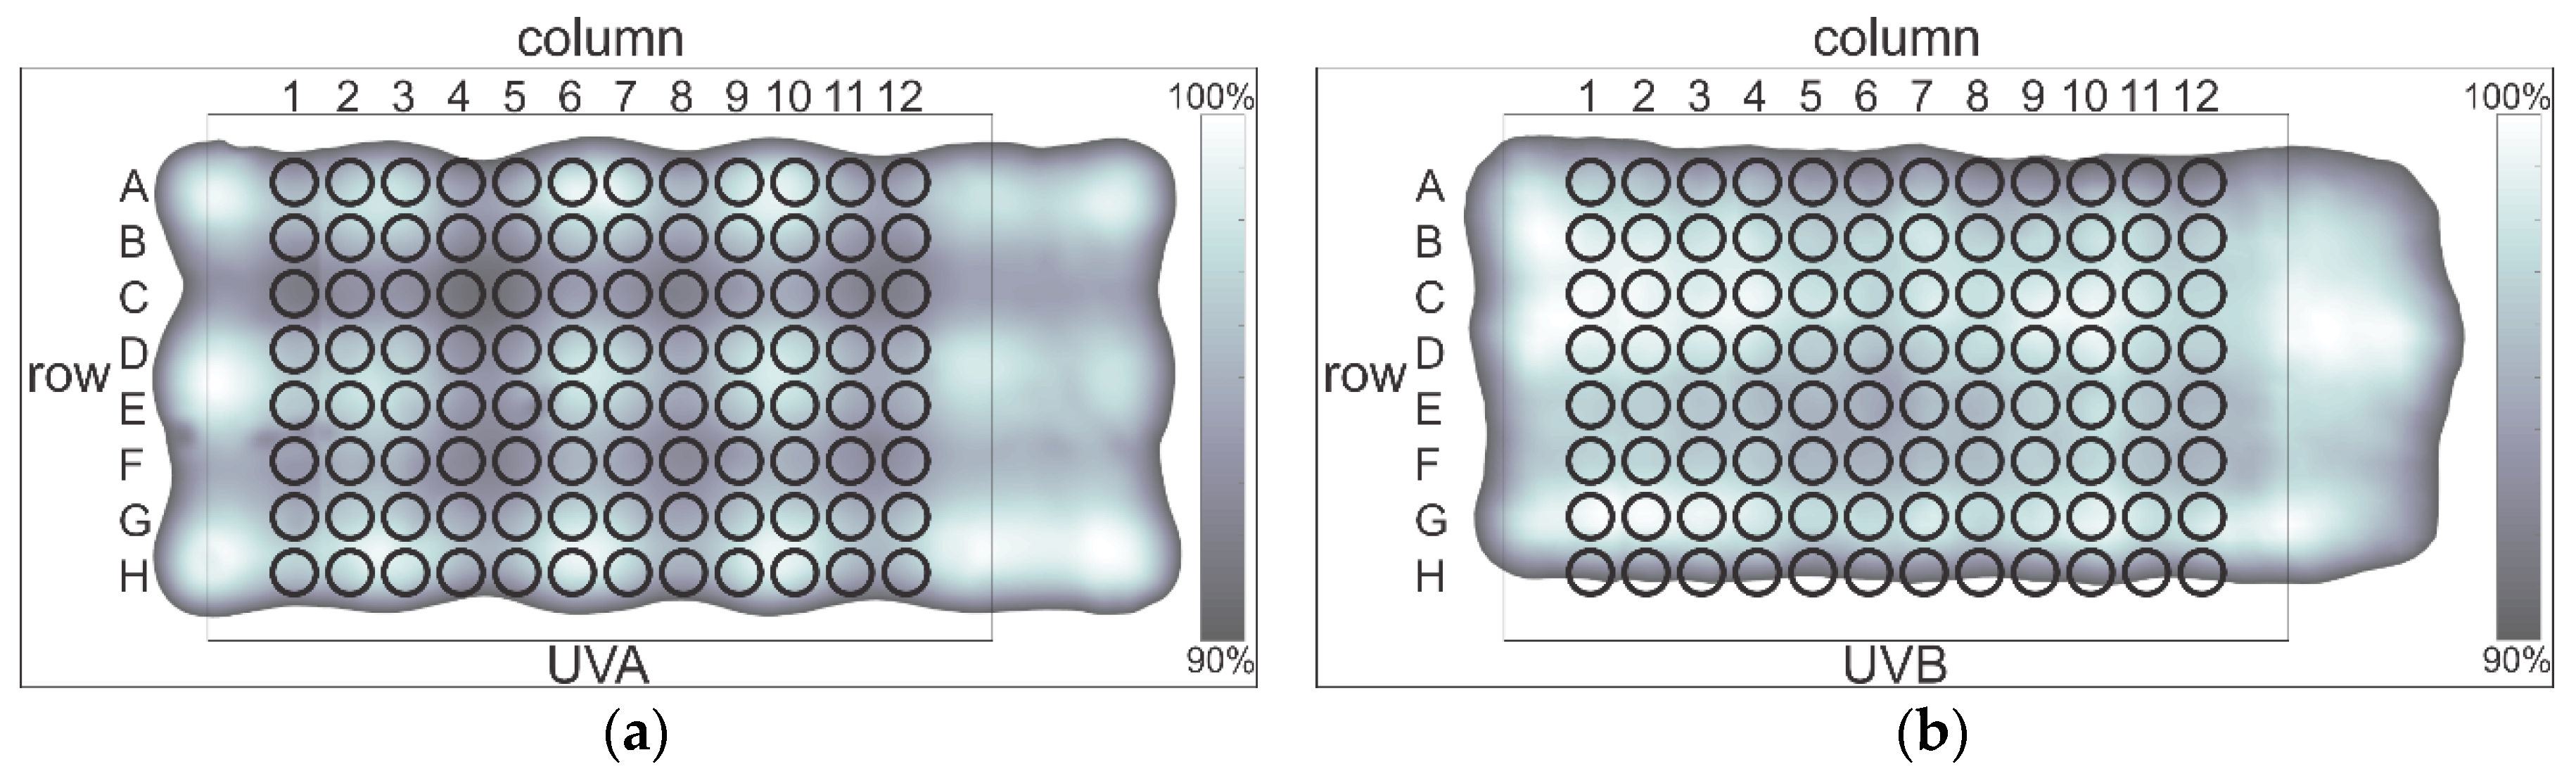
3.1. Irradiance and Homogeneity

Spatial irradiance at a specified distance from the UV lamps was measured using a calibrated S1133-01 photodiode (Hamamatsu Photonics K.K., Hamamatsu, Japan) with a photosensitive area of 2.8 mm × 2.4 mm and a Keithley 238 Source-Measure unit (Keithley Instruments Inc., Solon, OH., USA). Homogeneity was determined by scanning the entire area of both UV lamps in 2 mm intervals at a constant distance of 18 mm above the cover of the lamp, which corresponds to a distance of 30 mm above the LEDs. All the measurements were performed inside a black enclosure to prevent any stray light from interfering with the measurements.

3.2. Spectrum and Transparency

The illumination spectrum of the UV lamps was measured using an HR2000+ spectrometer (Ocean Optics Inc., Tampa, FL., USA) and CC-3-UV-S cosine corrector (Ocean Optics Inc., Tampa, FL., USA). Spectrometer calibration was performed with an LS-1-CAL-220 calibration light source (Ocean Optics Inc., Tampa, FL., USA). However, the output of the calibration light source at wavelengths below 400 nm is too low to provide acceptable calibration accuracy. Therefore, only relative spectrum measurements were performed, and the results were normalised to the maximum averaged value for each lamp. Spectrum measurements were carried out just above the transparent cover of the UV lamps, which is 12 mm above the LEDs. The transparency of the microtiter plates and acrylic glass cover was measured with a Lambda 950 spectrophotometer (Perkin Elmer Inc., Waltham, MA., USA).

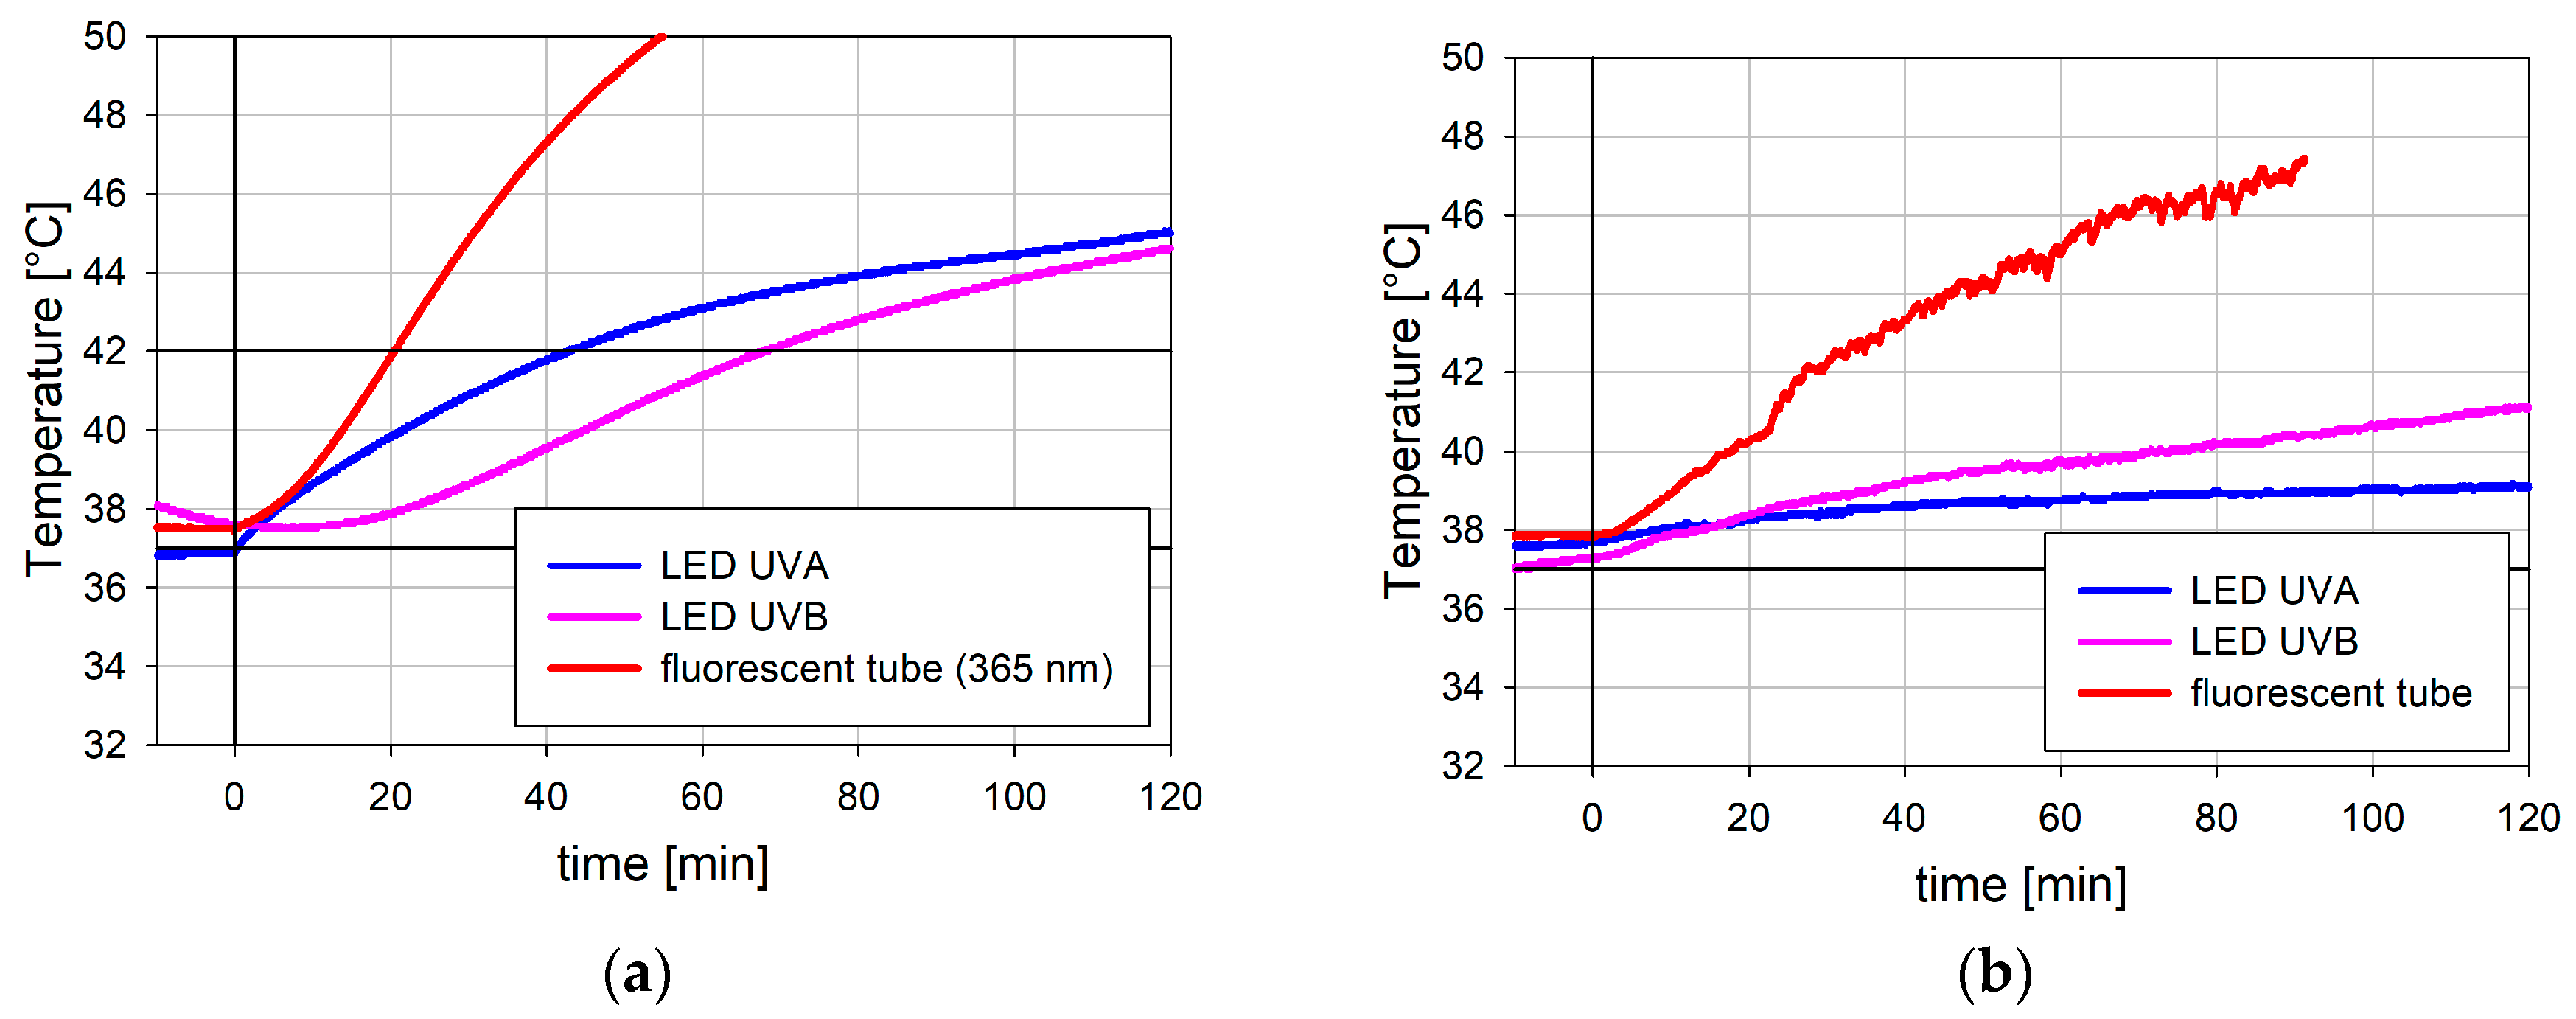
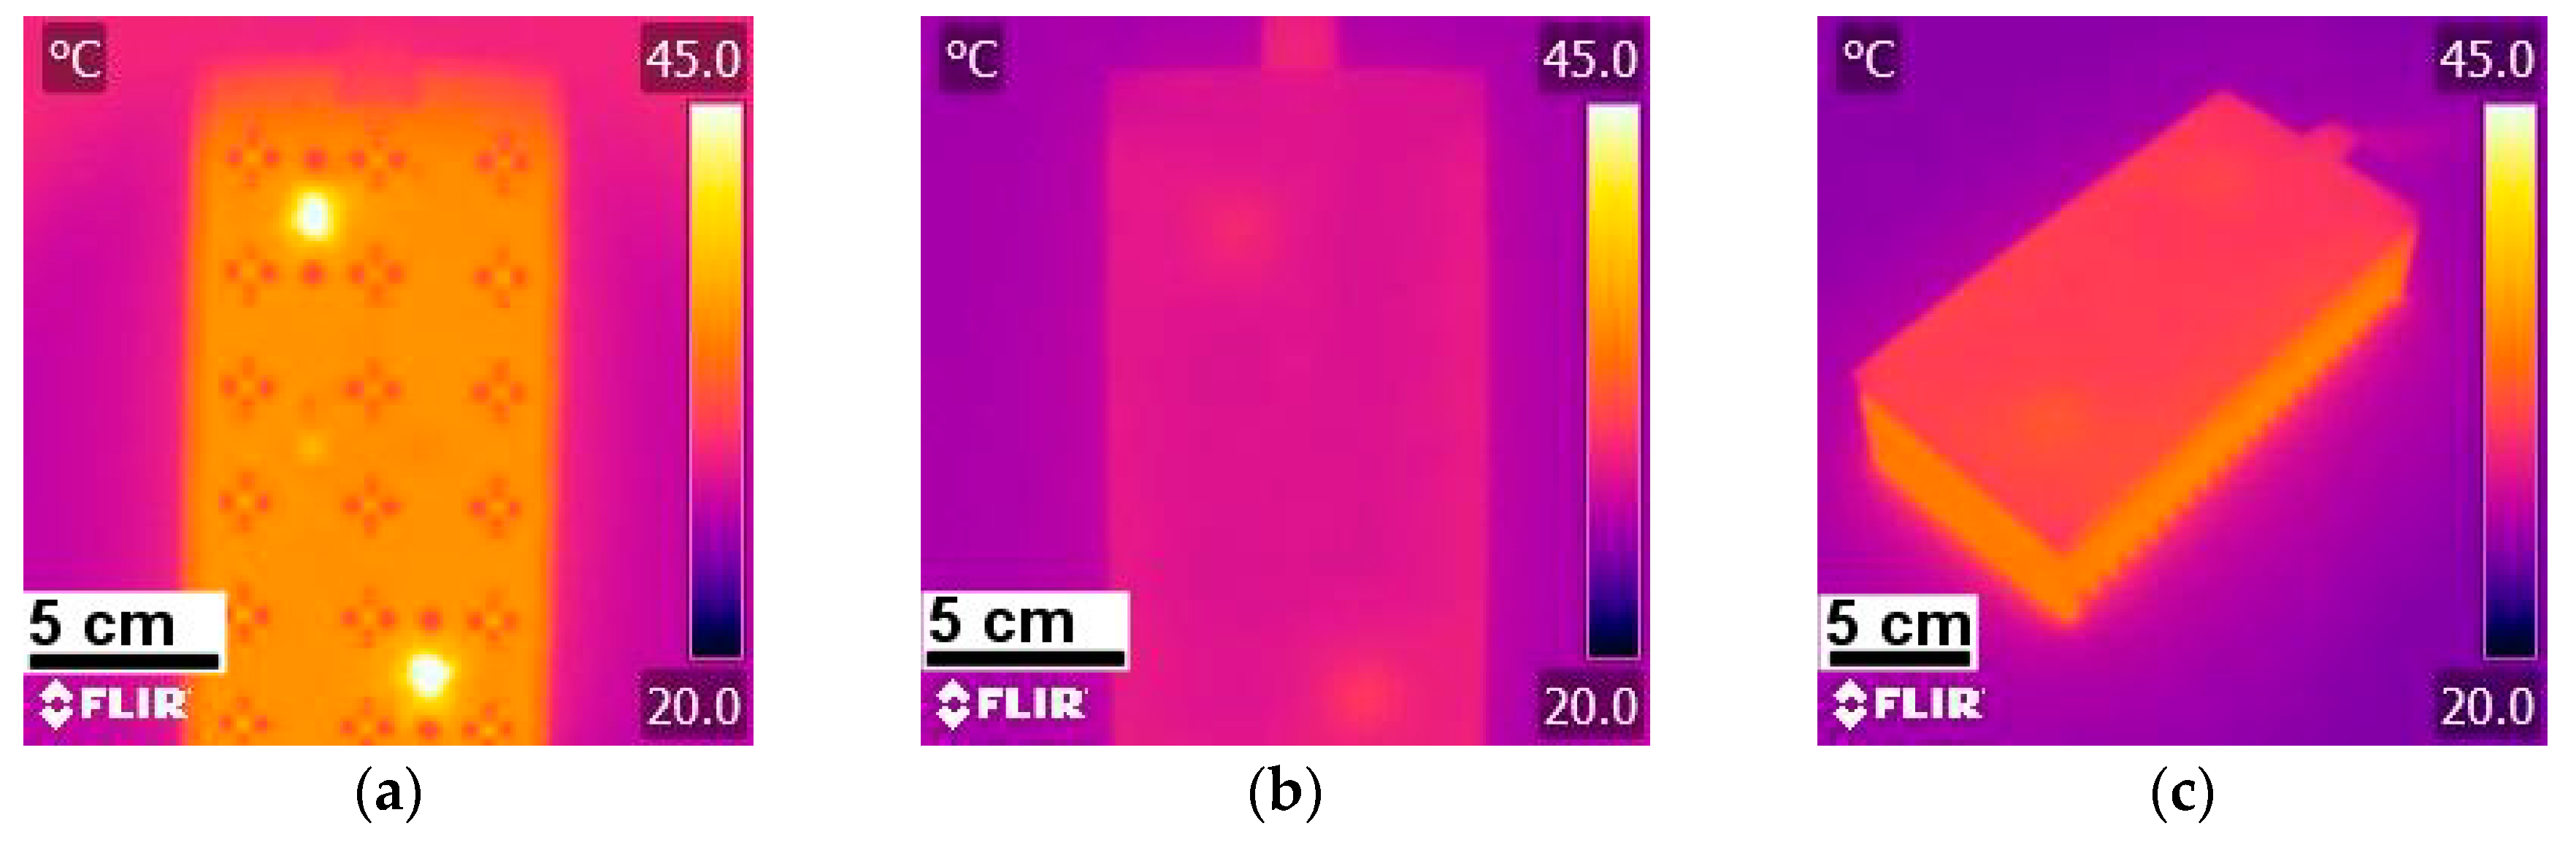
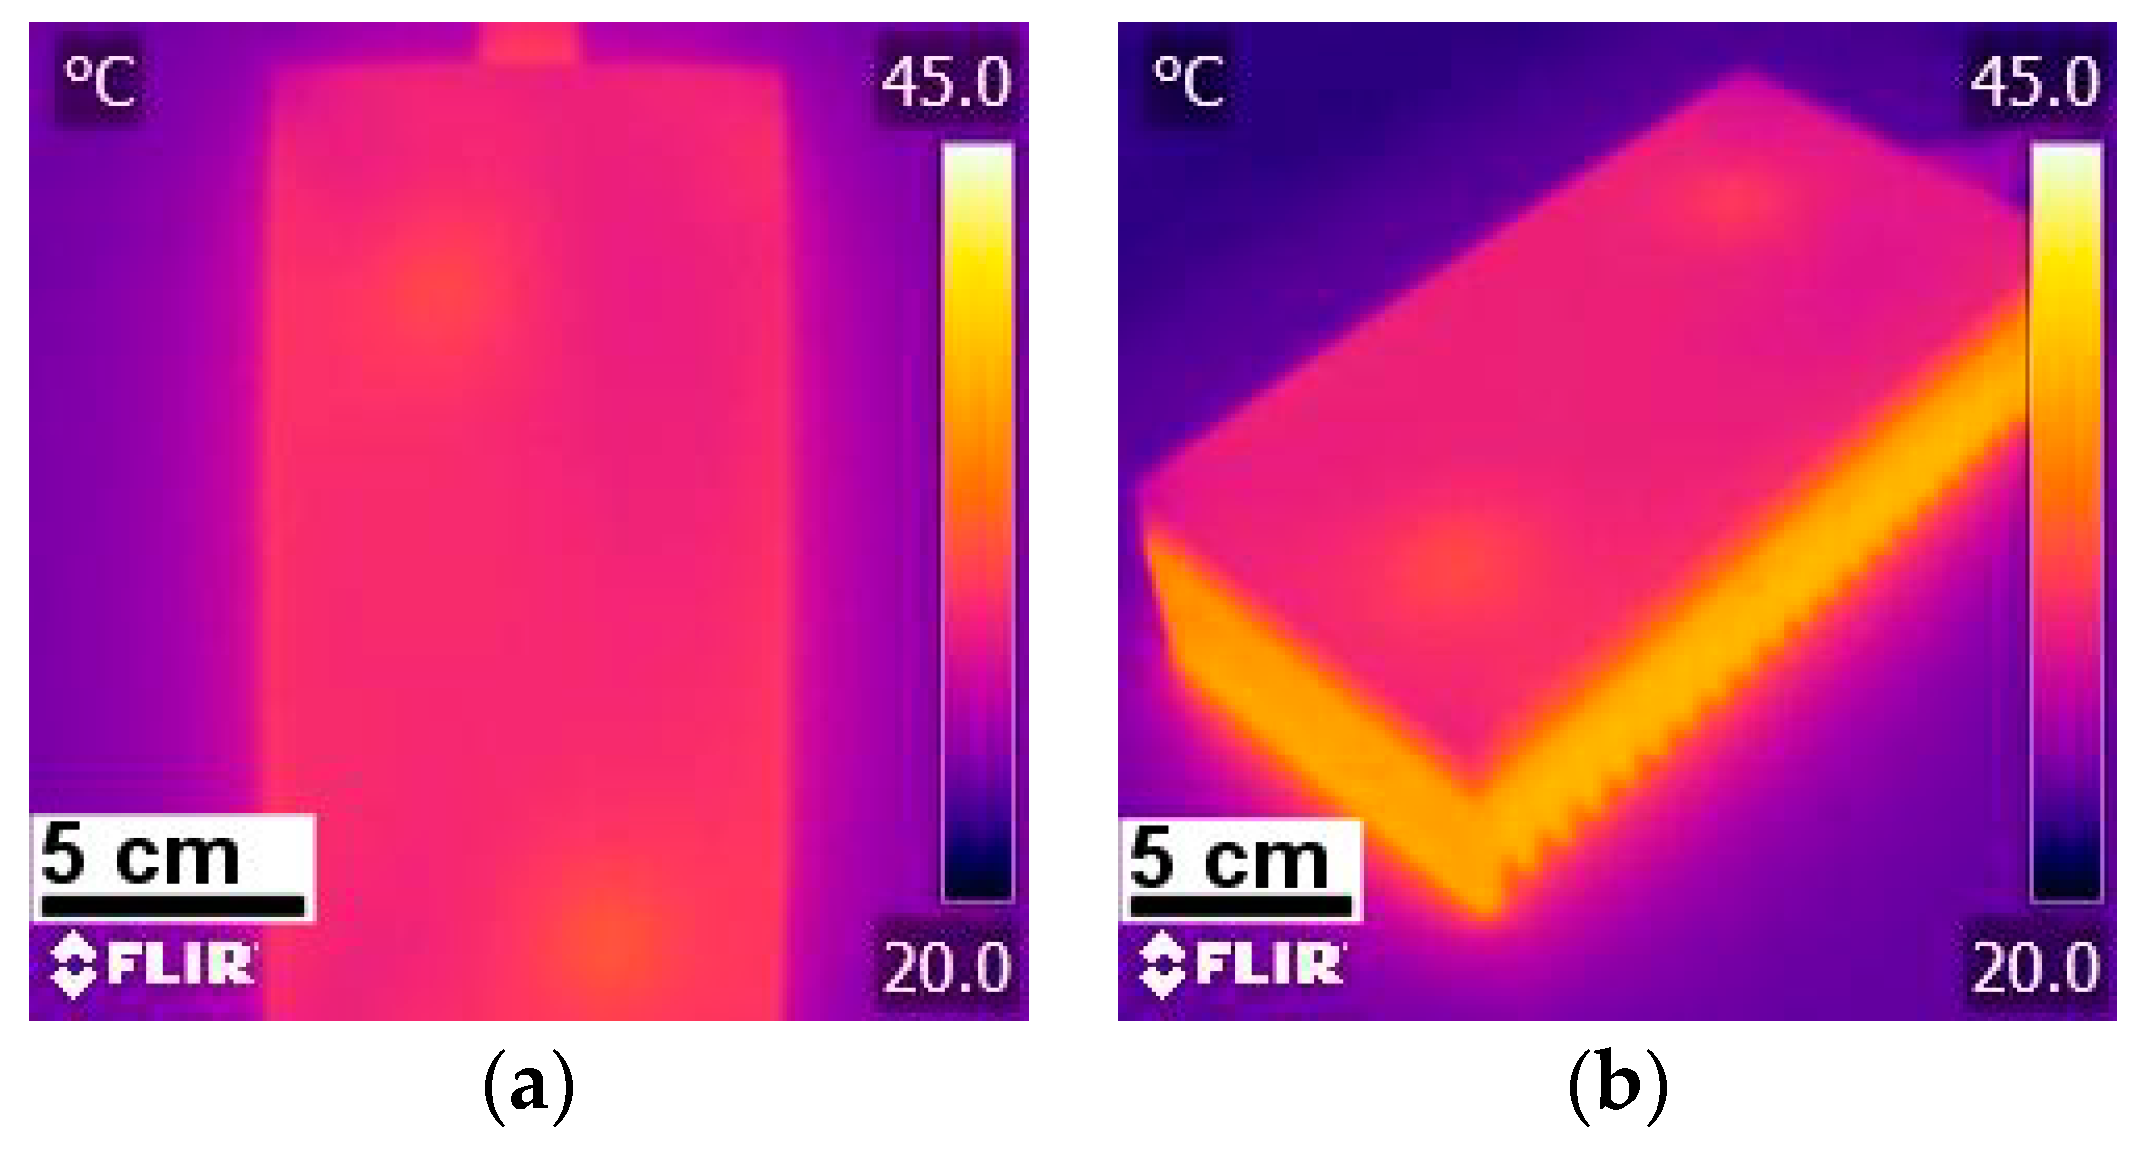
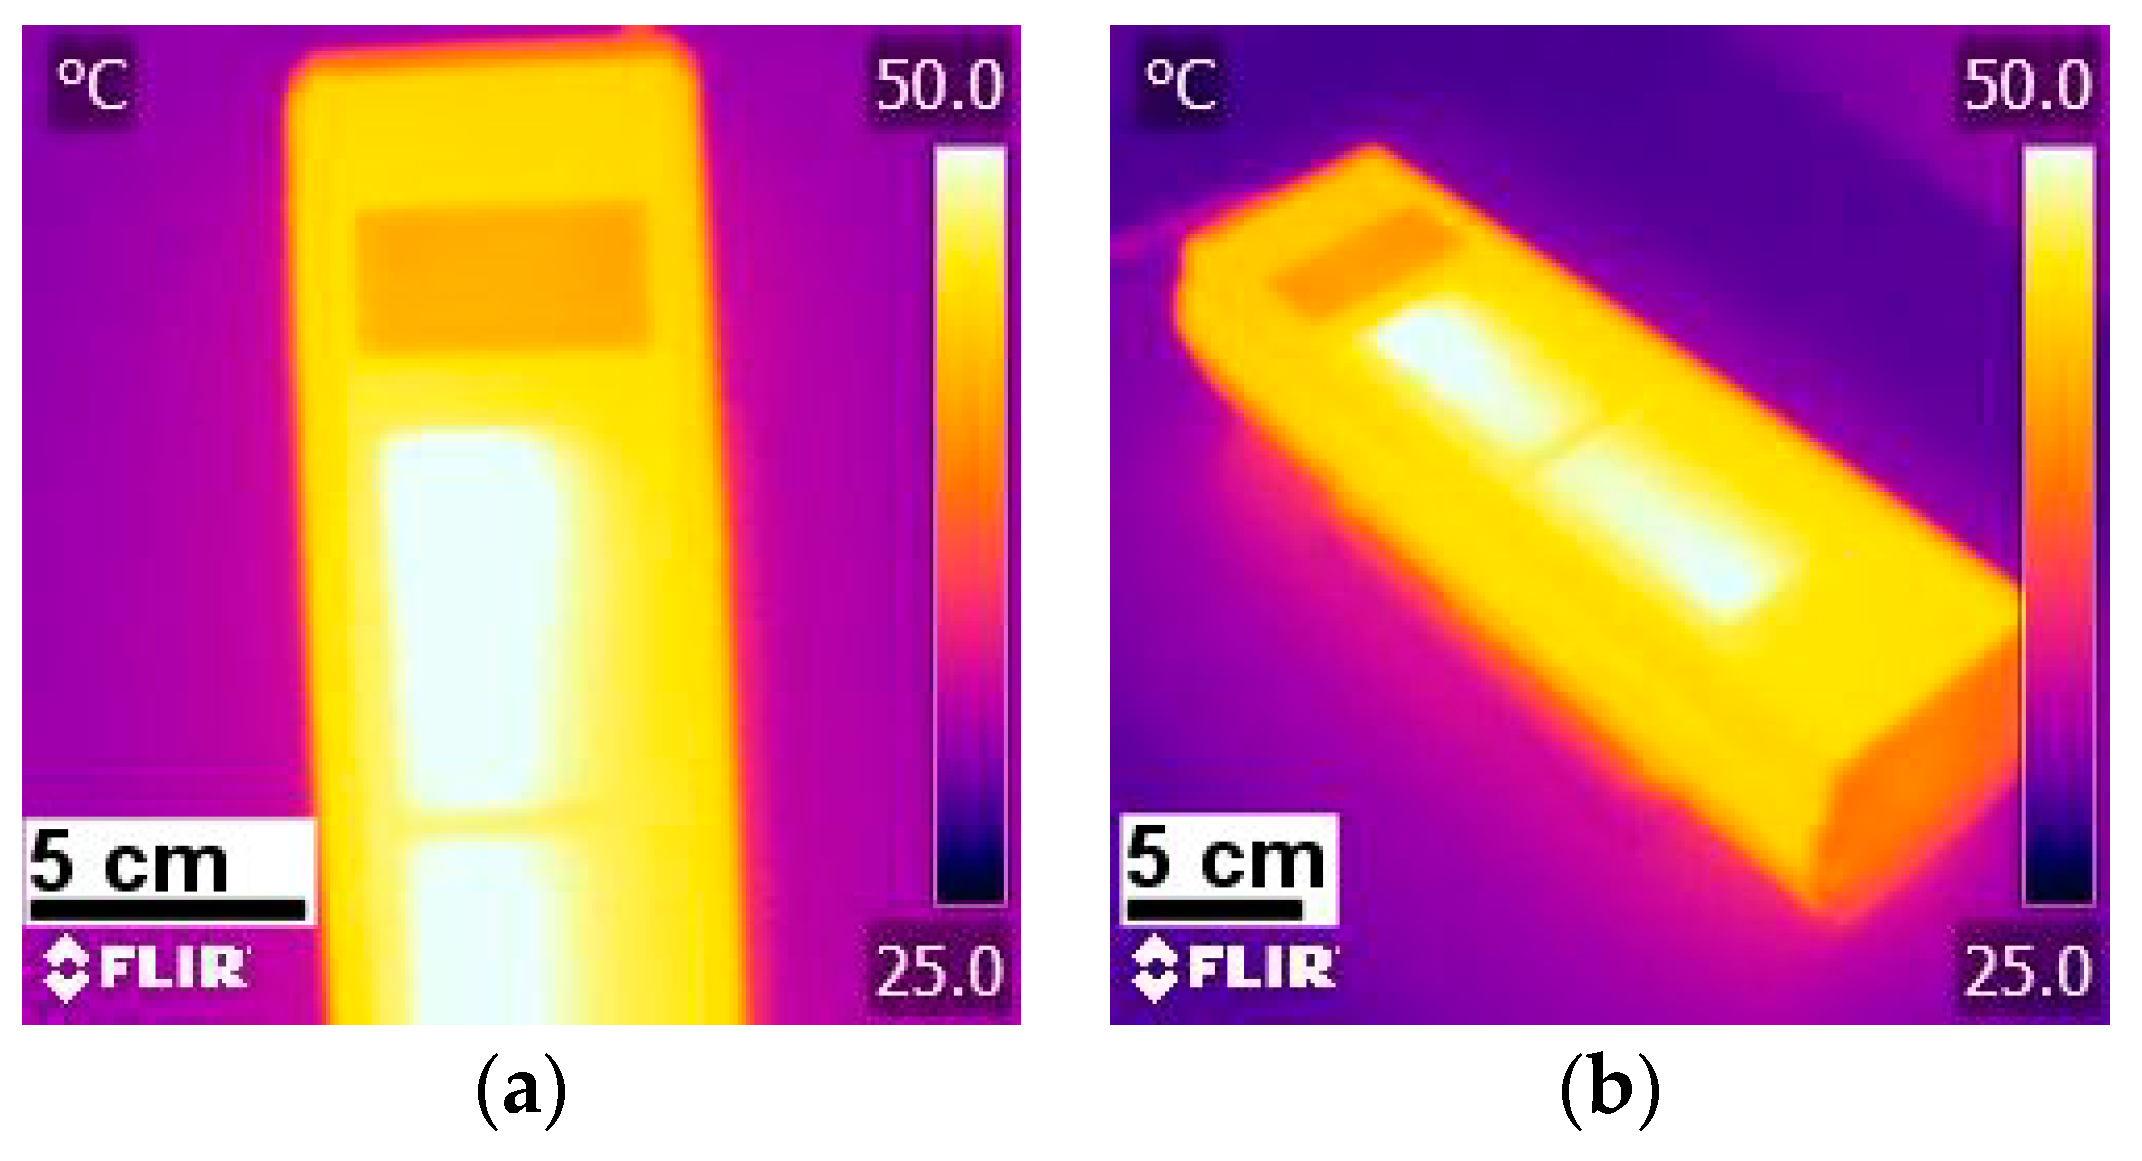
3.3. Heat Dissipation

The effects of excess heat dissipation were measured in a WTC binder Type 36210180003100 incubator (BINDER GmbH, Tuttlingen, Germany) with 6 DS18B20 digital temperature sensors (Maxim Integrated Products Inc., San Jose, CA., USA), which were placed inside the wells of a 96-well microtiter plate. All the wells were filled with 100 μL of a basic cell culture medium. Four out of six sensors were dyed white in order to reduce any possible temperature effects due to light absorption. Two sensors remained black for comparison. One black and one white sensor were placed in neighbouring wells in the middle of the microtiter plate, one white sensor was placed on the edge, and two white sensors were placed into opposite corners of the microtiter plate. The remaining black sensor was positioned approximately 5 cm away from the lamp to measure the ambient temperature. The microtiter plate was placed on top of the lamp at the appropriate height above the lamp. The incubator was set to maintain a temperature of 37 °C.
The measurements showed only small discrepancies between different sensor positions, and confirmed that the wells in the centre of the microtiter plate, which are the most insulated from the ambient temperature, are the most critical with regard to unwanted temperature increases. Therefore, only the measurements of the centre well are reported. The difference between the black sensors and the ones that were dyed white was also negligible.
Further investigation of heat dissipation was performed with a FLIR i7 infrared (IR) camera (FLIR Systems Inc., Wilsonville, OR., USA). A lamp was covered with a black painted cardboard box with a hole on top for the camera. Pictures were taken after 60 min of operation. Pictures from angles other than from the top were taken just after the lamp had been turned off to avoid exposure to the UV radiation. The emissivity factor was set to 0.95, which is a reasonable value for most matte surfaces. Further calibration was not performed, therefore the IR images cannot be used for accurate temperature reading, while they do provide a good understanding of temperature changes.

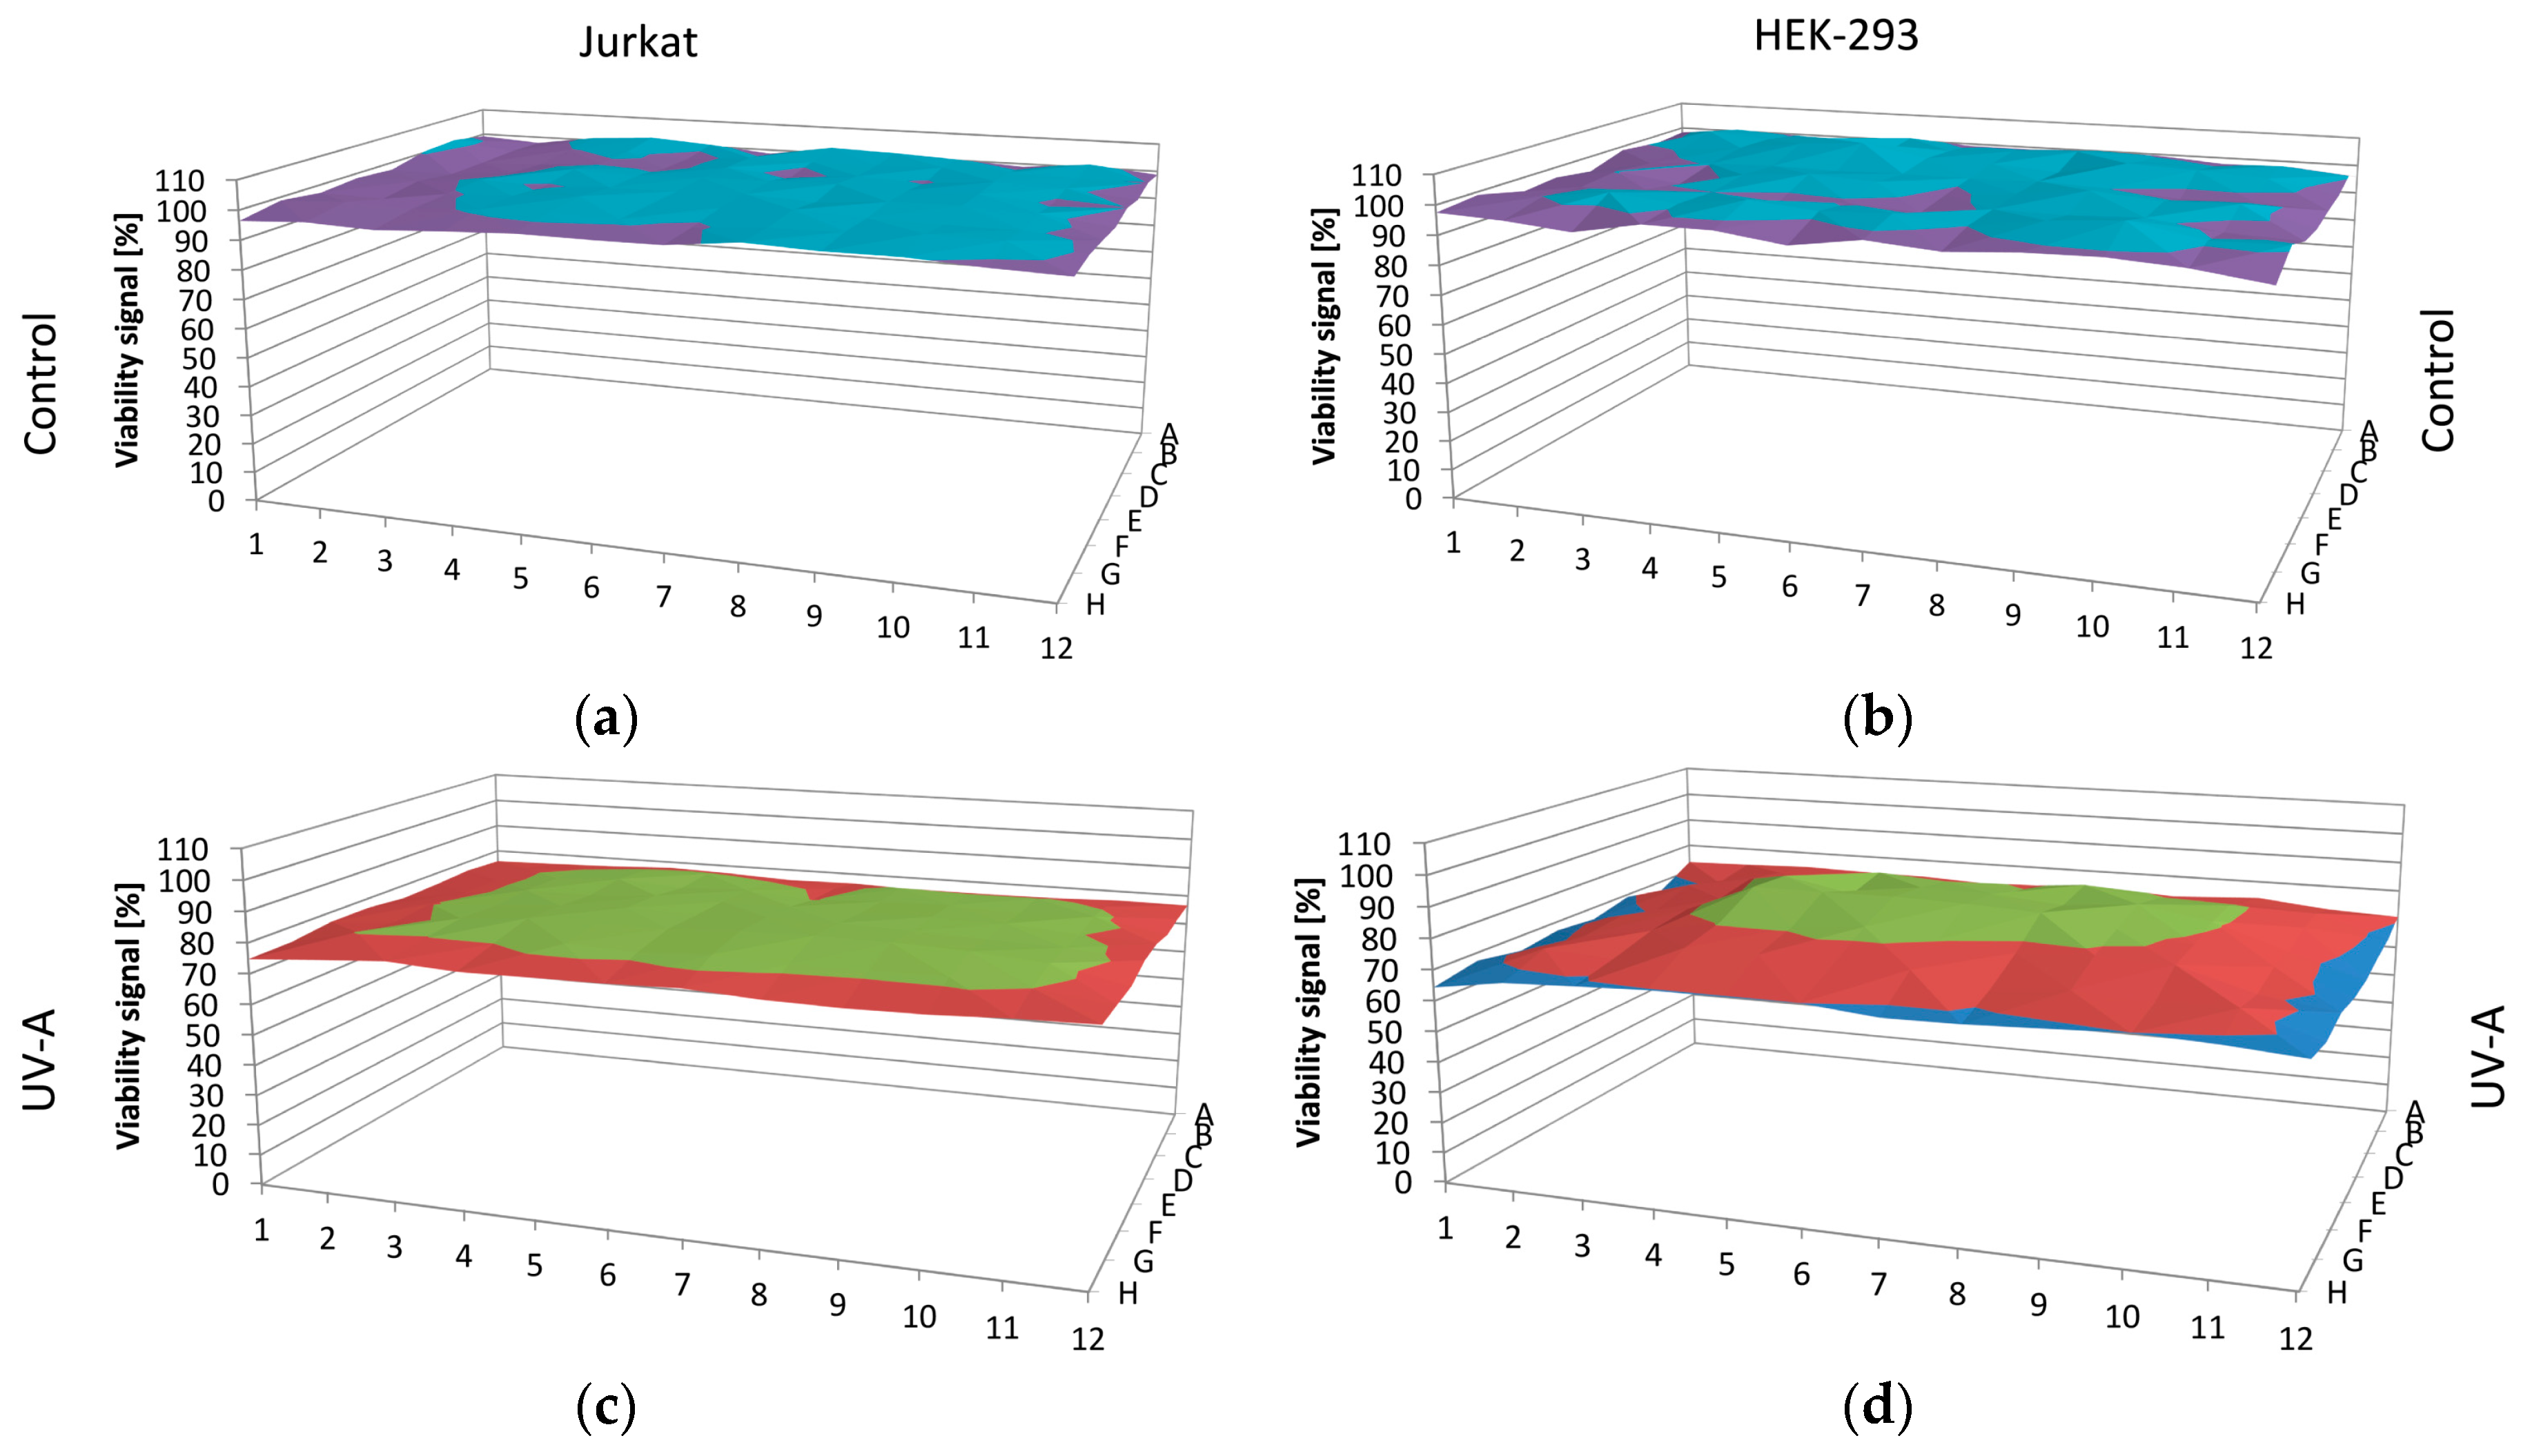
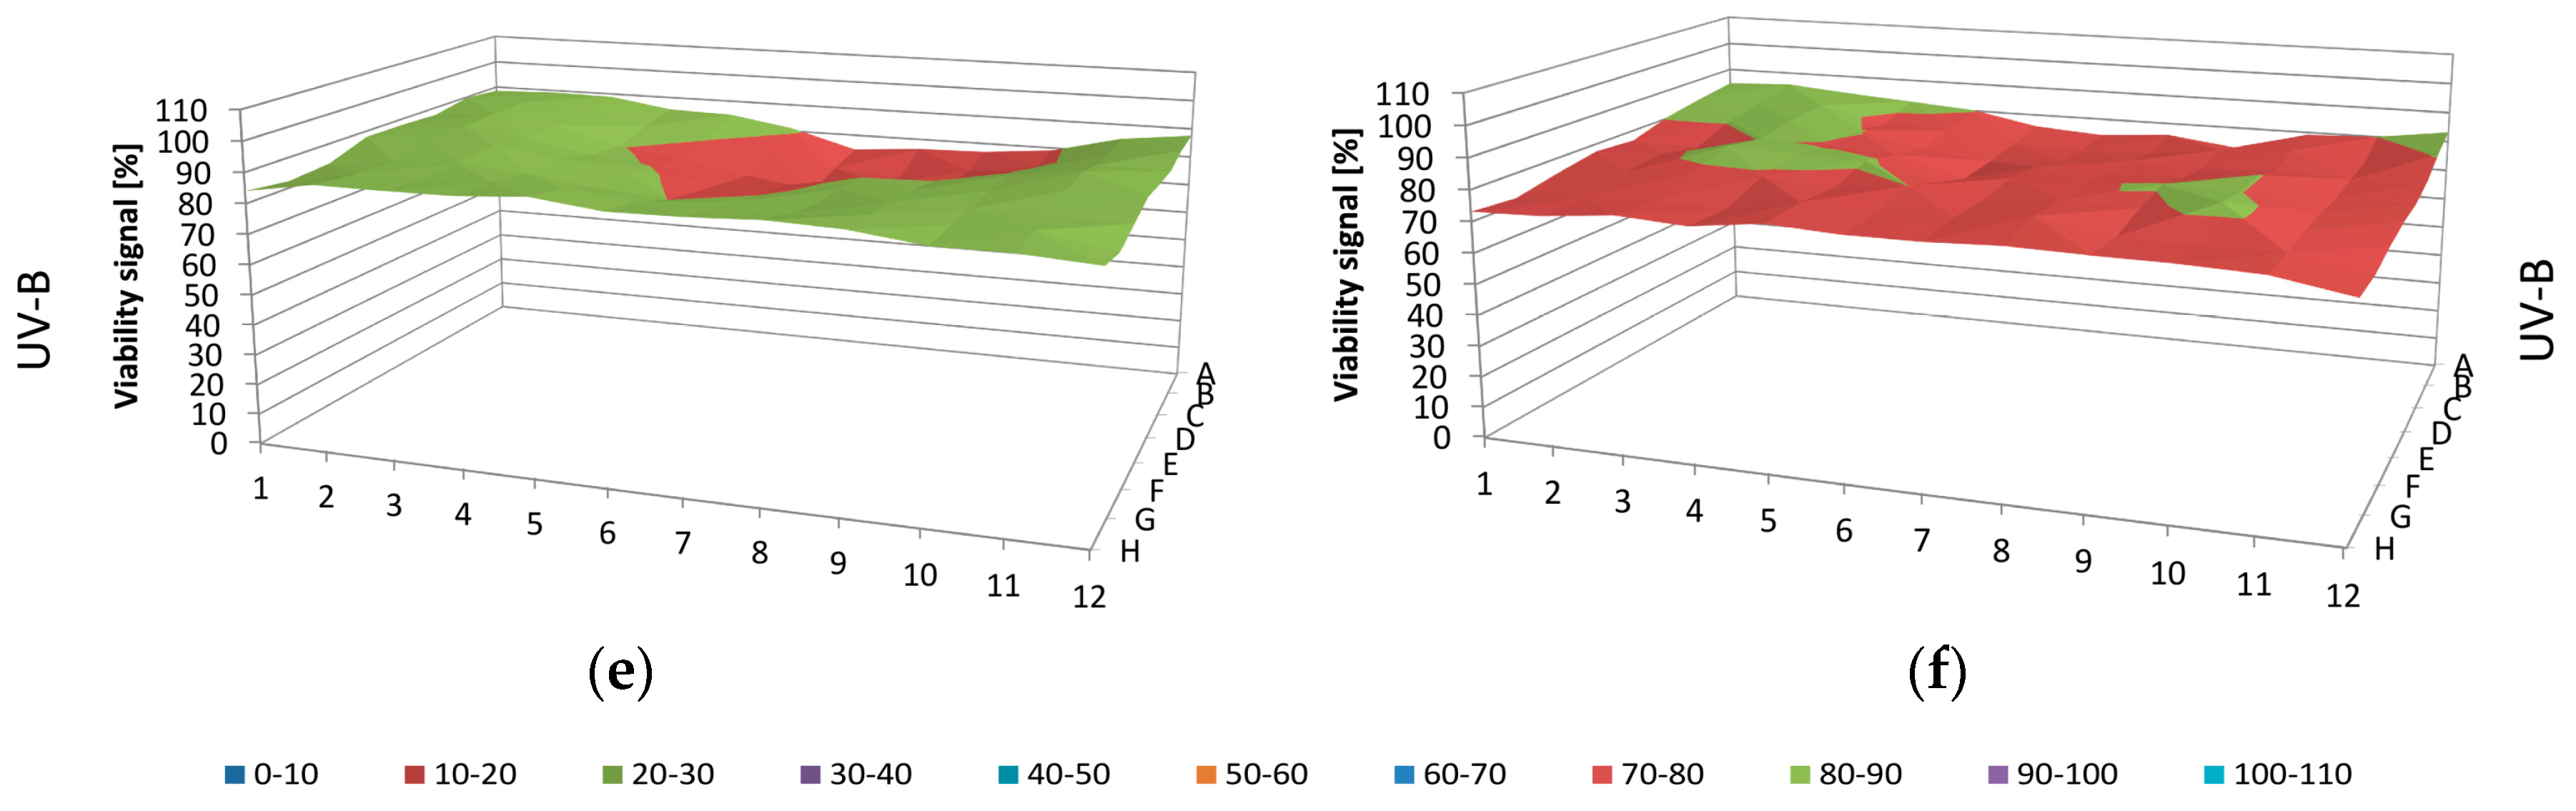
3.4. Cell Culture Tests

Jurkat cells (E6.1) were obtained from the European Collection of Authenticated Cell Cultures (ECACC). The cells were cultured as a suspension in cell culture flasks in a RPMI 1640 medium supplemented with 10% (v:v) of heat-inactivated foetal bovine serum (HIFBS) at 37 °C and a 5% CO2 atmosphere in a high humidity incubator. The medium was replaced every second or third day. Cells were sub cultured through dilution in a fresh medium.
HEK-293 cells (CRL-1593) were obtained from American Type Culture Collection (ATCC). Cells were cultured adherent in cell culture flasks in a DMEM medium, supplemented with 10% (v:v) of HIFBS and 1% (v:v) of L-glutamine to a final 2 mM concentration. The medium was replaced every second or third day. Cells were sub cultured when reaching about 90% confluency using a trypsin-EDTA solution.
For viability testing, the cells were seeded on 96-well microtiter plates in 200 µL of growth medium a day before exposure to the UV irradiation to enable cell adaptation and adhesion in adherent HEK-293 cells. The Jurkat and HEK-293 cells were seeded at a density of 150,000 cells/mL and 100,000 cells/mL, respectively, in all wells. In microtiter plates, border wells are often omitted from experiments due to border related effects. To minimise water evaporation from edge wells and related effects on cell fitness, the microtiter plates were kept on wet paper in vented plastic containers within the high humidity incubator. To ensure equal positioning of the microtiter plates in subsequent experiments, the plate holder was fixed on top of the UV light illumination panel. Plates were irradiated with UVA (365 nm) or UVB (308 nm). The overall exposure time to UVA was 966 s, which, taking into consideration the 73.84% transparency of the microtiter well at a wavelength of 365 nm, resulted in a dose of 50000 J/m2, while for UVB, the exposure time was 666 s, which in conjunction with the 48.46% transparency at a wavelength of 308 nm, resulted in a dose of 1000 J/m2. The irradiation was performed in a dust free cabinet in the bottom-up direction. By doing so, the optical effect of medium surface was excluded. As the cells were adherent or sedimented to the bottom during irradiation, the possible medium-related absorption was neglected. The time out of the incubator during irradiation was equal for all tested and control plates. After irradiation, the cells were incubated for 21 h to develop apoptotic response and then a PrestoBlue® Cell Viability Reagent (Thermo Fisher Scientific Inc., Waltham, MA., USA) was added to them. A fluorescent signal proportional to the number of viable cells was measured after 3 h with a plate reader. Means and standard deviations of identically positioned wells from three independent experiments were calculated.

4. Results and Discussion

All presented measurement results and simulations are available in an online dataset [30].

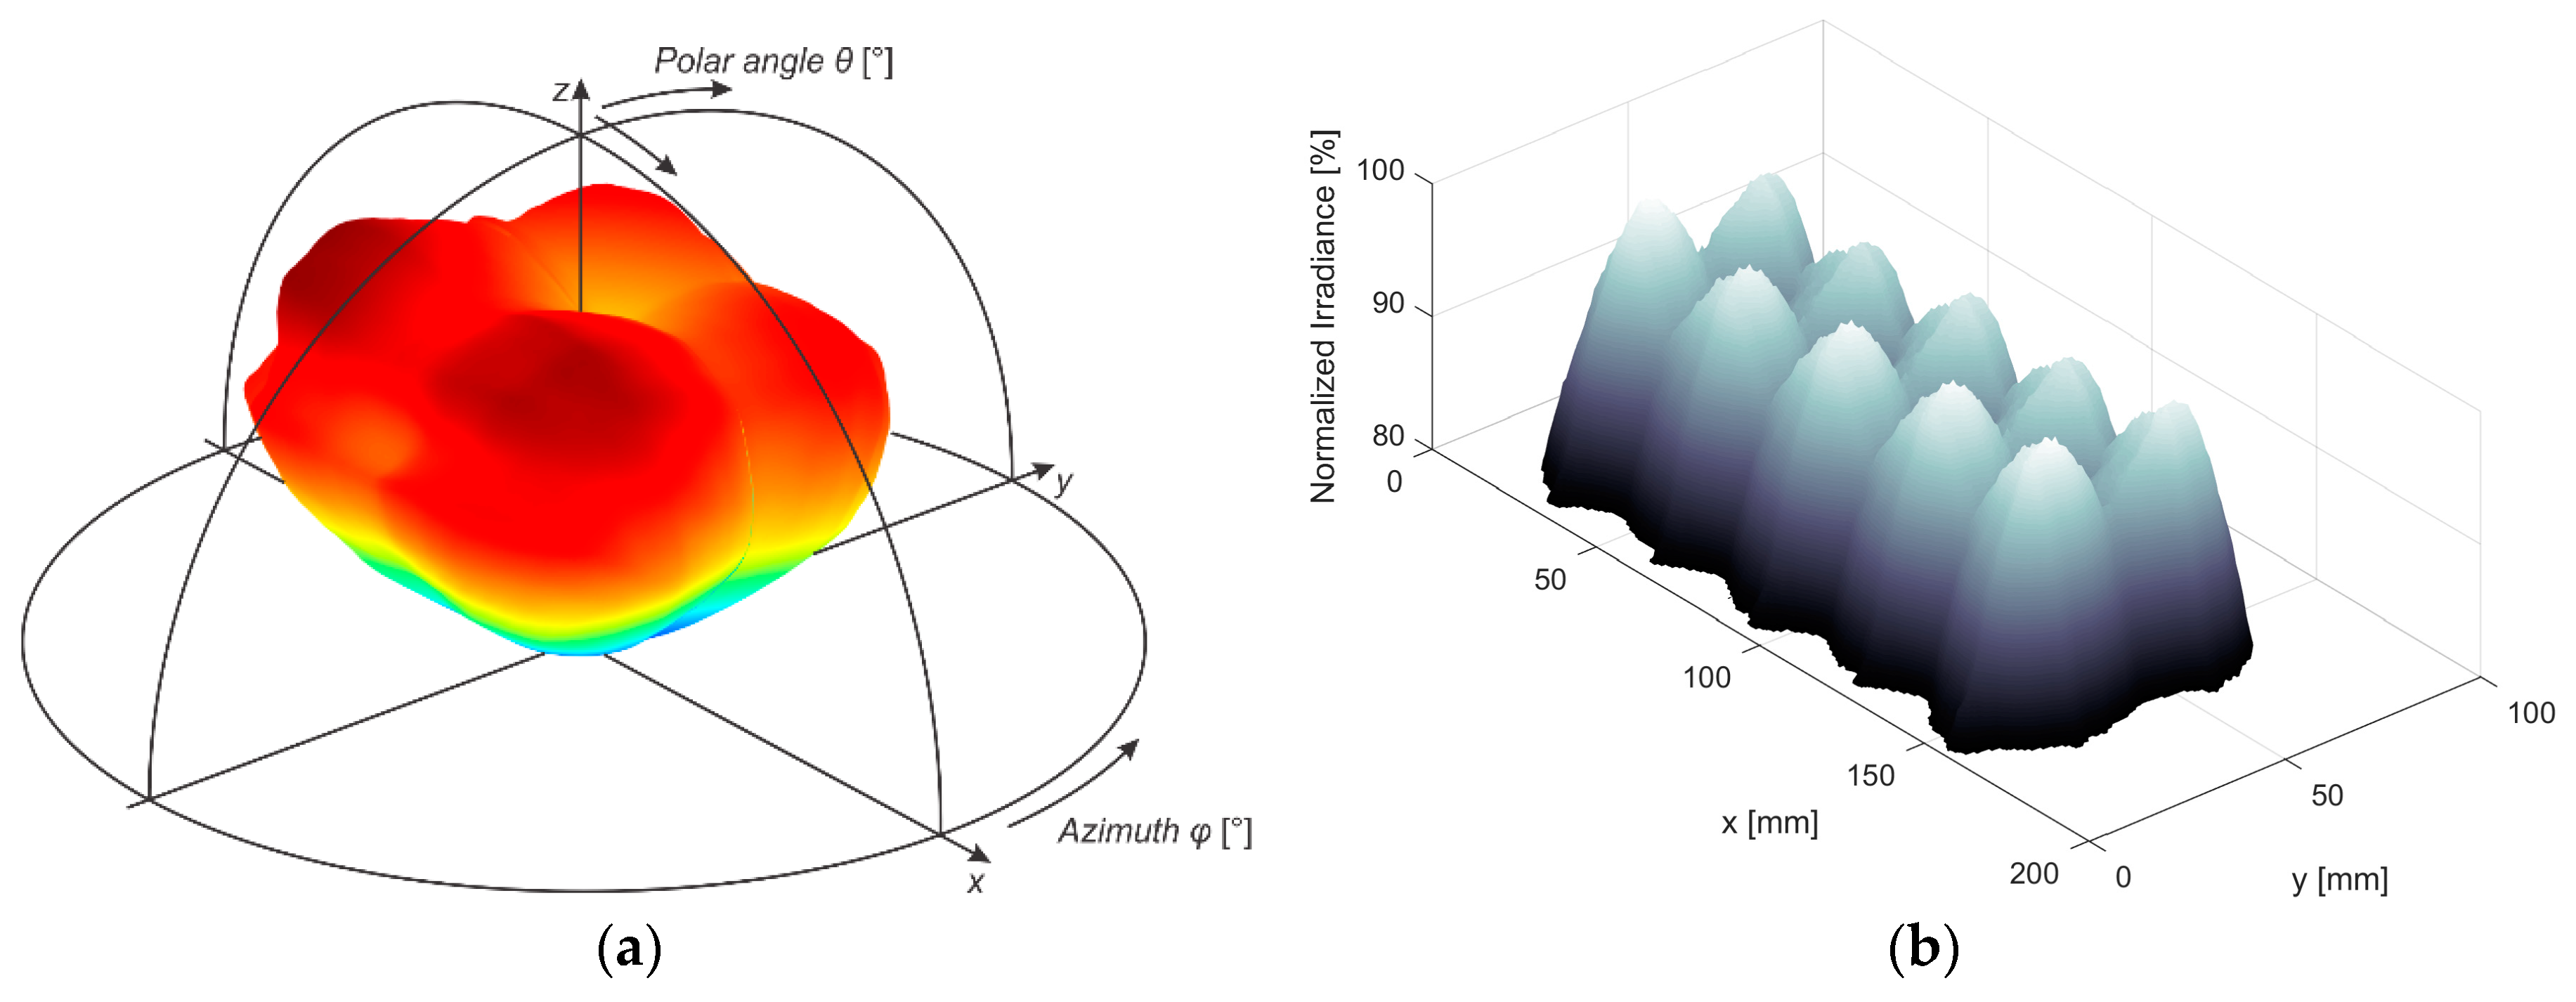
4.1. Simulation Results

Simulated normalised irradiance of the optimised configuration for the UVA lamp is shown in Figure 5. This configuration yields a usable illumination area of 148 mm × 66 mm (marked with the black line), which is slightly less than the initially desired area. However, the smaller illumination area is acceptable, given the cost saving. The inhomogeneity within the usable area is ±3%—slightly better than the initial requirement, which gives a bit of leeway for the real world implementation.

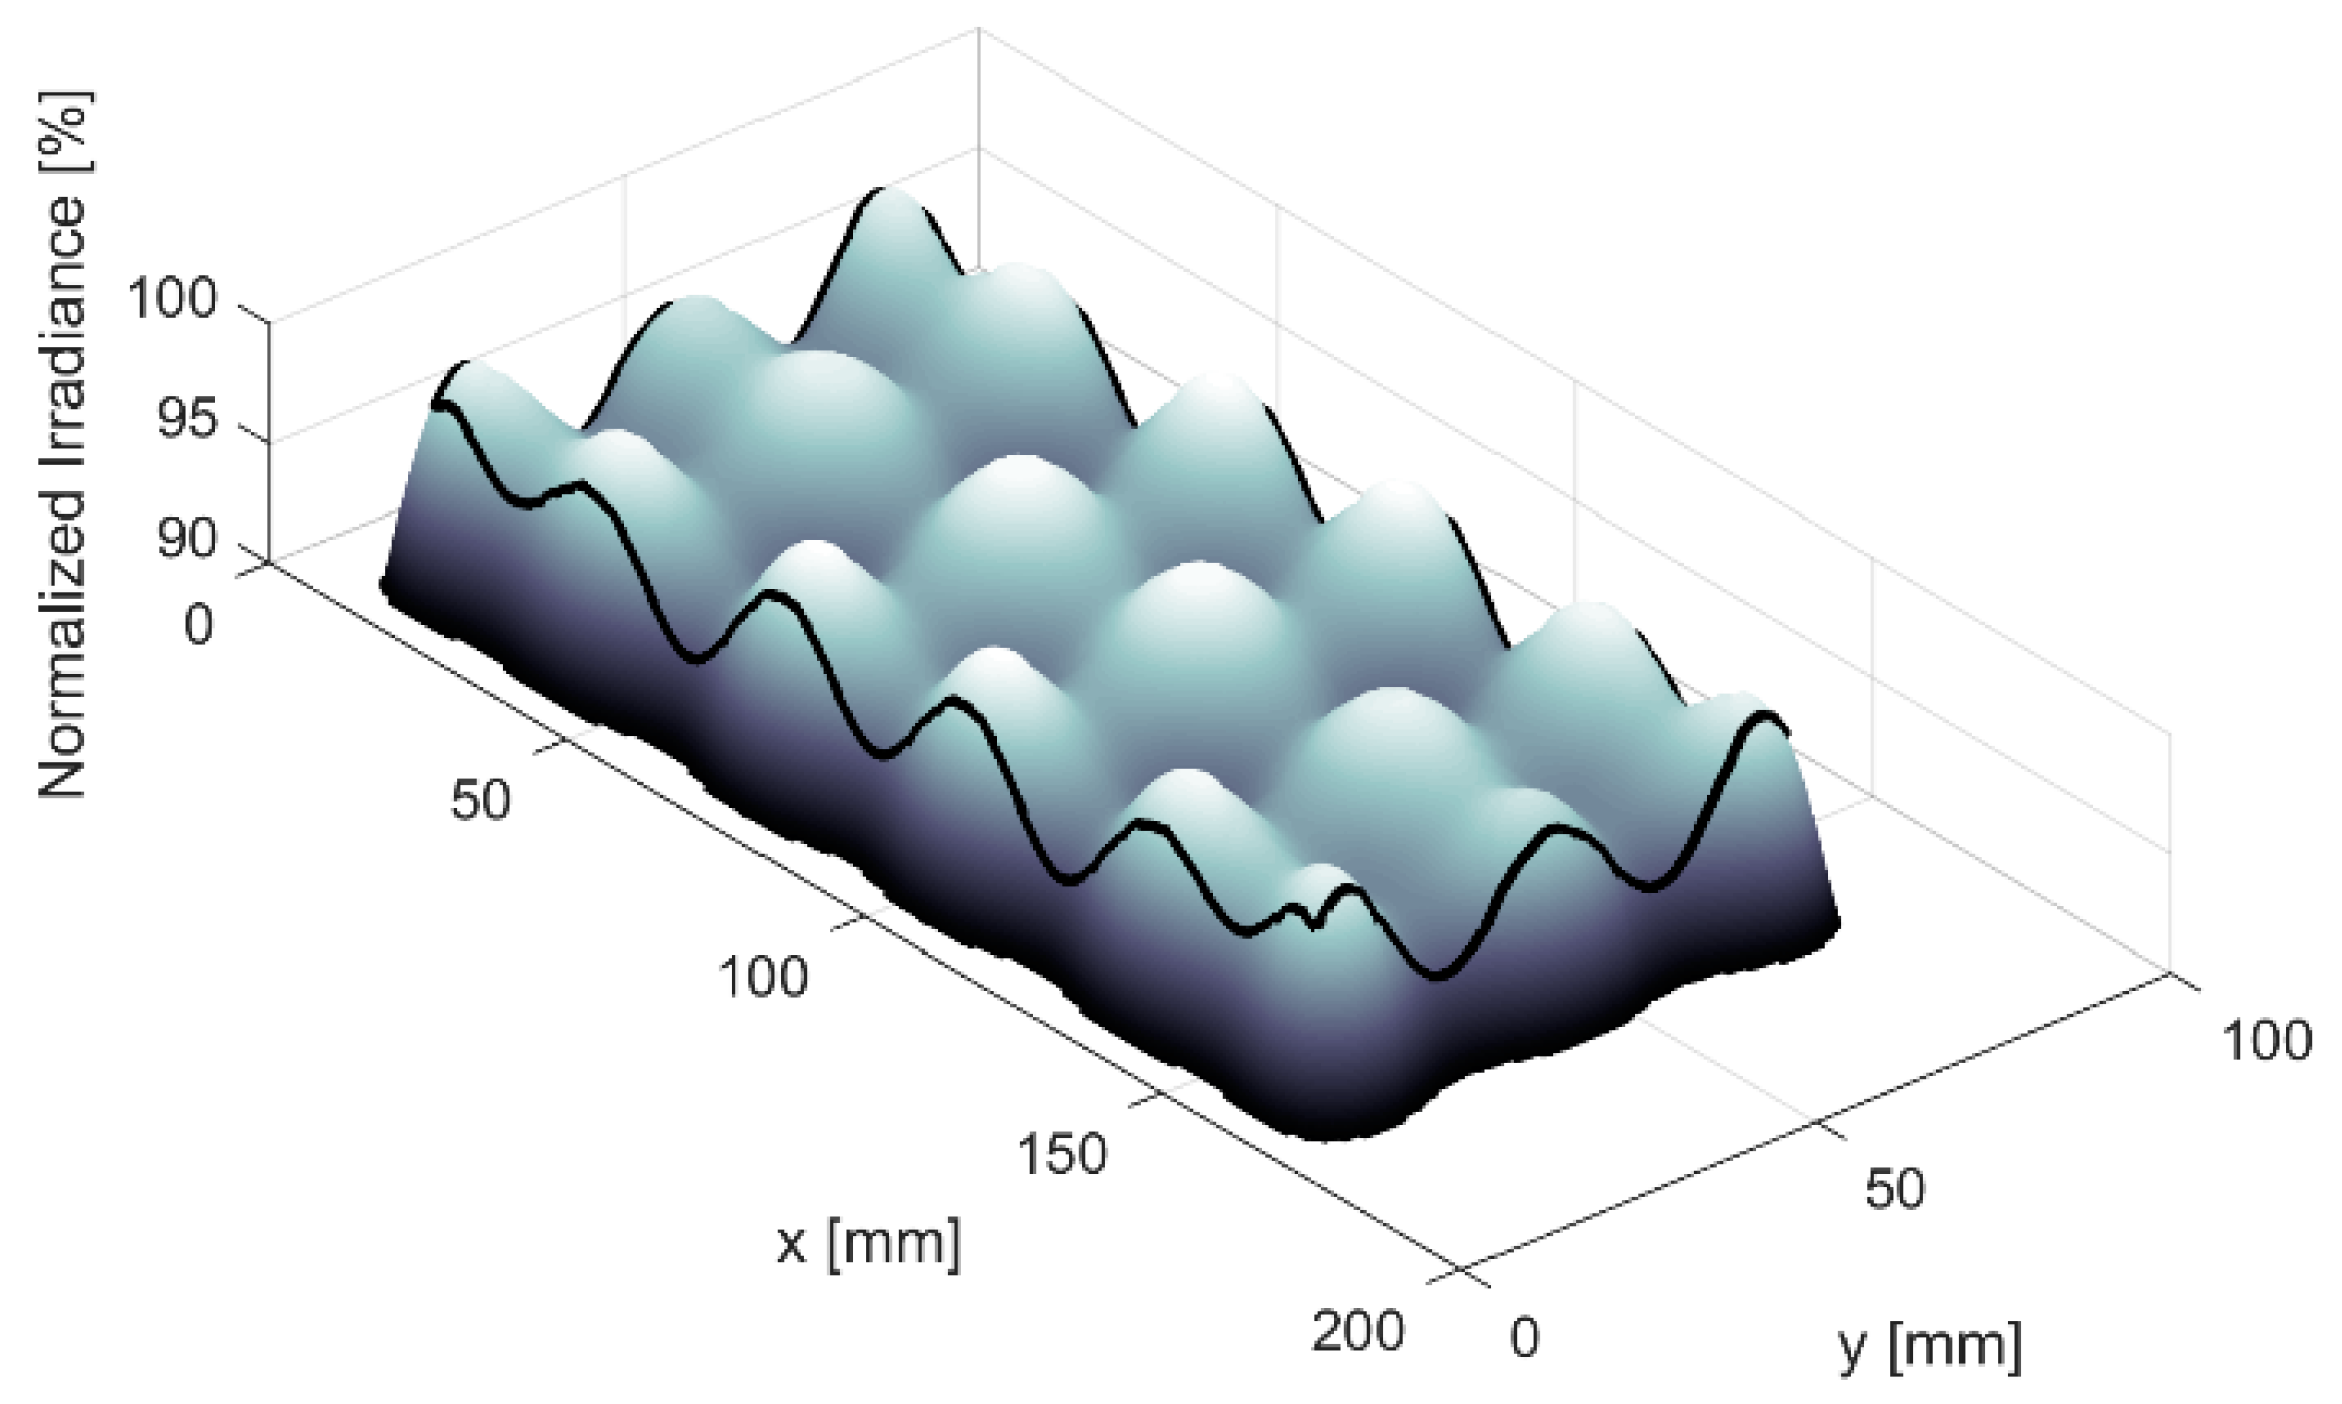
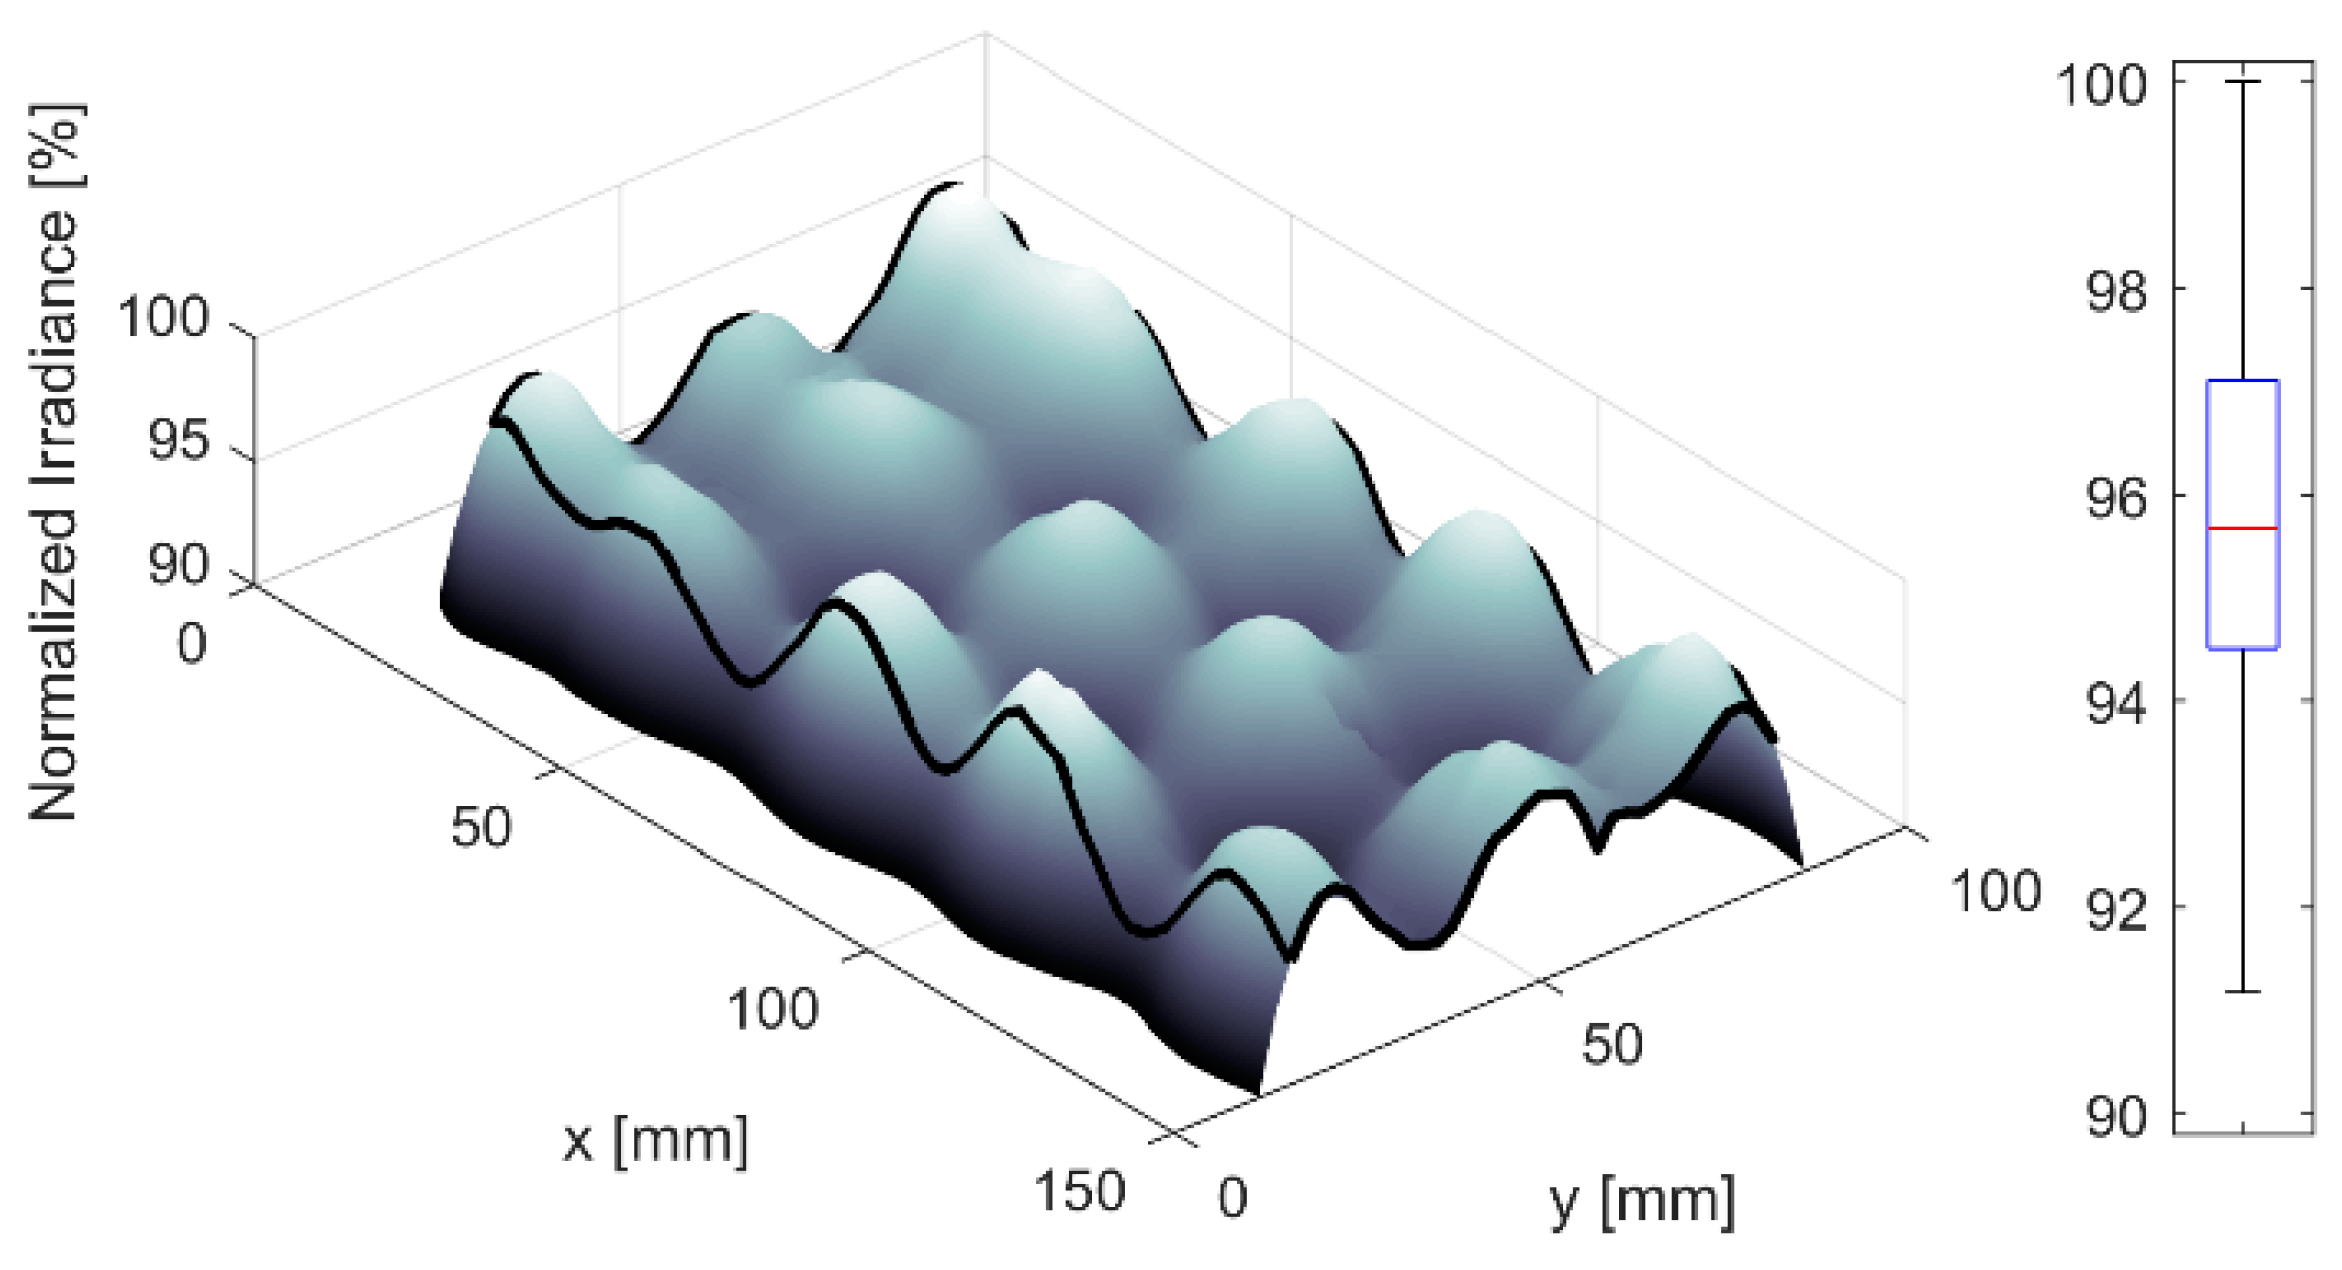
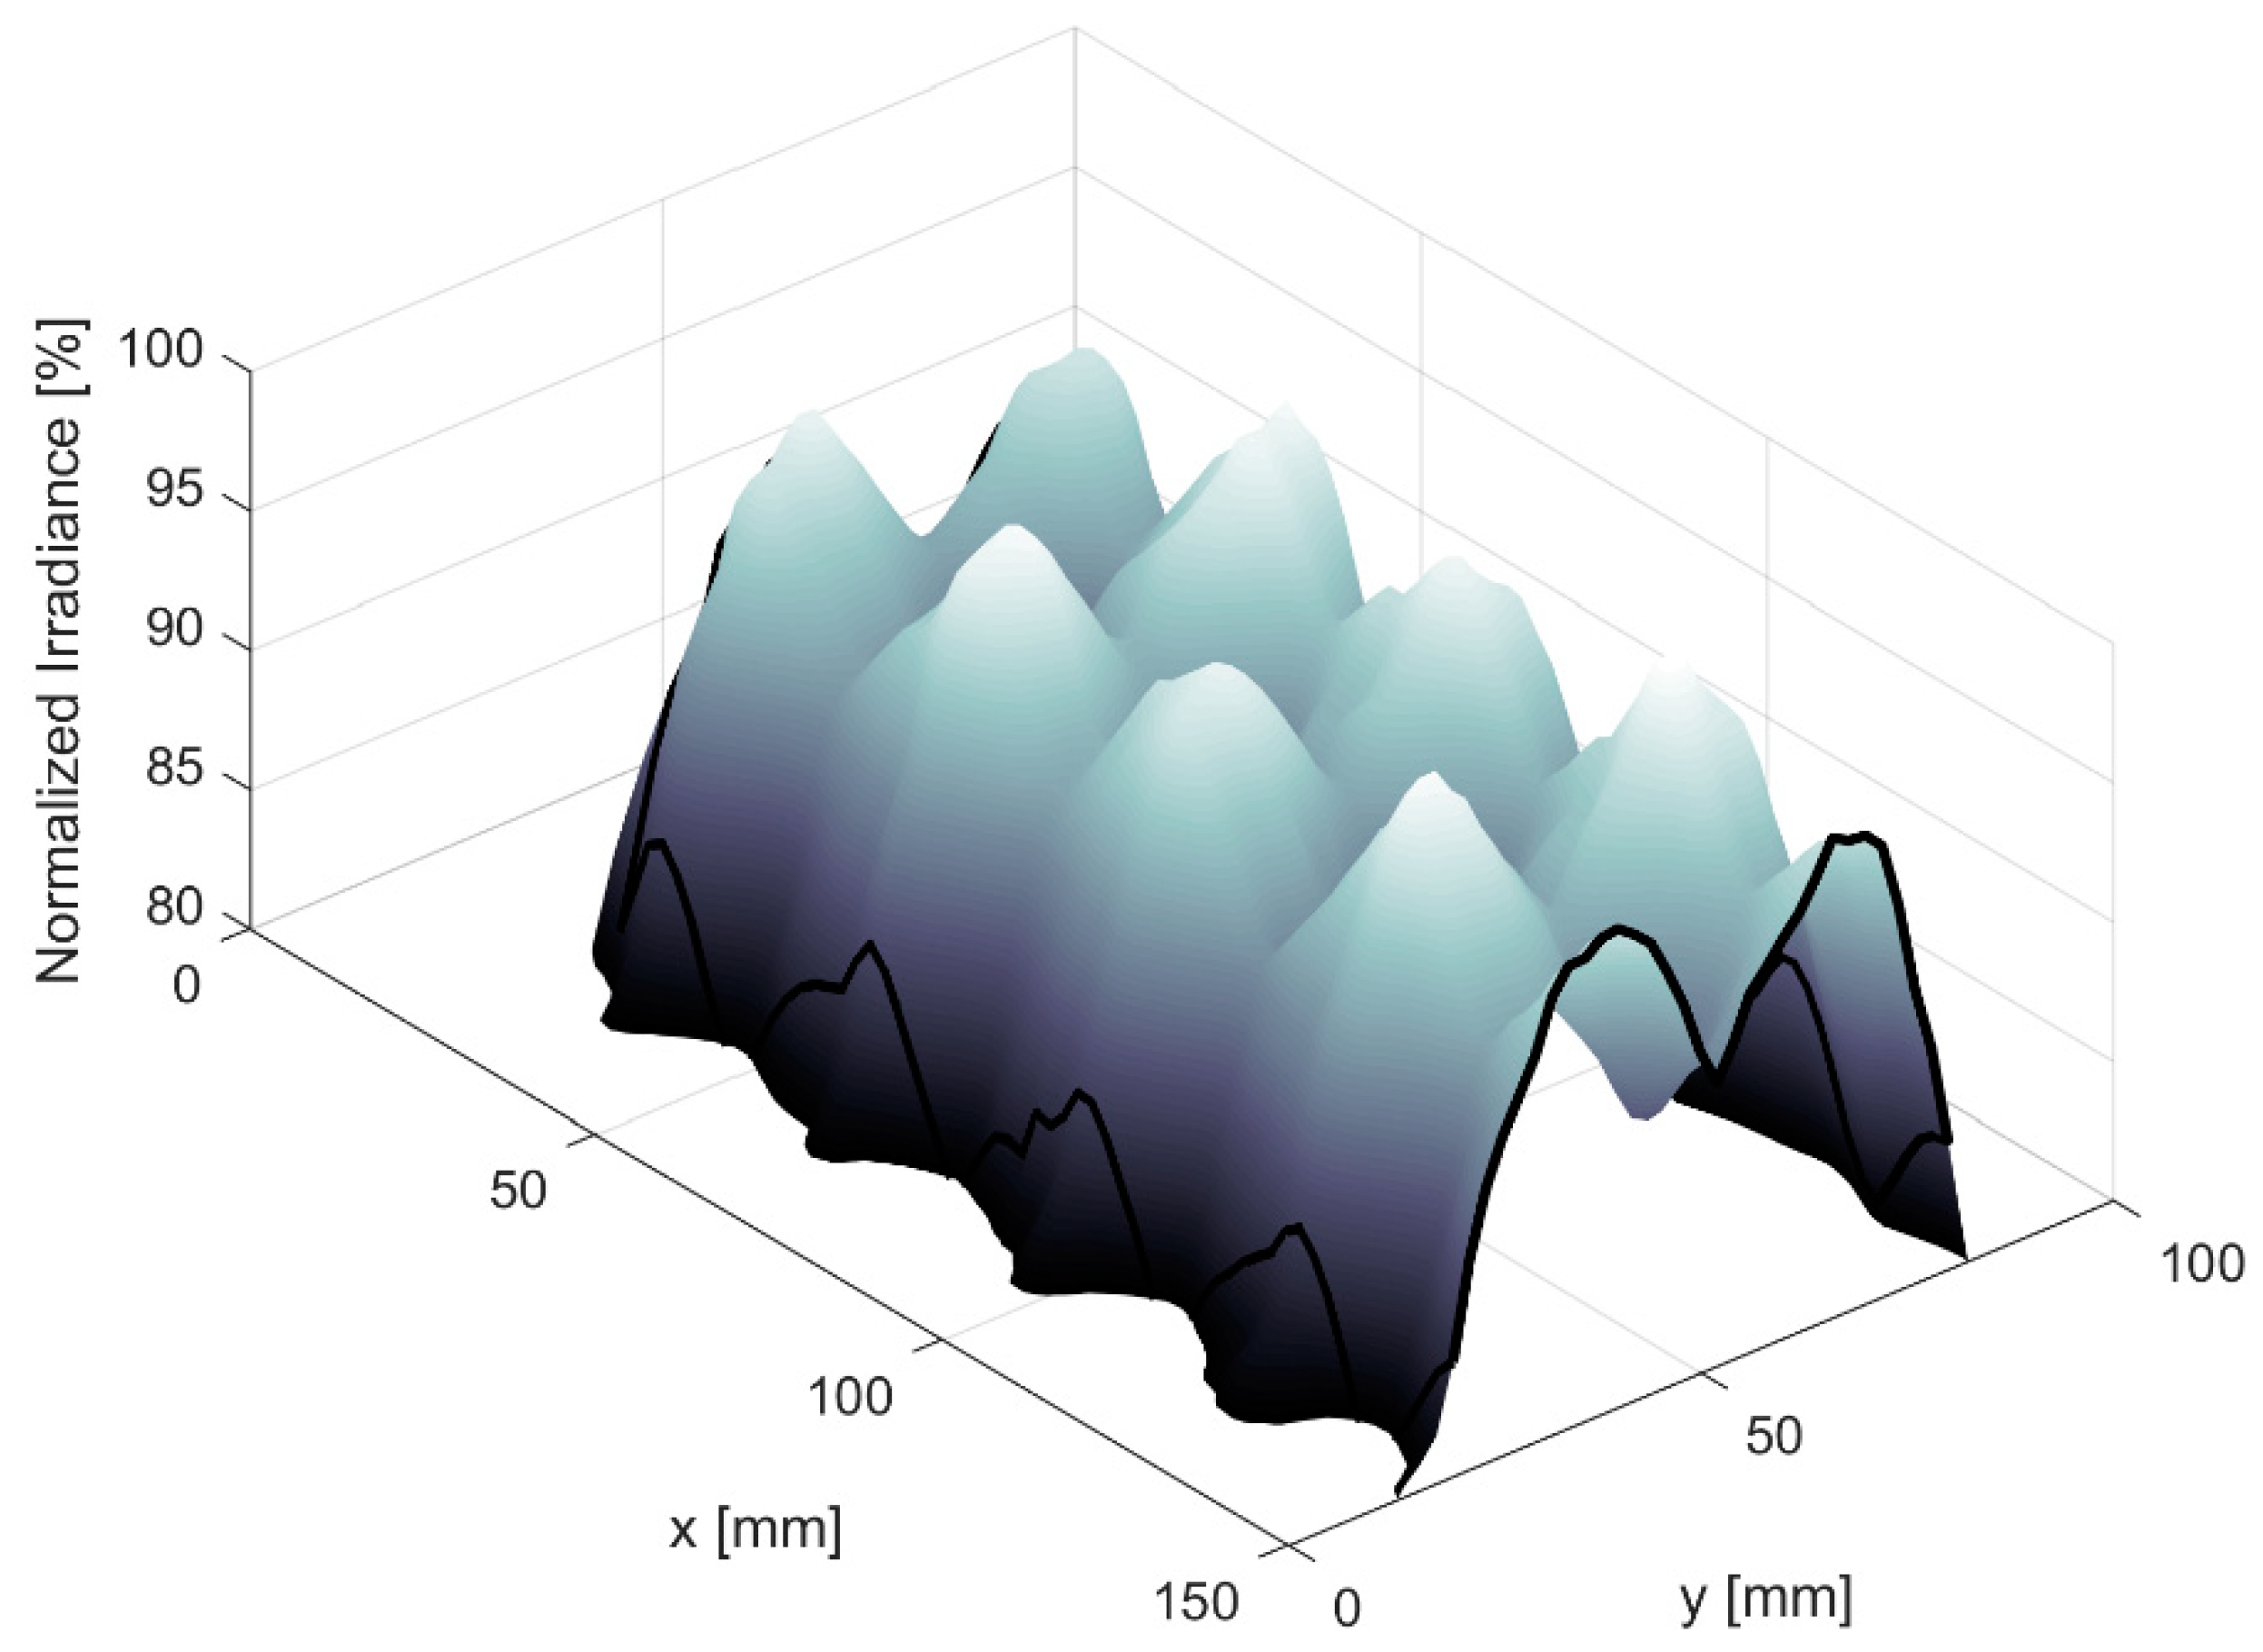
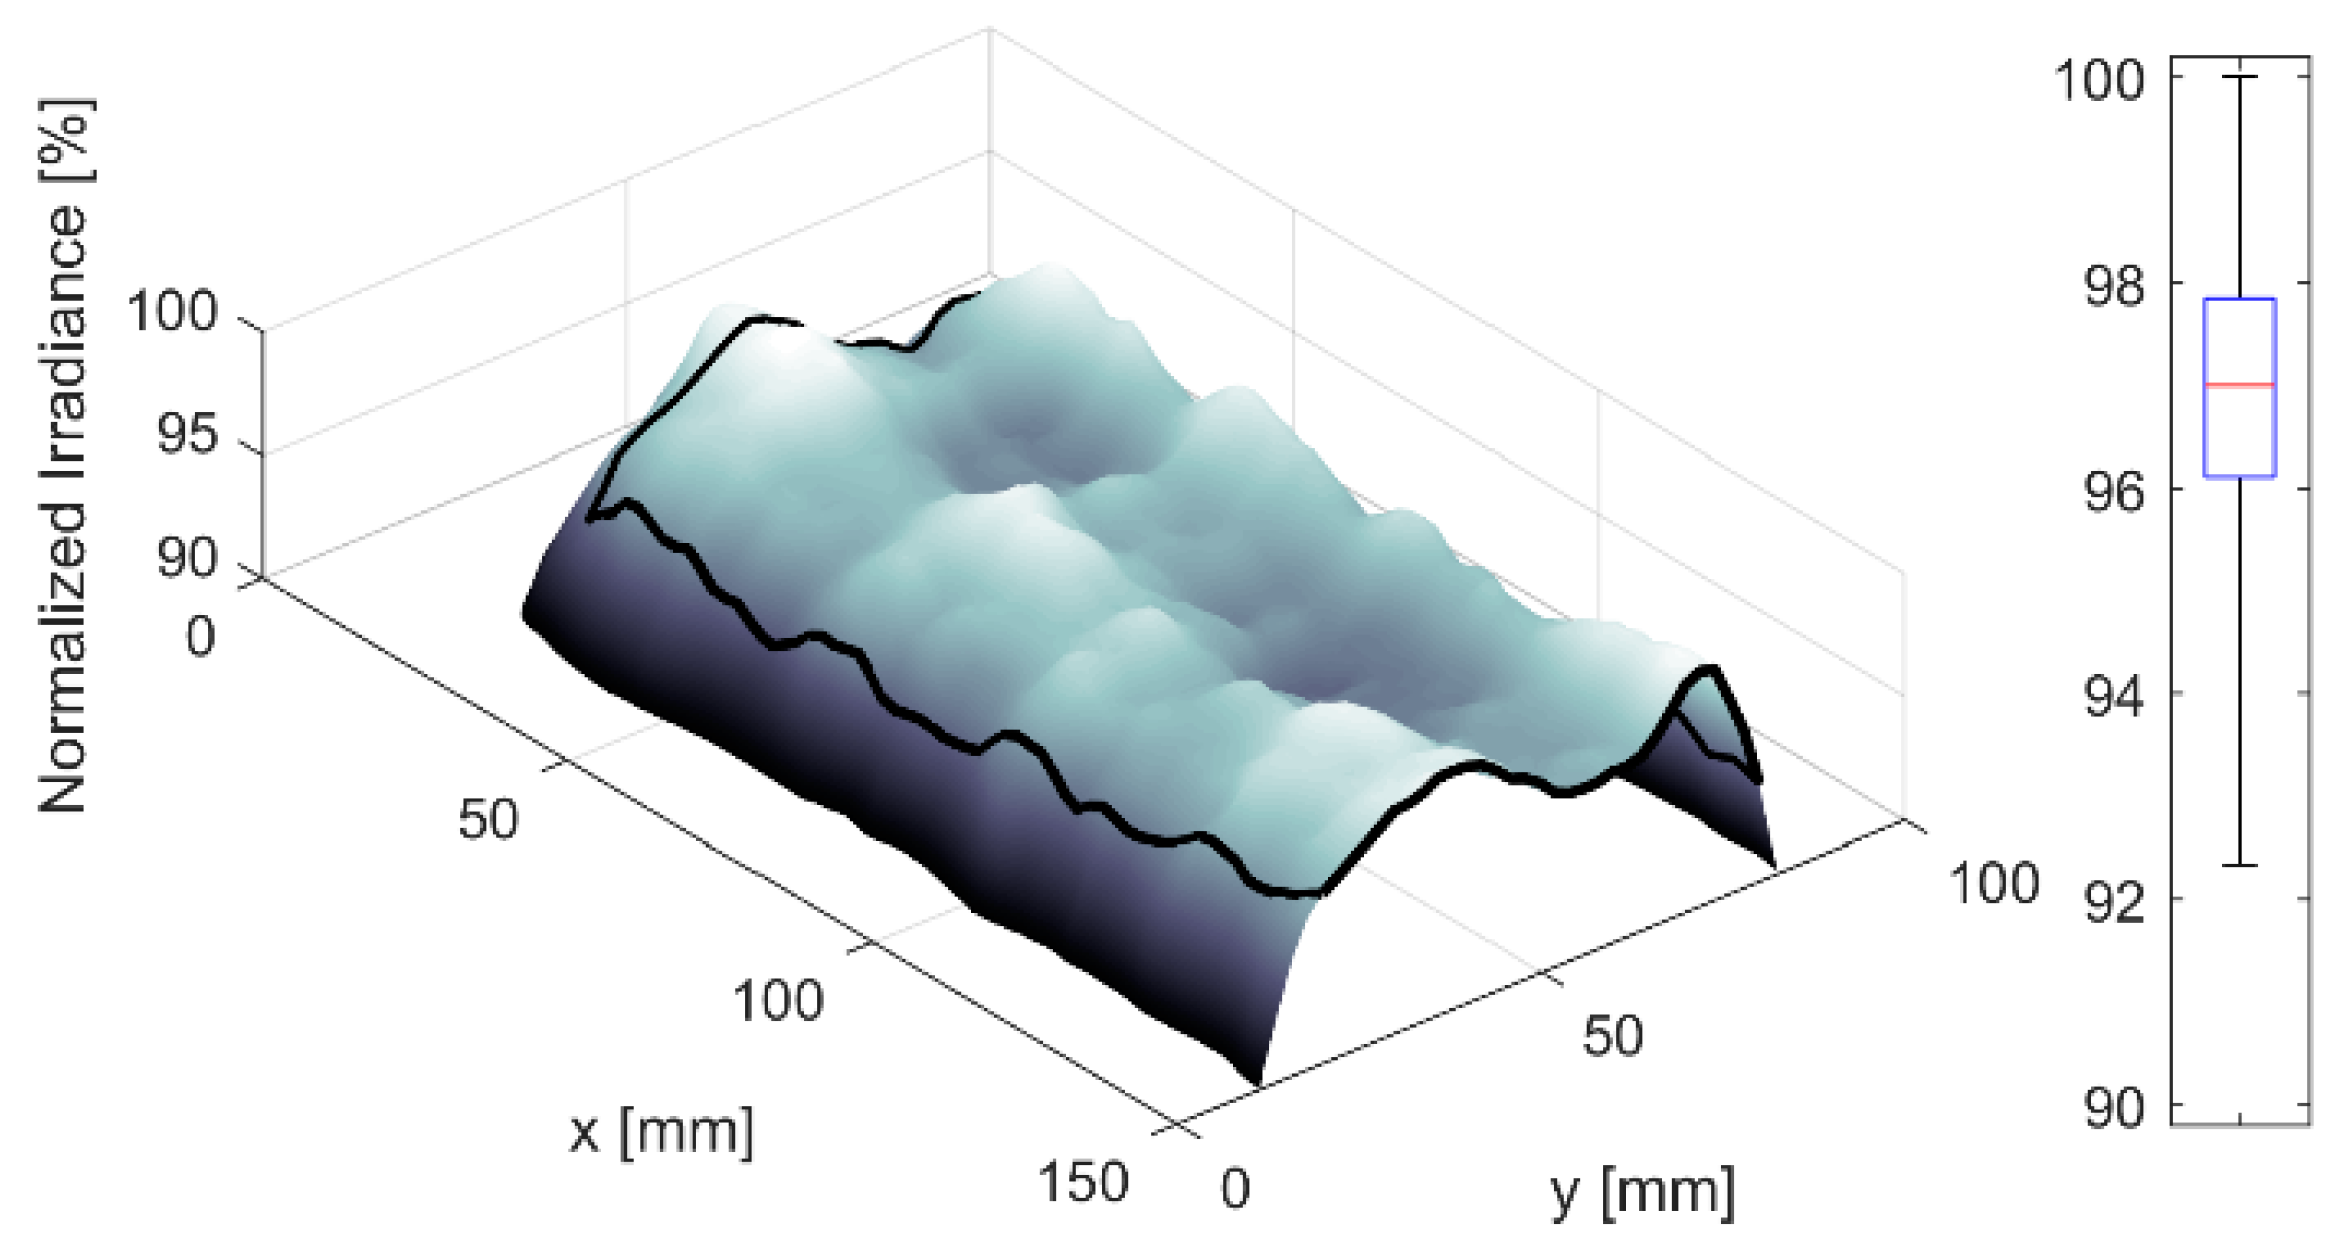
4.2. Irradiance Homogeneity
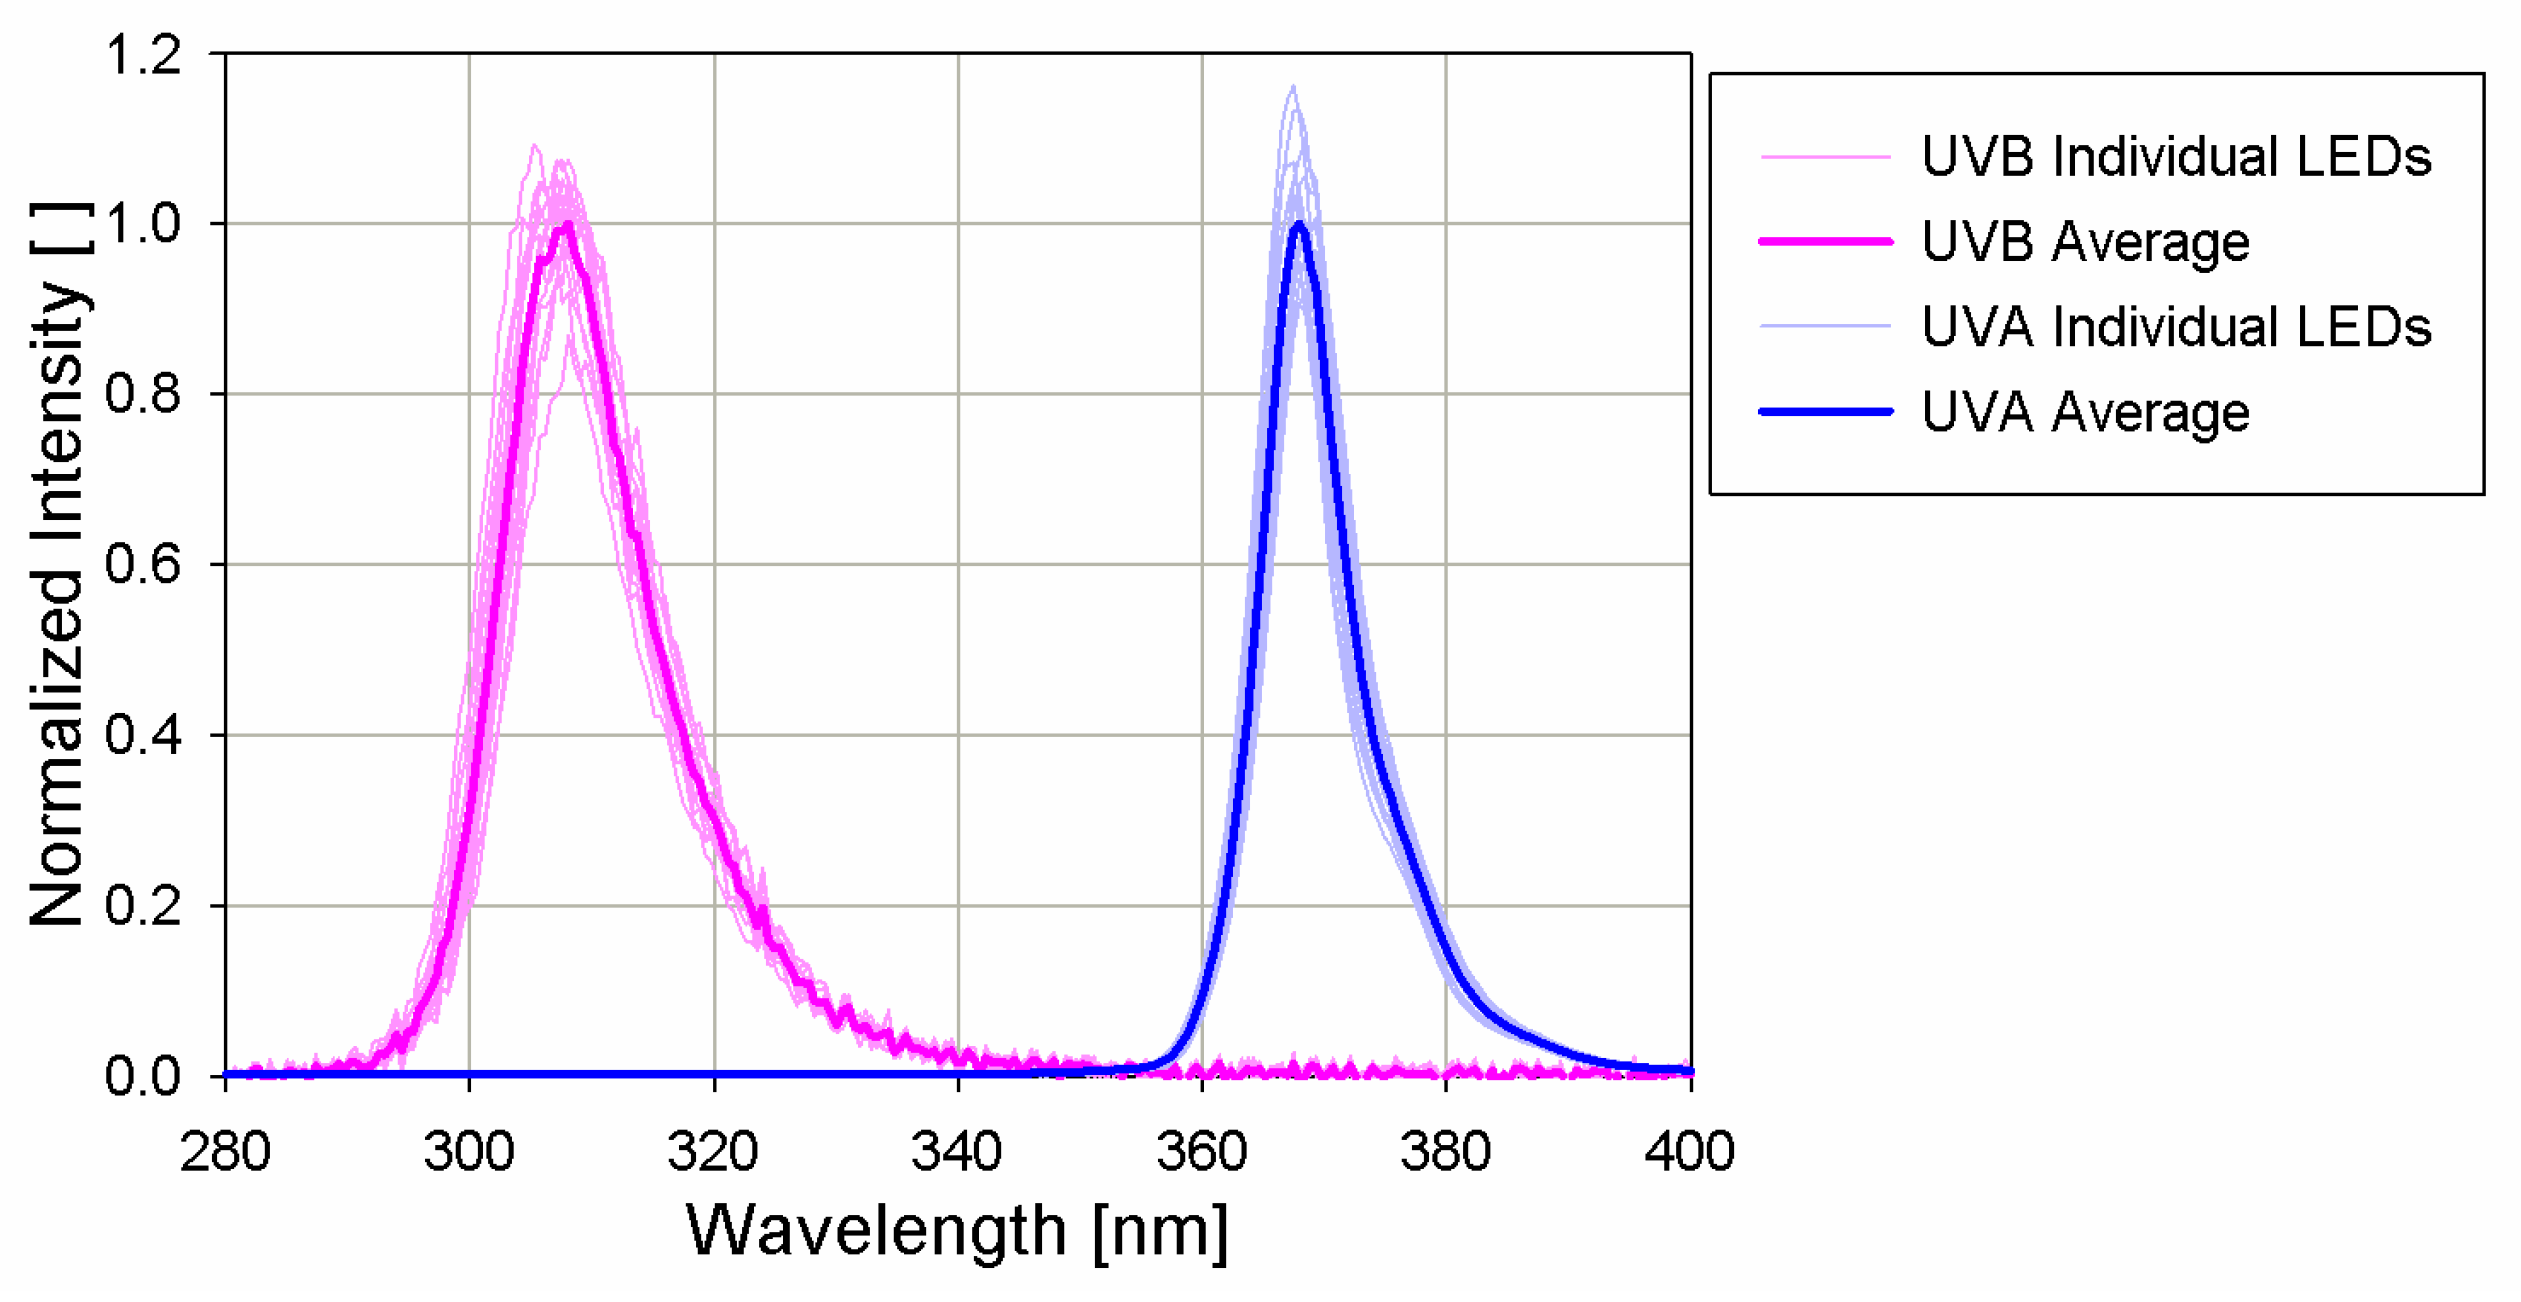
The irradiance measurement graphs are normalised to the maximum measured value in order to facilitate comparison of inhomogeneity. The black line in the graphs indicates the area where the average optical power density and maximum deviations from the average value were calculated.
Figure 6 shows the measured irradiance achieved by the UVA lamp, which matches the simulation very well. The difference between the simulated and measured data is below ±2%. The average irradiance produced by the UVA lamp was measured to be 70.1 W/m2. The maximum irradiance was 73.2 W/m2 and the minimum was 66.7 W/m2. These numbers translate to an inhomogeneity in the range between −4.9% and +4.4%, which is slightly more than the simulation predicted values, yet less than the initial requirement, albeit on a slightly reduced area than initially specified. Table 2 contains the individual LED output power settings required to achieve this result. The maximum discrepancy between the values determined by the simulation and the values determined by the calibration is approximately 10%, which confirms that the ability to set currents for each individual LED is a necessary feature.
The measured irradiance produced by the UVB lamp, shown in Figure 7, did not match the initial simulation shown in Figure 5, which was performed using the RRP of the UVA LED. A revised version of the UVB LED datasheet with a RRP had, in the meantime, been published. The published RRP differed considerably from the RRP of the UVA LED. Using the newly published RRP in the simulation still failed to provide a match between the measurement and the simulation. However, Kheyrandish et al. [31] reported that most LEDs with a heart-shaped RRP, like the one provided for the UVB LED, have an azimuth dependant RRP. Therefore, a 3D scan of the UVB LED’s RRP was performed (Figure 8a). The new simulation using the 3D scan as an input parameter was found to match the measured irradiance of the UVB lamp very well (Figure 8b).
The measured irradiance distribution of the UVB lamp was too inhomogeneous to meet the initial requirement of ±5%. To improve the homogeneity, an optical diffusor was created by engraving an ACRISUNPLUS acrylic sheet (Plastidite S.p.A., Trieste, Italy) with a laser. Although the addition of the diffusor reduced the optical output of the lamp by approximately 40%, the homogeneity of the lamp was significantly improved. Figure 9 shows the irradiance achieved by the UVB lamp with the diffusor. The area where the lamp satisfies the initial requirements is only 120 mm × 60 mm; however, it was decided that the benefits of a lamp redesign would not outweigh the additional costs. The average irradiance produced by the UVB lamp with added diffusor is 3.10 W/m2, with a maximum of 3.20 W/m2 and a minimum of 2.95 W/m2, which corresponds to maximum deviations of +3.2% and −4.8% of the average optical power density, respectively. The different RRP of the UVB LEDs and the addition of the diffusor result in a different distribution of the output power of individual LEDs. The values determined by calibration are summarised in Table 3. The difference in the efficiency of individual LEDs is even greater in the case of the UVB LEDs compared to the UVA LEDs.
There is a very large difference in the irradiance both lamps produce, even though the electrical input power is almost the same in both cases. The main reason is that the efficiency of UVA LEDs is more than 10 times higher than that of UVB LEDs, which shows how much room for improvement still remains in the area of deep UV LED development. In this case, however, the lower efficiency of the UVB LEDs is not a problem, because biological tissue is much more sensitive to UV light of shorter wavelengths. A good reference is the sensitivity of human skin, presented in the CIE1987 reference action spectrum for erythema in human skin (Commission Internationale de l’Éclairage 1987) [29]. Taking into account the CIE1987 reference action spectrum, the CIE weighted irradiance that the UVA lamp (peak at 365 nm) produces is only 0.0254 W/m2CIE, while the CIE weighted irradiance which the UVB lamp produces (peak at 308 nm) is 0.516 W/m2CIE. This means that the impact of the UVB lamp on biological samples should be much larger than that of the UVA lamp, despite its much lower radiometric irradiance.

4.3. Spectrum

The spectrum of the UVA lamp is expected to be limited to the 320 nm–400 nm range and the spectrum of the UVB lamp to the 290 nm–320 nm range. The normalised measured spectrum of both lamps is shown in Figure 10. The UVA lamp emits most of its light in the wavelength range between 360 nm and 390 nm with a peak at 368 nm and a full width half magnitude (FWHM) of 9 nm. The light outside of the UVA range is below the noise floor of the instrument. The UVB lamp spectrum is slightly broader than that of the UVA lamp. Most of the light of the UVB lamp is emitted between 295 nm and 320 nm, and only 17% of light is emitted in the UVA range between 320 nm and 340 nm. The peak is at 308 nm and FWHM is 14 nm.

4.4. Heat Dissipation

Most of the input electrical power of any lamp is transformed into waste heat instead of light. This heat raises the temperature of biological samples under test beyond their optimal temperature of 37 °C. Purpose-built microtiter plate UV illuminators have a built-in cooling solution. On the other hand, a light source designed for use inside an incubator cannot transfer excess heat outside of the incubator, and therefore has to produce as little excess heat as possible. Fans are also not desirable, because excessive air movement can increase the risk of sample trans-contamination. Since heat dissipation comparison between a light source which cannot be placed inside an incubator and one that can does not make much sense, the heat dissipation of UV LED lamps is compared to the heat dissipation of the Vilber VL-6LC [32] handheld UV lamp based on fluorescent tubes with a similar power consumption, which can also be placed inside an incubator, provided that the humidity is set low enough.
Figure 11 shows temperature traces of the centre microtiter well (a) and ambient temperature inside an incubator (b) for the UVA (blue) and UVB (magenta) LED lamps and the VL-6LC (red) lamp. The optimal temperature for most of the biological samples is about 37 °C. In this test, we assume a maximum allowed temperature of 42 °C, which most cells can survive, to establish a metric for comparison of all three lamps. The UVA lamp took approximately 40 min, the UVB lamp 67 min and the VL-6LC only 20 min to reach a 5 °C increase above the optimal temperature in the central well of the microtiter plate.
Although the input electrical power of all three lamps is very similar, with 12.3 W for the UVA LED lamp, 13.3 W for the UVB LED lamp and 12.3 W for the VL-6LC lamp (VILBER LOURMAT Deutschland GmbH, Eberhardzell, Germany), the temperature increase rates of the centre microtiter well are very different. This behaviour can be explained with IR images shown in Figure 12, Figure 13 and Figure 14, which were taken after 60 min of operation. Figure 12a shows the UVA lamp without the acrylic glass cover. Here, all the individual light sources can be distinguished, while in Figure 12b the acrylic glass cover obscures all the details. This suggests that the acrylic glass blocks direct IR radiation and thus acts as a good thermal insulator. The details in the left image show that the hottest parts are the LED driving ICs, which have a temperature of about 40 °C above room temperature. The temperature of the LEDs has increased by only about 14 °C since activation. Each LED driving sub-circuit consumes much less power than the LED itself, but because each IC drives nine LEDs, the total dissipated power of each IC is approximately 2 to 3 times higher than that of each individual LED, which partially accounts for the higher temperature. The other reason the LEDs are considerably cooler is that the LEDs have a much better thermal contact to the heatsink. The same cooling solution would be unpractical for the driving ICs because of the large number of electrical connections.
Figure 12c shows a side view of the UVA LED lamp. The bottom part of the lamp, which acts as a heatsink, is considerably hotter than the acrylic glass cover. This means that a large part of the generated heat is dissipated to the ambient, away from the samples under test.
The UVB lamp has a much smaller temperature effect on samples under test than the UVA lamp because of the diffusor, which is basically a second sheet of acrylic glass, providing a second layer of thermal insulation. IR images of the UVB lamp are shown in Figure 13.
Figure 14 shows IR images of the VL-6LC lamp after 60 min of operation. This lamp is noticeably hotter than the LED lamps. Please note, the images in Figure 14 were taken later in the year when ambient temperatures were higher, which is why their colour scale is offset by 5 °C. Figure 14a shows the lamp from the top and Figure 14b from the side. The left side of the glass window is noticeably hotter than the right side of the window and the rest of the enclosure. The hottest spot was measured to be 53 °C. The sides of this lamp are no hotter than the top of the lamp. In fact, the window seems to be the hottest part of the lamp. The reason is that a fluorescent tube radiates light in all directions equally, and there is usually a reflector behind the tube to reflect the light that is radiated away from the target, back towards the target. Unfortunately, such reflectors reflect all the heat towards the window and the target as well. Since the metal parts of the lamp conduct heat quite well, all the metal parts of the lamp seem to have a considerably uniform temperature. The glass window, on the other hand, does not conduct heat very well, which is why the IR images can reveal which of the two tubes is currently in operation. Because a large part of the heat is directed towards the samples under test, this kind of lamp will have a greater impact on sample temperature than both LED-based lamps, which direct most of the heat towards the back of the lamp, away from the samples.
Measurements of the ambient temperature inside the incubator (Figure 11) do reflect the difference in power consumption of both LED lamps. However, the fluorescent tube-based lamp should have had about the same effect as the UVA lamp. This discrepancy can be attributed to the large heatsink of both LED lamps, which each weigh 1 kg and have a considerable heat capacity. As a result, the ambient temperature rises slowly compared to the VL-6LC lamp, because it takes a long time to heat up the heatsink which in turn heats up the ambient air. The delayed heating effect makes the LED lamps much better suited for experiments on temperature sensitive biological samples.

4.5. Cell Culture Tests

The uniform irradiation is supposed to generate a comparable biological response all over the seeded microtiter plate. We selected two cell lines frequently used in toxicity bioassays, and exposed them to irradiation, resulting in a roughly 20% reduction of the viability signal. The doses of UVA (50000 J/m2, 966 s) and UVB (1000 J/m2, 666 s) were determined empirically by pretesting (data not shown). The extent of metabolic conversion of PrestoBlue® viability substrate to a fluorescent product was taken as a measure of viability signal proportional to cell number. The microtiter well positions on both lamps and the corresponding irradiance are shown in Figure 15.
The fluorescence viability signal readings from the control plates show high uniformity with only a slight reduction in the border wells when compared to the plate average (Figure 16a,b). This indicates well-controlled growth conditions in all wells, including the border ones. The plates irradiated with UVA and UVB exhibited a reduced viability signal when compared to the control plate. The viability signal was measured 24 h after irradiation to intensify the effect as shown by Khalila and Shebabya [33]. The overall variability of the viability signal in individual microplate positions in each series of experiments with UV exposure increased compared to both control series. In the UVA irradiated plates, the viability signal decreased over the whole plate. In the Jurkat cells, the decrease of the viability signal was uniform with only a slightly heightened effect in the border wells (Figure 16c). In the adherent HEK-293 cells, the decrease of the viability signal in the border wells was more pronounced (Figure 16d). In the UVB irradiated plates, the viability signal was also decreased over the whole plate. However, variabilities were higher than in the UVA experiments. In the Jurkat cells, an area of higher viability signal loss was observed in the central part of the mictotiter plate (Figure 16e). The same pattern could be observed in three independent repetitions of the experiment; however, it could not be directly attributed to the measured differences in UVB irradiance. In the HEK-293 cells, a similar, but much less pronounced, position-dependent effect was observed (Figure 16f). The irradiance distributions of the UVA and UVB lamps are quite uniform.
Our ambition was to demonstrate a similar uniformity of a physiological response in correspondence with the irradiance. We obtained a uniform reduction in the viability signal after irradiation with the UVA lamp in the Jurkat cell line (Figure 16c) and after irradiation with the UVB lamp in the HEK-293 cell line (Figure 16f), but a slightly higher difference between the centre and the periphery of the plates in the other two cases (Figure 16d,e). We reason that these irregularities cannot be attributed to a lack of irradiation uniformity, as such differences would most likely be reflected in both cell lines for each lamp. The difference could be partly explained with the increased overall variability in irradiated plates and might partly be related to other, not strictly controlled conditions like temperature. Jurkat cells are known for their sensitivity to temperature and their ability to show pro-apoptotic signalling after an increase in temperature to 42 °C and above [34]. Our temperature measurements showed a slightly higher temperature increase in the central wells compared to the peripheral wells during UV irradiation, which could potentially influence the results. The temperature increase was not high enough to reduce the viability signal on its own. According to the temperature measurements inside microtiter wells shown in Figure 11a, the temperature of the cells illuminated with the UVA lamp did not increase by more than 2.5 °C in the 966 s of illumination and the temperature of the cells illuminated with the UVB lamp did not increase by more than 1 °C in 666 s of illumination. A synergistic effect between the UV illumination and the temperature or any other unforeseen influence is, however, possible.

5. Conclusions

UVA and UVB LED-based lamps were designed, built and tested. The measured average irradiance at a distance of 30 mm above the LEDs produced by the UVA lamp was 70.1 W/m2, with a maximum deviation of 4.9% over an area of 148 mm × 66 mm. For the UVB lamp, an additional diffusor was required to achieve satisfactory results, due to the more complex radiation pattern of UVB LEDs. The final average irradiance produced by the UVB lamp was 3.1 W/m2 with a maximum deviation of 4.8% over an area of 120 mm × 60 mm. The irradiance homogeneities of both lamps compare favourably to the stated inhomogeneity of ±7% of the Vilber Bio-Sun UV illuminator [26]. An added bonus compared to the Vilber Bio-Sun is the possibility of using these LED lamps for bottom-up or top-down illumination, which can make it easier to deliver the exact required irradiation dose to the samples.
The mechanical design for the effective thermal management of LED-based lamps indeed proved to be effective, since the influence of the LED-based lamps on sample temperatures in an incubator was much lower than the influence of the fluorescent tube-based handheld lamp, despite all three lamps having had almost identical electrical power consumption. The UVA LED lamp was able to illuminate samples for 40 min, the UVB LED lamp for 67 min and the fluorescent tube-based lamp for only 20 min, before the temperature of the samples increased by more than 5 °C. In experiments with real cell cultures the illumination doses were tailored to generate a suitable physiological response of the tested cell cultures, which required significantly shorter illumination times of only 966 s and 666 s for the UVA and UVB lamp, respectively. During these illumination periods, the temperature effects were on a much more acceptable level of less than 2.5 °C and 1 °C for the UVA and UVB lamps, respectively.
The tests on cell cultures confirmed the general suitability of the design for research purposes with regard to ease of use, installation into an incubator, the correct positioning of samples under test and so forth. The test results also confirmed uniformity of physiological responses to irradiation with both lamps in general. Slight border to centre differences in viability signals did occur in the HEK-293 cell culture irradiated by the UVA lamp and the Jurkat cell culture irradiated by the UVB lamp. There could be many reasons for these deviations, including an inhomogeneity of the lamps. However, since the results for the HEK-293 cell culture irradiated by the UVB lamp and the Jurkat cell culture irradiated by the UVA lamp exhibit very good uniformity, it can be concluded that both lamps produce sufficiently homogenous irradiance.
The presented solution is a careful balance between the desired specifications, cost, and simplicity of installation and use. Only one flat cable connection is required, which does not prevent closure of the incubator door. Should additional or more stringent requirements arise it would still be possible to improve the performance of the lamps: homogeneity could be improved with even more LEDs or an additional diffusor, heat dissipation within the measurement chamber could be further reduced by relocating the LED driving ICs to the control module at the expense of having more wires connecting the LED and the control module, etc.

Supplementary Materials

The following are available online at https://www.mdpi.com/2079-9292/8/3/343/s1, Electronic schematics, Source code, Android application.

Author Contributions

Conceptualisation, P.F. and M.P.; methodology, M.P.; software, M.P.; validation, S.C. and M.P.; formal analysis, S.C. and M.P.; resources, M.T. and S.C.; writing—original draft preparation, M.P., S.C. and P.F.; writing—review and editing, M.T.; visualization, M.P.; project administration, M.T.; funding acquisition, M.T.

Funding

This research was funded by the Slovenian Research Agency ARRS, grant number P2-0197.

Conflicts of Interest

The authors declare no conflict of interest. The funders had no role in the design of the study; in the collection, analyses, or interpretation of data; in the writing of the manuscript, or in the decision to publish the results.

References

  1. Emri, G.; Paragh, G.; Tósaki, Á.; Janka, E.; Kollár, S.; Hegedűs, C.; Gellén, E.; Horkay, I.; Koncz, G.; Remenyik, É. Ultraviolet radiation-mediated development of cutaneous melanoma: An update. J. Photochem. Photobiol. B Biol. 2018, 185, 169–175. [Google Scholar] [CrossRef] [PubMed]
  2. Song, X.; Peng, C.; Jiang, H.; Zhu, Q.; Wang, W. Direct and Indirect Effects of UV-B Exposure on Litter Decomposition: A Meta-Analysis. PLoS ONE 2013, 8, e68858. [Google Scholar] [CrossRef] [PubMed]
  3. Maisels, M.J.; McDonagh, A.F. Phototherapy for Neonatal Jaundice. N. Engl. J. Med. 2008, 358, 920–928. [Google Scholar] [CrossRef] [Green Version]
  4. Meesters, Y.; Duijzer, W.B.; Hommes, V. The effects of low-intensity narrow-band blue-light treatment compared to bright white-light treatment in seasonal affective disorder. J. Affect. Disord. 2018, 232, 48–51. [Google Scholar] [CrossRef]
  5. Holick, M.F. Ultraviolet B Radiation: The Vitamin D Connection. In Ultraviolet Light in Human Health, Diseases and Environment. Advances in Experimental Medicine and Biology; Ahmad, S., Ed.; Springer: Cham, Switzerland, 2017; Volume 996, pp. 137–154. ISBN 978-3-319-56017-5. [Google Scholar]
  6. Wang, Y.; Gutierrez-Herrera, E.; Ortega-Martinez, A.; Anderson, R.R.; Franco, W. UV fluorescence excitation imaging of healing of wounds in skin: Evaluation of wound closure in organ culture model. Lasers Surg. Med. 2016, 48, 678–685. [Google Scholar] [CrossRef] [PubMed] [Green Version]
  7. Lommerts, J.E.; Uitentuis, S.E.; Bekkenk, M.W.; de Rie, M.A.; Wolkerstorfer, A. The role of phototherapy in the surgical treatment of vitiligo: A systematic review. J. Eur. Acad. Dermatol. Venereol. 2018, 32, 1427–1435. [Google Scholar] [CrossRef] [PubMed]
  8. Heredia-Rodríguez, M.; Álvarez-Fuente, E.; Bustamante-Munguira, J.; Poves-Alvarez, R.; Fierro, I.; Gómez-Sánchez, E.; Gómez-Pesquera, E.; Lorenzo-López, M.; Eiros, J.M.; Álvarez, F.J.; et al. Impact of an ultraviolet air sterilizer on cardiac surgery patients, a randomized clinical trial. Med. Clin. 2018, 151, 299–307. [Google Scholar] [CrossRef] [PubMed]
  9. Sarkany, R.P.E. Ultraviolet Radiation and the Skin. In Encyclopedia of Environmental Health; Elsevier: Amsterdam, The Netherlands, 2011; pp. 469–482. [Google Scholar]
  10. Wischermann, K.; Boukamp, P.; Schmezer, P. Improved alkaline comet assay protocol for adherent HaCaT keratinocytes to study UVA-induced DNA damage. Mutat. Res. Toxicol. Environ. Mutagen. 2007, 630, 122–128. [Google Scholar] [CrossRef] [PubMed]
  11. O’Connor, I.; O’Brien, N. Modulation of UVA light-induced oxidative stress by β-carotene, lutein and astaxanthin in cultured fibroblasts. J. Dermatol. Sci. 1998, 16, 226–230. [Google Scholar] [CrossRef]
  12. Kyadarkunte, A.Y.; Patole, M.S.; Pokharkar, V.B. Cellular interactions and photoprotective effects of idebenone-loaded nanostructured lipid carriers stabilized using PEG-free surfactant. Int. J. Pharm. 2015, 479, 77–87. [Google Scholar] [CrossRef] [PubMed]
  13. Park, J.; Jung, H.; Kim, K.; Lim, K.-M.; Kim, J.; Jho, E.; Oh, E.-S. D-tyrosine negatively regulates melanin synthesis by competitively inhibiting tyrosinase activity. Pigment Cell Melanoma Res. 2018, 31, 374–383. [Google Scholar] [CrossRef] [PubMed]
  14. Shin, D.; Lee, Y.; Huang, Y.; Lim, H.; Jang, K.; Kim, D.; Lim, C.-J. Probiotic fermentation augments the skin anti-photoaging properties of Agastache rugosa through up-regulating antioxidant components in UV-B-irradiated HaCaT keratinocytes. BMC Complement. Altern. Med. 2018, 18, 196. [Google Scholar] [CrossRef] [PubMed]
  15. Tao, S.; Park, S.L.; de la Vega, M.R.; Zhang, D.D.; Wondrak, G.T. Systemic administration of the apocarotenoid bixin protects skin against solar UV-induced damage through activation of NRF2. Free Radic. Biol. Med. 2015, 89, 690–700. [Google Scholar] [CrossRef] [PubMed] [Green Version]
  16. Buechner, N.; Schroeder, P.; Jakob, S.; Kunze, K.; Maresch, T.; Calles, C.; Krutmann, J.; Haendeler, J. Changes of MMP-1 and collagen type Iα1 by UVA, UVB and IRA are differentially regulated by Trx-1. Exp. Gerontol. 2008, 43, 633–637. [Google Scholar] [CrossRef] [PubMed]
  17. Dalmau, N.; Andrieu-Abadie, N.; Tauler, R.; Bedia, C. Untargeted lipidomic analysis of primary human epidermal melanocytes acutely and chronically exposed to UV radiation. Mol. Omics 2018, 14, 170–180. [Google Scholar] [CrossRef] [PubMed]
  18. Philips Lighting Philips TL 40W/12 RS SLV/25 Product Information. Available online: http://www.lighting.philips.com/main/prof/lamps/special-lamps/medical-lamps/medical-therapy-uvb-broad-band/uvb-broadband-tl/928011301201_EU/product (accessed on 10 July 2018).
  19. Dupuis, R.D.; Krames, M.R. History, Development, and Applications of High-Brightness Visible Light-Emitting Diodes. J. Light. Technol. 2008, 26, 1154–1171. [Google Scholar] [CrossRef]
  20. Hadis, M.A.; Cooper, P.R.; Milward, M.R.; Gorecki, P.C.; Tarte, E.; Churm, J.; Palin, W.M. Development and application of LED arrays for use in phototherapy research. J. Biophotonics 2017, 10, 1514–1525. [Google Scholar] [CrossRef] [PubMed]
  21. Lee, S.H.; Kim, J.; Shin, J.H.; Lee, H.E.; Kang, I.-S.; Gwak, K.; Kim, D.-S.; Kim, D.; Lee, K.J. Optogenetic control of body movements via flexible vertical light-emitting diodes on brain surface. Nano Energy 2018, 44, 447–455. [Google Scholar] [CrossRef]
  22. Lee, H.E.; Lee, S.H.; Jeong, M.; Shin, J.H.; Ahn, Y.; Kim, D.; Oh, S.H.; Yun, S.H.; Lee, K.J. Trichogenic Photostimulation Using Monolithic Flexible Vertical AlGaInP Light-Emitting Diodes. ACS Nano 2018, 12, 9587–9595. [Google Scholar] [CrossRef] [PubMed]
  23. Lee, H.E.; Choi, J.; Lee, S.H.; Jeong, M.; Shin, J.H.; Joe, D.J.; Kim, D.; Kim, C.W.; Park, J.H.; Lee, J.H.; et al. Monolithic Flexible Vertical GaN Light-Emitting Diodes for a Transparent Wireless Brain Optical Stimulator. Adv. Mater. 2018, 30, 1800649. [Google Scholar] [CrossRef] [PubMed]
  24. Matafonova, G.; Batoev, V. Recent advances in application of UV light-emitting diodes for degrading organic pollutants in water through advanced oxidation processes: A review. Water Res. 2018, 132, 177–189. [Google Scholar] [CrossRef]
  25. Cree Inc. Cree First to Break 300 Lumens-Per-Watt Barrier. Available online: http://www.cree.com/News-and-Events/Cree-News/Press-Releases/2014/March/300LPW-LED-barrier (accessed on 10 July 2018).
  26. Vilber BIO-SUN. Available online: http://www.vilber.de/en/products/uv-instruments/uv-irradiation-systems/bio-sun/ (accessed on 12 December 2018).
  27. Pirc, M.; Topič, M. Light Intensity and Homogeneity of A LED Based Portable UV Light Source For Medical Research. In Proceedings of the 53rd International Conference on Microelectronics, Devices and Materials, Ljubljana, Slovenia, 4–6 October 2017; Bernik, S., Topič, M., Malič, B., Eds.; MIDEM: Ljubljana, Slovenia, 2017; pp. 71–75. [Google Scholar]
  28. Lite-on Technology Corp. UV-A LED LTPL-C034UVH365. Available online: http://optoelectronics.liteon.com/%230%23/Led/LED-Component/Detail/908?param4=18 (accessed on 10 July 2018).
  29. European Commission Health & Consumer Protection Directorate-General. Opinion on Biological Effects of Ultraviolet Radiation Relevant to Health with Particular Reference to Sunbeds for Cosmetic Purposes; European Commission Health & Consumer Protection Directorate-General: Brussel, Belgium, 2006. [Google Scholar]
  30. Pirc, M.; Caserman, S. Comapct UV LED Lamp Measurement and Simulation Data. Available online: https://data.mendeley.com/datasets/wbhpcz67vn/1 (accessed on 20 March 2019).
  31. Kheyrandish, A.; Taghipour, F.; Mohseni, M. UV-LED radiation modeling and its applications in UV dose determination for water treatment. J. Photochem. Photobiol. A Chem. 2018, 352, 113–121. [Google Scholar] [CrossRef]
  32. Vilber VL-6LC. Available online: http://www.vilber.de/en/products/uv-instruments/uv-lamps/filtered-uv-lamps/vl-6lc/ (accessed on 17 December 2018).
  33. Khalil, C.; Shebaby, W. UVB damage onset and progression 24 h post exposure in human-derived skin cells. Toxicol. Rep. 2017, 4, 441–449. [Google Scholar] [CrossRef] [PubMed]
  34. Milleron, R.S.; Bratton, S.B. Heat Shock Induces Apoptosis Independently of Any Known Initiator Caspase-activating Complex. J. Biol. Chem. 2006, 281, 16991–17000. [Google Scholar] [CrossRef] [PubMed] [Green Version]
Figure 1. Geometry of the simulated problem. Vectors N1 and N2 are normals to the LED plane and target surface, respectively. The light beam’s outbound angle at LEDi and incident angle at the point Tj are the same, because the LED plane and the target surface are parallel.
Electronics 08 00343 g001
Figure 2. Relative radiation profile of the UVA LED (LTPL-C034UCH365).
Electronics 08 00343 g002
Figure 3. Block diagram of the UV lamp. The lamp head and the lamp controller are connected by a flat cable.
Electronics 08 00343 g003
Figure 4. (a) A cross-section drawing and (b) a photograph of the portable UV lamp head with a 3 by 6 LED array without the acrylic glass cover. On the right side of the middle row, one LED with its aluminium substrate is missing to better illustrate the design.
Electronics 08 00343 g004
Figure 5. Simulated normalised irradiance of the optimised configuration of the 3 by 6 UVA LED array at a distance of 30 mm. The black line marks the bounds of the usable area. The vertical scale of the graph is limited to a range between 90 and 100% to show the inhomogeneity in greater detail.
Electronics 08 00343 g005
Figure 6. Measured normalised irradiance of the UVA lamp at a distance of 30 mm above the LEDs. The boxplot on the right represents the measured values within the bounds of the black line. The whiskers represent the extremes of the data set.
Electronics 08 00343 g006
Figure 7. Measured normalised irradiance of the UVB lamp at a distance of 30 mm above the LEDs.
Electronics 08 00343 g007
Figure 8. (a) 3D scanned RRP of the UVB LED UF1HA-0F001 and (b) simulated normalised irradiance of the UVB lamp using the newly scanned RRP at a distance of 30 mm above the LEDs.
Electronics 08 00343 g008
Figure 9. Measured normalised irradiance of the UVB lamp with added diffusor at a distance of 30 mm above the LEDs. The boxplot on the right represents the measured values within the bounds of the black line. The whiskers represent the extremes of the data set.
Electronics 08 00343 g009
Figure 10. Normalised spectrum of the UVA (blue lines) and the UVB (magenta lines) lamp. The thin lines are measurements of individual LEDs and the thick line is the average of all the measurements.
Electronics 08 00343 g010
Figure 11. The temperature of the centre microtiter well (a) and ambient temperature (b) during a 120 min illumination period inside an incubator with each of the three lamps. The lamps were switched on at the 0 min mark.
Electronics 08 00343 g011
Figure 12. Infrared images of the UVA LED lamp after 60 min of operation: (a) top view without the acrylic glass cover; (b) top view with cover; (c) side view with cover.
Electronics 08 00343 g012
Figure 13. Infrared images of the UVB LED lamp after 60 min of operation: (a) top view with cover; (b) side view with cover.
Electronics 08 00343 g013
Figure 14. Infrared images of the fluorescent tube-based lamp after 60 min of operation: (a) top view; (b) side view.
Electronics 08 00343 g014
Figure 15. Positioning of the microtiter wells on the UVA (a) and UVB (b) lamp and position-dependent irradiance. The irradiance scale ranges only from 90% to 100%. The white background shows where the irradiance drops below 90%.
Electronics 08 00343 g015
Figure 16. Position-dependent viability signals in a 96-well microtiter plate: (a) Jurkat control signal; (b) HEK-293 control signal; (c) Jurkat irradiated by UVA lamp; (d) HEK-293 irradiated by UVA lamp; (e) Jurkat irradiated by UVB lamp; (f) HEK-293 irradiated by UVB lamp.
Electronics 08 00343 g016aElectronics 08 00343 g016b
Table 1. Theoretical relative output power of individual LEDs in the array for achieving the most homogenous illumination, expressed in percent.
Column123456
Row
110075777775100
2755556565575
310075777775100
Table 2. Actual relative output power of individual LEDs of the UVA lamp after the calibration, expressed in percent.
Column123456
Row
1100.076.274.677.874.6100.0
277.855.658.755.660.379.4
398.477.874.676.273.093.7
Table 3. Actual relative output power of individual LEDs of the UVB lamp after the calibration, expressed in percent.
Column123456
Row
190.584.182.579.479.498.4
279.465.171.474.663.577.8
3100.079.4100.081.082.596.8

