Economic Analysis of Grid-Connected PV System Regulations: A Hungarian Case Study


Abstract
1. Introduction
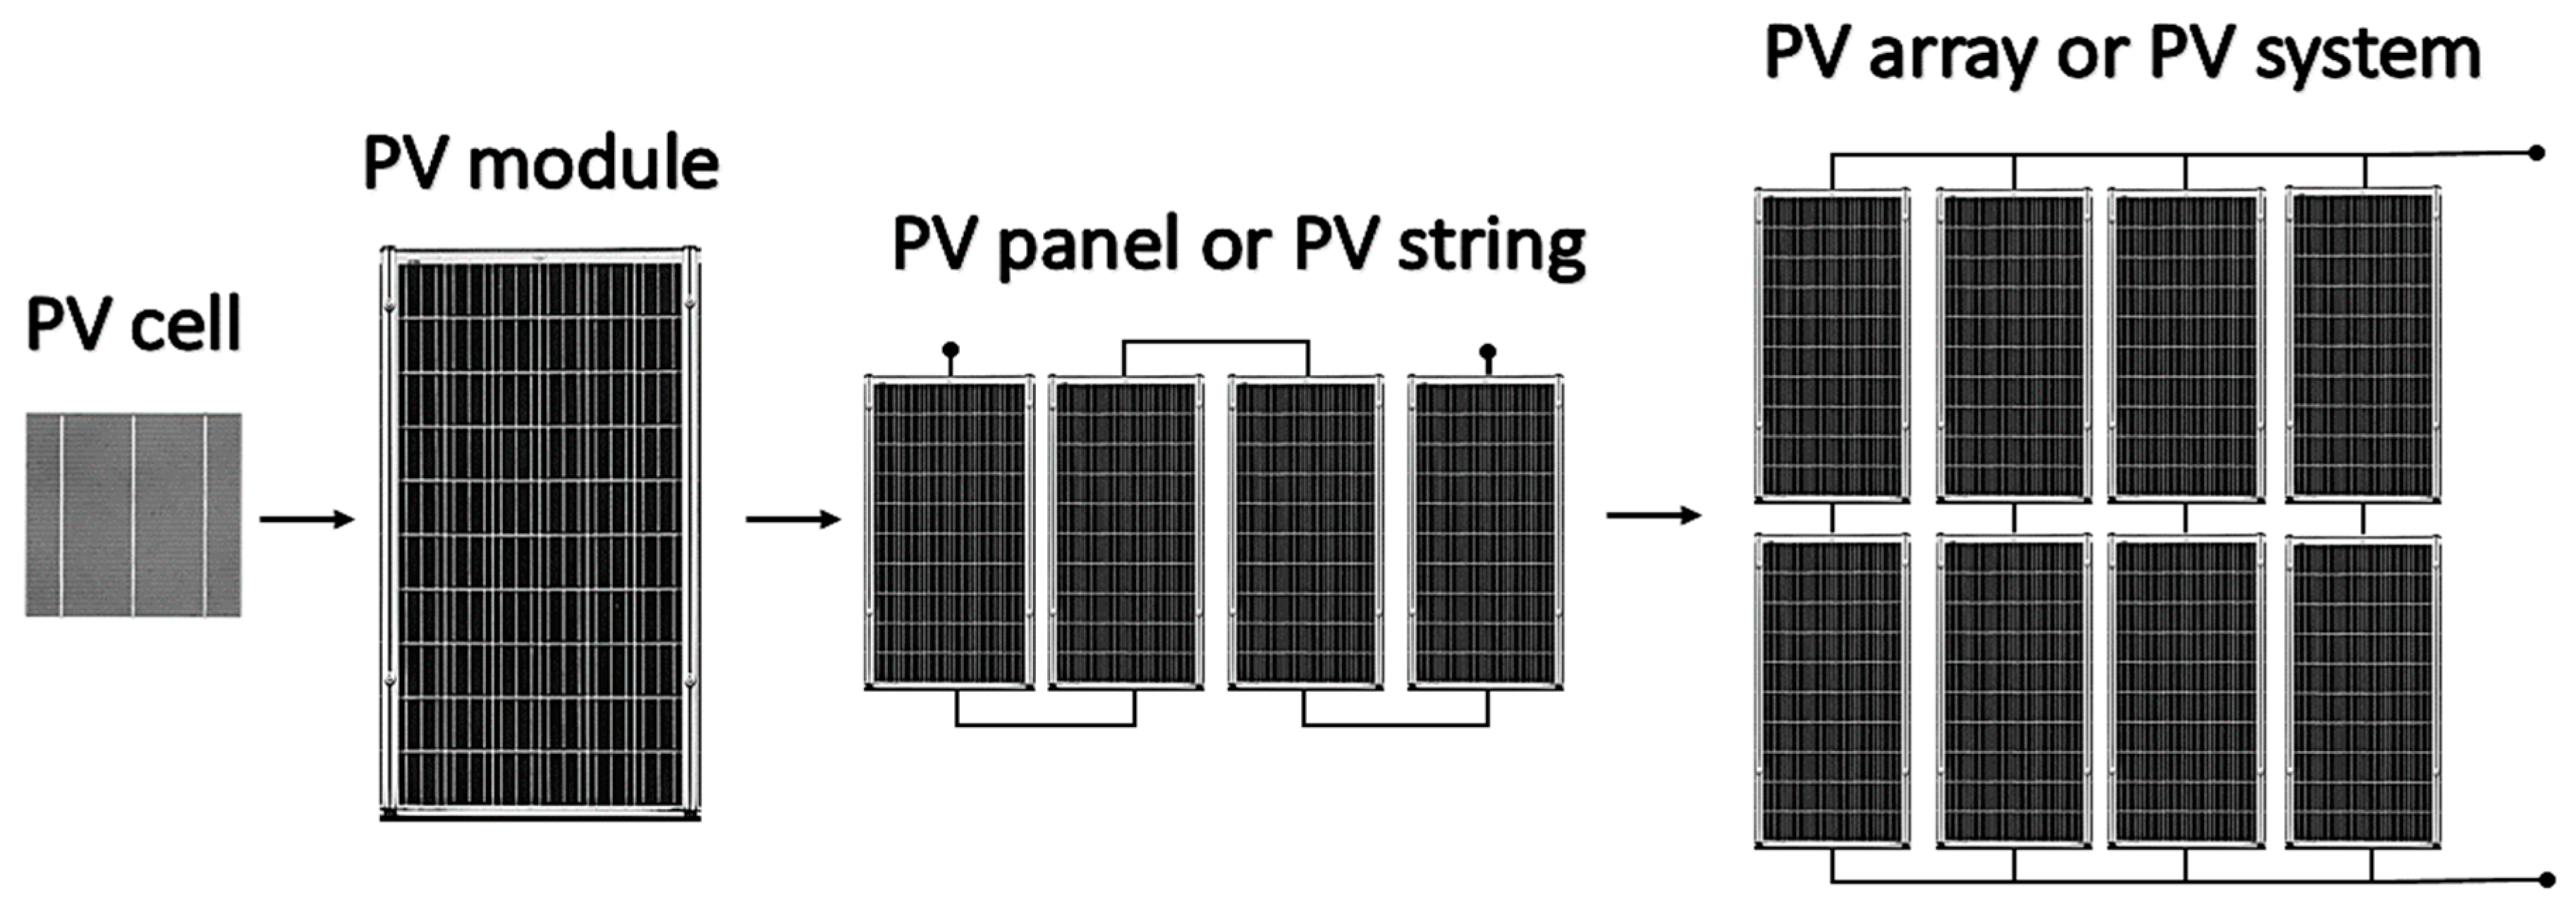
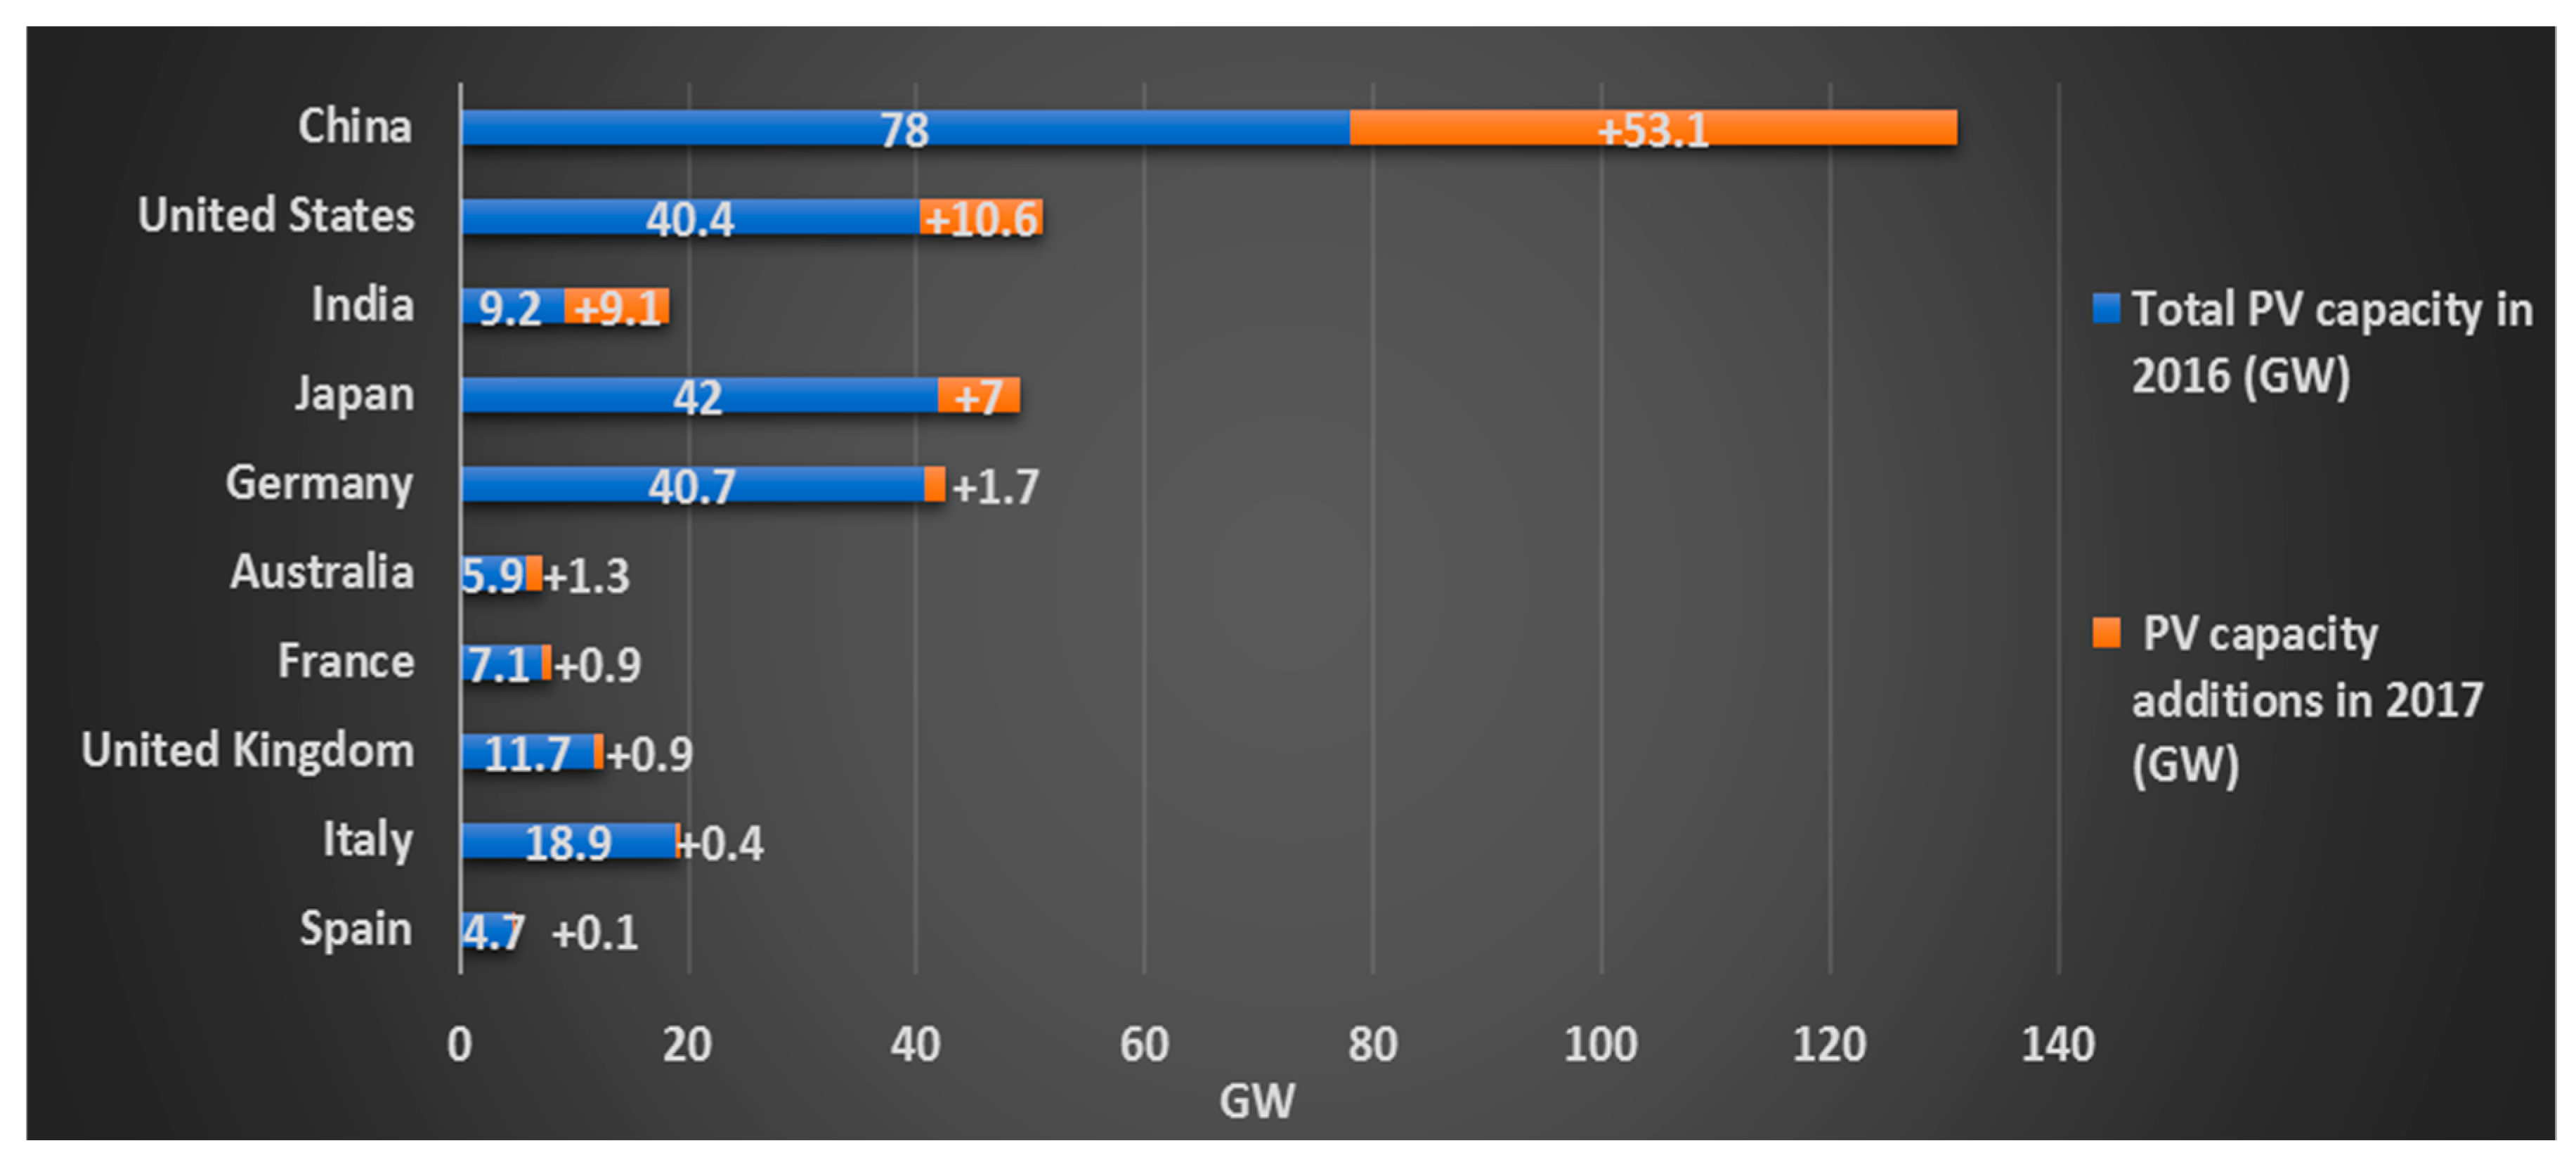
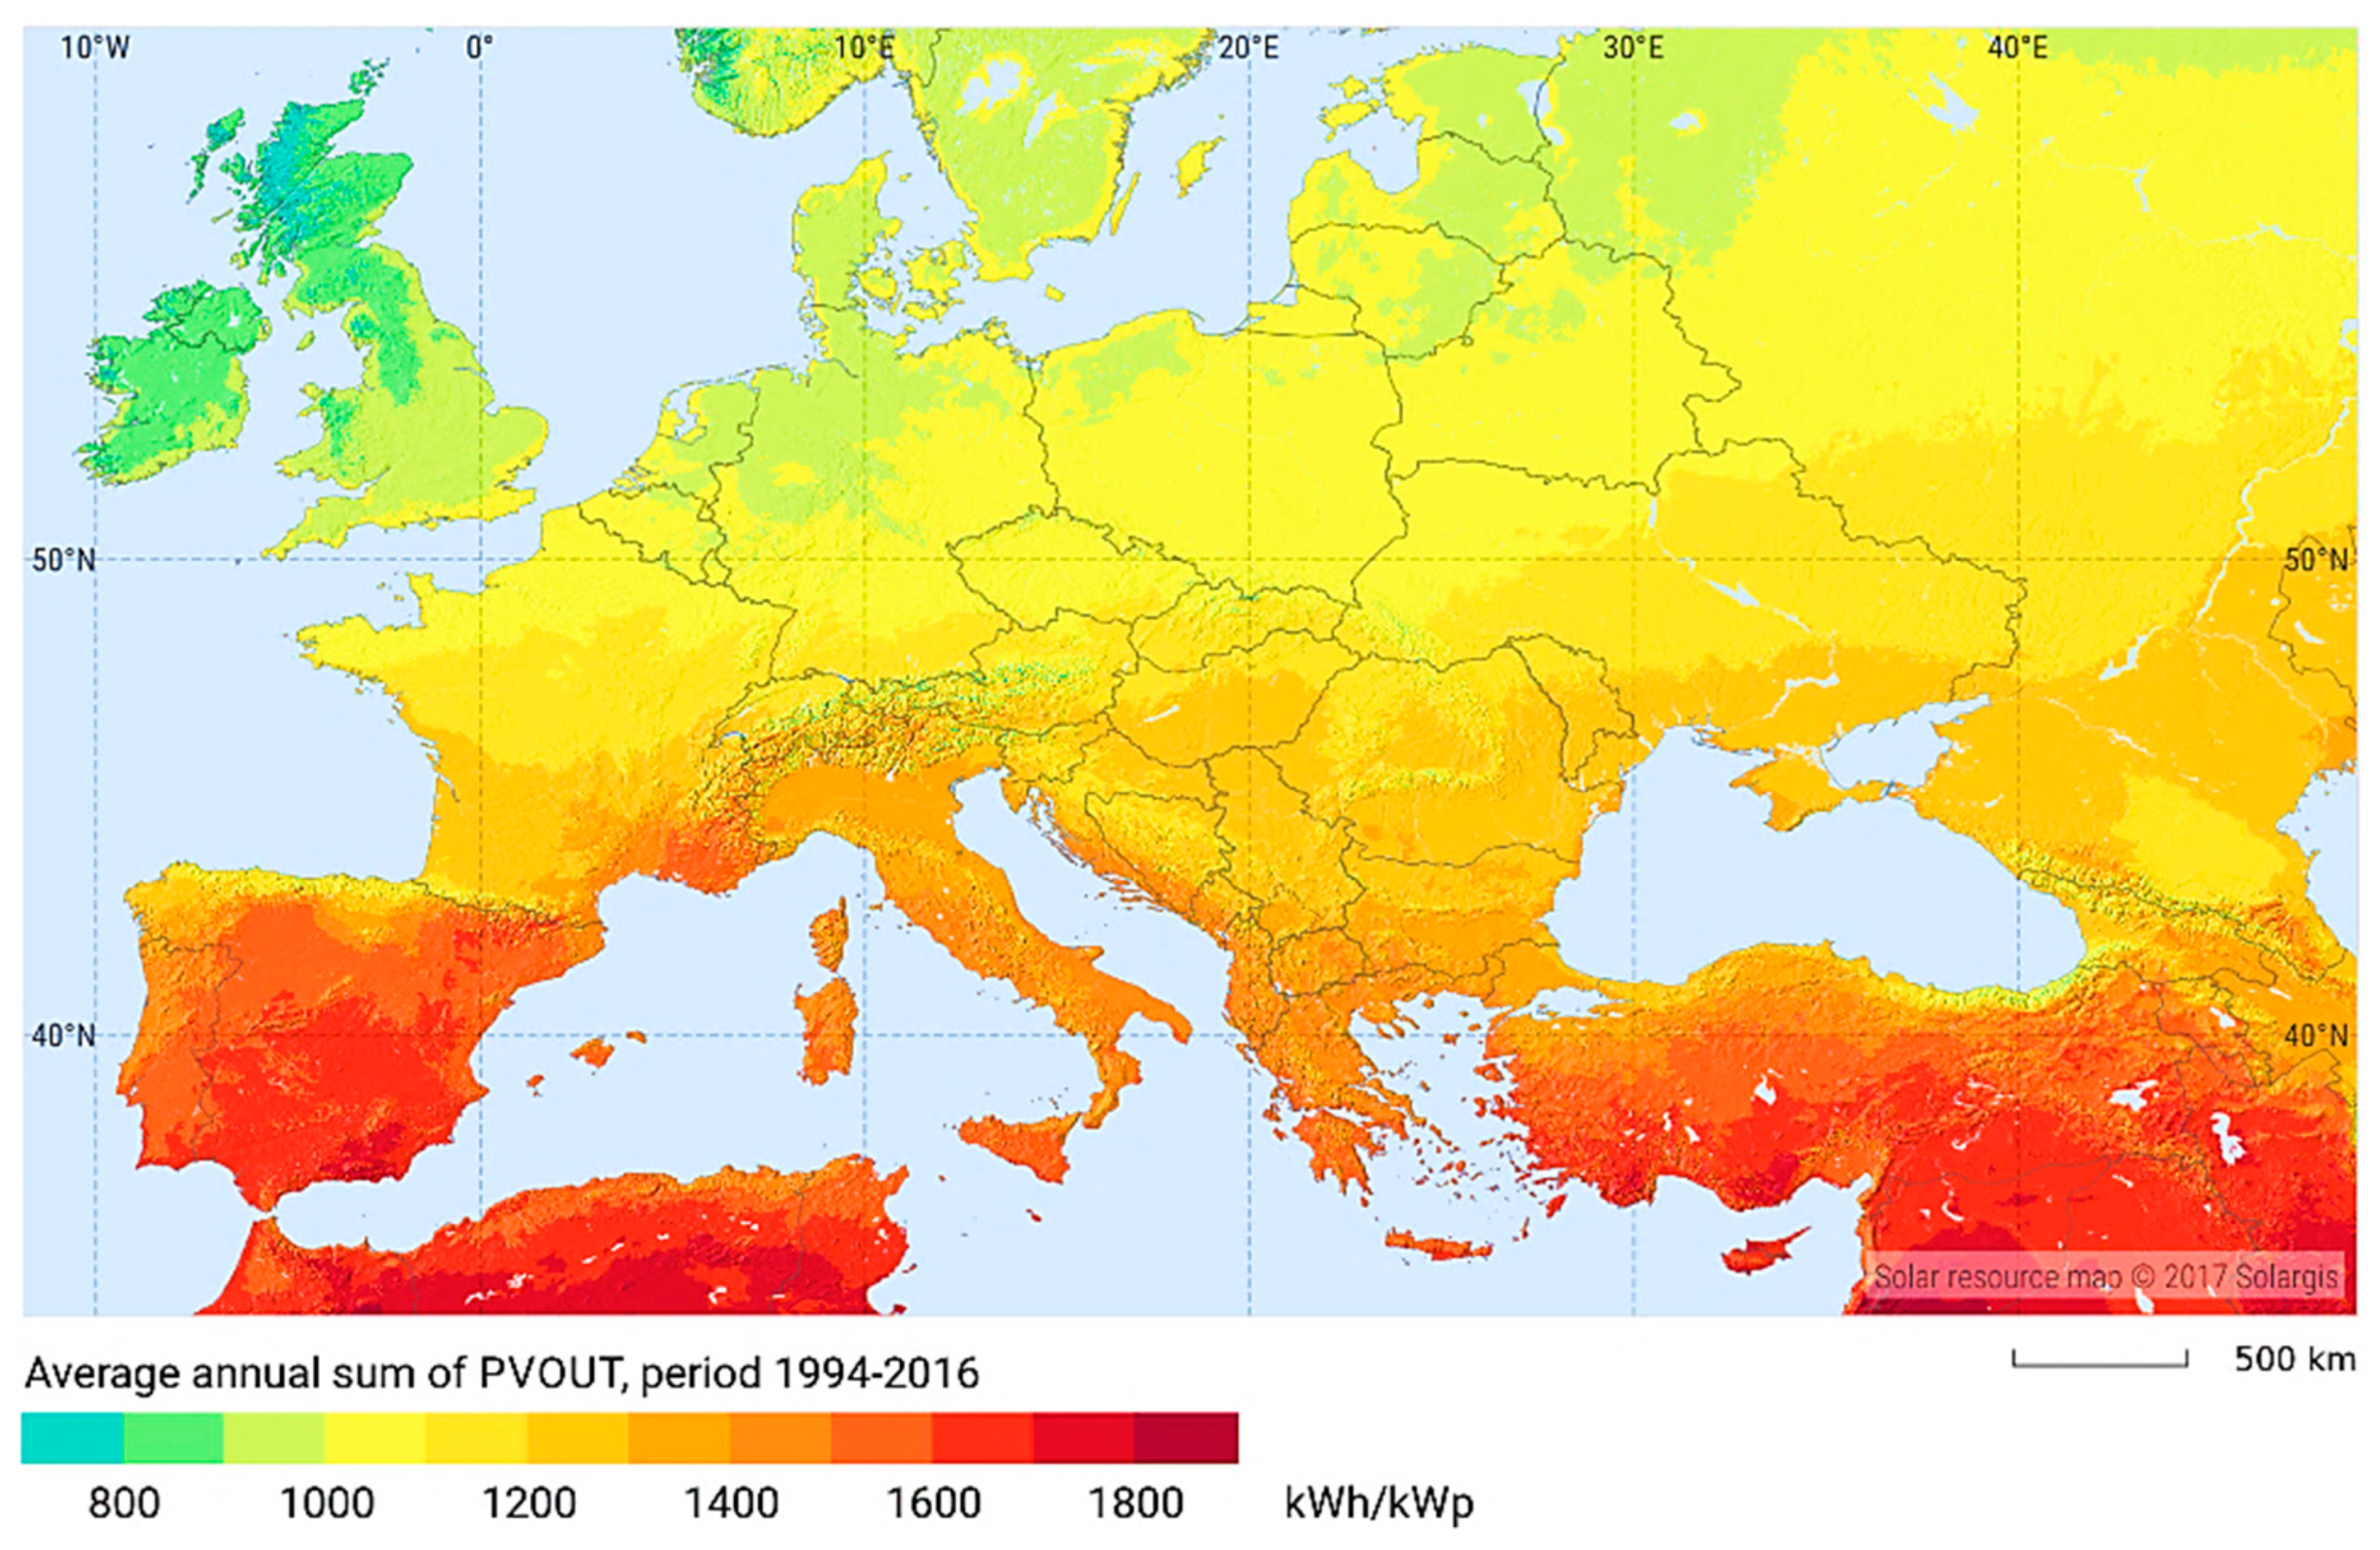
1.1. Changes in the Spreading of Photovoltaic (PV) Technology
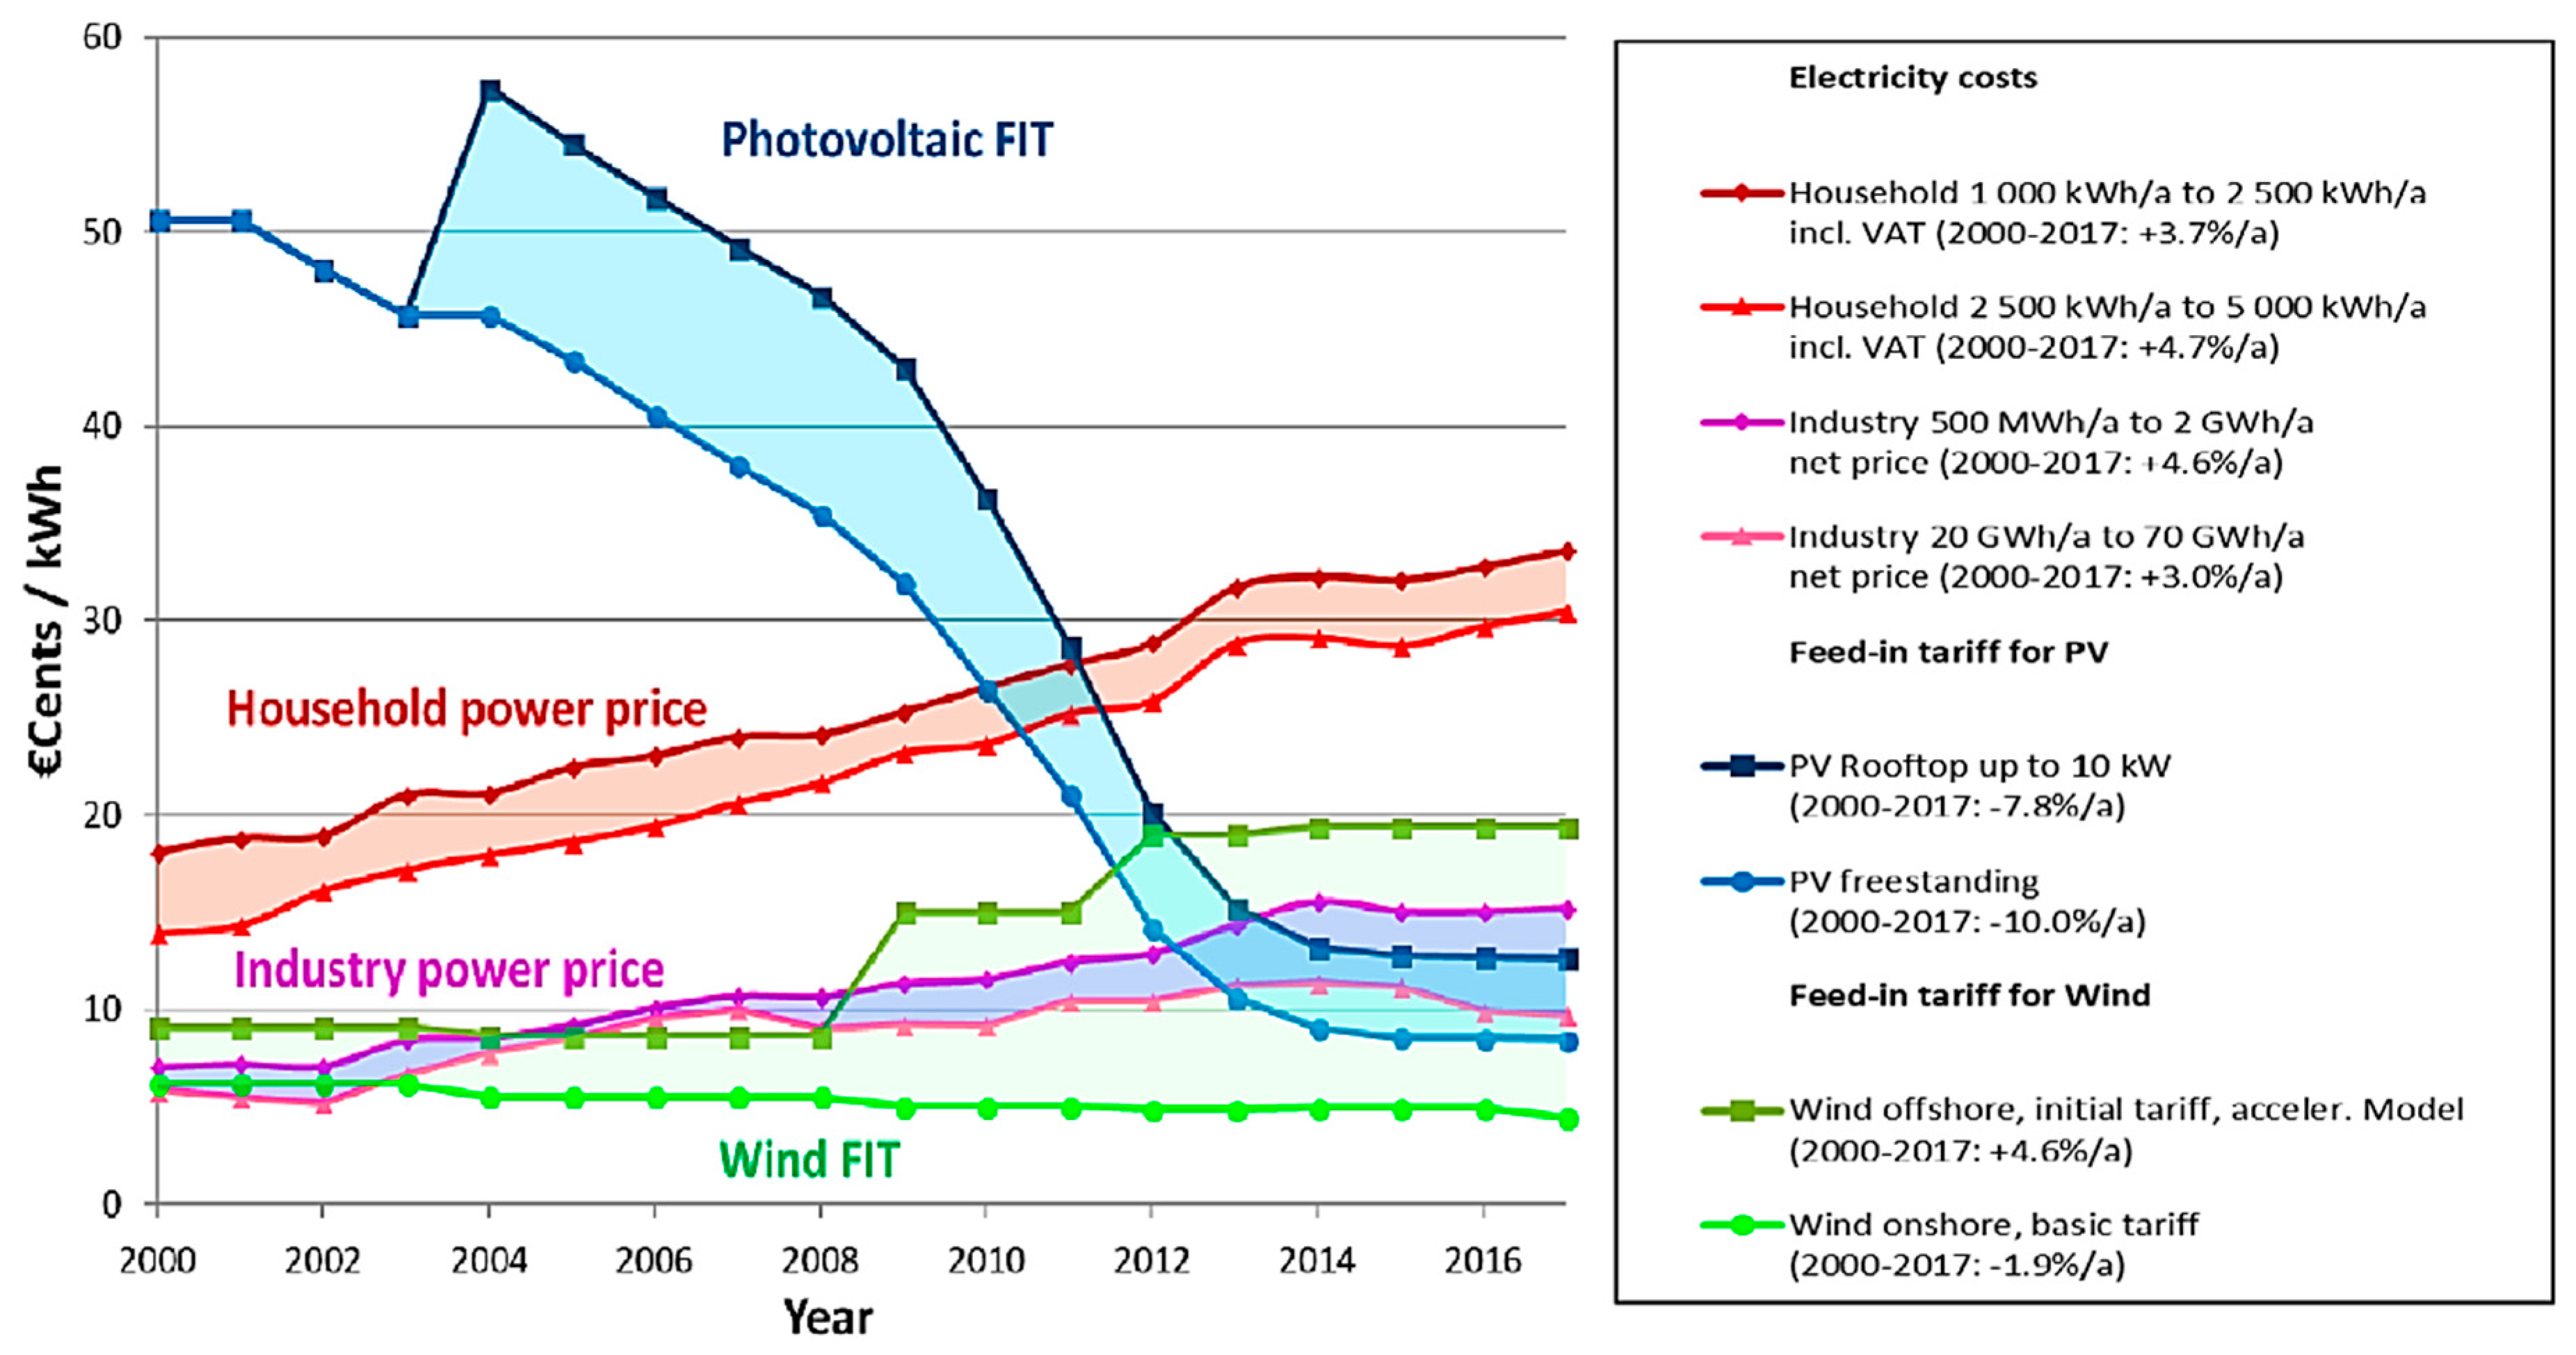
1.2. Feed-in-Tariff (FiT) in Hungary—Overall Summary
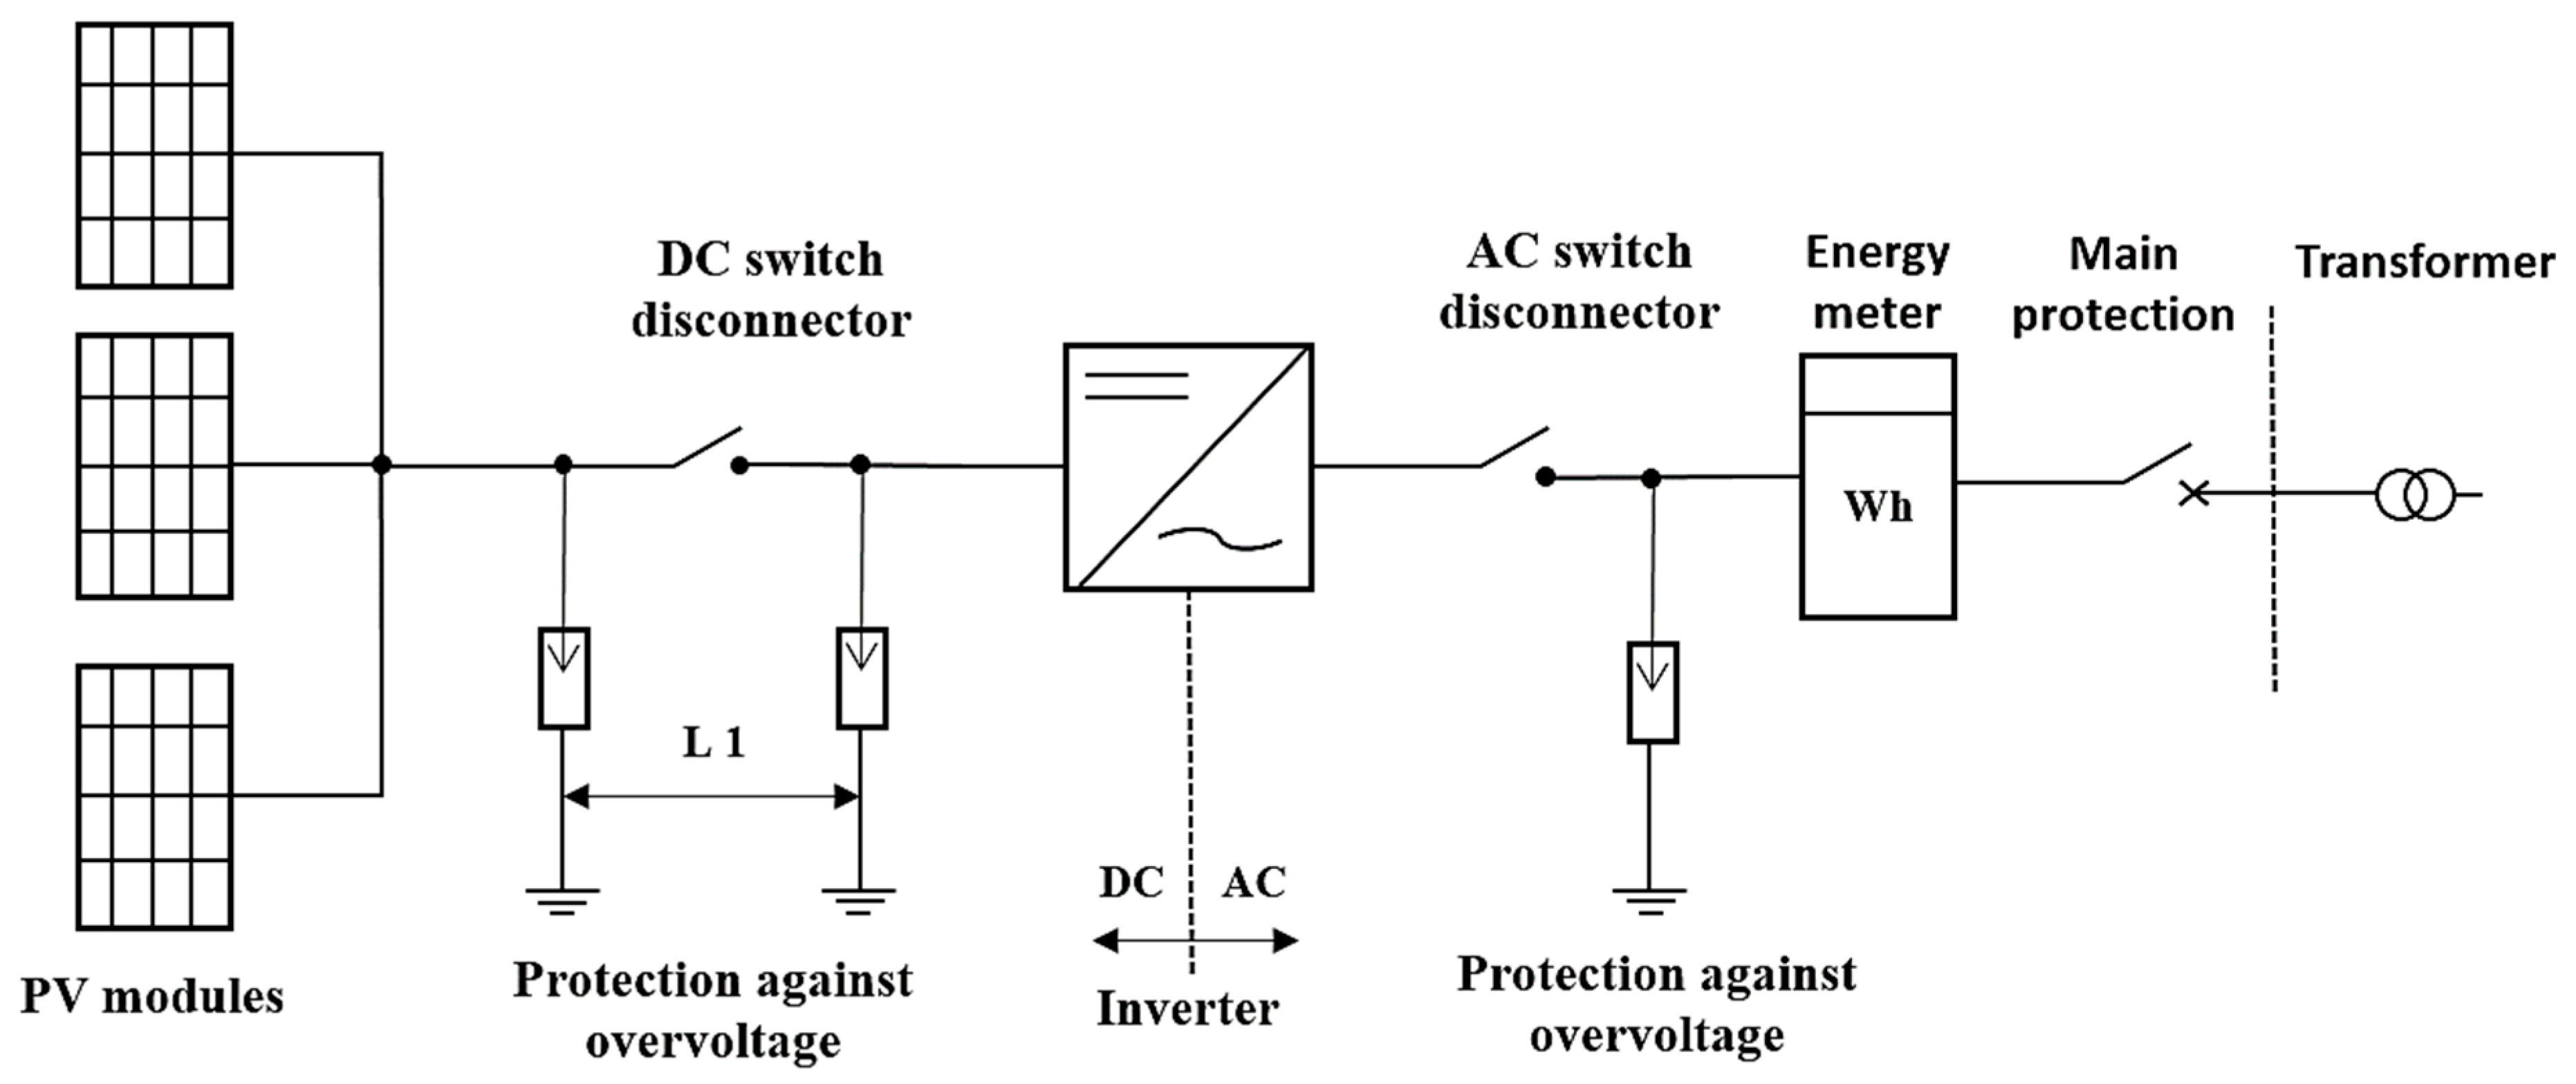
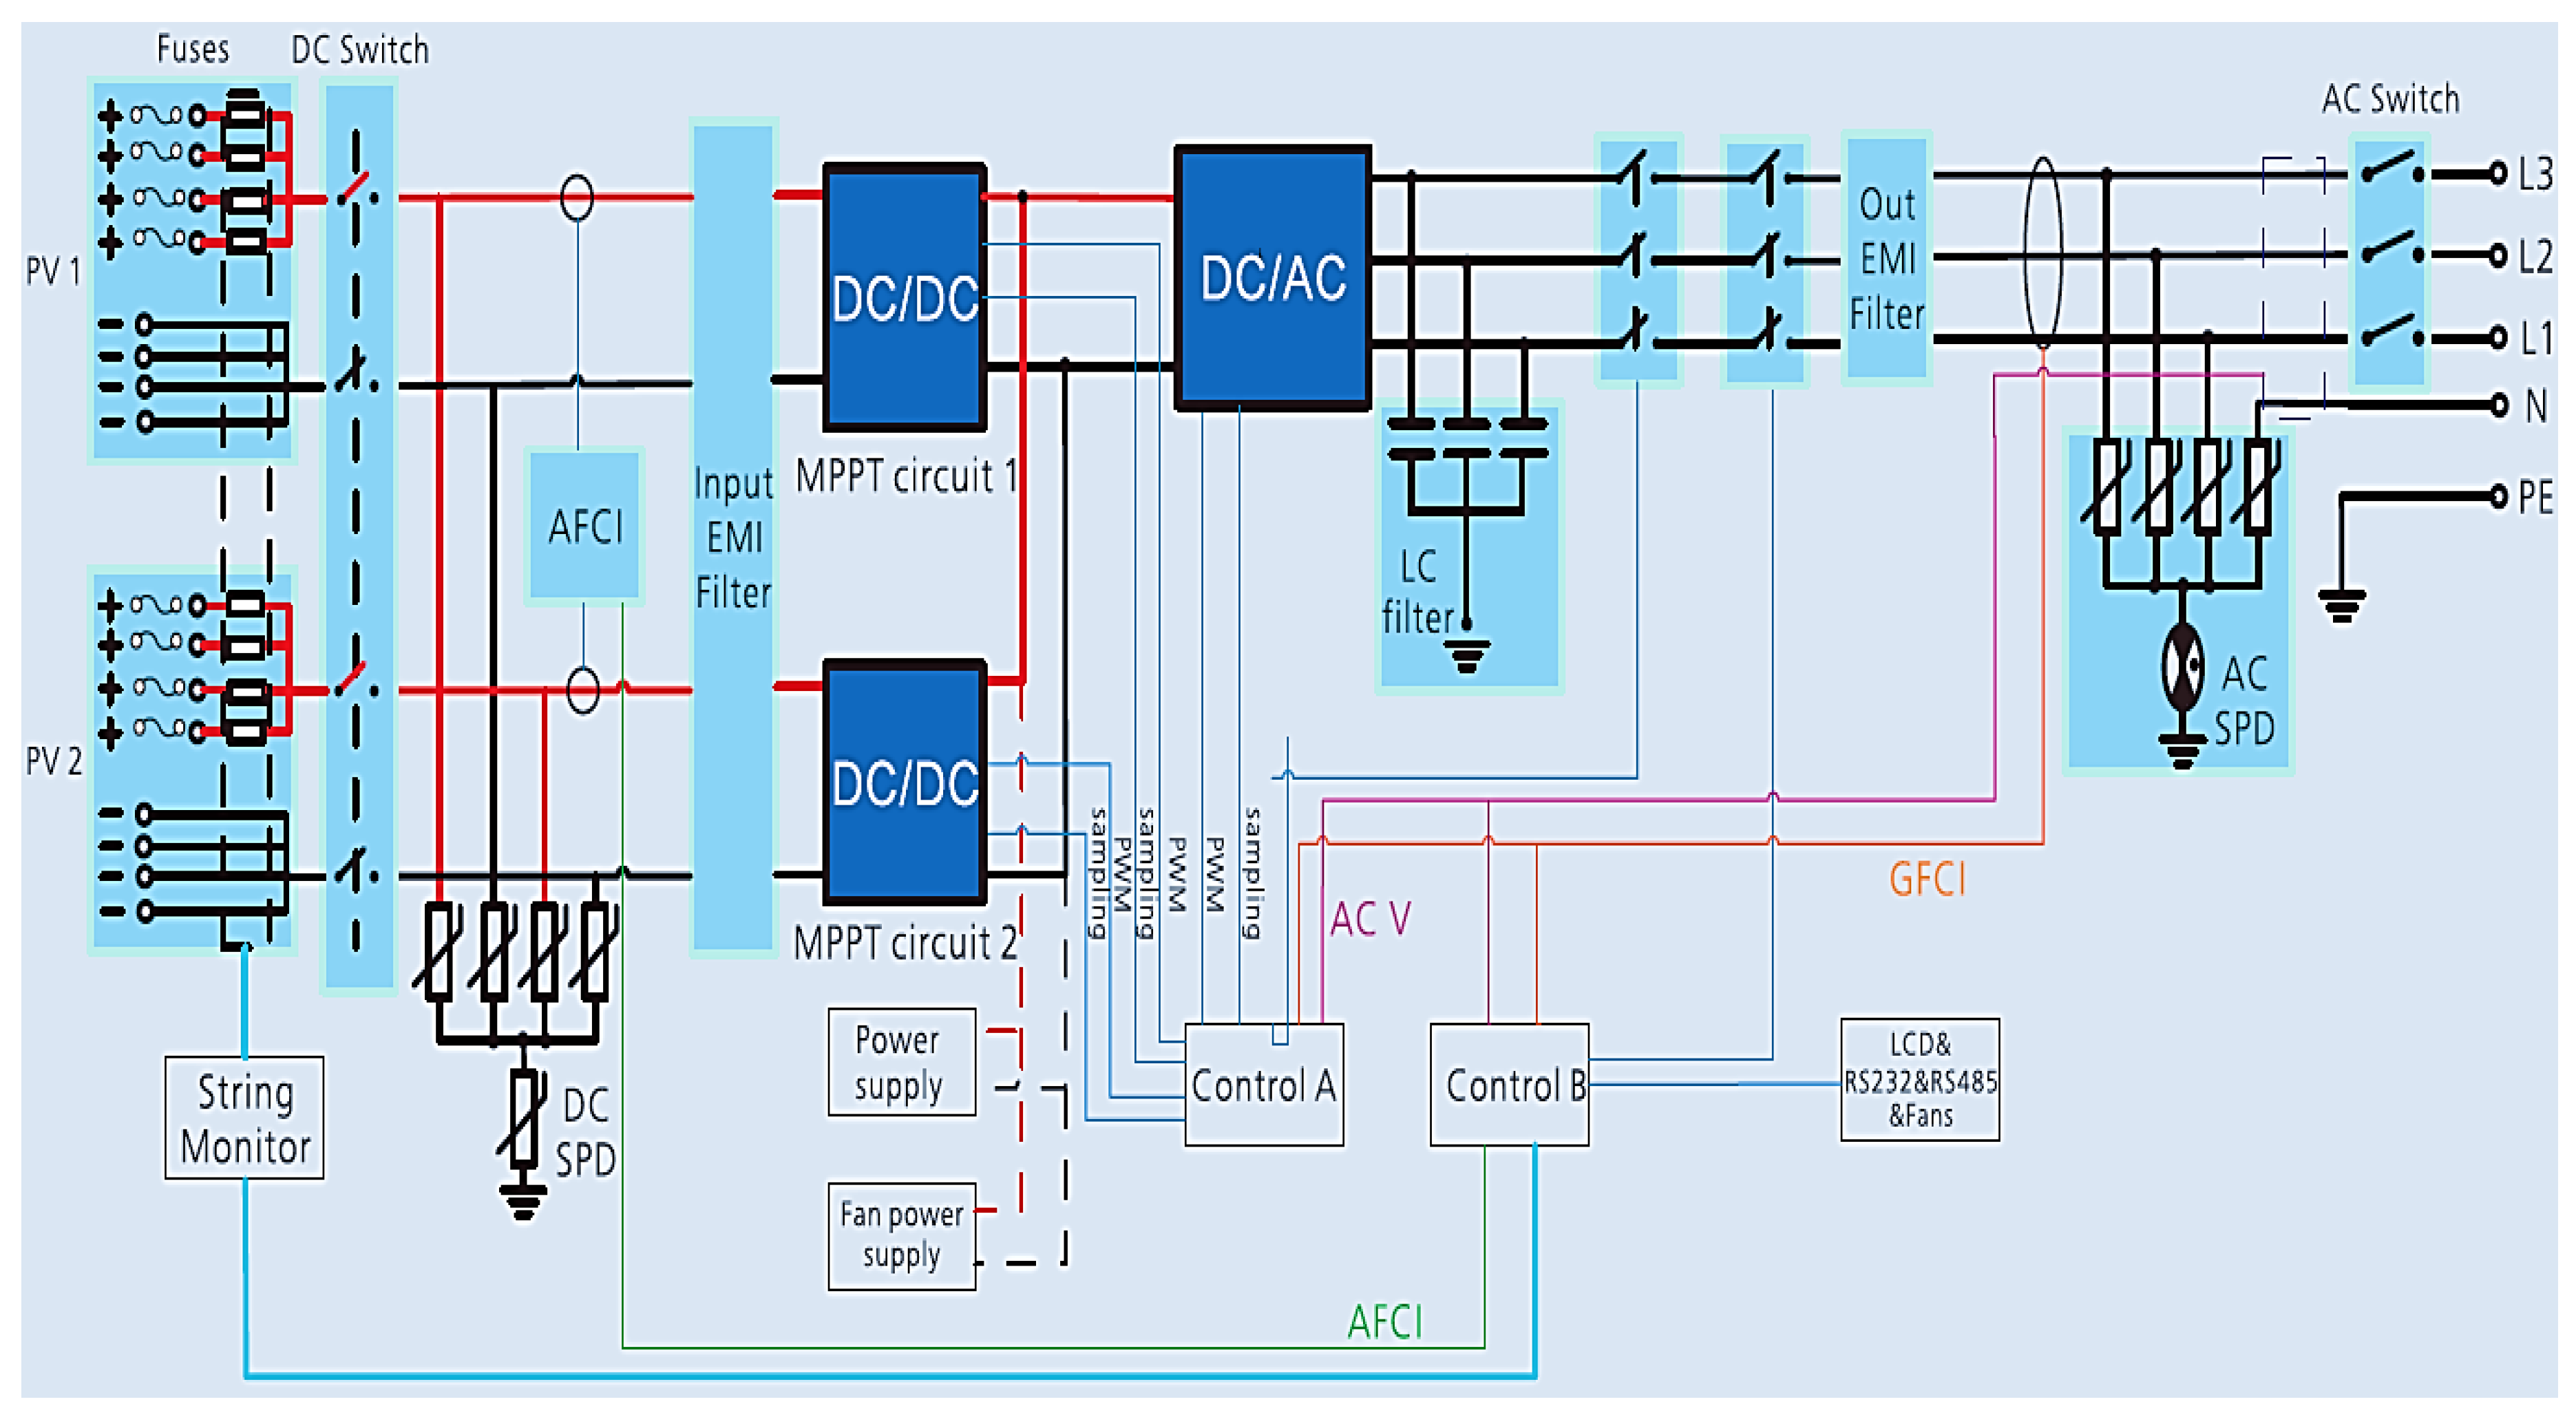
1.3. Popular PV Inverter Technologies and Systems in Hungary
- PV modules, PV-inverter, frames, cable with outlets, AC/DC overcurrent and overvoltage protection, grounding network, additional electric outfit, costs of design, installation and transportation.
2. Material and Methods
Methods and Details of the Technical and Economic Assessment
- a 50 kWp PV system subject to the HMKE regulation (NS + FiT);
- a 500 kWp Small-scale PV system, where feeding into the grid is not allowed (only NS); and
- a 500 kWp PV system subject to the 31.12.2016 KÁT regulation (FiT + FiT bonus) (Table 1).
- This solution makes it possible for investors to use new and more efficient PV technologies every 15 years.
3. Results
The Economic-Technical Aspects of the Examined PV Systems
4. Conclusions
Author Contributions
Acknowledgments
Conflicts of Interest
Abbreviations
| AC | Alternating Current (A) |
| AFCI | Arc Fault Circuit Interrupter (-) |
| a-Si | Amorphous silicon (-) |
| CFtotal | Total cash flow (not discounted) (€) |
| CO&M,total | Total operation and maintenance costs for the duration of the investment (€) |
| Ct | Discounted (net) cash inflow for the duration of investment (€) |
| C0 | Total initial investment costs (€) |
| DC | Direct Current (A) |
| DPP | Discounted payback period (years) |
| E | Annual PV energy output (kWh) |
| E1 | First year, annual PV energy output (kWh) |
| Et | Other years, annual PV energy output (kWh) |
| Etotal | Total PV energy output for the duration of the investment (kWh) |
| EDIOP | Economic Development and Innovation Program (-) |
| EEEOP | Environment and Energy Efficiency Operational Program (-) |
| EMI filter | Electromagnetic interference filter (-) |
| EU | European Union (-) |
| FiT | Feed-in-tariff (€/kWh) |
| FiTtotal | Total feed-in-tariff for the duration of the investment (€/kWh) |
| GFCI | ground fault circuit interrupter (-) |
| HMKE | Household-sized power plants (-) |
| IRR | Internal Rate of Return (%) |
| IS | Investment supports (-) |
| KÁT | Renewable Energy Support Scheme till 31 December 2016 (-) |
| m-Si | Monocrystalline silicon (-) |
| METÁR | Renewable Energy Support Scheme from 1 January 2017 (-) |
| MPPT | Maximum Power Point Tracking (-) |
| NPV | Net present value (€) |
| NS | Net metering system (-) |
| PV | Photovoltaic (-) |
| PWM | Pulse-width modulation (-) |
| p-Si | Polycrystalline silicon (-) |
| PVGIS | JRC Photovoltaic Geographical Information System (-) |
| SPD | Surge Protection Device (-) |
| r | Discount rate (%) |
| VRE | Variable renewable energy (-) |
References
- Dominković, D.F.; Bačeković, I.; Sveinbjörnsson, D.; Pedersen, A.S.; Krajačić, G. On the way towards smart energy supply in cities: The impact of interconnecting geographically distributed district heating grids on the energy system. Energy 2017, 137, 941–960. [Google Scholar] [CrossRef]
- Kordmahaleh, A.A.; Naghashzadegan, M.; Javaherdeh, K.; Khoshgoftar, M. Design of a 25 MWe Solar Thermal Power Plant in Iran with Using Parabolic Trough Collectors and a Two-Tank Molten Salt Storage System. Int. J. Photoenergy 2017, 2017, 1–11. [Google Scholar] [CrossRef]
- Noman, A.M.; Addoweesh, K.E.; Alolah, A.I. Simulation and Practical Implementation of ANFIS-Based MPPT Method for PV Applications Using Isolated Ćuk Converter. Int. J. Photoenergy 2017, 2017, 1–15. [Google Scholar] [CrossRef]
- Daliento, S.; Chouder, A.; Guerriero, P.; Pavan, A.M.; Mellit, A.; Moeini, R.; Tricoli, P. Monitoring, Diagnosis, and Power Forecasting for Photovoltaic Fields: A Review. Int. J. Photoenergy 2017, 2017, 1–13. [Google Scholar] [CrossRef]
- Sefa, İ.; Demirtas, M.; Çolak, İ. Application of one-axis sun tracking system. Energy Convers. Manag. 2009, 50, 2709–2718. [Google Scholar] [CrossRef]
- REN21. Renewables 2018 Global Status Report—REN21; REN21: Paris, France, 2018. [Google Scholar]
- Nengroo, S.; Kamran, M.; Ali, M.; Kim, D.-H.; Kim, M.-S.; Hussain, A.; Kim, H.; Nengroo, S.H.; Kamran, M.A.; Ali, M.U.; et al. Dual Battery Storage System: An Optimized Strategy for the Utilization of Renewable Photovoltaic Energy in the United Kingdom. Electronics 2018, 7, 177. [Google Scholar] [CrossRef]
- Turner, J.A. A realizable renewable energy future. Science 1999, 285, 687–689. [Google Scholar] [CrossRef]
- Lin, A.; Lu, M.; Sun, P.; Lin, A.; Lu, M.; Sun, P. The Influence of Local Environmental, Economic and Social Variables on the Spatial Distribution of Photovoltaic Applications across China’s Urban Areas. Energies 2018, 11, 1986. [Google Scholar] [CrossRef]
- Liu, Z.; Wu, D.; Yu, H.; Ma, W.; Jin, G. Field measurement and numerical simulation of combined solar heating operation modes for domestic buildings based on the Qinghai–Tibetan plateau case. Energy Build. 2018, 167, 312–321. [Google Scholar] [CrossRef]
- Alsafasfeh, M.; Abdel-Qader, I.; Bazuin, B.; Alsafasfeh, Q.; Su, W. Unsupervised Fault Detection and Analysis for Large Photovoltaic Systems Using Drones and Machine Vision. Energies 2018, 11, 2252. [Google Scholar] [CrossRef]
- Hosenuzzaman, M.; Rahim, N.A.; Selvaraj, J.; Hasanuzzaman, M.; Malek, A.B.M.A.; Nahar, A. Global prospects, progress, policies, and environmental impact of solar photovoltaic power generation. Renew. Sustain. Energy Rev. 2015, 41, 284–297. [Google Scholar] [CrossRef]
- Roth, W. General concepts of photovoltaic power supply systems. Fraunhofer Inst. Sol. Energy Syst. ISE 2005, 1–23. [Google Scholar]
- Kumar Sahu, B. A study on global solar PV energy developments and policies with special focus on the top ten solar PV power producing countries. Renew. Sustain. Energy Rev. 2015, 43, 621–634. [Google Scholar] [CrossRef]
- Zsiborács, H.; Pályi, B.; Pintér, G.; Popp, J.; Balogh, P.; Gabnai, Z.; Pető, K.; Farkas, I.; Baranyai, N.H.; Bai, A. Technical-economic study of cooled crystalline solar modules. Sol. Energy 2016, 140. [Google Scholar] [CrossRef]
- Benick, J.; Richter, A.; Muller, R.; Hauser, H.; Feldmann, F.; Krenckel, P.; Riepe, S.; Schindler, F.; Schubert, M.C.; Hermle, M.; et al. High-Efficiency n-Type HP mc Silicon Solar Cells. IEEE J. Photovolt. 2017, 7, 1171–1175. [Google Scholar] [CrossRef]
- Cosme, I.; Cariou, R.; Chen, W.; Foldyna, M.; Boukhicha, R.; Roca i Cabarrocas, P.; Lee, K.D.; Trompoukis, C.; Depauw, V. Lifetime assessment in crystalline silicon: From nanopatterned wafer to ultra-thin crystalline films for solar cells. Sol. Energy Mater. Sol. Cells 2015, 135, 93–98. [Google Scholar] [CrossRef]
- Green, M.A.; Emery, K.; Hishikawa, Y.; Warta, W.; Dunlop, E.D. Solar cell efficiency tables (version 48). Prog. Photovolt. Res. Appl. 2016, 24, 905–913. [Google Scholar] [CrossRef]
- Green, M.A.; Hishikawa, Y.; Dunlop, E.D.; Levi, D.H.; Hohl-Ebinger, J.; Ho-Baillie, A.W.Y. Solar cell efficiency tables (version 51). Prog. Photovoltaics. Res. Appl. 2018, 26, 3–12. [Google Scholar] [CrossRef]
- International Energy Agency. Technology Roadmap Solar Photovoltaic Energy, 2014th ed.; International Energy Agency: Paris, France, 2014; pp. 1–60. [Google Scholar]
- Krempasky, J. Semiconductors, Questions & Answers; Technical Publishing House: Budapest, Hungary, 1977. [Google Scholar]
- Panasonic Corporation. Solar Cell Achieves World’s Highest Energy Conversion Efficiency of 25.6% at Research Level. Available online: http://news.panasonic.com/global/press/data/2014/04/en140410-4/en140410-4.html (accessed on 20 February 2018).
- Verlinden, P.; Deng, W.; Zhang, X.; Yang, Y.; Xu, J.; Shu, Y.; Quan, P.; Sheng, J.; Zhang, S.; Bao, J. Strategy development and mass production of high-efficiency crystalline Si PV modules. In Proceedings of the 6th World Conference on Photovoltaic Energy Conversion, Kyoto, Japan, 23–27 November 2014. [Google Scholar]
- Zsiborács, H.; Pályi, B.; Baranyai, H.N.; Veszelka, M.; Farkas, I.; Pintér, G. Energy performance of the cooled amorphous silicon photovoltaic (PV) technology. Idojaras 2016, 120, 415–430. [Google Scholar]
- SecondSol Inc. New and Used PV Module Prices. Available online: https://www.secondsol.com/en/categories/Photovoltaic-Modules_40939 (accessed on 7 November 2018).
- Matsui, T.; Sai, H.; Suezaki, T.; Matsumoto, M.; Saito, K.; Yoshida, I.; Kondo, M. Development of Highly Stable and Efficient Amorphous Silicon Based Solar Cells. In Proceedings of the European Photovoltaic Solar Energy Conference and Exhibition, Villepinte, France, 30 September–4 October 2013; pp. 2213–2217. [Google Scholar] [CrossRef]
- ÖKO-HAUS GmbH. Information on the Prices of A-Si Solar Modules, Price Quotation. Available online: https://www.oeko-haus.com/ (accessed on 19 February 2018).
- Enjavi-Arsanjani, M.; Hirbodi, K.; Yaghoubi, M. Solar Energy Potential and Performance Assessment of CSP Plants in Different Areas of Iran. Energy Procedia 2015, 69, 2039–2048. [Google Scholar] [CrossRef]
- Statista, I. Cumulative Solar Photovoltaic Capacity Globally as of 2017, by Select Country. Available online: https://www.statista.com/statistics/264629/existing-solar-pv-capacity-worldwide/ (accessed on 12 September 2018).
- REN21. Renewable Energy Policy Network for the 21st Century Renewables 2017 Global Status Report—REN21; REN21: Paris, France, 2017; pp. 1–302. [Google Scholar]
- PV Magazine. Spain’s Grid-Connected PV Capacity Reaches 4.72 GW. Available online: https://www.pv-magazine.com/2017/07/13/spains-grid-connected-pv-capacity-reaches-4-72-gw/ (accessed on 9 November 2018).
- PV Magazine. The Rebirth of Spain’s Solar Sector: 135 MW of New PV Systems Installed in 2017. Available online: https://www.pv-magazine.com/2018/02/06/the-rebirth-of-spains-solar-sector-135-mw-of-new-pv-systems-installed-in-2017/ (accessed on 9 November 2018).
- PV Magazine. France’s PV Capacity Tops 7.13 GW. Available online: https://www.pv-magazine.com/2017/03/01/frances-pv-capacity-tops-7-13-gw/ (accessed on 9 November 2018).
- PV Magazine. Italy Installed 369 MW of New PV Systems in 2016. Available online: https://www.pv-magazine.com/2017/03/02/italy-installed-369-mw-of-new-pv-systems-in-2016/ (accessed on 9 November 2018).
- PV Magazine. Hungary to See Record PV Growth in 2018. Available online: https://www.pv-magazine.com/2018/09/12/hungary-to-see-record-pv-growth-in-2018/ (accessed on 11 November 2018).
- Vokas, G.A.; Zoridis, G.C.; Lagogiannis, K.V. Single and Dual Axis PV Energy Production Over Greece: Comparison Between Measured and Predicted Data. Energy Procedia 2015, 74, 1490–1498. [Google Scholar] [CrossRef]
- Eke, R.; Senturk, A. Performance comparison of a double-axis sun tracking versus fixed PV system. Sol. Energy 2012, 86, 2665–2672. [Google Scholar] [CrossRef]
- Rena Projekt Kft. 500 kW Small-Scale or KÁT PV System System Technical Information’s and Prices in Hungary. Available online: https://renasolar.hu/arak.html (accessed on 7 November 2018).
- Solargis.com. Solar Resource Maps and GIS Data for 200+ Countries. Available online: https://solargis.com/products/maps-and-gis-data/download/ (accessed on 4 February 2018).
- Bai, A.; Popp, J.; Balogh, P.; Gabnai, Z.; Pályi, B.; Farkas, I.; Pintér, G.; Zsiborács, H. Technical and economic effects of cooling of monocrystalline photovoltaic modules under Hungarian conditions. Renew. Sustain. Energy Rev. 2016, 60, 1086–1099. [Google Scholar] [CrossRef]
- Fraunhofer Institute for Solar Energy Systems. Photovoltaics Report; Fraunhofer Institute for Solar Energy Systems: Freiburg, Germany, 2018. [Google Scholar]
- La Monaca, S.; Ryan, L. Solar PV where the sun doesn’t shine: Estimating the economic impacts of support schemes for residential PV with detailed net demand profiling. Energy Policy 2017, 108, 731–741. [Google Scholar] [CrossRef]
- European Commission. RES LEGAL Europe. Available online: http://www.res-legal.eu/ (accessed on 13 November 2018).
- Coria, G.; Penizzotto, F.; Pringles, R. Economic analysis of photovoltaic projects: The Argentinian renewable generation policy for residential sectors. Renew. Energy 2018. [Google Scholar] [CrossRef]
- European Commission. Legal Sources on Renewable Energy—Hungary. Available online: http://www.res-legal.eu/en/search-by-country/hungary/ (accessed on 2 February 2018).
- Sorknæs, P.; Djørup, S.R.; Lund, H.; Thellufsen, J.Z. Quantifying the influence of wind power and photovoltaic on future electricity market prices. Energy Convers. Manag. 2019, 180, 312–324. [Google Scholar] [CrossRef]
- Pintér, G.; Baranyai, N.H.; Wiliams, A.; Zsiborács, H. Study of photovoltaics and LED energy efficiency: Case study in Hungary. Energies 2018, 11. [Google Scholar] [CrossRef]
- Hungarian Transmission System Operator—MAVIR ZRt. Useful Documents to KÁT System. Available online: https://www.mavir.hu/web/mavir/ugyfelszolgalat (accessed on 2 February 2018).
- E.ON Hungária Zrt. House-Hold-Sized Power Plants (HMKE). Available online: http://energia.eon.hu/hmke/# (accessed on 2 February 2018).
- Information about the Small-Scale PV System Tiszta Energiák Kft. Available online: https://www.tisztaenergiak.hu/ (accessed on 11 October 2018).
- D’Adamo, I. The Profitability of Residential Photovoltaic Systems. A New Scheme of Subsidies Based on the Price of CO2 in a Developed PV Market. Soc. Sci. 2018, 7, 148. [Google Scholar] [CrossRef]
- Silvestre, S.; Chouder, A.; Karatepe, E. Automatic fault detection in grid connected PV systems. Sol. Energy 2013, 94, 119–127. [Google Scholar] [CrossRef]
- Dinçer, F. The analysis on photovoltaic electricity generation status, potential and policies of the leading countries in solar energy. Renew. Sustain. Energy Rev. 2011, 15, 713–720. [Google Scholar] [CrossRef]
- Yu, B. An Improved Frequency Measurement Method from the Digital PLL Structure for Single-Phase Grid-Connected PV Applications. Electronics 2018, 7, 150. [Google Scholar] [CrossRef]
- Su, M.; Luo, C.; Hou, X.; Yuan, W.; Liu, Z.; Han, H.; Guerrero, J.; Su, M.; Luo, C.; Hou, X.; et al. A Communication-Free Decentralized Control for Grid-Connected Cascaded PV Inverters. Energies 2018, 11, 1375. [Google Scholar] [CrossRef]
- Kouro, S.; Leon, J.I.; Vinnikov, D.; Franquelo, L.G. Grid-Connected Photovoltaic Systems: An Overview of Recent Research and Emerging PV Converter Technology. IEEE Ind. Electron. Mag. 2015, 9, 47–61. [Google Scholar] [CrossRef]
- Li, H.; Wen, C.; Chao, K.-H.; Li, L.-L. Research on Inverter Integrated Reactive Power Control Strategy in the Grid-Connected PV Systems. Energies 2017, 10, 912. [Google Scholar] [CrossRef]
- PJP Napelem Kft. 50 kW HMKE System Technical Information’s and Prices in Hungary. Available online: https://www.ppnapelem.hu/napelem/50-kwp-napelem-rendszer (accessed on 7 November 2018).
- Euronorm Group Builder Kft. PV System Installation Prices. Available online: http://ceginformacio.creditreform.hu/cr9317990317 (accessed on 4 February 2018).
- PV Europe. Solar Inverter Ranking: Huawei, Sungrow and SMA Leading. Available online: https://www.pveurope.eu/News/Solar-Generator/Solar-inverter-ranking-Huawei-Sungrow-and-SMA-leading (accessed on 11 November 2018).
- SMA Solar Technology AG. PV System in Hungary, 1,945.01 kWp, Berettyóújfalu_13. Available online: https://www.sunnyportal.com/Templates/PublicPageOverview.aspx?page=3bb31f01-cf47-49f8-852f-11ea28e0bd1c&plant=3a1a11db-35f9-41d5-9837-56c4ac252d90&splang=en-US (accessed on 11 November 2018).
- SMA Solar Technology AG. PV System in Hungary, 50.00 kWp, Vojth Kft. Debrecen. Available online: https://www.sunnyportal.com/Templates/PublicPageOverview.aspx?page=560b2a23-0daa-4eaa-a7d3-5305113bb00c&plant=6f8eb384-86b6-46b3-969c-1ae91ecfb9bd&splang=en-US (accessed on 11 November 2018).
- SMA Solar Technology AG. PV System in Hungary, 1.19 kWp, Anlage Ungarn Willi Sturm. Available online: https://www.sunnyportal.com/Templates/PublicPageOverview.aspx?page=78aac4f6-dc0b-48a3-8b36-2c49d6492f97&plant=56cef609-9f8a-4b2b-8369-aa7b14b29eee&splang=en-US (accessed on 11 November 2018).
- E.ON Hungária Zrt. House-Hold-Sized Power Plants (HMKE), Frequently Asked Questions. Available online: http://energia.eon.hu/hmke/gyik (accessed on 2 February 2018).
- EU-Solar Zrt. House-Hold-Sized Power Plants (HMKE), Information’s and Regulations. Available online: http://www.growatt.hu/engedelyeztetes/e-on/ (accessed on 12 November 2018).
- Villamosterv Kft. Small-Scale PV System Technical Information and Design Features; Villamosterv Kft: Dombóvár, Hungary, 2018. [Google Scholar]
- E.ON Hungária Zrt. Household-Size Power Plants (HMKE) Documentation; E.ON Hungária Zrt: Budapest, Hungary, 2018. [Google Scholar]
- Growatt New Energy Technology Co., Ltd. Growatt 30000TL3-S/33000TL3-S/40000TL3-NS/50000TL3; Growatt New Energy Technology Co., Ltd.: Shenzhen, China, 2018. [Google Scholar]
- EU-Solar Zrt. General Information about Growatt Inverters. Available online: http://www.growatt.hu/ (accessed on 20 December 2018).
- BAU-CONSULTING Kft. Small-Scale PV System in Kökénypuszta; Official technical description and documentation; BAU-CONSULTING Kft: Pécs, Hungary, 2017. [Google Scholar]
- Green Team Mérnöki Kft. Small-Scale PV System in Kaposvár; Tender design documentation; Green Team Mérnöki Kft: Sajókápolna, Hungary, 2017. [Google Scholar]
- Márton Sándor Balogh. Small-Scale PV System in Zalaegerszeg; Official technical description and documentation; Zala Megyei Büntetés-végrehajtási Intézet: Zalaegerszeg, Hungary, 2016.
- E.ON Hungária Zrt. Small-Scale PV System Technical Information. Available online: https://www.eon.hu/hu/lakossagi/aram/muszaki-ugyek/kiseromuvek-csatlakozasi-lehetsegei.html (accessed on 12 November 2018).
- Lengyel, A. What is the value of the KÁT permission and what can you do with it? In Proceedings of the EU-Solar Conference, Budapest, Hungary, 28 November 2017; pp. 1–19. [Google Scholar]
- Hungarian Transmission System Operator—MAVIR ZRt. KÁT, FiT Information’s. Available online: https://www.mavir.hu/web/mavir/aktualis-informaciok (accessed on 7 November 2018).
- Wolters Kluwer Hungary Kft. KÁT, METÁR, FiT and Bonus Legislation. Available online: https://net.jogtar.hu/jogszabaly?docid=a0700389.kor (accessed on 7 November 2018).
- SMA Solar Technology AG. MV Power Station 500SC/630SC/800SC/900SC/1000SC; SMA Solar Technology AG: Niestetal, Germany, 2018. [Google Scholar]
- SMA Solar Technology AG. MV POWER STATION 4400/4950/5000/5500/6000; SMA Solar Technology AG: Niestetal, Germany, 2018. [Google Scholar]
- SMA Solar Technology AG. MV POWER STATION 2200/2475/2500/2750/3000; SMA Solar Technology AG: Niestetal, Germany, 2018. [Google Scholar]
- Zsiborács, H.; Pályi, B.; Pintér, G.; Baranyai, N.H.; Szabó, P.; Farkas, I. Economic questions and energy performance of the cooled polycrystalline solar photovoltaic (PV) technology. Rev. Agric. Rural Dev. 2016, 5, 162–170. [Google Scholar]
- Kocsis, K.; Schweitzer, F. Hungary in Maps; Geographical Institute, Research Centre for Astronomy and Earth Sciences of the Hungarian Academy of Science: Budapest, Hungary, 2011. [Google Scholar]
- PANNON Pro Innovations Ltd. Practical Experiences of PV Systems. Available online: https://klimainnovacio.hu/en/pannon-pro-innovations (accessed on 2 February 2018).
- Ewiser Forecast Kft. PV Energy Production Forecast. Available online: https://ewiserforecast.com/pv-park-forecast (accessed on 12 November 2018).
- Jordan, D.C.; Kurtz, S.R. Photovoltaic Degradation Rates—An Analytical Review. Prog. Photovoltaic. Res. Appl. 2013, 21, 12–29. [Google Scholar] [CrossRef]
- SecondSol Inc. New and Used Inverter Prices. Available online: https://www.secondsol.com/en/categories/Inverters_40948 (accessed on 7 November 2018).
- Brealey, R.A.; Myers, S.C.; Allen, F.; Mohanty, P. Principles of Corporate Finance; McGraw-Hill/Irwin: New York, NY, USA, 2003. [Google Scholar]
- Investing.com. European Government Bonds Yields. Available online: https://www.investing.com/rates-bonds/european-government-bonds?maturity_from=10&maturity_to=310 (accessed on 2 February 2018).
- Inflation.eu. Historic Inflation Hungary—Historic CPI Inflation Hungary. Available online: http://www.inflation.eu/inflation-rates/hungary/historic-inflation/cpi-inflation-hungary.aspx (accessed on 2 February 2018).
- Hungarian National Bank. Foreign Exchange Rates. Available online: https://www.mnb.hu/arfolyamok (accessed on 7 February 2018).
- E.ON Hungária Zrt. Average Delivery Price for Electric Energy for Business Customer in the HMKE System and in the Small-Scale PV System. Available online: https://www.eon.hu/hu/uzleti/aram/arak-tarifadijak.html (accessed on 2 February 2018).
- European Commission. JRC Photovoltaic Geographical Information System (PVGIS). Available online: http://re.jrc.ec.europa.eu/pvg_tools/en/tools.html#PVP (accessed on 2 February 2018).
- SMA Solar Technology AG. ZMET PV System Profile. Available online: https://www.sunnyportal.com/Templates/PublicPageOverview.aspx?page=96e1e167-9121-42c5-8f5c-bae1923c6a85&plant=a2fa17c6-7f5c-4b13-8a61-3a83f77e5d84&splang=en-US (accessed on 20 February 2018).
- SMA Solar Technology AG. Pitvaros 1 PV System Profile. Available online: https://www.sunnyportal.com/Templates/PublicPageOverview.aspx?page=07f487db-8b6a-4e9c-aa43-7992c5957656&plant=88dd56e3-63c5-4aa6-9926-2a1948b65854&splang=en-US (accessed on 20 December 2018).
- SMA Solar Technology AG. CZK-001 PV System Profile. Available online: https://www.sunnyportal.com/Templates/PublicPageOverview.aspx?page=afeb0fab-f6db-4b82-8782-49ac359e5f13&plant=934c0200-15f1-4e6c-8100-b9f5a02912c0&splang=en-US (accessed on 20 December 2018).
- Corona Energy. How to Calculate Your CO2 Emissions. Available online: https://www.coronaenergy.co.uk/how-to-calculate-co2-emissions/ (accessed on 9 March 2018).
- NIPSCO. LED Street Light Program. Available online: https://www.nipsco.com/our-services/led-streetlights (accessed on 2 February 2018).
- Kacira, M.; Simsek, M.; Babur, Y.; Demirkol, S. Determining optimum tilt angles and orientations of photovoltaic panels in Sanliurfa, Turkey. Renew. Energy 2004, 29, 1265–1275. [Google Scholar] [CrossRef]
- Breyer, C.; Schmid, J. Global Distribution of Optimal Tilt Angles for Fixed Tilted PV Systems. Horizon 2010. [Google Scholar] [CrossRef]
- Almaktar, M.; Abdul Rahman, H.; Hassan, M.Y. Economic Analysis Using Net Present Value and Payback Period: Case Study of a 9kWp Grid-Connected PV System at UTM, Johor Bahru Campus. Appl. Mech. Mater. 2016, 818, 119–123. [Google Scholar] [CrossRef]
- Brealey, R.A.; Myers, S.C.; Allen, F. Principles of Corporate Finance; McGraw-Hill/Irwin: New York, NY, USA, 2008; ISBN 0073405108. [Google Scholar]
- Vulcano Energia. Keszthely City Hospital PV System. Available online: http://www.napelem-napkollektorok.hu/hirek/keszthely-varosi-korhaz-napelem-rendszer (accessed on 2 February 2018).
- Local Government of Keszthely. KEOP-4.10.0/N/14-2014-0066. Available online: https://www.keszthely.hu/onkormanyzat/palyazatok/onkormanyzat-altal-elnyert-palyazatok/keszthely-varos-onkormanyzata-tulajdonaban-levo-intezmenyek-napelemekkel-torteno-felszerelese-# (accessed on 2 February 2018).
- VÜZ Kft. Winning Tenders. Available online: http://www.khvuz.hu/index.php/nyertes-palyazataink (accessed on 2 February 2018).
- Hungarian Energy and Utilities Regulatory Office. KÁT Information’s. Available online: http://enhat.mekh.hu/index.php/2017/06/26/ket-es-felszeresere-novekedhet-a-megujulo-alapu-villamosenergia-termeles/ (accessed on 13 November 2018).


| Content | Value |
|---|---|
| Average validated electric energy production of a 1 kWp HMKE or KÁT PV system in Hungary, first year (kWh/a) | 1200 |
| Average validated electric energy production of a 1 kWp Small-scale PV system with a regulatory device in Hungary, first year (kWh/a) | 1140 |
| Decrease of annual performance of average crystalline modules after the 1st year (%) | 0.5 |
| Duration of the investment (year) | 15 |
| System loss (PV inverter, grid) (%) | 10 |
| Tilt angle of PV modules (°) | 35 |
| Orientation (azimuth) (°) | 180 |
| Household-sized power plant (HMKE) (kWp) | 50 |
| Small-scale PV system (kWp) | 500 |
| 31 December 2016 KÁT regulation (kWp) | 500 |
| Average delivery price for electric energy for business customers in the HMKE and in the Small-scale PV system (€/kWh/2019) | 0.1175 |
| KÁT FiT (€/kWh/2019) | 0.1095 |
| KÁT FiT bonus for daily forecast (€/kWh/2019) | 0.0093 |
| Rate of average inflation (2003–2017) (%) | 3.7 |
| Bond yield interest rate (%) | 4.36 |
| Financial support (%) | 0 |
| Investment costs, HMKE PV system, net, 2019 (€) | 41,817 |
| Investment costs, Small-scale or KÁT PV system, net, 2019 (€) | 447,205 |
| Average price of 1 kWp used crystalline PV modules, 2019 (€) | 100 |
| Average price of 1 kW used PV inverter power, HMKE, 2019 (€) | 56 |
| Average price of 1 kW used PV inverter power, Small-scale or KÁT, 2019 (€) | 52 |
| Description | Context | Ref. |
|---|---|---|
| Annual PV system energy output (kWh/a) | First year: = The software results of PVGIS | [91] |
| Other years: | [15,47,84] | |
| Total cash flow (€) | [15,44,47,82,84,99] | |
| Net present value (€) | [86,100] | |
| Internal Rate of Return (%) | ||
| Discounted payback period (€) |
| HMKE | Small-Case | KÁT | ||
|---|---|---|---|---|
| Feeding energy into the grid | yes | no | yes | yes |
| Self-consumption | 100% | 100% | possible | no self-consumption |
| Energy trader | not necessary | not necessary | necessary | necessary |
| Energy billing/balance | annual | continuous | continuous | continuous |
| NPV calculation in our study | yes | yes | no | yes |
| NPV after 15 years | low | highest | not analyzed | medium |
| 15-minutes forecast | not necessary | not necessary | not necessary | needed |
| Investment cost for the whole system | low | high | high | high |
| Administration needs | low | low | medium | high |
| Content | Values | ||
|---|---|---|---|
| Studied investment period (years) | 15 | ||
| Studied PV economic environment | HMKE | Small-scale | KÁT |
| System size (kWp) | 50 | 500 | |
| Investment costs, net, 2019 (€) | 41,817 | 447,205 | |
| Negative cash flow (CO&M,total + Demolition fee), net (€) | 10,026 | 66,966 | 81,366 |
| Positive cash flow, net (€) | 140,681 | 1,344,867 | 1,140,558 |
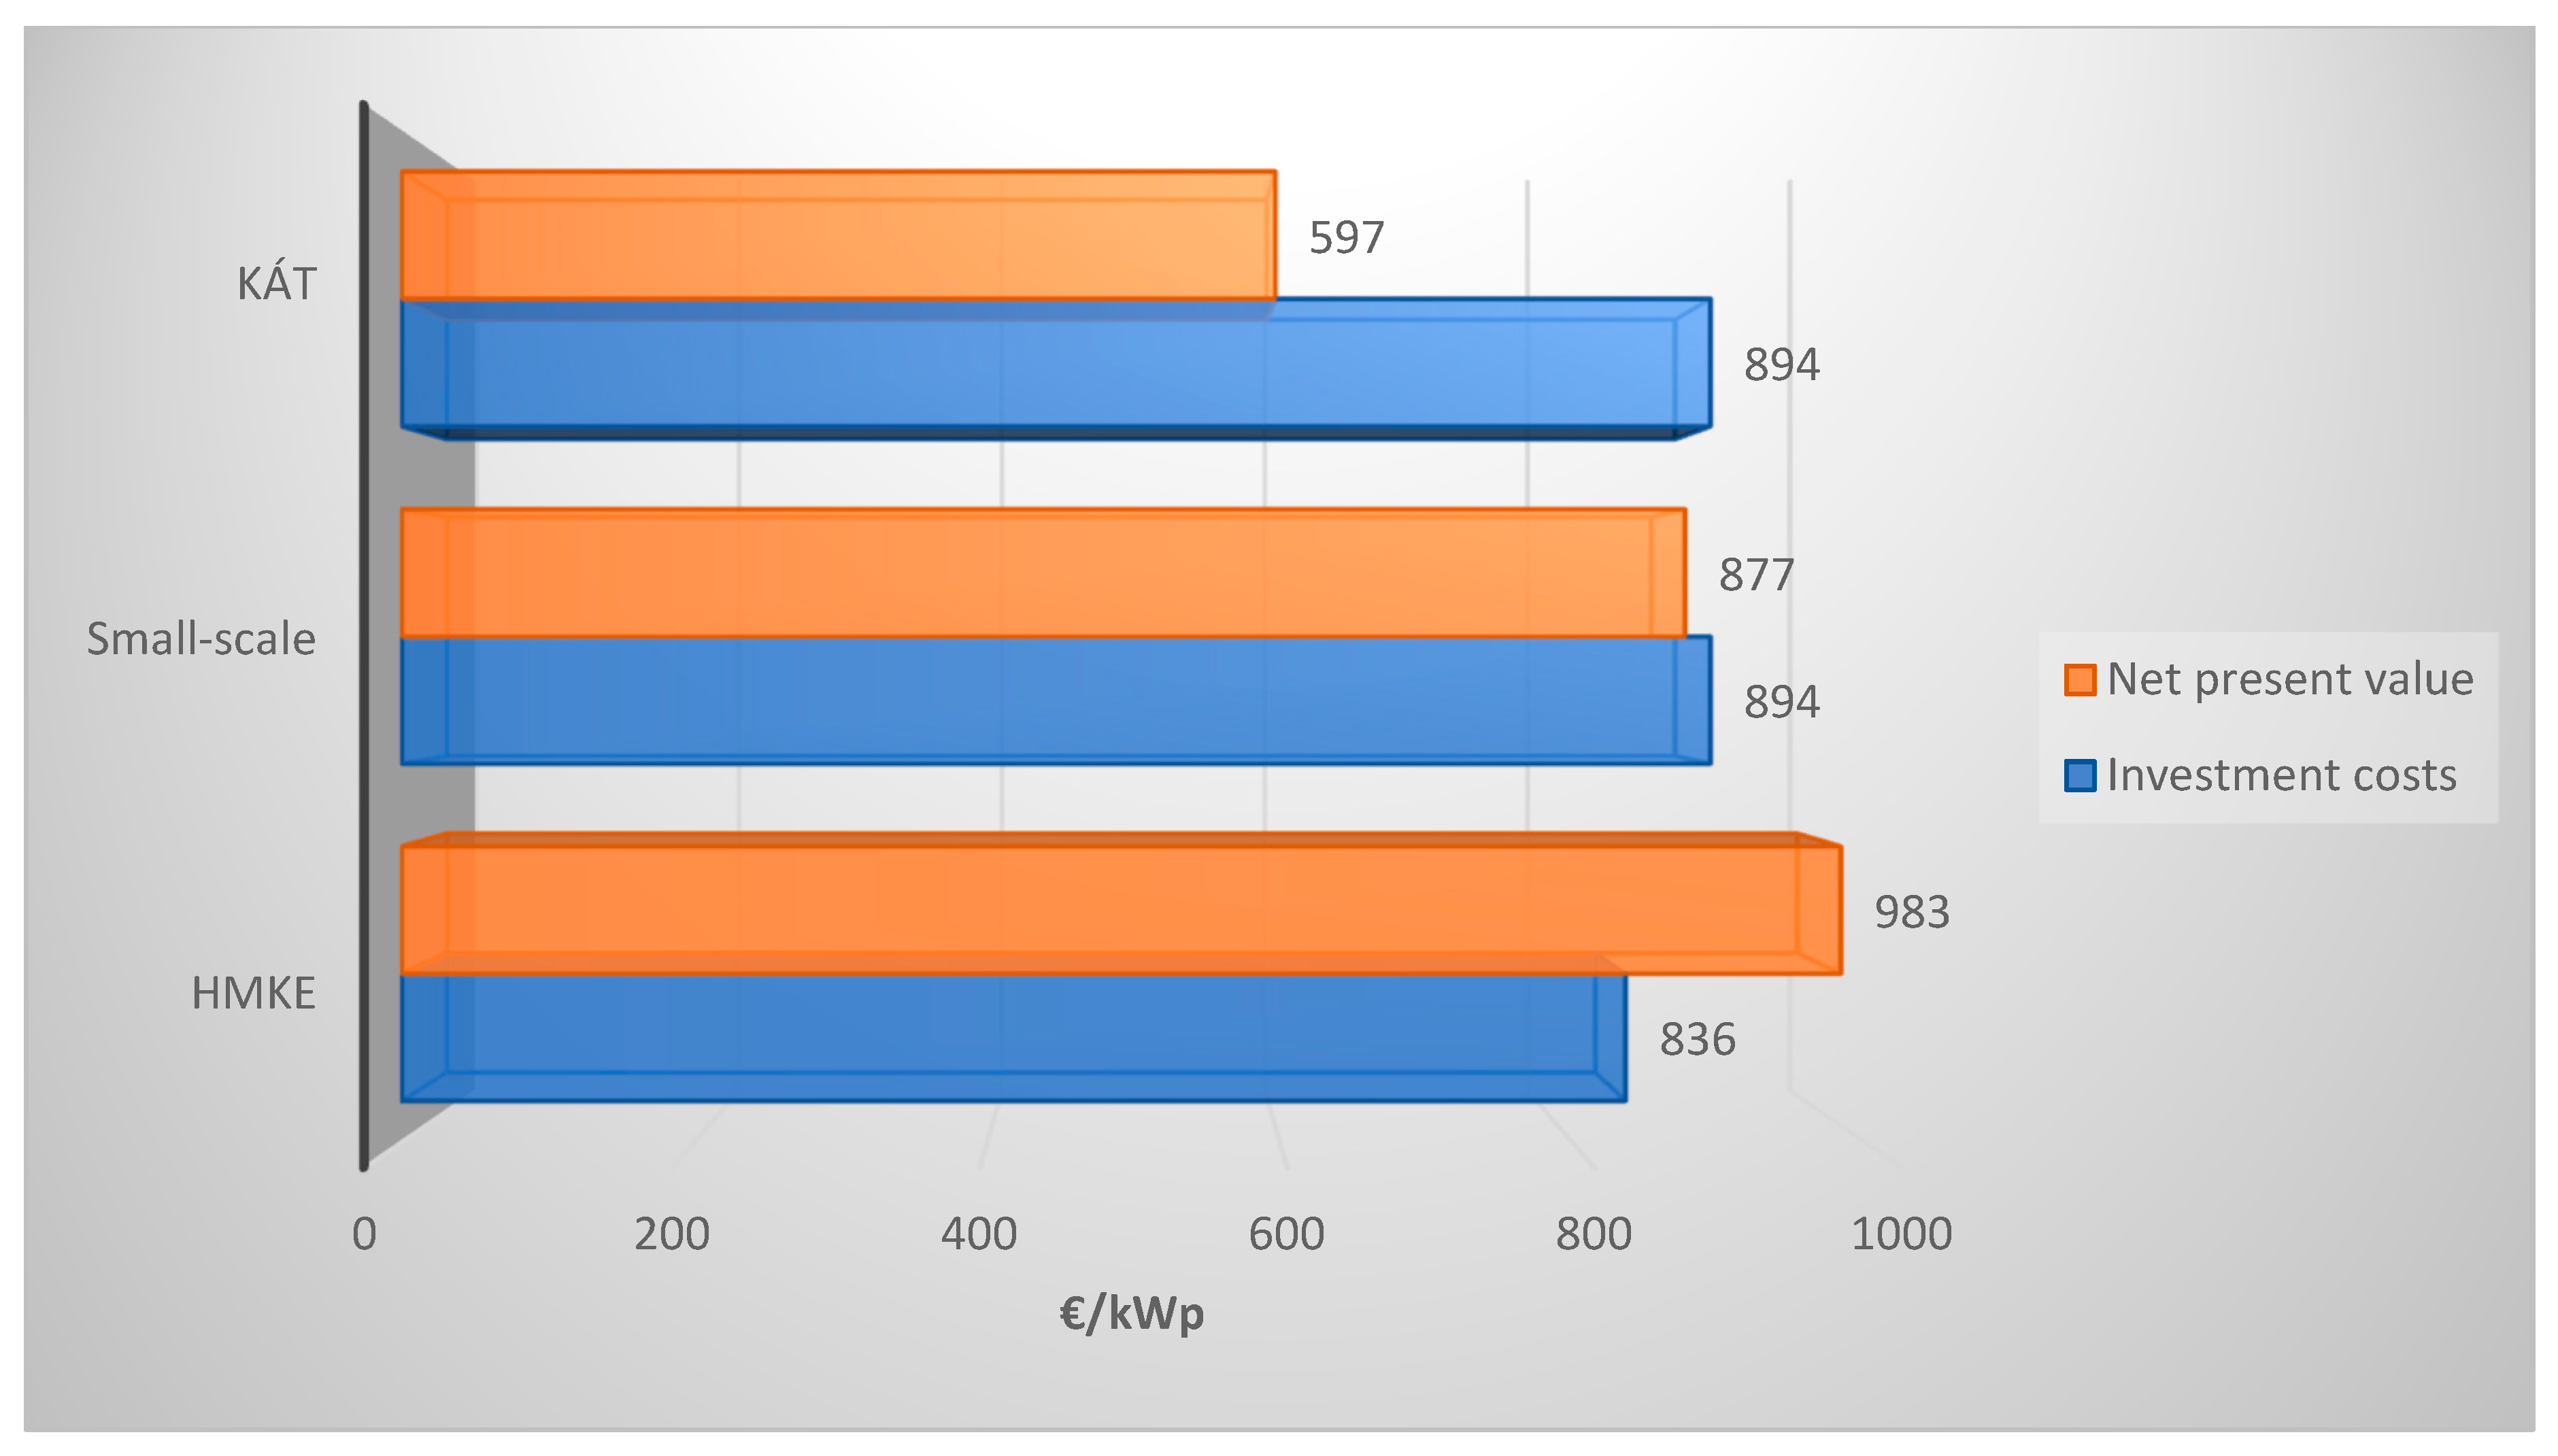
| Net present value (NPV) (€) | 48,935 | 438,470 | 298,490 |
| Internal rate of return (IRR) (%) | 16.5 | 14.7 | 12.2 |
| Discounted payback period (DPP) (year) | 7 | 8 | 9 |
| Needed support intensity for 0 NPV (%) | - | ||
© 2019 by the authors. Licensee MDPI, Basel, Switzerland. This article is an open access article distributed under the terms and conditions of the Creative Commons Attribution (CC BY) license (http://creativecommons.org/licenses/by/4.0/).
Share and Cite
Zsiborács, H.; Hegedűsné Baranyai, N.; Csányi, S.; Vincze, A.; Pintér, G. Economic Analysis of Grid-Connected PV System Regulations: A Hungarian Case Study. Electronics 2019, 8, 149. https://doi.org/10.3390/electronics8020149
Zsiborács H, Hegedűsné Baranyai N, Csányi S, Vincze A, Pintér G. Economic Analysis of Grid-Connected PV System Regulations: A Hungarian Case Study. Electronics. 2019; 8(2):149. https://doi.org/10.3390/electronics8020149
Chicago/Turabian StyleZsiborács, Henrik, Nóra Hegedűsné Baranyai, Szilvia Csányi, András Vincze, and Gábor Pintér. 2019. "Economic Analysis of Grid-Connected PV System Regulations: A Hungarian Case Study" Electronics 8, no. 2: 149. https://doi.org/10.3390/electronics8020149
APA StyleZsiborács, H., Hegedűsné Baranyai, N., Csányi, S., Vincze, A., & Pintér, G. (2019). Economic Analysis of Grid-Connected PV System Regulations: A Hungarian Case Study. Electronics, 8(2), 149. https://doi.org/10.3390/electronics8020149