Article

Demand Forecasting DBA Algorithm for Reducing Packet Delay with Efficient Bandwidth Allocation in XG-PON

1
State Key Laboratory of Information Photonics and Optical Communications, School of Electronic Engineering, Beijing University of Posts and Telecommunications, Beijing 100876, China
2
Department of Computer Science, ISRA University, Hyderabad 313, Pakistan
3
Department of Electronic Engineering, QUEST, Nawabshah 67480, Pakistan
4
Institute of Optoelectronics, Nanjing University of Information Science and Technology, Nanjing 210094, China
*
Author to whom correspondence should be addressed.
Electronics 2019, 8(2), 147; https://doi.org/10.3390/electronics8020147
Submission received: 20 November 2018 / Revised: 21 January 2019 / Accepted: 29 January 2019 / Published: 31 January 2019
(This article belongs to the Special Issue Optical Communications and Networks)

Abstract

:
In a typical 10G-Passive Optical Network (XG-PON), the propagation delay between the Optical Network Unit (ONU) and Optical Line Terminal (OLT) is about 0.3 ms. With a frame size of 125 μs, this amounts to three frames of data in the upstream and three frames of data in the downstream. Assuming no processing delays, the grants for any bandwidth requests reach the ONU after six frames in this request-grant cycle. Often, during this six-frame delay, the queue situation is changed drastically, as much, more data would arrive in the queue. As a result, the queued data that is delayed loses its significance due to its real-time nature. Unfortunately, almost all dynamic bandwidth allocation (DBA) algorithms follow this request-grant cycle and hence lacking in their performance. This paper introduces a novel approach for bandwidth allocation, called Demand Forecasting DBA (DF-DBA), which predicts ONU’s future demands by statistical modelling of the demand patterns and tends to fulfil the predicted demands just in time, which results in reduced delay. Simulation results indicate that the proposed technique out-performs previous DBAs, such as GigaPON access network (GIANT) and round robin (RR) employing the request-grant cycle in terms of Throughput and Packet delivery ratio (PDR). Circular buffers are introduced in statistical predictions, which produce the least delay for this novel DF-DBA. This paper, hence, opens up a new horizon of research in which researchers may come up with better statistical models to brew better and better results for Passive optical networks.

1. Introduction

Increased use of high data rate services in daily life, such as high-definition TV (HDTV), video on demand, teleconferencing, collaborative gaming, and several other sophisticated multimedia applications, has put an overwhelming demand for bandwidth and data speed on the access network [1,2,3]. At present, passive optical networks (PONs) [4] are used as fiber to the home (FTTH) or fiber to the premises (FTTH) last mile solutions. These networks utilize passive optical devices like splitters and combiners, having no need for electrical power, in a neighborhood to fan-out a single fiber from the central office (CO) to several homes. Standard in this proposition, 10G-Passive Optical Network (XG-PON) uses time-division multiple access (TDMA) with a single wavelength, requiring simply a single detector at the CO. It can serve up to 256 connections with a collective downstream bandwidth of 10Gbps and upstream bandwidth of 2.5 Gbps [5] whereas in 10-Gigabit-capable symmetric passive optical network (XGS-PON) provides same downstream bandwidth and upstream bandwidth of 10 Gbps [6]. In XG-PON, there are two main active transmission devices those are optical line termination (OLT) and optical network unit (ONU) [7,8] connected through optical fiber cable, connectors, splitter in optical distribution network (ODN) path [9,10]. The XG-PON architecture is depicted in Figure 1.
XG-PON defines five different types of QoS and implements these by defining five transmission containers (TCONTs), namely: Type1, Type2, Type3, Type4, and Type5 TCONTs, at each ONU. All the user’s traffic must fall into one of these TCONTs [2,11]. However, the simplicity of hardware comes at the cost of complexity in the software stack. A dynamic bandwidth allocation (DBA) algorithm is needed to be executed at the OLT (at the CO) that schedules timeslots for each ONU (at the user’s end) to let them transmit data in the upstream without interfering each other [12,13]. In each upstream frame, the ONUs append their requests for bandwidth, which are eventually delivered to the DBA by the OLT. The DBA depending upon its scheduling priorities creates a schedule of timeslots and broadcast it back to the ONUs using bandwidth map (BWmap) which is a header field in the downstream (DS) physical frame [14,15,16]. A BWmap can have many possible allocation structures, shown in Figure 2. Each may contain fields, such as Alloc_ID (A queue has its unique Allocation Identifier), Start_ time (time to synchronize upstream-US data from ONUs at different distances from OLT, DBRu (notifies permission for Alloc_ID ONU to send the data in the next US frame) and Grant_Size (total bandwidth approved for the specific Alloc_ID for the subsequent US frame) [17].
In a typical XG-PON network, the one-way propagation delay between ONU and OLT is around 0.3 ms. With a frame size of 125 μs, this amounts to three frames of data in the upstream and three frames of data in the downstream. Hence, for any bandwidth requests from ONUs, the corresponding grant schedule will reach back the ONU in no less than six-time slots, even by the most efficient DBA (assuming no processing time). Often, during this six-frame delay, the queue situation is changed drastically as much more data arrives in the queue or several times the queued data loses its significance due to its real-time nature. Unfortunately, almost all DBA algorithms follow this request-grant cycle and hence cannot create an upstream data connection with a delay less than 0.6 ms [7,18]. As a reason, designing efficient DBA for access networks, which provides instant bandwidth grants for demands made by ONU at the OLT, high throughput and improved latency is not a straightforward task. For a reason, some issues, such as predictability of demand, reduced demand-grant cycle time and efficient use of buffers need to be addressed.
For the instant bandwidth grants, estimation based DBA [19] utilizes previous values of grant size and queue length to shorten waiting delay which is not useful approximation for buffer occupancy in case of polled ONU. Linear prediction method [20] for EPON is used for upstream traffic flow supporting flexible bandwidth distribution with no data delay problem, bandwidth hunger, and data loss. This method records traffic amounts for previous polling cycles during the waiting time and requires a large memory with a powerful processor. [21] presented a similar prediction mechanism with the concept of early slot reservation and traffic awareness to reduce queuing delay in ONU buffers but offered increased US delay in case of bursty traffic. Another estimation based scheme, interleaved polling with adaptive cycle time with grant estimation (IPACT-GE) [22] achieves reduced waiting delay, and minimal buffer occupancy than IPACT [23] by predicting total new packets with the extra predicted amount, in between successive pollings and granting ONUs. Another study in [24] predicted arrivals in relation presented waited based DBA to calculate predicted arrivals in proportion to waiting time of ONU, Traffic arrivals in the few cycles and present traffic. Prediction based DBA (P-DBA) [25] used a high order moving average filter model with variable weights allocated to preceding arrivals to forecast traffic arrival time for GPON using similar traffic pattern. This work offers high bandwidth, low delay, and low packet loss, but lacks information about methods employed for traffic generation. Another prediction based approach in [14] reduces idle time and knows the correct traffic arrivals during this time, but it lacks information about the prediction mechanism. This method offered fair scheduling techniques, improved transmission efficiency and minimal signalling propagation delays in bursty traffic for extended reach access networks. The author used a different class of service types for queues of data packets in corresponding TCONTs in an optical burst switching mode to achieve high efficiency with low signalling in both short/ long-range dependence (SRD/LRD) traffic. Another polling based recent research [26] stressed the use of the prediction mechanism using TCONT notation to reduce grant delays for achieving improved bandwidth allocation, low latency in upstream and fair allocation among end users.
In this paper, we propose a new DBA, called as Demand Forecasting DBA (DF-DBA) that predicts future ONU demands by statistical modelling of the demand patterns and tends to fulfil the predicted demands just in time so that an ONU receives the grant as soon as the demand for the bandwidth was created. With the incorporation of circular buffers, we present the potential of this novel DF-DBA approach that can achieve better results in terms of throughput, Packet delivery ratio (PDR) and End-to-End Delay. Demand forecasting models have also been in use for different fields, such as business inventory management system [27,28], water distribution networks [29], neural networks [30,31], tourist system [32], and patient data management system [33]. However, to the best of our knowledge, this method is used for the first time in XG-PON networks to provide an easy way for ONU to receive the bandwidth grants. Simulation results show that the proposed DBA outperforms its contemporary counterparts with respect to the average QoS parameters, i.e., Throughput, Packet delivery ratio, and Delay.
The rest of the paper is structured as follows. Section 2 presents traditional DBA process, Section 3 presents proposed DF-DBA process and algorithm, Section 4 discusses simulation design environment, followed up by result discussion in Section 5 and conclusion remarks are drawn in Section 6.

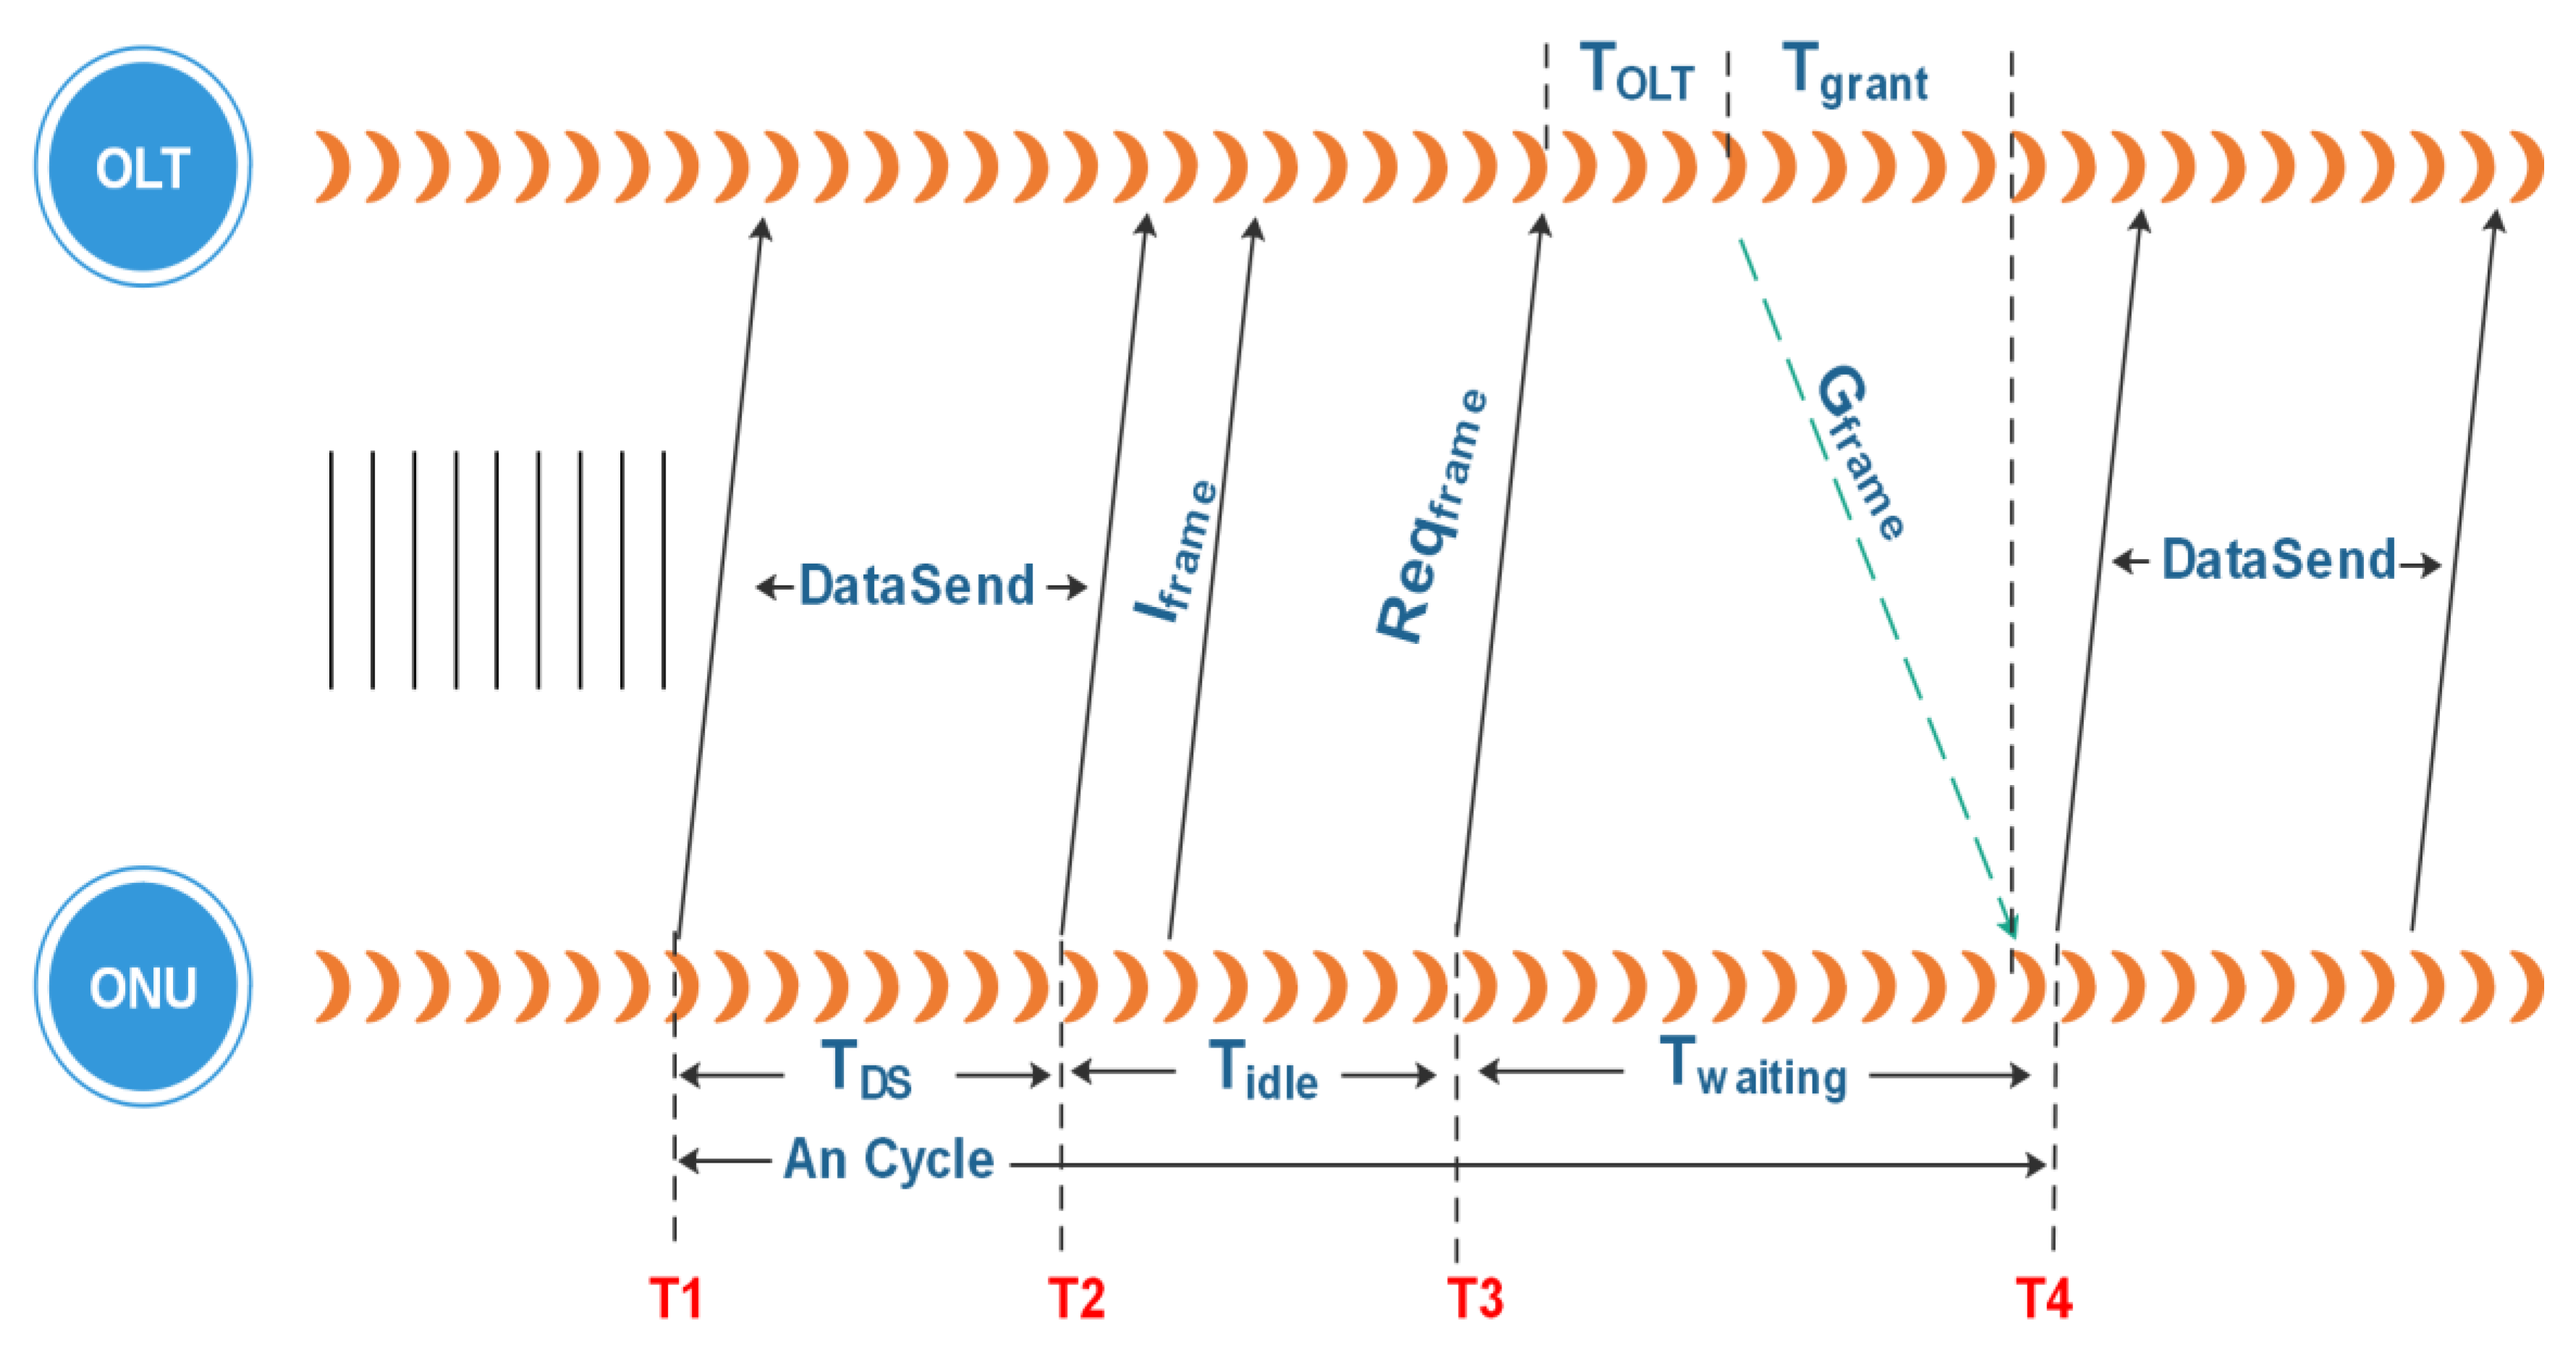
2. Traditional DBA Process

DBA is used to improve the uplink utilization of XG-PON network by alleviating idle time (Tidle) and time ONU waits for the grant (Twaiting). Efficient DBA mechanisms in XG-PON aims to improve network throughput, decrease packet drop probability and end-to-end delay. In real time, this all depends on how good OLT deals with ONU/OLT traffic. Traditional DBA, such as GigaPON access network (GIANT) DBA algorithm is physically implemented DBA algorithm for XGPON system that supports the traffic service classes defined in ITU-T Recommendation G.983.4 i.e., TCONTs. The service interval (SI) and allocation bytes (AB) were two basic main parameters for TCONTs. AB determines how many bytes are assigned to TCONT and SI declares how often the TCONT gets served. GIANT suffers from higher idle channel time as traffic frames arriving just after ONU has sent its queue report, must wait for the expiry of the SI timers to receive the US bandwidth allocation. Figure 3, shows the process of traditional DBA. ONU starts to send data frame to OLT from T1 instant for time known as data send time (TDS) then experiences an idle time (Tidle) for which there is no US channel utilization. During this period, ONUs keep forwarding idle frame (Iframe) till T2 instant. In T3, ONU sends a request frame (Reqframe) and waits for a certain time (Twaiting time) for the grant, can be calculated by in (1). As OLT receives Reqframe, it processes DBA and updates BWmap in OLT processing time (TOLT). After TOLT, OLT sends grant frames (Gframe) to ONU. Grant reaches ONU in grant time (Tgrant). As ONU receives the grant at T4 instant, it sends the data frame to OLT. This process continues until ONU remains activated. The complete process time is called cycle time in (2).
Twaiting = TOLT + Tgrant,
An Cycle = TDS + Tidle + Twaiting.

3. DF-DBA Process and Algorithm

DF-DBA algorithm is based on the fact that the network usage pattern persists (i.e., remains the same) over time and can be modelled statistically. In this research, it is proposed that the bandwidth be allocated for ONU demands just in time, based on the demand forecast, which is estimated from the statistical model of the TCONTs buffer’s data arrival rate. A number of grant frames that contain information about ONU bandwidth demands are first saved in a circular buffer. Meanwhile, OLT processes the DBA and updates BWmap within idle time (Tidle). After which OLT sends grant frames (Gframe) to ONU. As a result, ONU receives the grant even before its request reaches to OLT, which effectively reduces Twaiting for ONU. This is depicted in Figure 4.
DF-DBA Algorithm
Consider XG-PON network with single OLT and ONU i (1 < i < X) where X is the total number of ONUs. We introduce the following variables, given in Table 1 for ONU i.
In each upstream frame, ONUs send some of its queued data together with the DBRu report containing the amount of data still present in its queue as a request to OLT. Let Data[i] represents the amount of data sent in frame i, and Req[i] represents the DBRu request in the structure i, and then the instantaneous data arrival rate at the ONU TCONT queue can be computed from (3):
λ(QTCONT) = (Req[i] + Data[i] − Req[i − 1])/ΔT,
For the demand prediction, the concept of statistical modeling is used. OLT retains the last 100 values of Req[i] and Data[i] using a circular buffer. The instantaneous data arrival rate (QTCONT) for each TCONT can then be calculated from these values as needed. In the next step, running values of mean µ and standard deviation σ of λ(QTCONT) are calculated from the circular buffer in each cycle and are used to predict the demand size LTCONT using a normal distribution N (μ, σ) from (4).
LTCONT = N (μ, σ) × ΔT + 128,
The so predicted demand size LTCONT is assumed to be the amount of data arriving at the ONU TCONT queue during the last frame duration ΔT, and the same is used to calculate the bandwidth allocated to the TCONT in the next BW map. Further, 128 words have been added as surplus to accommodate for piggybacking of DBRu reports or as cushion space even if the model predicted a zero demand. The pseudo code of demand prediction DBA engine is presented in Table 2.

4. Simulation Design Environment

4.1. Platform

The network simulator NS-3—famous discrete-event simulation software is used for the analysis [34]. XG-PON module is one of the network modules in NS3 that is supported by the simulation of the passive optical network. It is made on a standard, configurable and expandable module that can simulate XG-PON’s reasonable simulation speed by supporting a wide range of research topics [7]. It includes major DBA schemes like round robin (RR) and GIANT. The XG-PON module has featured as follows:
  • As the fundamental intention about this module was once according to analyze XG-PON Transmission Convergence (XGTC) strata then top layer issues, the physical seam is within an easy path via carrying an excellent limit budget, because of the optical allocation network.
  • Module implementation does not feature Physical Layer Operations, Administration or Maintenance (PLOAM) and ONU Management yet Control Interface (OMCI) channels are now not implemented.
  • XG-PON aqueduct is modelled, so an easy point-to-multipoint (P2MP) race among Down Stream (and multipoint-to-point MP2P within Up Stream) together with propagation delays and rank charges have been configured such care of standards. Conversely, the packets are expected according to arrive, barring someone XG-PON losses, at their same recipients.
  • DBA at the OLT is accountable in imitation of allocating the US bandwidth according to TCONT, or US scheduler at ONU is responsible according to assign the transmission possibility regarding some TCONT according to its US XGEM Ports.
  • OLT and ONU keep sufficiently significant and separated queue, because of every XGEM Port-ID.
  • All ONUs are double to remain at an equal distance out of OLT.
We have extended this XG-PON module, implemented our DF-DBA engine, and can be sought by sending email to the authors. In this first study on DBA based on predicting the future demand of ONUs in XG-PON with improved throughput, Packet delivery ratio (PDR) and End-to-End Delay, we have used fixed packet size and have compared the results with two standard DBA algorithms under different stress conditions to validate the research work. We leave the study of considering variable packet size and analyzing other statistical methods for future research.

4.2. Simulation Environment

In order to evaluate the proposed algorithm under various stress conditions, we create simulation scenarios consisting of a varying number of ONUs –viz. 32, 64, 96, 128, 160, 192, and 224 connected with a single OLT as a star topology. Obviously, the 32 ONU scenario will offer less stress while the 224 ONU scenario will offer maximum stress to the DBA algorithm. We then simulated these scenarios under each of the three DBA algorithms, i.e., GIANT, RR-DBA, and proposed DF-DBA. To further verify our observations, we run these simulations twice, once for a shorter duration and then for a longer duration. These simulations were studied for three QoS metrics: Throughput, packet delivery ratio, and end-to-end delay for performance analysis of the three DBA algorithms.
TCONT-5 is used in each ONUs that models all bandwidth types and all services described by other TCONT types. The On-Off application type is used and configured as constant bit rate (CBR) with user datagram protocol (UDP). The link rate of ONU to OLT is 2.5 Gbits/s and OLT to ONUs 10 Gbits/s. Table 3 summarizes the simulation parameters of our XG-PON scenario.

5. Results and Discussions

We evaluate the performance of novel DBA protocol in terms of throughput, PDR and end-to-end delay in comparison with the other two well established DBA protocol standards, i.e., GIANT and Round Robin. Results and discussion of each parameter are presented as follows.

5.1. Throughput

The total amount of data delivered in unit time is known as network throughput, measured in bits/s and kbit/s; Total ONUs’ data for OLT is obtained by multiplying total frame count, frame size and multiplier factor of 8. Throughput is expressed in Equation (5).
T h r o u g h p u t [ k b p s ] = F r a m e C o u n t × F r a m e S i z e [ b y t e s ] × 8 [ b i t s b y t e ] T i m e [ s e c ] × 1024 .
Figure 5 presents the comparative performance of the three DBA algorithms in terms of throughput under varying stress conditions with respect to the number of ONUs simulated for 30 s and 60 s.
For the sake of this study, we just considered the upstream frames and had computed the upstream throughput for all the stress conditions. It can be clearly observed from Figure 5a,b that the variation in the number of ONUs has little impact on the throughput. This is because the network remained fully saturated in all the stress scenarios and was delivering as much data as possible. It is only up to the DBA algorithm that how it schedules to use this bandwidth. From the charts it can be seen that both GIANT and RR-DBA performed poorly. The throughput of the existing DBAs (RR-DBA and GIANT) remained below 0.4 Gbps under all stress conditions consistently. While DF-DBA can be seen better in utilizing the available bandwidth and offered a throughput of at least 1.2 Gbps even under high-stress conditions. Moreover, if, additional ONUs are added, RR-DBA and GIANT protocols fail to provide additional bandwidth capacity to new ONUs. On the other hand, DF-DBA is a better choice and provides sufficient bandwidth for each ONU’s grant to overcome network complexity and performance issues.

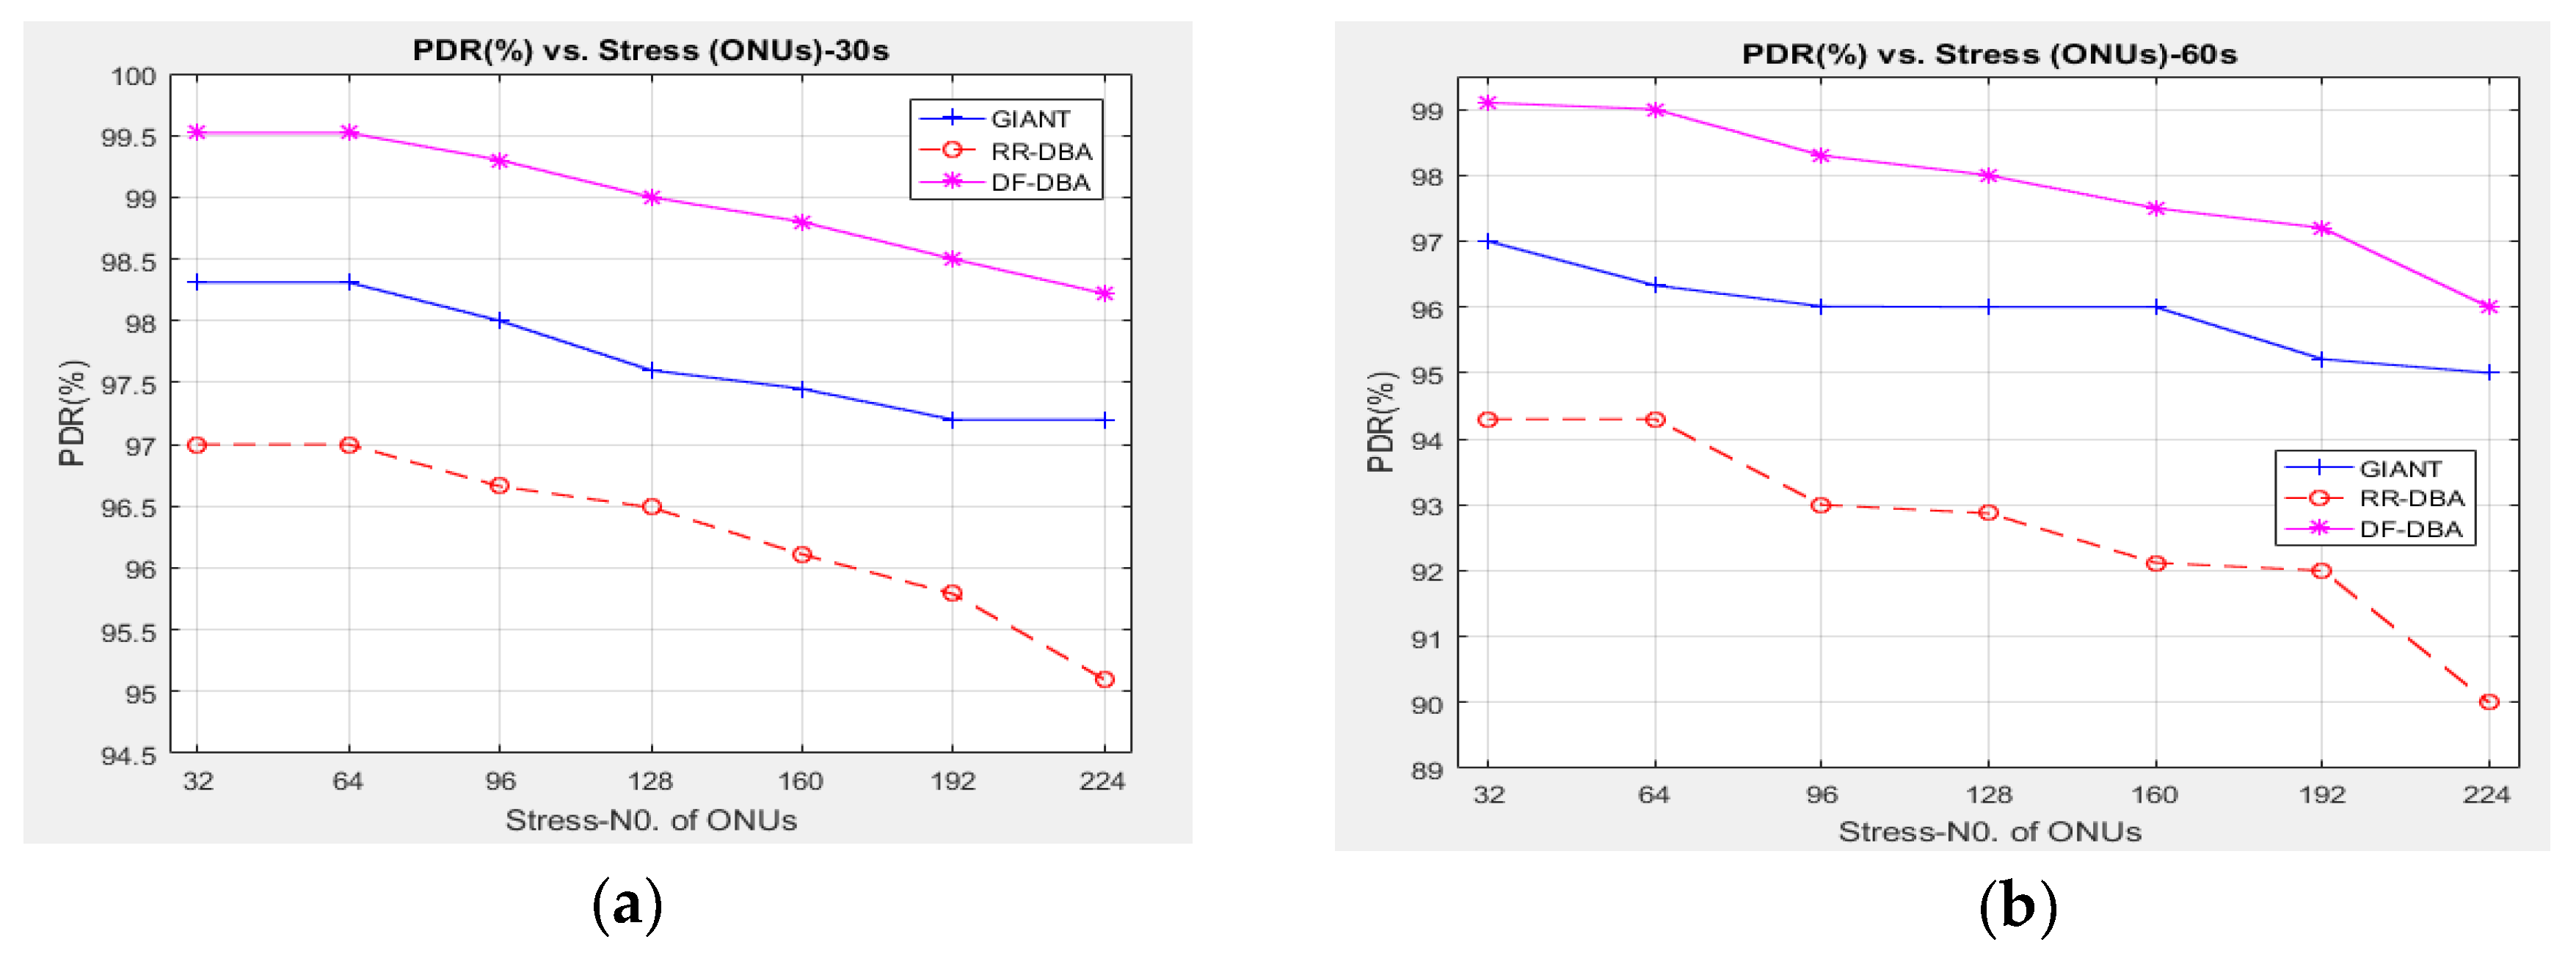
5.2. Packet Delivery Ratio

Packet delivery ratio (PDR) is a ratio of the received frame RFs at OLT over the sent frame SFs from ONUs, expressed in Equation (6). DF-DBA’s PDR is almost the same as the PDR of other DBAs.
P D R [ % ] = R F s S F s × 100 .
The simulation result in terms of PDR (%) under a variable number of ONUs, run for 30 s and 60 s Operation time is shown in Figure 6. Compared to RR-DBA and GIANT in Figure 6a, PDR (%) of DF-DBA is much higher (99.2) which implies that DF-DBA has the lowest frame dropping probability providing more throughput. All three DBAs maintain nearly constant PDR (%) with RR-DBA with least, GIANT with average and DF-DBA with highest values only up to 64 ONUs, which can be referred as a threshold stress point for analysis onwards.
As the number of ONUs is increased above threshold stress point, frame dropping probability increases and DF-DBA is only one that suffers least from decrease/fluctuation in PDR (%) as compared to RR-DBA and GIANT. Under Maximum stress of 224 maximum ONUs, we obtain the highest PDR (%) of 98.22 for DF-DBA, average PDR (%) of 97.2 from GIANT and PDR (%) of 95.1 RR-DBA. As depicted in Figure 6b, the effects of link situation become worse as packet delivery ratio further degrades in 60 s duration simulation analysis.
Above all, DF-DBA maintains minimal packet loss in such case and bears packet delivery ratio value of max: 99.1- min: 96. Whereas RR-DBA obtains max: 94.3- min: 90 and GIANT max: 97- min: 95 values of PDR (%). Result pattern for each DBA is nearly identical and can be seen behaving as neck to neck.

5.3. End-to-End Delay

End-to-End Delay or delay, measured in seconds, mili- seconds or nanoseconds, is the average time a frame takes to reach the destination. It is calculated by dividing the difference of received frame time and sent frame time by the total number of ONUs’ transmissions, expressed in Equation (7).
D e l a y [ s ] = R F s T i m e S F s T i m e T o t a l . n o . o f . O N U s . T r a n m i s s i o n .
The delay is most significant QoS factor for performance analysis of DBAs in XG-PON. Figure 7 presents the comparative performance of the three DBA algorithms in terms of Delay (ms) under varying stress conditions with respect to the number of ONUs, simulated for a different time.
It is clearly observed from the two Figure 7a,b that DF-DBA produces the least delay of 0.09 ms for 32 ONUs. This DBA predicts the future bandwidth need of ONUs, implying normal distribution technique and uses circular buffers efficiently which results in no waiting queues for ONUs requests. In the worst case, it can be wrong, but mostly it works properly well and lessens delay of XG-PON proficiently. In contrast, both GIANT and RR-DBA offer a very high delay of 0.2 ms and 0.4 ms respectively for 32 ONUs. These DBAs waste more time to check the buffer occupancy. As a result their operation mechanism cannot fulfil bandwidth grant requests of ONUs in time. This leads to increased delay and decreased PDR (%). Logically, both DBAs become no more a good choice for access networks. Further, it is observed from Figure 7a, after the threshold stress point, delay increases drastically in each DBA case. However, DF-DBA produces the least delay, almost three times less under the maximum number of ONUs. Under 60 s duration simulation run in Figure 7b, we notice that there is an increase in delay as compared to results to Figure 6a. Threshold stress point is maintained at 64 ONUs after which delay increases swiftly in each DBA case. Delay value ranges for 32 ONUs to 224 ONUs are 0.28 s–2.39 ms, 0.41 ms–2.59 ms and 0.09 ms–0.99 ms for RR-DBA, GIANT and DF-DBA respectively which confirms that DF-DBA is as an attractive solution against the delay problem in access networks.

6. Conclusions

In this research, we demonstrated that the DBA algorithm instead of waiting for the DBRu reports, if models the ongoing data flow patterns and forecasts the bandwidth requirements for active T-CONTs, could significantly lower the end-to-end delay. This DBA has outperformed DBAs employing the request-grant cycle regarding throughput and packet delivery ratio (PDR). However, the bursty nature of data makes the forecasting difficult. With a slight over-allocation, some risk of reduced throughput is induced, though it results in well-managed delay. A brief comparison between all three DBAs is presented in Table 4 at last. The statistical model used in this study was simply a normal distribution with a mean and standard deviation. This work is practically applicable at OLT side for the XG-PON. It improves performance at OLT side by decreasing US grant time. Better results are expected if more accurate statistical models for demand forecasting are analyzed. This paper, hence, opens up a new horizon of research in which researchers may come up with better statistical models to brew better and better results for passive optical networks.

Author Contributions

K.A.M. Implemented the simulation model in NS-3 and wrote the paper. X.X. supervised and funded the project. K.H.M., Q.Z., A.S, S.U. and N.u.A. contributed to the results analysis and R.U., F.T. and B.D. reviewed the paper.

Funding

This work is supported by Natural National Science Foundation of China (NSFC) (61727817/ 61425022/ 61522501/61605013/61875248/61307086/61475024/61672290/61475094/61675030); the National High Technology 863 Program of China (2015AA015501, 2015AA015502), the Fund of State Key Laboratory of IPOC (BUPT).

Conflicts of Interest

The authors declare no conflict of interest.

References

  1. Keshav, S. Paradoxes of Internet Architecture. IEEE Internet Comput. 2018, 22, 96–102. [Google Scholar] [CrossRef]
  2. Sapolsky, H.M.; Crane, R.J.; Neuman, W.R.; Noam, E.M. The Telecommunications Revolution: Past, Present, and Future, 1st ed.; Routledge: Oxfordshire, UK, 2018; ISBN 978-0815361923. [Google Scholar]
  3. Chatterjee, B.; Sarma, N.; Sahu, P.; Oki, E. Limitations of Conventional WDM Optical Networks and Elastic Optical Networks for Possible Solutions. In Routing and Wavelength Assignment for WDM-Based Optical Networks; Springer: Cham, Switzerland, 2017; Volume 410. [Google Scholar]
  4. Pachnicke, S.; Eiselt, M.H.; Grobe, K.; Elbers, J. The frontiers of optical access networks. In Proceedings of the 2015 International Conference on Optical Network Design and Modeling (ONDM), Pisa, Italy, 11–14 May 2015; pp. 12–15. [Google Scholar]
  5. ITU-T 10-Gigabit-capable passive optical networks (XG-PON): General requirements. ITU-T Recomm. G.987.1 2010, E 40850, 1–58. [CrossRef]
  6. ITU-T G.9807.1:10-Gigabit-capable symmetrical passive optical network (XGS-PON). ITU-T G-SERIES Recomm. 2016, E 41042, 1–286.
  7. Arokkiam, J.A.; Alvarez, P.; Wu, X.; Brown, K.N.; Sreenan, C.J.; Ruffini, M.; Marchetti, N.; Doyle, L.; Payne, D. Design, implementation, and evaluation of an XG-PON module for the ns-3 network simulator. Simulation 2017, 93, 409–426. [Google Scholar] [CrossRef] [Green Version]
  8. Arokkiam, J.A.; Wu, X.; Brown, K.N.; Sreenan, C.J. Experimental evaluation of TCP performance over 10Gb/s passive optical networks (XG-PON). In Proceedings of the 2014 IEEE Global Communications Conference, Austin, TX, USA, 8–12 December 2014; pp. 2223–2228. [Google Scholar]
  9. Available online: http://www.sopto.com/st/ftth-knowledge/what-is-optical-distribution-network (accessed on 20 May 2018).
  10. Arokkiam, J.; Brown, K.; Sreenan, C. Refining the GIANT dynamic bandwidth allocation mechanism for XG-PON. In Proceedings of the 2015 IEEE International Conference on Communications (ICC), London, UK, 8–12 June 2015. [Google Scholar]
  11. ITU-T G.984.3. Gigabit-Capable Passive Optical Networks (G-PON): Transmission Convergence Layer Specification; Internation Telecommunication Union: Geneva, Switzerland, 2014. [Google Scholar]
  12. Dhaini, A.R.; Ho, P.; Shen, G.; Shihada, B. Energy Efficiency in TDMA-Based Next-Generation Passive Optical Access Networks. IEEE/ACM Trans. Netw. 2014, 22, 850–863. [Google Scholar] [CrossRef] [Green Version]
  13. Garfias, P.; De Andrade, M.; Tornatore, M.; Buttaboni, A.; Sallent, S.; Gutierrez, L. Energy-Saving Mechanism in WDM/TDM-PON Based on Upstream Network Traffic. Photonics 2014, 1, 235–250. [Google Scholar] [CrossRef] [Green Version]
  14. Segarra, J.; Sales, V.; Prat, J. GPON scheduling disciplines under multi-service bursty traffic and long-reach approach. In Proceedings of the 2010 12th International Conference on Transparent Optical Networks, Munich, Germany, 27 June–1 July 2010. [Google Scholar]
  15. Kwang, K.H.; Harle, D.; Andonovic, I. Dynamic bandwidth allocation algorithm for differentiated sservices over WDM EPONs. In Proceedings of the 2004 Ninth International Conference onCommunications Systems, Singapore, 7 September 2004; pp. 116–120. [Google Scholar]
  16. Butt, R.; Ashraf, M.; Faheem, M.; Idrus, S. A Survey of Dynamic Bandwidth Assignment Schemes for TDM-Based Passive Optical Network. J. Opt. Commun. 2018. [Google Scholar] [CrossRef]
  17. ITU-T G.987.3:10-Gigabit-capable passive optical networks (XG-PON): Transmission convergence (TC) layer specification. ITU-T G-Ser. Recomm. 2014, 2.0, 1–146.
  18. Wu, X.; Brown, K.N.; Sreenan, C.J.; Arokkiam, J.; Alvarez, P.; Ruffini, M.; Nicola, M.; Doyle, L. An XG-PON Module for the NS-3 Network Simulator: The Manual; University College Cork: Cork, Ireland, 2013. [Google Scholar]
  19. Byun, H.-J.; Nho, J.-M.; Lim, J.-T. Dynamic bandwidth allocation algorithm in Ethernet passive optical networks. Electron. Lett. 2003, 39, 1001–1002. [Google Scholar] [CrossRef]
  20. Luo, Y.; Ansari, N. Limited sharing with traffic prediction for dynamic bandwidth allocation and QoS provisioning over Ethernet passive optical networks. J. Opt. Netw. 2005, 4, 561–572. [Google Scholar] [CrossRef]
  21. Turna, Ö.C.; Aydin, M.A.; Zaim, A.H.; Atmaca, T. Half cycling dynamic bandwidth allocation with prediction on EPON. In Proceedings of the 2012 IEEE Symposium on Computers and Communications (ISCC), Cappadocia, Turkey, 1–4 July 2012; pp. 898–902. [Google Scholar]
  22. Kramer, G.; Mukherjee, B.; Pesavento, G. IPACT a dynamic protocol for an Ethernet PON (EPON). IEEE Commun. Mag. 2002, 40, 74–80. [Google Scholar] [CrossRef]
  23. Zhu, Y.; Ma, M. IPACT With Grant Estimation (IPACT-GE) Scheme for Ethernet Passive Optical Networks. J. Lightw. Technol. 2008, 26, 2055–2063. [Google Scholar] [CrossRef]
  24. Hwang, I.-S.; Lee, J.Y.; Yeh, T.-J. Polling cycle time analysis for waited-based DBA in GPONs. In Proceedings of the International MultiConference of Engineers and Computer Scientists, Hong Kong, China, 13–15 March 2013; Volume 2203. [Google Scholar]
  25. Qi-yu, Z.; Bin, L.; Run-ze, W. A Dynamic Bandwidth Allocation Scheme for GPON Based on Traffic Prediction. In Proceedings of the 2012 9th International Conference on Fuzzy Systems and Knowledge Discovery, Chongqing, China, 29–31 May 2012; pp. 2043–2046. [Google Scholar]
  26. Kyriakopoulos, C.A.; Papadimitriou, G.I. Predicting and allocating bandwidth in the optical access architecture XG-PON. Opt. Switch. Netw. 2017, 25, 91–99. [Google Scholar] [CrossRef]
  27. Babai, M.Z.; Dallery, Y.; Boubaker, S.; Kalai, R. A new method to forecast intermittent demand in the presence of inventory obsolescence. Int. J. Prod. Econ. 2018. [Google Scholar] [CrossRef]
  28. Prak, D.; Teunter, R. A general method for addressing forecasting uncertainty in inventory models. Int. J. Forecast. 2018. [Google Scholar] [CrossRef]
  29. Lopez Farias, R.; Puig, V.; Rodriguez Rangel, H.; Flores, J.J. Multi-Model Prediction for Demand Forecast in Water Distribution Networks. Energies 2018, 11, 660. [Google Scholar] [CrossRef]
  30. Rafiei, M.; Niknam, T.; Aghaei, J.; Shafie-Khah, M.; Catalão, J.P.S. Probabilistic Load Forecasting Using an Improved Wavelet Neural Network Trained by Generalized Extreme Learning Machine. IEEE Trans. Smart Grid 2018, 9, 6961–6971. [Google Scholar] [CrossRef]
  31. Zhang, Q.; Song, T.; Cao, J.; Chen, S.; Du, H.; Wu, Z. The Application of Genetic Grey Neural Network in Equipment Demand Forecasting. In Proceedings of the 2018 2Nd International Conference on Management Engineering, Software Engineering and Service Sciences, Wuhan, China, 13–15 January 2018; ACM: New York, NY, USA, 2018; pp. 84–87. [Google Scholar]
  32. Agrawal, A.; Udmale, S.S.; Sambhe, V.K. Extended Four-Step Travel Demand Forecasting Model for Urban Planning. In Information and Communication Technology for Sustainable Development; Mishra, D.K., Nayak, M.K., Joshi, A., Eds.; Springer: Singapore, 2018; pp. 191–198. [Google Scholar]
  33. Mazar, S.T.; Manicka, Y.D. Enabling Data Communication between an Implantable Medical Device and a Patient Management System. U.S. Patent No. 9,578,449, 21 February 2017. [Google Scholar]
  34. Henderson, T.R.; Lacage, M.; Riley, G.F.; Dowell, C.; Kopena, J. Network Simulations with the ns-3 Simulator. SIGCOMM Demonstr. 2008, 14, 527. [Google Scholar]
Figure 1. Typical architecture of 10G-Passive Optical Network (XG-PON) network.
Electronics 08 00147 g001
Figure 2. XG-PON downstream (DS) BW map for US data transfer [17].
Electronics 08 00147 g002
Figure 3. Traditional dynamic bandwidth allocation (DBA) process diagram.
Electronics 08 00147 g003
Figure 4. Demand Forecasting (DF)-DBA process diagram.
Electronics 08 00147 g004
Figure 5. Throughput Analysis. (a) Throughput (Gbps) vs. Stress (ONUs)-30s (b) Throughput (Gbps) vs. Stress (ONUs)-60s.
Electronics 08 00147 g005
Figure 6. PDR (%) Analysis. (a) PDR (%) vs. Stress (ONUs) -30s (b) PDR (%) vs. Stress (ONUs) -60s.
Electronics 08 00147 g006
Figure 7. Delay Analysis. (a) Delay (ms) vs. Stress (ONUs) -30s. (b) Delay (ms) vs. Stress (ONUs) -60s.
Electronics 08 00147 g007
Table 1. Notation Used.
SymbolDescription
λ(QTCONT)Instantaneous data arrival rate at the ONU TCONTs queue
Req[i]DBRu request sent in the ith frame
Data[i]Amount of data sent in the ith frame
ΔTFrame size, typically 125 μs
iframe number
μMean of last 100 values of λ(QTCONT)
σS.D. of the last 100 values of λ(QTCONT)
LTCONTPredicted demand size
Table 2. Pseudo-code of Demand Forecast DBA engine.
Algorithm
//Initialization
Globals:
int N = 100;   // buffer size
int Req[N];   //DBRu request in the ith frame
int Data[N];  //data sent in the ith frame
int index = 0;
//Step# 1 Data &request frames saved in circular buffer at OLT
OnReceiveDataFrame(Frame)
{
index = (index + 1)% N;  //circular buffer
Data[index] = Frame.ReceivedDataSize;
Req[index] = Frame.DBRU.GetBuffOccupancy();
}
//Step#2 Calculate mean, variance, S.D and predict demand size
int PredictDemandSize()
{
int Sum = 0; for(i = 0; i<N; i++)
{
int i_minus_1 = ((i − 1)+N)%N; //circular buffer
sum += (Req[i] + Data[i] − Req[i_minus_1]);
}
double Mean = Sum/N; // mean is calculated
int Variance = 0; for(i = 0; i<N; i++)
{
int i_minus_1 = ((i − 1) + N)%N; //circular buffer
int Temp = (Req[i] + Data[i] − Req[i_minus_1]);
Variance += (Mean − Temp) * (Mean − Temp);
}
double Var = Variance/N; // variance is calculated
double SD = sqrt(Var);  // S.D is calculated
int PredictedSize = NormalDist_Random(Mean,SD);
return PredictedSize + 128; // add piggybacks & predict demand size
}
Table 3. Description of Simulation Parameters.
ParameterValue
OLT1
Network Load(#ONUs)32, 64, 96, 128, 160, 192, 224
Time30 s, 60 s
Upstream2.5 Gbps
Downstream10 Gbps
Packet size1472 bytes
ApplicationCBR, UDP
TCONT-type5
Environment Area20 km
Table 4. A brief comparison of round robin (RR), GigaPON access network (GIANT) and DF-DBA.
ParametersRRGIANTDF-DBA
WorkingUses a task-based approach and runs each task once, if having a token.Distributes bandwidth in very first iteration based on TCONTs priority.Predicts future ONU demands by statistical modelling
Grant sizeLess than or equal to a predetermined fixed size.Ratio of data rate and US frame size.Flexible, based on previous bandwidth requests and grants.
Grant timeDepends on OLT processing and grant time.Depends on OLT processing and grant time.Depends on OLT processing time
TCONT typeT1–T4T1–T4T5
Processing with no. of ONUsSlowMediumFast
ThroughputPoorPoorHigh
PDRLowMediumHigh
End to End DelayHighHighLow

