Article

Open-Access fNIRS Dataset for Classification of Unilateral Finger- and Foot-Tapping

1
Department of Brain and Cognitive Engineering, Korea University, Seoul 02841, Korea
2
Department of Electronic Engineering, Wonkwang University, Iksan 54538, Korea
*
Authors to whom correspondence should be addressed.
Electronics 2019, 8(12), 1486; https://doi.org/10.3390/electronics8121486
Submission received: 4 November 2019 / Revised: 27 November 2019 / Accepted: 3 December 2019 / Published: 6 December 2019

Abstract

:
Numerous open-access electroencephalography (EEG) datasets have been released and widely employed by EEG researchers. However, not many functional near-infrared spectroscopy (fNIRS) datasets are publicly available. More fNIRS datasets need to be freely accessible in order to facilitate fNIRS studies. Toward this end, we introduce an open-access fNIRS dataset for three-class classification. The concentration changes of oxygenated and reduced hemoglobin were measured, while 30 volunteers repeated each of the three types of overt movements (i.e., left- and right-hand unilateral complex finger-tapping, foot-tapping) for 25 times. The ternary support vector machine (SVM) classification accuracy obtained using leave-one-out cross-validation was estimated at 70.4% ± 18.4% on average. A total of 21 out of 30 volunteers scored a superior binary SVM classification accuracy (left-hand vs. right-hand finger-tapping) of over 80.0%. We believe that the introduced fNIRS dataset can facilitate future fNIRS studies.

1. Introduction

Owing to its many advantages, including portability, convenience in use, and scalability, when compared to functional magnetic resonance imaging, hemodynamic responses can be captured more easily than before using functional near-infrared spectroscopy (fNIRS) [1,2]. fNIRS is less vulnerable to electric noises and less sensitive to motion artifacts than electroencephalography (EEG) [3]. Especially, fNIRS is strongly robust to ocular artifacts; thus, frontal and prefrontal hemodynamic responses are not contaminated by the electrooculogram. These facts have turned the attention of those in the field of brain–computer interfaces (BCIs) towards fNIRS-BCIs as an alternative of EEG-BCIs (EEG-BCIs). In the field of fNIRS-BCIs, a variety of mental tasks (e.g., motor imagery, mental calculation, 3D rotation, and word association) have been adopted to induce task-related hemodynamic responses [4,5,6,7,8,9,10,11,12,13,14,15,16,17,18,19,20,21,22,23,24]. However, the hemodynamic responses induced by the visual stimulus are usually much slower than the steady-state visually evoked potentials, and do not provide unique advantages. Therefore, these hemodynamic responses have not been used for fNIRS studies actively [25,26].
Since hemodynamic responses are inevitably contaminated by physiological noises such as respiration and cardiac pulse, it is essential to separate the task-relevant hemodynamic responses from irrelevant components. Toward this end, researchers have so far conducted interesting studies concerning low-pass and band-pass filters [27,28,29,30,31], adaptive filters [32,33], wavelet filters [34,35], short channel separation [36,37,38], and principal component analysis filters [39,40]. Different types of machine learning methods, such as support vector machine (SVM) [41], linear discriminant analysis [42,43,44], hidden Markov model [45,46], and neural networks, have been considered to discriminate the task-related hemodynamic responses induced by different types of mental tasks. Furthermore, feature selection techniques such as the Fisher score [47], sequential forward selection [48], and genetic algorithm [49] have been applied to enhance the performance improvement of fNIRS-BCI systems. Although fNIRS-BCIs have mainly focused on the implementation of binary BCI systems, multi-class fNIRS-BCI systems have recently been proposed [50,51]. In addition to BCIs, fNIRS has been actively used in clinical and neuroscience areas [52,53,54].
Data acquisition through fNIRS is normally a complicated and laborious task due to the hemodynamic delay on the order of several seconds [55,56]. For this reason, those interested in fNIRS have utilized their time for less essential works rather than the enhancement of fNIRS systems and techniques [57]. These laborious tasks have been redundant in many studies, and such repetitive works should be lessened. Therefore, we present an open-access fNIRS dataset containing 75 trials of three-class overt movements. We provide the temporal hemodynamic responses and ternary classification accuracy of task-related hemodynamic responses as references. The reminder of this paper is organized as follows: Section 2 describes the experiment and fNIRS dataset in detail. In Section 3, we overview the fNIRS system configuration and experimental paradigm. Temporal hemodynamic responses and classification results are presented in Section 4. A brief conclusion is provided in Section 5.

2. fNIRS Dataset

2.1. Participants

A total of 30 volunteers (29 right-handed; 17 males; 23.4 ± 2.5 years old (mean ± standard deviation)) participated in this study. No volunteers reported a history of psychiatric or neurological disorders that could affect the experiment. All the volunteers were provided complete information about the experiment along with the required instructions. Written consent from the participants approved by the Korea University Institutional Review Board (KUIRB-2019-0254-01) were submitted prior to data recording. Experiments were conducted according to the criteria set by the declaration of Helsinki. All volunteers were monetarily reimbursed for their participation.

2.2. Apparatus

The fNIRS data were recorded by a three-wavelength continuous-time multi-channel fNIRS system (LIGHTNIRS, Shimadzu, Kyoto, Japan) consisting of eight light sources (Tx) and eight detectors (Rx). Four each of Tx and Rx were placed around C3 on the left hemisphere, and the rest were placed around C4 on the right hemisphere. Figure 1 depicts the placement of the fNIRS optodes.

2.3. Experimental Paradigm

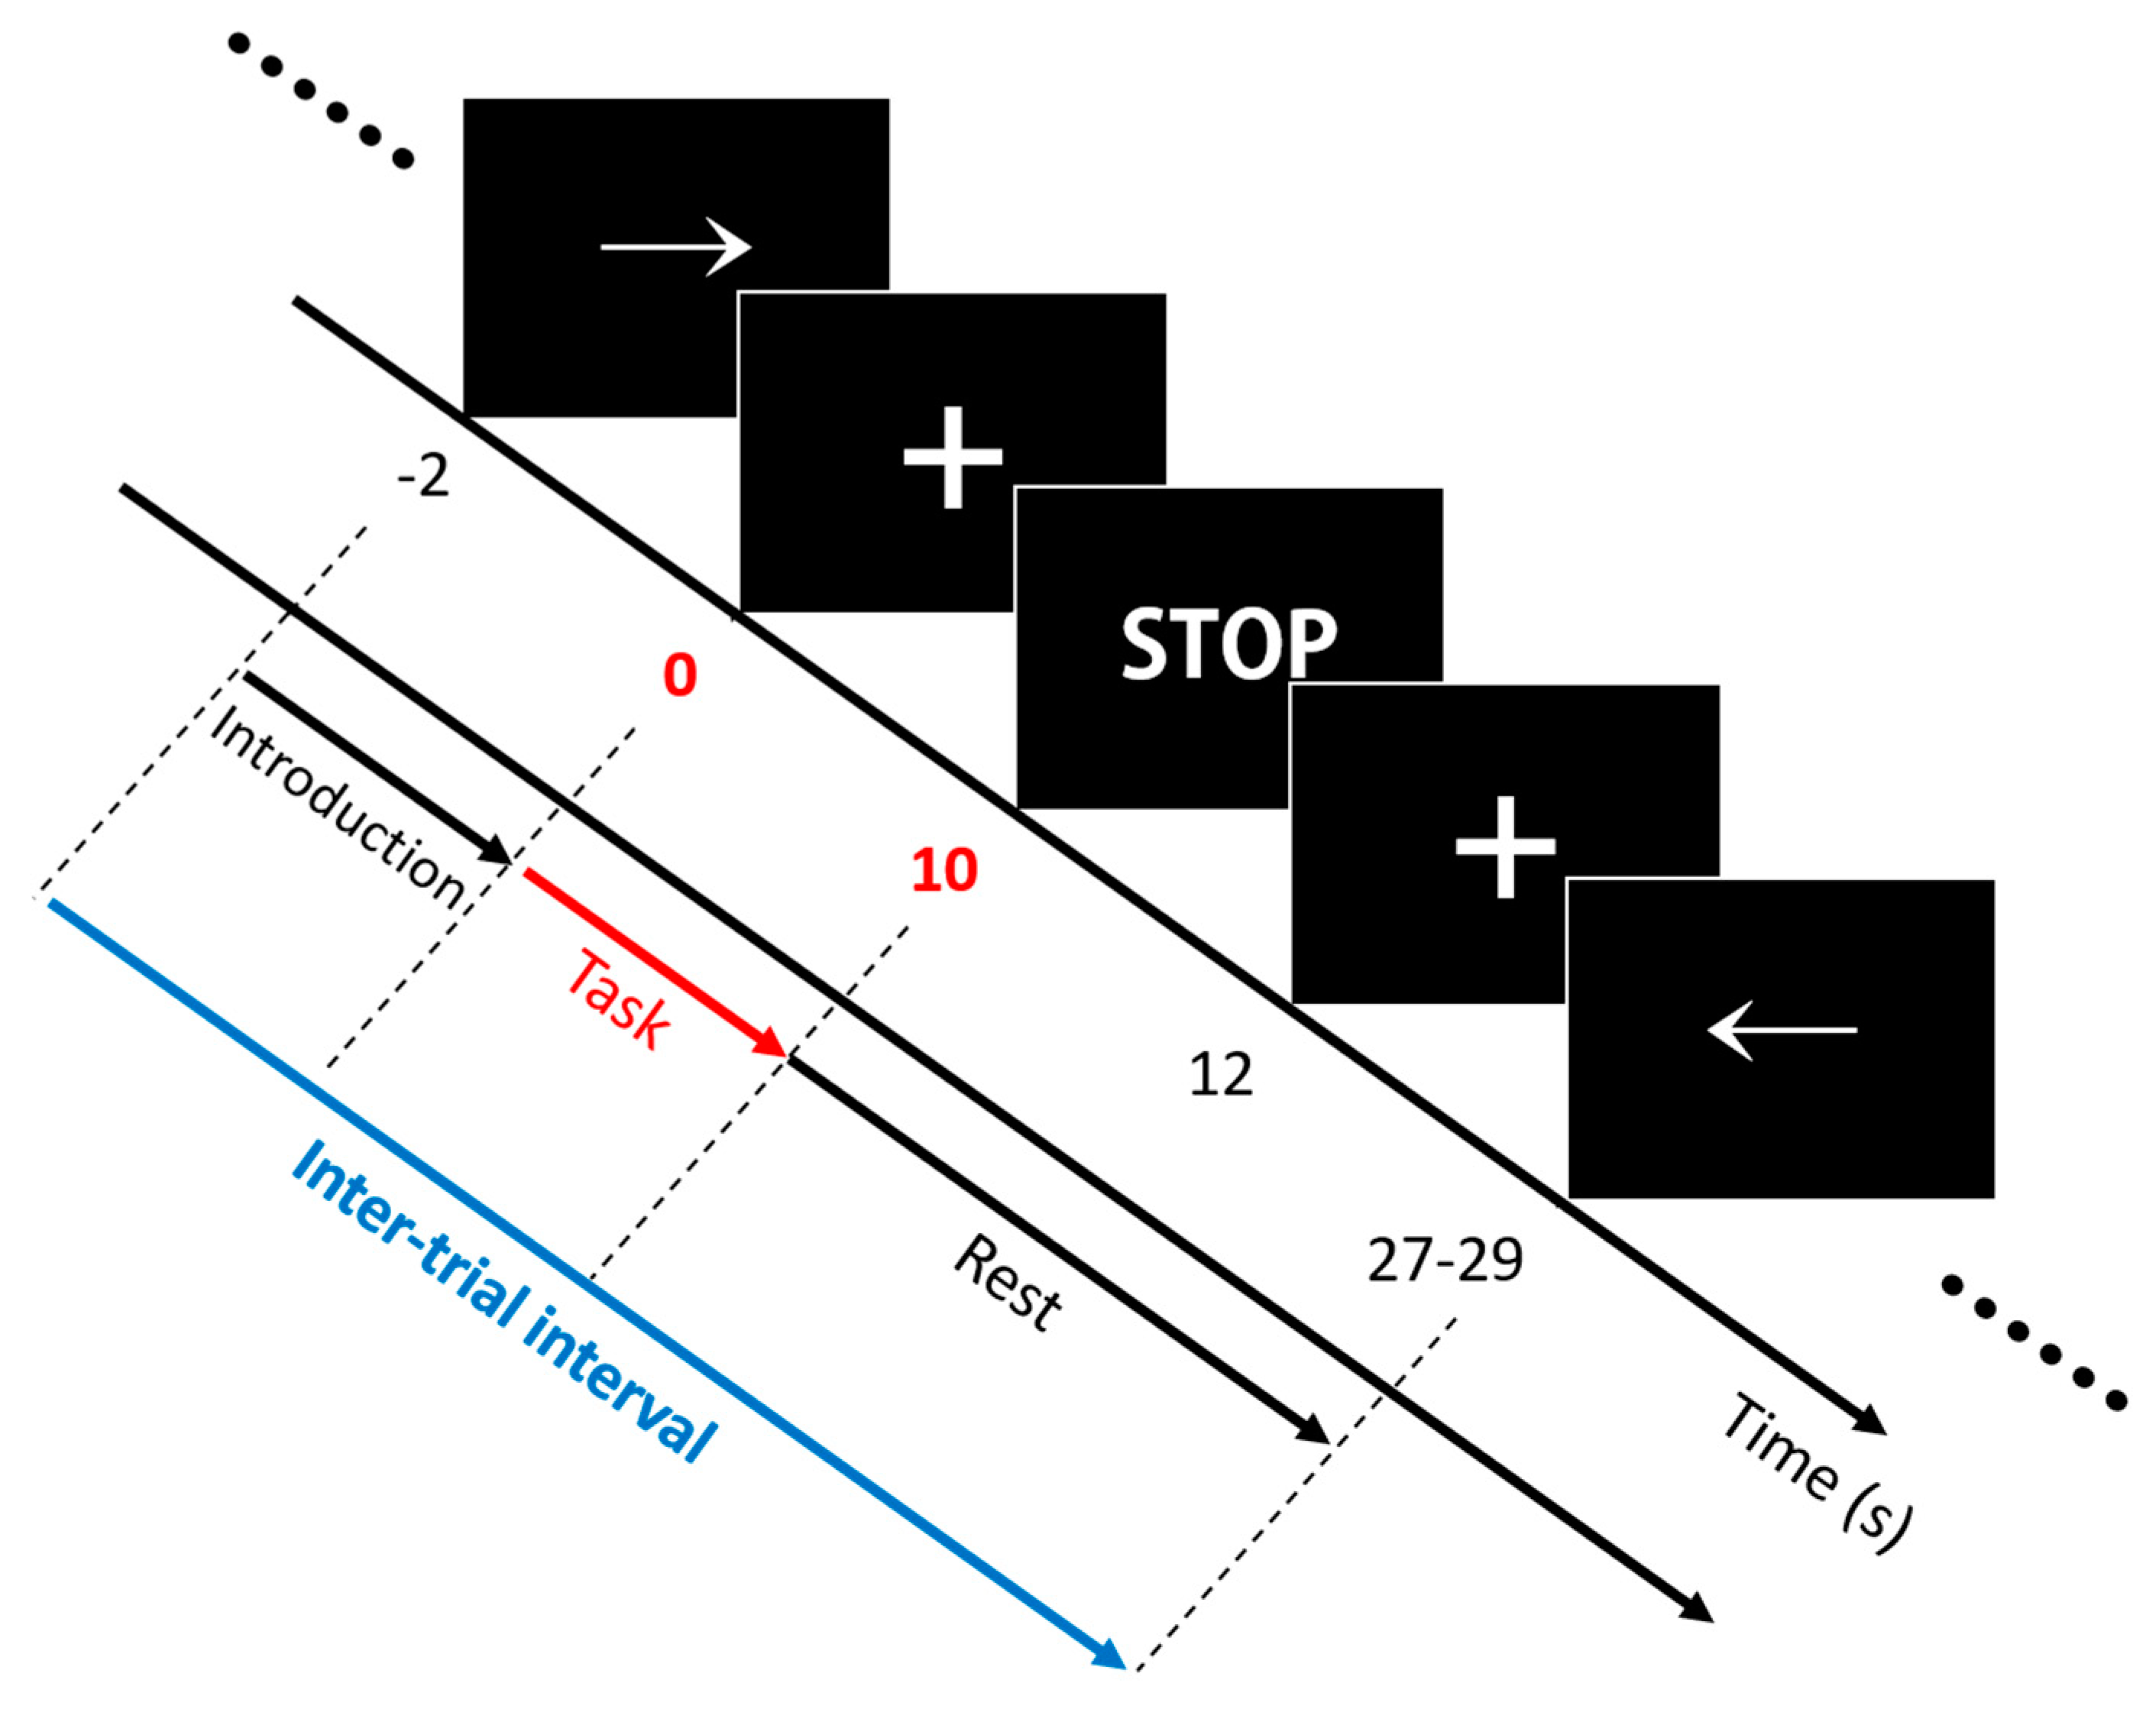
The experiment included three separate sessions comprising 25 trials with respect to each task. A single trial included an introduction period (2 s) and a task period (10 s), followed by an inter-trial break (17–19 s). Note that triggers were transmitted and marked in the data file at the start of the task periods. The inter-trial interval (i.e., the time interval between adjacent triggers) was 30 s on average. The volunteers were seated on a chair in front of a 27-inch LED monitor. The complete information and instructions regarding the experiment were displayed on the monitor. Out of right-hand finger-tapping (RHT), left-hand finger-tapping (LHT), and foot-tapping (FT), a specific task type was displayed at random, which volunteers were required to perform. The assigned task was initiated with a short beep, and the volunteers performed this task continuously during the task period. Then, an “inter-trial break period” was initiated with both a short beep and the display of a “STOP” sign on the monitor. Figure 2 presents the experimental paradigm. For RHT/LHT, the volunteers performed unilateral complex finger-tapping. They tapped their thumbs with other fingers one by one in the direction from the index finger to little finger and repeated it in the reverse order. The tapping continued at a steady rate of 2 Hz. For FT, the volunteers tapped their foot on the same side of their dominant hand constantly at a 1 Hz rate.

2.4. Dataset Description

Data with respect to a total of 30 volunteers were stored in MATLAB (Mathworks, Natick, USA) structure array format. Each volunteer’s data comprised concentration changes of oxygenated/reduced hemoglobin ΔHbO/HbR (cntHb), trigger (mrk), and fNIRS channel information (mnt). Each MATLAB structure array includes several fields, as listed in Table 1. The fNIRS dataset can be conveniently processed through the BBCI toolbox (https://github.com/bbci/bbci_public) implemented by the Berlin Brain–Computer Interface group [58]. The fNIRS dataset is freely downloadable via [59] along with the hands-on tutorials from the GitHub repository [60].

3. Signal Processing

This section presents the signal processing methods employed to obtain the analysis results. All of the signal processing was conducted using MATLAB 2019a.

3.1. Preprocessing and Segmentation

The concentration changes with respect to the oxygenated and reduced hemoglobin (ΔHbO/R) were band-pass filtered through a zero-order filter implemented by the third-order Butterworth filter with a passband of 0.01–0.1 Hz to remove the physiological noises and DC offset. The ΔHbO/R values were segmented into epochs ranging from −2 to 28 s relative to the task onset (i.e., 0 s). The epochs were subjected to a baseline correction to subtract the average value within the reference interval ranging from −1 to 0 s. The epochs included three-class (i.e., RHT, LFT, and FT) ΔHbO/R data with respect to a total of 25 trials. We computed the signal-to-noise ratio ( SNR ) as follows:
SNR = 10 log P s ˜ P n ˜ ,
where P s ˜ and P n ˜ are the powers of filtered data (signal estimate) and “unfiltered data − filtered data” (noise estimate), respectively. The SNRs of each of the channels were stored in the dataset; however, we did not discard the channels with low SNR values to ensure that the low-quality channel rejection according to arbitrary SNR threshold did not affect the classification results. Low-quality channel rejection can be a good practice in some cases to enhance the classification accuracy.

3.2. Classification

To extract the ΔHbO/R features, three time windows in the ranges of 0–5 s, 5–10 s, and 10–15 s within epochs were employed to compute the average ΔHbO/R for each of the 20 channels (the left and right hemispheres with 10 channels each). No feature/channel selection method was applied; therefore, the feature vector comprised three features extracted from 20 channels, and the dimensionality of the feature vector was computed as 120 (3 time windows × 20 channels × 2 chromophores). A linear SVM was used to calculate the binary and ternary classification accuracies. Leave-one-out cross-validation (LOOCV) was applied to validate the fNIRS dataset. LOOCV allocates a single trial data to a test set and the rest of the trial data to a training set in order to train and validate the classifier. This method increases the size of the training set to alleviate problems which could result from the high-dimensional feature vector, and ensure the reproducibility of the cross-validation results. Feature vectors were standardized using the mean and standard deviation of the features included in the training set in order to render the performance of the linear SVM consistent.

4. Results

In this section, we present the primary analysis results, such as the grand averages of temporal ΔHbO/R across all volunteers as well as the average/individual binary and ternary classification accuracies.

4.1. Temporal ΔHbO and ΔHbR

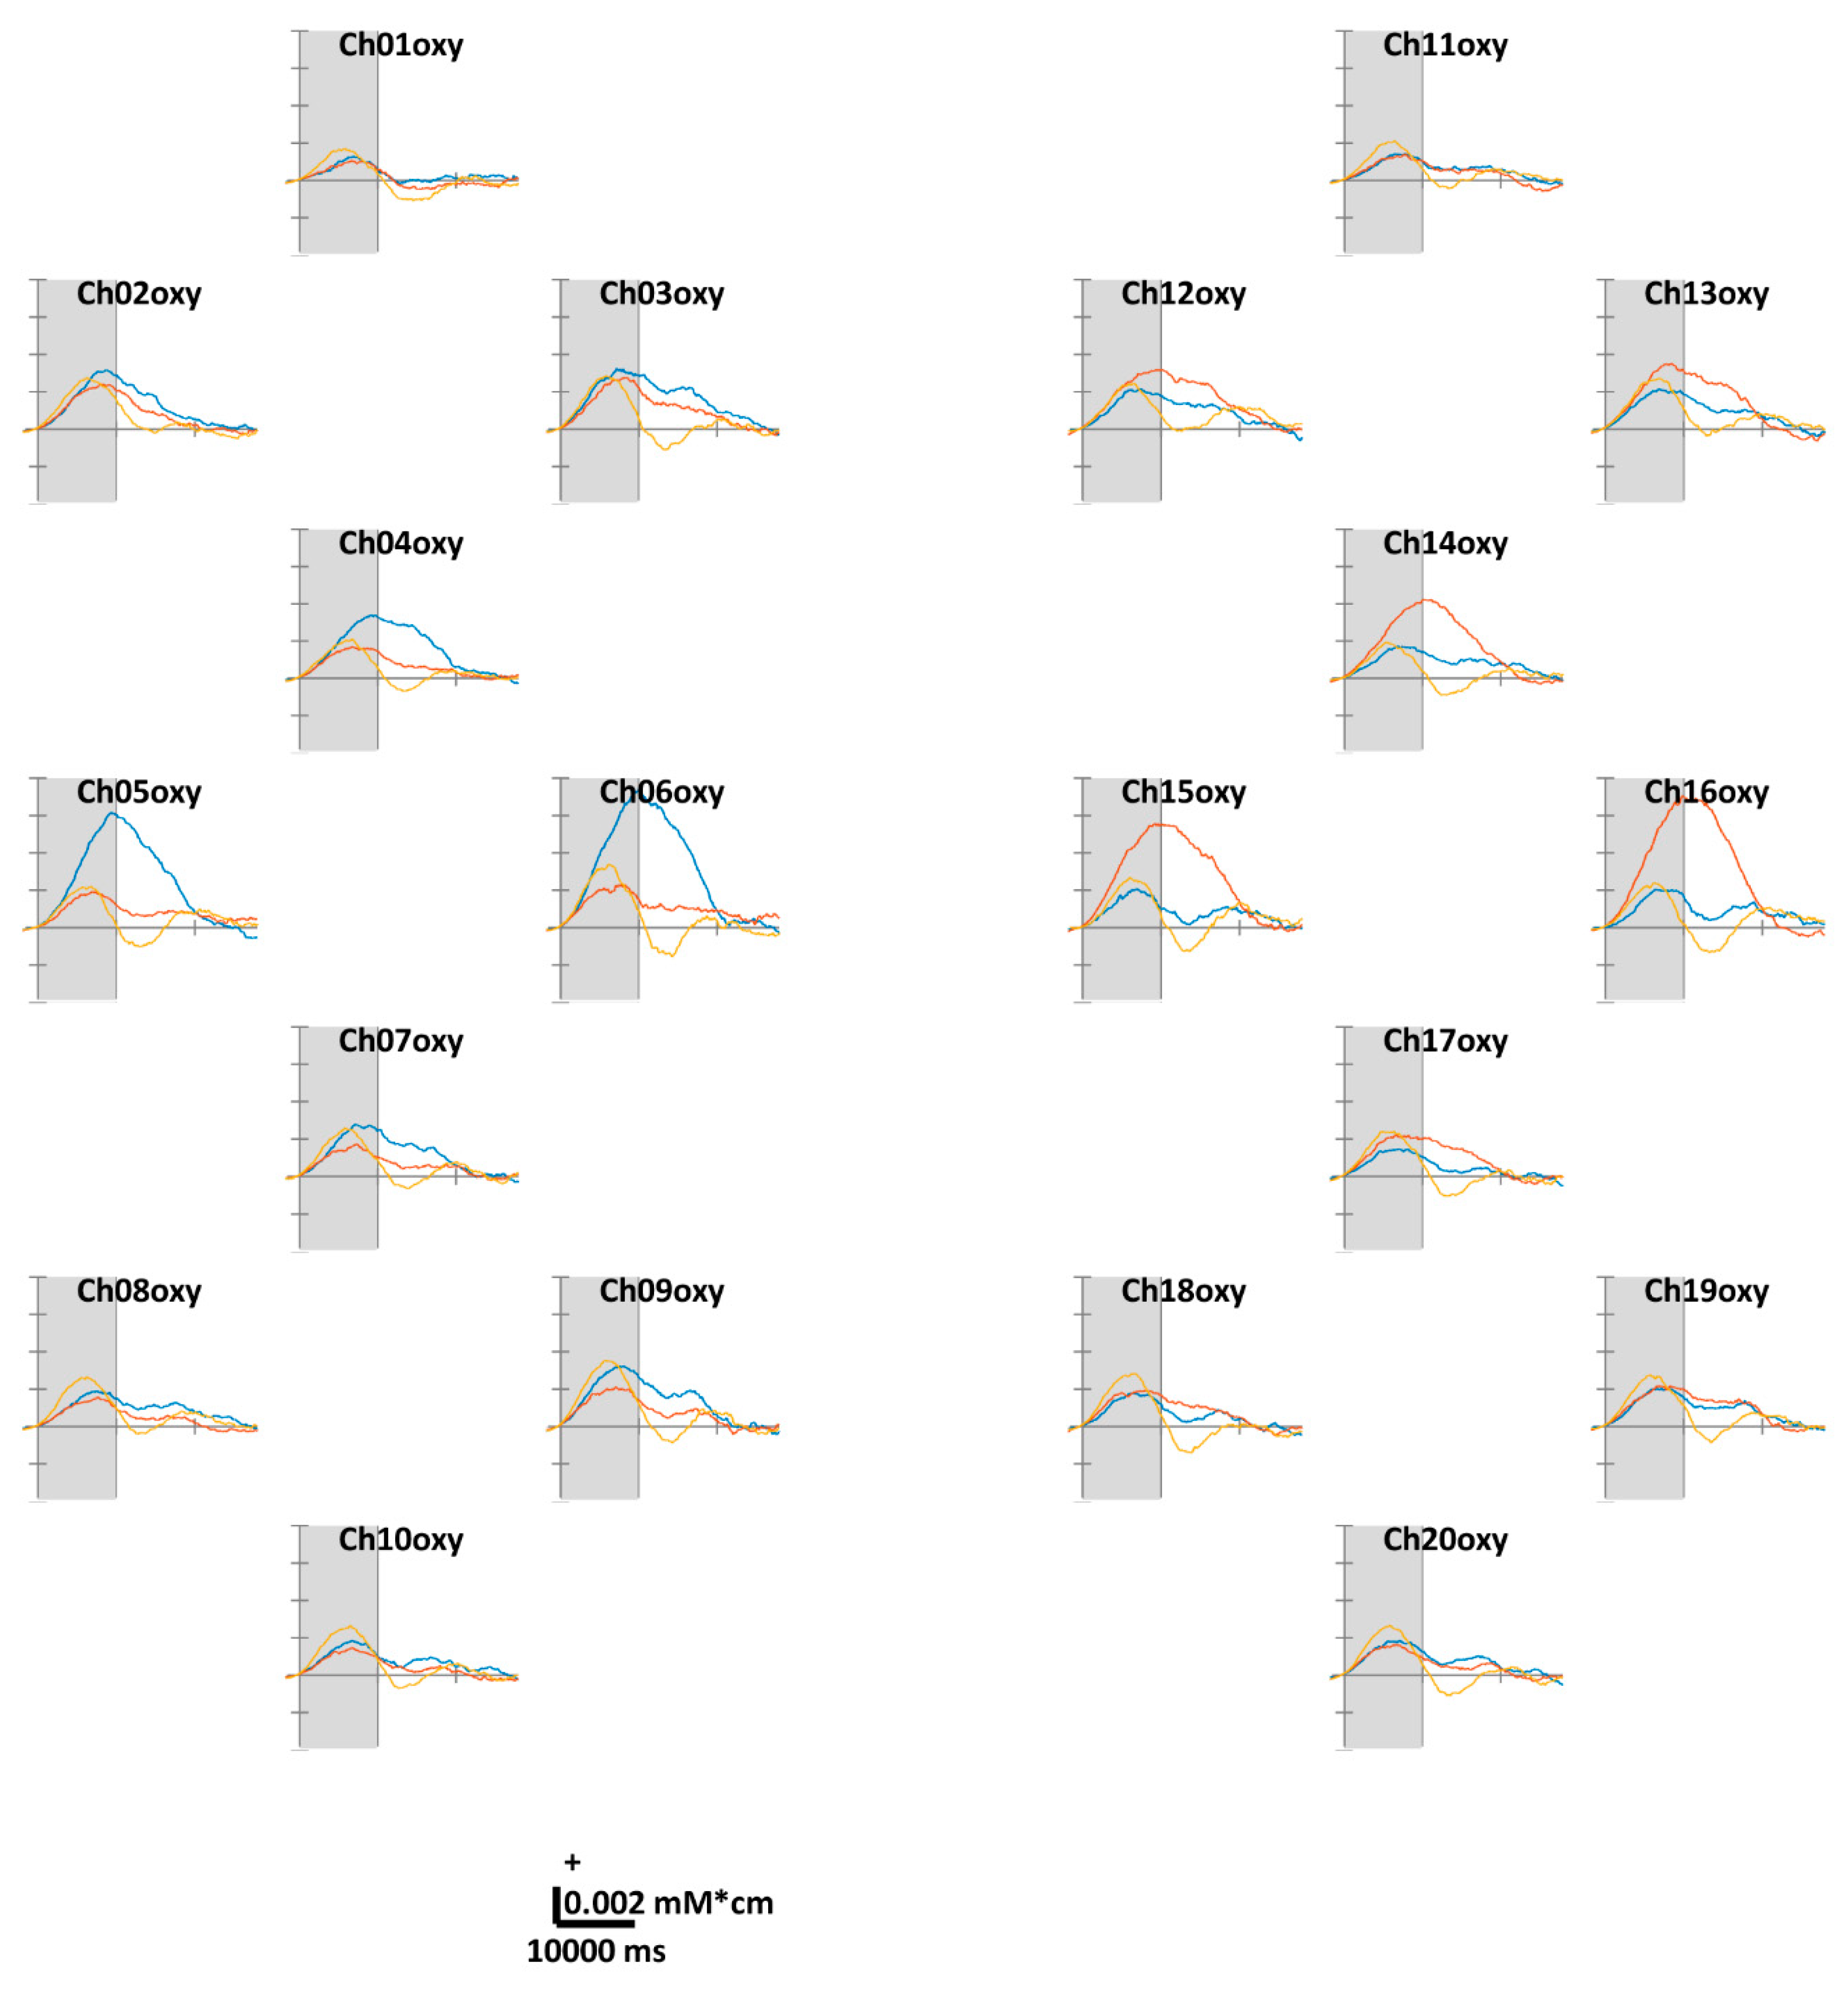
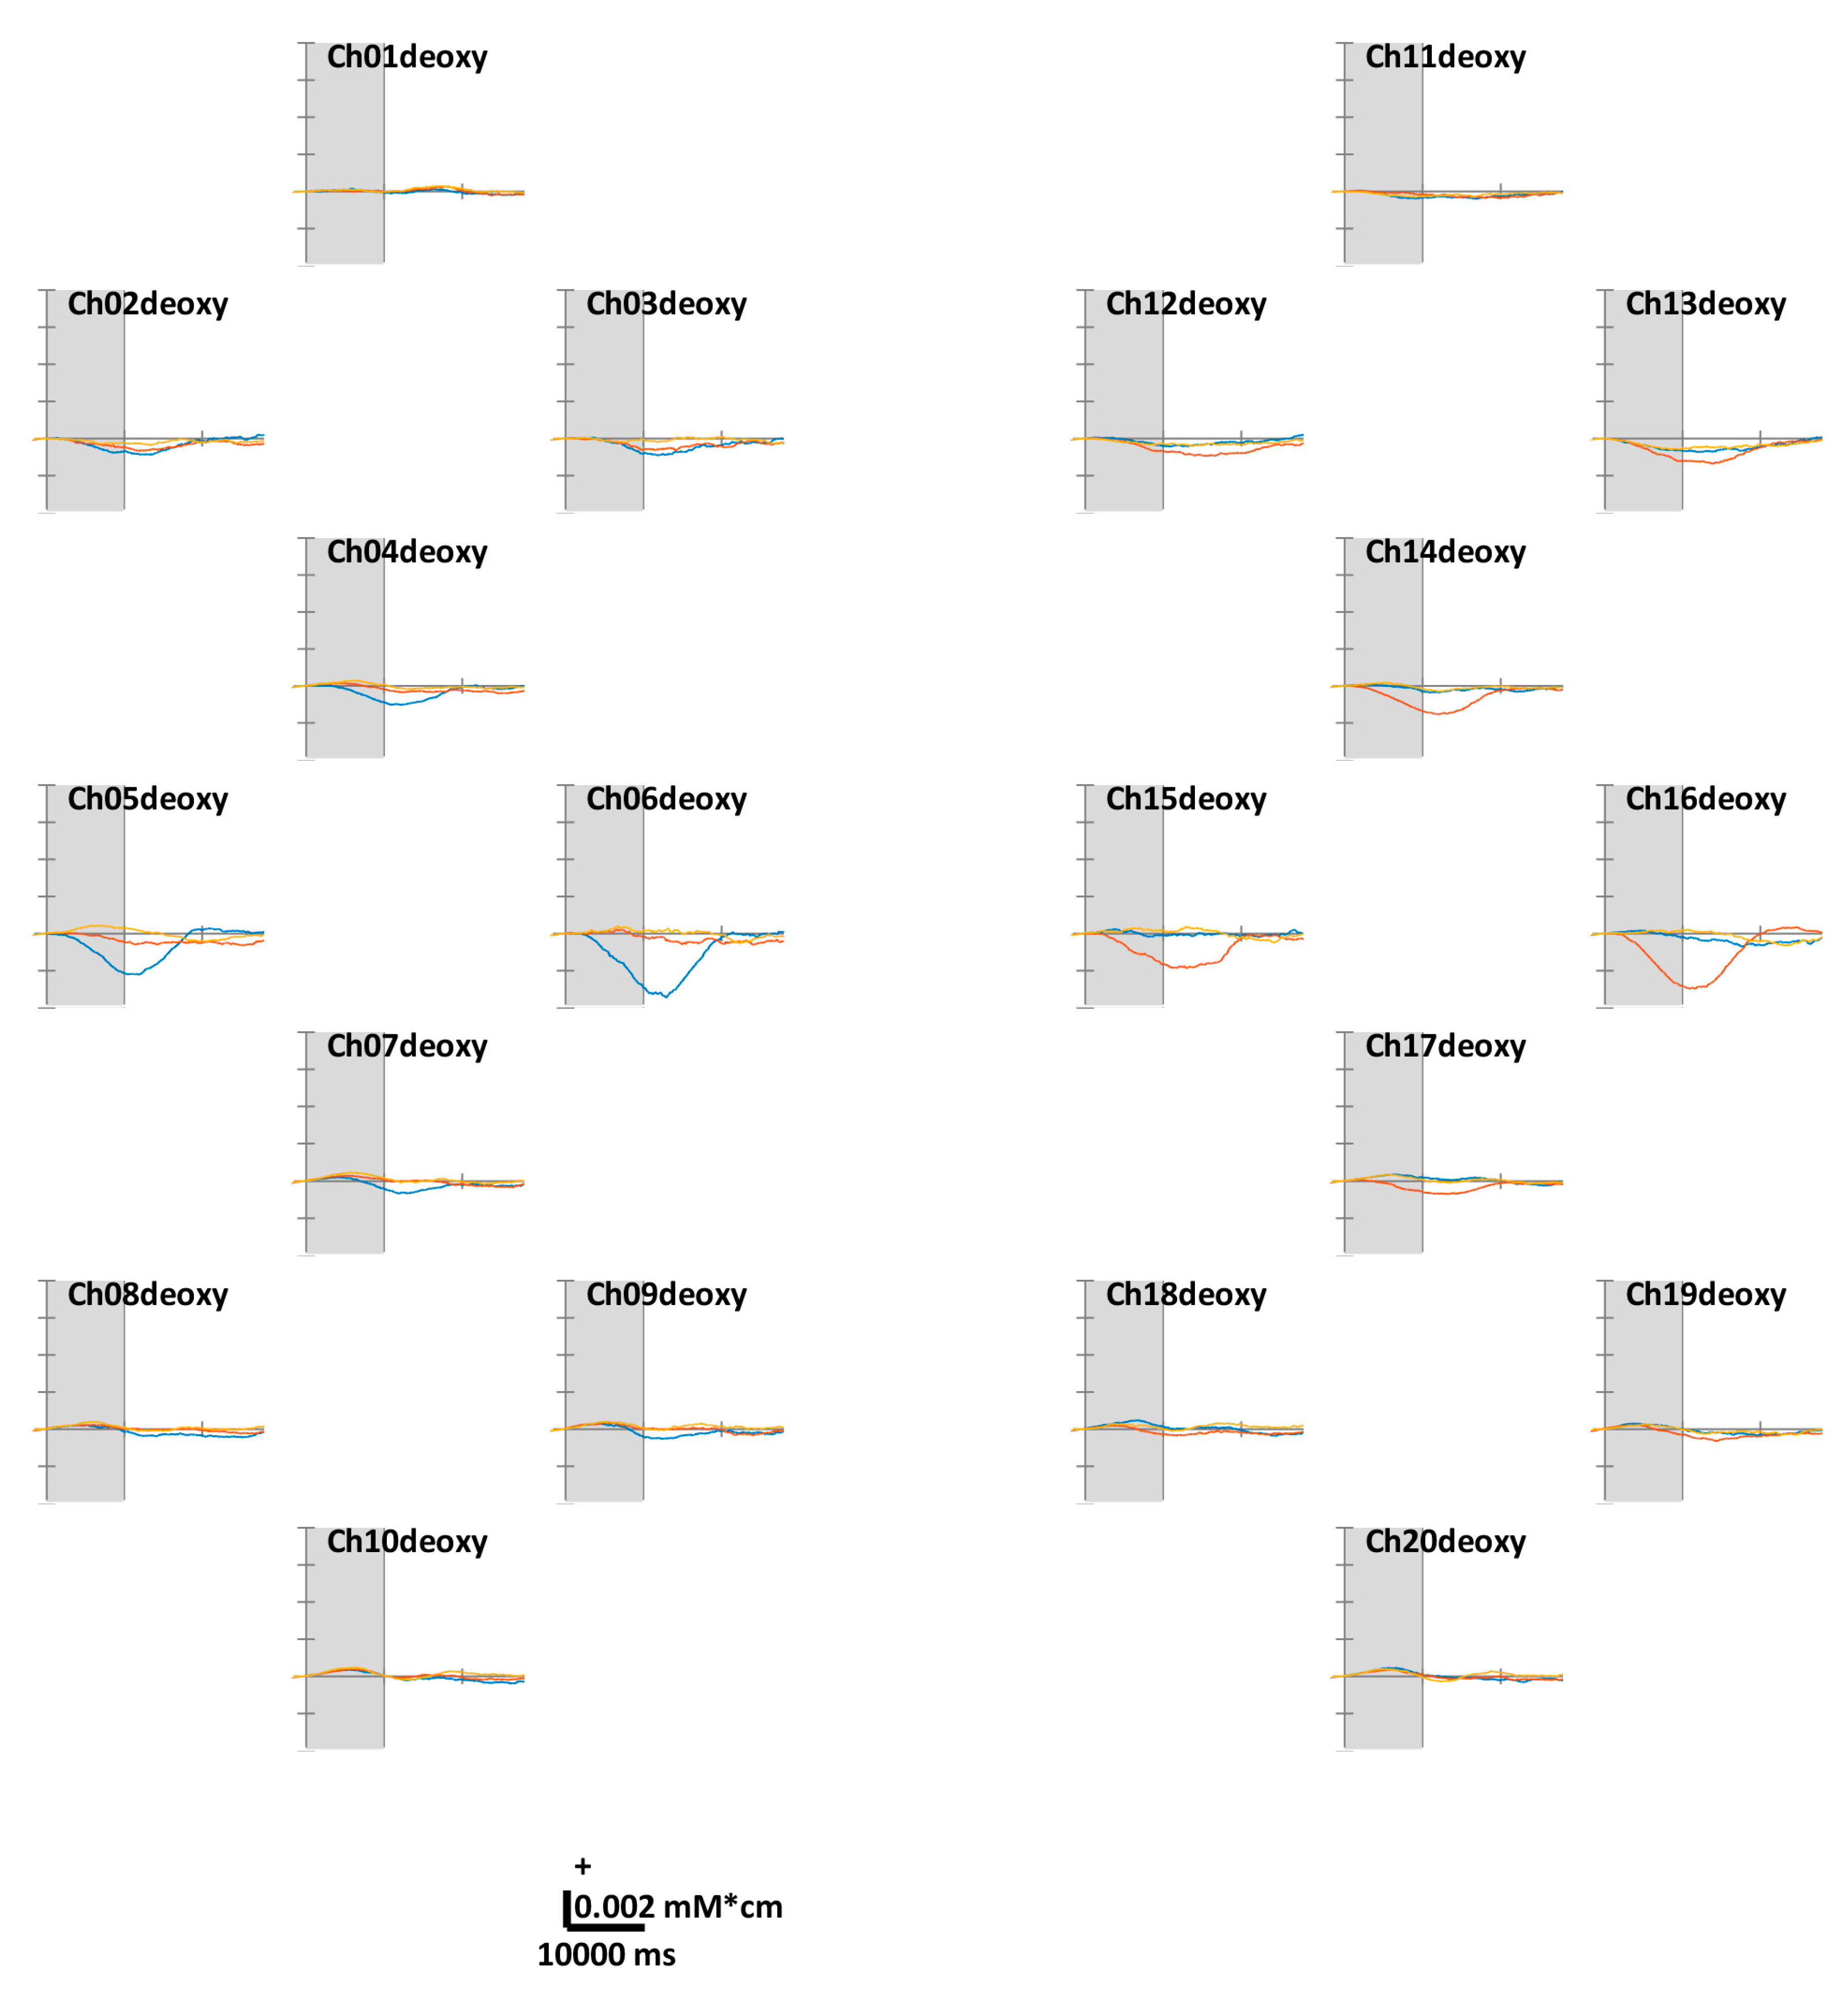
Figure 3 illustrates the task-related ΔHbO. According to the theoretical fact empirically established by numerous studies, the motor cortex regions in contralateral hemispheres were well-activated while the volunteers were performing unilateral finger-tapping. Distinct ΔHbR values were observed at Ch05, 06, 15, and 16 located in the anterior areas of C3 and C4. Unlike unilateral finger-tapping, while performing FT, the HbO responses were completely activated before (at 5–7 s) the end of the task period (at 10 s). At the end of the task period, the HbO level returns close to the baseline. We observed similar trends across all channels. For the ΔHbR values presented in Figure 4, as in the case of HbO, distinct ΔHbR in the direction opposite to that of ΔHbO were observed in (pre)motor cortices in contralateral hemispheres. Distinct ΔHbR was observed in the direction opposite to that of ΔHbO corresponding to the same location, particularly at Ch05, 06, 15, and 16.

4.2. Classification Accuracy

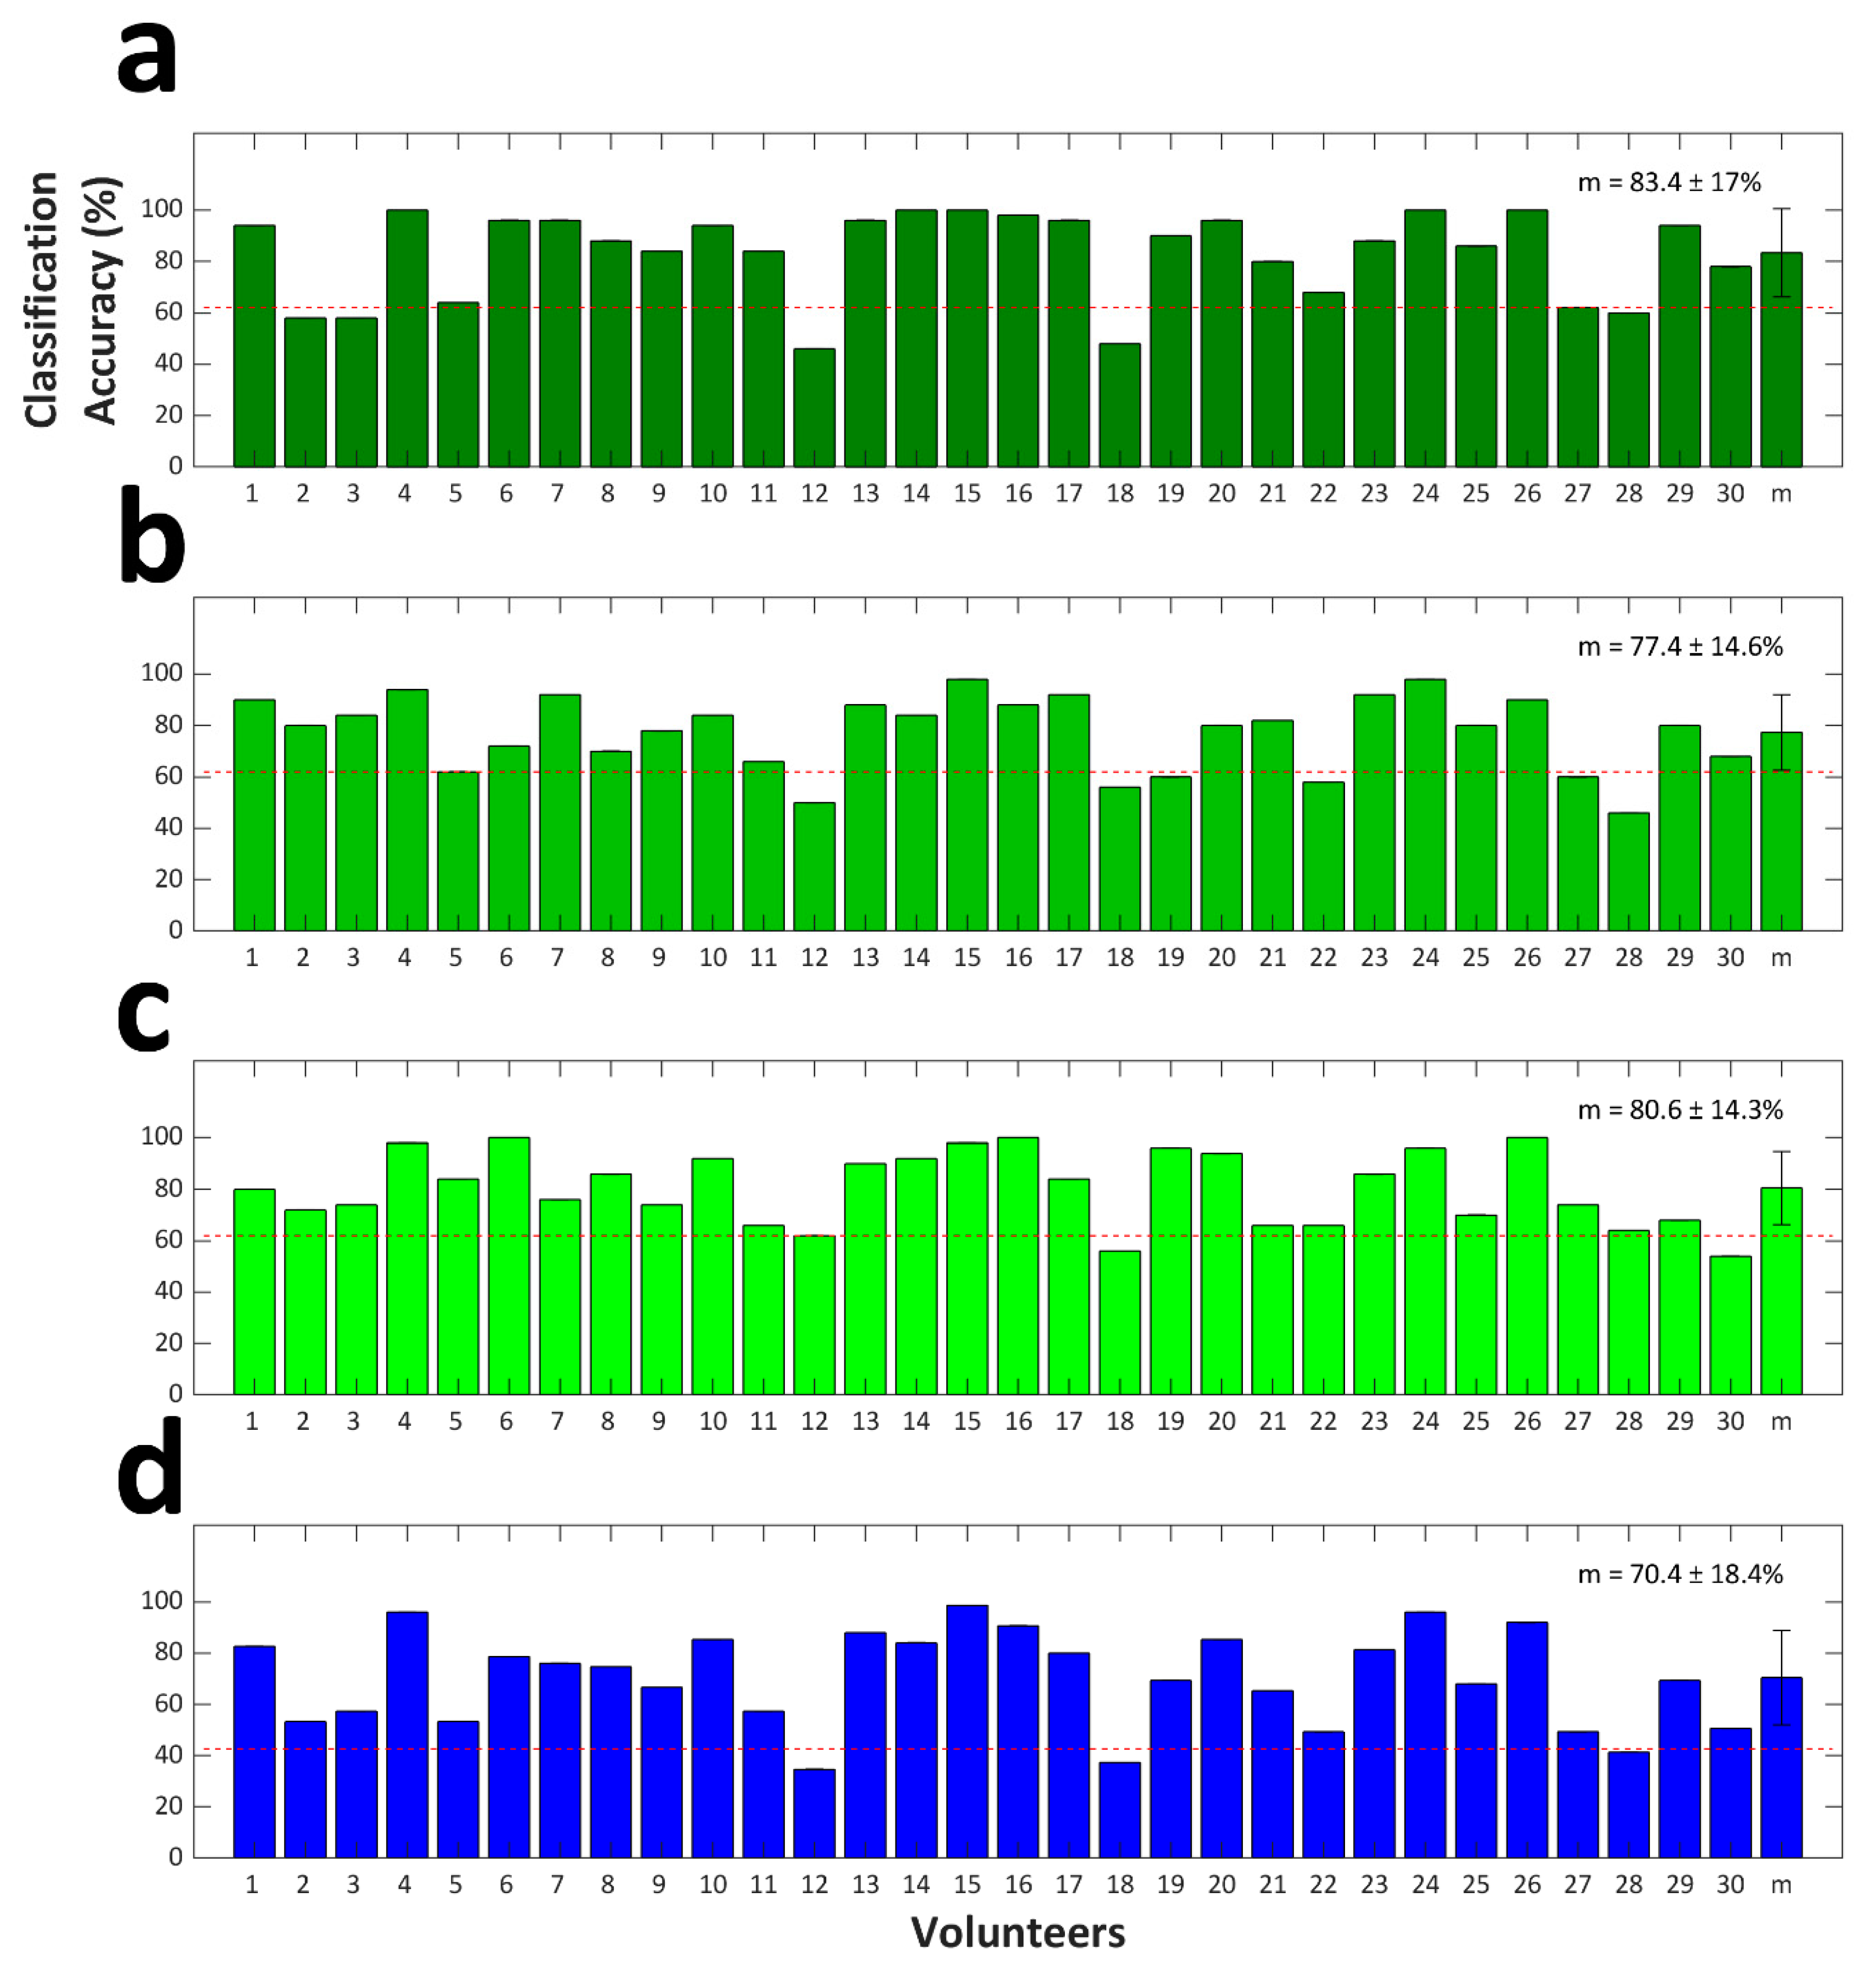
The LOOCV results are presented in Figure 5. The grand averages of binary classification accuracies were estimated at 83.4% ± 17.0%, 77.4% ± 14.6%, and 80.6% ± 14.3% for RFT vs. LFT, RFT vs. FT, and LFT vs. FT, respectively. A significant difference in the classification accuracy with respect to the three binary classification cases 2qs observed (Friedman test, p < 0.01). Using post-hoc analysis, we revealed that RFT vs. LFT classification accuracy 2qs significantly higher than RFT vs. FT classification accuracy (Wilcoxon signed-rank test with Bonferroni correction; corrected p < 0.01). Differences in the classification accuracies of the rest of the binary classification cases were not statistically significant. The grand average of the ternary classification accuracy was estimated at 70.4% ± 18.4%. Note that the results with respect to 27 out of 30 volunteers exceeded the theoretical chance level of ternary classification of 42.7% (p < 0.05) [61].

5. Discussion and Conclusions

As shown in Figure 3 and Figure 4, the ΔHbO/R values with respect to the three tasks demonstrated consistent differences in specific channels and time intervals. Therefore, it was observed that the temporal averages of ΔHbO/R within specific time intervals could be considered as relevant features to discriminate the task-related fNIRS data. As the feature extraction procedure employed for the classification was not optimized, more relevant feature extraction and selection could improve the binary and ternary classification accuracies. We provide brief tutorials along with the fNIRS dataset in order to enable an efficient handling of the dataset. We anticipate more interesting fNIRS studies and consider that the provided fNIRS dataset could contribute to the advancement of fNIRS technologies in the future.

Author Contributions

J.S. conceptualized the study and J.J. supervised the study. S.B. and J.P. implemented software for experiments and conducted experiments. S.B. and J.S. analyzed the data and wrote the manuscript. All authors reviewed the final manuscript.

Funding

This research was supported in part by Institute of Information & communications Technology Planning & Evaluation (IITP) grant funded by the Korea government (MIST) (2017-0-00451) and by the Basic Science Research Program through the National Research Foundation of Korea funded by the Ministry of Education, Science and Technology under Grant NRF-2018R1D1A1B07042378.

Conflicts of Interest

The authors declare no conflicts of interest. The funders had no role in the design of the study; in the collection, analyses, or interpretation of data; in the writing of the manuscript; or in the decision to publish the results.

References

  1. Coyle, S.; Ward, T.; Markham, C.; McDarby, G. On the suitability of near-infrared (NIR) systems for next-generation brain-computer interfaces. Physiol. Meas. 2004, 25, 815–822. [Google Scholar] [CrossRef] [PubMed] [Green Version]
  2. Boas, D.A.; Elwell, C.E.; Ferrari, M.; Taga, G. Twenty years of functional near-infrared spectroscopy: Introduction for the special issue. Neuroimage 2014, 85, 1–5. [Google Scholar] [CrossRef] [PubMed]
  3. Shin, J.; Kim, D.-W.; Müller, K.-R.; Hwang, H.-J. Improvement of information transfer rates using a hybrid EEG-NIRS brain-computer interface with a short trial length: Offline and pseudo-online analyses. Sensors 2018, 18, 1827. [Google Scholar] [CrossRef] [PubMed] [Green Version]
  4. Hwang, H.-J.; Lim, J.-H.; Kim, D.-W.; Im, C.-H. Evaluation of various mental task combinations for near-infrared spectroscopy-based brain-computer interfaces. J. Biomed. Opt. 2014, 19, 077005. [Google Scholar] [CrossRef] [PubMed]
  5. Rueckert, L.; Lange, N.; Partiot, A.; Appollonio, I.; Litvan, I.; Le Bihan, D.; Grafman, J. Visualizing Cortical Activation during Mental Calculation with Functional MRI. Neuroimage 1996, 3, 97–103. [Google Scholar] [CrossRef] [PubMed] [Green Version]
  6. MacDonald, A.; Cohen, J.; Stenger, V.; Carter, C. Dissociating the Role of the Dorsolateral Prefrontal and Anterior Cingulate Cortex in Cognitive Control. Science 2000, 288, 1835–1838. [Google Scholar] [CrossRef] [Green Version]
  7. Herrmann, M.J.; Ehlis, A.C.; Fallgatter, A.J. Prefrontal activation through task requirements of emotional induction measured with NIRS. Biol. Psychol. 2003, 64, 255–263. [Google Scholar] [CrossRef]
  8. Rowe, J.B.; Stephan, K.E.; Friston, K.; Frackowiak, R.S.; Passingham, R.E. The prefrontal cortex shows context-specific changes in effective connectivity to motor or visual cortex during the selection of action or colour. Cereb. Cortex 2005, 15, 85–95. [Google Scholar] [CrossRef] [Green Version]
  9. Nagamitsu, S.; Nagano, M.; Yamashita, Y.; Takashima, S.; Matsuishi, T. Prefrontal cerebral blood volume patterns while playing video games-a near-infrared spectroscopy study. Brain Dev. 2006, 28, 315–321. [Google Scholar] [CrossRef]
  10. Yang, H.; Zhou, Z.; Liu, Y.; Ruan, Z.; Gong, H.; Luo, Q.; Lu, Z. Gender difference in hemodynamic responses of prefrontal area to emotional stress by near-infrared spectroscopy. Behav. Brain Res. 2007, 178, 172–176. [Google Scholar] [CrossRef]
  11. Medvedev, A.V.; Kainerstorfer, J.M.; Borisov, S.V.; VanMeter, J. Functional connectivity in the prefrontal cortex measured by near-infrared spectroscopy during ultrarapid object recognition. J. Biomed. Opt. 2011, 16, 016008. [Google Scholar] [CrossRef] [PubMed] [Green Version]
  12. Power, S.D.; Kushki, A.; Chau, T. Towards a system-paced near-infrared spectroscopy brain–computer interface: Differentiating prefrontal activity due to mental arithmetic and mental singing from the no-control state. J. Neural Eng. 2011, 8, 066004. [Google Scholar] [CrossRef] [PubMed]
  13. Power, S.D.; Kushki, A.; Chau, T. Automatic single-trial discrimination of mental arithmetic, mental singing and the no-control state from prefrontal activity: Toward a three-state NIRS-BCI. BMC Res. Notes 2012, 5, 141. [Google Scholar] [CrossRef] [PubMed] [Green Version]
  14. Chai, R.; Ling, S.H.; Hunter, G.P.; Nguyen, H.T. Mental task classifications using prefrontal cortex electroencephalograph signals. In Proceedings of the 2012 Annual International Conference of the IEEE Engineering in Medicine and Biology Society, San Diego, CA, USA, 28 August–1 September 2012; pp. 1831–1834. [Google Scholar]
  15. Herff, C.; Heger, D.; Fortmann, O.; Hennrich, J.; Putze, F.; Schultz, T. Mental workload during n-back task—quantified in the prefrontal cortex using fNIRS. Front. Hum. Neurosci. 2013, 7, 935. [Google Scholar] [CrossRef] [Green Version]
  16. Naseer, N.; Hong, M.J.; Hong, K.-S. Online binary decision decoding using functional near-infrared spectroscopy for the development of brain–computer interface. Exp. Brain Res. 2014, 232, 555–564. [Google Scholar] [CrossRef]
  17. Shin, J.; Müller, K.-R.; Hwang, H.-J. Near-infrared spectroscopy (NIRS) based eyes-closed brain-computer interface (BCI) using prefrontal cortex activation due to mental arithmetic. Sci. Rep. 2016, 6, 36203. [Google Scholar] [CrossRef]
  18. Zafar, A.; Hong, K.S. Detection and classification of three-class initial dips from prefrontal cortex. Biomed. Opt. Express 2017, 8, 367–383. [Google Scholar] [CrossRef]
  19. Shin, J.; Kwon, J.; Choi, J.; Im, C.H. Ternary near-infrared spectroscopy brain-computer interface with increased information transfer rate using prefrontal hemodynamic changes during mental arithmetic, breath-Holding, and idle State. IEEE Access 2018, 6, 19491–19498. [Google Scholar] [CrossRef]
  20. Shin, J.; Im, C.-H. Performance prediction for a near-infrared spectroscopy-brain–computer interface using resting-state functional connectivity of the prefrontal Cortex. Int. J. Neural Syst. 2018, 28, 1850023. [Google Scholar] [CrossRef]
  21. Zephaniah, P.V.; Kim, J.G. Recent functional near infrared spectroscopy based brain computer interface systems: Developments, applications and challenges. Biomed. Eng. Lett. 2014, 4, 223–230. [Google Scholar] [CrossRef]
  22. Ferrari, M.; Quaresima, V. A brief review on the history of human functional near-infrared spectroscopy (fNIRS) development and fields of application. Neuroimage 2012, 63, 921–935. [Google Scholar] [CrossRef] [PubMed]
  23. Naseer, N.; Hong, K.-S. fNIRS-based brain-computer interfaces: A review. Front. Hum. Neurosci. 2015, 9, 00003. [Google Scholar] [CrossRef] [PubMed] [Green Version]
  24. Dornhege, G.; Millán, J.R.; Hinterberger, T.; McFarland, D.; Müller, K.-R. Toward Brain-Computer Interfacing; MIT Press: Cambridge, MA, USA, 2007. [Google Scholar]
  25. Hoshi, Y.; Tamura, M. Dynamic multichannel near-infrared optical imaging of human brain activity. J. Appl. Physiol. 1993, 75, 1842–1846. [Google Scholar] [CrossRef] [PubMed] [Green Version]
  26. Tomita, Y.; Vialatte, F.B.; Dreyfus, G.; Mitsukura, Y.; Bakardjian, H.; Cichocki, A. Bimodal BCI using simultaneously NIRS and EEG. IEEE Trans. Biomed. Eng. 2014, 61, 1274–1284. [Google Scholar] [CrossRef] [PubMed]
  27. Shin, J.; Kwon, J.; Im, C.-H. A multi-class hybrid EEG-NIRS brain-computer interface for the classification of brain activation patterns during mental arithmetic, motor imagery, and idle state. Front. Neuroinform. 2018, 23, 5. [Google Scholar] [CrossRef]
  28. Shin, J.; Kwon, J.; Im, C.-H. A ternary hybrid EEG-NIRS brain-computer interface for the classification of brain activation patterns during mental arithmetic, motor imagery, and idle state. Front. Neuroinform. 2018, 12, 5. [Google Scholar] [CrossRef]
  29. Shin, J.; von Lühmann, A.; Kim, D.-W.; Mehnert, J.; Hwang, H.-J.; Müller, K.-R. Simultaneous acquisition of EEG and NIRS during cognitive tasks for an open access dataset. Sci. Data 2018, 5, 180003. [Google Scholar] [CrossRef]
  30. Shin, J.; Muller, K.R.; Hwang, H.J. Eyes-closed hybrid brain-computer interface employing frontal brain activation. PLoS ONE 2018, 13, e0196359. [Google Scholar] [CrossRef]
  31. Shin, J.; von Lühmann, A.; Blankertz, B.; Kim, D.-W.; Jeong, J.; Hwang, H.-J.; Müller, K.-R. Open access dataset for EEG+NIRS single-trial classification. IEEE Trans. Neural Syst. Rehabil. Eng. 2017, 25, 1735–1745. [Google Scholar] [CrossRef]
  32. Zhang, Q.; Brown, E.; Strangman, G. Adaptive filtering for global interference cancellation and real-time recovery of evoked brain activity: A Monte Carlo simulation study. J. Biomed. Opt. 2007, 12, 044014. [Google Scholar] [CrossRef]
  33. Dong, S.; Jeong, J. Improvement in recovery of hemodynamic responses by extended Kalman filter with non-linear state-space model and short separation measurement. IEEE Trans. Biomed. Eng. 2019, 66, 2152–2162. [Google Scholar] [CrossRef] [PubMed]
  34. Abibullaev, B.; An, J. Classification of frontal cortex haemodynamic responses during cognitive tasks using wavelet transforms and machine learning algorithms. Med. Eng. Phys. 2012, 34, 1394–1410. [Google Scholar] [CrossRef] [PubMed]
  35. Molavi, B.; Dumont, G.A. Wavelet-based motion artifact removal for functional near-infrared spectroscopy. Physiol. Meas. 2012, 33, 259–270. [Google Scholar] [CrossRef] [PubMed]
  36. Gagnon, L.; Cooper, R.J.; Yücel, M.A.; Perdue, K.L.; Greve, D.N.; Boas, D.A. Short separation channel location impacts the performance of short channel regression in NIRS. Neuroimage 2012, 59, 2518–2528. [Google Scholar] [CrossRef] [Green Version]
  37. Gagnon, L.; Yücel, M.A.; Boas, D.A.; Cooper, R.J. Further improvement in reducing superficial contamination in NIRS using double short separation measurements. Neuroimage 2014, 85, 127–135. [Google Scholar] [CrossRef] [Green Version]
  38. Brigadoi, S.; Cooper, R.J. How short is short? optimum source-detector distance for short-separation channels in functional near-infrared spectroscopy. Neurophotonics 2015, 2, 025005. [Google Scholar] [CrossRef] [Green Version]
  39. Abibullaev, B.; An, J.; Lee, S.H.; Moon, J.I. Design and evaluation of action observation and motor imagery based BCIs using near-infrared spectroscopy. Measurement 2017, 98, 250–261. [Google Scholar] [CrossRef]
  40. Virtanen, J.; Noponen, T.; Merilainen, P. Comparison of principal and independent component analysis in removing extracerebral interference from near-infrared spectroscopy signals. J. Biomed. Opt. 2009, 14, 054032. [Google Scholar] [CrossRef]
  41. Luu, S.; Chau, T. Decoding subjective preference from single-trial near-infrared spectroscopy signals. J. Neural Eng. 2009, 6, 016003. [Google Scholar] [CrossRef]
  42. Fazli, S.; Mehnert, J.; Steinbrink, J.; Curio, G.; Villringer, A.; Müller, K.-R.; Blankertz, B. Enhanced performance by a hybrid NIRS-EEG brain computer interface. Neuroimage 2012, 59, 519–529. [Google Scholar] [CrossRef]
  43. Naseer, N.; Noori, F.M.; Qureshi, N.K.; Hong, K.S. Determining optimal feature-combination for LDA classification of functional near-infrared spectroscopy signals in brain-computer interface application. Front. Hum. Neurosci. 2016, 10, 237. [Google Scholar] [CrossRef] [Green Version]
  44. Hong, K.S.; Bhutta, M.R.; Liu, X.L.; Shin, Y.I. Classification of somatosensory cortex activities using fNIRS. Behav. Brain Res. 2017, 333, 225–234. [Google Scholar] [CrossRef]
  45. Sitaram, R.; Zhang, H.H.; Guan, C.T.; Thulasidas, M.; Hoshi, Y.; Ishikawa, A.; Shimizu, K.; Birbaumer, N. Temporal classification of multichannel near-infrared spectroscopy signals of motor imagery for developing a brain-computer interface. Neuroimage 2007, 34, 1416–1427. [Google Scholar] [CrossRef] [PubMed]
  46. Power, S.D.; Falk, T.H.; Chau, T. Classification of prefrontal activity due to mental arithmetic and music imagery using hidden Markov models and frequency domain near-infrared spectroscopy. J. Neural Eng. 2010, 7, 026002. [Google Scholar] [CrossRef] [PubMed] [Green Version]
  47. Hwang, H.J.; Choi, H.; Kim, J.Y.; Chang, W.D.; Kim, D.W.; Kim, K.W.; Jo, S.H.; Im, C.H. Toward more intuitive brain-computer interfacing: Classification of binary covert intentions using functional near-infrared spectroscopy. J. Biomed. Opt. 2016, 21, 091303. [Google Scholar] [CrossRef] [PubMed] [Green Version]
  48. Schudlo, L.C.; Chau, T. Dynamic topographical pattern classification of multichannel prefrontal NIRS signals: II. Online differentiation of mental arithmetic and rest. J. Neural Eng. 2014, 11, 016003. [Google Scholar] [CrossRef]
  49. Noori, F.M.; Naseer, N.; Qureshi, N.K.; Nazeer, H.; Khan, R.A. Optimal feature selection from fNIRS signals using genetic algorithms for BCI. Neurosci. Lett. 2017, 647, 61–66. [Google Scholar] [CrossRef]
  50. Schudlo, L.C.; Chau, T. Development of a ternary near-infrared spectroscopy brain-computer interface: Online classification of verbal fluency task, stroop task and rest. Int. J. Neural Syst. 2018, 28, 1750052. [Google Scholar] [CrossRef]
  51. Schudlo, L.C.; Chau, T. Towards a ternary NIRS-BCI: Single-trial classification of verbal fluency task, Stroop task and unconstrained rest. J. Neural Eng. 2015, 12, 066008. [Google Scholar] [CrossRef]
  52. Molavi, B.; May, L.; Gervain, J.; Carreiras, M.; Werker, J.F.; Dumont, G.A. Analyzing the resting state functional connectivity in the human language system using near infrared spectroscopy. Front. Hum. Neurosci. 2014, 7, 921. [Google Scholar] [CrossRef] [Green Version]
  53. Wallois, F.; Mahmoudzadeh, M.; Patil, A.; Grebe, R. Usefulness of simultaneous EEG-NIRS recording in language studies. Brain Lang. 2012, 121, 110–123. [Google Scholar] [CrossRef] [PubMed]
  54. Kubota, Y.; Toichi, M.; Shimizu, M.; Mason, R.A.; Coconcea, C.M.; Findling, R.L.; Yamamoto, K.; Calabrese, J.R. Prefrontal activation during verbal fluency tests in schizophrenia—a near-infrared spectroscopy (NIRS) study. Schizophr. Res. 2005, 77, 65–73. [Google Scholar] [CrossRef] [PubMed]
  55. Cui, X.; Bray, S.; Reiss, A.L. Speeded near infrared spectroscopy (NIRS) response detection. PLoS ONE 2010, 5, 15474. [Google Scholar] [CrossRef] [PubMed] [Green Version]
  56. Nambu, I.; Osu, R.; Sato, M.-a.; Ando, S.; Kawato, M.; Naito, E. Single-trial reconstruction of finger-pinch forces from human motor-cortical activation measured by near-infrared spectroscopy (NIRS). NeuroImage 2009, 47, 628–637. [Google Scholar] [CrossRef] [PubMed]
  57. Khan, M.J.; Hong, K.-S. Hybrid EEG–fNIRS-based eight-command decoding for BCI: Application to quadcopter control. Front. Neurorobot. 2017, 11, 6. [Google Scholar] [CrossRef] [PubMed] [Green Version]
  58. Blankertz, B.; Acqualagna, L.; Dähne, S.; Haufe, S.; Schultze-Kraft, M.; Sturm, I.; Ušćumlic, M.; Wenzel, M.A.; Curio, G.; Müller, K.-R. The Berlin brain-computer interface: Progress beyond communication and control. Front. Neurosci. 2016, 10, 530. [Google Scholar] [CrossRef] [Green Version]
  59. Bak, S.; Park, J.; Shin, J.; Jeong, J. Dataset: Open Access fNIRS Dataset for Classification of Unilateral Finger- and Foot-Tapping. Available online: https://doi.org/10.6084/m9.figshare.9783755.v1 (accessed on 23 October 2019).
  60. Bak, S.; Park, J.; Shin, J.; Jeong, J. Tutorials: Open Access fNIRS Dataset for Classification of Unilateral Finger- and Foot-Tapping. Available online: https://github.com/JaeyoungShin/fNIRS-dataset (accessed on 23 October 2019).
  61. Combrisson, E.; Jerbi, K. Exceeding chance level by chance: The caveat of theoretical chance levels in brain signal classification and statistical assessment of decoding accuracy. J. Neurosci. Methods 2015, 250, 126–136. [Google Scholar] [CrossRef]
Figure 1. Functional near-infrared spectroscopy (fNIRS) channel locations. Ch01–10 and Ch11–20 are located around C3 (Ch09) and C4 (Ch18), respectively. The channels are created by a pair of adjacent light sources (Tx) and detectors (Rx) placed 30 mm away from each other.
Electronics 08 01486 g001
Figure 2. Experimental paradigm. A single trial comprised an introduction period (−2 to 0 s) and a task period (0 to 10 s), followed by an inter-trial break period (10 to 27–29 s). Among right-hand finger-tapping (RHT) (→), left-hand finger-tapping (LHT) (←), and foot-tapping (FT) (↓), a random task type was displayed during the introduction period, which the volunteers were required to perform.
Electronics 08 01486 g002
Figure 3. Grand average (across all volunteers) of temporal concentration changes of oxygenated hemoglobin (ΔHbO) within epochs’ interval. The gray shade indicates the task period (0–10 s). The X- and Y-axes units are ms and mM·cm, respectively. The blue, red, and yellow solid lines correspond to RHT, LHT, and FT, respectively.
Electronics 08 01486 g003
Figure 4. Grand average (across all volunteers) of temporal concentration changes of reduced hemoglobin (ΔHbR) within epochs’ interval. The gray shade indicates the task period (0–10 s). The X- and Y-axes units are ms and mM·cm, respectively. The blue, red, and yellow solid lines correspond to RHT, LHT, and FT, respectively.
Electronics 08 01486 g004
Figure 5. (a) RFT vs. LFT, (b) RFT vs. FT, and (c) LFT vs. FT binary classification accuracies. (d) Ternary classification accuracies. The error bars indicate the standard deviation. The X-label denoted by “m” indicates the grand average classification accuracy across the 30 volunteers. The grand average classification accuracy is provided in each figure. Red dashed lines indicate the theoretical chance levels (62.0% and 42.7% for (ac) and (d), respectively).
Electronics 08 01486 g005
Table 1. Functional near-infrared spectroscopy dataset description.
StructureFieldDescription
cntHb.fsSampling rate (Hz)
.clabChannel labels
.xUnitX-axis unit
.yUnitY-axis unit
.snrSignal-to-noise ratio
.xConcentration changes of oxygenated/reduced hemoglobin (ΔHbO/R)
Mrk.event.descClass labels’ descriptions
.timeEvent occurrence times 1
.yClass labels in vector form
mnt.clabChannel labels
.boxChannel arrangement in Figure 3 and Figure 4
1 A trigger is marked where each task period starts.