Article

Electroporation Modelling of Irregular Nucleated Cells Including Pore Radius Dynamics

by
Michele Alessandro Chiapperino
1,†,
Pietro Bia
2,†,
Claudio Maria Lamacchia
1,† and
Luciano Mescia
1,*,†
1
Department of Electrical and Information Engineering, Polytechnic University of Bari via E. Orabona 4, 70125 Bari, Italy
2
Elettronica S.p.A., Design Solution Department, Via Tiburtina Valeria Km 13,700, 00131 Rome, Italy
*
Author to whom correspondence should be addressed.
These authors contributed equally to this work.
Electronics 2019, 8(12), 1477; https://doi.org/10.3390/electronics8121477
Submission received: 12 November 2019 / Revised: 25 November 2019 / Accepted: 30 November 2019 / Published: 4 December 2019
(This article belongs to the Section Bioelectronics)

Abstract

:
When high-amplitude, short-duration electric pulses are applied to cells the permeability of their membranes is increased. From the biological point of view, the phenomenon is quite well understood, however, it is important to develop accurate numerical models to investigate the electroporation effectiveness in terms of electrical, geometrical and physical parameters. To this aim, in this paper, we illustrate a spatio–temporal, non-linear, and dispersive multiphysics approach to study the electroporation in irregularly nucleated shaped cells. The model couples the Maxwell equations with the partial differential equation describing the creation and closure of pores as well as the evolution of the pore size. The dispersive properties of biological media and the irregular geometries of the membranes have been described using the multi-relaxation Debye-based relationship and the Gielis superformula, respectively. Numerical simulations highlight the importance to include in the model the spatial and temporal evolution of the pore radius. In fact, the obtained numerical results show significant discrepancies between our model and the one in which the pore radius dynamics is negligible.

1. Introduction

Electroporation (EP) is a non-thermal electromagnetic phenomenon in which the cell membrane permeability increases when exposed to a high voltage pulsed electric field (PEF). As a result, exogenous molecules that usually cannot cross the membrane barrier can enter the cytoplasm and nucleoplasm. EP is used in clinical and medical practice for various applications such as electrochemotherapy, gene therapy, DNA vaccination and nonthermal ablation [1,2]. Electroporation combined with chemotherapeutic drugs was found to be a very effective treatment both for killing tumor cells in vitro and for treating cancer in humans [3]. The effectiveness of the electroporation process depends on various physical and chemical parameters, such as the molecular composition of the membrane, but above all, on the parameters of electric pulses such as duration, frequency, rise and fall time, amplitude and number of pulses [4,5]. Conventional methods of electroporation use pulses of micro-millisecond duration to electroporate the cells. In this case, only the plasma membrane is electroporated since the cytoplasm and the extracellular medium act like good conductors. PEF with duration from the sub-microsecond to the nanosecond induce the electroporation of the plasma membrane as well as the permeabilization of the intracellular membranes. Furthermore, the electroporation process efficiency also depends on the type of cell [6], the mutual interaction with other cells and the cell positioning with respect to the electrodes [7]. Although electroporation is widely used in medical practice, EP protocols are very empirical as well as the electroporation process is not completely known. However, the accuracy of the mathematical model adopted to study the electroporation process has a considerable impact on the experimental analysis and on the choice of the EP parameters. Several numerical models have been proposed in literature to study the EP. Most of them use simplified geometric shapes to describe biological membranes as well as consider cellular structures as non-dispersive media. Moreover, in order to simplify the numerical calculation and to reduce the computational efforts, other methods do not take into account the thinness of the membranes. Among the different models of EP, studies implementing the dynamics of the pore radius have been also presented even if they were based on a simple cell geometry [8,9]. In view of these weaknesses, the present study is aimed at the evaluation of the transmembrane voltage (TMV) and pore density in a nucleated irregular-shaped cell. To this aim, a non-linear and dispersive numerical algorithm was developed. The dielectric response of cellular structures was modeled by incorporating the multi-relaxation Debye-based equations. Furthermore, the irregular shape of the cell was modeled by using the Gielis superformula. The Maxwell equations were solved in conjunction with the asymptotic Smoluchowski equation and the partial differential equations describing the spatial and time evolution of the size of the pores. Using the developed numerical algorithm, the electroporation process has been evaluated exposing the biological cell to short and long nanosecond pulses. Thus a comparison among models in which the pore radius dynamics are taken into account and the one in which it is neglected has been performed.

2. Mathematical Formulation

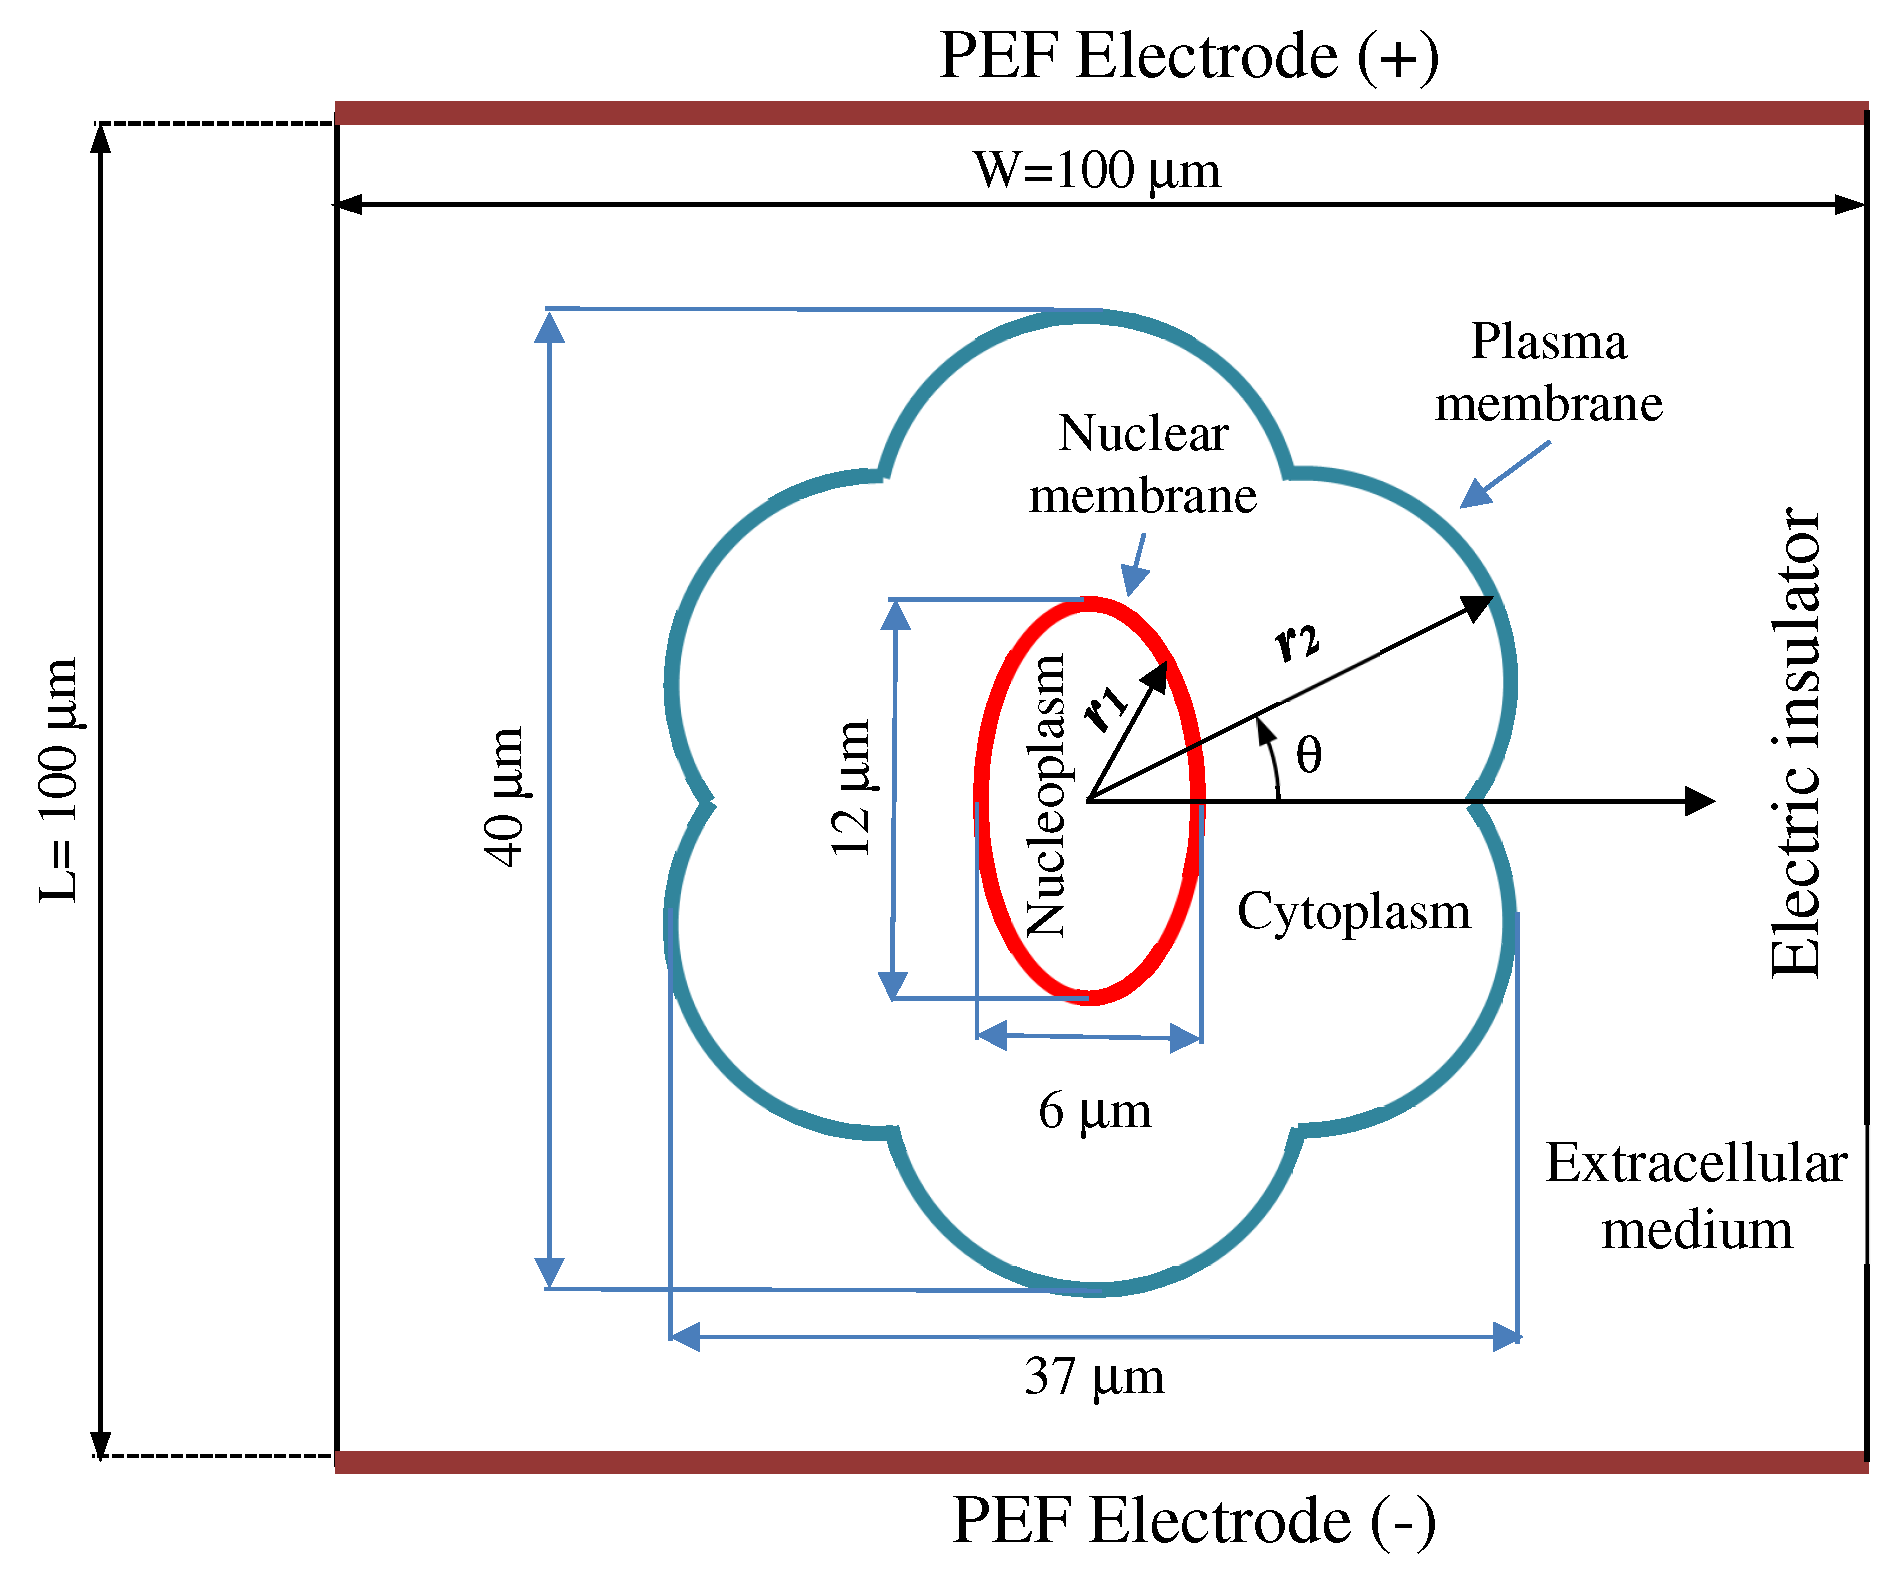
2.1. Cell Geometry Model

As shown in Figure 1, the biological cell considered in the proposed study is the nucleated cancer-like cell. The cell shape is modelled by using the Gielis superformula [4,6,7,10,11]. The relevance of the Gielis superformula to model the cell membranes perimeter was previously highlighted in [4]. Contrary to the canonical spherical cell-based model, an unconventional behavior of irregularly shaped cells was observed. In fact, the TMV does not have a conventional cosine type behavior and moreover, non-homogeneous EP effects occur along the cell membrane perimeter. In particular, the radius vectors r 1 and r 2 describing the plasma and nuclear membranes, respectively, are given by:
r 1 , 2 = r ^ 1 , 2 x 1 , 2 2 + y 1 , 2 2
x 1 , 2 = A 1 , 2 R 1 , 2 θ cos θ
y 1 , 2 = B 1 , 2 R 1 , 2 θ sin θ
R 1 ( θ ) = cos m 1 θ / 4 d 1 n 1 + sin m 2 θ / 4 d 2 n 2 1 / b 1
R 2 ( θ ) = cos m 3 θ / 4 d 3 n 3 + sin m 4 θ / 4 d 4 n 4 1 / b 2 ,
where θ π / 2 , π / 2 , m i , n i , i = 1 , , 4 and b 1 , 2 are positive real numbers, d j , j = 1 , , 4 are strictly positive real numbers, A 1 , 2 and B 1 , 2 are appropriate scaling factors. The plasma membrane boundary of the selected cell can be well-approximated by using the superformula parameters A 1 = B 1 = 16.8   μ m , m 1 = m 2 = 6 , d 1 = d 2 = 1 , n 1 = n 2 = 1 and b 1 = 2 as well as the nuclear membrane can be modelled by using the following Gielis parameters A 1 = B 1 = 3   μ m , m 1 = m 2 = 2 , d 1 = d 2 = 1 , n 1 = n 2 = 4 and b 2 = 1 . Moreover, to generate the cell membrane thinness, a particular extrusion operator transformation has been suitably implemented. In particular, the following equations was implemented
x i = x e 1 + h x e 2 + y e 2
y i = y e 1 + h x e 2 + y e 2 ,
where ( x i , y i ) are the coordinates of the internal side of the membrane, ( x e , y e ) are the coordinates of the external side of the membrane, h is the membrane thickness.

2.2. Pores Radius Model

The EP has been attributed to the creation of transient pores within the lipid bi-layer of the cell membrane when an external PEF is applied. This dynamic process can be modelled by Krassowska’s asymptotic equation [12]. In particular, the temporal evolutions of pore densities for plasma N P m and nuclear N N m membranes are calculated by solving the following first-order partial differential equations:
N P m ( x , y , t ) t = α e TMV P m V e p 2 1 N P m N 0 e q TMV P m V e p 2
N N m ( x , y , t ) t = α e TMV N m V e p 2 1 N N m N 0 e q TMV N m V e p 2 ,
where N 0 is the pore density in the resting membrane, α and q are EP parameters, V ep is the characteristic voltage of EP, TMV P m and TMV N m are the TMV evaluated on plasma and nuclear membrane, respectively. Pore density is proportional to the amplitude of the applied electric field as well as the pores creation enhances the membrane conductivity. In particular, the membrane conductivity increase that accompanies electroporation can be computed as follows:
σ P m ( x , y , t ) = σ 0 , P m + K P m N P m ( x , y , t ) σ p , P m π r p , P m 2
σ N m ( x , y , t ) = σ 0 , N m + K N m N N m ( x , y , t ) σ p , N m π r p , N m 2 ,
where σ 0 , P m and σ 0 , N m are the membrane conductivity at rest, σ p , P m and σ p , N m are the conductivities of the medium inside the pore and r p , P m and r p , N m the pore radius, respectively, for plasma and nuclear membrane, and
K P m = e ν P m 1 w 0 e w 0 η ν P m η ν P m w 0 η ν P m e ν P m w 0 e w 0 + η ν P m + η ν P m w 0 + η ν P m
K N m = e ν N m 1 w 0 e w 0 η ν N m η ν N m w 0 η ν N m e ν N m w 0 e w 0 + η ν N m + η ν N m w 0 + η ν N m ,
where w 0 is the energy barrier inside the pore and η is the relative length of pore entrance area with
ν P m = ( q e / k T ) TMV P m
ν N m = ( q e / k T ) TMV N m ,
where q e is the electron electric charge and k the Boltzmann constant.
The density and size of the pores depend on the intensity of the applied electric field. In stationary conditions, a dynamic equilibrium among the steric repulsion of lipid heads, the line tension acting on the pore perimeter and the surface tension of the cell membrane occurs [13]. When an external electric field is applied, this balance is lost and the pores radius start to increase. The pores initially created with radius r p , P m (for plasma membrane) and r p , N m (for nuclear membrane), change size to minimize the energy of the entire lipid bilayer. So, the temporal evolution of pore radius for the plasma membrane is calculated by solving the following differential equation [8]:
r p , P m t = D k T i = 1 4 S i , P m r p , P m r p m ,
with
S 1 , P m = F TMV P m 2 1 + k 1 r p , P m + k 2
S 2 , P m = 4 β r p m r p , P m 4 1 r p , P m
S 3 , P m = 2 π γ
S 4 , P m = 2 π T e , P m r p , P m ,
where T e , P m is the effective tension of the membrane:
T e , P m = 2 T e 2 2 T e 2 T e 1 1 K a N P m π r p , P m 2 2
Similarly for the nuclear membrane, the temporal evolution of pore radius is determined as follow:
r p , N m t = D k T i = 1 4 S i , N m r p , N m r p m
with
S 1 , N m = F TMV N m 2 1 + k 1 r p , N m + k 2
S 2 , N m = 4 β r p m r p , N m 4 1 r p , N m
S 3 , N m = 2 π γ
S 4 , N m = 2 π T e , N m r p , N m ,
where T e , N m is the effective tension of the membrane:
T e , N m = 2 T e 2 2 T e 2 T e 1 1 K a N N m π r p , N m 2 2 .
In Equations (16) and (22), S 1 , P m and S 1 , N m account for the electric force induced by the local TMV, S 2 , P m and S 2 , N m for the steric repulsion of lipid heads, S 3 , P m and S 3 , N m for the line tension acting on the pore perimeter, S 4 , P m and S 4 , N m for the surface tension of the cell membranes [8]. This study assumes that changes of cell area, volume, and shape can be ignored for pulses duration considered here. In particular, the presented model evaluating the temporal evolutions of pore densities and pore radius for plasma and nuclear membranes makes possible a quantitative evaluation of the membranes permeability to specific molecules and ions.

2.3. Complex Permittivity Model

The interaction of the PEF with the dielectric medium of cell compartment can be investigated by considering the electric polarization, i.e., the electric field induced disturbance of the charge distribution. From the macroscopic point of view, such interaction is generally due to different phenomena as the orientation of dipoles, ionic diffusion, interfacial polarization etc. Dielectric dispersion is the corresponding frequency dependence of permittivity which typically display extremely high dielectric constants at low frequencies, falling off in more or less distinct steps as the excitation frequency is increased. Cell suspensions typically exhibit a significant β -dispersion in the radio frequency range. This is due to the Maxwell–Wagner effect at the interface between the intra or extracellular solution and the phospholipid membrane. They also display a large α -dispersion at low frequency caused by the sarcoplasmic reticulum, gap junctions, and counterion relaxation on the cell surface. Moreover, an additive β -dispersion coming from the dispersion of organelles appears as a small tail to the large cell membrane β -dispersion [14]. In our numerical analysis, the following Debye-based relationship has been used to model the dispersive behavior of each cellular compartment [4,7,10].
ε ( ω ) = ε + i = 1 M Δ ε i 1 + j ω τ i ,
where M is the order of Debye equation, ε is the high frequency permittivity, Δ ε i are the relaxation amplitudes and τ i are the relaxation times. As the dielectric relaxation of the plasma ( P m ) and nuclear ( N m ) membrane takes place in the MHz region, a second order Debye equation has been used to describe their dispersive properties. Instead, the dielectric relaxation of the extracellular medium ( E x ), the cytoplasm ( C p ) and the nucleoplasm ( N p ) occurs in the GHz zone and thus a first order Debye equation has been adopted to model the dispersive properties of these materials. The time domain relations pertaining the polarization vector P 1 and P 2 , corresponding to the first and the second order Debye dispersion model, can be formulated as:
τ E x P 1 , E x t + P 1 , E x = ( ε ε 0 ) τ E x E t + ( Δ ε E x + ε ε 0 ) E
τ C p P 1 , C p t + P 1 , C p = ( ε ε 0 ) τ C p E t + ( Δ ε C p + ε ε 0 ) E
τ N p P 1 , N p t + P 1 , N p = ( ε ε 0 ) τ N p E t + ( Δ ε N p + ε ε 0 ) E
a 2 , P m 2 P 2 , P m t 2 + a 1 , P m P 2 , P m t + P 2 , P m = b 2 , P m 2 E t 2 + b 1 , P m E t + b 0 , P m E
a 2 , N m 2 P 2 , N m t 2 + a 1 , N m P 2 , N m t + P 2 , N m = b 2 , P m 2 E t 2 + b 1 , N m E t + b 0 , N m E ,
where
a 1 , P m = τ 1 , P m + τ 2 , P m
a 2 , P m = τ 1 , P m τ 2 , P m
b 0 , P m = Δ ε 1 , P m + Δ ε 2 , P m + ε ε 0
b 1 , P m = ( Δ ε 2 , P m + ε ε 0 ) τ 1 , P m + ( Δ ε 1 , P m + ε ε 0 ) τ 2 , P m
b 2 , P m = ( ε ε 0 ) τ 1 , P m τ 2 , P m ,
and
a 1 , N m = τ 1 , N m + τ 2 , N m
a 2 , N m = τ 1 , N m τ 2 , N m
b 0 , N m = Δ ε 1 , N m + Δ ε 2 , N m + ε ε 0
b 1 , N m = ( Δ ε 2 , N m + ε ε 0 ) τ 1 , N m + ( Δ ε 1 , N m + ε ε 0 ) τ 2 , N m
b 2 , N m = ( ε ε 0 ) τ 1 , N m τ 2 , N m .

2.4. Electromagnetic Model
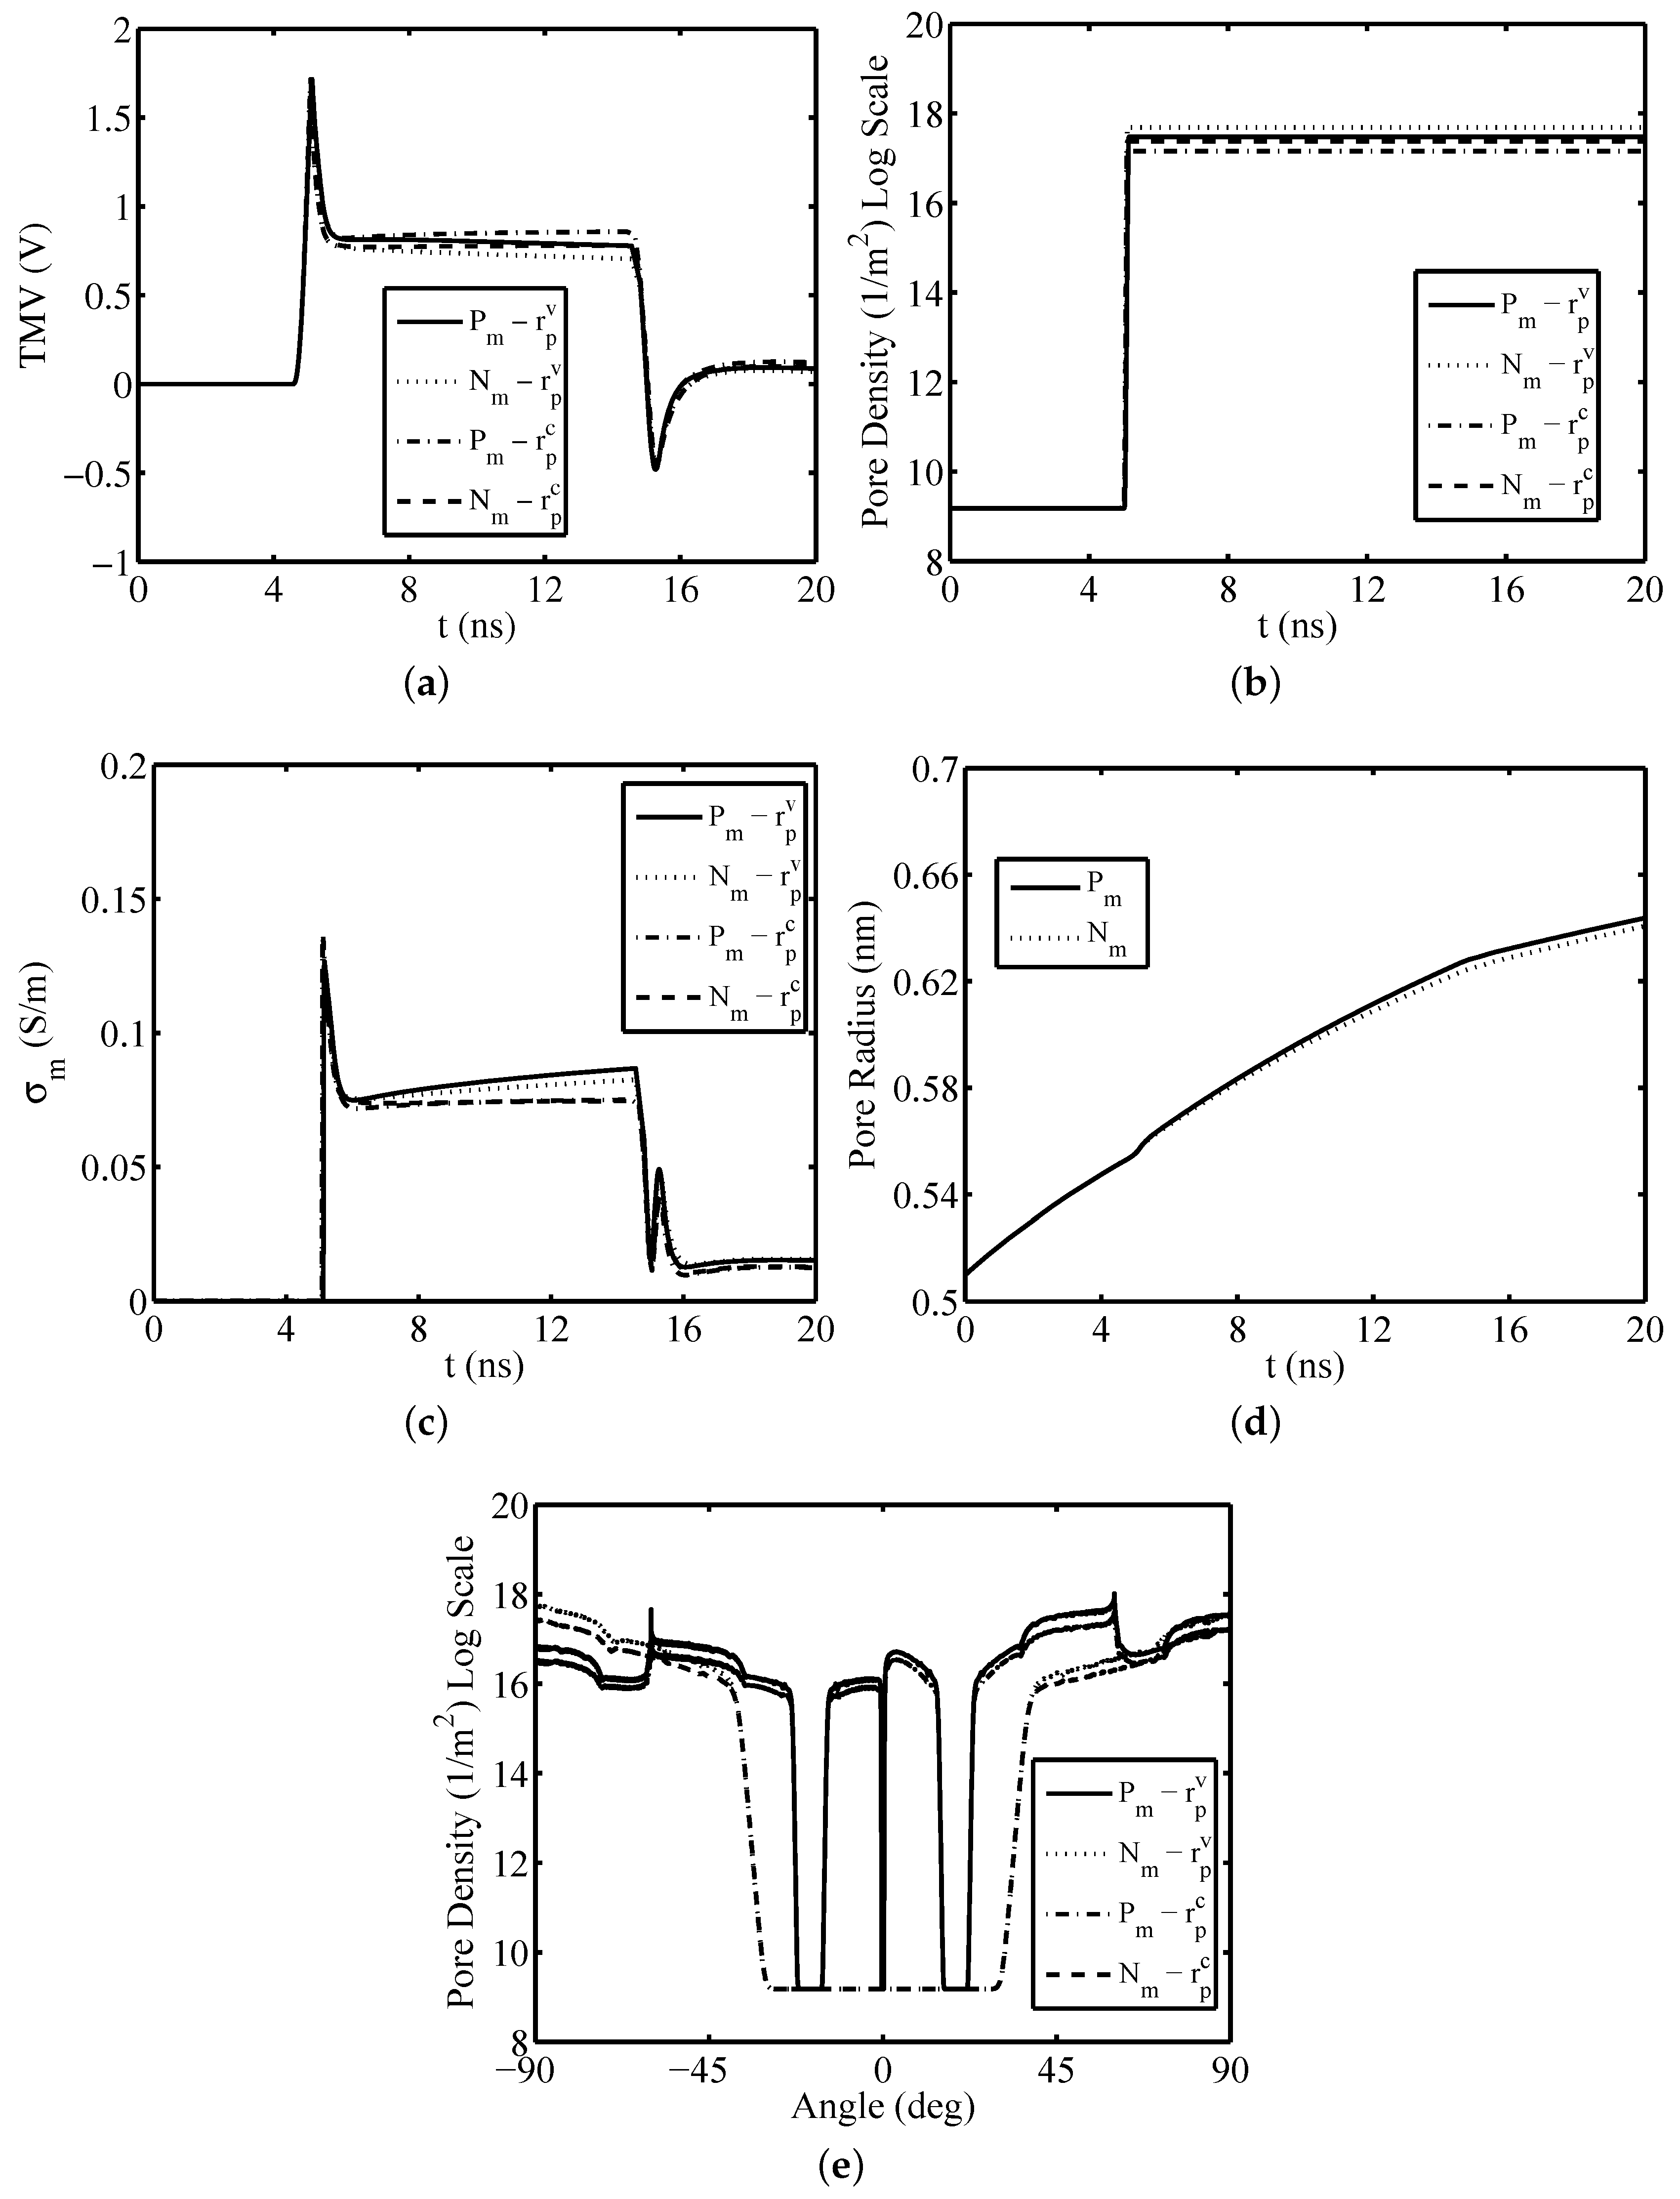
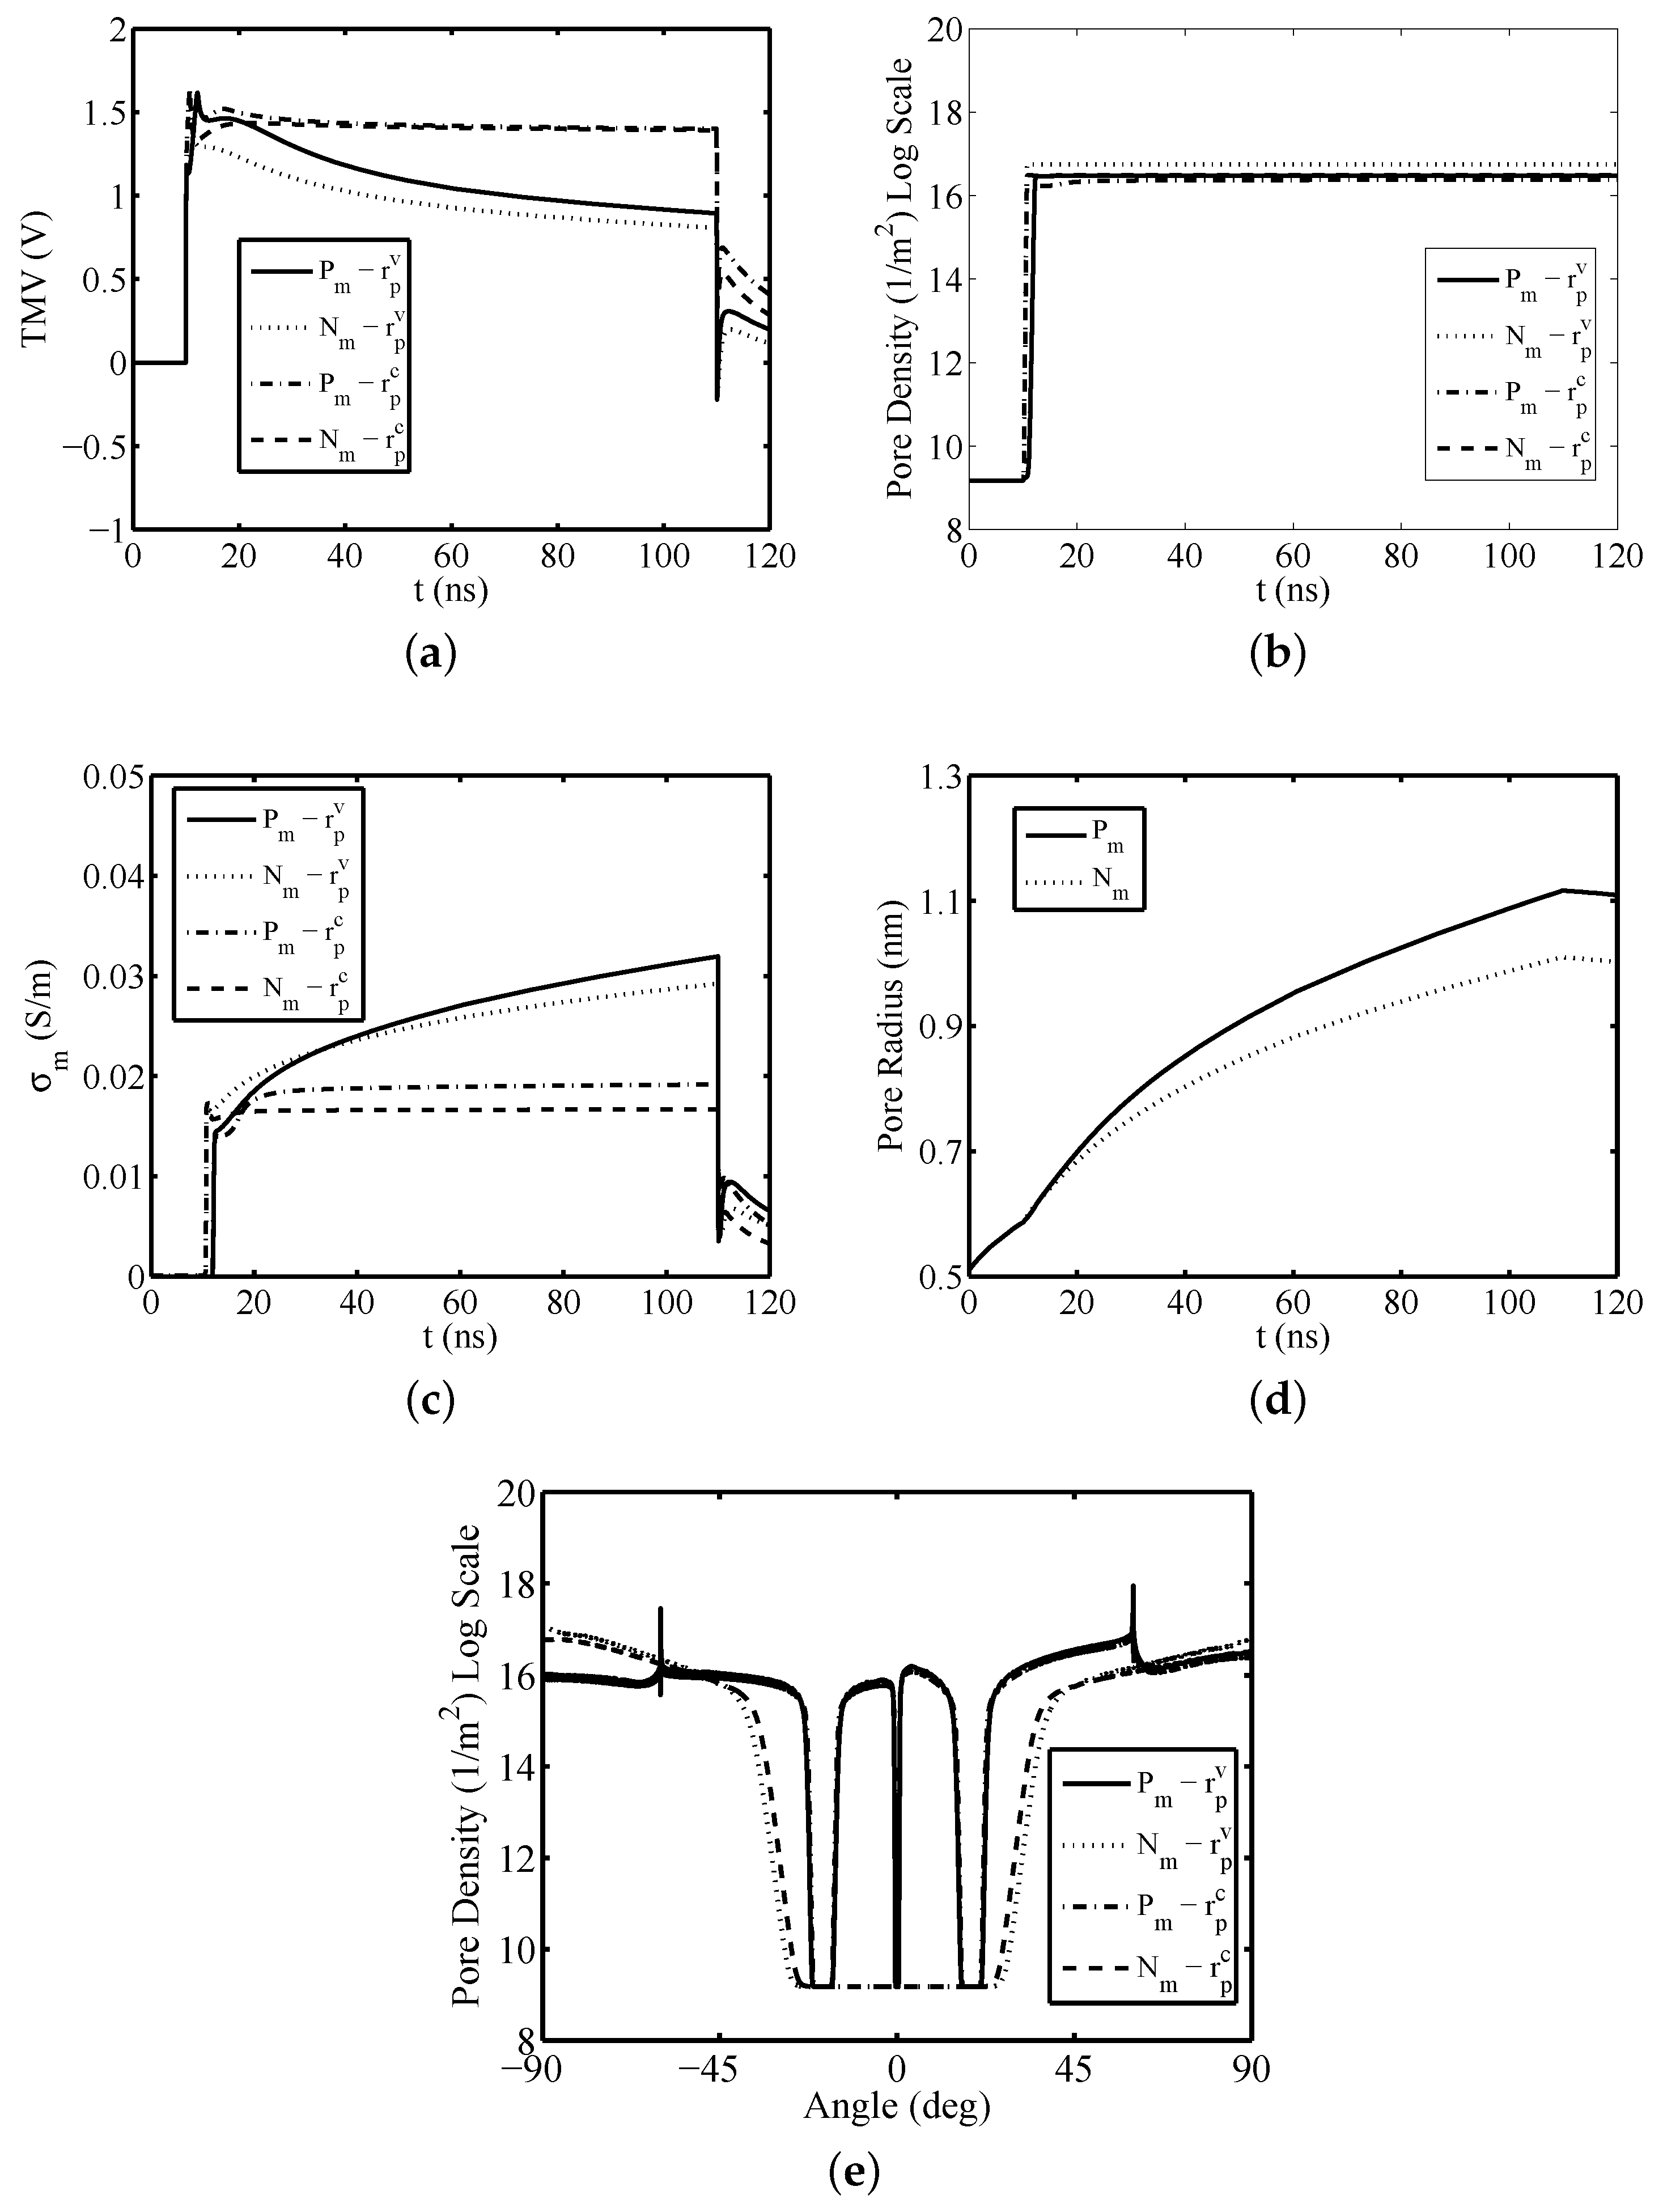
The electromagnetic model is based on the Maxwell equations
Γ H · dl = t S σ E + ε 0 E t + P t · d S
Γ E · dl = t S B · d S .
In particular, taking into account the small cell size and the microsecond/nanosecond electric pulses, the rate of the magnetic flux can be neglected. So, the resulting Maxwell equations in the differential form can be written in terms of the electric potential ϕ and the electric field E as
· ε 0 ϕ t + σ ϕ P t = 0
E = ϕ .
Finally, the TMV for the P m and N m membrane is evaluated as the difference between the electric potential inside (i) and outside (o) of each membrane:
TMV P m ( x , y , t ) = ϕ i , P m ( x , y , t ) ϕ o , P m ( x , y , t )
TMV N m ( x , y , t ) = ϕ i , N m ( x , y , t ) ϕ o , N m ( x , y , t ) .

3. Results

Implementing the aforesaid computational algorithm, the EP process was studied in both the cases characterized by variable and constant pore radius. The simulations were carried out considering the nucleated cancer cell inserted into a 2D space domain having length L = 100   μ m and width W = 100   μ m (see Figure 1). Table 1 shows the geometric, electric and EP parameters used in the numerical computations. Our computations and plots have been performed using MATLAB suite software. In our calculations, the nuclear envelope consists of two membranes in near contact between them, each one with a thickness equal to half the thickness of the entire nuclear envelope. Such hypothesis can be justified taking into account that the voltage drop across the perinuclear space is negligible [6]. In particular, both the inner and outer membranes of the nuclear envelope have the same conductivity σ 0 , N m = 1 × 10 4   S / m 1 . Thus, supposing that the transmembrane voltage is equally distributed between the two lipid membranes, the TMV through the single membrane is calculated as half of the voltage on the entire nuclear envelope [15]. Moreover, in the case of the numerical model with a constant pore radius an appropriate validation was carried out in [6] using the experimental results concerning real cancer cells electroporated by a unipolar rectangular pulse with duration of 100   μ s . Firstly, the biological cell has been exposed to a PEF having rectangular shape with amplitude E = 100   k V / c m 1 , duration T = 10   n s , rise time t r = 0.9   n s , and fall time t f = 0.9   n s . Moreover, a time delay of 5   n s and a computational window for the time coordinate of 20   n s was considered. Figure 2a–c highlight the dynamics versus the time of the TMV, pore density and conductivity of the membranes at the top of the cancer-like cell ( θ = 90 ), respectively, for the model with the pore radius variable, r p v , and the model with the pore radius constant and equal to r p = 0.8   n m , r p c . The application of the external pulse generates a rapid increase in the transmembrane voltage on the plasma and nuclear membrane. The resulting pore creation, as well as the increase of the membrane conductivity, lead to a decrease of the TMV reaching a negative peak value. For both models, the activation of electroporation occurs at the same time instant. The subsequent decrease of TMV is more rapid in the model with a variable pore radius compared to that with a constant pore radius. In fact, the enhancement of both pore density and radius creates a rapid increment of membranes conductivity generating a reduction of the transmembrane voltage. Moreover, Figure 2d displays the dynamics versus the time of pore radius at the top of the cancer-like cell for the plasma and the nuclear membrane. As the applied pulse is of short duration, the temporal dynamics of the pore radius is similar for the plasma and the nuclear membrane, increasing from 0.51   n m (minimum radius of hydrophilic pores) to a maximum value of about 0.64   n m . Therefore, given the temporal shortness of the applied pulse, the pore radius for both the plasma and the nuclear membrane does not reach the value of r p 0 = 0.8   n m which represents the minimum energy radius at TMV = 0   V . In addition, the pore radius size assumes equal values for the P m and N m membrane up to 5   n s , which denotes the time instant in which the applied pulse starts its activation. Moreover, an appreciable difference between the temporal evolution of the pore radius for each membrane is obtained starting by 10   n s . Furthermore, Figure 2e illustrates the pore density along the membranes circumference at t = 20   n s for both models. As highlighted by the obtained numerical results, the values of the pore density for the nuclear and the plasma membrane obtained using the model with pore radius variable are higher than that evaluated with the model having pore radius constant.
For both models, the plasma and nuclear membrane are electroporated in the points facing the electrodes. In particular, the plasma membrane is electroporated between the top points and an angle of about 22 ° and in the equatorial zone. Furthermore, the plasma membrane is not electroporated at θ = 0 ° due to its irregular perimeter. Moreover, the irregular perimeter of the plasma membrane creates for both models peaks of pore density values at θ = 60 ° . The nuclear membrane is characterized by significant electroporation between the top points and an angle of about 35 ° . A more evident difference between the two models is further highlighted when the biological cell is exposed to longer pulses.
Figure 3a–c display the dynamics versus the time of the TMV, pore density and conductivity of the membranes at the top of the cancer cell ( θ = 90 ° ), respectively, for the model with the pore radius variable and the model with the pore radius constant. In these simulations, the biological cell has been electroporated using a rectangular pulse having amplitude E = 50   k V / c m 1 , duration T = 100   n s , rise time t r = 0.1   n s and fall time t f = 0.1   n s . Moreover, the applied rectangular pulse starts at the time instant t s t a r t = 10   n s and the computational window for the time coordinate is 120   n s long. As reported in Figure 3a,b, the EP on the N m membrane occurs about 1   n s faster than of P m one. Furthermore, the TMV on each membrane quickly increases to about 1.6   V . The subsequent decrease of TMV is more rapid in the model with variable pore radius. In fact, for this model, the growing of the pore density and radius creates a rapid increment of membranes conductivity generating a quickly reduction of the TMV. Furthermore, as shown in Figure 3a the temporal dynamics of the TMV characterizing the two models are quite different. In fact, in the case of the model with variable pore radius, the temporal evolution of the TMV shows a significant gap between the peak value and the value that the curve assumes in the central flat area. Instead, for the model with a constant pore radius, the value assumed by the TMV in the central flat area is close to the value assumed by the peak. As shown in Figure 3d, the pore radius initially increases from r p m to a maximum value of about 1.1   n m , for the P m membrane, and of about 1   n m , for the N m one. In particular, for both membranes the maximum value of the pore radius is reached at the time instant of 110   n s . Moreover, the pore radius reaches the value of r p 0 = 0.8   n m at the time instant of about 30   n s , for the plasma membrane, and at the time instant of about 40   n s , for the nuclear membrane. In addition, the pore radius size assumes equal values for the P m and N m membrane up to 10   n s , which is the pulse activation time instant. A relevant discrepancy between the temporal evolution of the pore radius of each membrane is appreciated starting by 20   n s . Finally, when the pulse is removed the pore radius starts to decrease. Moreover, Figure 3e illustrates the pore density along the membranes circumference at t = 120   n s for both models. The EP for the P m membrane occurs in the angle range starting from 90 ° and ending at about 25 ° as well as in the equatorial zone. In particular, it is not electroporated at θ = 0 ° due to its particular geometric shape. Moreover, the proper perimeter of the plasma membrane creates for both models peaks of pore density values at θ = 60 ° . The nuclear membrane is characterized by significant electroporation between the top points and an angle of about 35 ° . As highlighted by the obtained numerical results, a higher level of electroporation is obtained for the model in which the pore radius is assumed variable for both the plasma and nuclear membrane.

4. Conclusions

In this paper, a nonlinear dispersive numerical algorithm of electroporation for irregularly nucleated shaped cells including the variation of pore radius has been presented. The developed algorithm solves simultaneously the Maxwell equations, the Smolouchouski equation and the equation describing the dynamic of the pore radii evolution. In particular, the presented algorithm describes the irregular perimeter of the P m and N m membranes using the Gielis superformula and it considers the dielectric dispersion properties of cell compartments using a Debye formulation. With reference to a nucleated cancer-like cell, a number of simulations have been carried out in order to compare the model with the pore radius variable and the one characterized by a constant pore radius. The performed analysis highlights a discrepancy between the two models underlining the importance to take into account in the numerical algorithm the differential equation describing the variation of the pore size.

Author Contributions

Conceptualization L.M. and M.A.C., methodology L.M., software M.A.C., validation M.A.C. and P.B., formal analysis L.M., M.A.C. and P.B., investigation M.A.C., resources L.M., data curation M.A.C., C.M.L., writing—original draft preparation M.A.C. and L.M., writing—review and editing L.M., C.M.L., visualization M.A.C., C.M.L., supervision L.M., funding acquisition L.M.

Funding

The work was partly supported within the bando INNONETWORK-sostegno alle attività di R&S per lo sviluppo di nuove tecnologie sostenibili, di nuovi prodotti e servizi”, plan: T-CARE- Teleassistenza e monitoraggio innovativi dei parametri vitali a domicilio con biosensori indossabili, Project code: B37H17005210007.

Conflicts of Interest

The authors declare no conflict of interest.

Abbreviations

ECTElectrochemotherapy
EPElectroporation
NTIRENonthermal irreversible electroporation
PEFPulsed electric field
TMVTransmembrane voltage

References

  1. Kranjc, M.; Bajd, F.; Serša, I.; Miklavčič, D. Magnetic resonance electrical impedance tomography for monitoring electric field distribution during tissue electroporation. IEEE Trans. Med. Imag. 2011, 30, 1771–1778. [Google Scholar] [CrossRef] [PubMed] [Green Version]
  2. Shi, J.; Ma, Y.; Zhu, J.; Chen, Y.; Sun, Y.; Yao, Y.; Yang, Z.; Xie, J. A Review on Electroporation-Based Intracellular Delivery. Molecules 2018, 23, 3044. [Google Scholar] [CrossRef] [PubMed] [Green Version]
  3. Hofmann, G.A.; Dev, S.B.; Dimmer, S.; Nanda, G.S. Electroporation therapy: A new approach for the treatment of head and neck cancer. IEEE Trans. Biomed. Eng. 1999, 46, 752–759. [Google Scholar] [CrossRef] [PubMed]
  4. Mescia, L.; Chiapperino, M.A.; Bia, P.; Gielis, J.; Caratelli, D. Modeling of Electroporation induced by pulsed electric fields in irregularly shaped cells. IEEE Trans. Biomed. Eng. 2018, 65, 414–423. [Google Scholar] [CrossRef] [PubMed]
  5. Lamberti, P.; Romeo, S.; Sannino, A.; Zeni, L.; Zeni, O. The Role of Pulse Repetition Rate in nsPEF-Induced Electroporation: A Biological and Numerical Investigation. IEEE Trans. Biomed. Eng. 2015, 62, 2234–2243. [Google Scholar] [CrossRef] [PubMed]
  6. Chiapperino, M.A.; Bia, P.; Caratelli, D.; Gielis, J.; Mescia, L.; Dermol-Černe, J.; Miklavčič, D. Nonlinear dispersive model of electroporation for irregular nucleated cells. Bioelectromagnetics 2019, 40, 331–342. [Google Scholar] [CrossRef] [PubMed]
  7. Mescia, L.; Chiapperino, M.A.; Lamacchia, C.M.; Bia, P.; Gielis, J.; Caratelli, D. Design of electroporation process in irregularly shaped multicellular systems. Electronics 2019, 8, 37. [Google Scholar] [CrossRef] [Green Version]
  8. Krassowska, W.; Filev, P.D. Modeling electroporation in a single cell. Biophys. J. 2007, 92, 404–417. [Google Scholar] [CrossRef] [PubMed] [Green Version]
  9. Leguebe, M.; Silve, A.; Mir, L.M.; Poignard, C. Conducting and permeable states of cell membrane submitted to high voltage pulses: Mathematical and numerical studies validated by the experiments. J. Theor. Biol. 2014, 360, 83–94. [Google Scholar] [CrossRef] [PubMed] [Green Version]
  10. Mescia, L.; Bia, P.; Chiapperino, M.A.; Caratelli, D. Fractional calculus based FDTD modeling of layered biological media exposure to wideband electromagnetic pulses. Electronics 2017, 6, 106. [Google Scholar] [CrossRef] [Green Version]
  11. Bia, P.; Caratelli, D.; Mescia, L.; Gielis, J. Analysis and synthesis of supershaped dielectric lens antennas. IET Microwaves Antennas Propag. 2015, 9, 1497–1504. [Google Scholar] [CrossRef]
  12. Neu, J.C.; Krassowska, W. Asymptotic model of electroporation. Phys. Rev. E 1999, 59, 471–482. [Google Scholar] [CrossRef]
  13. Jiang, C.; Davalos, R.V.; Bischof, J.C. Review of basic to clinical studies of irreversible electroporation therapy. IEEE Trans. Biomed. Eng. 2015, 62, 4–20. [Google Scholar] [CrossRef] [PubMed]
  14. Martinsen, G.; Grimnes, S.; Schwan, H.P. Interface phenomena and dielectric properties of biological tissues. In Encyclopedia of Surface and Colloid Science; Marcel Dekker, Inc.: New York, NY, USA, 2002; pp. 2643–2652. [Google Scholar]
  15. Rems, L.; Ušaj, M.; Kandušer, M.; Reberšek, M.; Miklavčič, D.; Pucihar, G. Cell electrofusion using nanosecond electric pulses. Sci. Rep. 2013, 3, 3382. [Google Scholar] [CrossRef] [PubMed] [Green Version]
  16. Salimi, E.; Thomson, D.J.; Bridges, G.E. Membrane dielectric dispersion in nanosecond pulsed electroporation of biological cells. IEEE Trans. Dielectr. Electr. Insul. 2013, 20, 1256–1265. [Google Scholar] [CrossRef]
  17. Kotnik, T.; Miklavcic, D. Theoretical evaluation of the distributed power dissipation in biological cells exposed to electric fields. Bioelectromagnetics 2000, 21, 385–394. [Google Scholar] [CrossRef]
  18. Polevaya, Y.; Ermolina, I.; Schlesinger, M.; Ginzburg, B.Z.; Feldman, Y. Time domain dielectric spectroscopy study of human cells ii. normal and malignant white blood cells. Biochim. Biophys. Acta 1999, 1419, 257–271. [Google Scholar] [CrossRef]
Figure 1. Sketch of the nucleated irregular cell geometry.
Electronics 08 01477 g001
Figure 2. Short ns rectangular pulse—temporal evolution of (a) transmembrane voltage (TMV), (b) pore density, (c) membranes conductivity and (d) pore radius at the top of the cell ( θ = 90 ° ). (e) Pore density versus the polar angle at t = 20   n s . Pulse amplitude and duration equal to 100   k V / c m 1 and 10   n s , respectively.
Electronics 08 01477 g002
Figure 3. Long ns rectangular pulse—temporal evolution of (a) TMV, (b) pore density, (c) membranes conductivity and (d) pore radius at the top of the cell ( θ = 90 ° ). (e) Pore density versus the polar angle at t = 120   n s . Pulse amplitude and duration equal to 50   k V / c m 1 and 100   n s , respectively.
Electronics 08 01477 g003
Table 1. Polarization, electric, geometrical, and electroporation (EP) parameters.
Title 1Title 2Title 3
τ 1 , P m 3 × 10 9   s First relaxation time of plasma membrane [16]
τ 1 , N m 3 × 10 9   s First relaxation time of nuclear membrane [16]
τ 2 , P m 4.6 × 10 10   s Second relaxation time of plasma membrane [16]
τ 2 , N m 4.6 × 10 10   s Second relaxation time of nuclear membrane [16]
τ E x 6.2 × 10 12   s Relaxation time of extracellular medium [17]
τ C p 6.2 × 10 12   s Relaxation time of cytoplasm [17]
τ N p 6.2 × 10 12   s Relaxation time of nucleoplasm [17]
Δ ϵ 1 , P m 2.3 × 10 11   F m 1 First relaxation amplitude of plasma membrane [16]
Δ ϵ 1 , N m 2.3 × 10 11   F m 1 First relaxation amplitude of nuclear membrane [16]
Δ ϵ 2 , P m 7.4 × 10 12   F m 1 Second relaxation amplitude of plasma membrane [16]
Δ ϵ 2 , N m 7.4 × 10 12   F m 1 Second relaxation amplitude of nuclear membrane [16]
Δ ϵ E x 5.9 × 10 10   F m 1 Relaxation amplitude of extracellular medium [17]
Δ ϵ C p 5.9 × 10 10   F m 1 Relaxation amplitude of cytoplasm [17]
Δ ϵ N p 5.9 × 10 10   F m 1 Relaxation amplitude of nucleoplasm [17]
ϵ 13.9 × 10 12   F m 1 High frequency permittivity [16]
ϵ 0 8.85 × 10 12   F m 1 Dielectric permittivity of vacuum
σ E x 5   S m 1 Conductivity of the extracellular medium [8]
σ 0 , P m 9.5 × 10 9   S m 1 Passive Conductivity of the plasma membrane [16]
σ C p 0.5   S m 1 Conductivity of cytoplasm [18]
σ 0 , N m 1 × 10 4   S m 1 Passive Conductivity of the nuclear membrane [15]
σ N p 1   S m 1 Conductivity of nucleoplasm [18]
σ p , P m 0.65   S m 1 Conductivity of solution inside the pore for plasma membrane [15]
σ p , N m 0.43   S m 1 Conductivity of solution inside the pore for nuclear membrane [15]
r p m 0.51   n m Minimum radius of hydrophilic pores [8]
r p 0 0.8   n m Minimum energy radius at TMV = 0   V [8]
q2.46Electroporation constant [8]
D 5 × 10 14   m 2 s 1 Diffusion coefficient for pore radius [8]
β 1.4 × 10 19   J Steric repulsion energy [8]
γ 1.8 × 10 11   J m 1 Edge energy [8]
T e 1 1 × 10 6   J m 2 Tension of the bilayer without pores [8]
T e 2 2 × 10 2   J m 2 Tension of hydrocarbon-water interface [8]
F 0.7 × 10 9   N V 2 Maximum electric force for TMV = 1   V [8]
k 1 0.97 × 10 9   m First costant for advection velocity [8]
k 2 0.31 × 10 9   m Second costant for advection velocity [8]
α 1 × 10 9   m 2 s 1 Pore creation rate density [16]
V e p 258   m V Characteristic voltage of electroporation [8]
N e q 1.5 × 10 9   m 2 Equilibrium pore density [8]
N p 4.07 × 10 9   m 2 Equivalent pore density for one pore [8]
w 0 3.2Energy barrier inside the pore [16]
η 0.15Relative length of pore entrance area [16]
K a 7.82 × 10⁻³Costant used in Equations (19) and (25) [8]
q e 1.65 × 10 19   C Electron electric charge
k 1.38 × 10 23   J K 1 Boltzmann constant
T 310   K Temperature [8]
h P m 5   n m Plasma membrane thickness [15]
h N m 10   n m Nuclear membrane thickness [15]

