Article

WiFreeze: Multiresolution Scalograms for Freezing of Gait Detection in Parkinson’s Leveraging 5G Spectrum with Deep Learning

1
School of Computing, Engineering and Built Environment, Glasgow Caledonian University, Glasgow G4 0BA, UK
2
Department of Electrical Engineering, University of Engineering and Technology, Lahore, Punjab 54890, Pakistan
3
School of Computing, Edinburgh Napier University, Edinburgh EH10 5DT, UK
4
School of Computing and Mathematics, Manchester Metropolitan University, Manchester M15 6BH, UK
5
School of Health and Life Sciences, Glasgow Caledonian University, Glasgow G4 0BA, UK
6
School of Engineering, University of Glasgow, Glasgow G12 8QQ, UK
*
Author to whom correspondence should be addressed.
Electronics 2019, 8(12), 1433; https://doi.org/10.3390/electronics8121433
Submission received: 30 September 2019 / Revised: 8 November 2019 / Accepted: 11 November 2019 / Published: 1 December 2019
(This article belongs to the Section Microwave and Wireless Communications)

Abstract

:
Freezing of Gait (FOG) is an episodic absence of forward movement in Parkinson’s Disease (PD) patients and represents an onset of disabilities. FOG hinders daily activities and increases fall risk. There is high demand for automating the process of FOG detection due to its impact on health and well being of individuals. This work presents WiFreeze, a noninvasive, line of sight, and lighting agnostic WiFi-based sensing system, which exploits ambient 5G spectrum for detection and classification of FOG. The core idea is to utilize the amplitude variations of wireless Channel State Information (CSI) to differentiate between FOG and activities of daily life. A total of 225 events with 45 FOG cases are captured from 15 patients with the help of 30 subcarriers and classification is performed with a deep neural network. Multiresolution scalograms are proposed for time–frequency signatures of human activities, due to their ability to capture and detect transients in CSI signals caused by transitions in human movements. A very deep Convolutional Neural Network (CNN), VGG-8K, with 8K neurons each, in fully connected layers is engineered and proposed for transfer learning with multiresolution scalogram features for detection of FOG. The proposed WiFreeze system outperforms all existing wearable and vision-based systems as well as deep CNN architectures with the highest accuracy of 99.7% for FOG detection. Furthermore, the proposed system provides the highest classification accuracies of 94.3% for voluntary stop and 97.6% for walking slow activities, with improvements of 9% and 23%, respectively, over the best performing state-of-the-art deep CNN architecture.

1. Introduction

Parkinson’s Disease (PD) is a progressive neurological disorder that effects more than 0.1 million people in the United Kingdom [1], 1–1.5 million in the United States [2], and 4.94 million people in China [3]. Every 1 in 37 people in the United Kingdom are diagnosed with PD at some stage of their life [1]. PD is caused by the neuronal loss and damage in the motor area of the brain, particularly the centers of the limbic, visceromotor, and somatomotor systems [4]. Most PD patients experience difficulty in walking, which indicates an onset of gait, balance, and other disabilities [5]. Half of the PD patients experience Freezing of Gate (FOG) symptoms, which represent an episodic absence of forward feet movement, despite of the intention for forward progress [6]. The frequency as well as the duration of FOG episodes increases with the progression of PD. FOG and falls are both interconnected phenomena, and FOG is known to hinder daily activities and increase fall risk [7], resulting in severe consequences for older adults.
Conventional clinical methods to validate FOG occurrences and their severity are based on self-report questionnaires [8] and doctors’ reports based on direct observation. Due to the impact of FOG on population in general and falls in older adults in particular, there is a high demand for automating the process of detection and recognition of FOG events. Currently, various methods using wearable devices and vision-based systems have been exploited for FOG detection. A number of systems have been proposed with wearable sensors or cameras for FOG detection, including (a) wearable accelerometer and/or gyroscope sensors [2,9,10], (b) smartphone-based sensors [11,12,13], (c) electromyograpy sensors [14,15], (d) pressure/force-based sensors [16,17], and (e) vision-based sensors [18,19]. However, such systems suffer from various drawbacks. Wearable sensors and smartphones need to be attached or carried by the patient all the time for continuous monitoring. Such devices may be cumbersome to carry or difficult to wear under all circumstances. Vision-based systems are sensitive to lighting conditions, require line-of-sight view, and suffer from privacy issues.
Recently, channel state information (CSI) measurements of WiFi devices have been used for monitoring and sensing purposes. WiFi devices are ubiquitous in indoor environments and offer a noninvasive, low-cost, passive monitoring system. WiFi-based sensing does not require a subject to be in direct line of sight and is not sensitive to lighting conditions. Therefore, WiFi sensing does not suffer from limitations of wearable sensors or camera-based systems. WiFi sensing-based monitoring systems only require a WiFi router or access point and one or more WiFi enabled devices. WiFi sensing with CSI measurements have been used in various applications, such as human presence/localization [20,21,22], activity recognition [23,24,25], fall classification and detection [26,27,28,29], gesture recognition [30,31,32], and user identification [33,34,35].
Recent work has leveraged WiFi sensing for human presence detection and localization. Qian et al. [20] used a WiFi-based Multiple Inputs and Multiple Outputs (MIMO) system and CSI measurements to detect presence of humans with dynamic movement speeds utilizing a Support Vector Machine (SVM), resulting in a true positive rate greater than 93%. Furthermore, the authors exploited eigenvalues of the CSI amplitudes and correlation matrix for the CSI phase information to detect human movement. PeriFi [21] used multipath reflections for spatial information to improve the sensitivity of conventional methods to sense the presence of both moving and stationary humans using an SVM. Zhou et al. [22] utilized CSI for indoor detection and localization by using spatial density-based clustering for denoising and principal component analysis for feature extraction, which are then classified by SVM for detection and localization of human presence.
Human activity recognition is an important application area for WiFi-based sensing. Zhang et al. [23] proposed a WiFi sensing model based on diffraction and modeled signal strengths for activities and repetitive motion exercises. Furthermore, their model collects various statistics such as time duration and counts repetitive motion apart from activity classification and is trained with a 5-layer CNN. CARM [24] is an activity classification and monitoring system based on CSI measurements. Wang et al. [25] proposed a location oriented activity detection and recognition system based on CSI called E-eyes. Apart from the activities of daily life, falls in older adults have also been classified among various activities using WiFi-based sensing. FallSense [26] utilized a dynamic algorithm for template matching to detect real-time falls with wireless channel data. The dynamic algorithm keeps on updating and improving on usage. Tian et al. [27] used a CNN along with a state machine to determine the state sequences for fall detection and duration based on radio frequency signals. WiFall [28] is a WiFi sensing-based fall detection system, which utilizes frequency information to detect sharp falls with the help of SVM classifier. In [29], fall detection was performed in real-time, utilizing both the amplitude and phase information of CSI values. Furthermore, the authors demonstrated that CSI measurements can successfully distinguish between falls and activities that are similar to falls.
WiFi sensing has also been exploited for gesture recognition. WiMU [30] is a multi-user system for gesture recognition. The novelty of WiMU lies in generating virtual samples for different possible combinations of performed gestures and comparison of both for the recognition and classification task. Widar-3.0 [31] is a WiFi sensing system for gesture recognition, which is based on the kinetic characteristic of various gestures. The gesture characteristics are derived from their velocity profiles and makes the system agnostic to different domains. Wi-Fringe [32] recognizes meaningful gestures with names in English language, rather than free form gestures with the help of CSI measurements. Nkabiti et al. [33] mapped CSI values representing human gait patterns to the body structure of individual persons for identification by leveraging a deep bidirectional recurrent neural network. Rapid [34] utilizes gait analyses with walking patterns and step detection from CSI measurements along with sound waves from footstep to identify users with high accuracy. NiFi [35] is a human identification system based on WiFi sensing, which exploits different user physical constraints to identify similarity among signal patterns for user identification.
In this work, we have utilized WiFi sensing for unobtrusive detection of FOG symptoms in PD patients. Our research demonstrates that FOG generates different CSI amplitude variations than the voluntary stop, sitting–standing, and walking fast and slow, which can be utilized for classification of FOG from other activities. The contributions of our work are given below.
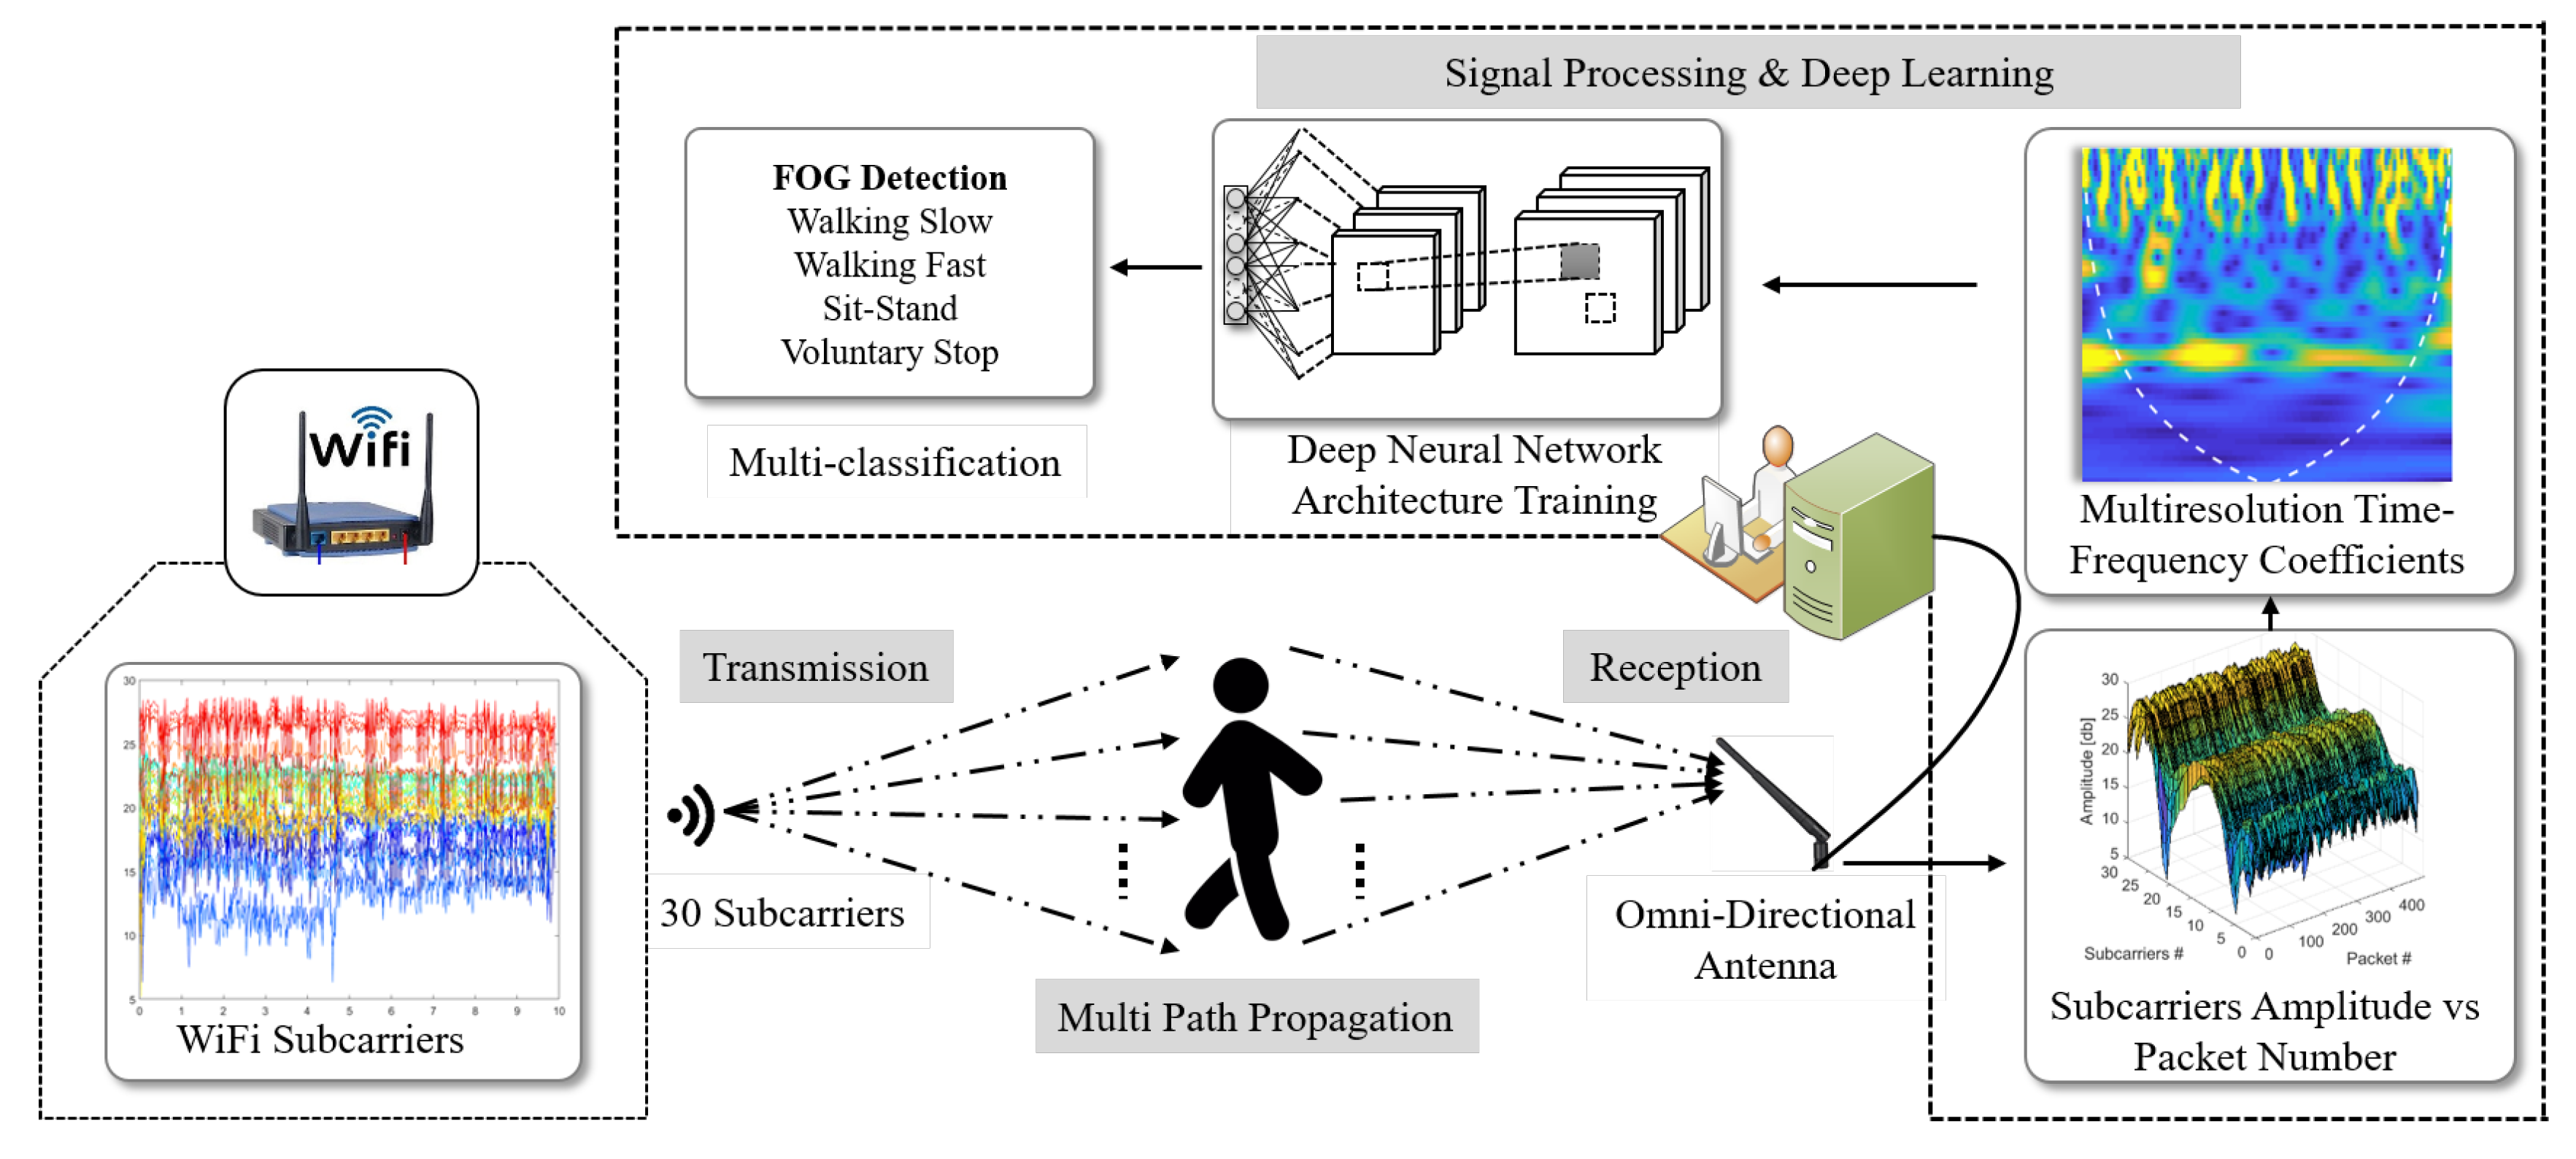
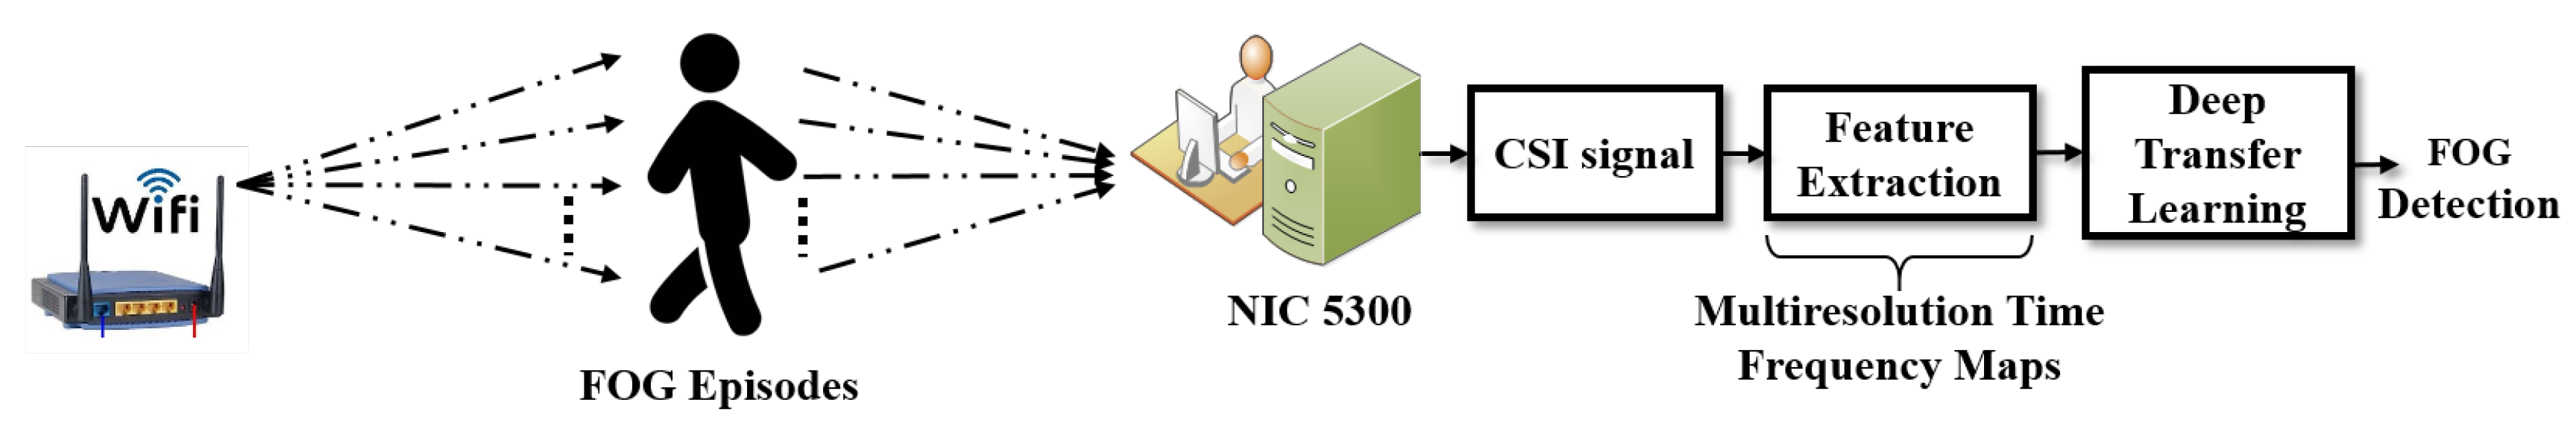
  • Proposed WiFi sensing system leveraging deep learning for high multi-classification accuracy for FOG detection compared to other activities including “voluntary stop”.
  • Utilized multiresolution scalograms of subcarrier CSI amplitudes as discriminating features for detection of FOG, due to their ability to detect transients in CSI signals at different resolutions.
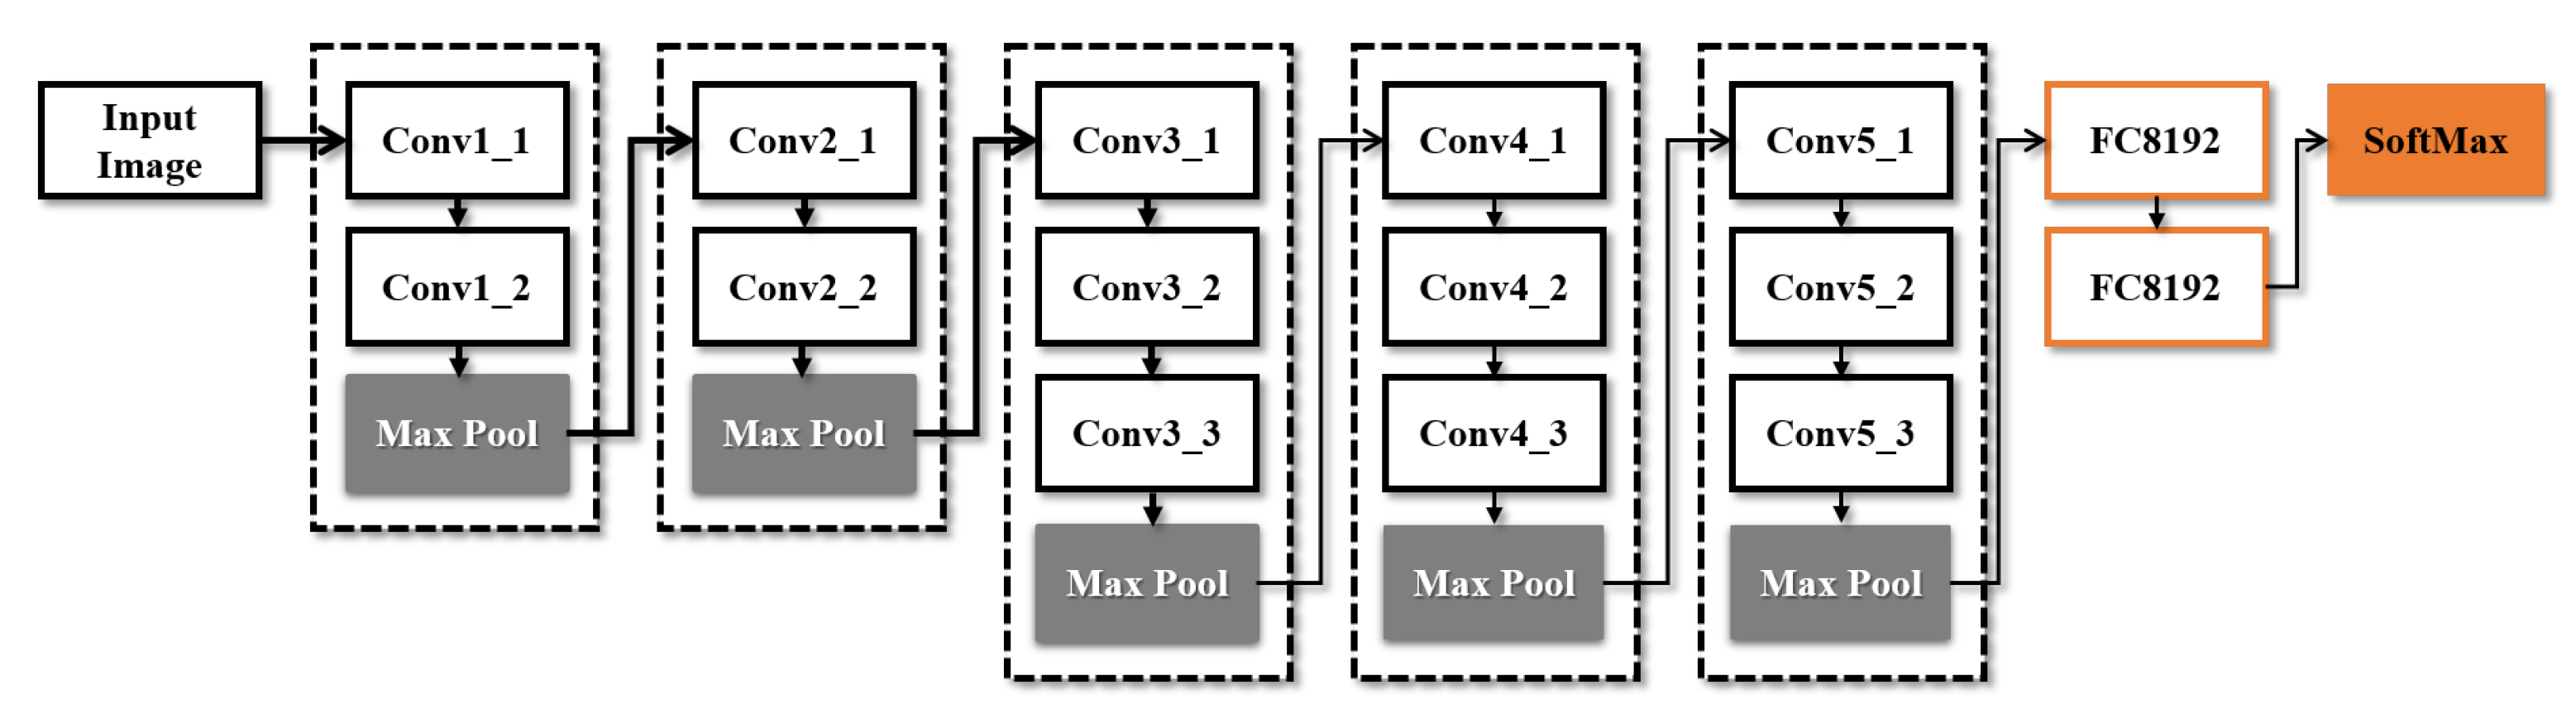
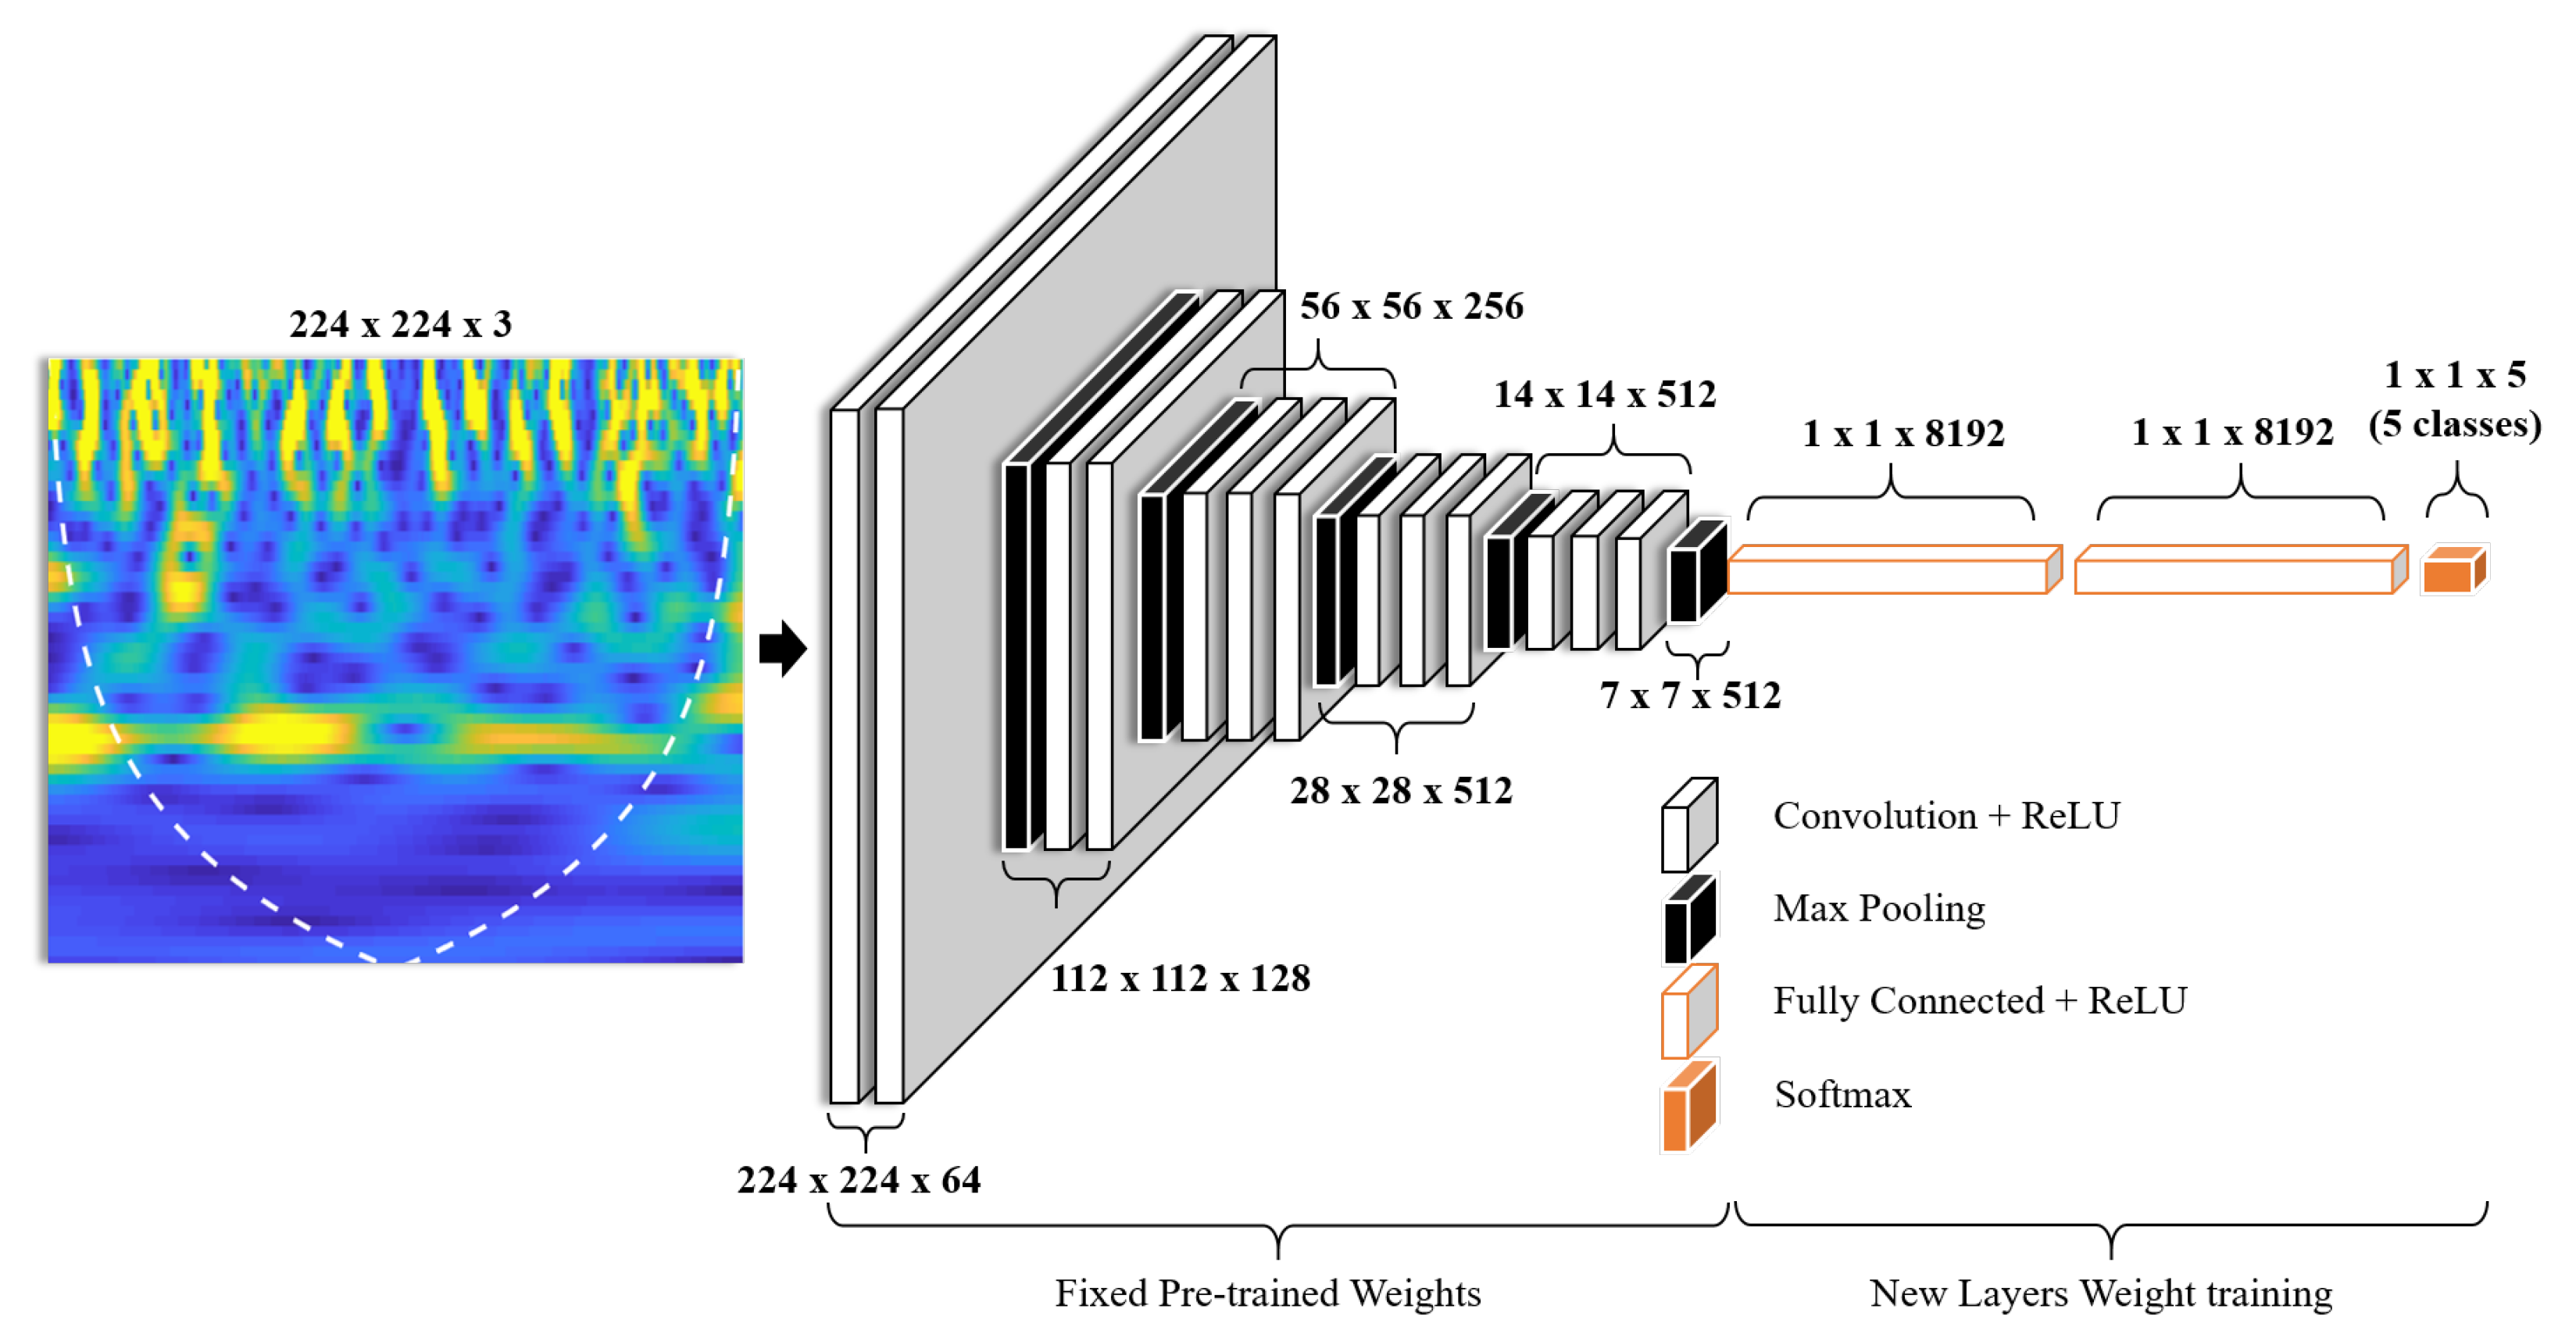
  • Engineered and modeled a very deep CNN architecture, namely, VGG-8K with 8192 neurons in each of the fully connected layers, with transfer learning for highest classification accuracy of FOG compared to current state-of-the-art deep CNN models.
The proposed system is illustrated in Figure 1 and leverages wavelet-based multiresolution scalograms of CSI amplitudes. The CSI phase measurements were not used because of their highly random nature. The multiresolution scalograms represent time–frequency signatures of FOG and Activities of Daily Life (ADL) that are used as image objects to train a very deep CNN with transfer learning. The proposed very deep CNN, VGG-8K, has been engineered from an existing pretrained deep learning network architecture and provides high accuracy detection of FOG at 99.7%.

2. Channel State Information Preliminaries

CSI represents the frequency response of the channel through which a wireless signal propagates at a given carrier frequency. Each CSI entry has amplitude and phase information associated with it, which is affected by the multipath propagation effects. The channel frequency response (CFR), H s c , for a subcarrier, s c , with frequency f s c over n multiple propagation paths can be given as
H s c ( f s c ; t ) = n a n ( t ) e j 2 π f s c τ n ( t )
where a n ( t ) is the amplitude attenuation, whereas τ n ( t ) is the propagation delay τ n ( t ) for path n at subcarrier frequency f s c . The C S I s c value for a channel with subcarrier frequency f s c represents an estimate of CFR and can be given as
C S I s c = | H s c | e j sin ( H s c )
The amplitude and phase of CSI values are effected by the movements of transmitter, receiver, objects, and human beings. Therefore, for a given environment and fixed positions for transmitters and receivers, CSI is effectively able to capture the changes in channel response, due to various movements including FOG and ADLs for PD patients. Orthogonal Frequency Division Multiplexing (OFDM) divides a WiFi channel into multiple subcarriers. Let a WiFi channel with MIMO have N T x transmitting antennas and N R x receiving antennas, then the WiFi channel can be modeled as
r s c = H s c t s c + n s c , s c { 1 , , S }
where t s c R N T x and r s c R N R x represent transmitted and received signal vectors, respectively, for a given subcarrier s c . H s c represents the CSI matrix for a given s c , and the total number of subcarriers used in our work are S = 30 . n s c is the noise vector. The CSI values are obtained from the received packets, where CSI packet received is a N T x × N R x × 30 matrix. It results in a 3 D matrix with subcarriers along the third dimension, whereas N T x × N R x represents the number of streams. For example, a system with two transmitters and two receivers will have four streams, where each stream can be represented as
C S I 1 = { C S I 1 1 , , C S I 1 30 } C S I 2 = { C S I 2 1 , , C S I 2 30 } C S I 3 = { C S I 3 1 , , C S I 3 30 } C S I 4 = { C S I 4 1 , , C S I 4 30 }
here, C S I k s c , k represents the stream number and s c represents the subcarrier. In this work, only amplitudes of CSI measurements have been used for FOG detection and classification from ADLs, therefore CSI will be used synonymously for CSI amplitude. The next section gives the methodology for FOG detection and classification work done in the paper.

3. Methodology

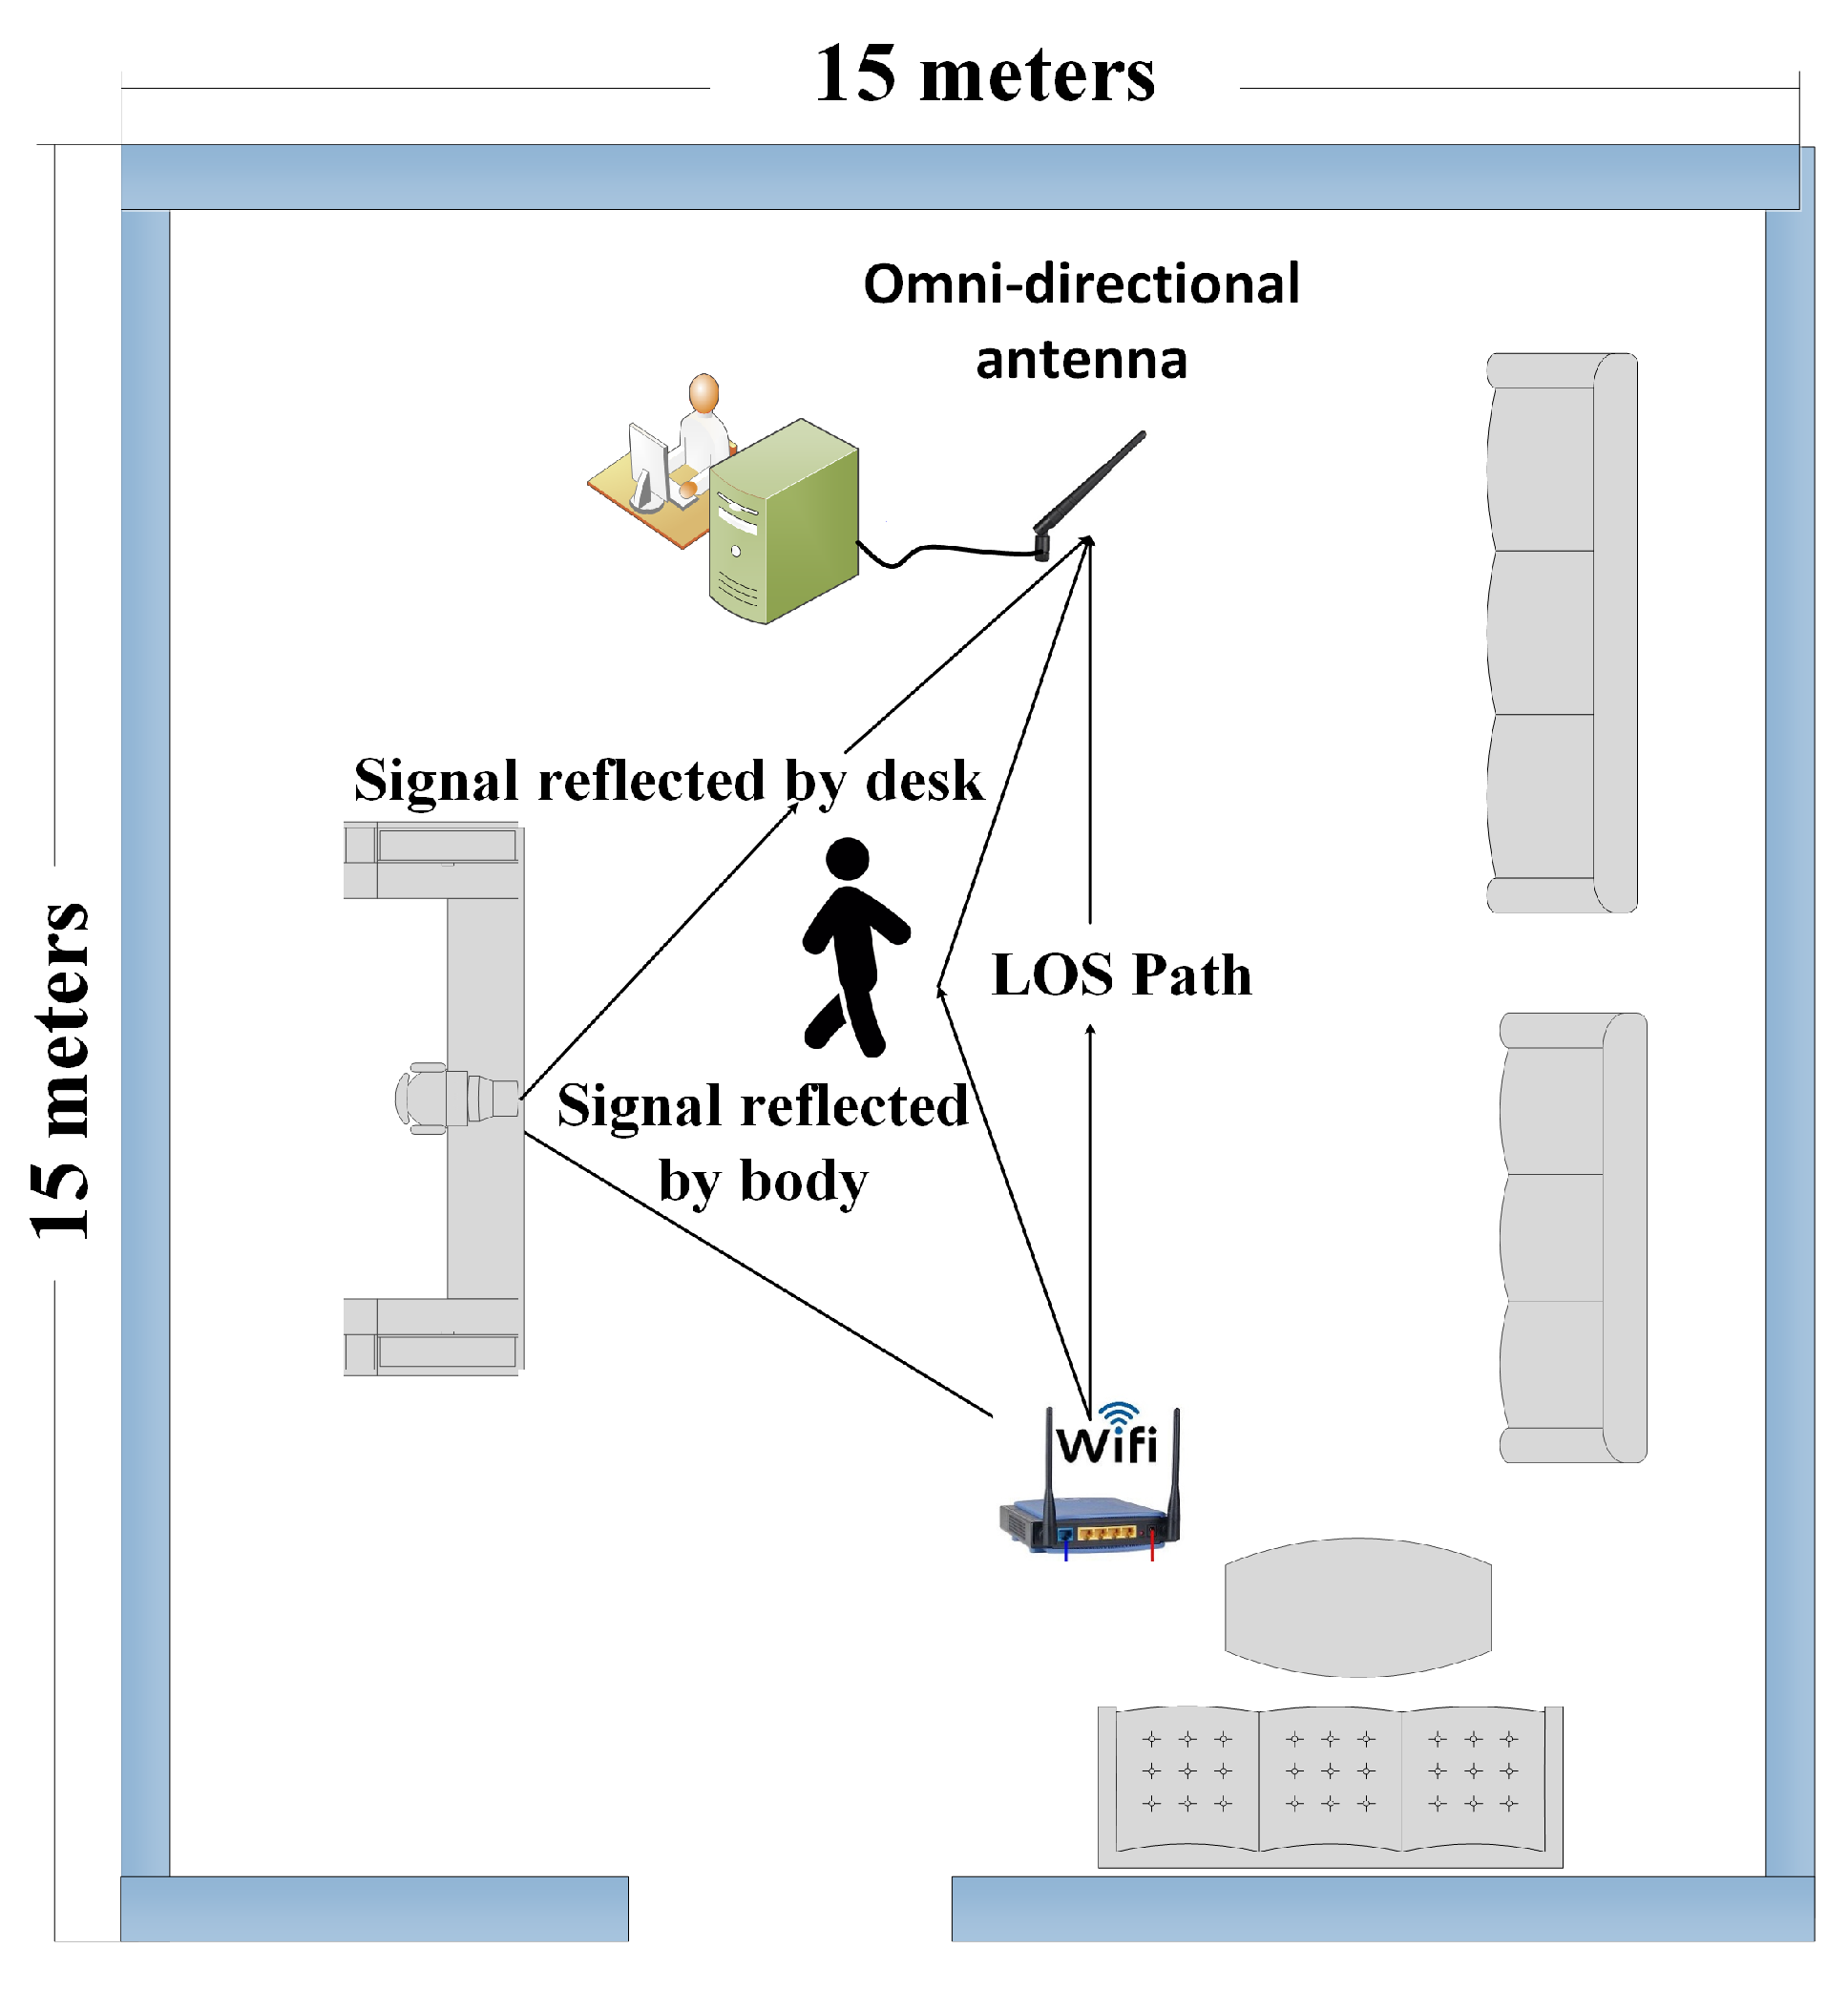
3.1. FOG Detection Set-Up

The experimental indoor setup for FOG detection is illustrated in Figure 2. The indoor setup is based in a room of size (15 m × 15 m) at Xidian University, China. The transmitter (Tx) is a WiFi router placed 10 m apart, in the line of sight of the receiver (Rx). The Rx consists of an omnidirectional antenna connected to a commercial Intel 5300 network adapter installed in the PCIe slot of an HP desktop computer, equipped with Ubuntu 14.1 and 4 GB RAM. The Tx works at 4.8 GHz in C-band and generates RF signals with multiple frequencies. The frequency is part of the 5G spectrum in China and is an essential part of the official 5G communication standards in China [36]. In addition, the Internet of Things (IoT) for 5G network primarily use the specific frequency band as well. The receiver side antenna also works with the similar frequency band. These signals are received by RX and the CSI variations are passed onto the desktop for processing. A total number of 15 volunteers took part in the experiments after obtaining ethical approval and were asked to perform four activities of daily life, during which the freezing of gate episodes were captured. This work takes into account five activities namely, walking fast, walking slow, sit–stand, voluntary stops, and FOG. The ground truth for FOG was the patient assertion of experiencing the FOG episode, the remaining activities were randomized over different subjects, and the instruction and subsequent observation of a particular activity was used as the ground truth. The activities affect the wireless medium and the perturbations in CSI values are captured and used for discrimination of FOG episodes from ADLs.

3.2. Experimental Procedure

The experimental procedure for FOG detection consists of a WiFi sensing system comprised of multiple carriers, the amplitude variations of 30 subcarriers were processed on the receiver side. The processing involved extraction of features from the received signal through signal processing techniques. Signal processing operations were performed in Matlab 2017 to obtain time-frequency scalograms for each subcarrier. Deep transfer learning was performed on the extracted features using Tensorflow [37] and Keras [38] on Google colab [39] with the help of K40 Nvidia graphics processing units. The training and testing procedure was based on hold out validation with 80% data for training and 20% for testing. The proposed system was evaluated and compared with a number of deep state-of-the-art pretrained networks, such as VGG-16 [40], VGG-19 [40], ResNet-50 [41], and ResNet-101 [41].

4. The Proposed WiFreeze System

The proposed WiFreeze system architecture is illustrated in Figure 3 and solves a multi-classification problem of FOG detection and recognition of various ADLs. The system consists of a WiFi router, which transmits data using OFDM comprised of 30 subcarriers. The CSI amplitudes | H s c | and phase H s c of the subcarriers are affected by the human movements in the environment under test. The receiver receives the amplitude perturbations | H s c | for each subcarrier at the granularity of packets and corresponding time values. Each of the subcarrier amplitudes | H s c | are processed for feature extraction. A multiresolution time-frequency scalogram is computed with the continuous wavelet transform, and the time-frequency patterns are used as an image object for classification of FOG and ADLs. Transfer learning is performed on a very deep CNN with scalogram images as inputs for detection of FOG and ADLs.

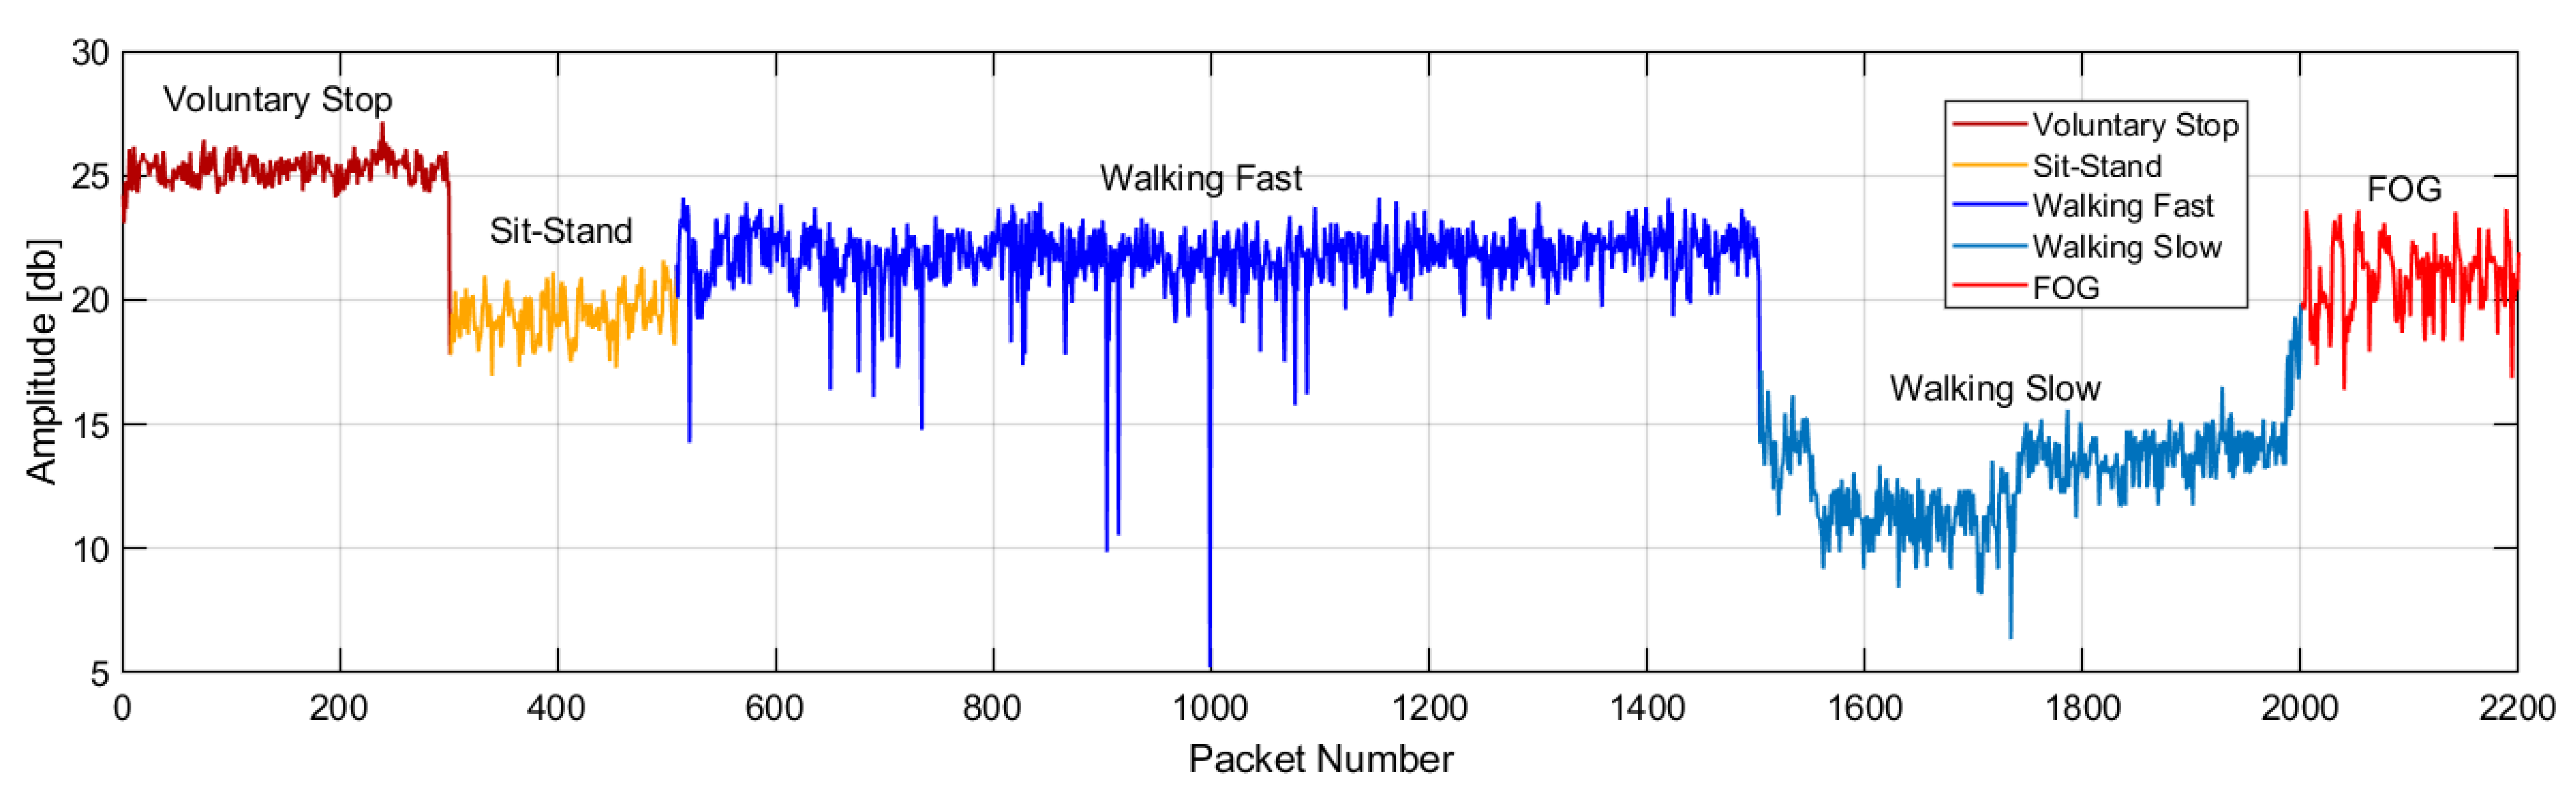
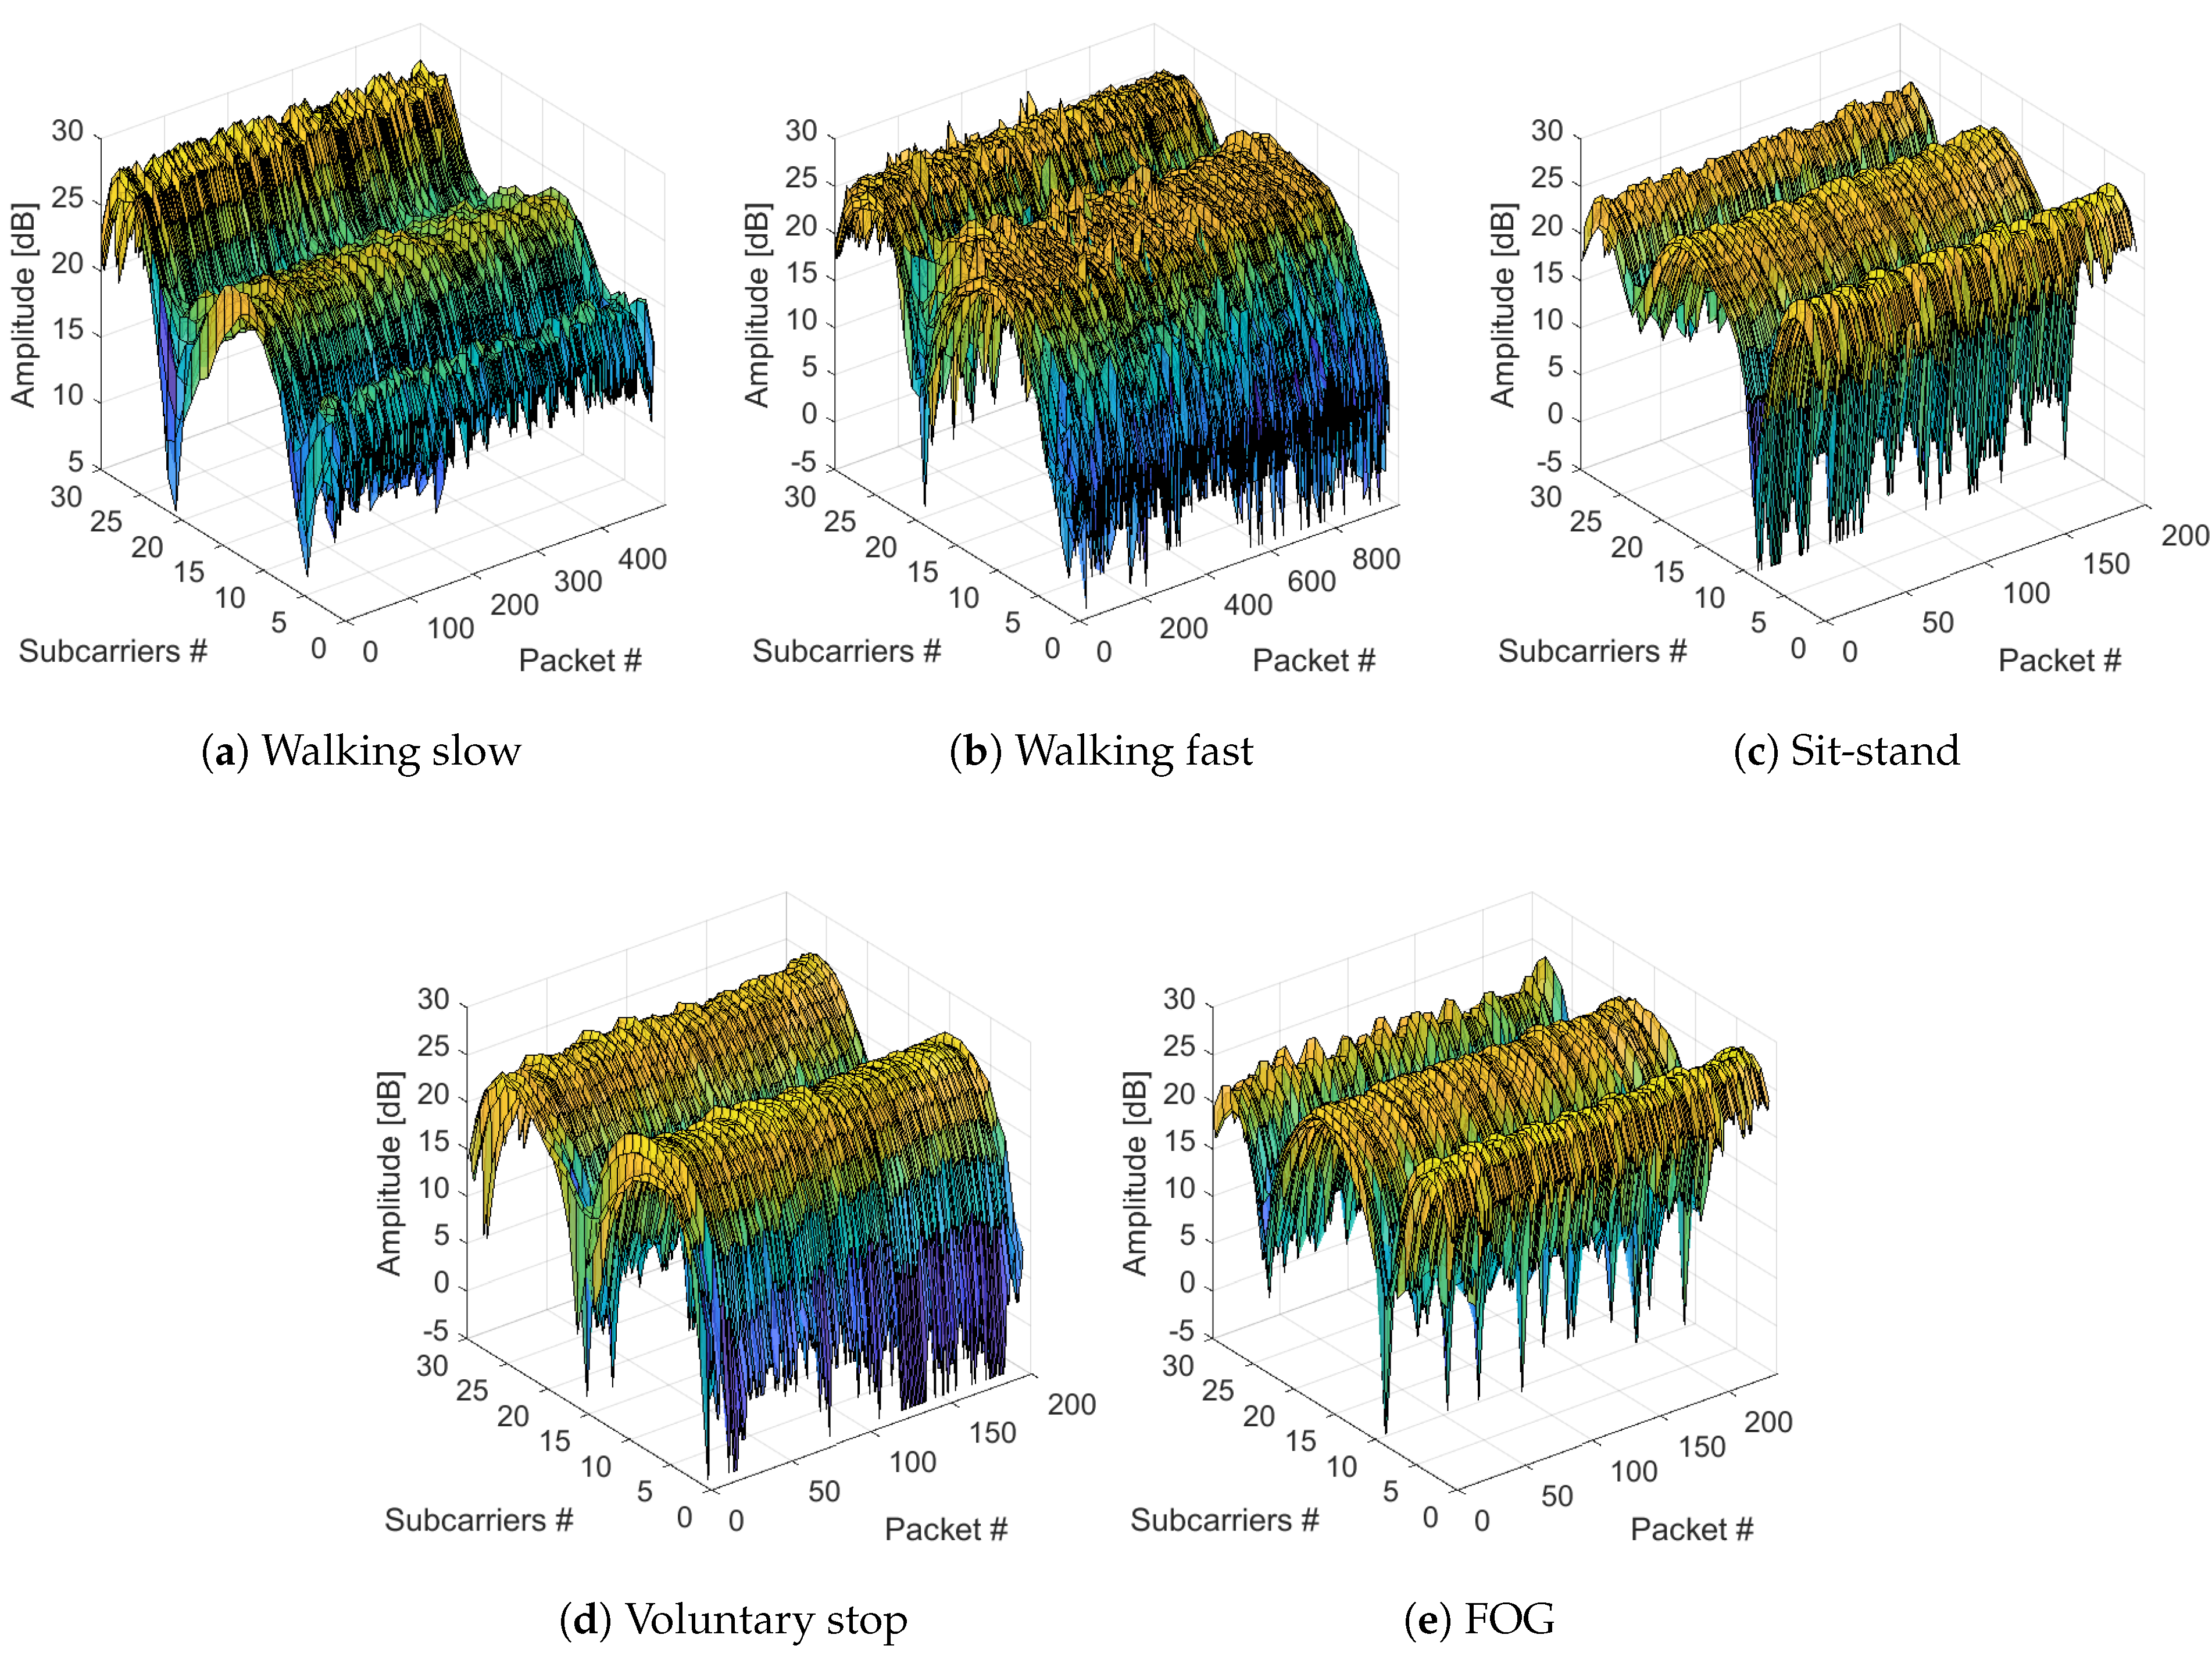
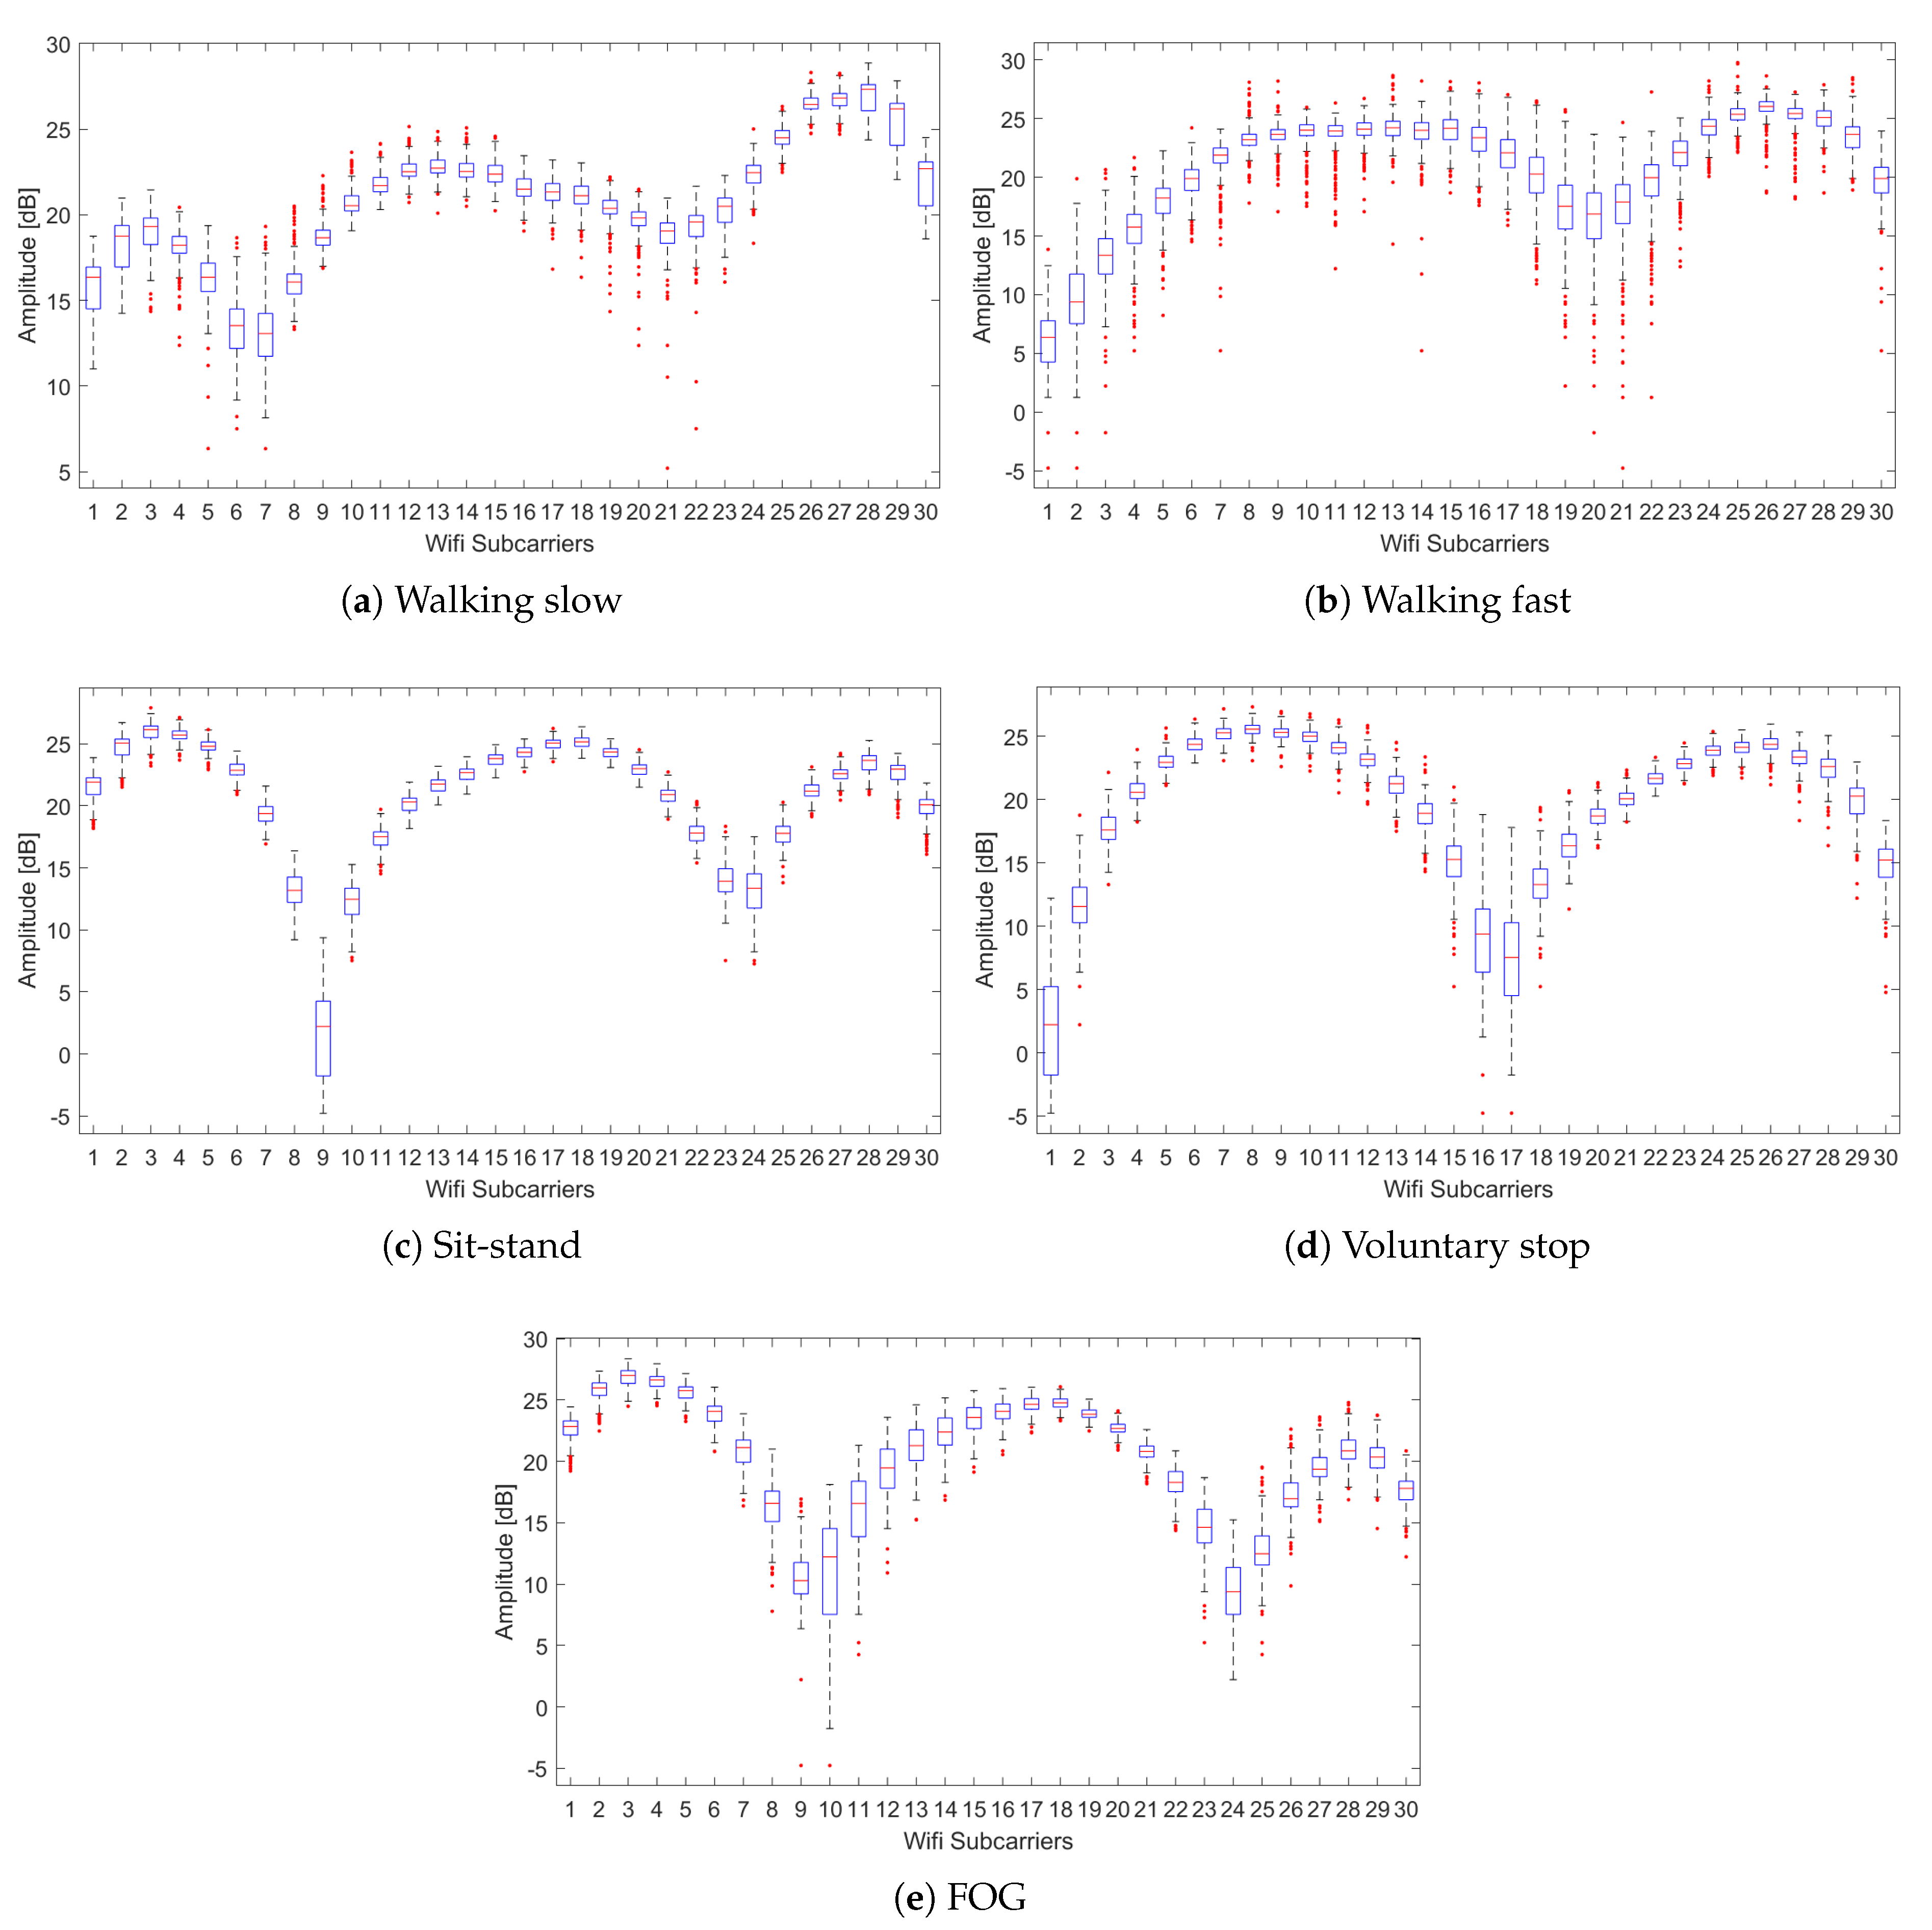
4.1. CSI for FOG and Activities

The CSI amplitudes [dB] were obtained from the Intel 5300 NIC connected to the omnidirectional antennae receiver. CSI measurements in our work refer to CSI amplitudes, as phase values were not used due to their highly random nature. Figure 4 shows CSI values for an arbitrary sequence of movements, as the activities were randomized over different subjects. Furthermore, the CSI measurements for FOG and different ADLs exhibit distinguishable variations in the amplitudes of subcarriers, with the number of packets as illustrated in Figure 5. The CSI measurements also change with the subcarriers (frequency) as illustrated in Figure 5, amplitude [dB] versus subcarriers plot. Overall, Figure 5 illustrates significant changes in CSI measurements across number of packets (time) and subcarrier numbers (frequency) for different ADLs and FOG. Note that the CSI measurements show distinguishable changes between FOG and voluntary stop despite similarities in both movements, as illustrated in Figure 5e,d, respectively.
The box plots for the CSI measurements versus subcarriers are also illustrated in Figure 6, which show first quartile Q 1 _ C S I s c , median M d _ C S I s c , third quartile Q 3 _ C S I s c , interquartile range I Q R , minimum value m i n _ C S I s c , and maximum values m a x _ C S I s c , as given in Equations (5)–(10), respectively. The CSI values below the lower limit m i n _ C S I s c and above the upper limit m a x _ C S I s c are outliers, denoted as red dots in the box plot shown in Figure 6. The box plots for CSI measurements provide statistical information about the amplitude of variations along 30 subcarriers. It is quite clear from the box plots that statistical information of a single subcarrier such as median, quartiles, and interquartile ranges are not sufficient to distinguish between various activities and FOG. The available statistical information of various subcarriers may be same across different activities, such as subcarriers 13, 14, and 15 in Figure 6a,c, have similar median and quartile values. Similarly, subcarriers 9 and 10 in Figure 6c,d provide same statistical information. In the next section, we describe signal processing technique for feature extraction, which can be applied to a single carrier to obtain features for classification of FOG and ADLs.
Q 1 _ C S I s c = H s c t + N + 1 4 × T
M d _ C S I s c = H s c t + N + 1 2 × T
Q 3 _ C S I s c = H s c t + 3 × N + 1 4 × T
I Q R = Q 3 _ C S I s c Q 1 _ C S I s c
min _ C S I s c = Q 1 _ C S I s c 1.5 ( I Q R )
max _ C S I s c = Q 3 _ C S I s c + 1.5 ( I Q R )

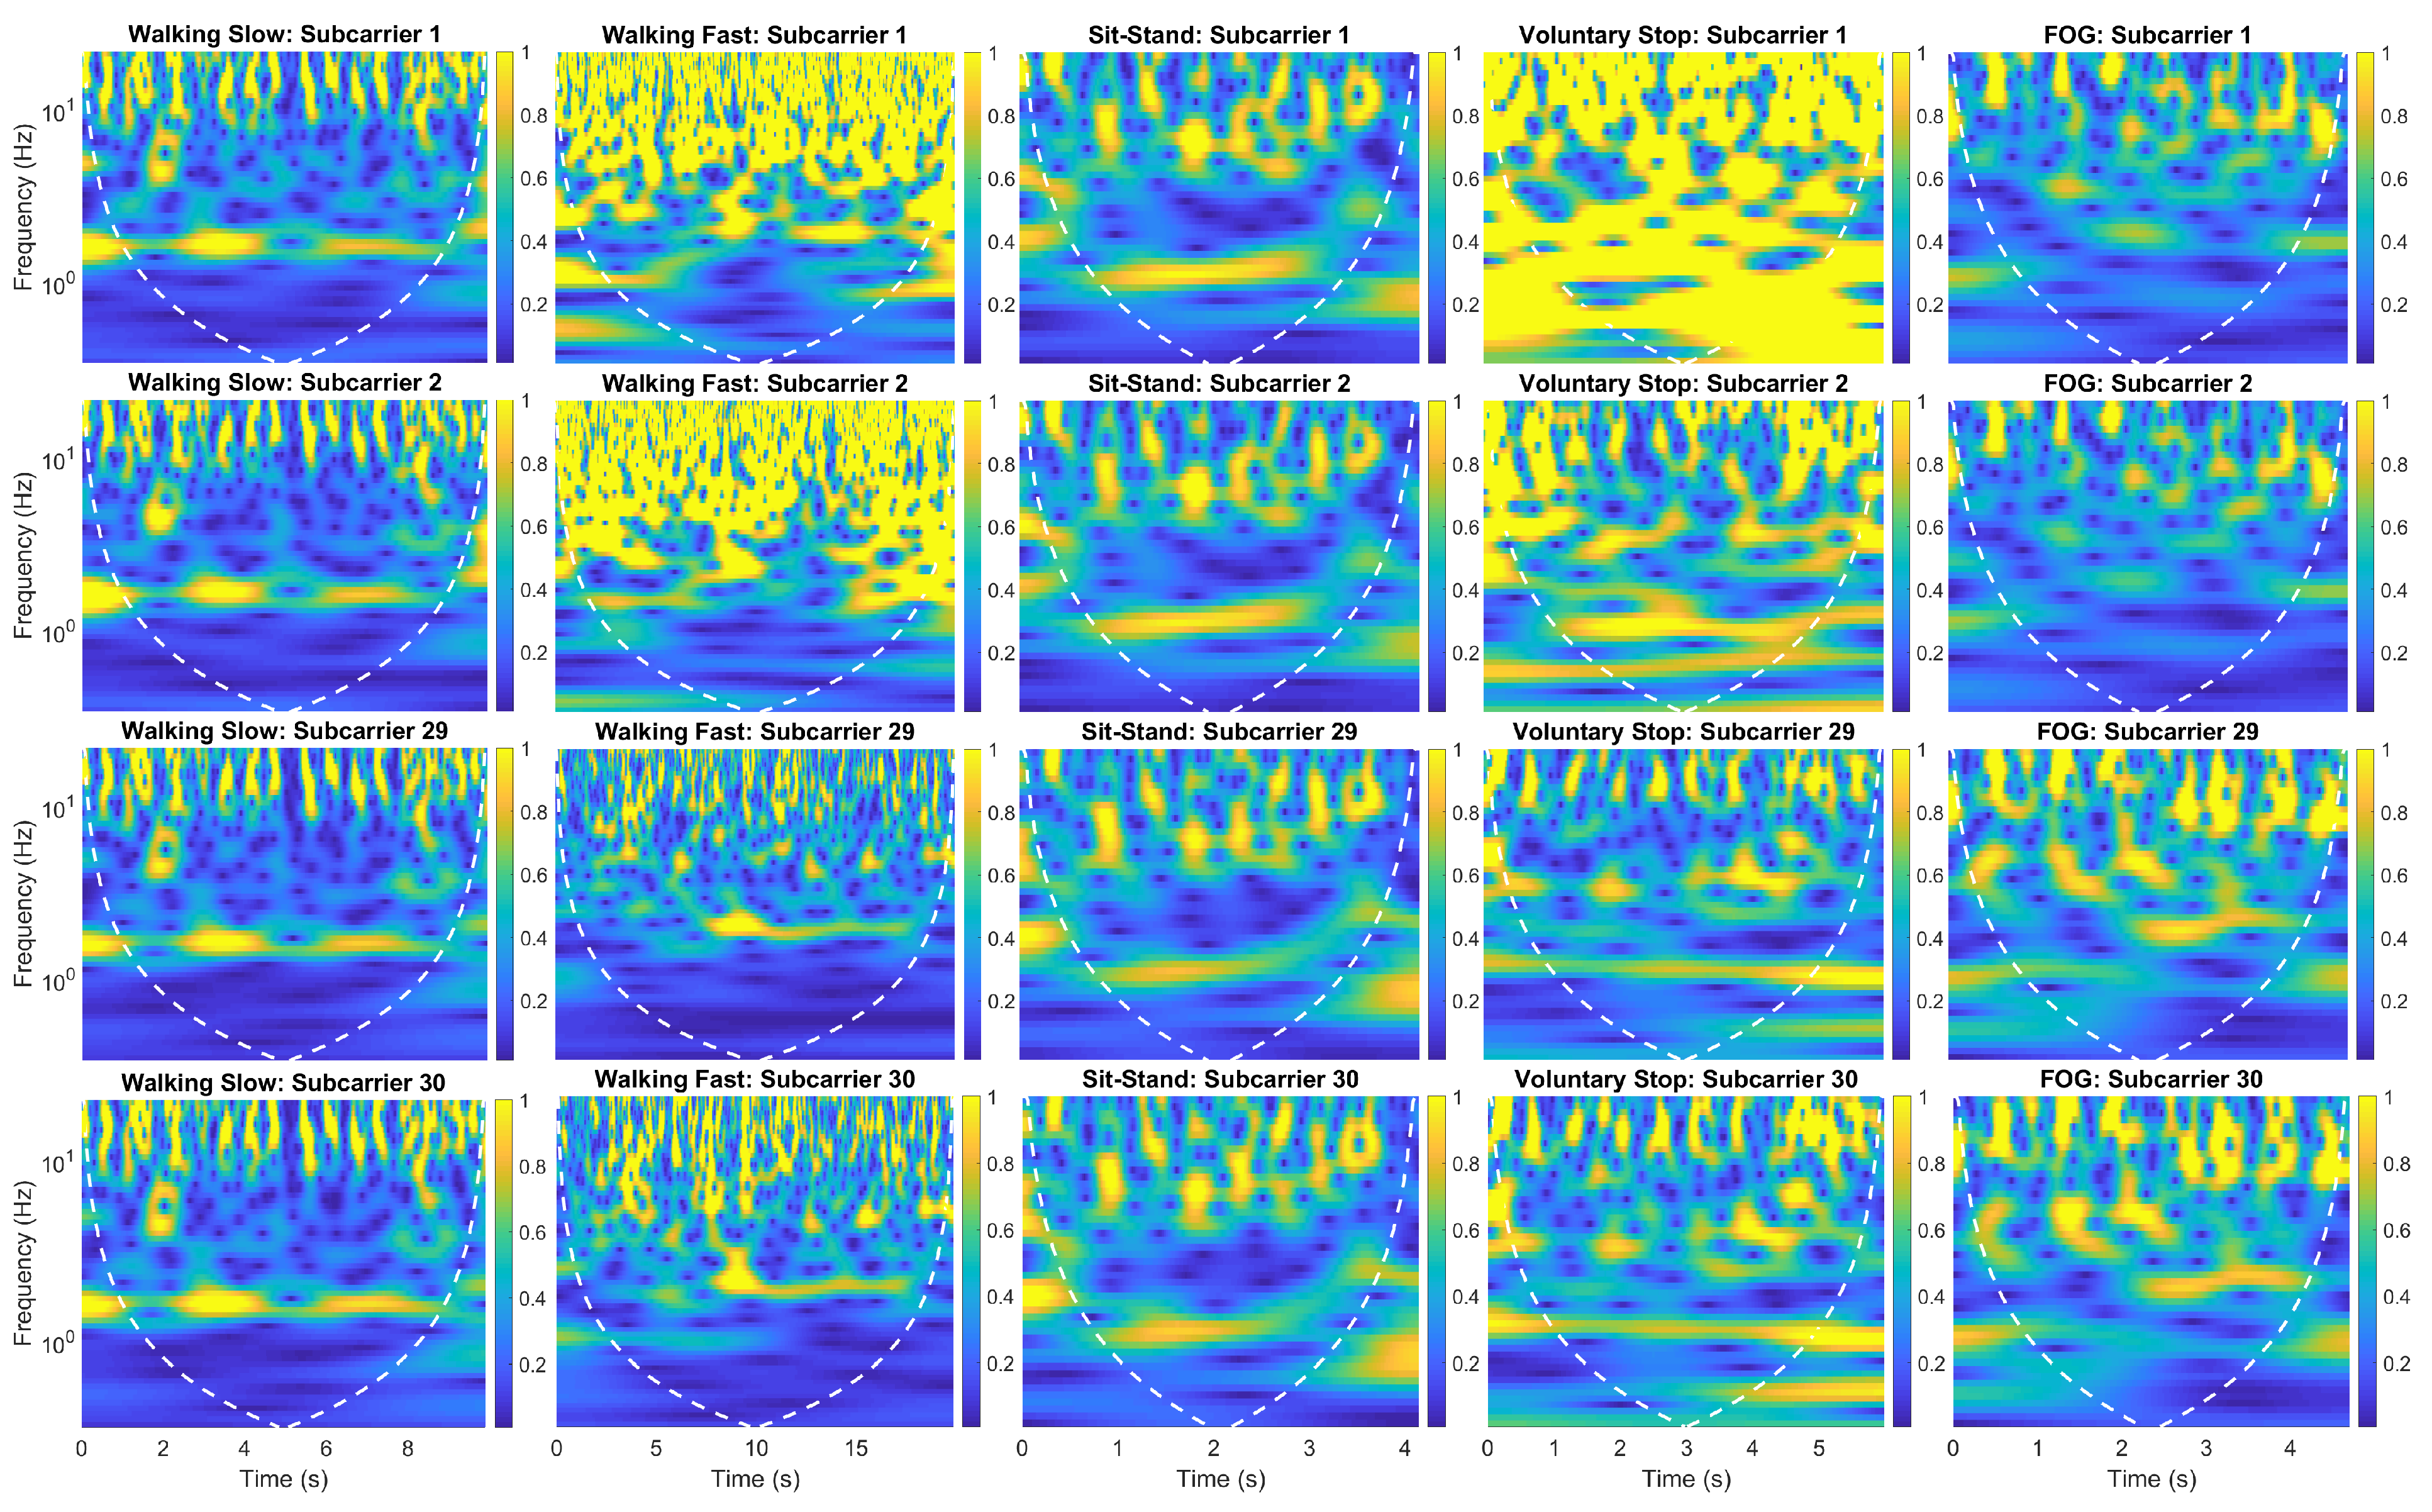
4.2. Multiresolution Time-Frequency Scalograms

Multiresolution time-frequency scalograms are computed for CSI amplitudes for each of the subcarriers and are used as features in the proposed WiFreeze FOG detection system. The scalogram E ( t , f ) is a multiresolution energy density function obtained from the time-frequency analysis of CSI signals with continuous wavelet transform (CWT). The function E ( t , f ) is computed from the square of the amplitude of CWT function C d ( t , f ) of a discrete sequence. The scalogram function can be derived from the CWT C c ( t , s ) of a continuous time signal x ( t ) , given in terms of time t and scale s in Equation (11):
C c ( t , s ) = x ( v ) 1 s ψ v t s d v
where ψ ( v t / s ) represents translations and dilations of the mother wavelet ψ ( t ) [42]. Using v t = τ and scale s as functions of frequency f, s = g 1 ( ω ) = g 2 ( f ) , where CWT of continuous and discrete signal are given in Equations (12) and (13) as
C c ( t , f ) = x ( t + τ ) Ψ ( τ , f ) d τ
C d ( t , f ) = T k x ( t + k T ) Ψ ( k T , f ) d τ
where x ( k T ) is a discrete sequence sampled with a period T = 1 / F and F is the sampling frequency. CWT for a discrete CSI signal can be computed by substituting x ( k T ) with C S I s c ( k T ) , as given in Equation (14):
C d ( t , f ) = T k C S I s c ( t + k T ) Ψ ( k T , f ) d τ
where T = 0.02 s, F = 50 Hz is the sampling frequency used for sampling CSI amplitudes, and the mother wavelet used is the “morse” wavelet [43]. The scalogram E ( t , f ) can then be represented in Equation (16) as
E = C d ( t , f ) C d ( t , f )
E = T 2 k 1 k 2 C S I s c ( t + k 1 T ) C S I s c ( t + k 2 T ) Ψ ( k 1 T , f ) Ψ ( k 2 T , f )
Wavelet-based scalograms provide multiresolution time-frequency plots owing to a variable window size, which is a result of different dilations of the mother wavelet. Scalograms can better localize transient changes in CSI values, due to transitions in human movements, and provide higher resolution due to smaller window durations at higher frequencies (smaller scales). The Short-Time Fourier Transform (STFT), on the other hand, has constant window size and results in poor resolution and time localization. Furthermore, CWT-based scalograms can detect smooth features in signals due to bigger windows durations at lower frequencies. The CSI amplitudes [dB] for FOG and ADLs are illustrated in Figure 7 for subcarriers 1, 2, 29, and 30.
The scalograms in Figure 7 are plotted against a logarithmic frequency scale, whereas the white dotted line inside each scalogram shows the cone of influence. The cone of influence delineates the region where edge effects become significant. The region inside the cone of influence is significant because of higher accuracy. The region outside is suspect due to potential inaccuracies of edge effects; however, it maintains differentiating patterns that are different for different activities. These scalograms are used as image objects into a proposed very deep CNN architecture for classification of FOG and activities.

4.3. The Proposed Deep Network for WiFreeze System

The proposed very deep CNN architecture is engineered from an existing VGG-16 architecture [40] and is illustrated in Figure 8 with each layer size. The VGG-16 [40] architecture is pretrained on the imagenet [44] database for object identification. The layers of the proposed network VGG-8K consist of 13 convolutional layers, five maximum pool layers, one global average pooling, two Fully Connected (FC) layers at the output with 8192 neurons each, and a Softmax layer with five classes, as illustrated in Figure 9. The neural network is called VGG-8K as it has 8000 neurons in each FC layer. The convolutional layers of the proposed network use the pretrained weights of VGG-16 [40], whereas the FC and Softmax layers are trained by transfer learning on the scalograms of all subcarriers for the FOG and activities data set.
The proposed network is trained with Stochastic Gradient Descent (SGD) using momentum and Nesterov accelerated gradient. Using the objective function Q ( ϕ ) , where ϕ R D represents the model parameters. The update of parameters is opposite in direction to the gradient ϕ Q ( ϕ ) of function Q ( ϕ ) . The batch gradient descent computes the update using entire data in Equation (17). SGD uses each data example and mini-batch in Equations (18) and (19). The training algorithm is accelerated by adding update vector with a momentum factor γ in Equation (20). The Nesterov accelerated gradient is exploited by using ϕ γ u t 1 in the objective function, Equation (21), where parameters are updated by Equation (22).
ϕ = ϕ η · ϕ Q ( ϕ )
ϕ = ϕ η · ϕ Q ( ϕ ; x ( j ) ; y ( j ) )
ϕ = ϕ η · ϕ Q ( ϕ ; x ( j : j + n ) ; y ( j : j + n ) )
u t = γ u t 1 + η ϕ Q ( ϕ )
u t = γ u t 1 + η ϕ Q ( ϕ γ u t 1 )
ϕ = ϕ u t
The learning rate hyperparameters were tuned for higher accuracy and speed. A number of learning rates from 0.0001 to 0.1 were tested, and the best results were obtained for the learning rate η = 0.001 . The momentum parameter can be used to improve the speed of optimization and was tested for a number of values from 0.5 to 0.99. The final momentum value of γ = 0.9 was used for the learning algorithm, whereas the decay rate of ρ = 1 × 10 6 was utilized for the learning rate. The Nesterov accelerated gradient was also applied to the momentum term to improve convergence and training speed. The loss function used was the categorical cross entropy due to the multi-classification nature of the problem. The output of the Softmax function layer is used to calculate loss function [45].
The network has totally 86,075,205 parameters, with 71,360,517 trainable parameters for the 2 new 8K FC and 1 Softmax layer and 14,714,688 non-trainable parameters. The 86M parameters are total weight and biases of all the layers. The 13 convolution layers of VGG-16 have 14,714,688 (14M) parameters, which are kept fixed for transfer learning, whereas the newly added last three layers are trained. The number of parameters for the last three layers can be calculated. There are 512 outputs from the pooling layer, which are provided as input to a dense layer of 8192 neurons, 512 weights × 8192 neurons + 8192 bias parameters = 4,202,496. Whereas 8192 inputs from a dense layer are provided to another dense layer of 8192 neurons, 8192 weights × 8192 neurons + 8192 bias parameters = 67,117,056. Furthermore, 8192 inputs from a dense layer are provided to a Softmax layer with 5 neurons for 5 class classification, 8192 weights × 5 neurons + 5 bias parameters = 40,956. Therefore, the total trainable parameters of the last three layers are 71,360,517 (71M), and the total number of parameters is 14,714,688 + 71,360,517 = 86,075,205 (86M).

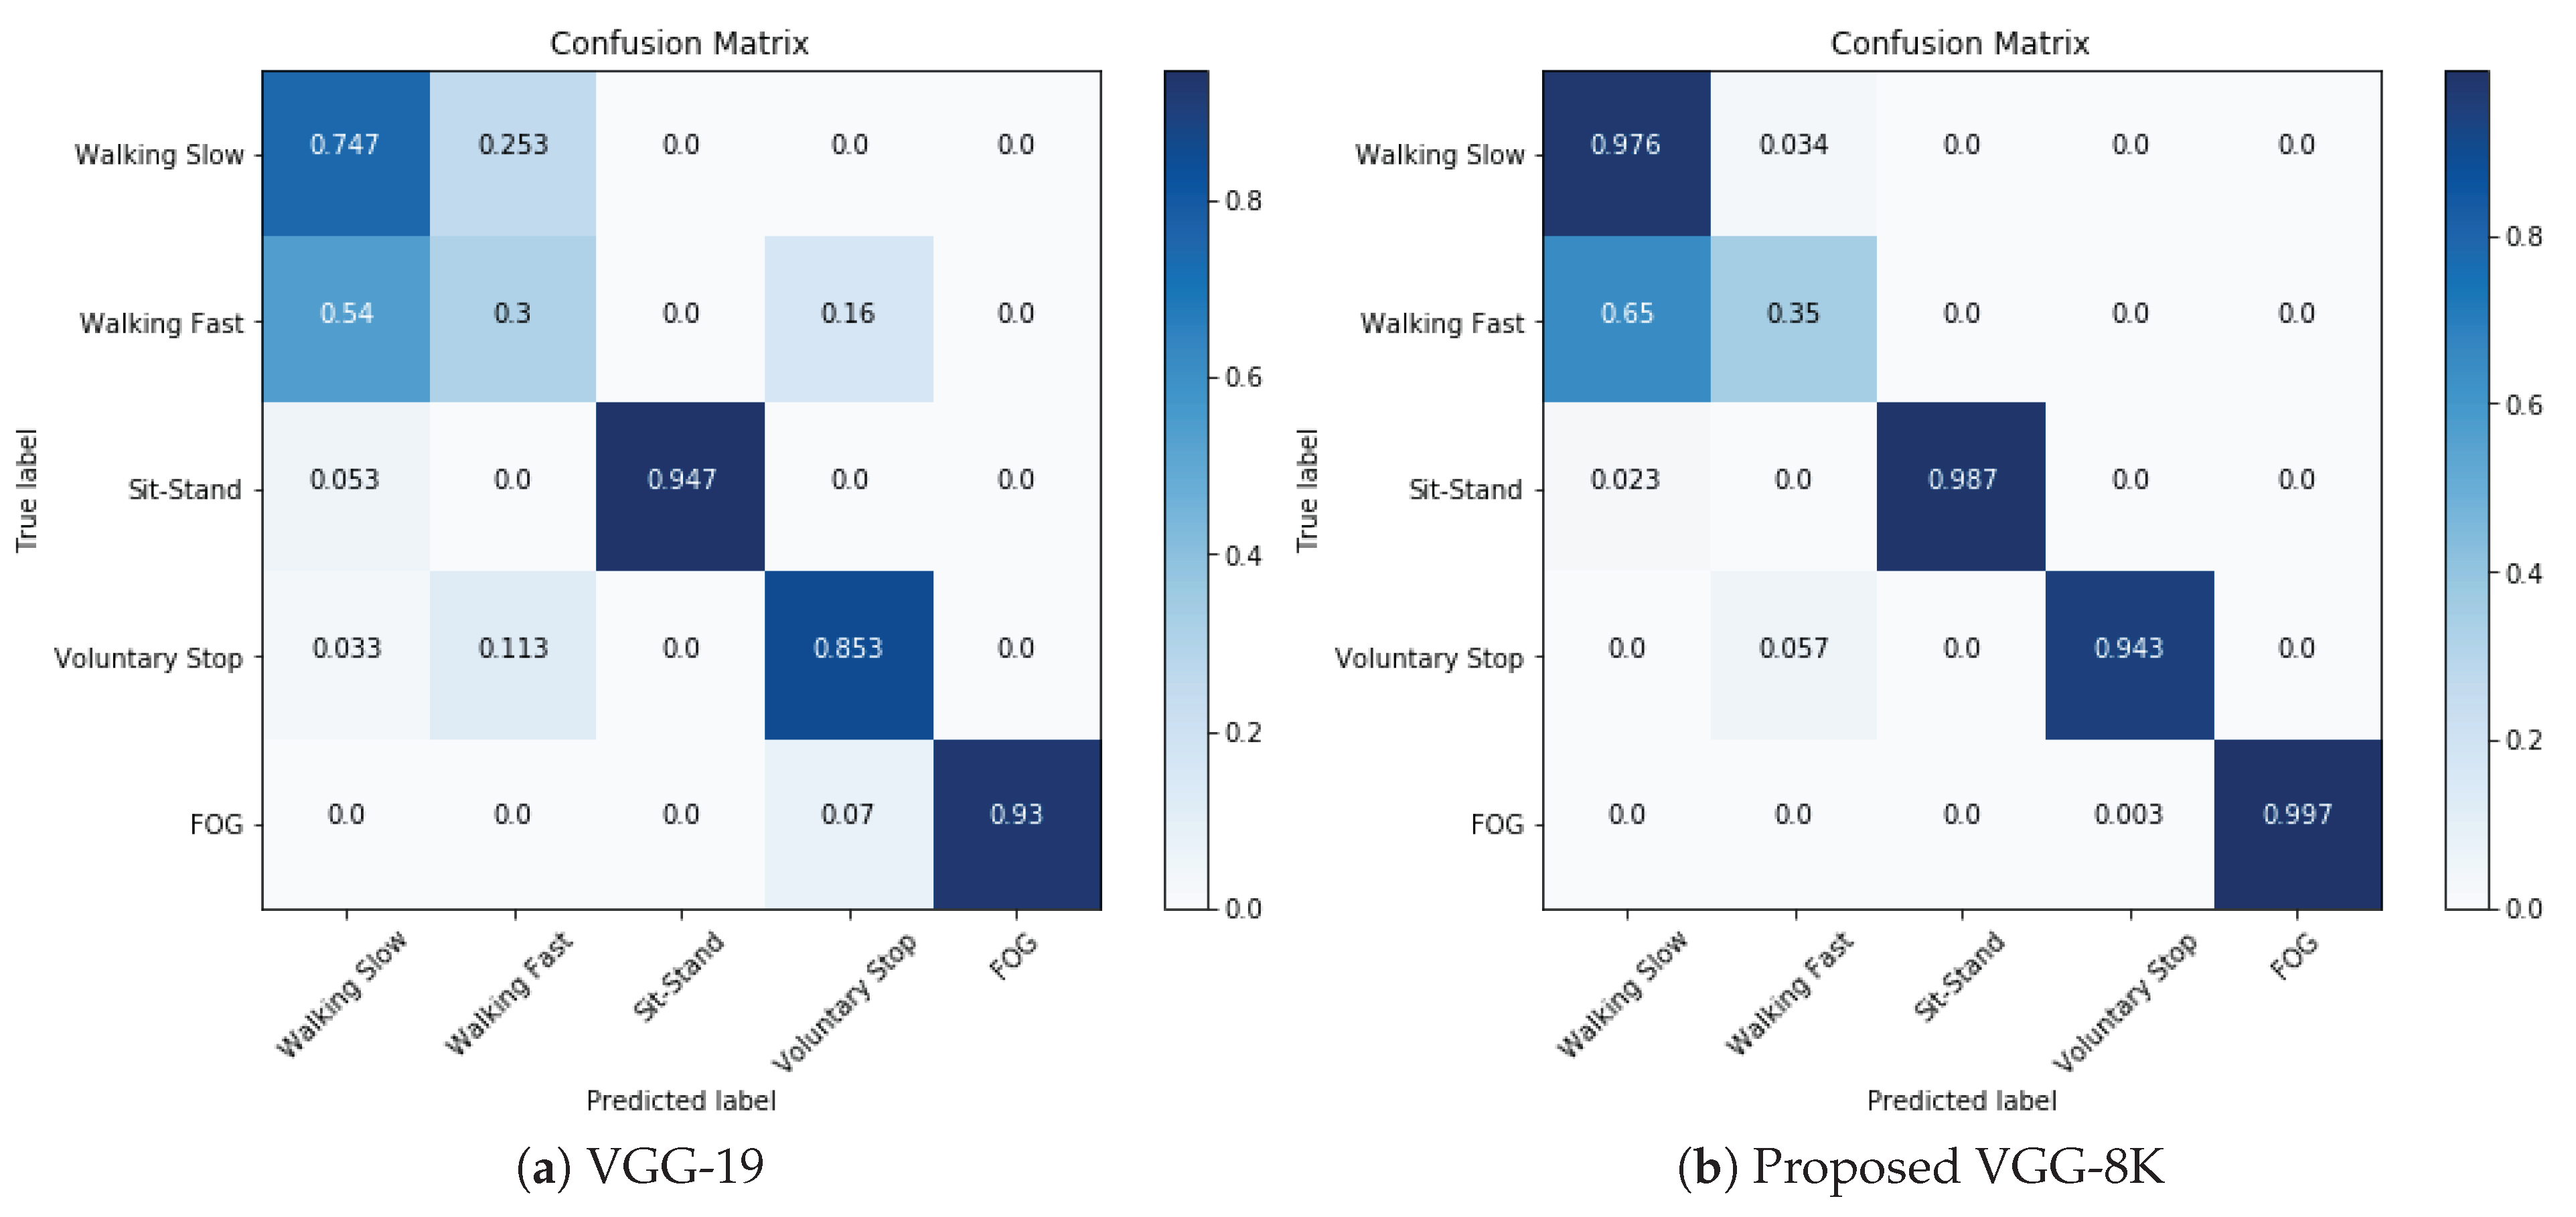
5. Results and Discussion

The proposed WiFreeze system demonstrates that CSI amplitude variations, and their multiresolution time frequency scalograms provide an effective sensing mechanism for differentiating between FOG and activities such as walking fast/slow, sit–stand, and voluntary stops. The proposed deep neural network, VGG-8K achieves high FOG detection accuracy, as well as high overall multi-class accuracy. The proposed VGG-8K is trained through transfer learning and results are illustrated and compared in Table 1 against existing pretrained deep CNNs VGG-16 [40], VGG-19 [40], ResNet-52 [41], and ResNet-101 [41], which are also trained with transfer learning on the proposed time-frequency scalograms. The proposed network has a high accuracy of FOG detection at 99.7% and overall multi-class accuracy of 85.06%.
The second-best performing deep network is the VGG-19 [40] with 93% FOG detection accuracy, followed by VGG-16 [40] with 91% accuracy, whereas overall multi-class accuracies are 75.3% and 70.8%, respectively. ResNet-50 [41] and ResNet-101 [41] gave lower accuracies of 67% and 54%, respectively, as illustrated in Table 1. The normalized confusion matrix of the proposed network is compared with VGG-19 [40], which has the second-best accuracy in Figure 10. The confusion matrix shows that FOG is misclassified as voluntary stop 0.3% of the time in VGG-8K and 0.7% of the time in VGG-19 [40]. This is because the two movements are quite similar, and, despite this, the proposed system performs very well in detecting FOG. Furthermore, the accuracies of Walking Slow, Sit–Stand, and Voluntary Stop are above 94%, whereas recognition of “walking fast” is poor at 35%, as it is misclassified as “walking slow” 65% of the time. This is because walking fast or slow are relative terms for subjects under test and fast walk of one subject that can easily be construed as slow walk of another subject by the classifier. However, the aim of this research is to detect FOG from ADLs and the system performs very well in differentiating against all tested activities including walking.
Furthermore, the asymptotic 95% confidence interval (CI) illustrates the statistical significance of the experimental results in Table 1. Given 15 patients, five activities are captured three times from each patient, resulting in 225 events. Each event is measured independently from 30 WiFi subcarriers with different subcarrier frequencies. The total size of the input example set for detection of freezing of gate is 225 × 30 = 6750, with 1350 FOG examples. Each classification decision for a class is a Bernoulli trial, as it can be true or false. Whereas the proportions of a Bernoulli trial follow a Bernoulli distribution; however, for sample sets larger than 30, the distribution can be approximated by a Gaussian. An asymptotic confidence interval (CI) is computed using the classification accuracy (or error), standard deviation, and number of samples for Gaussian approximation of the aforementioned examples in this work. The radius of the interval for classification accuracy is given in Equation (23):
i n t e r v a l = k × A c c u r a c y × ( 1 A c c u r a c y ) n
where interval represents the radius of CI, n = 1350 for 20% of the data set used, and k is the number of standard deviations. The asymptotic 95% CI shows statistical significance of the experimental results, where the interval has 95% probability of containing the actual classification result. The number of standard deviations k = 1.96 has been used from the Gaussian distribution, which corresponds to a CI value of 95%. The FOG accuracy of 99.7% is statistically significant, as the result lies in the interval 99.65% to 99.99% with 95% probability. Furthermore, the F1-score of 96.14% with a CI of 95.11% to 97.17% indicates a statistically significant higher performance.
The proposed WiFreeze system is compared against wearable device- and vision-based detection systems for detection of FOG in Table 2, and, although most systems perform only binary classification, the proposed system performs multi-classification, which is more complex than binary classification. In spite of the multi-classification scenario, Table 2 shows that the proposed WiFreeze system achieves highest classification results for FOG detection. WiFreeze outperforms all other wearable and vision-based systems, while it has the added advantages of lower cost, noninvasiveness, line of sight, and lighting agnostic WiFi sensing, although different systems used different numbers of patients ranging from 7 to 45. However, the detection system and classification method has a major impact on the sensitivity, specificity and accuracy values. In spite of the use of deep learning techniques, such as 3D CNN and Graph CNN, the sensitivity, specificity, and accuracy results of vision-based systems are limited to ~80%, with maximum accuracy value of 82.10%. Table 2 shows that systems based on wearable devices, such as IMU perform better than vision-based systems in most of the cases, in terms of both sensitivity and accuracy. The smartphone-based sensors with both classical machine learning and deep learning techniques provide the second highest sensitivity, specificity, and accuracy values. Although, both the second- and third-best performing systems in terms of accuracy are Capecci et al. [12] and Kim et al. [11], which are smartphone-based systems and are highlighted in bold in Table 2 with an accuracy of 93.8% and 92.86%, respectively. It is clear from the table that the proposed system and technique have the highest accuracy and sensitivity (recall) of 99.70% and 97.08%, respectively, compared to other detection systems and classification techniques used for FOG detection. Furthermore, an F1-Score of 96.14% is achieved, which currently outperforms the competitive methods.

6. Conclusions

FOG is a debilitating illness in PD patients and represents the onset of disability. FOG also increases the risk of falls. Automating the process of FOG detection is in high demand due to its impact on health and well-being of individuals. Although current systems for FOG detection utilize wearable sensors and vision-based systems, wearable sensors need to be carried for continuous monitoring, whereas camera-based systems are intrusive and require line of sight. In this work, we proposed a noninvasive WiFi-based sensing system for detection of FOG for PD patients. The system utilizes CSI amplitudes for discriminating FOG symptoms from walking, sitting–standing, and voluntary stopping activities. Multiresolution time frequency scalograms are proposed for feature extraction due to their ability to detect transitions and transient human movements. A very deep multi-class CNN, VGG-8K, is proposed for deep transfer learning of scalograms for detection of FOG, which performs better than the existing state-of-the-art deep neural networks in overall multi-class accuracy as well as FOG detection. The system utilizes single subcarrier information for detecting FOG episodes and has the highest performance accuracy of 99.7%, compared to existing systems with wearable and vision-based systems. The systems also provide improvements of 9% and 23% in detection of walking slow and voluntary stop activities with the proposed very deep CNN architecture compared to existing state-of-the-art deep CNN architectures on WiFi sensing data, although a higher number of patients and events could lead to a smaller range for CI (inversely proportional to input samples), due to an increase in the number of cases and, subsequently, input samples for the classifier. However, this will not result in any significant changes to the metrics, as the presented results have smaller intervals for 95% CI values with FOG accuracy of 99.7% between 99.65% to 99.99% and F1-score of 96.14% between 95.11% to 97.17%. The higher performance of the proposed scheme remains statistically significant, with an overall maximum CI value of ±1.24 for the reported improvements. In future, the proposed system will be extended for generalized locations, where the system setup trained on one location can be tested and used for other locations.

Author Contributions

Conceptualization, A.T.; methodology, A.T. and S.A.S.; software, A.T.; validation, A.T.; formal analysis, A.T.; investigation, A.T. and J.A.; resources, J.A. and S.A.S.; writing–original draft preparation, A.T.; writing–review and editing, A.T.; visualization, A.T.; supervision, R.M.G., G.M., D.A.S.; project administration, Q.H.A., H.L. and M.A.I.

Conflicts of Interest

The authors declare no conflict of interest.

References

  1. Parkinson’s UK. The Incidence and Prevalence of Parkinson’s in the UK: Results from the Clinical Practice Research Datalink Summary Report. Available online: https://www.parkinsons.org.uk/sites/default/files/2018-01/CS2960%20Incidence%20and%20prevalence%20report%20branding%20summary%20report.pdf (accessed on 5 August 2019).
  2. Prateek, G.V.; Skog, I.; McNeely, M.E.; Duncan, R.P.; Earhart, G.M.; Nehorai, A. Modeling, Detecting, and Tracking Freezing of Gait in Parkinson Disease Using Inertial Sensors. IEEE Trans. Biomed. Eng. 2018, 65, 2152–2161. [Google Scholar] [CrossRef] [PubMed]
  3. Li, G.; Ma, J.; Cui, S.; He, Y.; Xiao, Q.; Liu, J.; Chen, S. Parkinson’s disease in China: A forty-year growing track of bedside work. Transl. Neurodegener. 2019, 8, 22. [Google Scholar] [CrossRef] [PubMed]
  4. Braak, H.; Ghebremedhin, E.; Rüb, U.; Bratzke, H.; Del Tredici, K. Stages in the development of Parkinson’s disease-related pathology. Cell Tissue Res. 2004, 318, 121–134. [Google Scholar] [CrossRef]
  5. Shulman, L.M.; Gruber-Baldini, A.L.; Anderson, K.E.; Vaughan, C.G.; Reich, S.G.; Fishman, P.S.; Weiner, W.J. The evolution of disability in Parkinson disease. Mov. Disord. 2008, 23, 790–796. [Google Scholar] [CrossRef] [PubMed]
  6. Giladi, N.; Nieuwboer, A. Understanding and treating freezing of gait in parkinsonism, proposed working definition, and setting the stage. Mov. Disord. Off. J. Mov. Disord. Soc. 2008, 23, S423–S425. [Google Scholar] [CrossRef] [PubMed]
  7. Bloem, B.R.; Hausdorff, J.M.; Visser, J.E.; Giladi, N. Falls and freezing of gait in Parkinson’s disease: A review of two interconnected, episodic phenomena. Mov. Disord. Off. J. Mov. Disord. Soc. 2004, 19, 871–884. [Google Scholar] [CrossRef] [PubMed]
  8. Nieuwboer, A.; Rochester, L.; Herman, T.; Vandenberghe, W.; Emil, G.E.; Thomaes, T.; Giladi, N. Reliability of the new freezing of gait questionnaire: Agreement between patients with Parkinson’s disease and their carers. Gait Posture 2009, 30, 459–463. [Google Scholar] [CrossRef]
  9. Camps, J.; Samà, A.; Martín, M.; Rodríguez-Martín, D.; Pérez-López, C.; Moreno Arostegui, J.M.; Cabestany, J.; Català, A.; Alcaine, S.; Mestre, B.; et al. Deep learning for freezing of gait detection in Parkinson’s disease patients in their homes using a waist-worn inertial measurement unit. Knowl.-Based Syst. 2018, 139, 119–131. [Google Scholar] [CrossRef]
  10. Samà, A.; Rodríguez-Martín, D.; Pérez-López, C.; Català, A.; Alcaine, S.; Mestre, B.; Prats, A.; Crespo, M.C.; Bayés, À. Determining the optimal features in freezing of gait detection through a single waist accelerometer in home environments. Pattern Recognit. Lett. 2018, 105, 135–143. [Google Scholar] [CrossRef]
  11. Kim, H.B.; Lee, H.J.; Lee, W.W.; Kim, S.K.; Jeon, H.S.; Park, H.Y.; Shin, C.W.; Yi, W.J.; Jeon, B.; Park, K.S. Validation of Freezing-of-Gait Monitoring Using Smartphone. Telemed. e-Health 2018, 24, 899–907. [Google Scholar] [CrossRef]
  12. Capecci, M.; Pepa, L.; Verdini, F.; Ceravolo, M.G. A smartphone-based architecture to detect and quantify freezing of gait in Parkinson’s disease. Gait Posture 2016, 50, 28–33. [Google Scholar] [CrossRef] [PubMed]
  13. Pepa, L.; Ciabattoni, L.; Verdini, F.; Capecci, M.; Ceravolo, M.G. Smartphone based Fuzzy Logic freezing of gait detection in Parkinson’s Disease. In Proceedings of the MESA 2014—10th IEEE/ASME International Conference on Mechatronic and Embedded Systems and Applications, Senigallia, Italy, 10–12 September 2014. [Google Scholar] [CrossRef]
  14. Mitoma, H.; Hayashi, R.; Yanagisawa, N.; Tsukagoshi, H. Characteristics of parkinsonian and ataxic gaits: A study using surface electromyograms, angular displacements and floor reaction forces. J. Neurol. Sci. 2000, 174, 22–39. [Google Scholar] [CrossRef]
  15. Nieuwboer, A.; Dom, R.; De Weerdt, W.; Desloovere, K.; Janssens, L.; Stijn, V. Electromyographic profiles of gait prior to onset of freezing episodes in patients with Parkinson’s disease. Brain 2004, 127, 1650–1660. [Google Scholar] [CrossRef] [PubMed]
  16. Plotnik, M.; Giladi, N.; Balash, Y.; Peretz, C.; Hausdorff, J.M. Is freezing of gait in Parkinson’s disease related to asymmetric motor function? Ann. Neurol. Off. J. Am. Neurol. Assoc. Child Neurol. Soc. 2005, 57, 656–663. [Google Scholar] [CrossRef]
  17. Hausdorff, J.; Schaafsma, J.; Balash, Y.; Bartels, A.; Gurevich, T.; Giladi, N. Impaired regulation of stride variability in Parkinson’s disease subjects with freezing of gait. Exp. Brain Res. 2003, 149, 187–194. [Google Scholar] [CrossRef]
  18. Amini, A.; Banitsas, K.; Hosseinzadeh, S. A new technique for foot-off and foot contact detection in a gait cycle based on the knee joint angle using microsoft kinect v2. In Proceedings of the 2017 IEEE EMBS International Conference on Biomedical & Health Informatics (BHI), Orlando, FL, USA, 16–19 February 2017; pp. 153–156. [Google Scholar]
  19. Bigy, A.A.M.; Banitsas, K.; Badii, A.; Cosmas, J. Recognition of postures and Freezing of Gait in Parkinson’s disease patients using Microsoft Kinect sensor. In Proceedings of the 2015 7th International IEEE/EMBS Conference on Neural Engineering (NER), Montpellier, France, 22–24 April 2015; pp. 731–734. [Google Scholar]
  20. Qian, K.; Wu, C.; Yang, Z.; Liu, Y.; He, F.; Xing, T. Enabling contactless detection of moving humans with dynamic speeds using CSI. ACM Trans. Embed. Comput. Syst. (TECS) 2018, 17, 52. [Google Scholar] [CrossRef]
  21. Soltanaghaei, E.; Kalyanaraman, A.; Whitehouse, K. Peripheral wifi vision: Exploiting multipath reflections for more sensitive human sensing. In Proceedings of the 4th International on Workshop on Physical Analytics, Niagara Falls, NY, USA, 19 June 2017; pp. 13–18. [Google Scholar]
  22. Zhou, R.; Lu, X.; Zhao, P.; Chen, J. Device-free presence detection and localization with SVM and CSI fingerprinting. IEEE Sens. J. 2017, 17, 7990–7999. [Google Scholar] [CrossRef]
  23. Zhang, F.; Niu, K.; Xiong, J.; Jin, B.; Gu, T.; Jiang, Y.; Zhang, D. Towards a Diffraction-based Sensing Approach on Human Activity Recognition. Proc. ACM Interact. Mob. Wearable Ubiquitous Technol. 2019, 3, 33. [Google Scholar] [CrossRef]
  24. Wang, W.; Liu, A.X.; Shahzad, M.; Ling, K.; Lu, S. Understanding and modeling of wifi signal based human activity recognition. In Proceedings of the 21st Annual International Conference on Mobile Computing and Networking, Paris, France, 7–11 September 2015; pp. 65–76. [Google Scholar]
  25. Wang, Y.; Liu, J.; Chen, Y.; Gruteser, M.; Yang, J.; Liu, H. E-eyes: Device-free location-oriented activity identification using fine-grained wifi signatures. In Proceedings of the 20th Annual International Conference on Mobile Computing and Networking, Maui, HI, USA, 7–11 September 2014; pp. 617–628. [Google Scholar]
  26. Gu, Y.; Zhang, Y.; Huang, M.; Ren, F. Your WiFi Knows You Fall: A Channel Data-driven Device-free Fall Sensing System. In Proceedings of the 2018 5th IEEE International Conference on Cloud Computing and Intelligence Systems (CCIS), Nanjing, China, 23–25 November 2018; pp. 943–947. [Google Scholar]
  27. Tian, Y.; Lee, G.H.; He, H.; Hsu, C.Y.; Katabi, D. RF-based fall monitoring using convolutional neural networks. Proc. ACM Interac. Mob. Wearable Ubiquitous Technol. 2018, 2, 137. [Google Scholar] [CrossRef]
  28. Wang, Y.; Wu, K.; Ni, L.M. Wifall: Device-free fall detection by wireless networks. IEEE Trans. Mob. Comput. 2016, 16, 581–594. [Google Scholar] [CrossRef]
  29. Wang, H.; Zhang, D.; Wang, Y.; Ma, J.; Wang, Y.; Li, S. RT-Fall: A real-time and contactless fall detection system with commodity WiFi devices. IEEE Trans. Mob. Comput. 2016, 16, 511–526. [Google Scholar] [CrossRef]
  30. Venkatnarayan, R.H.; Page, G.; Shahzad, M. Multi-user gesture recognition using WiFi. In Proceedings of the 16th Annual International Conference on Mobile Systems, Applications, and Services, Munich, Germany, 10–15 June 2018; pp. 401–413. [Google Scholar]
  31. Zheng, Y.; Zhang, Y.; Qian, K.; Zhang, G.; Liu, Y.; Wu, C.; Yang, Z. Zero-Effort Cross-Domain Gesture Recognition with Wi-Fi. In Proceedings of the 17th Annual International Conference on Mobile Systems, Applications, and Services, Seoul, Korea, 17–21 June 2019; pp. 313–325. [Google Scholar]
  32. Islam, M.T.; Nirjon, S. Wi-Fringe: Leveraging Text Semantics in WiFi CSI-Based Device-Free Named Gesture Recognition. arXiv 2019, arXiv:1908.06803. [Google Scholar]
  33. Nkabiti, K.P.; Chen, Y.; Sultan, K.; Armand, B. A Deep Bidirectional LSTM Recurrent Neural Networks for Identifying Humans Indoors Using Channel State Information. In Proceedings of the 2019 28th Wireless and Optical Communications Conference (WOCC), Beijing, China, 9–10 May 2019; pp. 1–5. [Google Scholar]
  34. Chen, Y.; Dong, W.; Gao, Y.; Liu, X.; Gu, T. Rapid: A multimodal and device-free approach using noise estimation for robust person identification. Proc. ACM Interact. Mob. Wearable Ubiquitous Technol. 2017, 1, 41. [Google Scholar] [CrossRef]
  35. Cheng, L.; Wang, J. How can I guard my AP?: Non-intrusive user identification for mobile devices using WiFi signals. In Proceedings of the 17th ACM International Symposium on Mobile Ad Hoc Networking and Computing, Paderborn, Germany, 5–8 July 2016; pp. 91–100. [Google Scholar]
  36. Ministry of Industry and Information Technology of the People’s Republic of China. Ministry of Industry and Information Technology on the Fifth Generation International Mobile Telecommunications System (IMT-2020) Using 3300–3600 MHz and 4800–5000 MHz Band Related Matters Notice; Ministry of Industry and Information Technology of the People’s Republic of China: Beijing, China, 6 June 2017.
  37. Abadi, M.; Barham, P.; Chen, J.; Chen, Z.; Davis, A.; Dean, J.; Devin, M.; Ghemawat, S.; Irving, G.; Isard, M.; et al. Tensorflow: A system for large-scale machine learning. In Proceedings of the 12th {USENIX} Symposium on Operating Systems Design and Implementation ({OSDI} 16), Savannah, GA, USA, 2–4 November 2016; pp. 265–283. [Google Scholar]
  38. Chollet, F.; others. Keras: The python deep learning library. Astrophysics Source Code Library. 2018. Available online: https://ascl.net/1806.022 (accessed on 5 August 2019).
  39. Carneiro, T.; Da Nóbrega, R.V.M.; Nepomuceno, T.; Bian, G.B.; De Albuquerque, V.H.C.; Reboucas Filho, P.P. Performance Analysis of Google Colaboratory as a Tool for Accelerating Deep Learning Applications. IEEE Access 2018, 6, 61677–61685. [Google Scholar] [CrossRef]
  40. Simonyan, K.; Zisserman, A. Very deep convolutional networks for large-scale image recognition. arXiv 2014, arXiv:1409.1556. [Google Scholar]
  41. He, K.; Zhang, X.; Ren, S.; Sun, J. Deep residual learning for image recognition. In Proceedings of the IEEE Conference on Computer Vision and Pattern Recognition, Las Vegas, NV, USA, 26 June–1 July 2016; pp. 770–778. [Google Scholar]
  42. Rao, R. Wavelet transforms. In Encyclopedia of Imaging Science and Technology; John Wiley & Sons: Hoboken, NJ, USA, 2002. [Google Scholar] [CrossRef]
  43. Lilly, J.M.; Olhede, S.C. Generalized Morse wavelets as a superfamily of analytic wavelets. IEEE Trans. Signal Process. 2012, 60, 6036–6041. [Google Scholar] [CrossRef]
  44. Deng, J.; Dong, W.; Socher, R.; Li, L.J.; Li, K.; Fei-Fei, L. Imagenet: A large-scale hierarchical image database. In Proceedings of the 2009 IEEE Conference on Computer Vision and Pattern Recognition, Miami, FL, USA, 20–25 June 2009; pp. 248–255. [Google Scholar]
  45. Zhang, W.; Du, T.; Wang, J. Deep learning over multi-field categorical data. In European Conference on Information Retrieval; Springer: Cham, Switzerland, 2016; pp. 45–57. [Google Scholar]
  46. Camps, J.; Samà, A.; Martín, M.; Rodríguez-Martín, D.; Pérez-López, C.; Alcaine, S.; Mestre, B.; Prats, A.; Crespo, M.C.; Cabestany, J.; et al. Deep learning for detecting freezing of gait episodes in Parkinson’s disease based on accelerometers. In International Work-Conference on Artificial Neural Networks; Springer: Cham, Switzerland, 2017; pp. 344–355. [Google Scholar]
  47. Rodríguez-Martín, D.; Samà, A.; Pérez-López, C.; Català, A.; Moreno Arostegui, J.M.; Cabestany, J.; Bayés, À.; Alcaine, S.; Mestre, B.; Prats, A.; et al. Home detection of freezing of gait using support vector machines through a single waist-worn triaxial accelerometer. PLoS ONE 2017, 12, e0171764. [Google Scholar] [CrossRef]
  48. Masiala, S.; Huijbers, W.; Atzmueller, M. Feature-Set-Engineering for Detecting Freezing of Gait in Parkinson’s Disease using Deep Recurrent Neural Networks. arXiv 2019, arXiv:1909.03428. [Google Scholar]
  49. Amini, A.; Banitsas, K.; Young, W.R. Kinect4FOG: Monitoring and improving mobility in people with Parkinson’s using a novel system incorporating the Microsoft Kinect v2. Disabil. Rehabil. Assist. Technol. 2019, 14, 566–573. [Google Scholar] [CrossRef]
  50. Sun, R.; Wang, Z.; Martens, K.E.; Lewis, S. Convolutional 3D Attention Network for Video Based Freezing of Gait Recognition. In Proceedings of the 2018 Digital Image Computing: Techniques and Applications (DICTA), Canberra, Australia, 10–13 December 2018; pp. 1–7. [Google Scholar]
  51. Hu, K.; Wang, Z.; Mei, S.; Ehgoetz, K.; Yao, T.; Lewis, S.; Feng, D. Vision-based freezing of gait detection with anatomic directed graph representation. IEEE J. Biomed. Health Inform. 2019. [Google Scholar] [CrossRef]
  52. Hu, K.; Wang, Z.; Wang, W.; Martens, K.A.E.; Wang, L.; Tan, T.; Lewis, S.J.; Feng, D.D. Graph Sequence Recurrent Neural Network for Vision-based Freezing of Gait Detection. IEEE Trans. Image Process. 2019. [Google Scholar] [CrossRef] [PubMed]
  53. Kim, H.; Lee, H.J.; Lee, W.; Kwon, S.; Kim, S.K.; Jeon, H.S.; Park, H.; Shin, C.W.; Yi, W.J.; Jeon, B.S.; et al. Unconstrained detection of freezing of Gait in Parkinson’s disease patients using smartphone. In Proceedings of the 2015 37th Annual International Conference of the IEEE Engineering in Medicine and Biology Society (EMBC), Milan, Italy, 25–29 August 2015; pp. 3751–3754. [Google Scholar] [CrossRef]
Figure 1. Freezing of Gait (FOG) detection using channel state information (CSI) amplitudes of WiFi signals.
Electronics 08 01433 g001
Figure 2. FOG detection experimental set-up.
Electronics 08 01433 g002
Figure 3. Proposed WiFreeze system for detection of FOG.
Electronics 08 01433 g003
Figure 4. Amplitude variations of a random subcarrier.
Electronics 08 01433 g004
Figure 5. Perturbations of amplitude information for 30 subcarriers.
Electronics 08 01433 g005
Figure 6. Box plots of CSI measurements for FOG and activities.
Electronics 08 01433 g006
Figure 7. Multiresolution time-frequency scalograms of activities for subcarriers 1, 2, 29, and 30.
Electronics 08 01433 g007
Figure 8. Proposed VGG-8K structure.
Electronics 08 01433 g008
Figure 9. Proposed VGG-8K layers.
Electronics 08 01433 g009
Figure 10. Normalized confusion matrix.
Electronics 08 01433 g010
Table 1. Accuracy of proposed VGG-8K with 95% confidence interval.
Deep NeuralWalking SlowWalking FastSit-StandVoluntary StopFOGMulti-Class
NetworksAccuracy [CI] (%)Accuracy [CI] (%)Accuracy [CI] (%)Accuracy [CI] (%)Accuracy [CI] (%)Accuracy [CI] (%)
ResNet5045.00 [42.35–47.64]25.00 [22.62–27.31]15.00 [13.00–16.90]45.00 [42.33–47.65]67.00 [64.54–69.51]39.40 [36.77–42.00]
ResNet10160.00 [57.42–62.61]27.00 [24.57–29.37]30.00 [27.50–32.44]27.00 [24.57–29.37]54.00 [51.36–56.66]39.60 [36.97–42.21]
VGG1660.00 [57.42–62.61]35.00 [32.42–37.54]81.00 [79.00–83.09]87.00 [85.31–88.79]91.00 [89.60–92.53]70.80 [68.43–73.23]
VGG1974.67 [72.42–76.99]30.00 [27.50–32.44]94.67 [93.60–95.87]85.33 [83.55–87.22]93.00 [91.77–94.36]75.53 [73.31–77.82]
Proposed VGG-8K97.60 [96.69–98.42]35.00 [32.42–37.54]98.70 [98.26–99.30]94.30 [93.20–95.54]99.70 [99.65–99.99]85.06 [83.26–86.96]
Table 2. Comparison of FOG detection systems.
AuthorsDetection SystemSensorsPatientsAlgorithmSensitivitySpecificityAccuracy
Prateek et al. [2]Wearable devicesIMU16Likelihood ratio86.00%-81.03%
Camps et al. [46]Wearable devicesAccelerometer15CNN88.60%78.00%83.33%
Sama et al. [10]Wearable devicesAccelerometer15Support vector machine91.81%87.45%89.60%
Rodriguez et al. [47]Wearable devicesAccelerometer21Support vector machine88.10%80.10%84.00%
Camps et al. [9]Wearable devicesIMU21CNN92.60%88.70%89.00%
Masiala et al. [48]Wearable devicesAccelerometer10Deep RNN85.00%89.00%-
Aminis et al. [49]Vision basedCamera, depth15Position offset tracking--88.60%
Bigy et al. [19]Vision basedCamera, depth7Body joint positions--92.00%
Sun et al. [50]Vision basedCamera453D CNN68.20%80.80%79.30%
Hu et al. [51]Vision basedCamera45Graph CNN81.90%82.10%82.10%
Hu et al. [52]Vision basedCamera45Deep RNN83.80%82.30%82.50%
Kim et al. [53]Smart phoneAccelerometer, gyro15AdaBoost.M187.00%89.20%86.00%
Kim et al. [11]Smart phoneAccelerometer, gyro32CNN93.80%90.10%92.00%
Capecci et al. [12]Smart phoneAccelerometer20Spectrum, cadence87.57%94.97%92.86%
Pepa et al. [13]Smart phoneAccelerometer18Fuzzy inference system89.00%97.00%93.00%
Proposed WiFreezeWiFi 5G Spect.Wireless sensing15Multi-Class Deep CNN97.08%100.00%99.70%

