Article

Rotation Angle Estimation of JPEG Compressed Image by Cyclic Spectrum Analysis

1
School of Electronic and Electrical Engineering, Shanghai University of Engineering Science, Shanghai 201620, China
2
Shanghai Key Laboratory of Integrated Administration Technologies for Information Security, Shanghai Jiao Tong University, Shanghai 200240, China
*
Author to whom correspondence should be addressed.
Electronics 2019, 8(12), 1431; https://doi.org/10.3390/electronics8121431
Submission received: 4 November 2019 / Revised: 23 November 2019 / Accepted: 26 November 2019 / Published: 30 November 2019
(This article belongs to the Section Artificial Intelligence)

Abstract

:
Image rotation is a common auxiliary method of image tampering, which can make the forged image more realistic from the geometric perspective. Most algorithms of image rotation angle estimation employ the peak value on the Fourier spectrum; however, JPEG post-processing brings additional peak interferences to the spectrum, which has a great impact on algorithm performance. In this paper, angle estimation is carried out for images compressed by JPEG. Firstly, the Fourier cyclic spectrum of image covariance is calculated, followed by semi-soft threshold wavelet transform to eliminate the block artefacts brought by JPEG compression. According to the shortest distance principle in the range of the limited amplitude, the processed cyclic spectral data are sorted to select the peak points. Finally, according to the selected peak point, the corresponding position coordinates of the theoretical peak point are found, and the rotation angle of the image is estimated by the theoretical peak point. Experimental results demonstrate that the average absolute error of the proposed algorithm is significantly lower than that of the state-of-the-art methods investigated, which highlights the promising potential of the proposed method as an image resampling detector in practical forensics applications.

1. Introduction

Images are one of the important ways for people to obtain information. However, every coin has two sides; with the popularization of various image editing tools, people can recreate images in their own way, but the authenticity of the image cannot be guaranteed, and fake images affect people’s life in different aspects. Therefore, in order to identify the authenticity of images, image forensics technology has come into being, and blind image forensics is widely applied because it does not need prior information [1,2,3]. In the process of image stitching and tampering, the forged area is usually resampled by rotation, scaling, and other processes to make it more realistic from a geometric perspective [3]. Therefore, the detection of resampled images has great significance in the field of image forensics.
At present, the detection algorithm of image resampling is mainly based on the periodicity relation introduced by resampling. Popescu and Farid et al. [4] first proposed the resampling detection algorithm based on the expectation maximization (EM) algorithm. After the image is resampled, the Fourier amplitude spectrum exhibits periodic peaks. However, the iterative characteristics of the method are sensitive to the initial values. On the basis of the above algorithm, Kirchner et al. [5] adopted fast and stable factors to improve the EM algorithm, so as to improve the efficiency of the EM algorithm. In general, the EM algorithm can only judge whether the image was resampled or not, but it cannot estimate the resampling factor quantitatively. Furthermore, depending on the periodicity of the interpolation signal and its derivative, Mahdian et al. [6] introduced Radon transform to analyze the change in covariance statistics and detect the rotation angle of an image. The Radon transform algorithm can only judge the rotation operation of the image qualitatively, but it cannot estimate the concrete rotation angle. In order to solve the problem of the above algorithm not being able to estimate the resampling factor, Gallagher et al. [7] estimated the scaling factors of images based on the fact that interpolation signals (linear and cubic interpolation) would introduce periodicity to the second derivative on variance. However, the defect of this algorithm lies in the inaccurate estimation of the image scaling factor and the inability to detect down-sampling operations. To avoid this problem, Wei et al. [8] improved Gallagher’s algorithm, derived a detection formula for image down-sampling, and proposed a method to estimate rotation angle. However, the method was only limited to the detection of single resampling, and no rigorous theoretical proof was given for the formula of peak position. Vazquez-Padin et al. [9] applied a second-order cyclostationary method to detect the periodicity caused by resampling. Chen et al. [3,10] improved the theoretical derivation and experimental results of Vazquez-Padin et al. [9], and the further derivation of double resampling was presented. However, it resulted in larger errors when the rotation angle was small. Reference [11] exposed the resampling traces by increasing the gap between image and noise from the perspective of spatial decomposition and a random matrix. Based on the hypothesis testing model, Le et al. [12] distinguished original TIFF images from resampled TIFF images using a statistical detector. Liu et al. [13] reduced block artefacts of JPEG compressed images using the difference of the third derivative, and then estimated the magnification factor of the images. Furthermore, Liu et al. [14] used the maximum likelihood estimation to detect and estimate the reduction factors of JPEG pre-compressed images. However, the existing methods are not excellent at estimating the image rotation angle after JPEG compression.
Based on the existing algorithms, this paper further studies image rotation angle estimation with JPEG compression. In this paper, in order to reduce the peak interference caused by JPEG compression, the amplitude data around the theoretical trajectory in the cyclic spectrum are processed by wavelet transform with a semi-soft threshold. In terms of the selection method, unlike the algorithms which select the maximum amplitude, this paper considers the amplitude and distance conditions comprehensively, selects the appropriate peak point, and calculates the corresponding theoretical point to estimate the rotation angle of an image.
The rest of the article is arranged as follows: in Section 2, the principle of the image cyclic spectrum and its rotation theory trajectory are briefly introduced. In Section 3, this paper introduces the proposed method including the semi-soft threshold wavelet, super sort, and the amplitude–distance selection method. In Section 4, the experimental results of the resampling detection under different angles are considered, and an experimental comparison using different quality factors is also given. Finally, in Section 5, conclusions are drawn, and future work directions are pointed out.

2. Image Cyclic Spectrum and Its Rotation Theory Trajectory

The process of image rotation is often accompanied by an interpolation operation, which makes the cyclic spectral amplitude of covariance (second-order statistic) show a certain periodicity [3,9,10]. Assuming the original image is f (x1, x2), the rotated image is as follows:
I ( x 1 , x 2 ) = i = j = f ( i , j ) h ( x 1 M 1 i L 1 , x 2 M 2 j L 2 ) ,  
where ( L 1 / M 1 , L 2 / M 2 ) is the rotation factor of the image, h ( x 1 , x 2 ) represents the interpolation kernel function, and common kernel functions include linear, cubic, sinc, etc. [10]. Let x ( m ) = x ( m 1 , m 2 ) denote the actual random field, and let its mean value be μ x ( m ) E { x ( m ) } ; then, the formula of covariance is
c x x ( m ; τ ) E { [ x ( m ) μ x ( m + τ ) } ,
where τ ( τ 1 , τ 2 ) is the period T ( T 1 , T 2 ) .
According to Equation (2), the Fourier series of covariance is as follows:
c x x ( m ; τ ) = α A x x C x x ( α ; τ ) e j ( α 1 m 1 + α 2 m 2 ) ,
C x x ( α ; τ ) = lim M 1 , M 2 1 M 1 M 2 m 1 = 0 M 1 1 m 2 = 0 M 2 1 c x x ( m ; τ ) × e j ( α 1 m 1 + α 2 m 2 ) ,
where α = ( α 1 , α 2 ) , the cyclic frequency set is A x x { α : C x x ( α , τ ) 0 , π < α 1 , α 2 π } , and C x x ( α ; τ ) is also called cyclic covariance, which represents each frequency pair in the loop. Therefore, the Fourier cyclic spectrum of covariance can be defined as
S x x ( α , w ) τ 1 = τ 2 = C x x ( α ; τ ) e j ( w 1 τ 1 + w 2 τ 2 ) ,
where w = ( w 1 , w 2 ) is each frequency pair in the frequency domain. The obtained cyclic spectrum S x x ( α , w ) is further transformed to baseband spectrum F ˜ A ( m ) in the range of [0, 1]2. Therefore, the peak value caused by image rotation appears in the normalized frequency F ˜ A ( m ) [3].
F ˜ A ( m ) = frac { ( A T ) 1 m } .
According to Equation (6), when | | m | | 1 = 1 (1 norm of m), then we can get the trajectories of the four peaks as follows [10]:
F x 2 + F y 2 = 1 , ( 1 F x ) 2 + ( 1 F y ) 2 = 1 , ( 1 F x ) 2 + F y 2 = 1 , F x 2 + ( 1 F y ) 2 = 1 ,
where Fx and Fy represent the coordinates of the peak point. Thus, we can judge whether the image was rotated according to whether there is a peak value in the trajectory, and we can further estimate the rotation angle of the image according to the location of the peak.

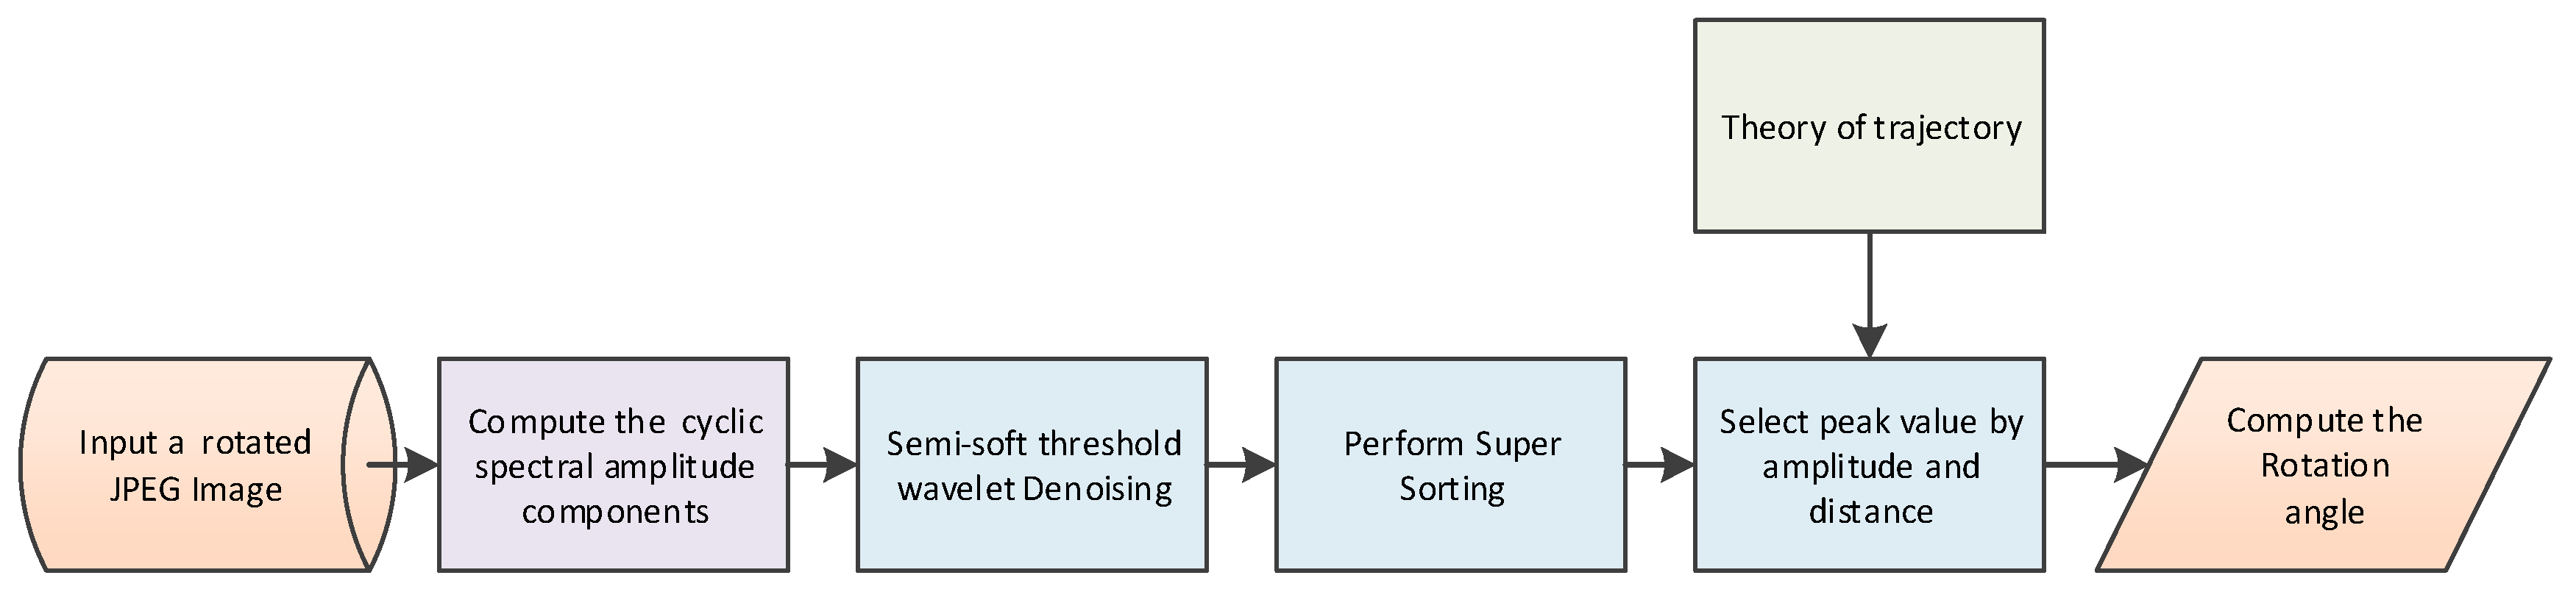
3. The Proposed Method

Effective post-processing of peaks can reduce the influence of the interference peak introduced by JPEG compression, so that the estimated rotation angle is more accurate. Moreover, a reasonable selection method can further reduce the average error and lead to high accuracy of the tampering region location. The specific steps of the image rotation angle estimation algorithm under JPEG post-processing are listed below, and its flow chart is shown in Figure 1.
(1)
Calculate the second-order statistics (covariance) of the image (the rotated image processed by JPEG compression) and its cyclic spectral amplitude components.
(2)
Employ semi-soft threshold wavelet transform to denoise the four neighborhood amplitude components of the theoretical trajectory in the cyclic spectrum.
(3)
Perform a super sorting operation on the amplitude data.
(4)
Select the peak point according to the principle of amplitude–distance.
(5)
The rotation angle of the JPEG image is estimated according to the corresponding theoretical peak point position coordinates.

3.1. Cyclic Spectrum Preprocessing Based on Semi-Soft Threshold Wavelet

According to the analysis in Section 2, we can calculate the cyclic spectrum image (hereinafter called cyclic spectrum) of covariance and the amplitude value of four neighborhoods around the theoretical trajectory; in the case of JPEG post-processing, the mean absolute error of the algorithm will be large if the amplitude value is directly applied in the estimation of rotation angle, because the interference of block artefacts introduced by compression is large and destroys some resampling traces. In this paper, the four neighborhood amplitudes of the trajectory are denoised using the semi-soft threshold wavelet, which can effectively reduce the interference of the additional peak and further reduce the error of the estimated rotation angle.
Wavelet transform is a time-frequency analysis method which can change both the time window and the frequency window. It decomposes and refines the cyclic spectrum through scaling, translation, etc. It can realize automatic adjustment to meet the analysis needs of image signals. The noise of the cyclic spectrum is mainly distributed in the high-frequency region; thus, the process of wavelet denoising is mainly concentrated in the high-frequency region. In this paper, a two-level Daubechies wavelet was selected to decompose the amplitude vectors of Fx and Fy in cyclic spectrum S x x ( α , w ) . Firstly, the x-axis was analyzed, where e m k and g m k represent a set of orthogonal basis functions.
f x = k c m k e m k ( t ) + k d m k g m k ( t ) .
The scale coefficient c m k and wavelet coefficient d m k of m scale after decomposition are shown in Equation (9) [15].
{ c m k = n c m + 1 , n h 0 ( n 2 k ) ( t ) d m k = n d m + 1 , n h 1 ( n 2 k ) ( t ) ,
where h 0 ( n 2 k ) ( t ) and h 1 ( n 2 k ) ( t ) are the filter coefficients. Specifically, h 0 ( n 2 k ) ( t ) = 1 2 e ( r 2 k ) e ( t n ) d t , and h 1 ( n 2 k ) ( t ) = 1 2 g ( r 2 k ) e ( t n ) d t . The wavelet coefficient d m k of the image increases with the increase in decomposition scale c m k . Therefore, the wavelet transform of a two-dimensional cyclic spectrum is firstly decomposed in the x-direction and then in the y-direction. After wavelet decomposition, the high-frequency sub-bands mainly contain the details of cyclic spectrum and noise. For each high-frequency sub-band, threshold quantization processing is carried out. The wavelet coefficients larger than the threshold are considered to be related to the image rotation angle, which are still retained. The wavelet coefficients smaller than the threshold are considered to be generated by noise and set to zero, so as to achieve the purpose of denoising the amplitude components of the four neighborhoods of the trajectory.
In this paper, wavelet transform based on a semi-soft threshold function is used for denoising. Compared with a hard threshold, a semi-soft threshold has a certain continuity, but its deviation is smaller than a soft threshold [15,16,17]. Firstly, the unified threshold t2 is calculated according to Equation (10).
t 2 = 2 σ 2 ln N ,
where σ 2 represents the noise standard deviation, and N is the signal length. Secondly, t1 can be calculated according to Equation (11).
t 1 = 0.5 × t 2 .
As shown in Equation (12), the semi-soft threshold has certain continuity in the range t 1 < | d 2 ( w ) | < t 2 and is superior to the soft threshold; at | d 2 ( w ) | > t 2 , its quantization is the same as that of the hard threshold method. Therefore, it is better to quantify the amplitude of the four neighborhoods of the trajectory.
d 2 t ( w ) = { d 2 ( w ) | d 2 ( w ) | > t 2 sgn ( d 2 ( w ) ) ( t 2 ( | d 2 ( w ) | t 1 ) t 2 t 1 ) t 1 < | d 2 ( w ) | < t 2 0 | d 2 ( w ) | t 1 ,
where sgn() represents a symbolic function. When d 2 ( w ) > 0, sgn( d 2 ( w ) ) = 1; when d 2 ( w ) = 0, sgn( d 2 ( w ) ) = 0; when d 2 ( w ) < 0, sgn( d 2 ( w ) ) = −1. t1 and t2 represent thresholds, d 2 ( w ) is the wavelet coefficient, and d 2 t ( w ) is the wavelet coefficient after thresholding. Therefore, this paper obtains the spectrum amplitude data by using semi-soft threshold wavelet denoising, which can remove part of the interference caused by JPEG compression, so that the peak distribution is in line with the trajectory requirements.

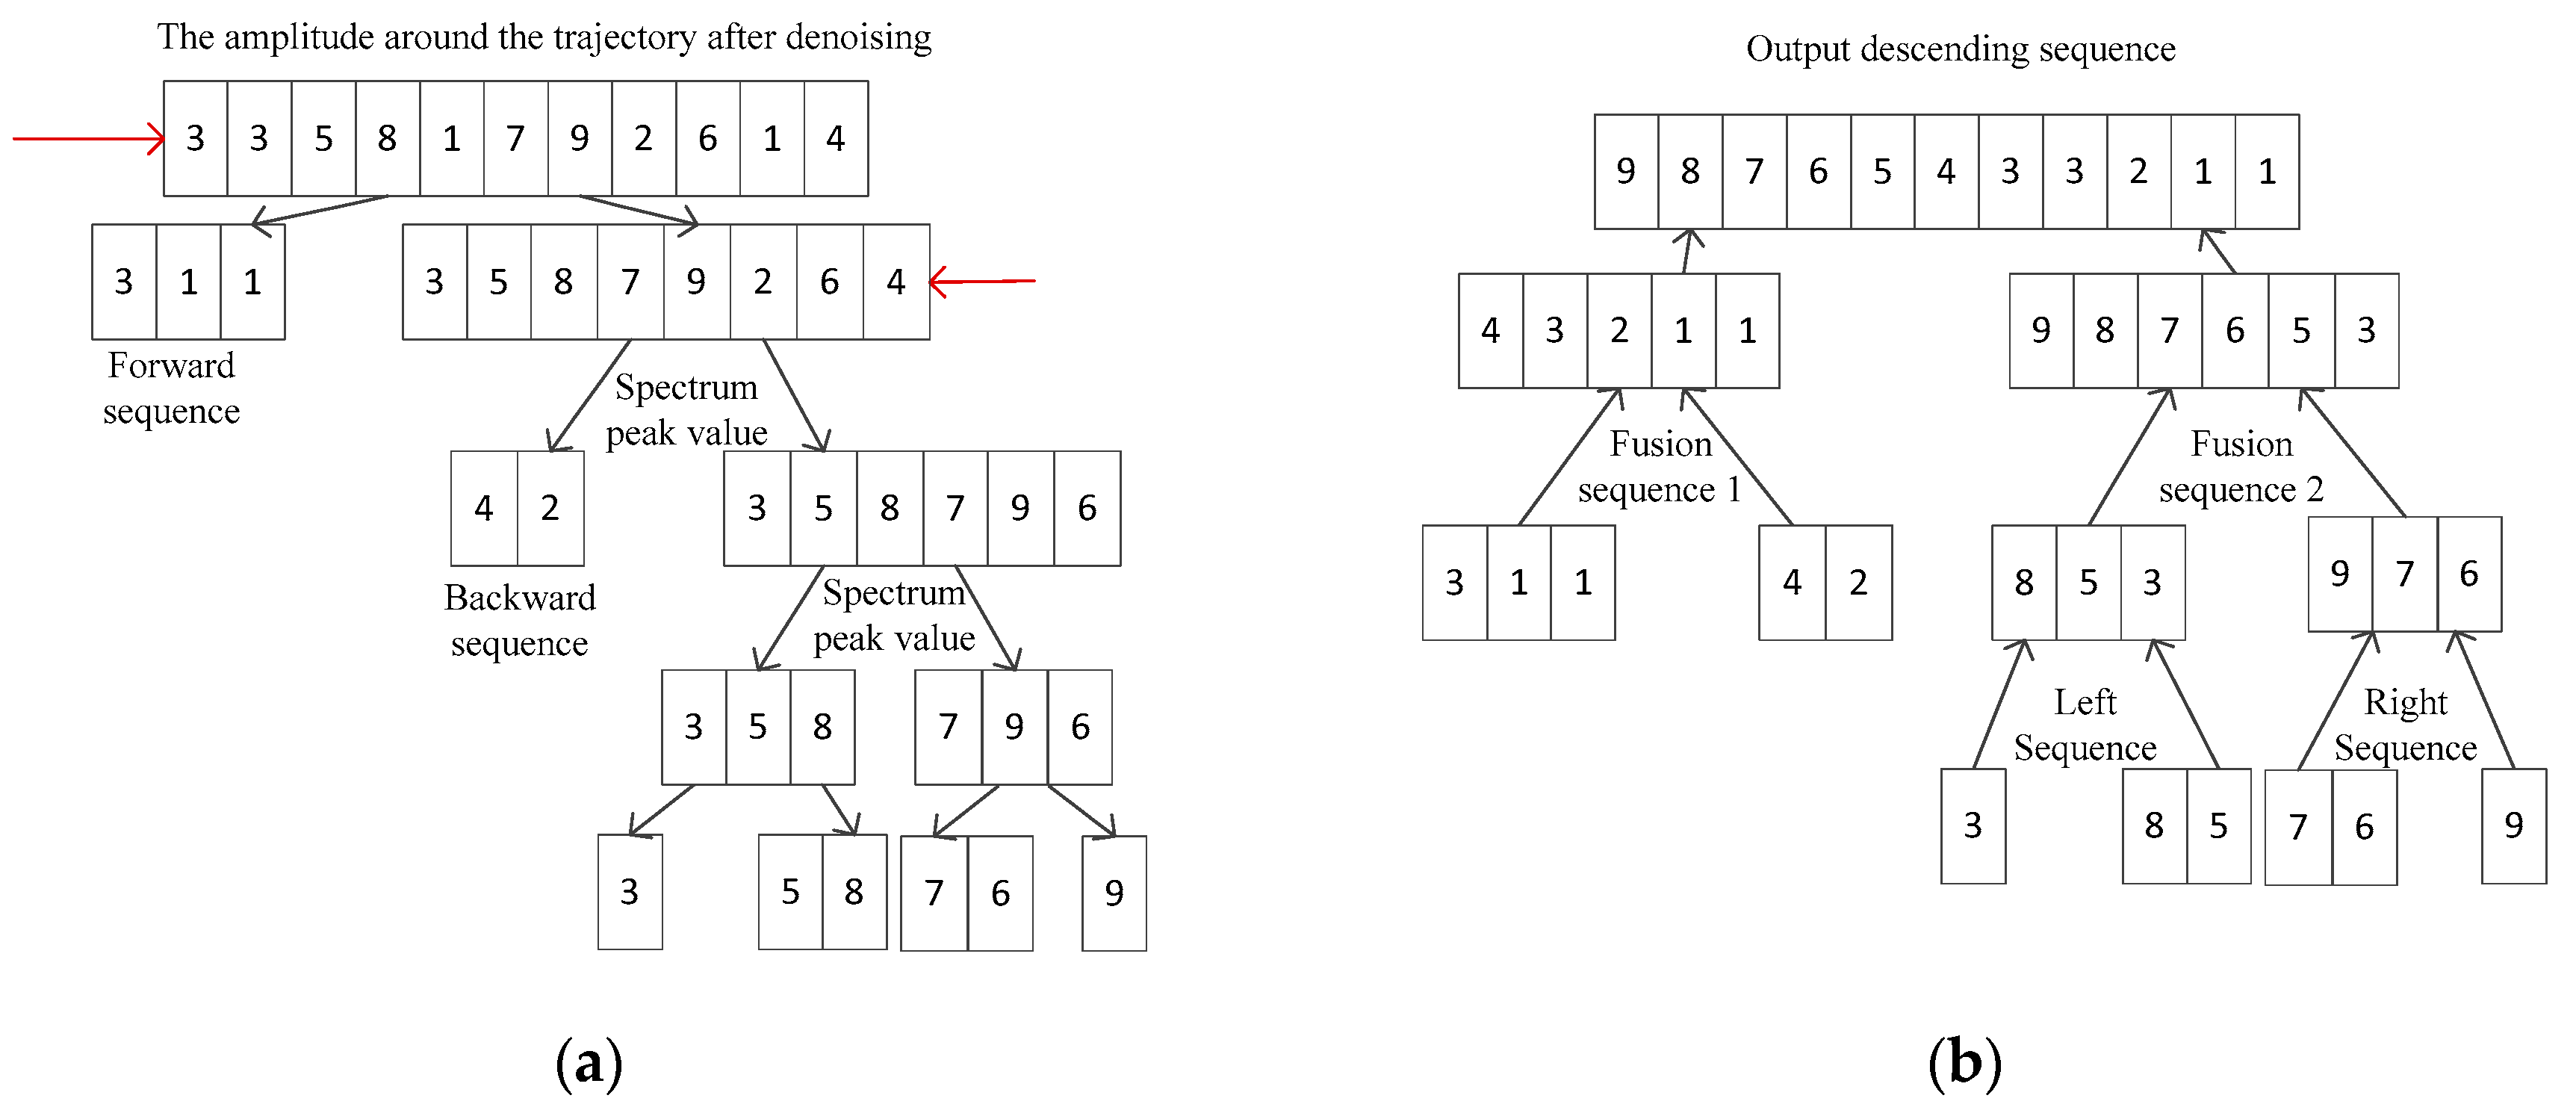
3.2. Image Rotation Angle Estimation Based on Super Sorting

In the cyclic spectrum, the data of the four neighborhoods around the theoretical trajectory are processed by wavelet transform, and a sorting operation is needed according to the amplitude so as to facilitate the selection of the spectrum peak. The existing sorting methods are divided into comparative sorting and non-comparative sorting. The comparative sorting methods include bubble sort, insert sort, select sort, quick sort, merge sort, and so on; the non-comparative sorting methods include bucket sort, cardinality sort, count sort, etc. [18]. All sorting algorithms have some defects; for example, bubble sorting, selection sorting, and insertion sorting have high time complexity. Quick sorting is an improvement of bubble sorting, which is greatly affected by the data range and initial data sorting. Merge sorting is faster, but it requires a lot of memory and has a high space complexity. The sorting of non-comparative classes requires that the data contain positioning features. Reference [19] discussed the strengths and weaknesses of various sorting algorithms in terms of time and classification ideas, and comprehensively considered the sorting time and data complexity. Therefore, this paper comprehensively considers the sorting time and data complexity, and it adopts the super sorting method to sort the data. The super sorting algorithm adopts the idea of “divide and conquer” to sort.
Every time the sorting function is called, it goes through four steps: forward selection, backward selection, fusion, and partition. When the boundary condition is met, the deepest recursive call is returned, resulting in a fully sorted list. The specific decomposition and fusion of amplitude sorting are shown in Figure 2.
Firstly, forward selection is applied to the original cyclic spectrum amplitude data. Forward selection is used to select the data from left to right, select the next element according to the current minimum element value, and move the selected element into the forward selection sequence. After iterating through the whole list, the original amplitude data are divided into the forward selection list and the new original list. Then, backward selection is applied to the newly obtained original list, with the direction from right to left. The remaining steps are the same as the forward selection, finally producing the backward selection list and the new original list. Then, the forward list and backward list are merged. If the length of the new original list is still greater than 1, the original list is further divided into two sub-lists, left and right, repeating the front and back selection. When the length of the original list is less than or equal to 1, all the current sub-lists are merged to get the final ordered amplitude data. The specific algorithm steps are shown in Algorithm 1.
Algorithm 1 Super_Sort (L)
Input: Spectral data column L (containing n data) around trajectory paths after wavelet pretreatment
Output: Spectral data around trajectory paths in descending order
1:     If length (L) < 1 then
2:     Return ()
3:     else
4:     Forward sequence ← empty matrix
5:     Backward sequence ← empty matrix
6:     /* Forward Selection*/
7:     current minimum amplitude ← L [left]
8:     for i ← 1 to length (L) by 1 do
9:     if L[i] ≤ current minimum amplitude
10:   then current minimum amplitude ← L [i]
11:   remove L [i] to forward sequence
12:   end
13:   /*Backward Selection*/
14:   if length(L) > 1
15:   then current minimum amplitude ← L [length (L)]
16:   for i ← length (L) to 1 by 1 do
17:   if L [i] ≤ current minimum amplitude then
18:   then current minimum amplitude ← L [i]
19:   remove L [i] to backward sequence
20:   end
21:   sequence 1 ← Fusion of forward sequence and backward sequence fusion
22:   /* Partition*/
23:   Middle ← empty matrix
24:   Middle1 ← empty matrix
25:   Middle2 ← empty matrix
26:   while length (L) > 1
27:   do Middle ← length (L)/2
28:   Middle1 ← (0, middle)
29:   Middle2 ← (middle + 1, length(L))
30:   Middle1 ← call super_sort (Middle1)
31:   Middle2 ← call super_sort (Middle2)
32:   end
33:   sequence 2 ← the fusion of middle1 and middle2
34:   Return the fusion of sequence 1 and 2
After obtaining the ordered amplitude data, unlike the existing algorithms which directly choose the maximum amplitude value point as the calculation point, this paper selects the point based on the super sort and considers the two conditions of amplitude value and distance comprehensively. The ordered amplitude data are selected to calculate the Euclidean distance d (the distance from peaks to the theoretical trajectory) within a certain range of amplitude. The calculation method is shown in Equation (13).
d = ( F ˜ x F x ) 2 + ( F ˜ y F y ) 2 .
The point ( F ˜ x , F ˜ y ) with the smallest distance d is taken as the peak point brought by the image rotation angle, and the rotation angle is calculated by transporting the corresponding theoretical peak coordinate ( F x , F y ) into Equation (14), so that the estimation error is further reduced. The formula for estimating the angle is shown in Equation (14), where θ ^ represents the image rotation angle estimated by the algorithm.
θ ^ = arctan ( F y / F x ) .

4. Experimental Results and Discussion

The Uncompressed Color Image Dataset (UCID) contains 1338 images in TIFF format, which is an uncompressed color image database [20]. In the experiment, 200 uncompressed images were selected from the UCID database for evaluation. For each image, image blocks with sizes of 128 × 128 and 256 × 256 were cropped from the central region. At present, the detection error of the existing algorithm in the rotation angle (25°,45°] is small and approaches zero. Therefore, a rotation angle from 1° to 25° with a step of 1° was considered, and the bicubic kernel interpolation method, which is difficult to detect, was selected for the experiment. The quality factors (QFs) were 95, 90, and 85. The average absolute error of the estimated results from about 200 images was obtained for experimental comparison. The experiment also included the estimation of image rotation angle in an uncompressed scenario and in a JPEG compressed scenario, as well as tampering detection and location, and a time comparison compared with existing algorithms.

4.1. The Evaluation Criteria of Algorithm

In this paper, mean absolute error was adopted as the objective evaluation standard for detecting and estimating the performance of image rotation angle.
Δ θ =   p = 1 N u m | θ ^ - θ | N u m ,
where θ is the real angle value of image rotation, θ ^ is the angle value estimated by the algorithm, p is the number of images, N u m is the total number of images taken by the experiment, and Δ θ is the average absolute error between the calculated rotation angle and the real angle. In the localization experiment of forged images, gray images were used in this paper for experimental demonstration. Firstly, the images were input, and angles were estimated using the algorithms proposed by Vazquez-Padin [9] and Chen [3], as well as the algorithm proposed in this paper, in the case of a 128 × 128 image block size. The image block with an angle estimation error is within 1° was considered as the tampered part [9], and marked with a red border. The specific steps are shown in Algorithm 2.
Algorithm 2 Image positioning algorithm
Input: The rotated image
Output: Locate the tampered part of the image
1:     Input the rotated image I
2:     /* Set the image block size B and lag range K */
3:     B ← 128 × 128
4:     K ← 9
5:     /*Acquire the rows i and columns j of the rotated image*/
6:     [i,j] ← size(I)
7:     X ← j:j + B + sqrt (K) − 1
8:     Y ← i:I + B + sqrt (K) − 1
9:     estimated angle ← call the angle estimator function
10:   If absolute (estimated angle − actual angle) < 1
11:   then I (X,Y) ← the tamper part
12:   marked with red box
13:   end

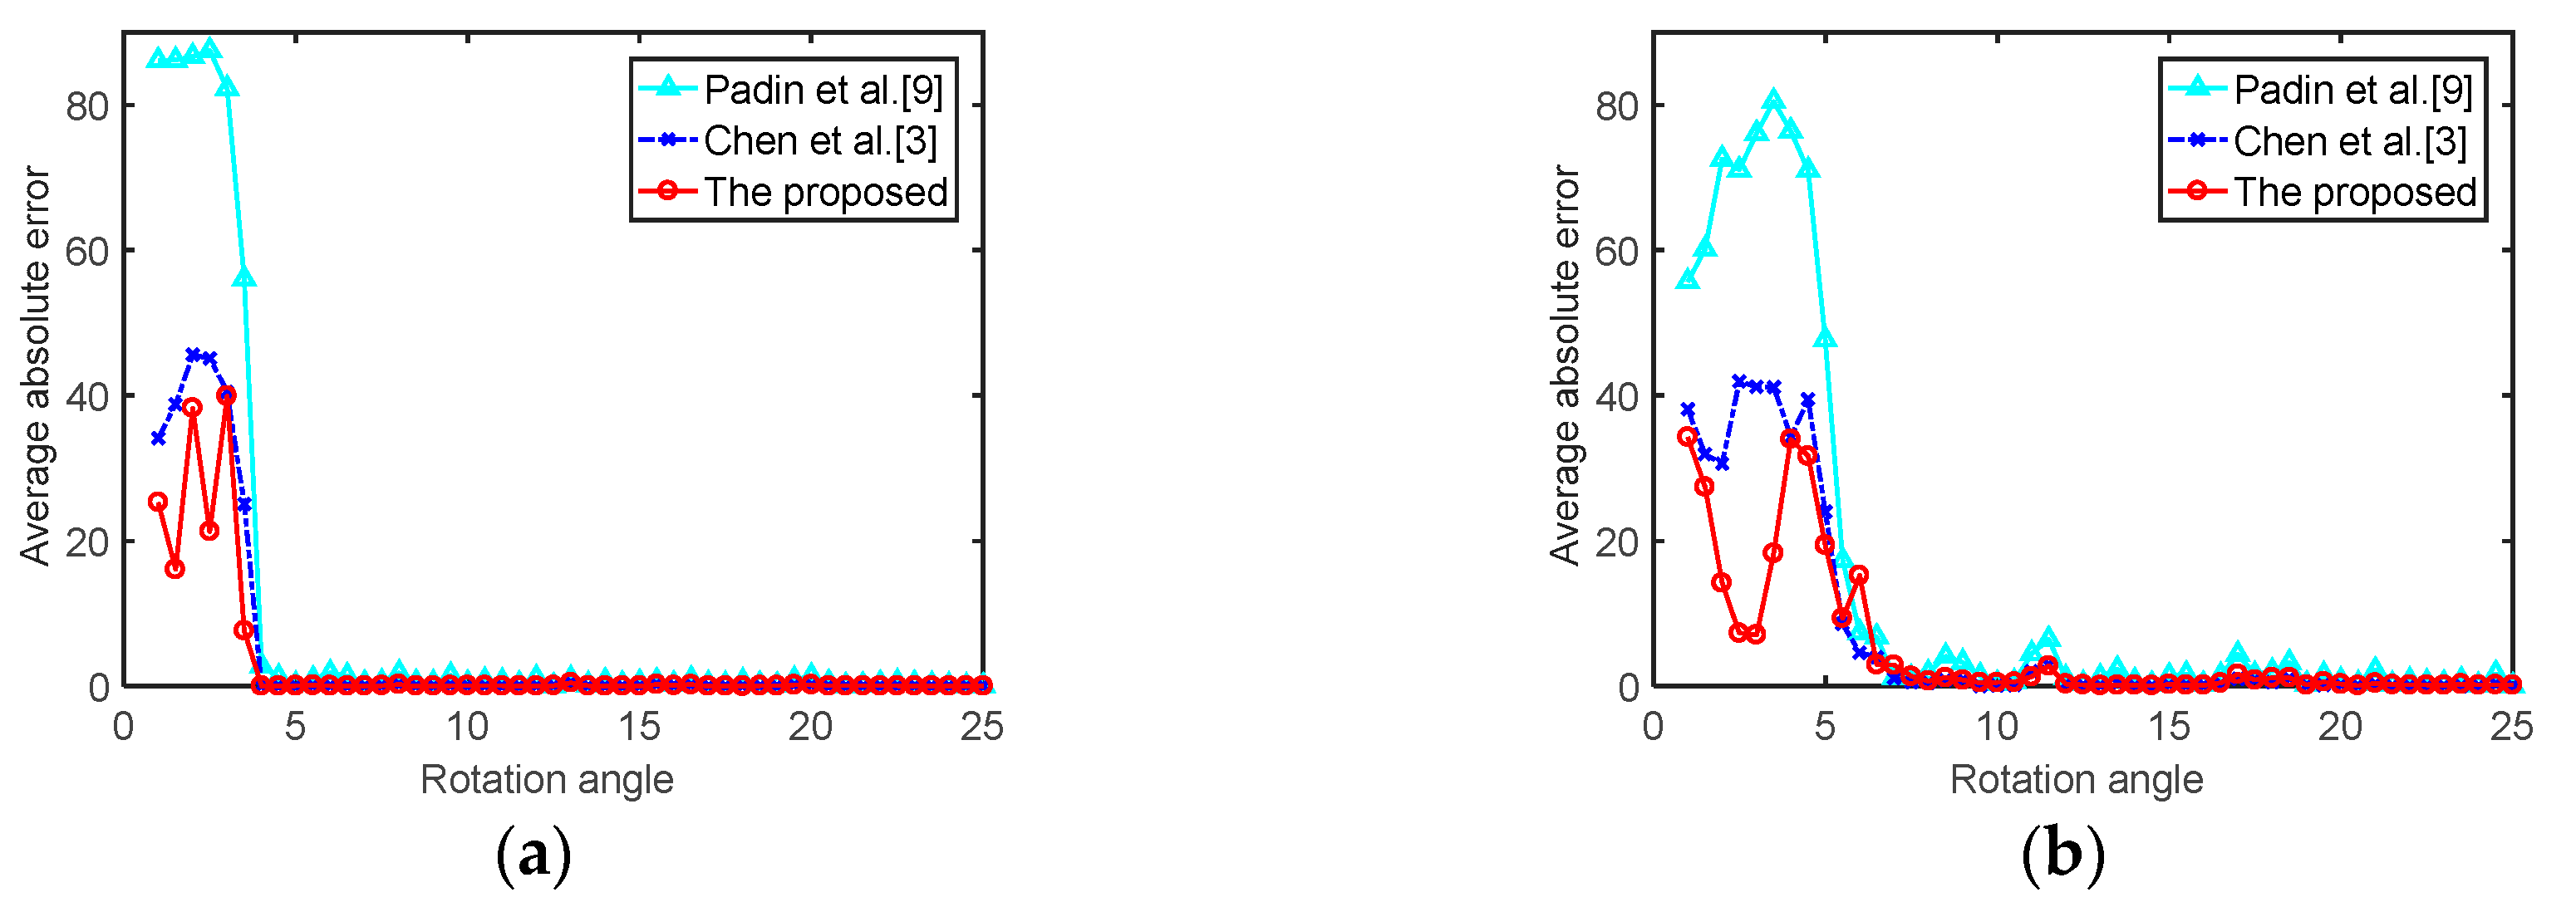
4.2. Rotation Angle Estimation Error and Positioning Results of Uncompressed Images

In this paper, 200 uncompressed images were cut into 256 × 256 and 128 × 128 blocks for the experiment, and the algorithms of Vazquez-Padin et al. [9] and Chen et al. [3] were compared with the proposed algorithm under the same conditions.
Figure 3 shows the comparison between the results of Vazquez-Padin [9] (regular triangle solid line), Chen [3] (dotted asterisk), and the proposed algorithm (circle solid line). The image block sizes from left to right were 256 × 256 and 128 × 128, respectively. It can be observed from the figure that the size of the image block had a certain impact on the detection results. A smaller image block led to a greater detection error. In the case of the uncompressed image, there were no block artefacts, and the resampling trace was not affected; thus, all algorithms had better detection results. In the [1°,5°] rotation range of the same image block size, the semi-soft threshold wavelet and point selection method in the algorithm proposed in this paper produced an average absolute error lower than that of Chen et al. [3] and Vazquez-Padin et al. [9] when the rotation angle was small.

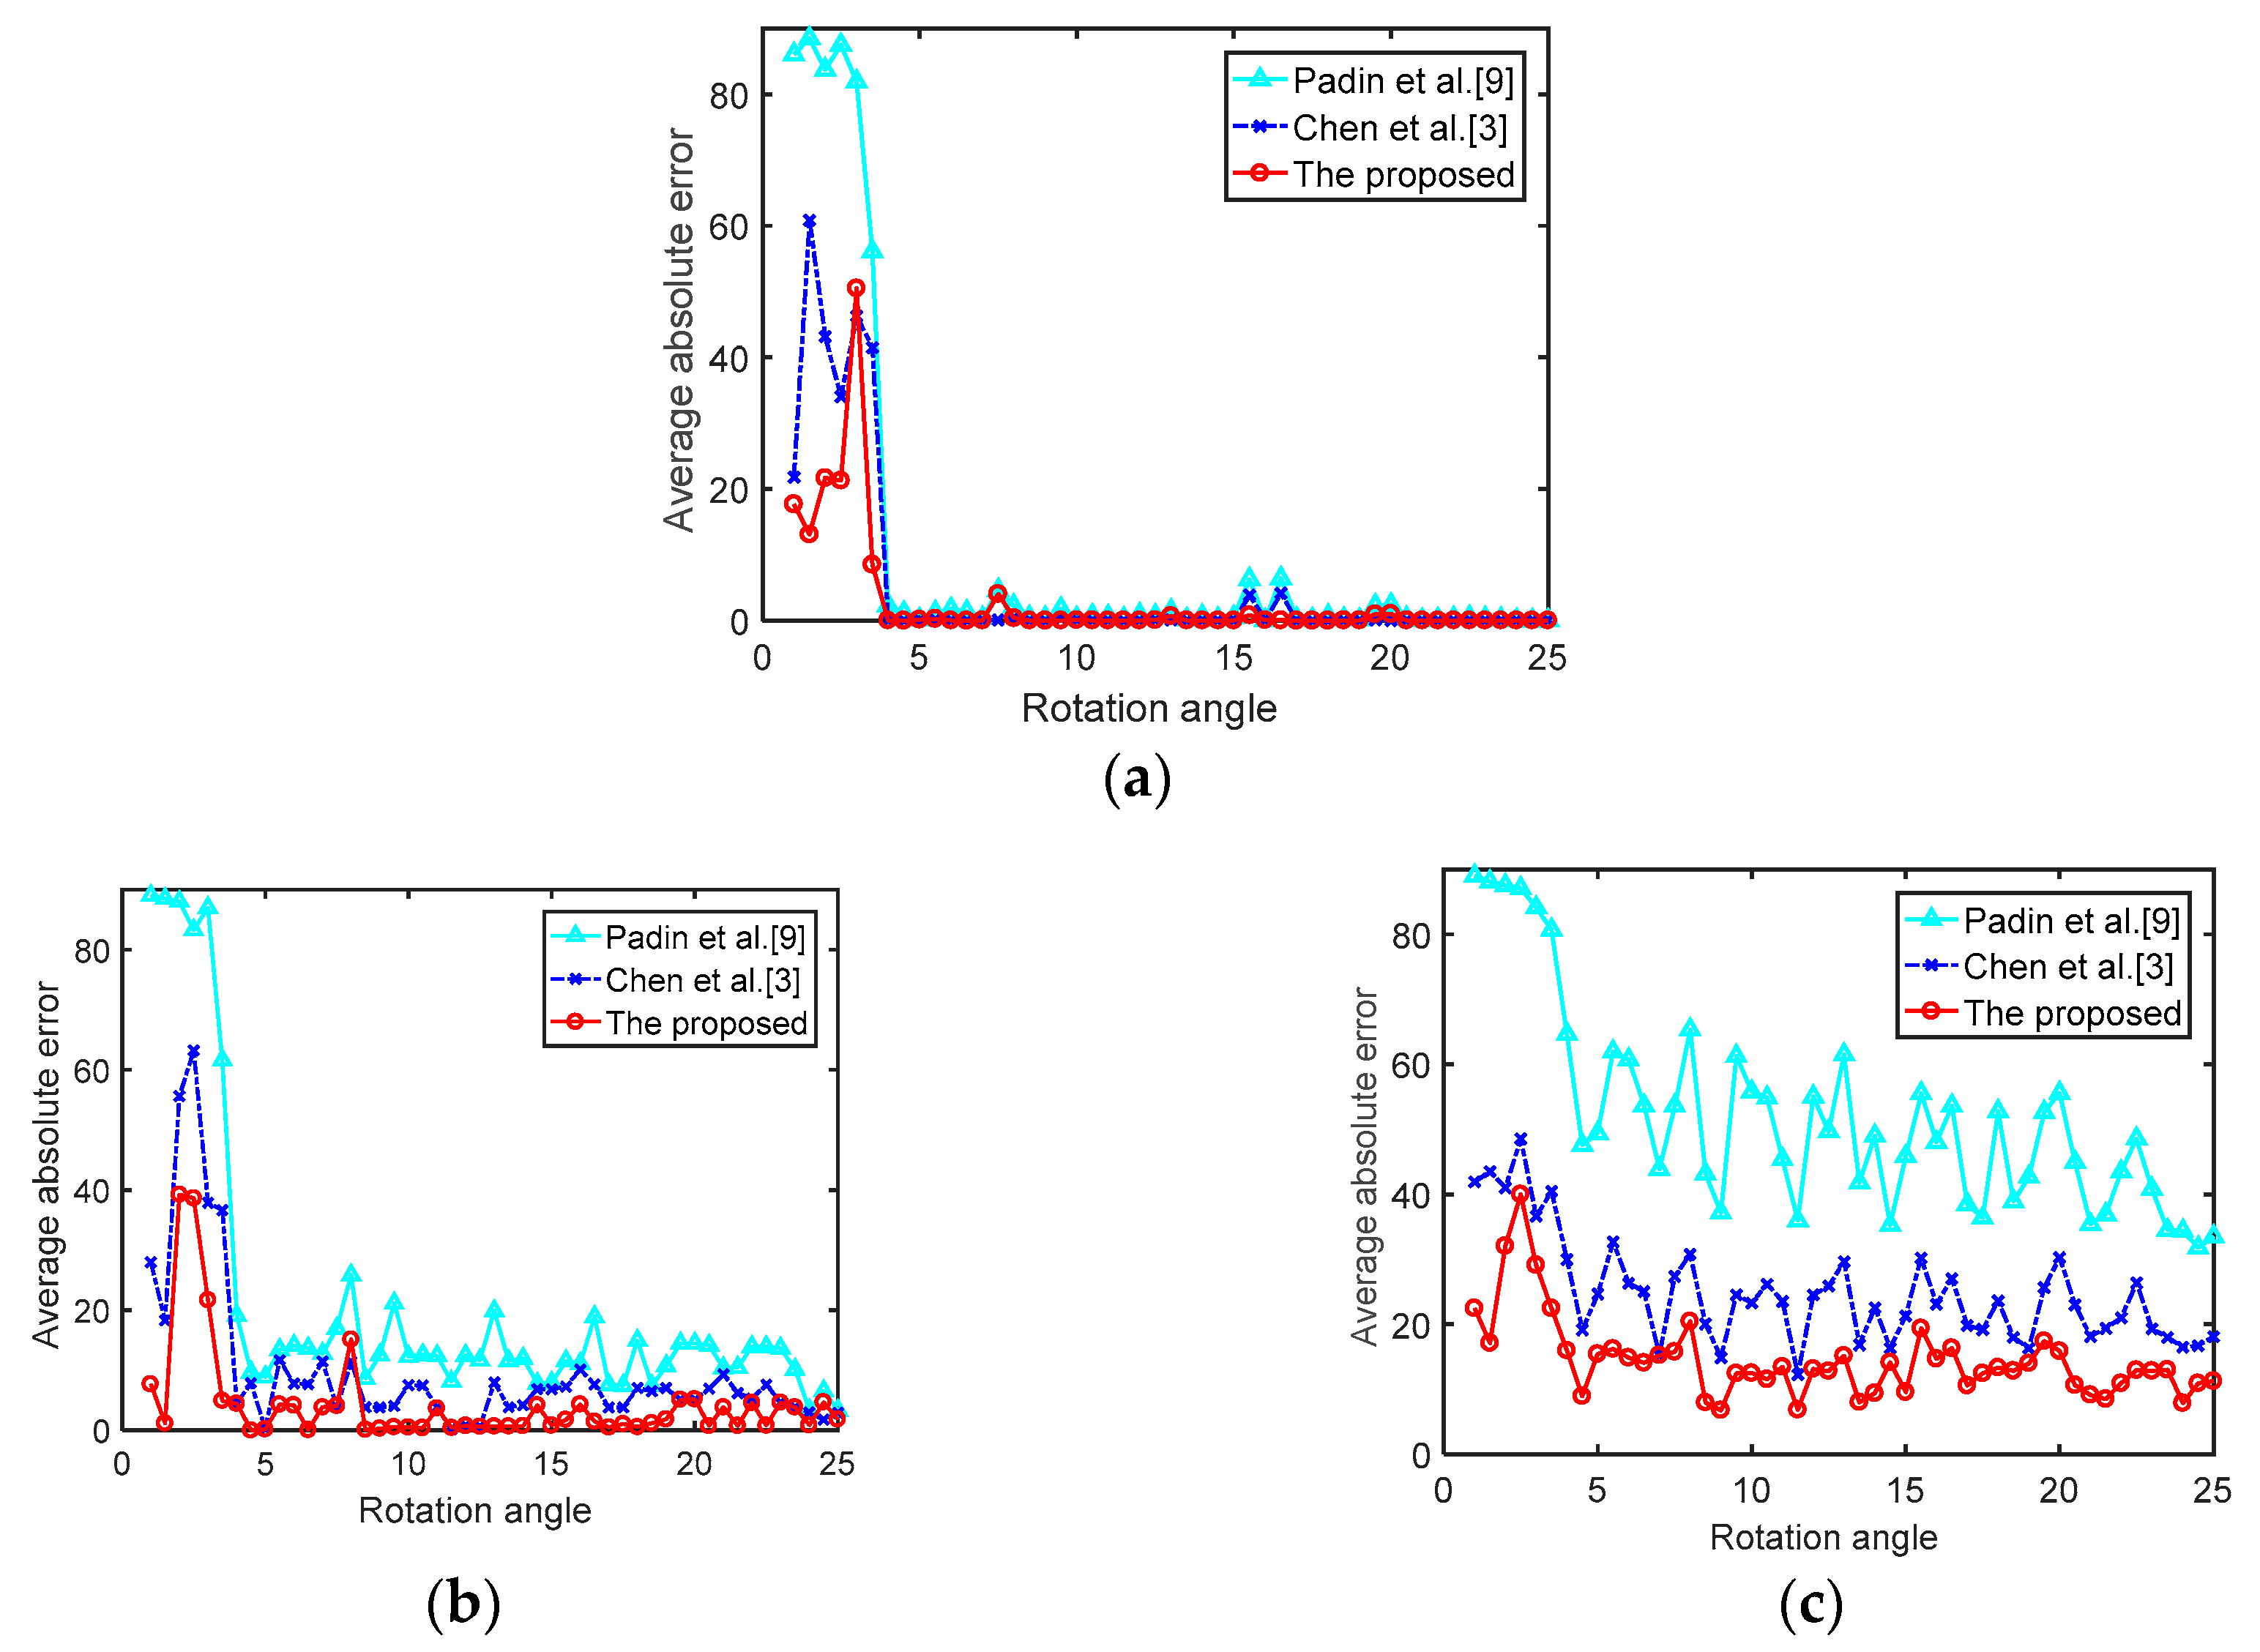
4.3. Image Rotation Estimation Results under JPEG Compression

JPEG compression is a lossy compression format of an image, but it is also a popular image format. The rotated image is usually compressed into JPEG format during transmission. Therefore, it is of practical significance to estimate the rotation angle of the image under JPEG compression. The compression process of JPEG introduces a certain amount of distortion to the image and destroys the resampling traces brought by the rotation angle. Generally, a larger compression quality factor (QF) (within the range of 1 to 100) denotes a smaller disturbance introduced [21]. In this part of the experiment, when the compression quality factors were 95, 90, and 85, 256 × 256 image blocks were used for rotation angle estimation, and the experimental results are shown in Figure 4.
Figure 4 shows the estimated error of the rotation angle of Vazquez-Padin [9] (regular triangle solid line), Chen [3] (dotted asterisk), and the proposed algorithm (circle solid line) in JPEG compression. With the change in compression quality factor, the average absolute error of angle estimation was also affected to a certain extent. A smaller compression quality factor led to worse image quality, and the traces of image resampling were destroyed; thus, the estimation error was also larger. However, under the same compression quality factor, the estimation result of the proposed algorithm was still better than that of the existing algorithms. As shown in Figure 4a, within the rotation angle of [1°, 5°], the detecting error of the proposed algorithm was smaller; in Figure 4b,c, it can be concluded that, within the rotation angle of [1°,25°], compared with the existing methods, the algorithm in this paper obtained a smaller detecting error because it applied semi-soft threshold wavelet transform and an amplitude–distance selection method to cope with the cyclic spectrum amplitude data. In order to display the performance of the algorithm in a more comprehensive way, the estimation accuracies for 256 × 256 blocks with a quality factor of 95, 90, and 85 (1°–25°) are given in Table 1.
Under the same compression quality factor and rotation angle, the highest detection accuracy in all algorithms is shown in bold in Table 1. The highest detection accuracy of all algorithms in Table 1 is expressed in bold (under the rotation angle). It can be concluded from Table 1 that, for the same rotation angle (for example, 20°), the detection accuracy decreased with the decrease in QF; however, on a whole, the angle estimation algorithm in this paper was more robust against JPEG compression, and the estimation accuracy was better than the existing algorithms. Under the same compression quality factor, the proposed algorithm also had better estimation accuracy than the compared algorithms. Specifically, within the rotation angle range of [6°, 25°] and QF = 95, the detection accuracy of the proposed algorithm was higher than that of the existing algorithms; except for QF = 90 and a rotation angle of 7°, the detection accuracy of the proposed algorithm was 0.5 percentage points lower than that of Chen et al. [6], and, in the case of QF = 90 and 85 and a rotation angle range of [1°, 25°], the algorithm in this paper had better estimation accuracy. The semi-soft threshold wavelet transform was used to process the amplitude data of the cyclic spectrum, and the amplitude–distance method effectively reduced the interference of the additional peak value and improved the estimation accuracy. However, the model still needs to be further improved at small angles to achieve a higher detection rate.

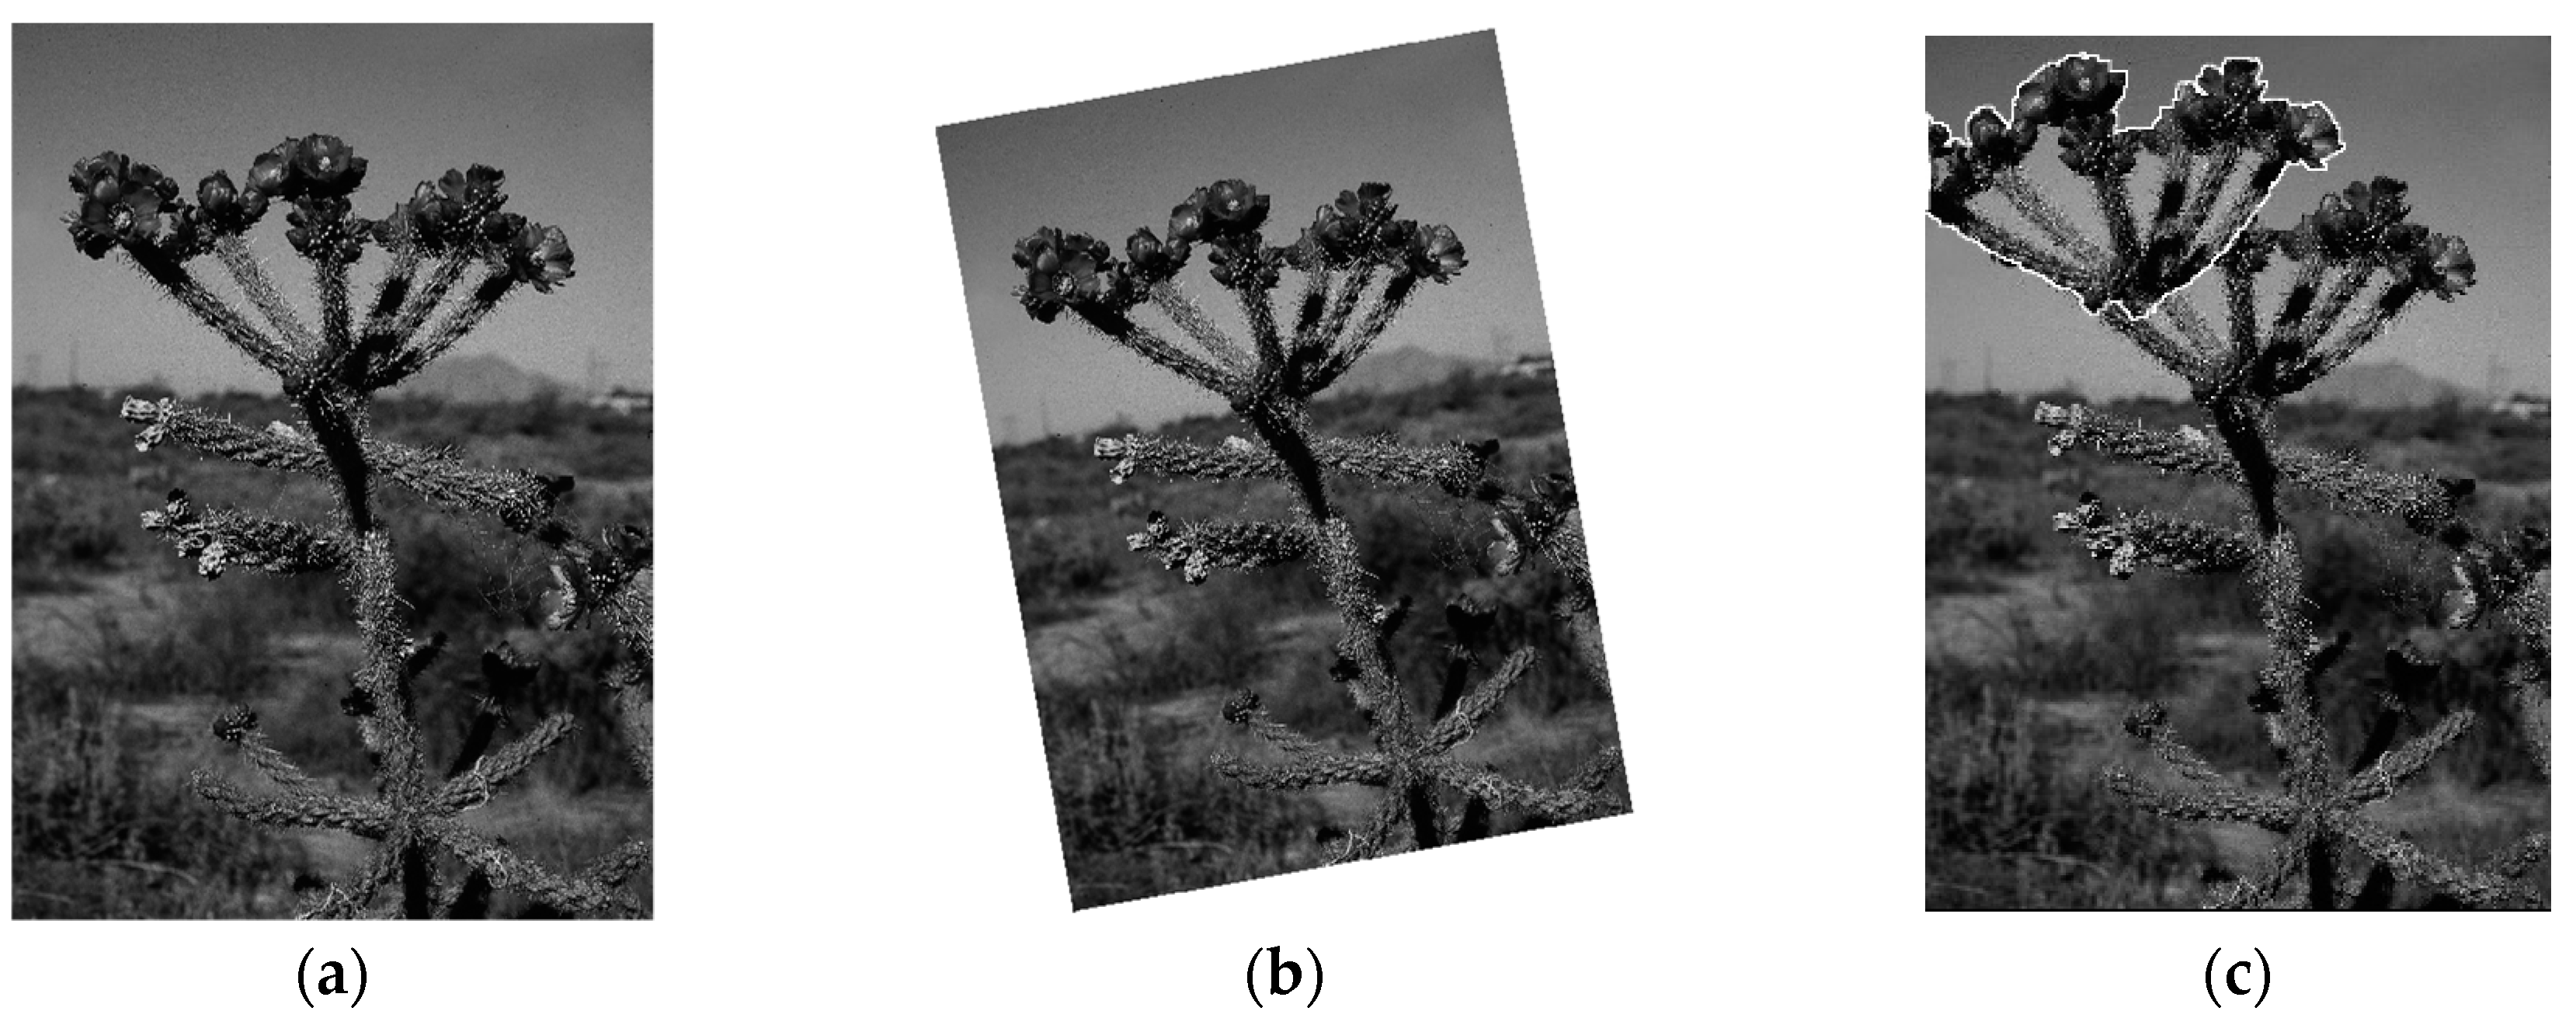
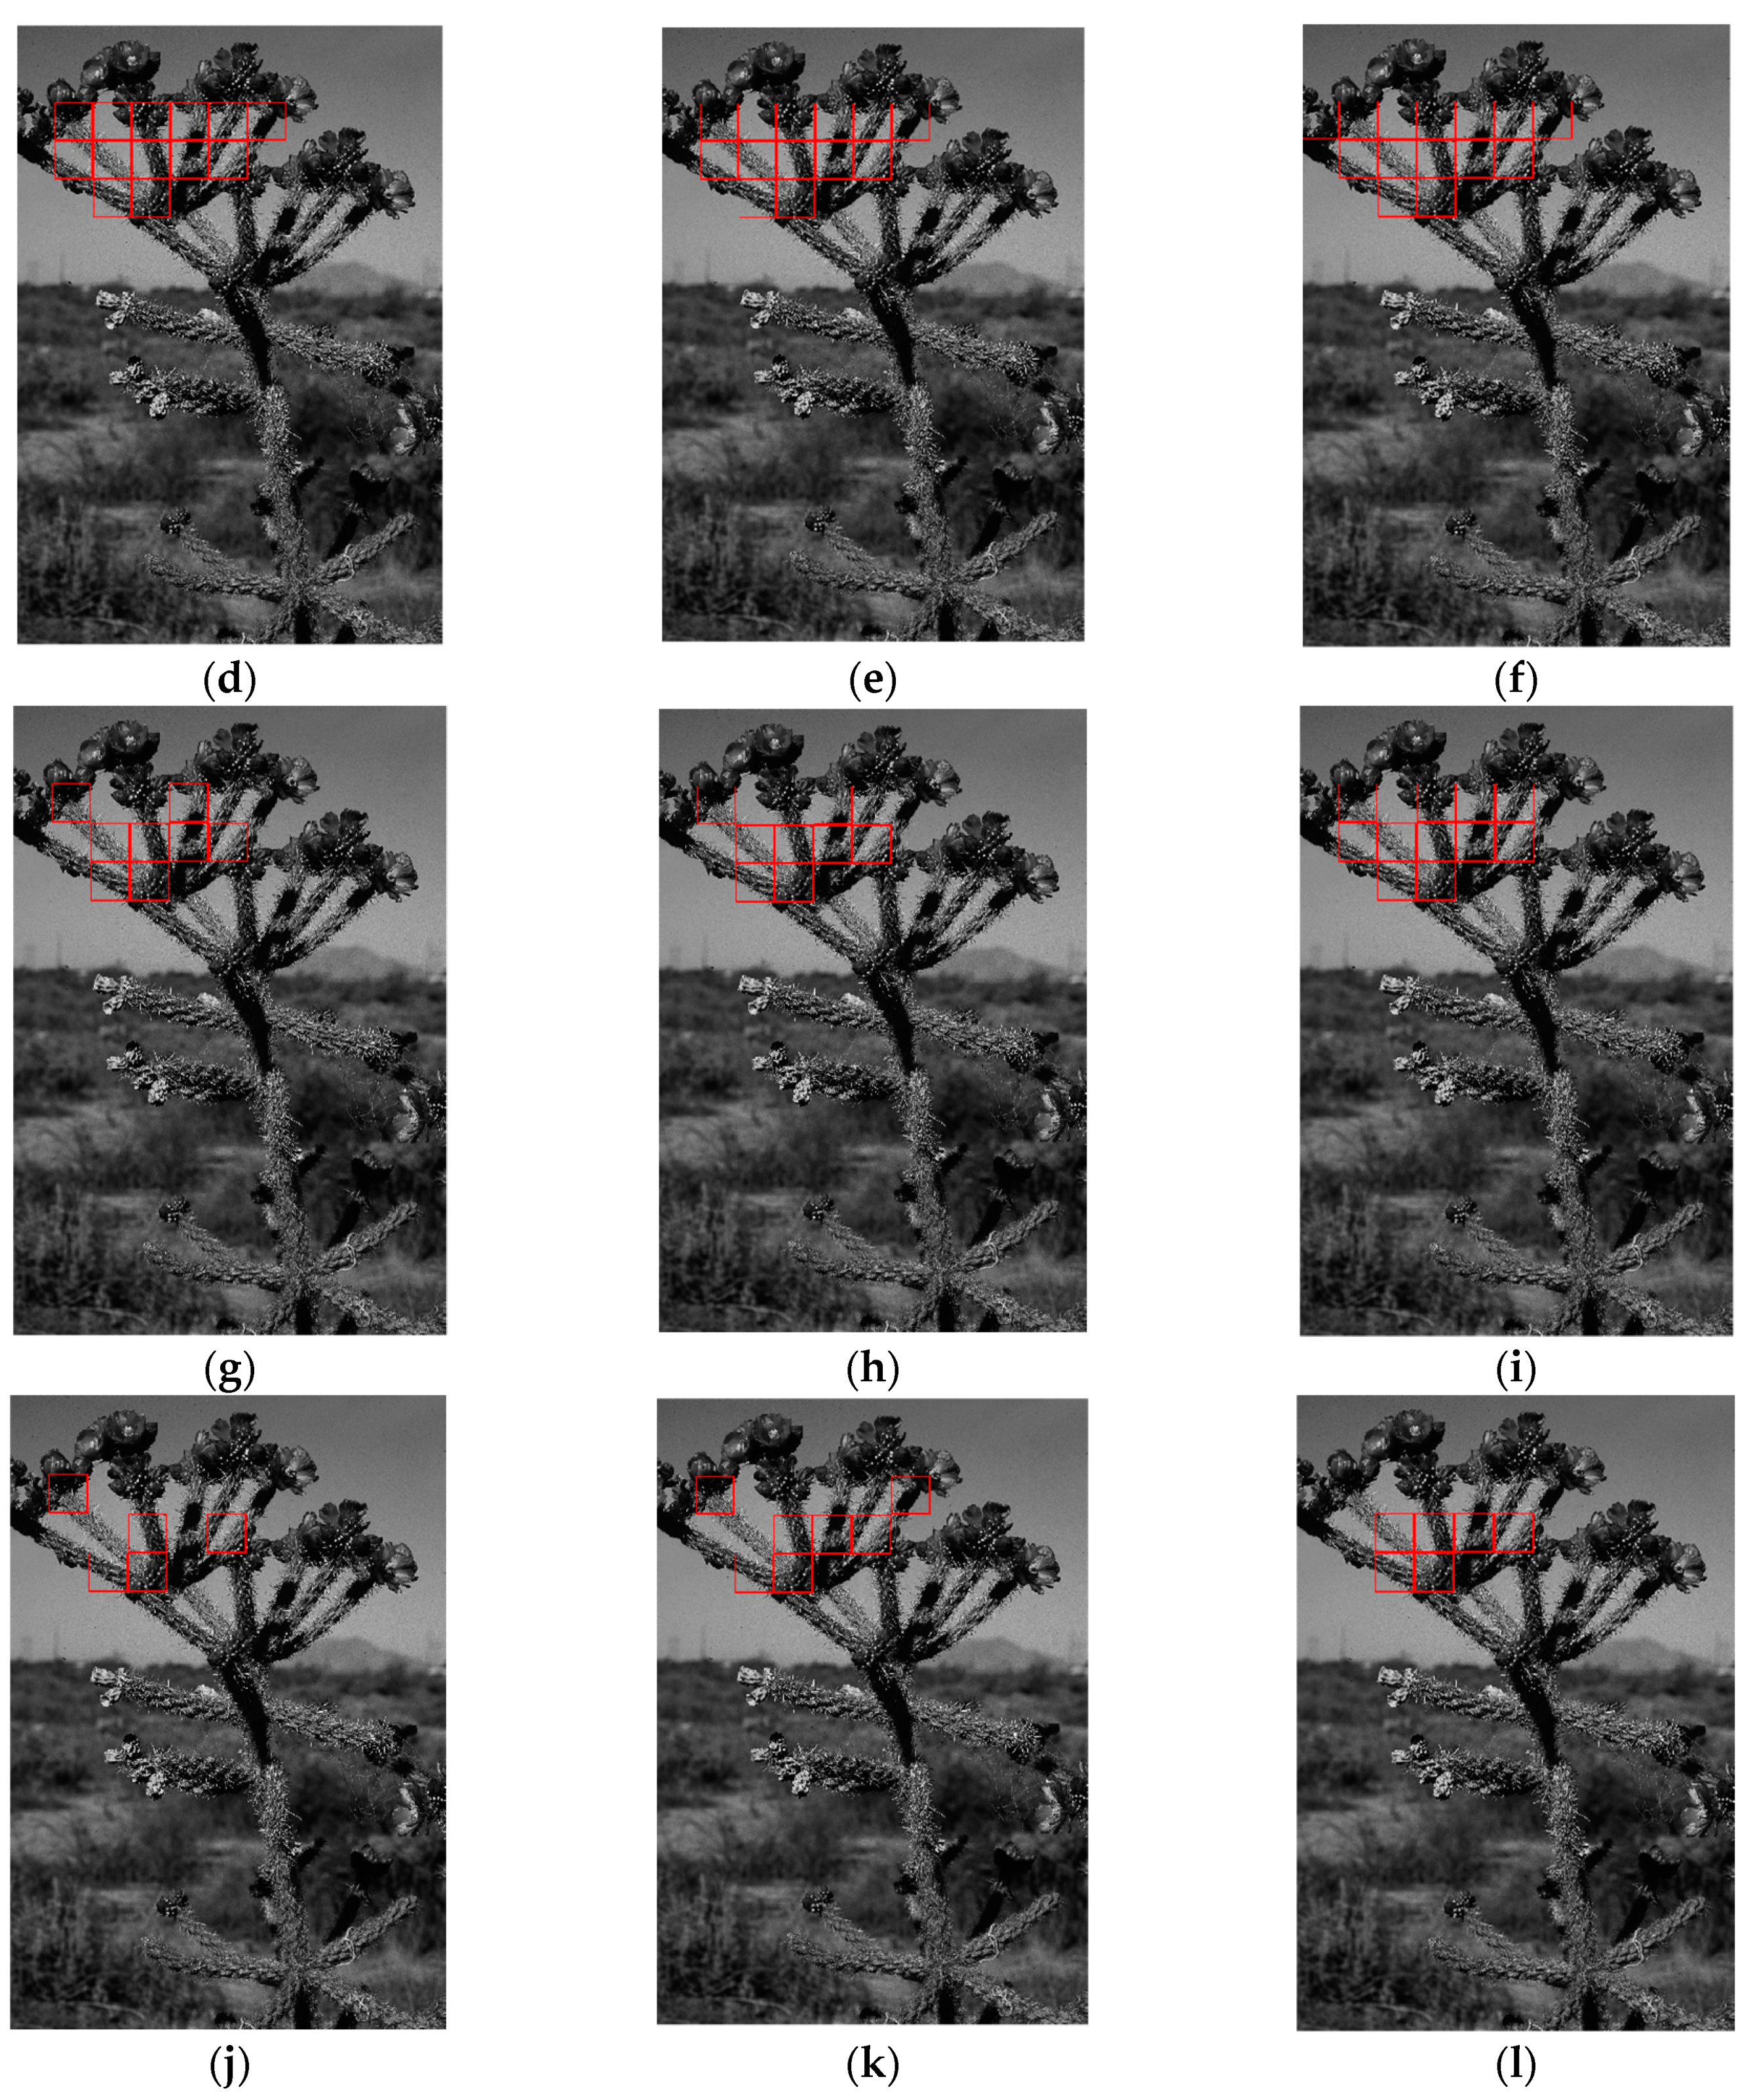
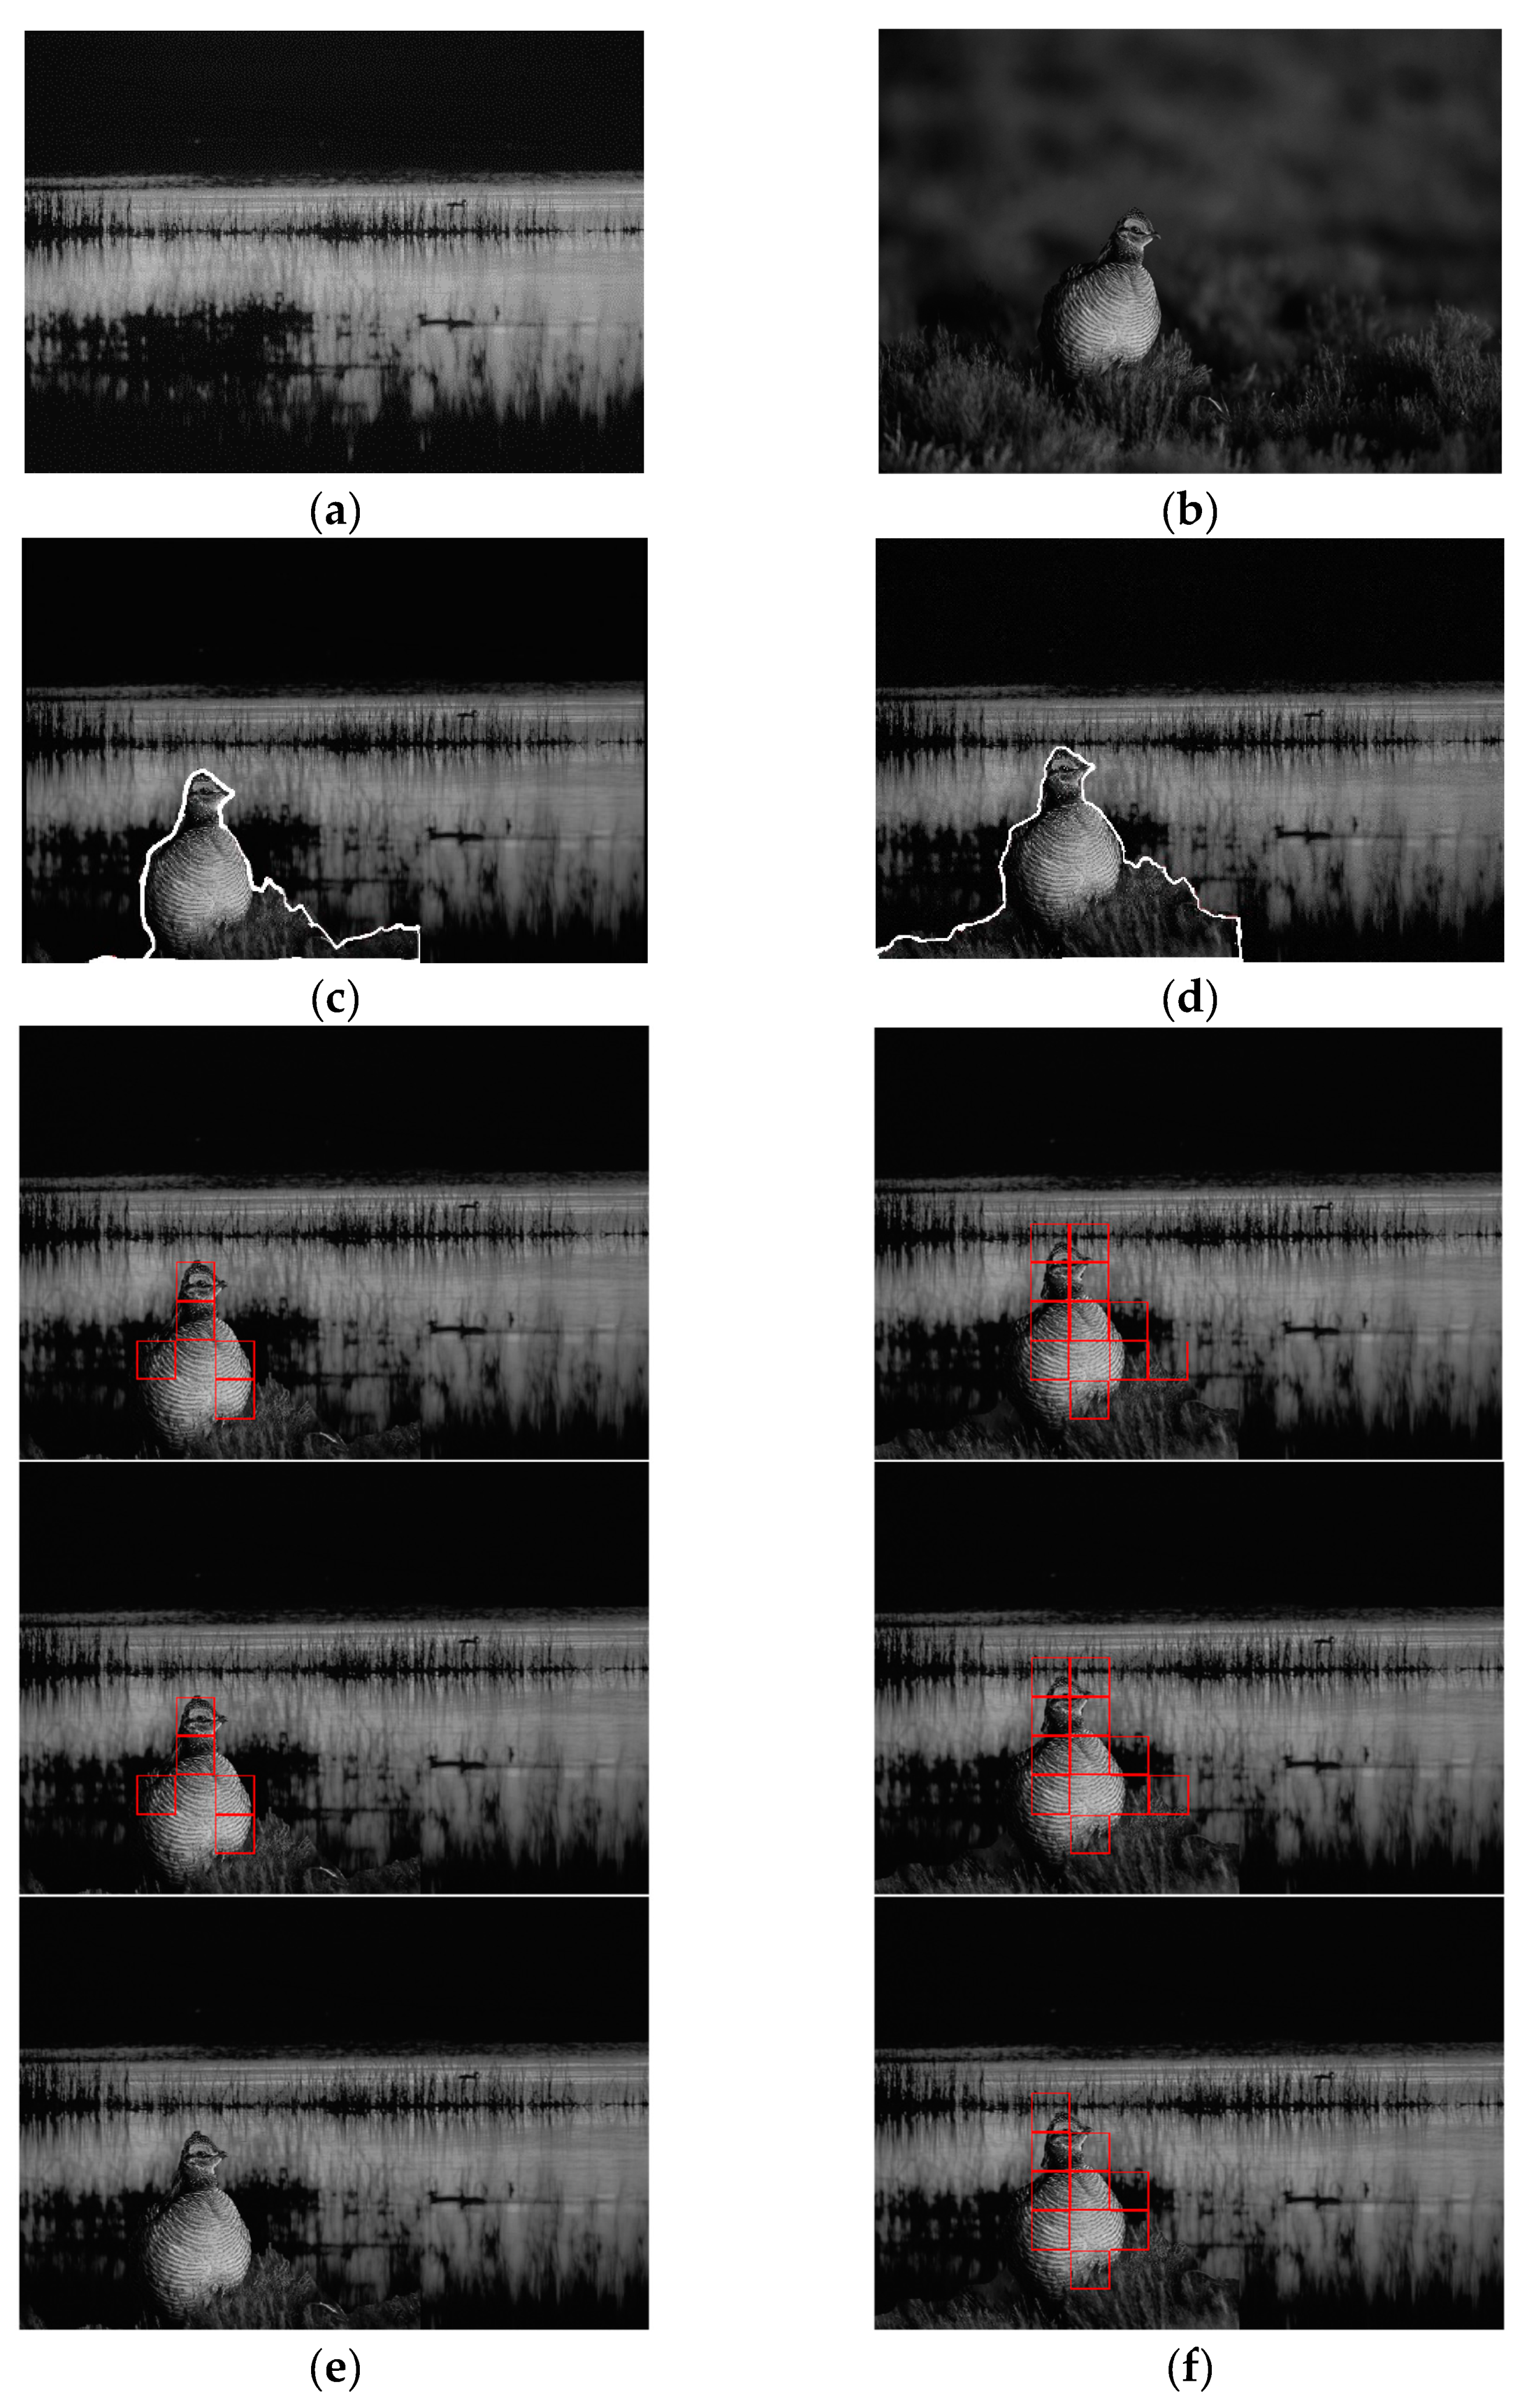
4.4. The Location Detection of Tampered Image

In order to verify the validity of the algorithm in the tampered image, this paper compared the position detection of the tampered image. The specific positioning results are shown in Figure 5 and Figure 6. This paper employed Photoshop to modify the original 1500 × 2100 real image to generate the tampered image. The tampered area was rotated by 10° (Figure 5b) and then placed in Figure 5a to generate a forged image (Figure 5c). The white outline marks the tampered area, and a block size of 128 × 128 was used for tamper detection and location.
Figure 5 shows the location results of tampered images with the same rotation angle (10°) and different quality factors. The following can be concluded from the figure:
(1) With the decrease in QF, the positioning accuracy also decreased. Through the quantitative calculation of image location, it can be concluded that, when QF was reduced from 95 to 85, the true positive rate (TP) value of the proposed algorithm was reduced from 83.55% to 33.39%, the TP value for Chen et al. was reduced from 76.57% to 34.03%, and the TP value for Vazquez-Padin et al. was reduced from 76.57% to 27.24%. The main reason is that JPEG lossy compression reduces the quality of the image, which affects the detection performance of the algorithm.
(2) When QF = 95, TP for the proposed algorithm was 83.55%, while it was 76.57% for Chen et al. and 76.57% for Vazquez-Padin et al. The results show that the semi-soft threshold wavelet transform could effectively improve the detection performance of the algorithm for JPEG compression.
Figure 6 shows the estimated positioning results of different rotation angles (15°, 20°) under the same compression quality factor (QF = 95). The sizes of the image blocks used were all 128 × 128. Figure 6a inserted the duck into the water surface background by rotating it 15°, and, in Figure 6b, the duck was inserted into the surface background by rotating it 20°. As can be seen from Figure 6, the positioning accuracy with a rotation angle of 20° was higher than that with a rotation angle of 15°. A larger rotation angle leads to more obvious resampling traces, making it relatively easy to detect. In the proposed method in this paper, the value of TP was 60.15% when the rotation angle was 20°, and 59.16% when the rotation angle was 15°. Therefore, it can be concluded that a larger rotation angle leads to a more obvious resampling trace, which is relatively easy to detect. The algorithm in this paper can also effectively detect and locate different rotation regions.

4.5. Analysis of Algorithm Complexity and Time Comparison

For the proposed method in the paper, we chose the maximum complexity of the algorithm, while the complexity of the compared algorithms was O (n2). Therefore, according to the algorithm introduced in this paper, we can determine that the time complexity of the semi-soft threshold wavelet transform is T (n) = O (n), that of the super sort is T (n) = O (n2), and that of the amplitude–distance selection method is T (n) = O (n). Thus, the time complexity of the proposed algorithm can be written as T (n) = O (n2). It can be seen that the proposed method improved the detection accuracy without increasing the time complexity.
All algorithms were run on an Intel(R) Core(TM) i5-8250u central processing unit (CPU) personal computer (1.6 GHz), and the software environment was Matlab 2016b. When the rotation angle was 20°, the time required for sorting the amplitude values around the theoretical trajectory are shown in Table 2. With 128 × 128 and 256 × 256 image blocks, it can be seen that the sorting algorithm in this paper took relatively less time compared with the state-of-the—art methods investigated. However, due to the addition of data post-processing and the point selection method in the algorithm, the overall time complexity of the algorithm was higher than that of the comparison algorithms. As can be seen from Table 2, the time required for the super sorting algorithm adopted in this paper was less. The comparison results of the total time consumption with the existing algorithms are shown in Table 3. It can be seen from Table 2 and Table 3 that the super sorting algorithm could effectively reduce the running time of the algorithm in this paper, but the overall running time of the proposed algorithm was slightly higher than the existing algorithms.

5. Conclusions

This paper presented a rotation angle estimation algorithm for JPEG compressed images. According to the theoretical trajectory presented on the cyclic spectrum, the obtained amplitude was effectively post-processed to estimate the rotation angle. JPEG compression often brings additional peak interference to the cyclic spectrum, and destroys the resampling trace caused by the rotation angle, causing some interference with the selection of calculation points. Therefore, directly choosing the maximum peak value for angle calculation according to the cyclic spectrum brings great deviation to the image estimation value. In this paper, the amplitude component of the four neighborhoods around the theoretical trajectory in the cyclic spectrum was firstly denoised using semi-soft threshold wavelet transform, which effectively reduced the interference of JPEG compression. Secondly, the peak value was selected using the method of amplitude–distance selection based on super sorting, and the rotation angle was estimated using the corresponding theoretical point. The experimental results showed that the algorithm can effectively reduce the rotation angle estimation error and successfully perform tampering detection and location in a JPEG compression scenario. However, there is still a challenge for optimization in the estimation of small rotation angles with a low compression quality factor. Further optimizing the model and improving the estimation of image rotation angle are future directions of this work. In the future, this research can also be combined with many disciplines, such as artificial intelligence, criminal investigation, fault analysis [22,23], and so on.

Author Contributions

Conceptualization, S.D. and Y.Z.; methodology, S.D. and Y.Z.; software, S.D.; validation, S.D. and Y.Z.; resources, S.D. and Y.Z.; writing—original draft preparation, S.D.; writing—review and editing, S.D., Y.Z., W.S., and L.Z.; supervision, Y.Z.; project administration, Y.Z.; funding acquisition, Y.Z. and F.W.

Funding

This work was mainly funded by the Key Project of Science and Technology Commission of Shanghai Municipality (grant no. 18511101600), the Natural Science Foundation of Shanghai (grant no. 17ZR1411900), the Opening Project of Shanghai Key Laboratory of Integrated Administration Technologies for Information Security (grant no. AGK2015006), the Founding Program for the Cultivation of Young University Teachers of Shanghai (grant no. ZZGCD15090), the Research Start-up Foundation of Shanghai University of Engineering Science (grant no. 2016-56), and the Post-Graduation Innovation Project of Shanghai University of Engineering Science (18KY0208).

Conflicts of Interest

The authors declare no conflicts of interest. The funder had no role in the design of the study; in the collection, analyses, or interpretation of data; in the writing of the manuscript, or in the decision to publish the results.

References

  1. Islam, M.M.; Karmakar, G.C.; Kamruzzaman, J.; Mueshed, M. Detecting Splicing and Copy-Move Attacks in Color Images. In Proceedings of the 2018 Digital Image Computing: Techniques and Applications (DICTA), Canberra, Australia, 10–13 December 2018; pp. 1–7. [Google Scholar]
  2. Marra, F.; Poggi, G.; Sansone, C.; Verdoliva, L. Blind PRNU-based Image Clustering for Source Identification. IEEE Trams. Inf. Foren. Sec. 2017, 12, 2197–2211. [Google Scholar] [CrossRef]
  3. Chen, C.L.; Ni, J.Q.; Shen, Z.Y.; Shi, Y.Q. Blind Forensics of Successive Geometric Transformations in Digital Images Using Spectral Method: Theory and Applications. IEEE Trans. Image Process. 2017, 26, 811–2824. [Google Scholar] [CrossRef] [PubMed]
  4. Popescu, A.C.; Farid, H. Exposing digital forgeries by detecting traces of resampling. IEEE Trans. Image Process. 2005, 53, 758–767. [Google Scholar] [CrossRef]
  5. Kirchner, M. Fast and reliable resampling detection by spectral analysis of fixed linear predictor residue. In Proceedings of the Workshop on Multimedia & Security, Oxford, UK, 22–23 September 2008; ACM: New York, NY, USA; pp. 11–20. [Google Scholar]
  6. Mahdian, B.; Saic, S. Blind Authentication Using Periodic Properties of Interpolation. IEEE Trams. Inf. Foren. Sec. 2008, 3, 529–538. [Google Scholar] [CrossRef]
  7. Gallagher, A.C. Detection of linear and cubic interpolation in JPEG compressed images. In Proceedings of the 2nd Canadian Conference on Computer and Robot Vision (CRV’05), Victoria, BC, Canada, 9–11 May 2005; IEEE: Piscataway, NJ, USA; pp. 65–72. [Google Scholar]
  8. Wei, W.M.; Wang, S.Z.; Zhang, X.P.; Tang, Z.J. Estimation of Image Rotation Angle Using Interpolation-Related Spectral Signatures With Application to Blind Detection of Image Forgery. IEEE Trams. Inf. Foren. Sec. 2010, 5, 507–517. [Google Scholar] [CrossRef]
  9. Vazquez-Padin, D.; Mosquera, C.; Fernando, P. Two-dimensional statistical test for the presence of almost cyclostationarity on images. In Proceedings of the International Conference on Image Processing, ICIP 2010, Hong Kong, China, 26–29 September 2010; IEEE: Piscataway, NJ, USA; pp. 1745–1748. [Google Scholar]
  10. Chen, C.L.; Ni, J.Q.; Shen, Z.Y. Effective Estimation of Image Rotation Angle Using Spectral Method. IEEE Signal. Pro. Lett. 2014, 21, 890–894. [Google Scholar]
  11. Vazquez-Padin, D.; Perez-Gonzalez, F.; Comesana-Alfaro, P. A Random Matrix Approach to the Forensic Analysis of Upscaled Images. IEEE T. Inf. Foren. Sec. 2017, 12, 2115–2130. [Google Scholar] [CrossRef]
  12. Nhan, L.; Florent, R. Statistical Detector of Resampled TIFF Images. In Proceedings of the 2018 IEEE International Symposium on Signal Processing and Information Technology (ISSPIT), Louisville, KY, USA, 6–8 December 2018; IEEE: Piscataway, NJ, USA; pp. 331–335. [Google Scholar]
  13. Liu, X.J.; Lu, W.; Huang, T.; Liu, H.M.; Xue, Y.J.; Yeung, Y.L. Scaling factor estimation on JPEG compressed images by cyclostationarity analysis. Multimed. Tools Appl. 2018, 78, 7947–7964. [Google Scholar] [CrossRef]
  14. Liu, X.; Lu, W.; Zhang, Q.; Huang, J.W. Downscaling Factor Estimation on Pre-JPEG Compressed Images. IEEE Trans. Circ. Syst. Vid. 2019, 1. [Google Scholar] [CrossRef]
  15. Qian, Y. A Wavelet Denoising Method Based on Improved Threshold and Autocorrelation. In Proceedings of the 30th Chinese Control and Decision Making Conference (CCDC 2018), Shenyang, China, 9–11 June 2018. [Google Scholar]
  16. Zhang, Y.; He, N.; Zhen, X.; Xin, S. Image Denoising Based on the Wavelet Semi-soft Threshold and Total Variation. In Proceedings of the 2017 International Conference on Vision, Image and Signal Processing (ICVISP), Osaka, Japan, 22–24 September 2017; IEEE: Piscataway, NJ, USA; pp. 55–62. [Google Scholar]
  17. Shen, C.; Wu, A.; Bai, N.F.; Fan, H.H. TWT output signal denoising based on improved wavelet threshold. In Proceedings of the 2017 18th International Vacuum Electronics Conference (IVEC), London, UK, 1 April 2017; pp. 1–2. [Google Scholar]
  18. Khurana, M.; Faujdar, N.; Saraswat, S. Hybrid bucket sort switching internal sorting based on the data inside the bucket. In Proceedings of the 2017 6th International Conference on Reliability, Infocom Technologies and Optimization (Trends and Future Directions) (ICRITO), Noida, India, 1 September 2017; pp. 476–482. [Google Scholar]
  19. Gugale, Y. Super Sort Sorting Algorithm. In Proceedings of the 2018 3rd International Conference for Convergence in Technology (I2CT), Pune, India, 6–8 April 2018; pp. 1–5. [Google Scholar]
  20. Zhang, H.; Sindagi, V.; Patel, V.M. Image De-raining Using a Conditional Generative Adversarial Network. IEEE Trans. Circuits Syst. Video Technol. 2017, 1. [Google Scholar] [CrossRef]
  21. Morales-Cruz, E.; Garcia-Hernandez, J.J. Detection of JPEG compression on bitmap image based on phase spectrum statistical feature. In Proceedings of the 2017 International Conference on Information Society (I-Society), Dublin, Ireland, 1 July 2017; pp. 111–115. [Google Scholar]
  22. Wang, Z.; Zheng, L.; Junyuan, W. Research of novel bearing fault diagnosis method based on improved krill herd algorithm and kernel Extreme Learning Machine. Complexity 2019. [Google Scholar] [CrossRef]
  23. Gao, Y.; Villecco, F.; Li, M.; Song, W.Q. Multi-Scale Permutation Entropy Based on Improved LMD and HMM for Rolling Bearing Diagnosis. Entropy 2017, 19, 176. [Google Scholar] [CrossRef] [Green Version]
Figure 1. The estimation of image rotation angle flow chart after JPEG compression.
Electronics 08 01431 g001
Figure 2. Super sort diagram: (a) data decomposition sketch; (b) data fusion sketch.
Electronics 08 01431 g002
Figure 3. Estimated mean absolute error without compression: (a) estimated mean absolute error comparison with 256 × 256 image blocks; (b) estimated mean absolute error comparison with 128 × 128 image blocks.
Electronics 08 01431 g003
Figure 4. The average error of image rotation angle estimation after JPEG processing with 256 × 256 image block: (a) the average absolute estimation error of quality factor (QF) = 95; (b) the average absolute estimation error of QF = 90; (c) the average absolute estimation error of QF = 85.
Electronics 08 01431 g004
Figure 5. Location results of tampered images with different quality factors for 128 × 128 block size: (a) the original image; (b) the image rotated by 10°; (c) the tampered image; (df) when QF = 95, the positioning result diagram for Vazquez-Padin et al. [9], Chen et al. [3], and the proposed algorithm; (gi) when QF = 90, the positioning result diagram for Vazquez-Padin et al. [9], Chen et al. [3], and the proposed algorithm; (jl) when QF = 85, the positioning result diagram for Vazquez-Padin et al. [9], Chen et al. [3], and the proposed algorithm.
Electronics 08 01431 g005aElectronics 08 01431 g005b
Figure 6. Location results of tampered images when QF = 95: (a) the original image; (b) rotated target image; (c) rotated target by 15° to tamper with the image; (d) rotated target by 20° to tamper with the image; (e) positioning result map under the rotation angle of 15° for the proposed algorithm, Chen et al. [3], and Vazquez-Padin et al. [9]; (f) positioning result map under the rotation angle 20° for the proposed algorithm, Chen et al. [3], and Vazquez-Padin et al. [9].
Electronics 08 01431 g006
Table 1. Angle estimation accuracy of the proposed algorithm, and those by Chen et al. [3] and Vazquez-Padin et al. [9] for a 256 × 256 image block. QF—quality factor. The highest detection accuracy in all algorithms is shown in bold.
θ °QF = 95QF = 90QF = 85
Proposed AlgorithmChen et al. [3]Vazquez-Padin et al. [9]Proposed AlgorithmChen et al. [3]Vazquez-Padin et al. [9]Proposed AlgorithmChen et al. [3]Vazquez-Padin et al. [9]
0.6400.4850.0000.4350.2600.0000.1900.0950.000
0.4500.4700.0000.3400.3000.0000.2000.1750.005
0.3800.4650.0000.3350.2600.0000.1750.1100.000
0.9100.8850.0000.6650.6150.0000.3700.2800.000
0.9100.9150.9100.7750.7250.7000.5300.4650.420
0.8900.8550.0000.6400.6200.0000.3400.2750.000
0.9750.9550.9300.8800.8850.7300.8000.7950.470
0.9250.8900.0000.8450.7050.0000.6500.5650.005
0.9650.9400.9350.8100.7850.7700.6550.5750.540
10°0.9050.8900.8850.7000.6400.6250.4550.3450.300
11°0.9450.9350.9300.7750.7150.6900.5200.4650.425
12°0.9300.9050.8850.7300.6900.6300.4150.3150.280
13°0.9150.8300.6000.6550.5300.4000.3400.2150.140
14°0.9450.9250.9100.7600.7000.6800.5450.3900.345
15°0.9200.9200.9150.7400.7000.6800.5150.4000.380
16°0.9150.9000.9000.7000.6650.6350.4250.4050.345
17°0.9500.9300.9300.7900.7750.7450.5800.5250.470
18°0.9550.9350.9300.7600.6800.6250.5200.3500.265
19°0.9400.9250.9200.7550.7350.7150.5250.4850.395
20°0.9400.9150.8600.7250.5950.5400.4500.2450.299
21°0.9600.9450.9400.8500.7850.7500.6550.5250.485
22°0.9500.9250.9250.7800.7500.6800.5450.4100.360
23°0.9500.9350.9300.7650.7300.6800.5700.4650.390
24°0.9700.9450.9400.8500.8100.8050.6850.5600.480
25°0.9550.9500.9500.8400.8100.4790.6400.5250.485
Table 2. Comparisons of algorithm running time in seconds.
Sorting Methods128 × 128256 × 256
Proposed algorithm0.03430.0360
Chen et al. [3]0.03710.0416
Vazquez-Padin et al. [9]0.03830.0440
Table 3. Comparisons of algorithm synthesis time in seconds.
Sorting Methods128 × 128256 × 256
Proposed algorithm3.020911.4109
Proposed algorithm without super sorting3.083711.8447
Chen et al. [3]2.921911.1977
Vazquez-Padin et al. [9]2.965511.3359

