1. Introduction
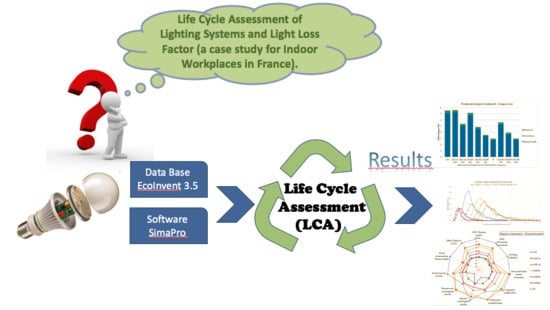
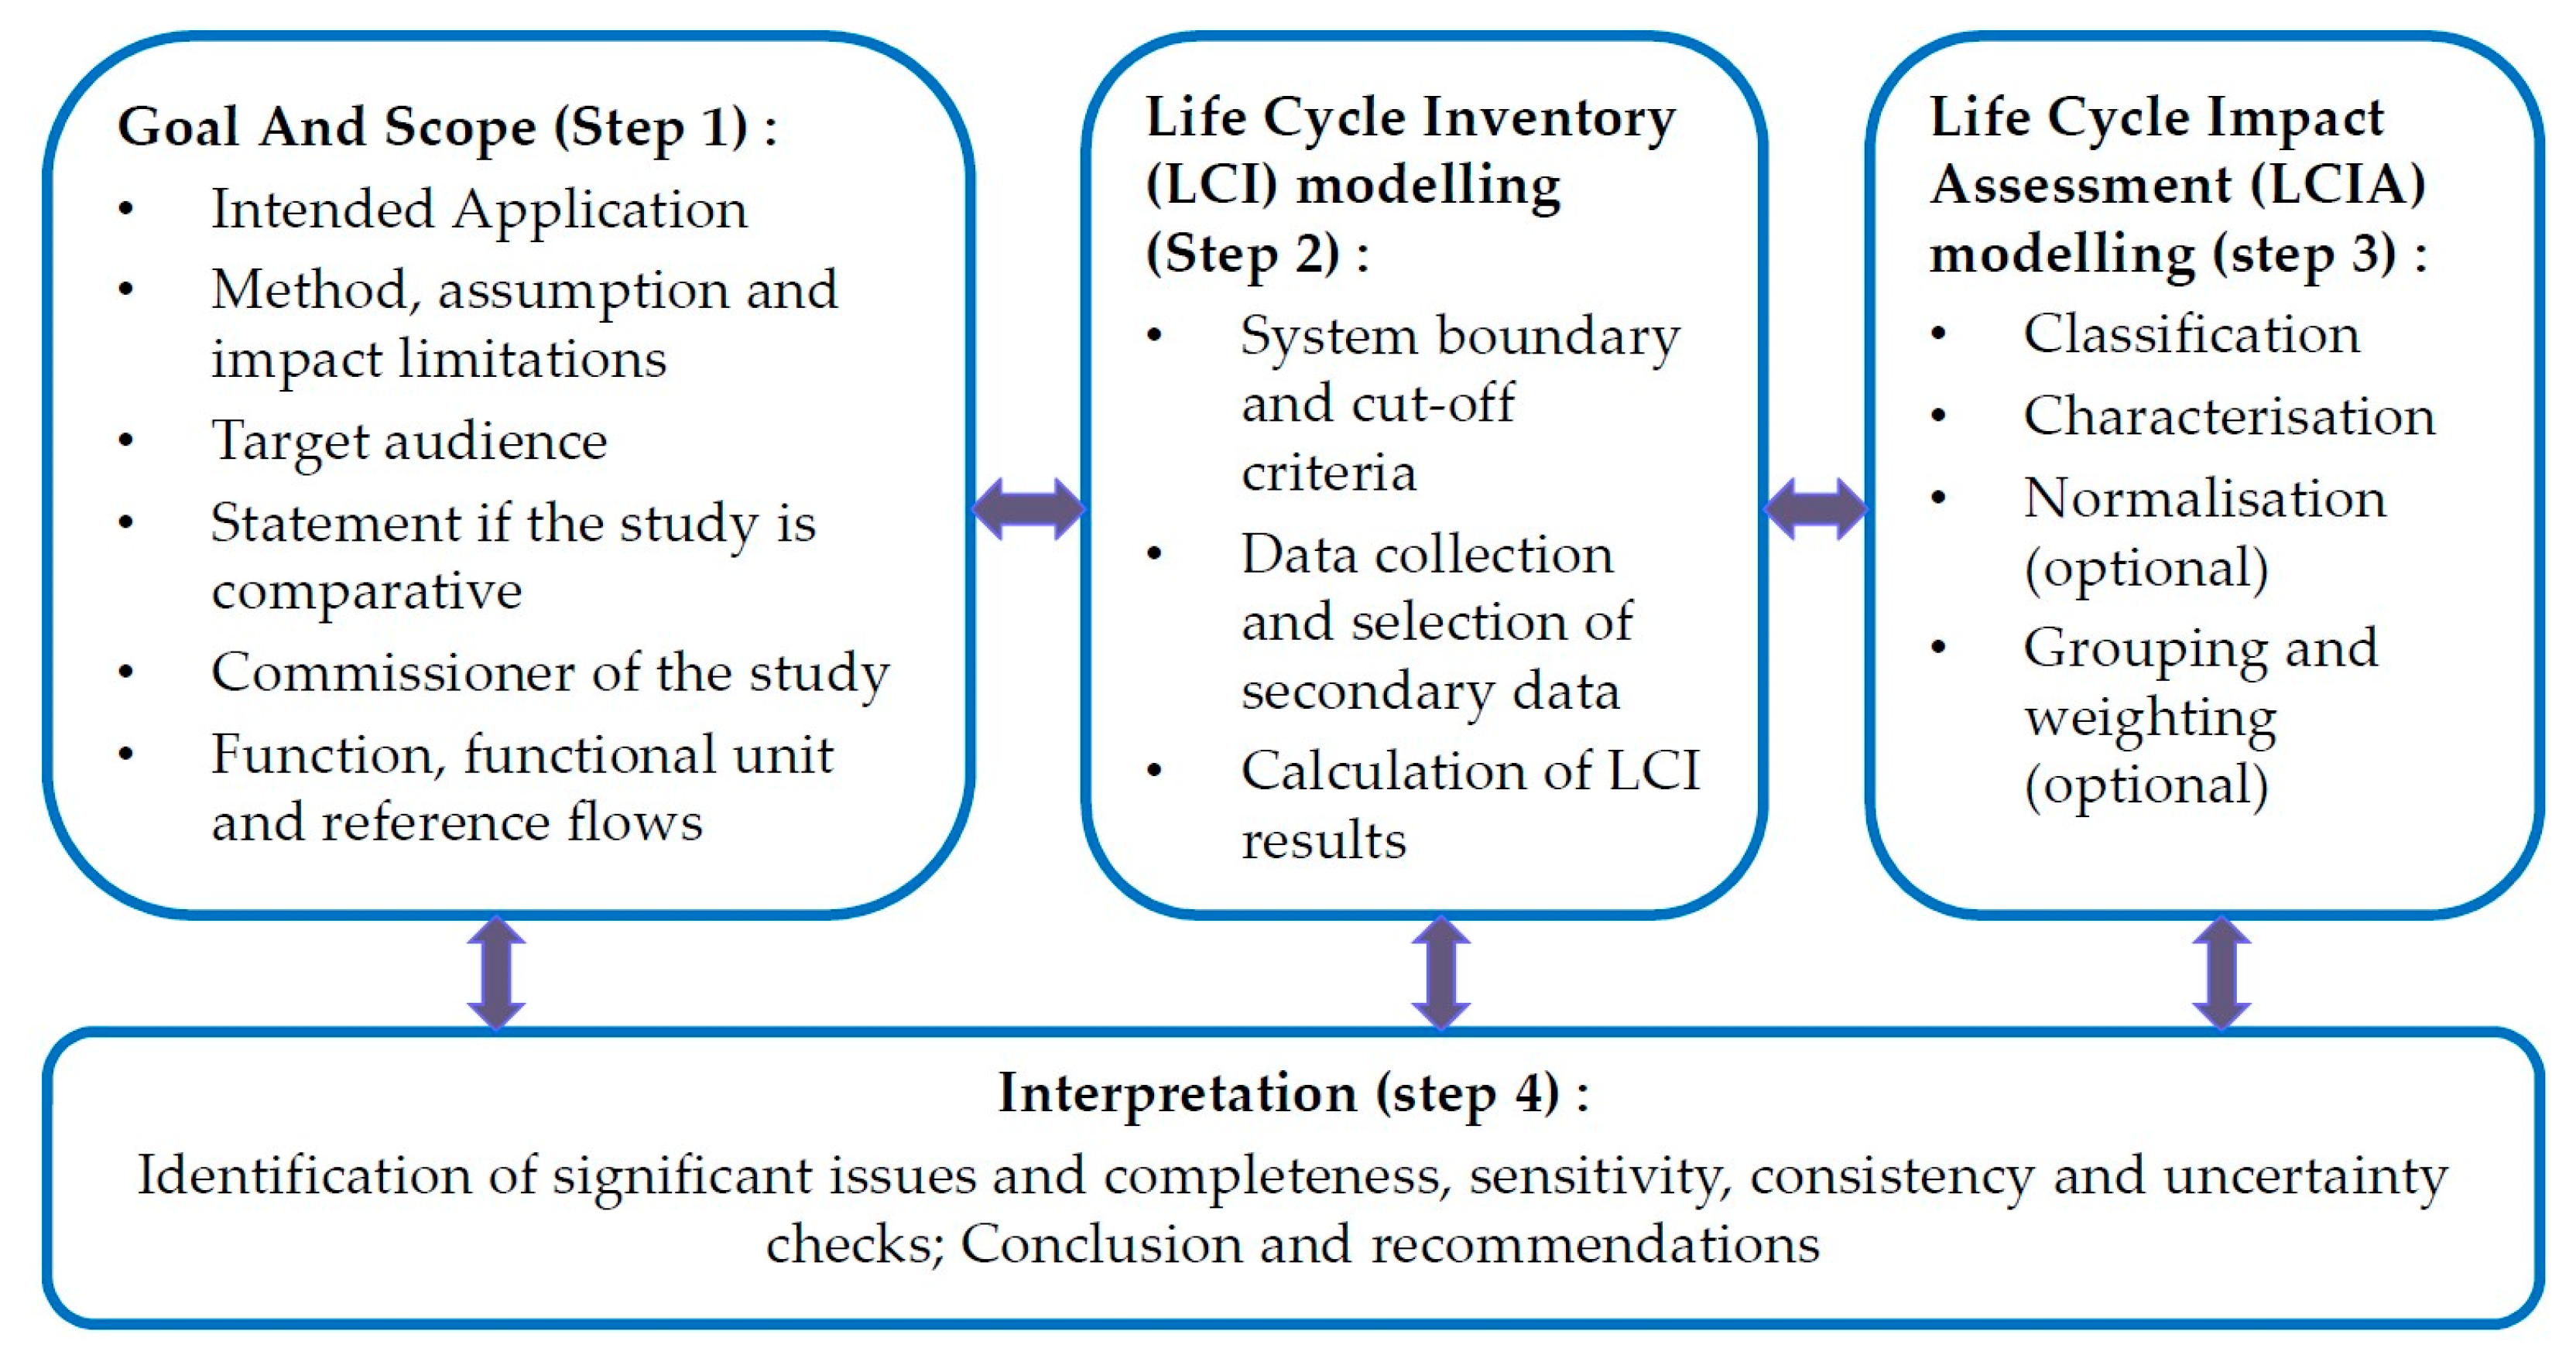
“The increased awareness of the importance of environmental protection, and the possible impacts associated with products, both manufactured and consumed, has increased interest in the development of methods to better understand and address these impacts. One of the techniques being developed for this purpose is life cycle assessment (LCA)” (ISO 14040:2006). LCA is an internationally standardized methodology to identify and evaluate not only greenhouse gas (GHG) emissions, but also the impacts of products and services on the environment and ecosystems including soil, air, and water, as well as the impacts on human health (ISO 14040:2006 [
1] and 14044:2006 [
2]).
“LCA addresses the environmental aspects and potential environmental impacts (e.g., use of resources and the environmental consequences of releases) throughout a product’s life cycle from raw material acquisition through production, use, end-of-life treatment, recycling and final disposal (i.e., cradle-to-grave).” (ISO14040:2006). The flows of materials and energy of each product’s life cycle phase are associated with impact indicators, and allow determining the potential impacts on our environment and health.
Focusing on lighting systems, several comparative or single-case LCAs have been published over the last decades. Manuela Franz and Franz P. Wenzl [
3] present a review of 12 published LCAs of lighting systems. These studies compared the environmental impacts of light-emitting diode (LED) lamps with other lighting systems, especially by assessing the pros and cons of adding electronic components (manufacturing phase) to improve their efficiency and lifetime (use phase). They highlight that different methods, data sources, assumptions, or simplifications lead to different results and interpretations. Therefore, it’s almost impossible to make a general statement on LED environmental performance without defining a precise use case: “
It is recommended […] to conduct comparative LCA of the same lamp technologies. These studies should consider no-name products and premium products, and different applications scenarios” [
3] (e.g., country of use, type of use, product availability in the market, lighting norms of the country, and application scenarios).
It appears that most of these studies have been conducted considering a country of use where electricity is mostly generated by fossil fuel (e.g., the United Kingdom [
4], United States [
5], India [
6], and Italy [
7]). They conclude that the use phase is the most impacting phase along the complete life cycle of LED lamps. The International Energy Agency (2014) states that, on average, 85% of the environmental impact is due to the use phase, while the remaining 15% is shared mainly between manufacturing and end-of-life treatment [
8]. Nevertheless, France presents the singularity of using nuclear plants to generate electricity, and this specific situation has not been studied yet. Wang et al. [
9] compare the LCA of nuclear, wind, and hydropower production, and show that hydropower and nuclear plants are the two least impacting means of producing electricity, followed by wind power. These three energy production processes represent 92.8% of the French electricity mix [
10]. Therefore, using the French mix should reduce significantly the potential impacts of the use phase. Tähkämö et al. [
11] confirm this intuition when they compared European and French electricity mixes. They highlight that when switching from European to French electricity mixes, the use phase share decreases from 93% to 76% of potential impacts for a LED downlight luminaire (62 lm/w efficacy and 25,000-h lifetime). In 2017, the Center for Economic Studies and Research on Energy (CEREN) showed that in French indoor workplaces, only 10% of installed lamps were LED lamps while 80% were fluorescent tube (T5, T8, or T12) [
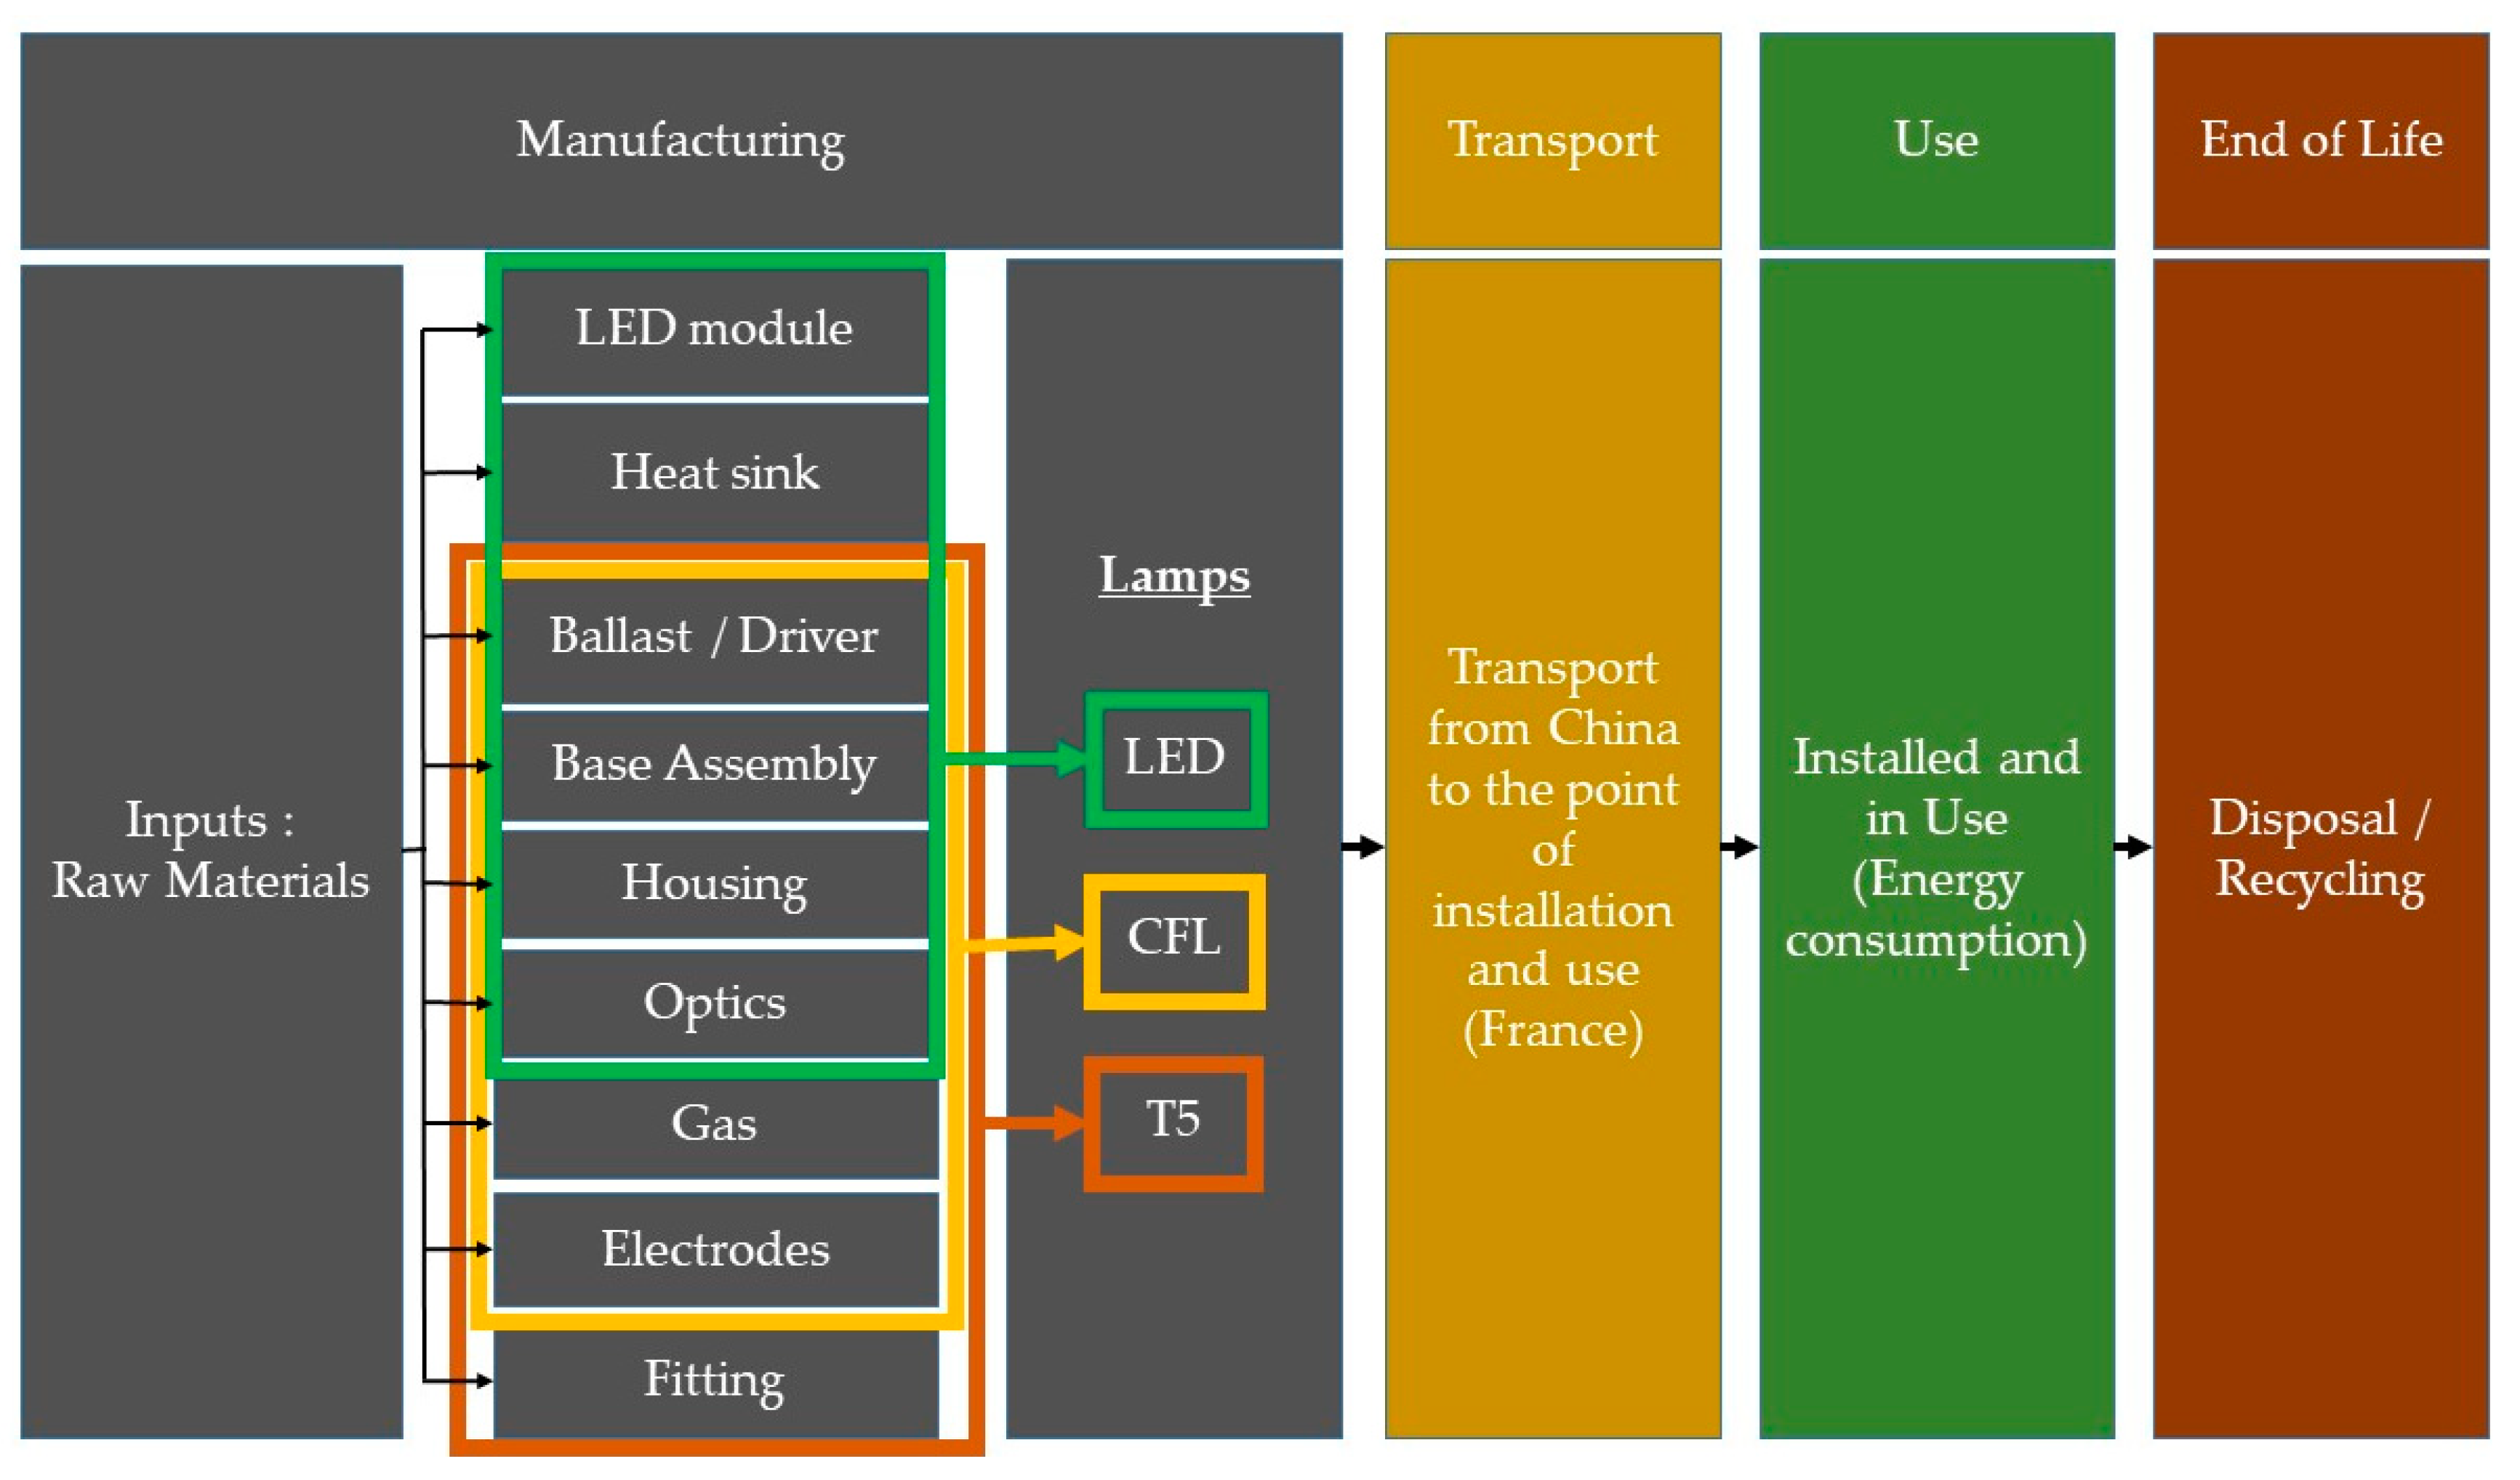
12]. The “T” in lamp nomenclature represents the shape of the lamp tubular. The number following the “T” usually represents the diameter of the lamp in eighths of an inch (1-inch equals 2.5 cm). T5 lamps have a diameter equal to 5 times an eighth of an inch, or 5/8”. Over the next few years, the transition to the most efficient way of lighting will continue, and it’s necessary to establish strategies for lamp replacement. This paper studies further the French singularity in front of recent improvements on LED lamps (efficacy, lifetime, and manufacturing processes) and discusses the consequences of lamp replacement strategies. The following systems commonly used for indoor lighting have been studied: light-emitting diode (LED), compact fluorescent lamp (CFL), and fluorescent tube (T5).
On the other hand, one of the key parameters that guides LCA studies is the functional unit. It is defined as the “
quantified performance of a product system for use as a reference unit” [
1]. A variety of functional units have been used in previous studies: mega lumen hour [
4,
5,
6,
13,
14,
15], hour of light [
13,
16], and lux hour [
7]. The International Energy Agency states that the most coherent functional unit that is applicable to lighting systems is megalumen hour (Mlm-h) [
8]. It consists of equalizing the lumen output during a defined period of time before comparing lamps’ potential environmental impacts. However, LCA studies are generally conducted by considering what a perfect lighting system can potentially achieve (using manufacturer specifications), rather than how it is actually being used and what it actually achieves. Through the classical definition of Mlm-h as the functional unit, some parameters associated to the use phase are not considered:
This can lead to confusion about the actual performance of each lighting system. While we expect a decrease in energy consumption for lighting purposes, a case study in Austria showed an increase of 29% during the period of lighting technology transformation (Franz and Nicolics [
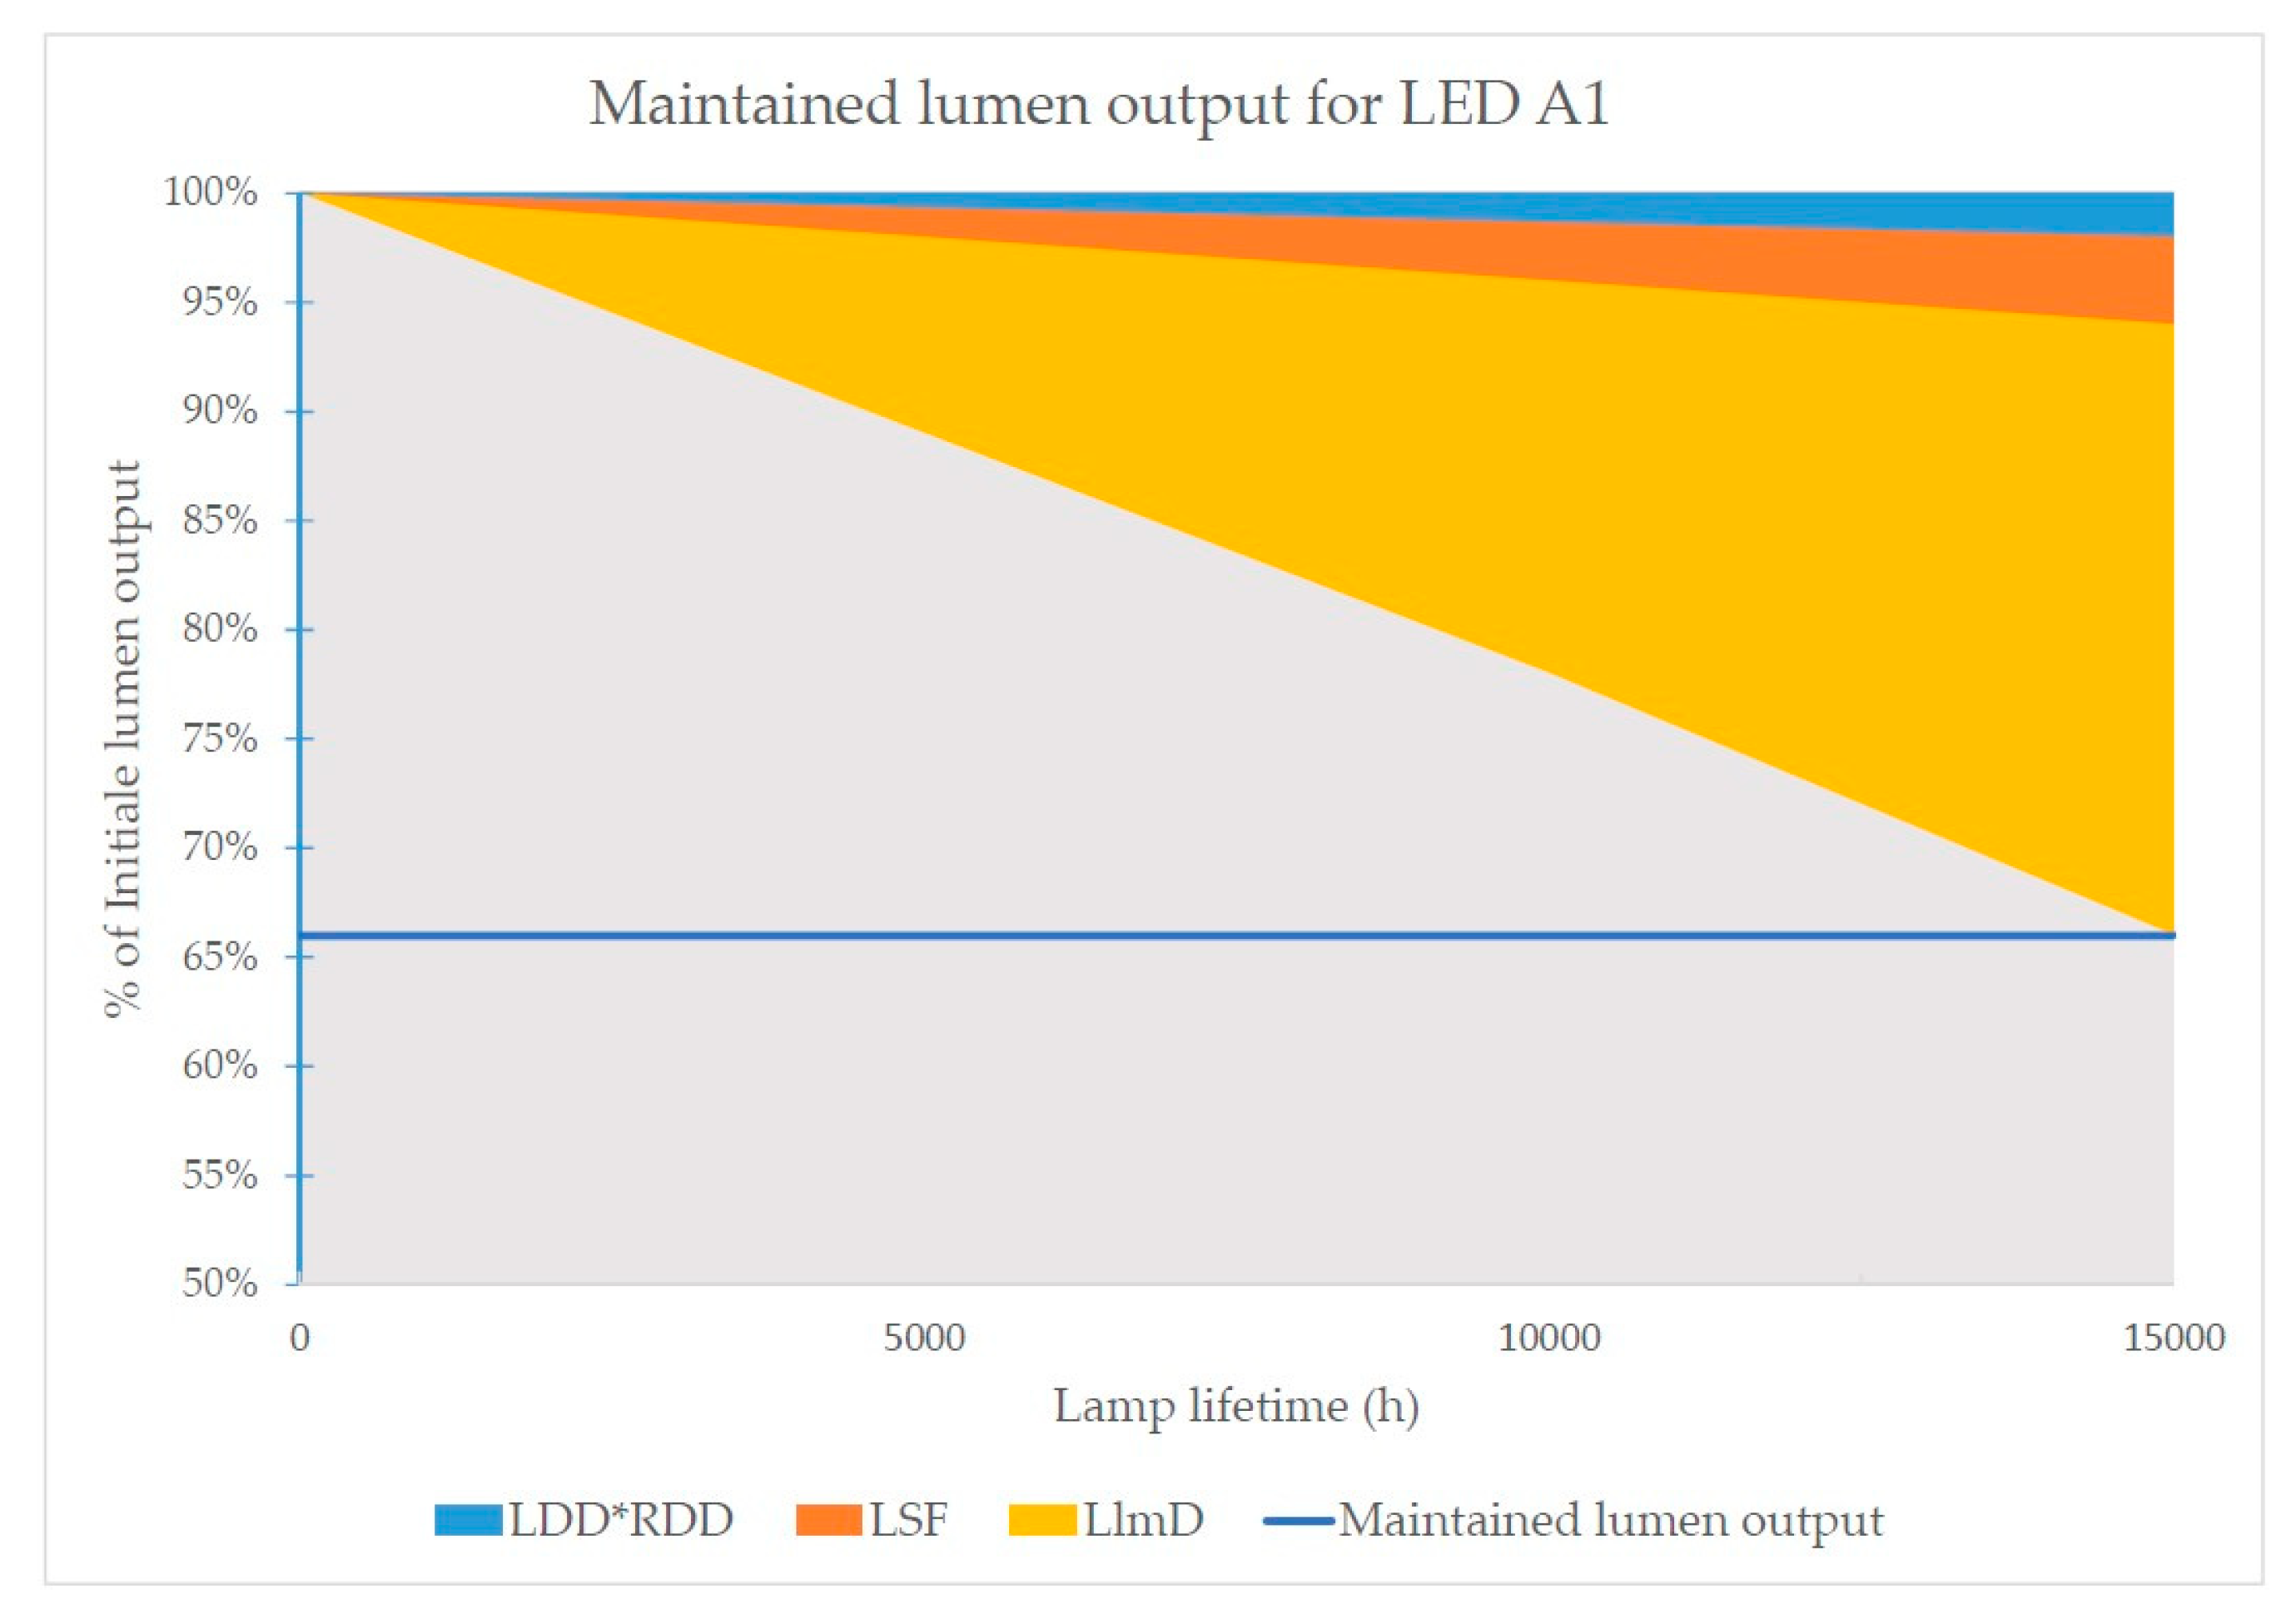
22]). In order to address this issue, a light loss factor has been defined for each lamp. The light loss factor (LLF) combines several parameters such as the room dirt depreciation (RDD), the luminaire dirt depreciation (LDD), the lamp survival factor (LSF), and the lamp lumen depreciation (LlmD) for each system studied at the end of its lifetime [
23]. The light loss factor is used by lighting professionals to size lighting systems in working places, but also to plan maintenance operation [
24]. The light loss factor helps to ensure that businesses comply with standards of lighting equipment for indoor workplaces in France [
25]. These standards define the minimum illuminance that should be maintained in work places, depending on the activity (e.g., 500 lux for data treatment). To verify that this minimum illuminance is respected, the lumen output that can be maintained (maintained lumen output) by each lamp over its respective lifetime has been calculated thanks to the light loss factor.
Finally, this paper contributes to enhance the LCA of lighting systems by considering the real utilization of lamps. The introduction of the light loss factor will facilitate the interaction between the environmental and the economic aspects by using similar parameters to define the use phase. This new approach and the introduction of the maintained megalumen hours (M-Mlmh) as the new functional unit will help to lay the foundation for the life cycle sustainability assessment of lighting systems, as developed by Zimek et al. [
26].
3. Results
3.1. Life Cycle Impact Assessment (LCIA)
The life cycle impact assessment is presented in the following sub-sections from both the midpoint and the endpoint level. When the LED industry proposed new lamps with improved efficacy and/or lifetime, this LCA presents the best strategy for lamp replacement in France when a minimum illuminance is required
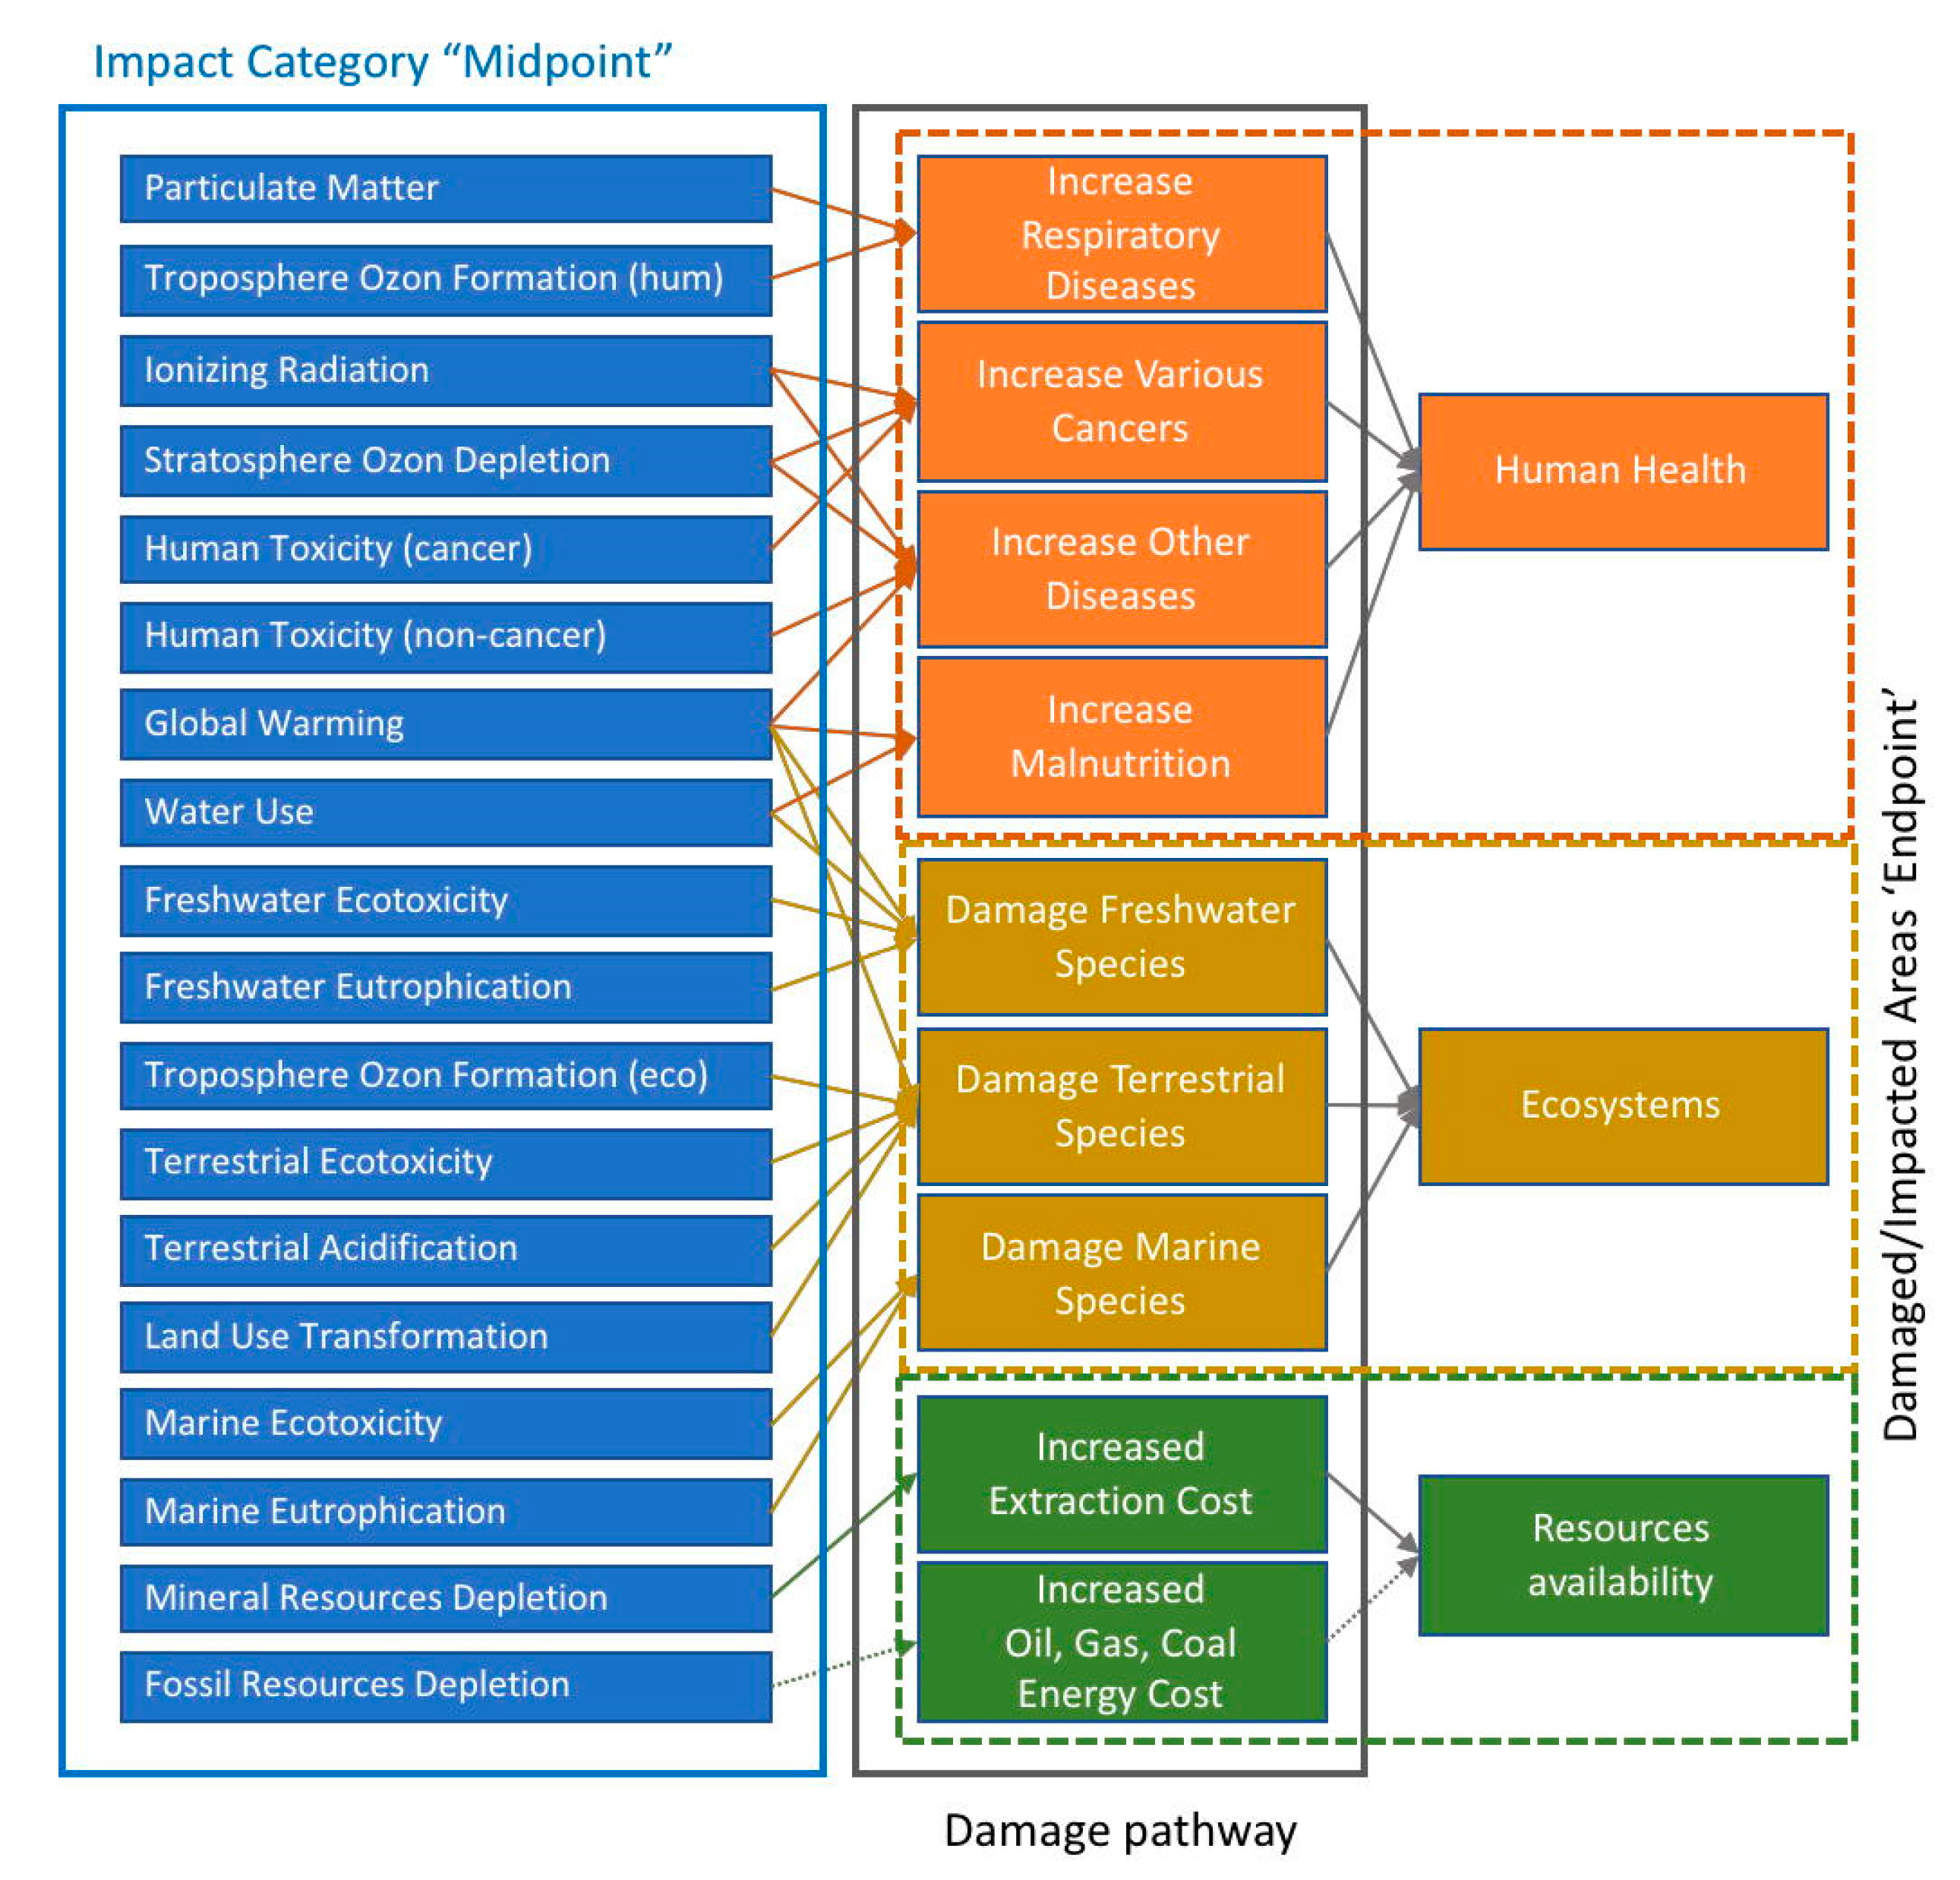
3.1.1. Problem Oriented (Midpoint)
The recipe midpoint characterization evaluates the impacts according to 18 indicators (
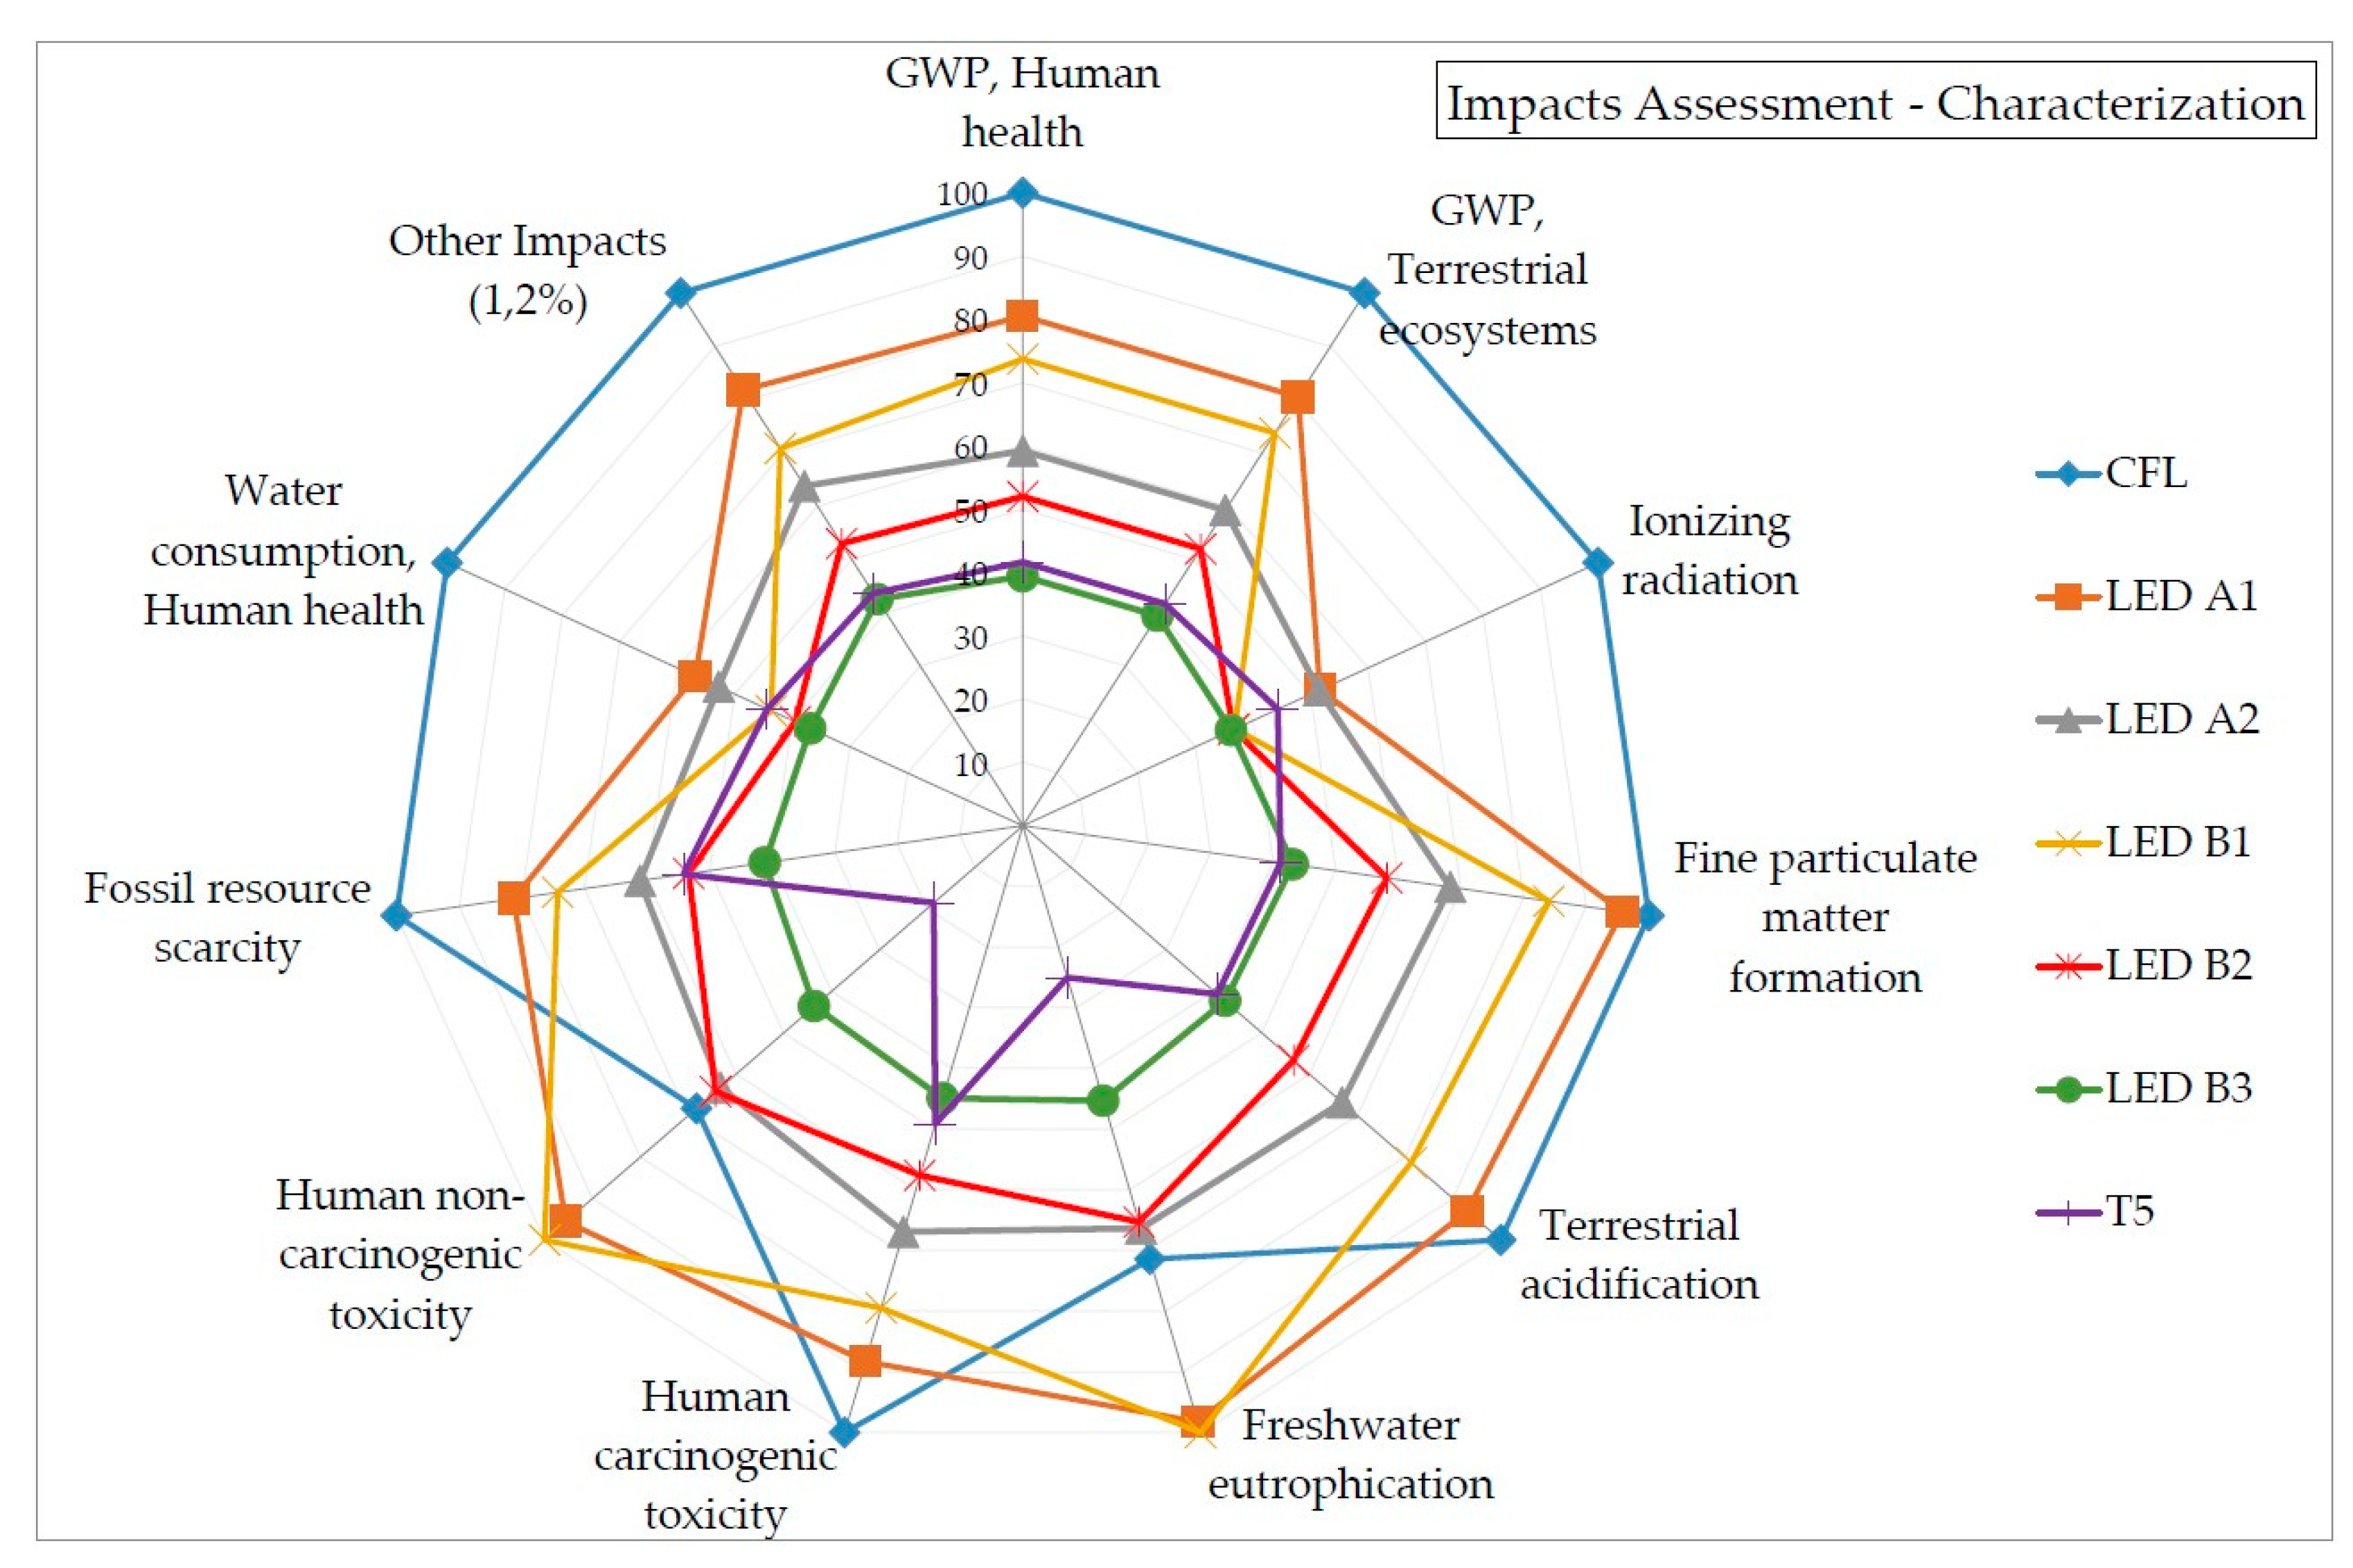
Figure 3). However, each indicator does not contribute equally to the potential impacts. The characterization of the 10 most impacting indicators (98.8% of cumulated impacts) are presented in
Figure 5. For a better understanding and visibility of the results, all remaining indicators are included in the category “Other Impacts” (
Figure 5).
All impacts are normalized compared to the most impacting systems for each indicator. The following statements can be made:
CFL has the lowest impact for nine out of 11 categories, and it appears to be the lowest performing lamp compared to all other systems studied.
LED A1 and LED B1 have very similar scores despite the improved efficacy (from 95 to 134 lm/W) and manufacturing processes for LED B1.
LED A2 has a better score for nine out of 11 categories compared to LED B1, which has a lower efficacy but a longer lifetime (from 15,000 h to 25,000 h).
LED B2 is slightly better than LED A2, but improving the efficacy does not seem to result in matching the reduction in environmental impacts.
LED B3 competes with T5 to be the best lamp (the best for seven out of 11 categories), despite the additional materials from the T5 luminaire.
LED B global power consumption is the lowest (29% lower than LED A, 18% lower than T5 and 64% lower than CFL).
These first statements tend to prove that in order to reduce environmental impacts, switching to a similar product with a longer lifetime (i.e., from LED A1 to A2) is a better strategy than switching to a product with higher efficacy, less power consumption, and a similar maintained lumen output (i.e., from LED A1 to B1).
Table 3 shows the distribution of the potential impact for each life cycle phase.
While the use phase is the most impacting phase of the life cycle for LED lamps in countries where electricity is mostly generated from fossil fuel [
27], in France, the use phase represents only between 20.3% and 40.5% of the potential impacts, depending upon the LED lamp in question. The distribution of impacts is inverted compared to other countries. This can be explained by the lower potential environmental impact generated by French electricity production [
9]. The transport and the end-of-life phases represent between 0.1% and 0.2% of the potential impacts for each lamp.
The reduction of energy consumption and higher efficacy only have an impact on the use phase. However, the use phase has less impact than the manufacturing one. Thus, the reduction of energy consumption does not significantly improve the environmental performance in the case of lamp replacement. Contrarily, a longer lifetime will distribute manufacturing impacts over a longer time period and will consistently reduce the potential impacts of LED products. Nevertheless, reducing global consumption has beneficial effects such as a cost-saving effect and the reduction of the global need in electricity at the country level. These beneficial effects have not been considered in this work.
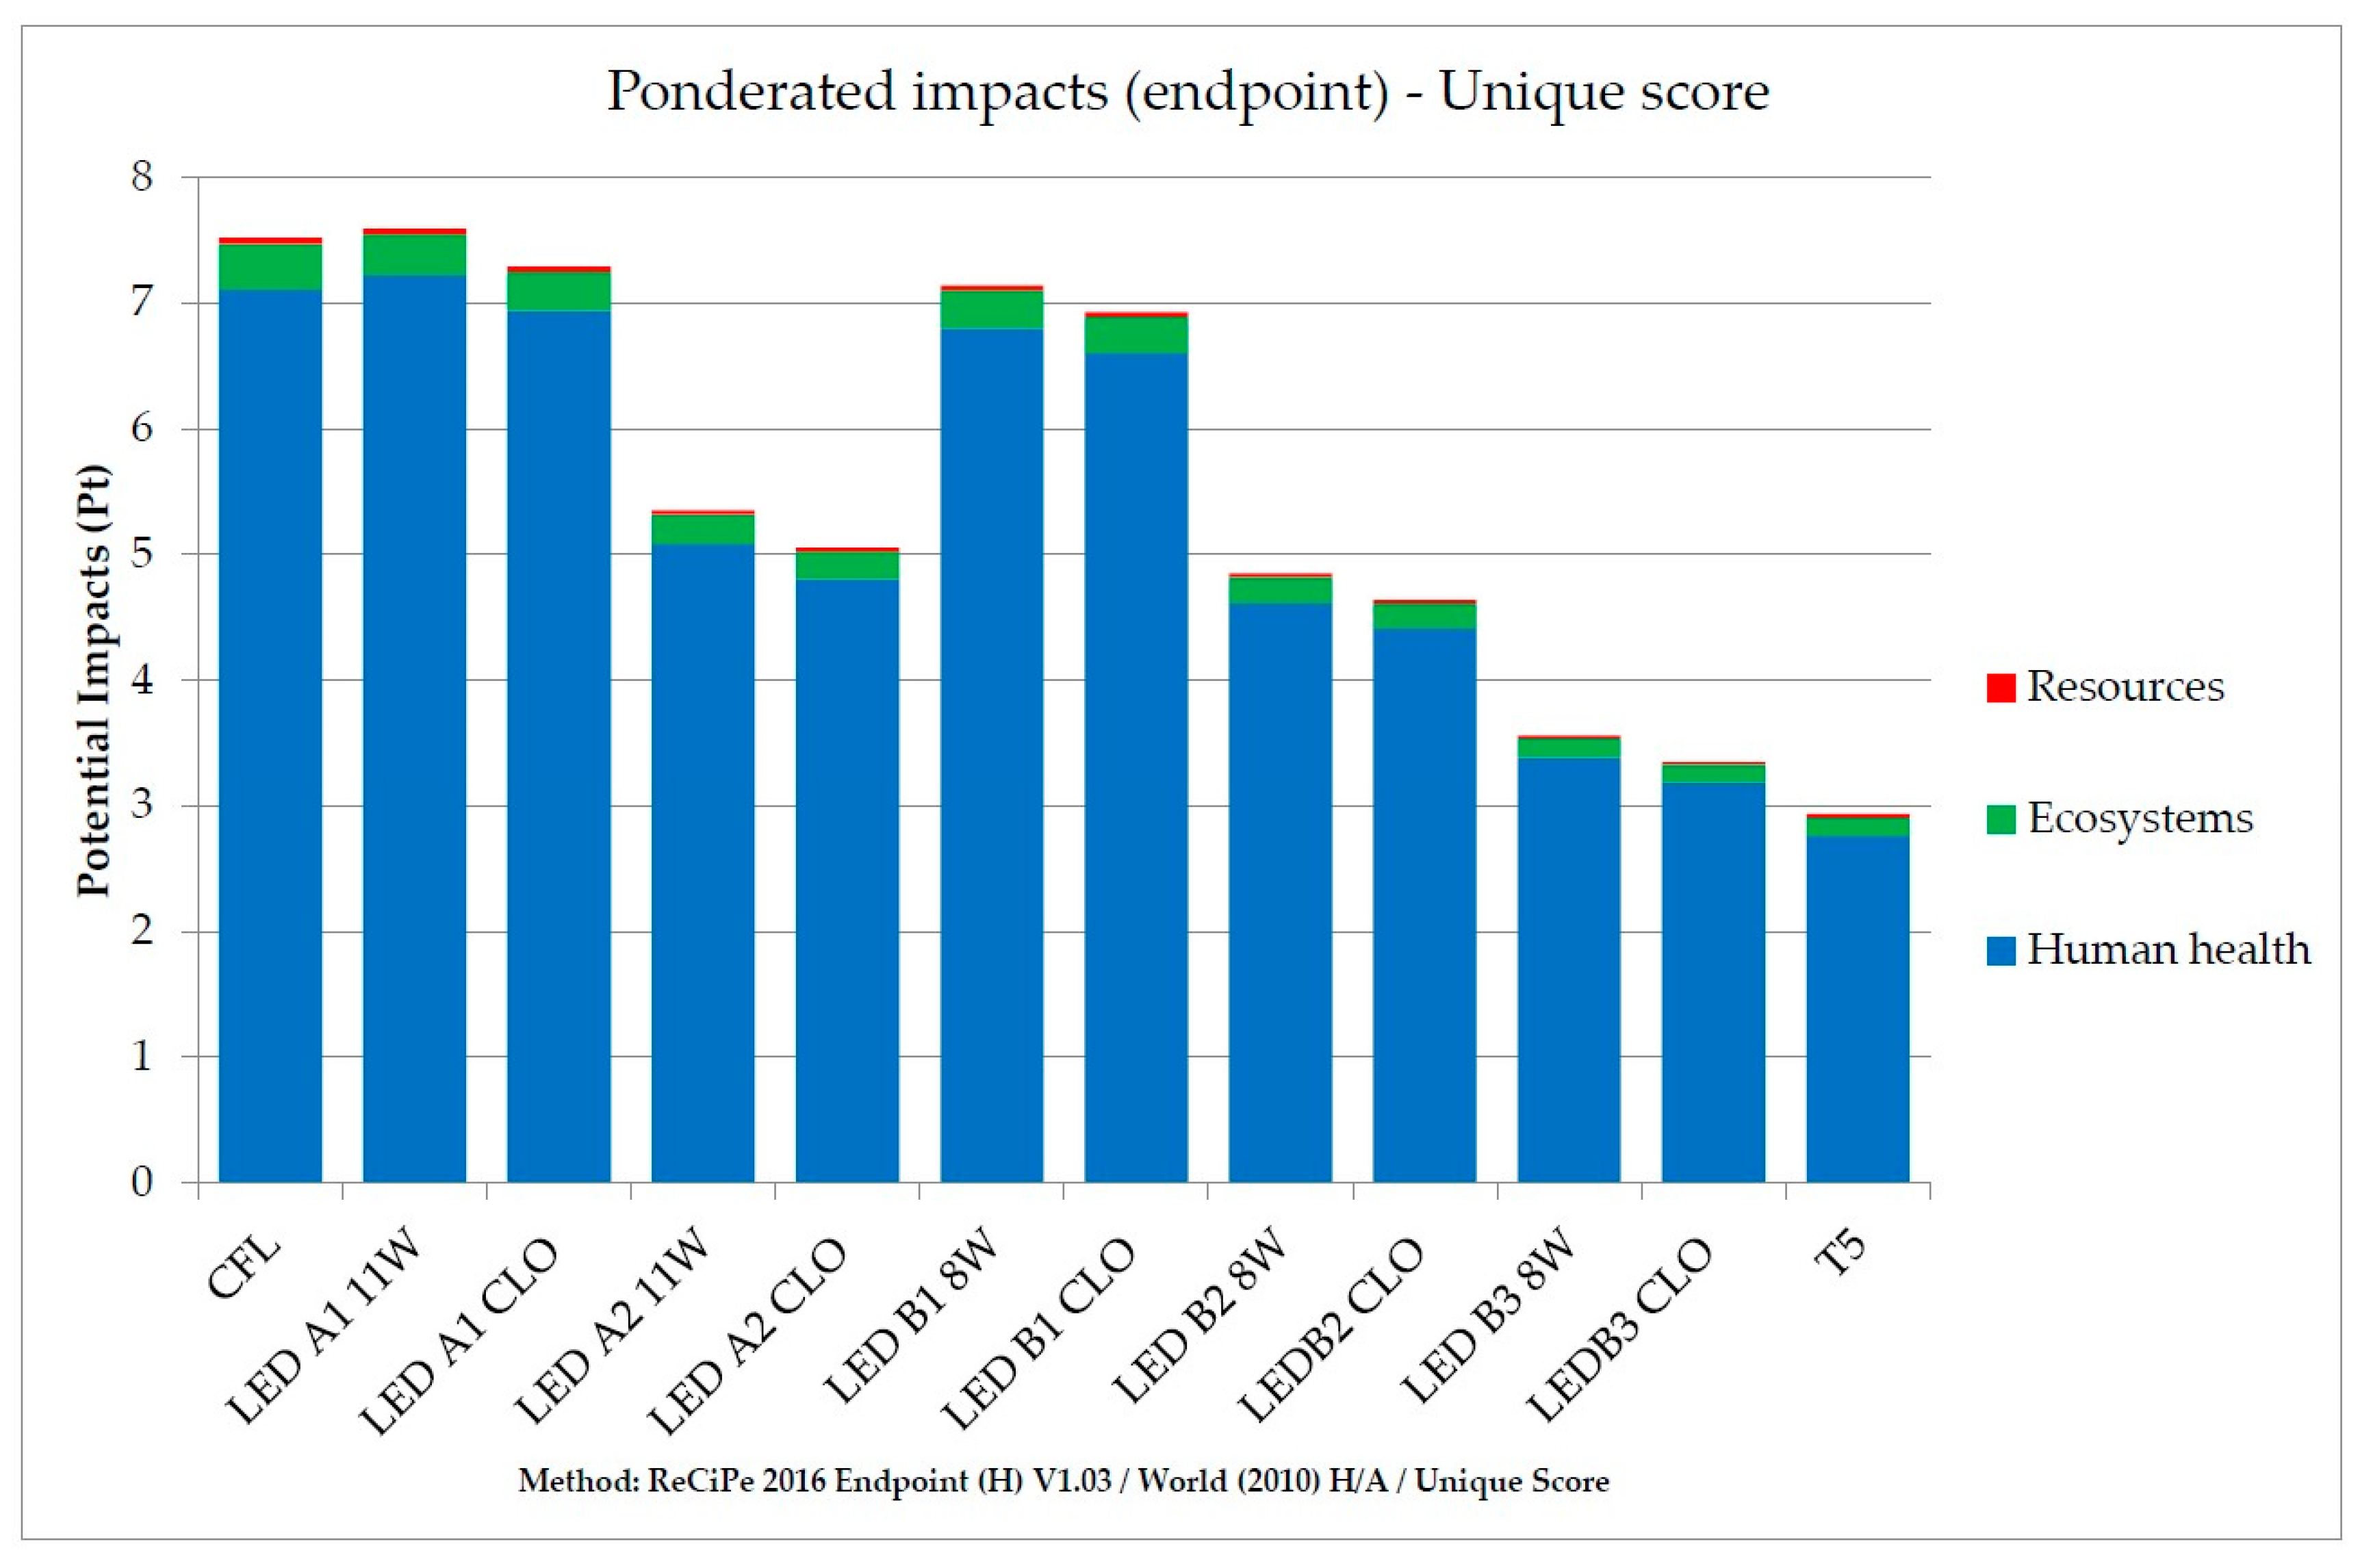
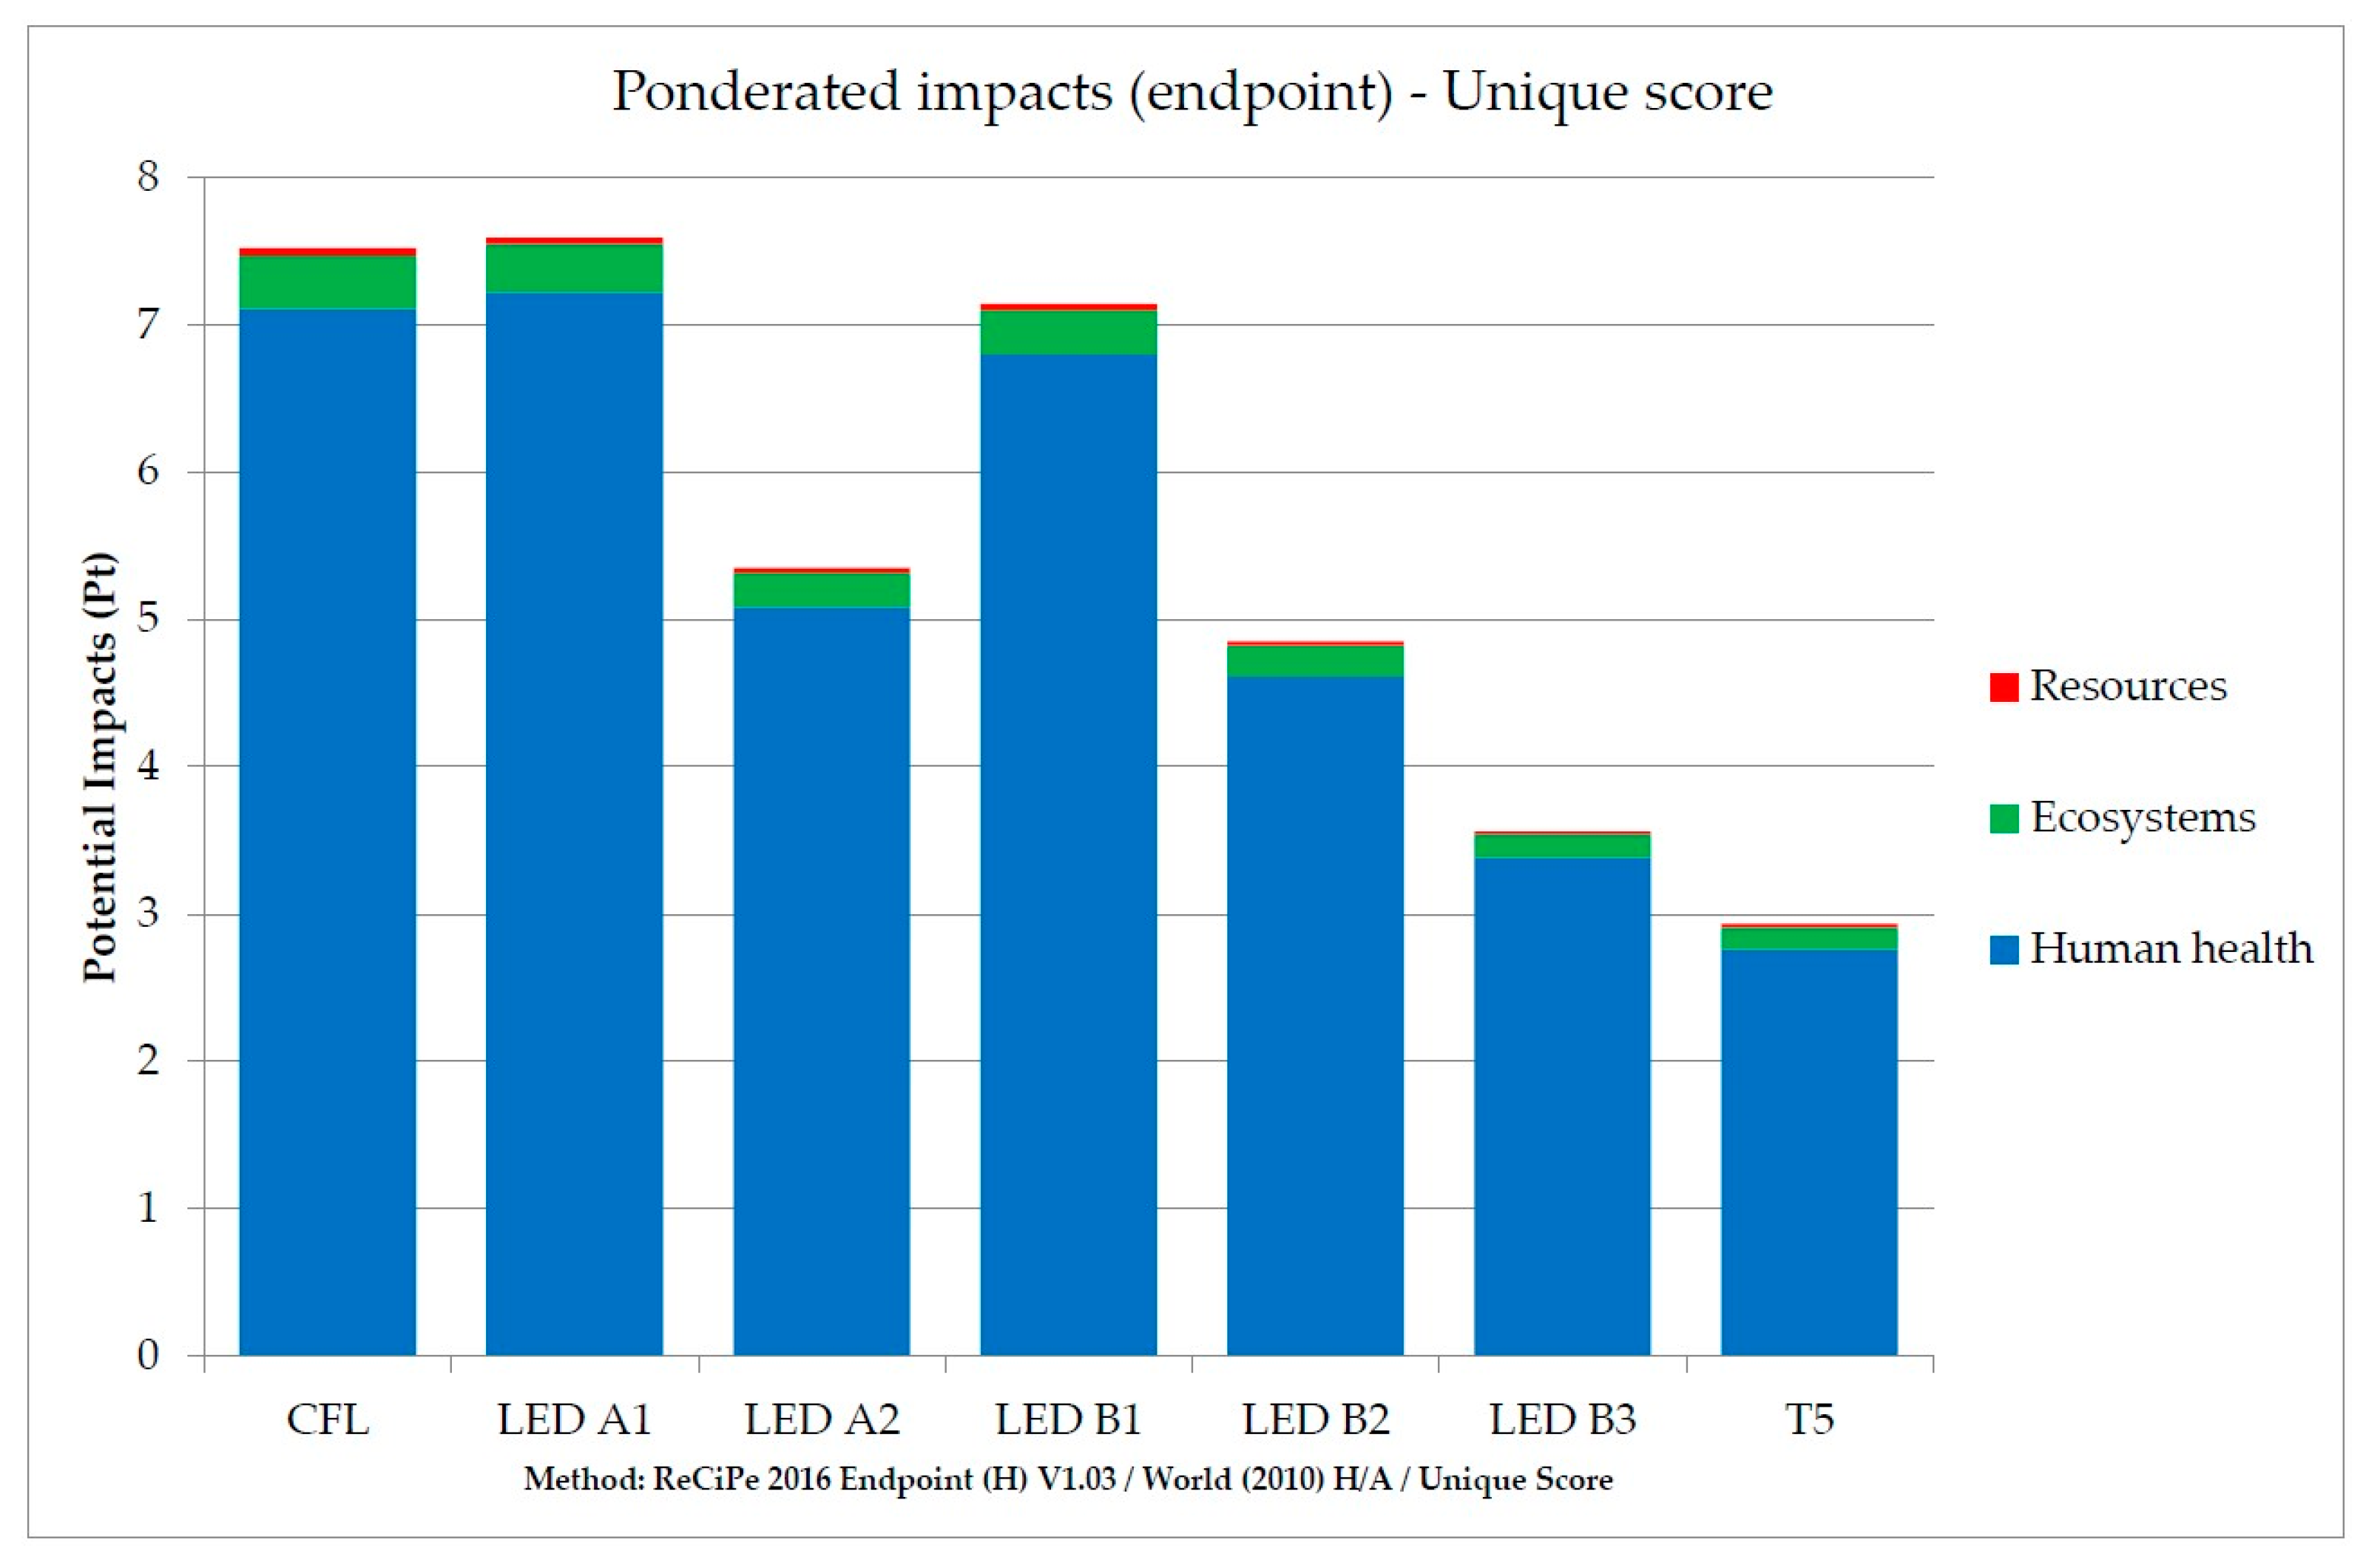
3.1.2. Damage Oriented (Endpoint)
These findings are now compared to the endpoint level, by pondering each category of impacts and grouping them into three damage-oriented categories: Resources, Ecosystems, and Human Health (
Figure 6)
The following statements can be made:
CFL and LED A1 have a similar score.
LED A1 and B1 scores are close, with only a 6.1% improvement by switching to LED B1. The same statement can be made between LED A2 and B2 (a 9.6% improvement).
LED A2′s potential environmental impact is 28.9% and 24.3% lower than that of LED A1 and B1, respectively.
T5 is the best studied system despite LED B3 showing a better performance for seven categories of impacts at the midpoint level.
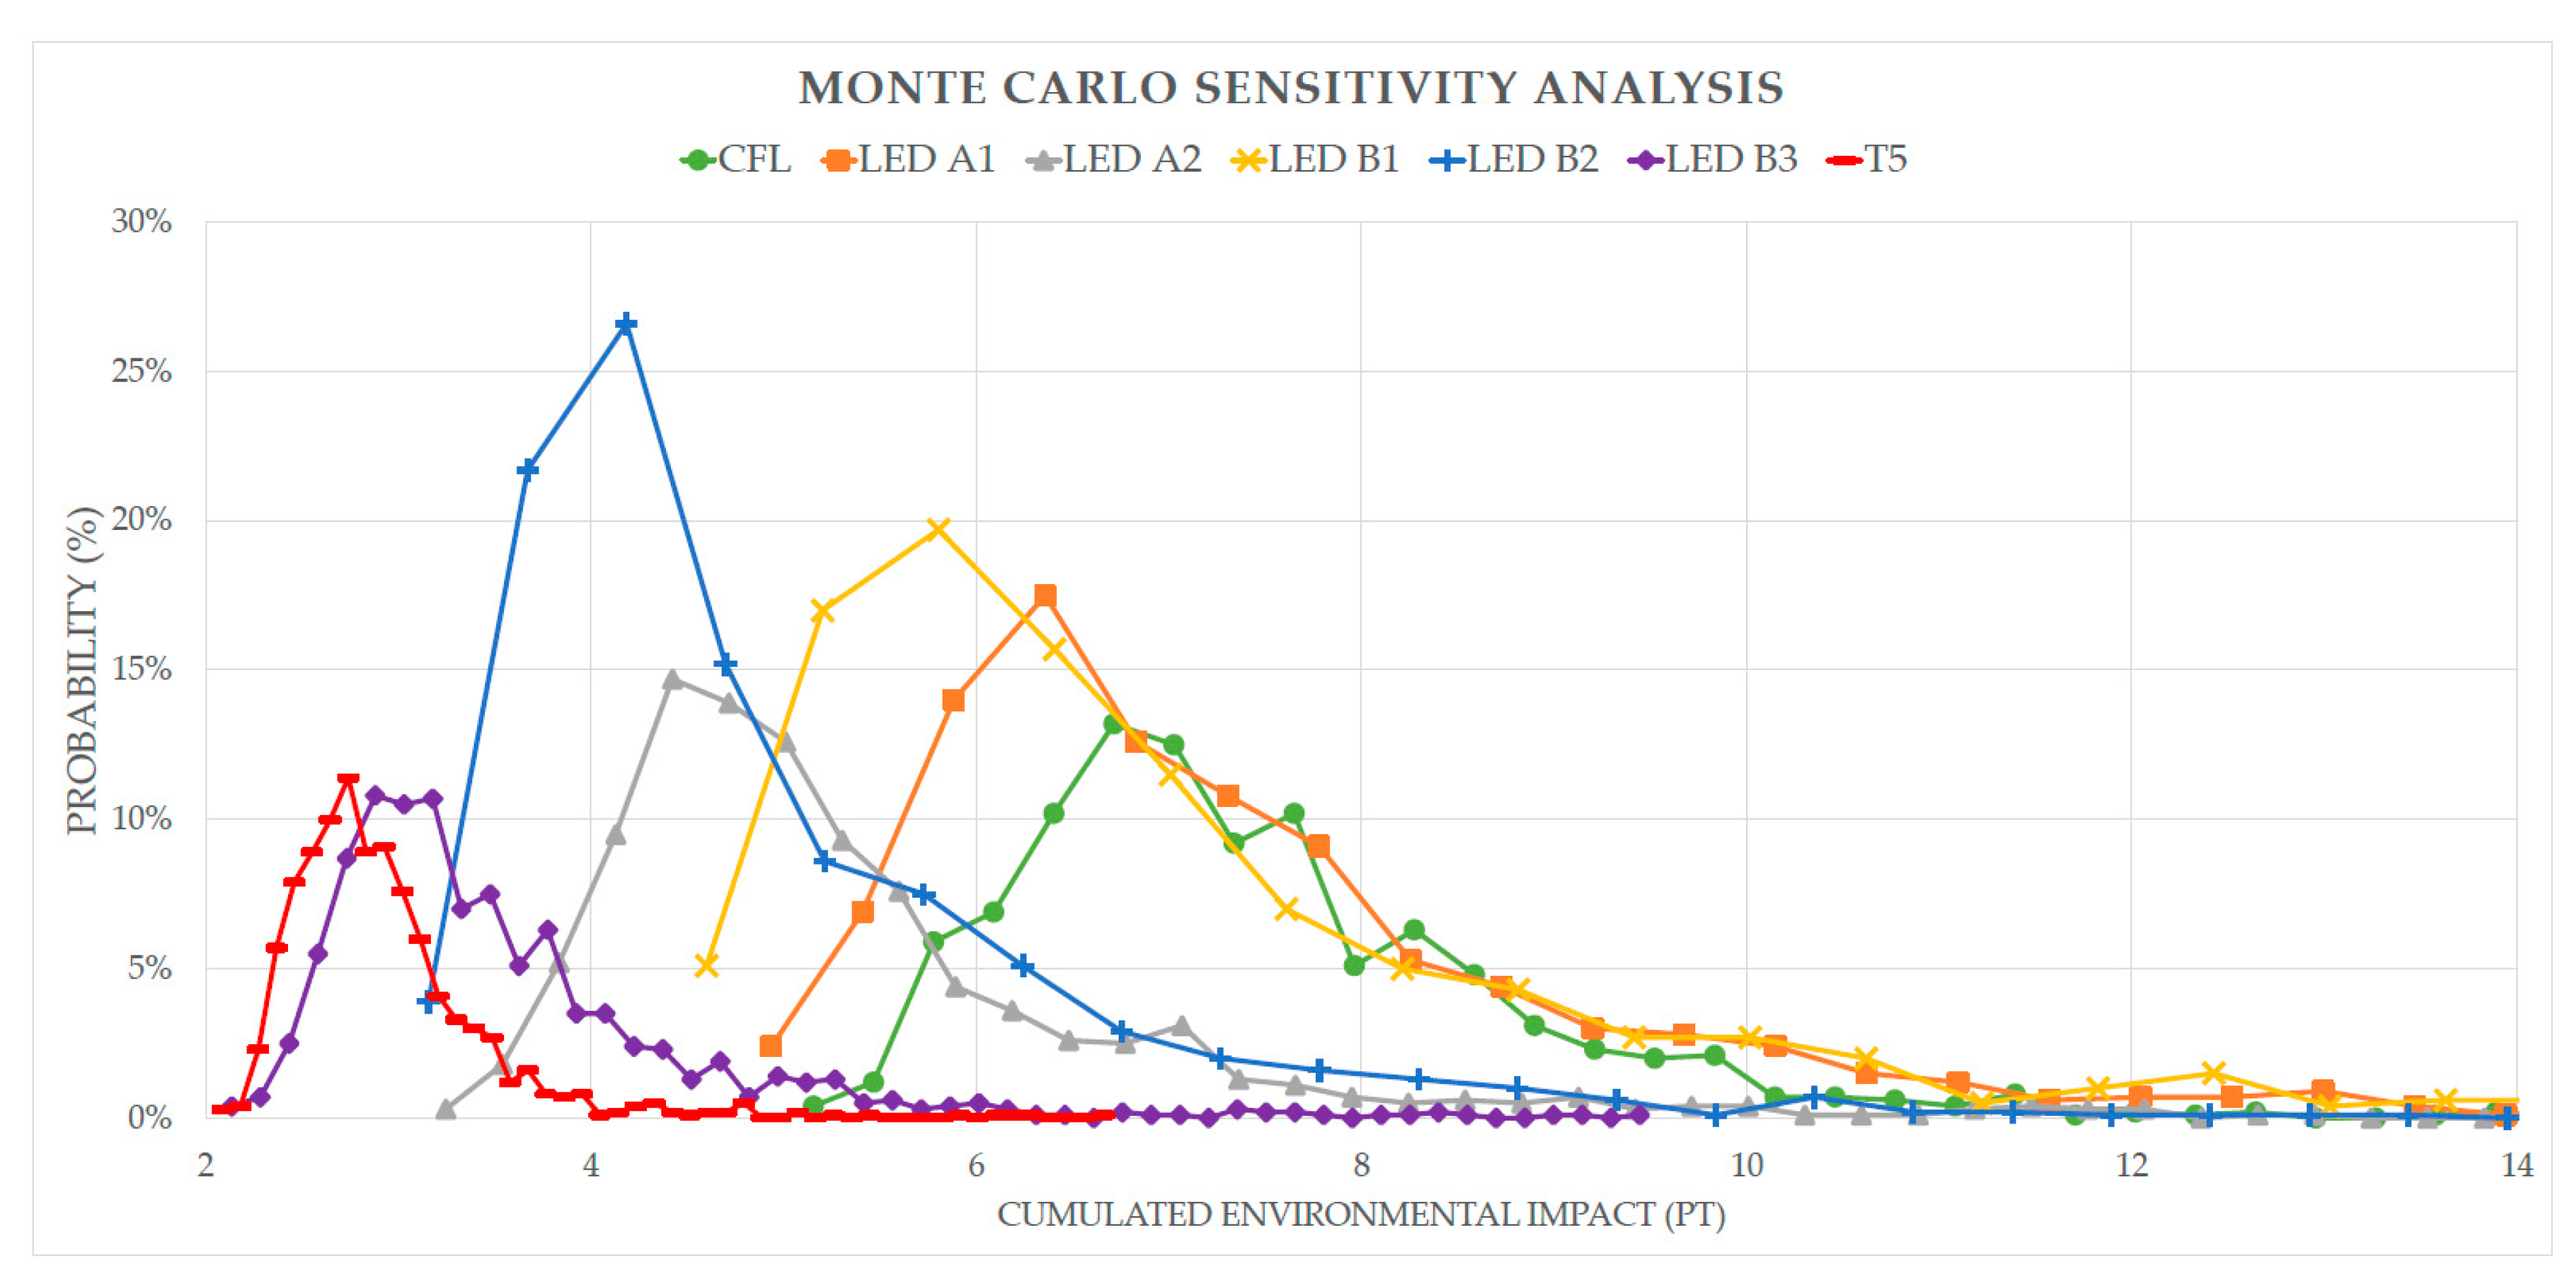
Passing from the midpoint to the endpoint level allows the presentation of assessment in a unique score. However, it induces several uncertainties during the deliberation process. These uncertainties are generated by the variation and stochastic error of the values that describe the exchanges, due to measurement uncertainties, activity specific variations, or temporal variations. When the relevant information to completely describe an activity in detail is unavailable, the average data applied will have a basic uncertainty that reflects the lack of knowledge regarding their precise nature. A Monte Carlo sensitivity analysis has been run to evaluate these uncertainties, and the results are presented in
Figure 7. For each lamp, the model has been executed 1000 times.
Globally, the endpoint level analysis confirms previous statements made at the midpoint level, except for the highest and lowest performing systems. At the endpoint level, CFL and LED A1 are the lowest performing systems, while LED A1 is performing better both at the midpoint level and during the sensitivity analysis. Finally, it is difficult to determine which lamp has a better performance between the LED A1 and the CFL lamp. While comparing the performances of the two LEDs with a 15,000 h lifetime (A1 and B1) to the CFL, there isn’t a significant improvement, and a life cycle cost analysis would help to determine which system should be preferred.
The sensitivity analysis and the endpoint level confirm that improving the lifetime of an LED lamp has a greater effect on potential environmental impacts than improving the efficacy: LED A2 and B2 with 25,000 h lifetime have significantly less impacts respectively than LED A1 and B1 with 15,000 h lifetime. Furthermore, the LED A2 and B2 performances remain similar, despite a better efficacy for LED B2. It is difficult to conclude which system should be preferred, even if LED B2 presents fewer uncertainties than LED A2.
Finally, it is difficult to make a statement when comparing T5 and LED B3. Despite LED B3 having a better performance in seven out of 11 categories, the endpoint level reveals T5 as the best system, and the sensitivity analysis shows fewer uncertainties and standard deviation for the T5 lamp. However, the potential impacts are close, and LED bulbs with a 40,000-h lifetime may compete with T5 in the future.
3.2. Impacts of Constant Lighting Output (CLO)
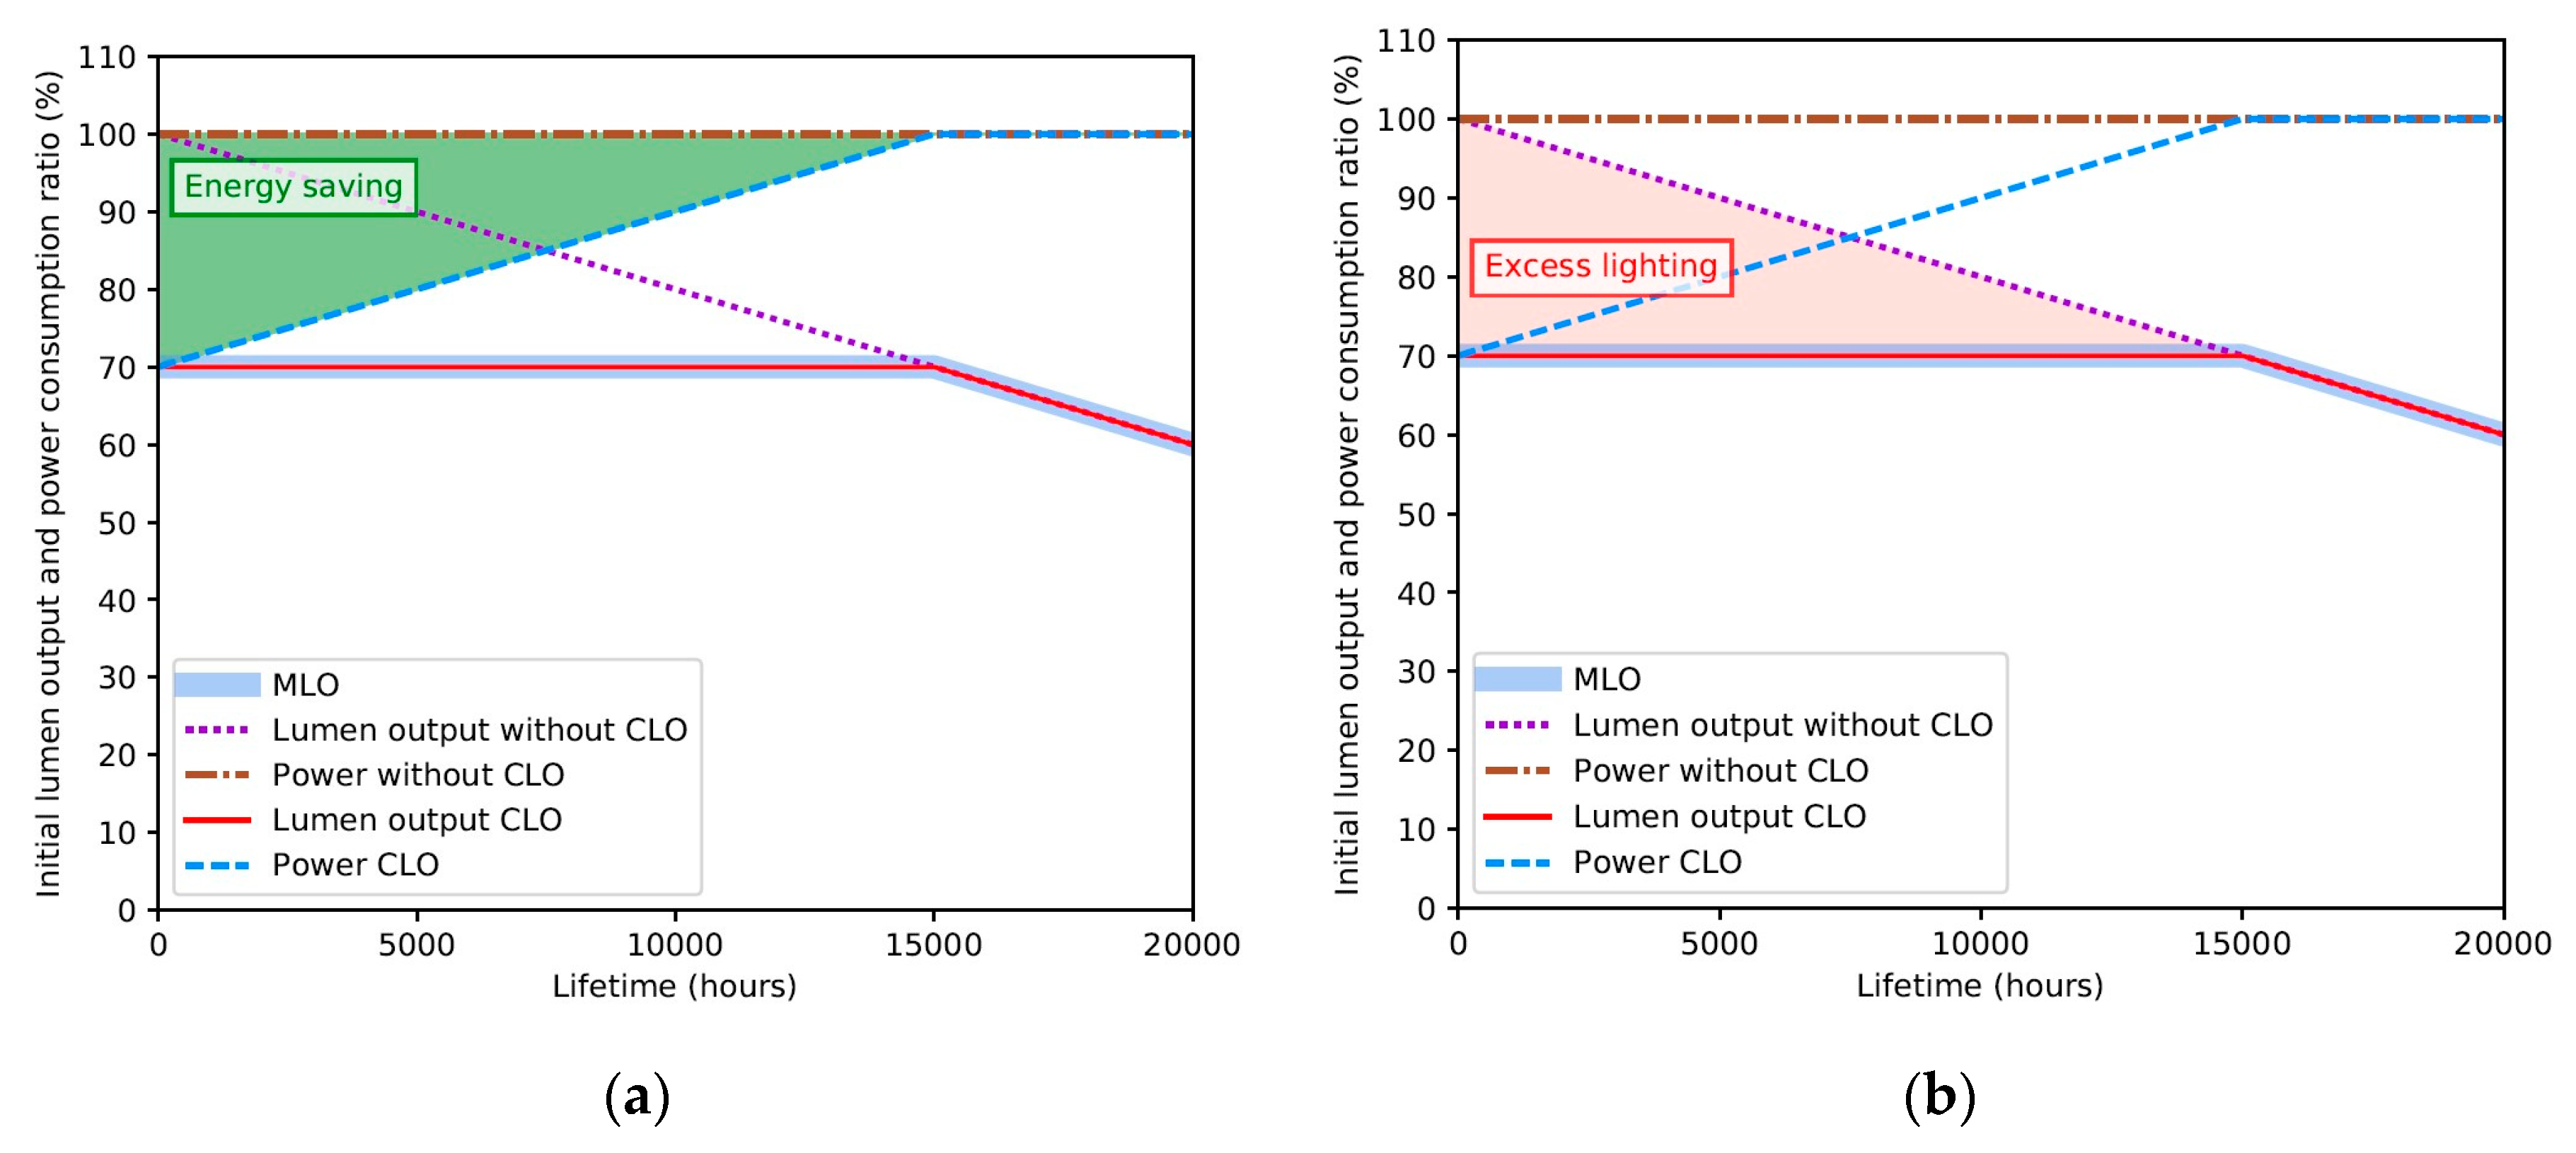
CLO is a function that is available for several products. This solution is gaining popularity among lighting professionals due to its ability to save energy while keeping a constant lumen output during the whole lifetime of LED lamps. For an L70 LED lamp, CLO compensates for lumen depreciation by monitoring the power consumption. The power supply is adjusted to 70% at the beginning of the lamp service, and will increase to 100% at the end of lifetime. Lumen output is maintained at a constant level of 70% of the initial value during its complete lifetime. Compared to LEDs without CLO, CLO maintains the same lumen output with a global 15% reduction of energy consumption over the lamp lifetime (
Figure 8).
To evaluate the performance of such a solution, we need to evaluate the increase in electronic components required for CLO. However, there is no detail about these extra materials. From a life cycle inventory point of view, we only applied a reduction of the global power consumption of 15% (
Table 4), while keeping the inventories the same. Instead of estimating the amount of added materials, we have evaluated the maximum possible increase of the manufacturing phase that will be compensated by energy saving.
Endpoint LCIA results are presented in
Figure 9.
When switching to a similar LED with CLO, endpoint indicators globally show only a low environmental improvement. The relative reduction of potential impacts induced by energy saving, when using for CLO lamps, are presented in
Table 5. This reduction is compared to the allowed increased of manufacturing impacts. This value represents the threshold of the relative increase in manufacturing impacts to not exceed in order to ensure that the impacts of added materials will be compensated by energy saving.
Table 5 shows that the additional materials and components required should not generate an increase of manufacturing phase impacts higher than 5.4% for LED A1. The higher the lifetime of the lamp, the higher the potential impact reduction generated by CLO lamps, and the higher the amount of extra materials that could be added. A more precise inventory of the additional materials and components required should be conducted to ensure that CLO will not lead to an increase of potential impacts. The benefits of adding electronic components to reduce energy consumption are mitigated by the specific electricity mix in France.
Nevertheless, even if the potential impacts of lighting are only marginally reduced, lowering energy consumption should remain part of the main goal. Providing the same illuminance with less energy shows cost-reduction effects as well as a reduction of the global need of electricity production at the country level.
Moreover, the positive impacts of having a constant lumen output in people’s perception, comfort, and well-being are not taken into account, and will be investigated in further studies. A long life product may be replaced before it reaches its end of useful life for several reasons: the premises reach their end of life or are refurbished, the product becomes obsolete or out of fashion, or a new generation of products provides greater energy saving [
8]. Another reason is that lumen depreciation and misdefining the maintained lumen output could incite people to under-use LED lamps: users would tend to replace their LED lamps when they notice a decrease in illumination below their expectation. While this behavior can be seen as normal, the problem lies in the fact that the moment when users change their lamps doesn’t necessarily coincide with the theoretical end of life (L70, i.e., needed time for lumen output to decrease to 70% of its initial value [
18,
19]). CLO helps to mitigate this behavior by indicating more precisely when the rated lifetime of an LED is attained (i.e., when the lumen depreciation will be actually visible), and could ensure an optimal usage of LEDs
Finally, even if LCA show only a few improvements when using CLO, some beneficial social and economic effects have not been considered, and will be investigated at a later time to evaluate the relevance of this solution, especially regarding the impact induced by adding electronic components.
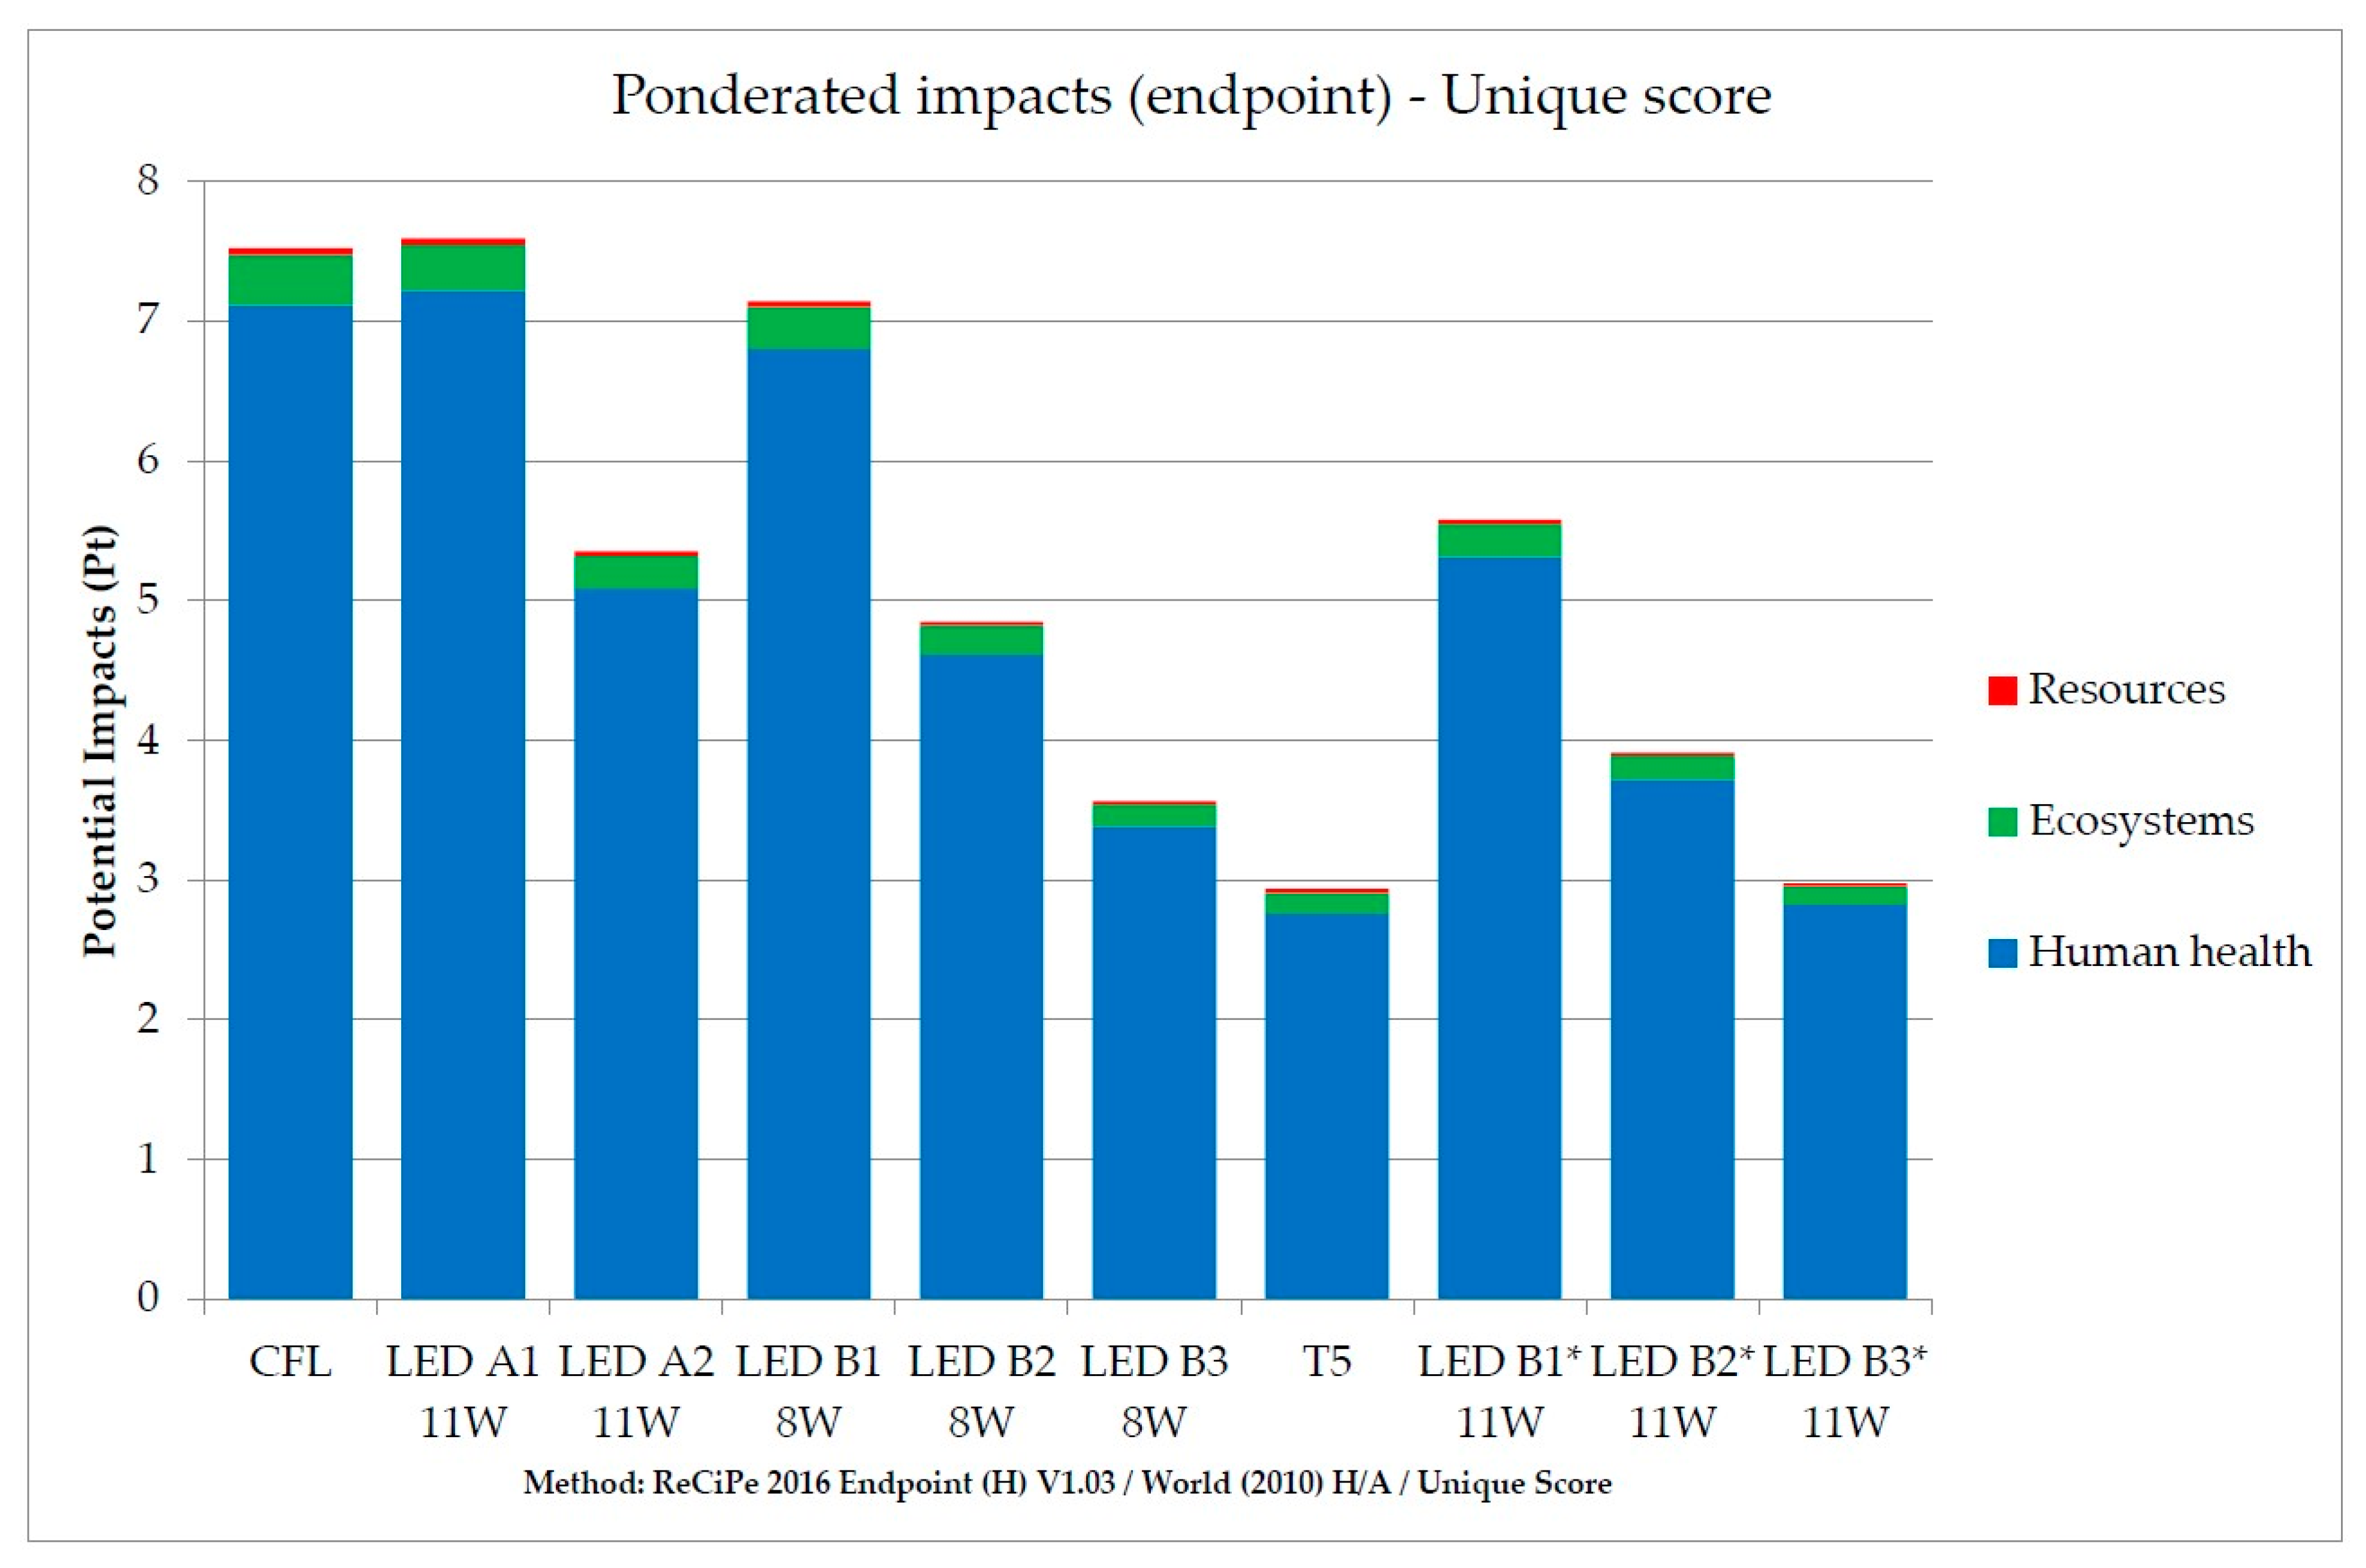
3.3. New Buildings and Refurbishment Scenario
In the case of new buildings or refurbishment, there is no longer any logic of lamp replacement. This scenario gives the opportunity to install new lighting systems without being limited by the previous installation (case of lamp replacement). Therefore, we can compare lamps with different maintained lumen output because they are still able to perform the same function (i.e., maintaining a defined lumen output over its lifetime). If they are well placed, two lamps with 1500 lumen can potentially deliver the same illuminance as three lamps with 1000 lumen. This will only cause a change in the number and types of luminaires. LED B 11W has been added to the study to evaluate this possibility (
Table 6).
When switching from LED B 8 W to a respective LED B 11 W, each lamp uses more energy individually, while the global energy consumption remains the same (394.5 kWh). Only the reference flow is lowered, as fewer lamps are needed. The LCIA results are presented in
Figure 10.
At constant efficacy, LEDs with higher power consumption (11 W) perform better than LEDs with lower power consumption (8 W) because they are able to provide the same luminous ambiance using fewer lamps. This led to a major reduction of the manufacturing phase contribution to the environmental impacts, and logically to a consistent improvement of the potential impacts, as manufacturing represents between 59.2% and 79.3% of that impact, depending upon LED lamps’ parameters and manufacturing processes.
In the case of new building and refurbishment, LED lamps with a longer lifetime and a higher lumen output should be preferred, as they could consistently reduce the number of lamps required to respect minimal illuminance, while keeping the same energy consumption.
3.4. Lamp Replacement Recommendations
This work aims to define the best strategies for lighting indoor workplaces in France. Two main scenarios have been conducted: lamp replacement
(1) and new buildings or refurbishment
(2). For each scenario, the impact of the lifetime, efficacy, and maintained lumen output has been evaluated with the LCA methodology.
Table 7 sums up 10 scenarios for lamp replacements and highlights the respective potential reduction of impacts and energy consumption.
Scenarios 1 to 5 show a potential environmental impact reduction of 24% to 32.1%, thanks to the lifetime improvement of LEDs. Scenarios 6 to 8 represent the opportunities created by new buildings or refurbishment. Using LEDs with a higher lumen output leads to a 16.5% to 21.9% reduction of potential impacts. Scenarios 9 and 10 simulate an improvement of efficacy from 95 lm/W to 134 lm/W, which leads to a 5.9% to 9.4% reduction of potential environmental impacts. Finally, scenarios 1 to 8 maintain a constant global consumption, while scenarios 9 and 10 reduce it by 162.5 kWh.
Table 6 confirms that choosing a lamp for replacement could result in a significant reduction of the potential impacts when oriented toward the mitigation of the manufacturing phase impacts. Until the manufacturing phase is the most impacting, efforts should be focused on it to efficiently reduce the potential environmental impacts. This could be done by extending the rated lifetime (scenarios 1 to 5), reducing the number of lamps needed in each room (scenarios 6 to 8), or improving the end-of-life phase, as suggested by Dzombak et al. (2017) [
30]. Even if the end-of-life phase represents only 0.2% of the potential impacts, developing lamp reparation, reuse, or recycling has the potential to greatly reduce impacts of the manufacturing phase. Specific scenarios should be investigated to evaluate the impact of such improvements.
4. Discussion
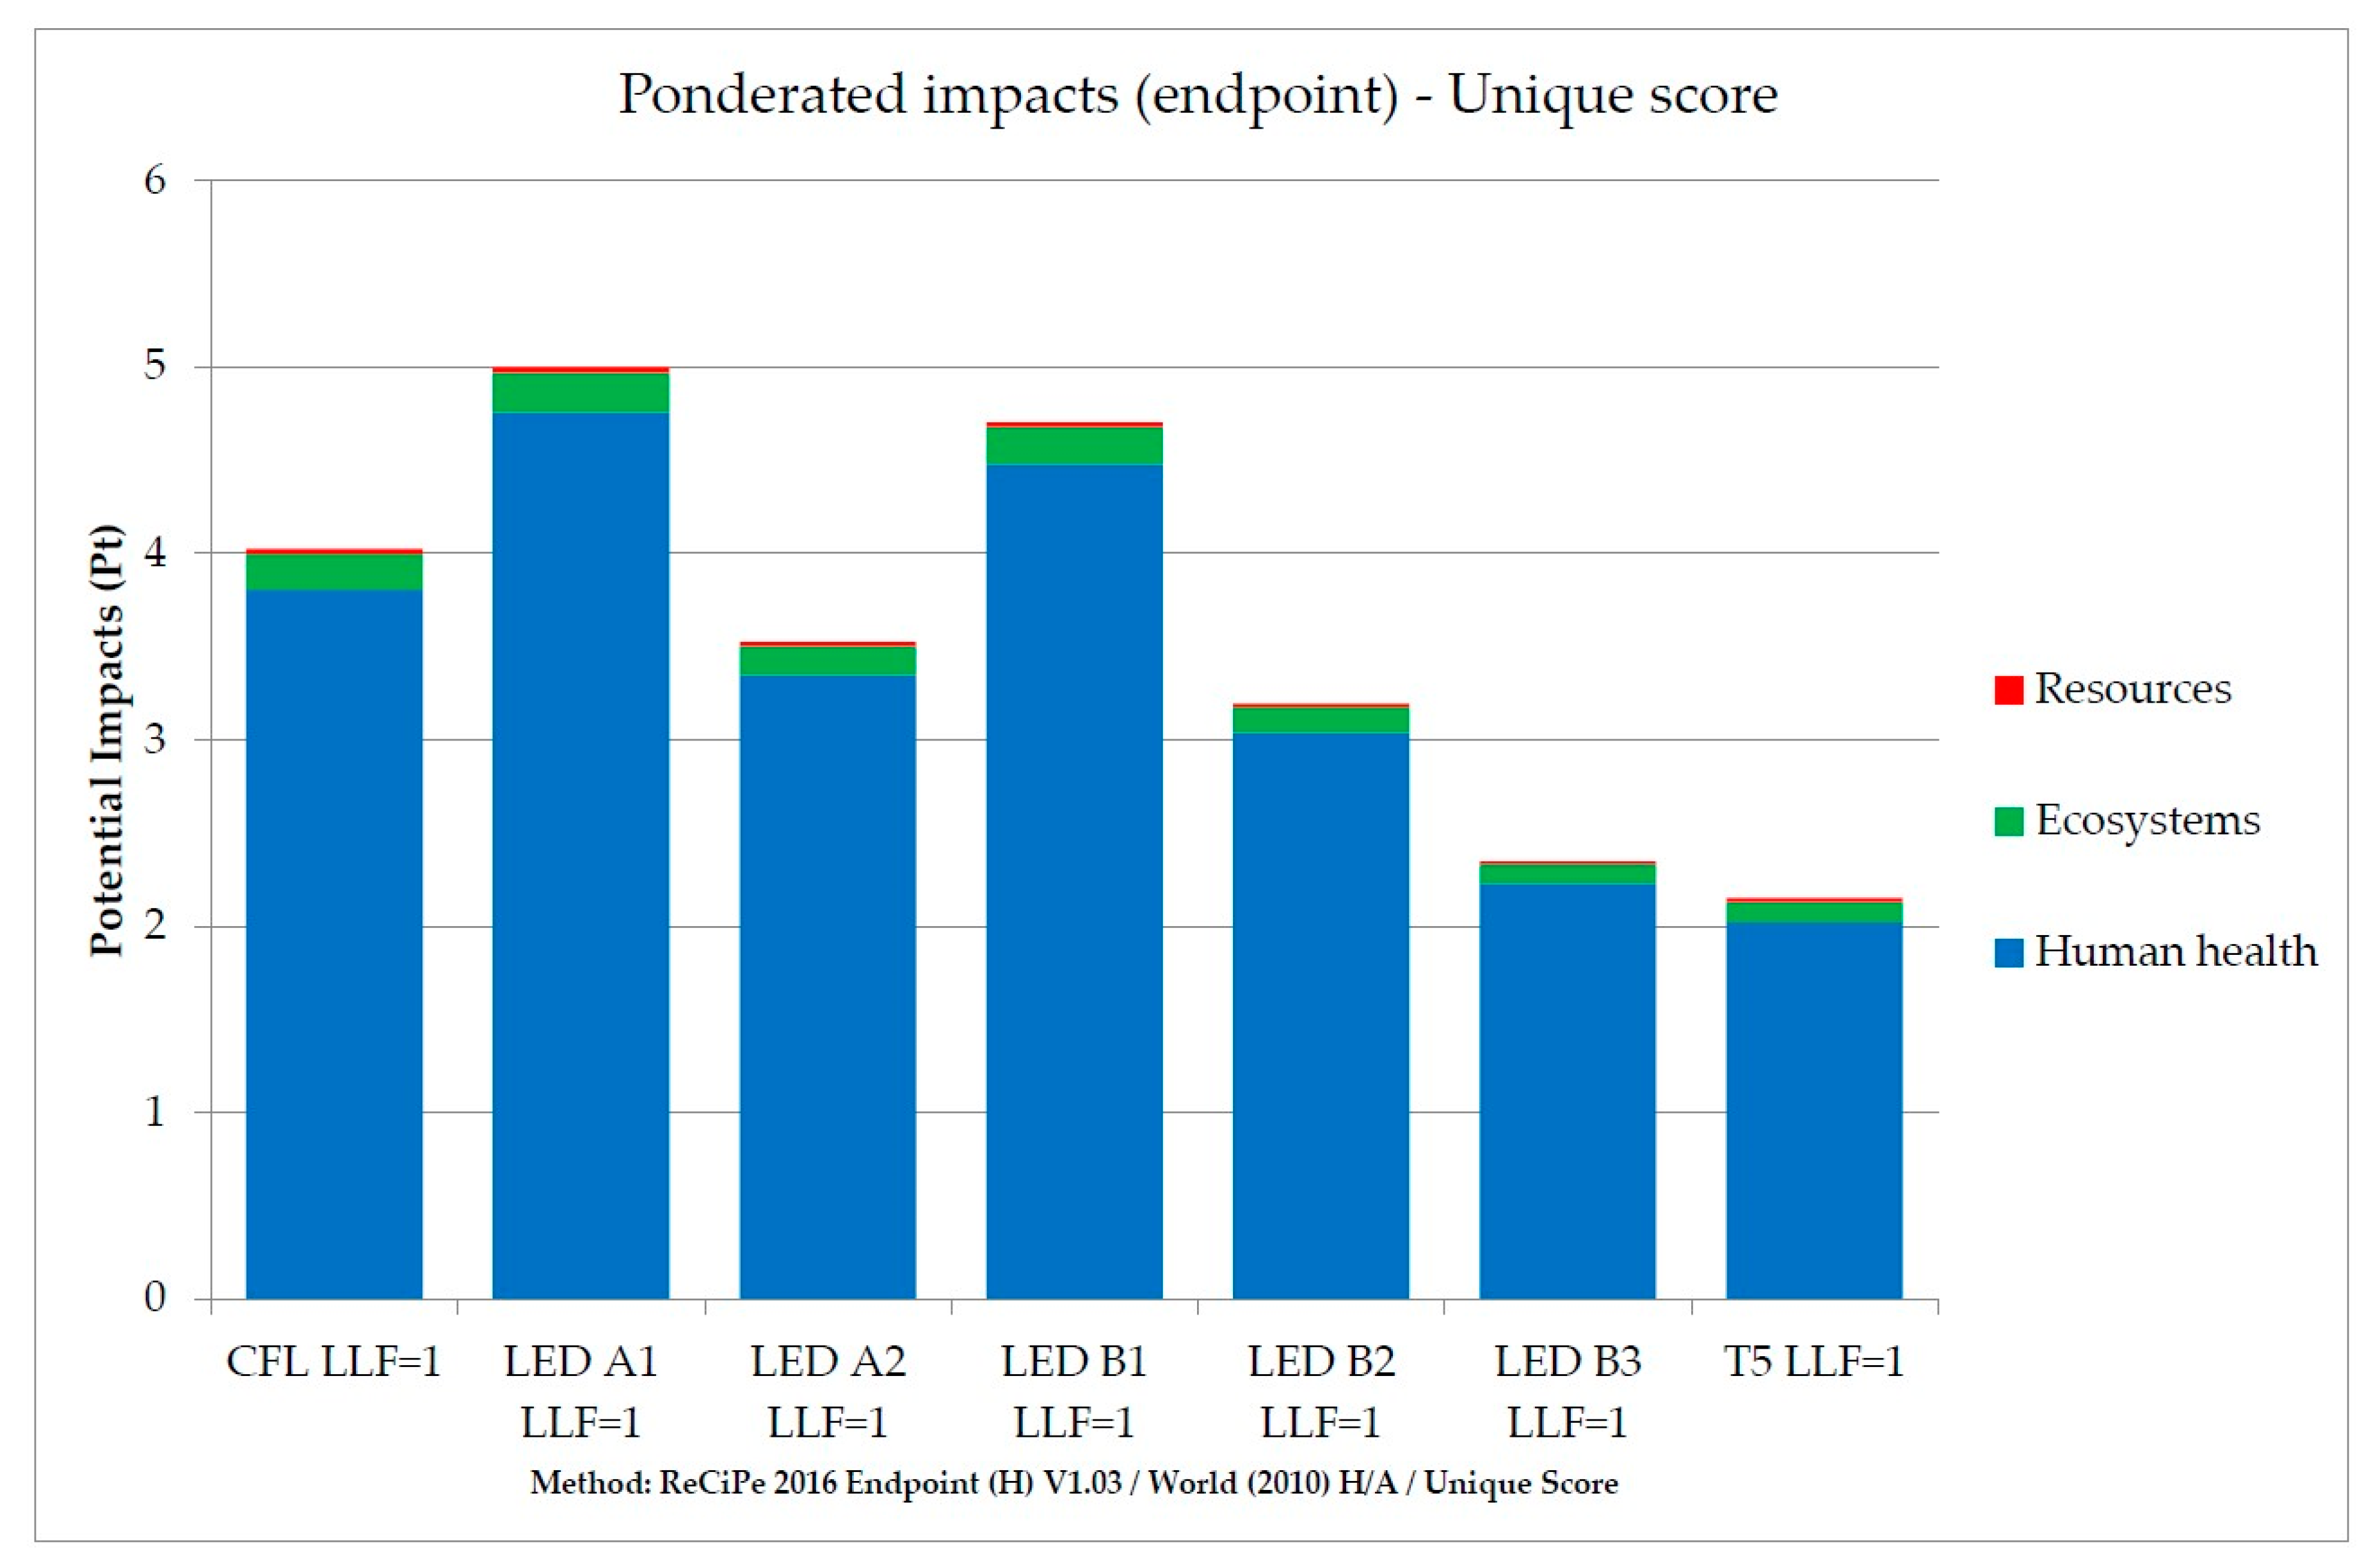
This paper aims to evaluate the potential impacts of lighting systems by introducing the light loss factor. There are currently no similar published LCA studies for France. In order to discuss these results, we have conducted an additional life cycle impact assessment with an LLF = 1. The same functional unit has been used, and the results are presented in
Figure 11.
Compared to
Figure 6., the life cycle impact assessment is significantly impacted by introduction of the light loss factor. Without using the LLF, LED lamps with a 15,000 h lifetime (LED A1 and B1) are no longer less impacting than a CFL lamp. On the other hand, the potential impacts of LED B3 and T5 are getting closer. This is mostly due to a higher LLF for T5 (0.73) than for LED A3 (0.66).
When comparing only LED lamps, introduction of the LLF does not modify the relative environmental performance or the recommendation to favor an LED lamp with a longer lifetime. As developed by Tähkämö et al., this study confirms that the life cycle results are mostly sensitive to the lifetime of the product and the electricity mix in use [
11].
On the other hand, when comparing LED lamps with other systems (CFL and T5), the introduction of the LLF modifies the ranking of lamps.
Figure 6 and
Figure 11 highlight that conducting an LCA of lighting systems with or without considering the LLF of each lamp leads to different results, which will impact lamp replacement strategies. This finding contradicts Osram, who stated that the lumen depreciation is too small to impact the results [
15].
Moreover, considering the LLF for LCA studies helps to evaluate the performance of technical solutions to mitigate or avoid the lumen depreciation (CLO). The introduction of new materials could lead to an increase of potential environmental impacts, and LLF and LCAs help to anticipate the pros and cons of such technology.
Finally, using the LLF highlights some interactions between the environmental, economic, and human aspects of lighting. From an economic point of view, the LLF (or maintenance factor [
24]) is used to define the installation process and the maintenance operation for indoor workplaces. It is directly linked to the cost of lighting, and will facilitate the identification of consequences and indirect impacts in the intersection of LCA and life cycle cost [
31]. From a human point of view,
Section 3.2 explains that the perception of lumen depreciation by humans could lead to a decrease in the real useful lifetime of lamps. This can be seen as a rebound effect of lumen depreciation and should be considered when assessing lighting systems.
We found that using LLF better describes the real usage of the lamps as well as its function, and therefore we recommend its use when comparing several lamps.
5. Conclusions
Life cycle assessment methodology has been used to evaluate the environmental performance of lighting systems for indoor workplaces in France. The light loss factor has been introduced to analyze the real usage of the product and to be compliant with French norms. Thanks to the light loss factor, the maintained lumen output has been defined for each lighting system and a life cycle assessment has been conducted using maintained megalumen hour as the new functional unit for several scenarios (lamp replacement, constant lighting output, new buildings and refurbishment).
First, the life cycle impact assessment shows that the T5 and LED B3 (40,000 h lifetime and 134lm/w efficacy) are currently the lowest impacting systems for lighting indoor workplaces. To consider replacing a CFL lamp with an LED lamp, the rated lifetime of the LED should be higher than 15,000 h to ensure a reduction of the potential environmental impacts.
Regarding constant lighting output, the life cycle assessment shows almost no improvement in the potential impacts, while the constant lighting output reduces global consumption and improves the users’ quality of life by producing a constant lighting output. This can be done by introducing new electronic components, and these effects should be considered to determine if constant lighting output is a relevant technical solution to improve the environmental, economic or social aspects of lighting.
This life cycle assessment of lighting systems helped to establish strategies for lamp replacement. From an environmental point of view, improving the lifetime will always be the best strategy for both lamp replacement as well as for new buildings or refurbishment. The next best strategy is to use LED lamps with higher lumen output to reduce the number of luminaires required. However, this is dependent upon the LED’s ability to recreate an adequate light ambiance respecting French norms. Finally, even if improving the efficacy of LED lamps leads to a reduction of global energy consumption, we can safely state that enhancing LED lamps’ lifetime and manufacturing processes results in a greater reduction of potential environmental impacts.
To conclude, even if the life cycle assessment methodology focuses on environmental aspects, it helps to prove that economic and social factors must also be considered to establish a coherent lamp replacement strategy. The price of the most performing LED lamps could be an issue for its expansion in indoor workplaces, especially when considering that T5 is a more economic option and presents a similar potential environmental impacts. A life cycle cost analysis will be conducted to answer this question. In addition, the rebound effect induced by how people use lamps should not be neglected, as well as the impact of light on human well-being and comfort. A multi-criteria approach is recommended to deepen our understanding of the performance of each lighting system.

 ,
, 


