Article

An Efficient Method for LED Light Sources Characterization

1
Department of Information Engineering (DII), Università Politecnica delle Marche, 60131 Ancona, Italy
2
iGuzzini Illuminazione S.p.A, Via Mariano Guzzini 37, 62019 Recanati, Italy
*
Author to whom correspondence should be addressed.
Electronics 2019, 8(10), 1089; https://doi.org/10.3390/electronics8101089
Submission received: 29 August 2019 / Revised: 18 September 2019 / Accepted: 23 September 2019 / Published: 25 September 2019
(This article belongs to the Special Issue Latest Developments in LED Drivers)

Abstract

:
Digital LED drivers capable of blending the spectrum of two LED fixtures with different Correlated Color Temperatures through the LEDs’ power supply control are widespread. However, the digital control of lighting systems is possible only after a careful study of the LED’s response, in terms of illuminance and Correlated Color Temperature. The proposed work takes advantage of the Tunable White technology for the realization of an efficient method for LED light source characterization. In order to evaluate how the light changes as a function of the electric power supplied by the LED drivers, an experimental setup to characterize LED light sources has been designed. Starting from the data acquired from the experimental setup, a model for dimming the LED driver and obtaining the desired values of quality of light has been developed. The proposed model is based on the least squares method and its accuracy is evaluated by comparing the obtained values of illuminance and Correlated Color Temperature with those measured by an illuminance spectrophotometer. Results achieved an error of 0.3% for Correlated Color Temperature and 1.5% for illuminance using the proposed approximation functions.

1. Introduction

Light Emitting Diode (LED) technology is increasingly popular these days and much research is focused on different aspects of this technology, such as LED topology, LED drivers, power or voltage analysis and LED radiation patterns [1,2,3]. Recently, the new application possibilities offered by LEDs, together with the evolution of solid state technology, are bringing innovation in both general and accent lighting. In the literature, as well as in industries, we have a growing interest in LED light sources applications thanks to their stability, reliability and easy application of digital control [4]. Typically, LED sources have a fixed Correlated Color Temperature (CCT) and color rendering while the light intensity can be adjusted through LED drivers allowing digital control of the light emission [5,6]. In particular, the Tunable White technology is highly developed and widespread and light quality can now be perfectly adapted to match with different scenarios requirements. In fact, the Tunable White LED light sources allow the easy mixing of two lights with different Correlated Color Temperatures, cool and warm [7]. The Tunable White LEDs offer benefits not available in normal LED light sources, including the minimization of the potential blue hazard, improved color perception without drastically scarifying lumen efficiency, and reliability. However, to achieve a high quality level of light the digital control of the LED drivers used in the Tunable White technology can be very complex. In fact, they are generally controlled in power without knowing the exact values of illuminance and Correlated Color Temperature emitted by LEDs. The method univocally used today to reach the expected values of illuminance and Correlated Color Temperature using Tunable White LEDs consists in carrying out continuous manual settings of the LEDs driver power and measurements of the relative emitted light. This iterative procedure represents an inefficient method for LED light source characterization, especially where it is desired in complex scenarios in comfortable environments at any time and in every circumstance of the day [8].
Studies show that an adjustable Correlated Color Temperature is beneficial for human health, well-being and productivity [9]. A person may prefer warm or cool light depending on the time of day, the activity performed or the contribution of natural light. Therefore, it is important to adapt artificial light to the natural light, in order to keep synchronized the human circadian rhythm [10]. Lighting quality is not only important for practical needs, such as work and visual comfort, but it also has a fundamental role in the emotional sphere, transmitting and emphasizing emotions through simple plays of light [11]. For this reason, there is a growing demand for dynamic and real-time adjustment of light to meet users needs and generate high comfort light in special scenarios, such as in cultural heritage applications where visual appearance represents a crucial aspect as it allows a subject to immerse himself in the artwork, blending into the art [12]. These characteristics can be satisfied using appropriate models providing suitable driver settings for Tunable White LEDs to reach a certain light quality. However, in the literature, experimental methods to characterize a LED source and thus derive such models have never been proposed.
In this paper we provide a method to obtain an efficient method for LED light source characterization typically used in cultural heritage applications. In particular, we study the Tunable White LED’s response used in the new lighting system installed in the Scrovegni Chapel, Padua, Italy [13]. The description refers to the cultural heritage standards, but the proposed method for the model development can be considered valid for any other type of application or LED light sources. Based on the least squares method, an accurate mathematical model for illuminance and Correlated Color Temperature control has been developed with the aim of obtaining an efficient dimming in LED light sources. Moreover, the developed tool allow us to check the LED light source’s output by adjusting the input of the LED drivers, providing the minimum power values necessary to obtain the desired lighting parameters. The described work represents the first example of LED light source characterization based on illuminance and Correlated Color Temperature measurements.

2. Materials and Methods

In order to study and control LED light in high quality lighting, the spectral stability of a LED light source represents a critical aspect [14], especially when the field of application concerns cultural heritage. The European technical specification UNI CEN/TS 16163 provides the specifications to be used in lighting systems designed for cultural assets such as historic buildings, museums or galleries. In cultural heritage applications, as well as in many other sectors, the quality of LED light sources represents a wide and crucial aspect to investigate. the LED spectrum does not only influence the emitted light chromatic aspect, but also the color’s perception of illuminated objects by the source. For this reason it is necessary to study in detail the LED light source’s response, varying the LED’s input power to analyze how the lighting parameters change and are correlated to each other. In detail, we study the LED light source response in relation to the LED driver’s power in order to obtain an accurate digital control of the lighting system and an excellent colorimetric performance in compliance with the standards of the application field.
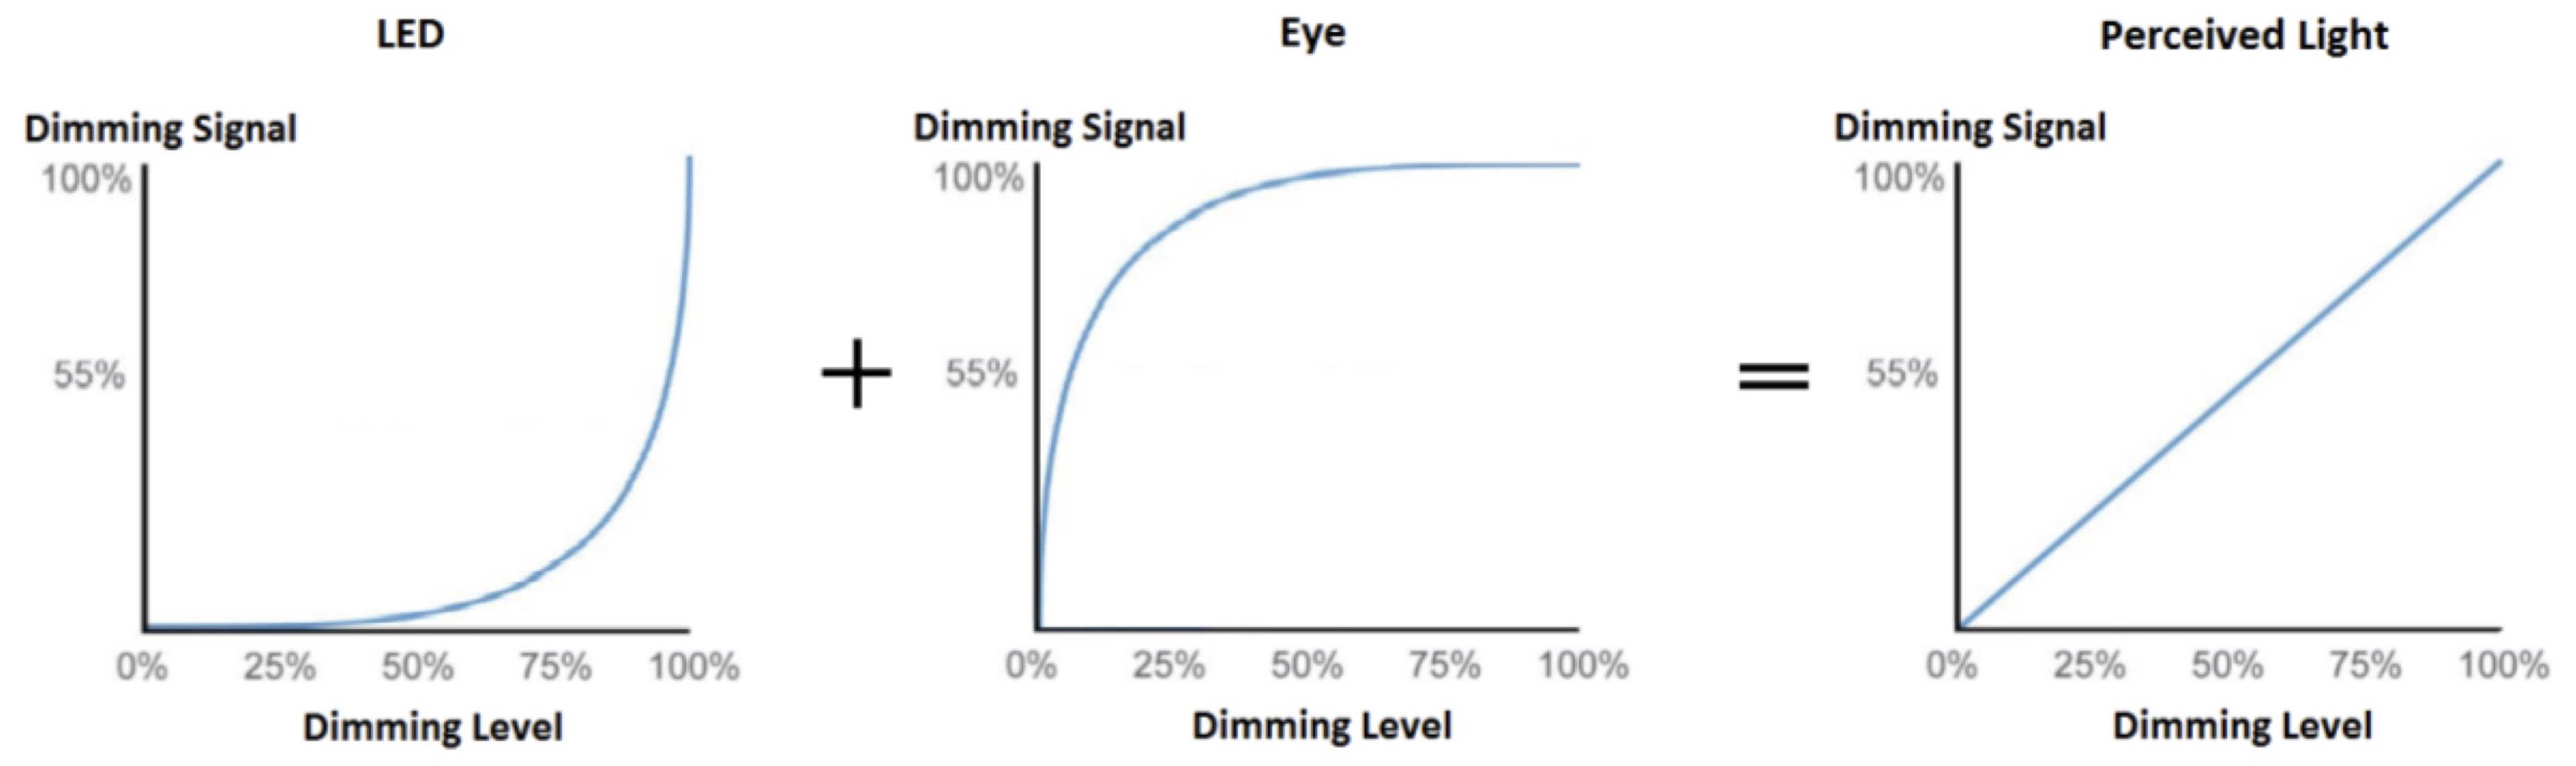
The perception of the human eye is defined by a curve with a logarithmic trend, with greater sensitivity to variations at low percentages of illuminance [15]. It is fundamental to take into account this aspect in the LED driver settings to obtain an accurate digital control of the lighting system. In fact, given the sensitivity of the human eye, greater attention must be paid to low dimming levels. In order to not lose information in this analysis, it is necessary to choose an adequate number of input values for LED light source power supply. Therefore, variable power steps should be considered to power LEDs with more dense ranges at low values and larger ranges when increasing the power values. Moreover, to obtain a linear perception of the increase in illuminance, the LED light source must be have an illuminance curve with the exponential trend (Figure 1).
In order to obtain a LED light source in which output values of the illuminance are linked exponentially to the input value, the controller and the LED driver must be properly configured. Therefore, it is very important to choose the right dimming curve (Figure 2). Typically, digital controllers of lighting systems available are linear, so it has been necessary to select LED drivers with a settable exponential dimming curve. The LED drivers used in this study were DC Maxi Jolly US DALI (TCI, Saronno, Italy) with an exponential dimming curve set.
The aim of this work is to find the appropriate settings to give to LED drivers to generate the desired rendering corresponding to specific lighting parameters. Among the lighting parameters, the most important are illuminance, measured in lux (lx), and color quality, which is generally evaluated in terms of Correlated Color Temperature and measured in kelvin (K) [12,16].
Although the CCT is an important aspect of the color appearance, this single parameter is not enough to describe the complex spectral power distribution. For example, two sources with the same CCT can look different. To address this issue, the Duv is defined by the American National Standards Institute (ANSI), as a parameter that quantifies the distance between the chromaticity of a black body radiator and a given light source of equal CCT [17].
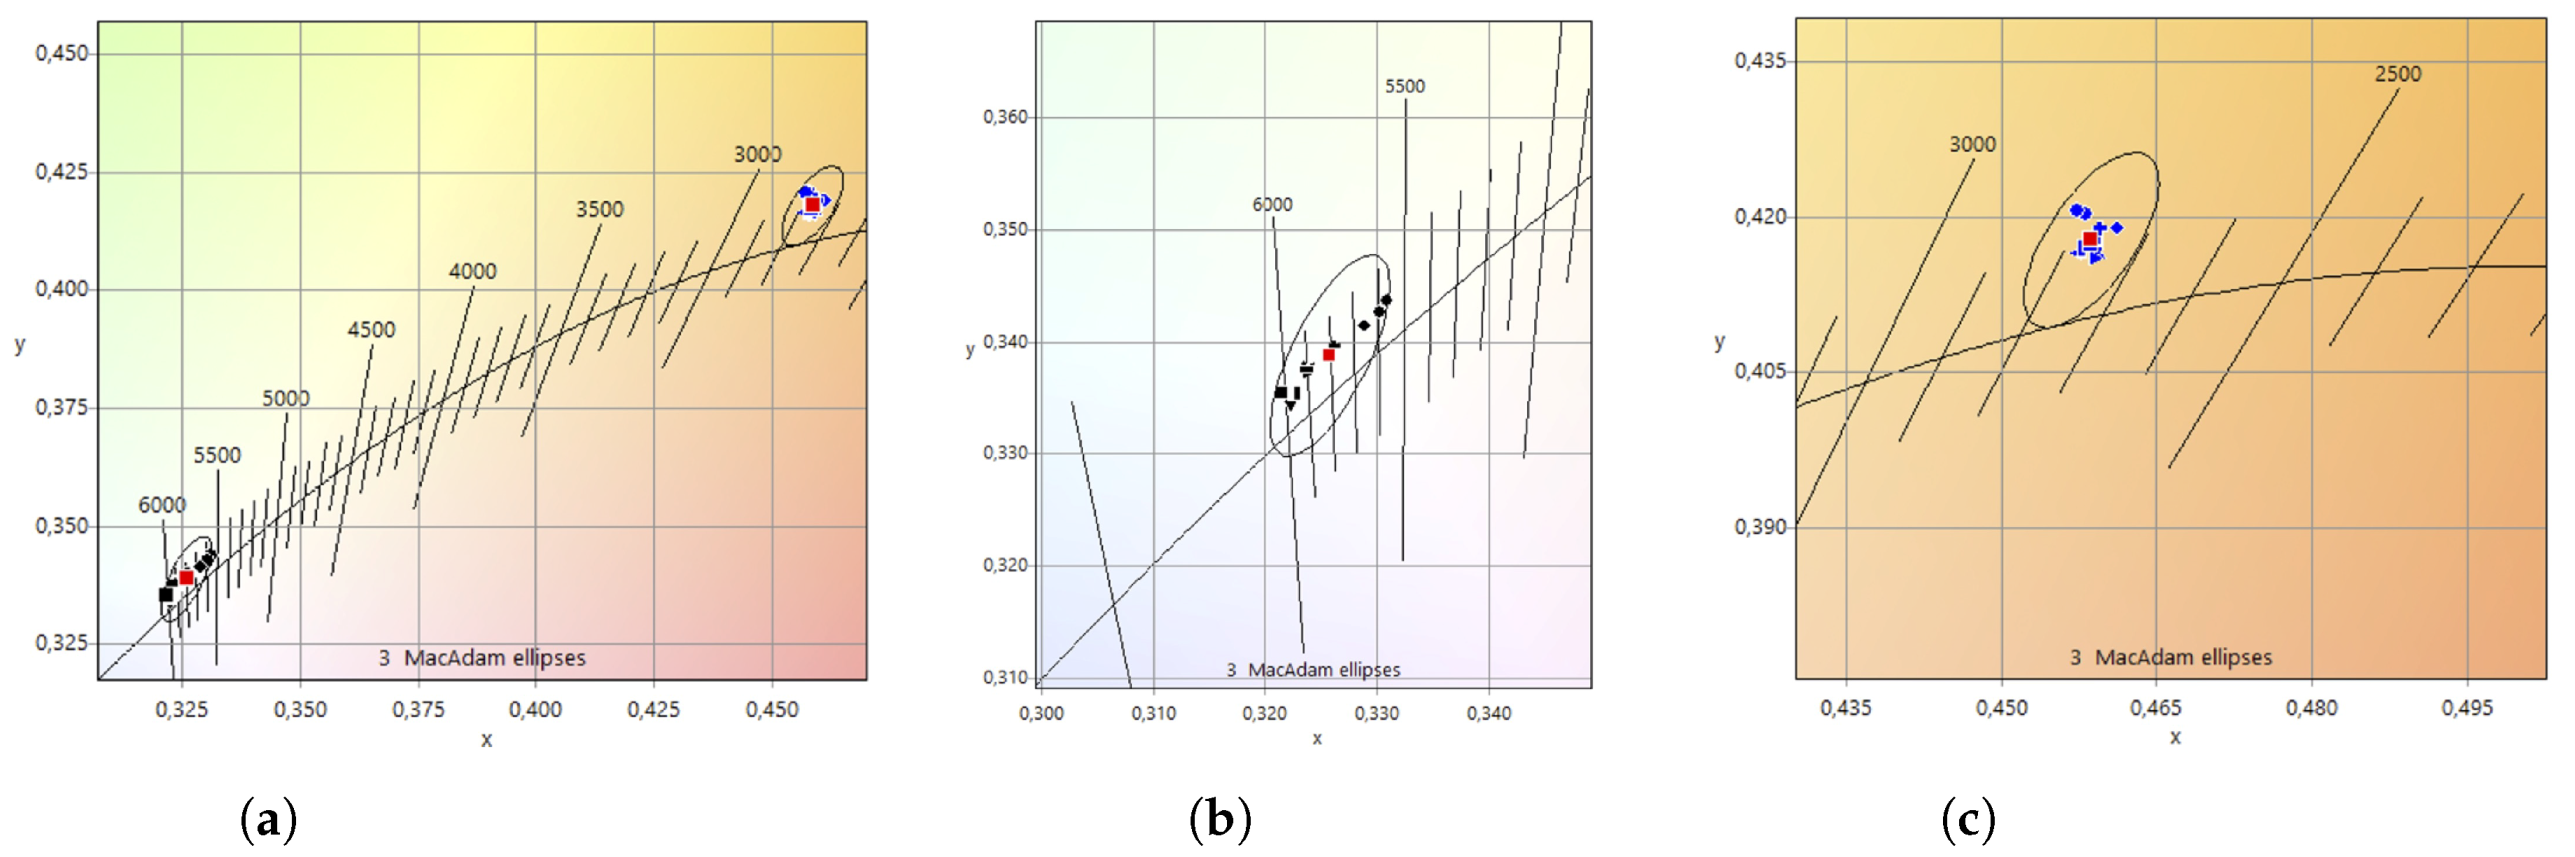
While in some applications, large color tolerances may be acceptable, in other fields, such as museums, the color quality keeping of LED light sources must be carefully considered. The light source’s color is often described using chromaticity coordinates (x,y) which represent a basic principle of the CIE system of colorimetry. In this work we have referred to CIE 1931 [12]. In the lighting literature, a metric commonly used for quantifying perceivable color difference is the MacAdam ellipse, which is a region in the chromaticity diagram. If the chromaticity coordinates of two white LED light sources are located beyond this area, a color difference between these two sources can be detected by human eyes. [18]. Depending on the reference application field, there are acceptable tolerances defined by ANSI to establish color matching between two sources. For example, for an achromatic (white) wall there must be a 2-step MacAdam ellipse, while to illuminate multicolored scenes or paintings it does not have to exceed a 4-step MacAdam ellipse to make color differences imperceptible [19]. In this study, we have used LEDs that guarantee variations that fall within a 3-step MacAdam ellipse, as indicated in the manufacturer’s datasheet. In this way, we put ourselves through more stringent case studies with respect to the requirements requested by this application, where color variations are visible from 4-step MacAdam ellipse.
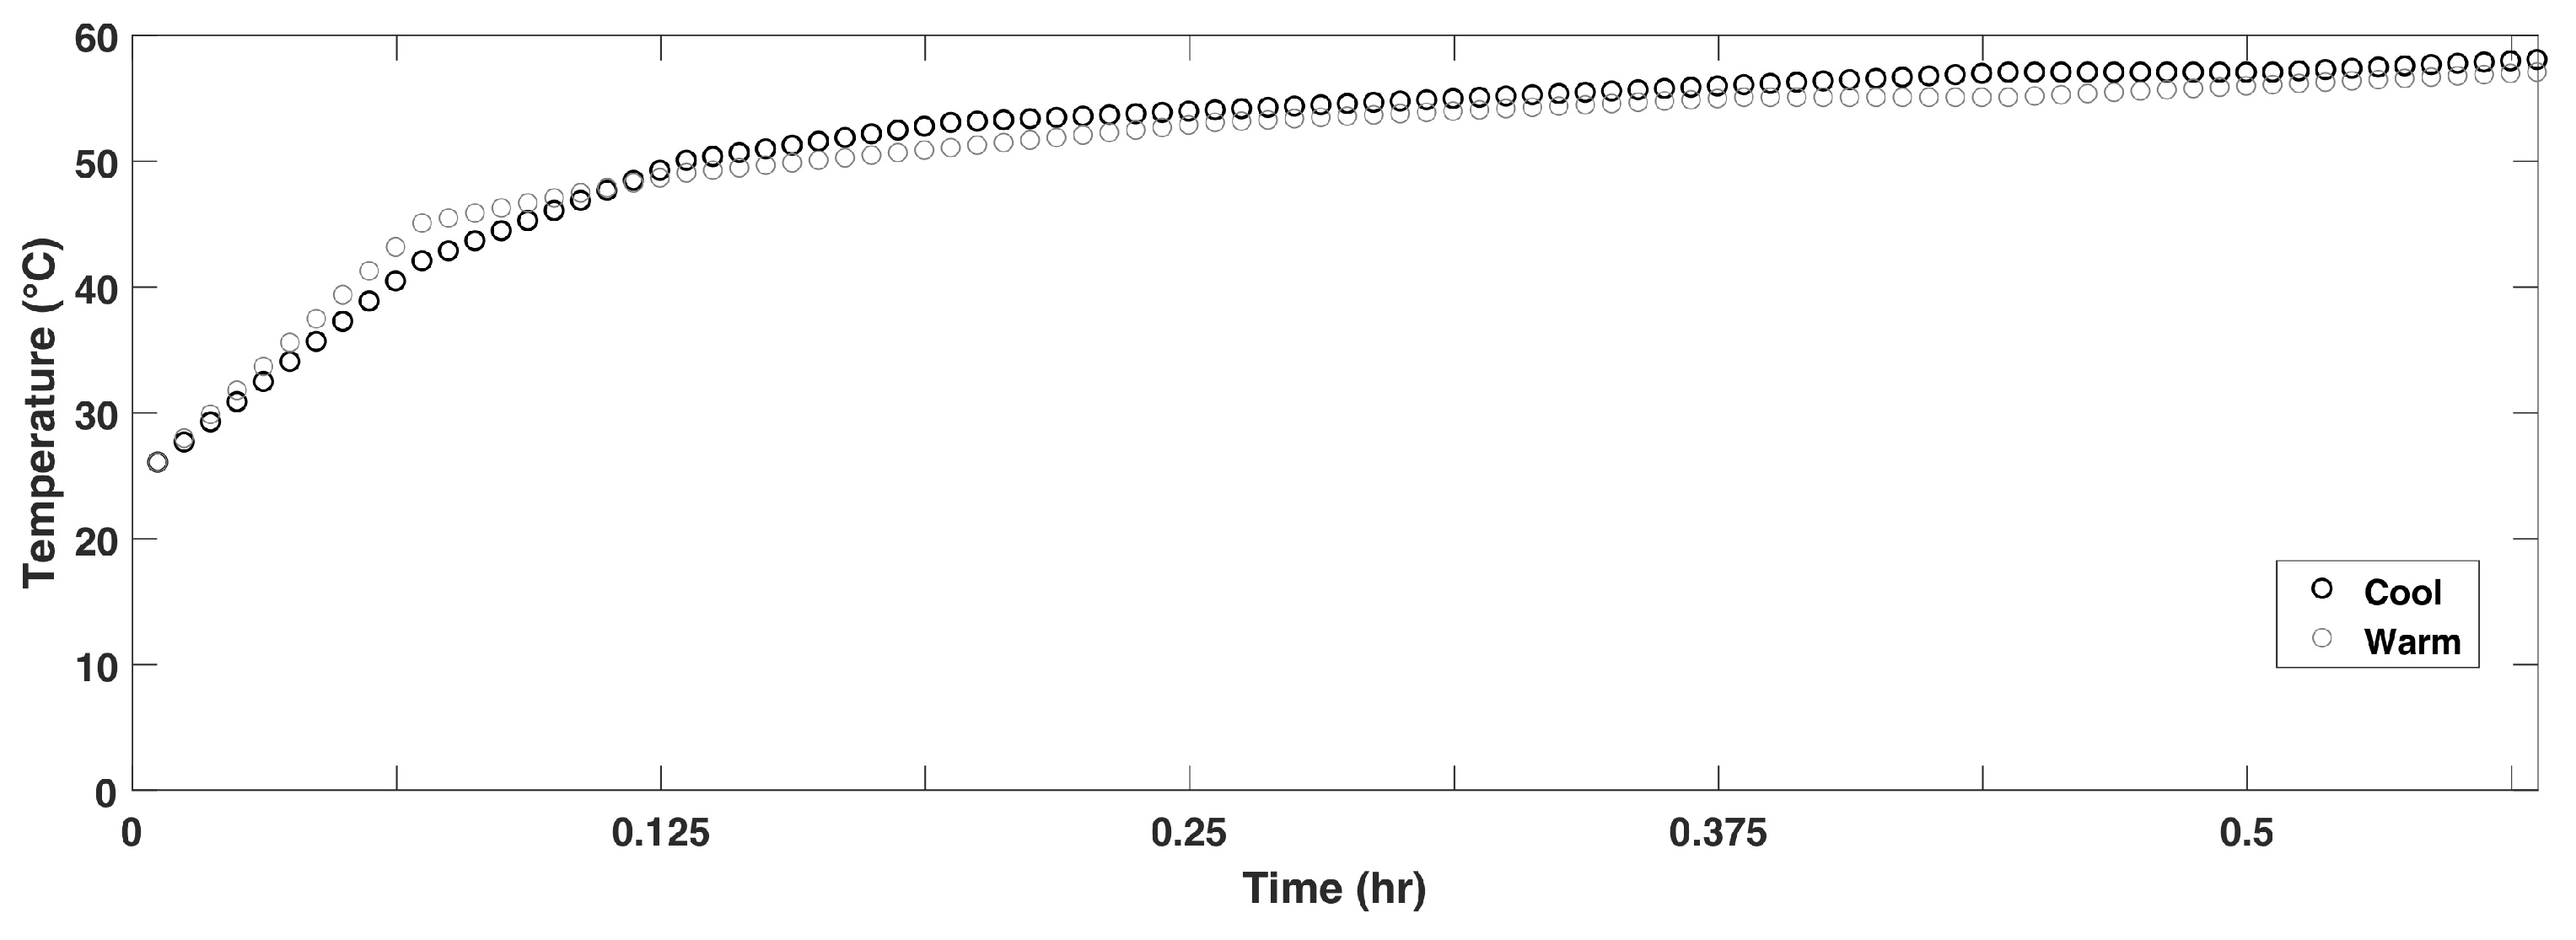
The junction temperature of the LEDs is another aspect that should not be underestimated. It influences the perceivable color difference [20]. Based on the IES LM-79-08 standard and other studies present in the literature, the junction temperature changes the amplitude and position of the peak wavelength of the spectrum linearly with the heat [21]. In order to evaluate the thermal stabilization of the LEDs used in this study, a detailed analysis of the spectrum’s trend as a function of the junction temperature over time has been carried out. In this analysis, thermocouples have been placed on warm and cool LEDs powered at maximum power and their junction temperature has been measured using the instrument Agilent 34970A. These measures have been performed on each LED light source considered in this study. The ambient temperature in which measurements are being taken is maintained at 25 ° C. Figure 3 shows the mean values of the junction temperature of warm and cool LEDs. Results of the performed analysis have shown that after 25 min the thermal stabilization is almost reached, swinging a few degrees, and consequently also the shape of the spectrum has stabilized. In fact, after 33 min of operation the temperature rose up to about 60 ° C on both warm and cool LEDs.

3. LED Light Sources Characterization

In order to study how the lighting parameters of the LED light sources change as a function of the electric power, a suitable experimental setup was used for both the training and testing phases. The training phase includes a series of useful measures to characterize the LED light source’s response during operation. Data obtained from the training phase have been processed to develop the mathematical model for LED light sources characterization. The accuracy of the developed mathematical model has been evaluated in the testing phase.

3.1. Experimental Setup

The proposed protocol is useful for the response evaluation of a specific LED light source and to measure light parameters. The LED light sources used in this work are based on Tunable White technology with cool CCT LEDs mixed with warm CCT LEDs. The topology is basically composed of two main white LEDs chains, each one with a different CCT. Therefore, the emitted spectrum can be tuned by means of a twin dimmable power supply system, one for each LED chain. The result in a continuously tuned spectrum comprised between the two limits is represented by the CCTs of the two LED chain, respectively. In particular, the considered LED light sources for this study were the Laser Blade produced by iGuzzini Illuminazione S.p.a. As shown in Figure 4, each Laser Blade contains 15 LED elements, specifically 7 cool LEDs and 8 warm LEDs of Osram, 5700 K and 2700 K, respectively. In this work, a total of 12 Laser Blades were used for the training and testing phases. In particular, 10 Laser Blades were used in the training phase to calculate the mathematical model shown below, and 2 in the testing phase to validate this model.
In order to provide the results of the illuminance and CCT curves of these LED light sources in a laboratory environment, a series of measures was carried out. According to UNI EN 13032-4 standards, measurements were carried out in a sphere (with a diameter of 195 cm) containing the LED light source and an illuminance spectrophotometer. Figure 5a illustrates how the LED light source and the spectrophotometer were positioned. The used illuminance spectrophotometer (CL-500, Konica Minolta) allowed us to perform punctual measurements of lighting parameters, such as CCT, illuminance, Duv and spectrum.
Experimental setup architecture and the composing elements are illustrated in Figure 5b. In this figure, each main component of the architecture is schematized and highlighted in different colors. Interconnection standards in the lighting field have to be taken into account for each LED light source connection. Specifically, LED drivers used in this work are current dimmable drivers and incorporate communication interfaces for digital addressable control compliant with the Digital Addressable Lighting Interface (DALI) IEC international standard. In order to send DALI commands to each LED driver using HTTP’s GET method, a DALI Gateway was used. An automatic management software was developed to evaluate the light source response at different input power values. Analysis focused on variable power steps with different ranges between training and testing phases. Therefore, management software was developed to interface the PC with lights on one side via Ethernet, and the PC with Minolta on the other, via USB. For each input command for cool and warm channels power supply, the lighting parameters were acquired and saved after 30 min, when the junction temperature had stabilized.

3.2. Training Phase

The training phase was executed on a significant number of samples representative of the considered product’s family. In particular, ten LED light sources (Laser Blade) were selected and the lighting parameters measurement was carried out for each of them using variable power steps with ranges of: 1% between (0–10)%, 5% between (10–50)% and 10% between (50–100)%. In order to evaluate the performed tests, the LED light sources distribution in CIE 1931 graph was carried out. In particular, measurements powering only the 100% cool LEDs and only the 100% warm LEDs were selected and illustrated in Figure 6a. Red point identifies the mean value. According to the technical specifications of the LEDs’ datasheet, each LED can vary by 3-step MacAdam’s ellipses. Therefore, in this figure the 3-step MacAdam’s ellipses related to the mean values are also illustrated. Figure 6b,c show that the measures are uniformly distributed inside the 3-step MacAdam, so the sample size can be considered representative of the Laser Blade’s family.

3.3. Mathematical Model Development

In the training phase, all the acquisitions of the 10 LED light sources were performed. CCT and illuminance values for all the crossover power values from 0% to 100% between cool and warm channel ( P c e P w ) were obtained. The power values of cool and warm channels were linked to the dimmable drivers’ parameter control according to the formula:
P c = V c · I c · d c
P w = V w · I w · d w
where V c and V w are the voltage drops of the LEDs chains connected in series for cool and warm channels, respectively; I c and I w are the maximum currents that can be supplied by LED drivers for cool and warm channels, respectively; and d c and d w are the percentage values of the output currents that can be set on the LED drivers to implement the dimming function of cool and warm channels, respectively. The mean values for each pair of inputs ( P c , P w ) were calculated and illustrated in Figure 7, both for CCT (Figure 7a) and illuminance (Figure 7b).
In order to estimate the average polynomial surface that approximates the known points ( P c , P w ) , a polynomial representing the entire family of LED light sources has been obtained. Starting from the values of the known points, a function of the differences (distances) is minimized to calculate its coefficients [22].
To analyze the illuminance, we calculated the function F L u x ( P c , P w ) , given by:
F L u x ( P c , P w ) = i + j = 0 n a i j · P c i · P w j
where the polynomial degree is n = 4 , and we have used the least squares approach to find the coefficients a i j minimizing the difference between the curve fitting and the data.
CCT surface computation is more complex, in fact we did not have significant values outside the area covered by the known data ( P c , P w ) . For this reason, given the trend of the CCT function, we decided to divide this function into smaller domains to obtain a more accurate model. So the CCT, represented by the function F C C T ( P c , P w ) , is given by:
F C C T ( P c , P w ) = f C C T , 1 ( P c , P w ) 0 P c 10 , 0 P w 10 f C C T , 2 ( P c , P w ) 10 < P c 50 , 0 P w 10 f C C T , 3 ( P c , P w ) 50 < P c 100 , 0 P w 10 f C C T , 4 ( P c , P w ) 0 P c 10 , 10 < P w 50 f C C T , 5 ( P c , P w ) 10 < P c 50 , 10 < P w 50 f C C T , 6 ( P c , P w ) 50 < P c 100 , 10 < P w 50 f C C T , 7 ( P c , P w ) 0 P c 10 , 50 < P w 100 f C C T , 8 ( P c , P w ) 10 < P c 50 , 50 < P w 100 f C C T , 9 ( P c , P w ) 50 < P c 100 , 50 < P w 100
where
f C C T , l ( P c , P w ) = k + y = 0 m b k y · P c k · P w y
with 1 l 9 , the range of powers in which the CCT function has been divided into smaller domains. In this function, the polynomial degree is m = 8 , and also here the least squares approach was used to calculate the coefficients b k y .
In order to find the right cool, P c , and warm, P w , power values to get precise Correlated Color Temperature ( C C T ) and illuminance ( L u x ) values, the following system has to be solved:
( P c , P w ) = { F L u x ( P c , P w ) = C C T F C C T ( P c , P w ) = L u x
In order to easily solve this system, a user friendly interface able to find the right power for the desired CCT and illuminance (Figure 8) was developed. Moreover, thanks to the measurements performed in the training phase, the developed interface is also able to place the expected CCT values in the CIE 1931 graph.

3.4. Testing Phase

The performance of the proposed model was evaluated through a testing phase involving further LED light sources not considered in the training phase. The adopted experimental setup is the same as that used in the training phase and shown in Figure 5b, but power steps are different. In particular, the ranges of power steps for the testing phase were calculated from the system Equation (6) of the mathematical model in order to get pairs of power values P c and P w (test points). These points were obtained by giving the desired values of CCT and illuminance to the mathematical model. The desired CCT ranged from a minimum value of 2700 K to a maximum value of 5700 K with a delta of 100 K. Whereas the desired illuminance ranged from a minimum value of 20 lx to a maximum of 1200 lx with a delta of 40 lx. Data obtained in the testing phase have been used for comparison between CCT and illuminance values measured by illuminance spectrophotometer and those used as system input Equation (6).

4. Results

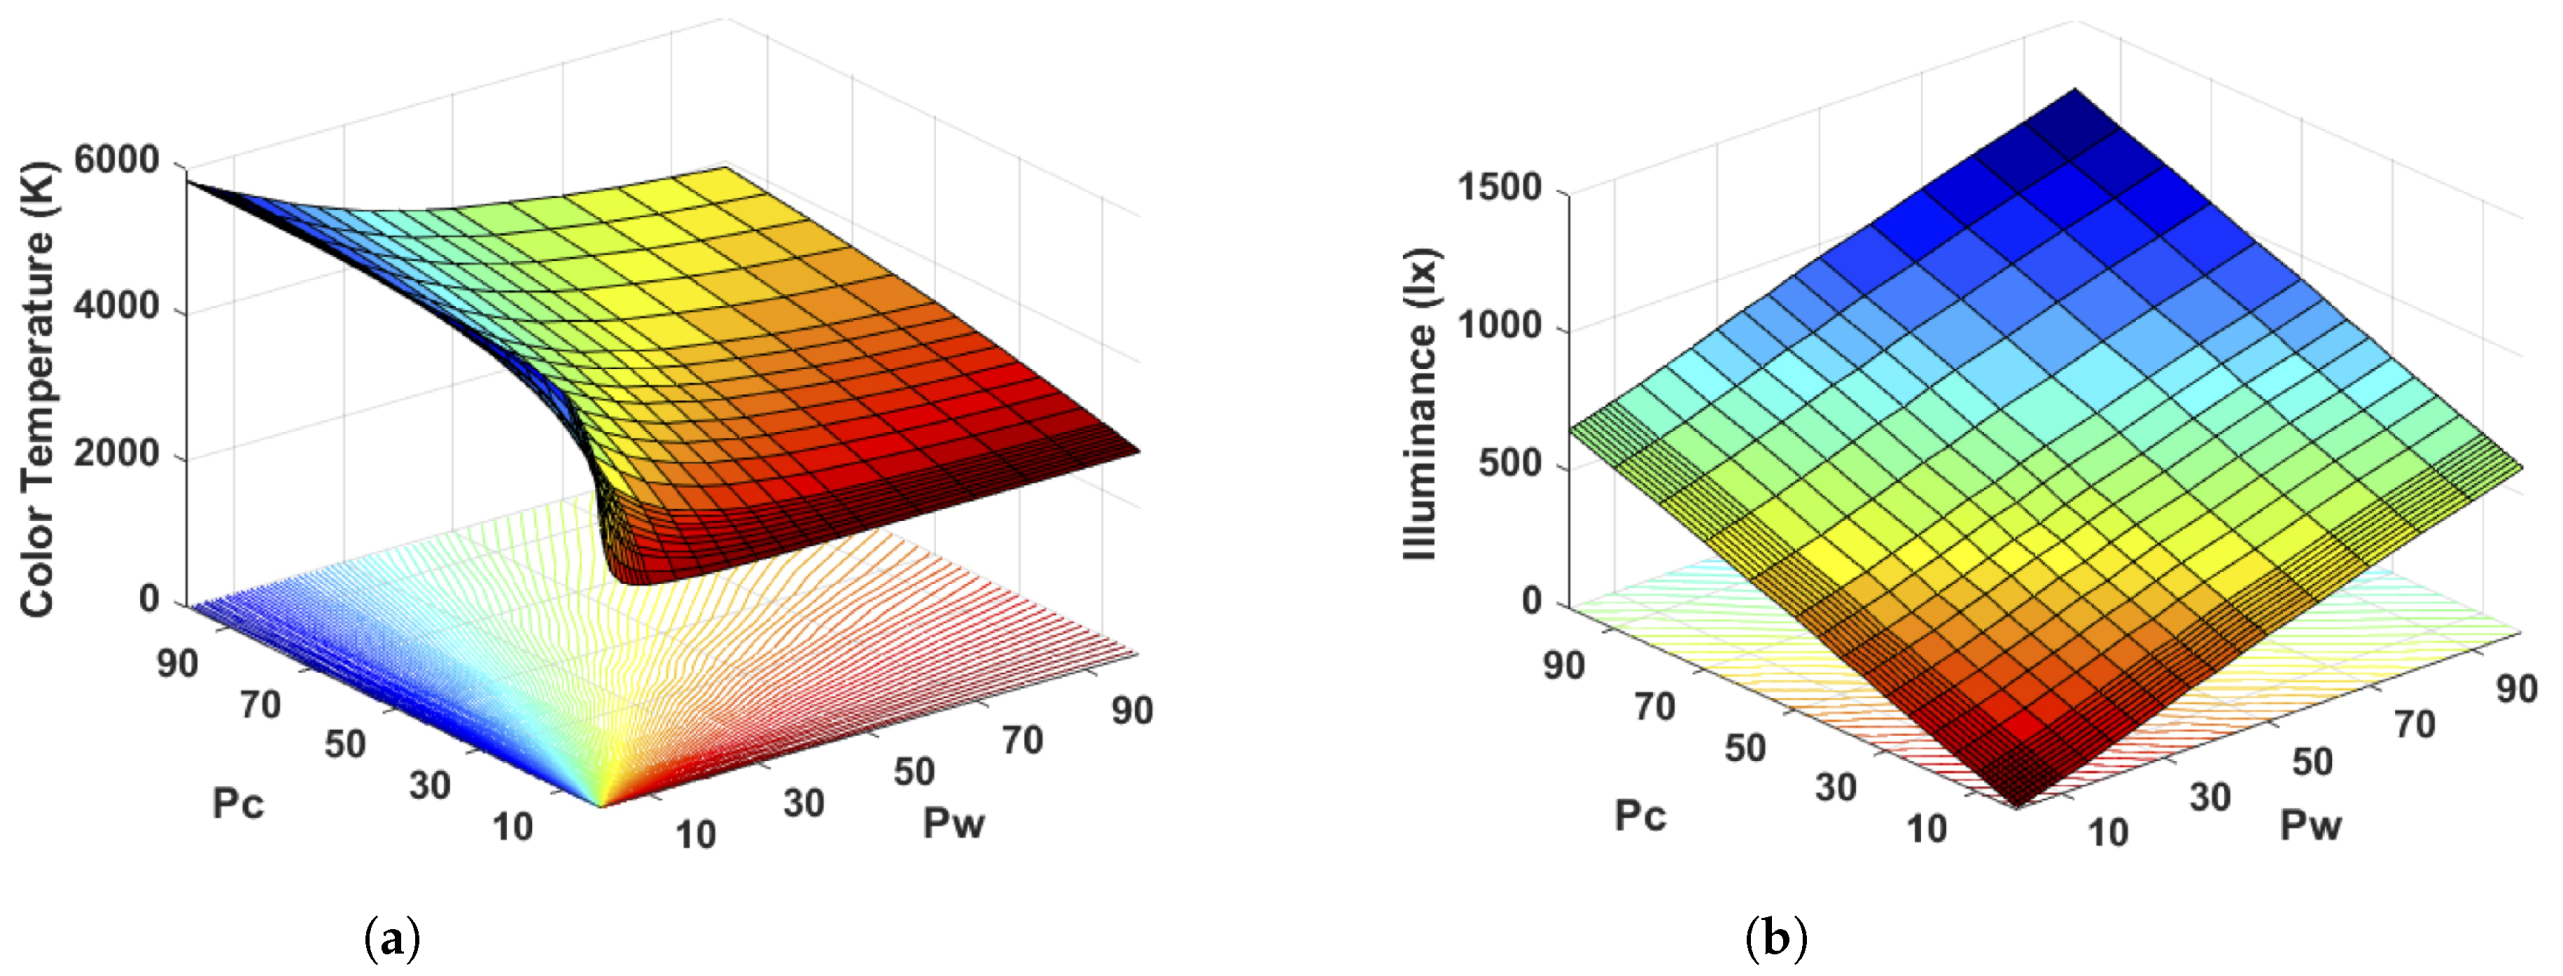
In this paper, a new efficient method for LED light sources characterization is presented. The developed mathematical model was achieved from CCT and illuminance average curves obtained during the training phase. These curves are summarized in Figure 7, where CCT (Figure 7a) and illuminace trend (Figure 7b) as a function of dimming are illustrated. The CCT surface curve has an irregular trend, when the power of the cool channel increases, keeping the warm channel constant, the CCT moves towards high values and vice versa for the warm channel. Instead by increasing the power the illuminance’s curve has a linear trend. The level sets for CCT and illuminance projected on the x-y plane are also illustrated in both figures (Figure 7), identifying the iso-CCT and iso-illuminance points. Moving along those lines we have all the power inputs ( P c , P w ) that keep CCT or illuminance constant. From the intersection between CCT and illuminance level sets it is possible to find the corresponding values of warm and cool channel which allow us to obtain the desired lighting parameters values. In Figure 7a it is shown how the level sets of the CCT are a beam of fan curves. Starting from the center, with the same power for the warm and cool channel, we have a natural CCT, moving towards the low power of the warm channel dominates a cool CCT, while increasing the power of the warm channel leads to a warmer CCT. In Figure 7b the level sets are lines on which to maintain a constant illuminance the powers of the warm and cool channel must always be compensated.
In the testing phase, a comparison between the expected CCT and illuminance values and those measured by illuminance spectrophotometer were carried out. For a more accurate analysis, the distributions of the relative percentage differences of the CCT and illuminance values were calculated as follows:
P r e l ( % ) = [ ( P m e a s u r e d P e x p e c t e d ) / P m e a s u r e d ] · 100
where P m e a s u r e d and P e x p e c t e d are the values of the generic lighting parameters P (CCT or illuminance) for the measured and expected value. 
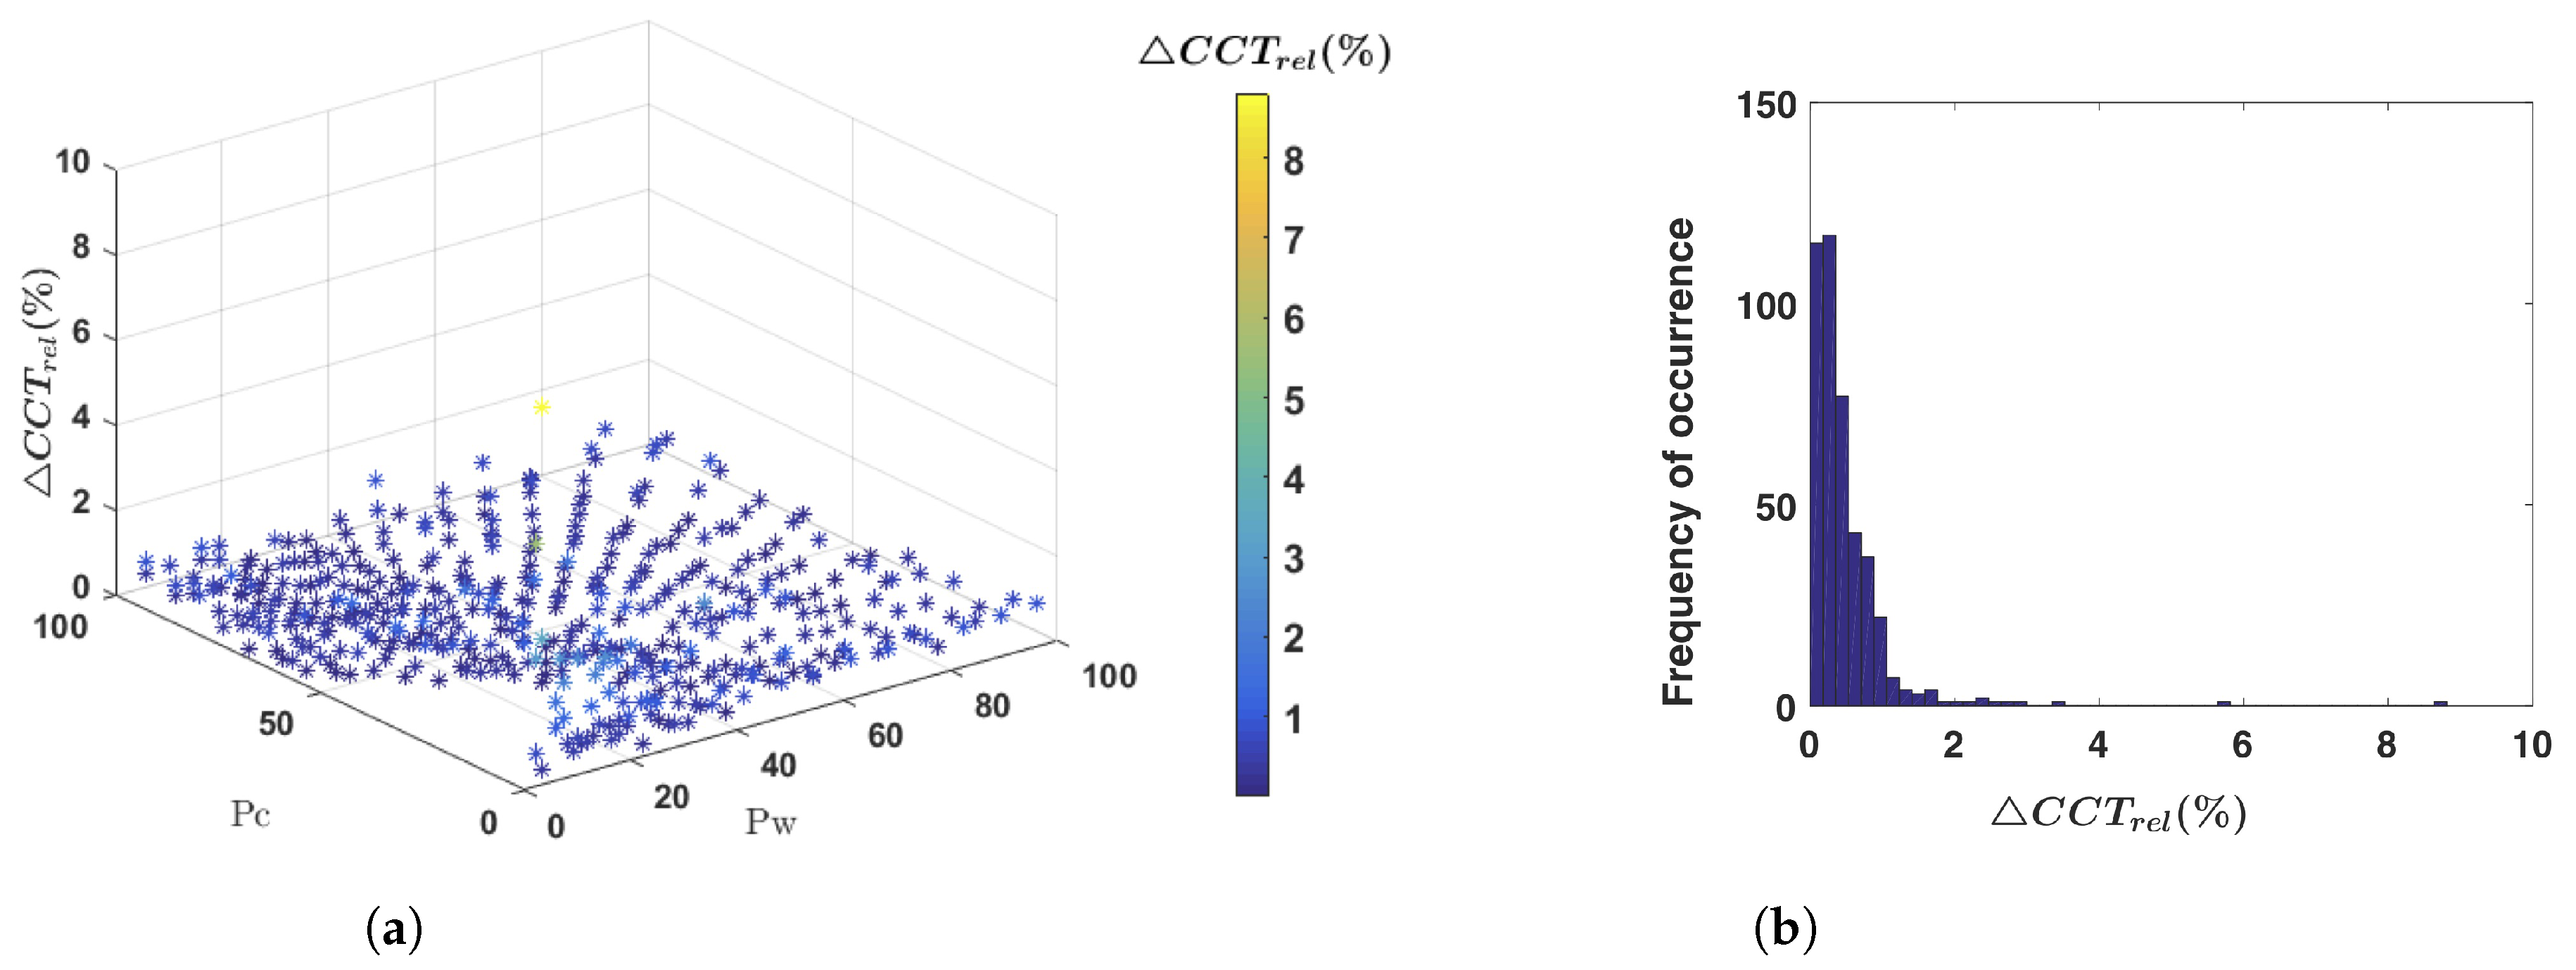
Figure 9a shows the distribution of the relative percentage differences of the CCT for a LED light source used in the testing phase. It shows the distribution as a function of power, highlighting slightly greater errors for low values; while Figure 9b loses the link with the input power of the LED light source and it shows the final results of both LED light sources. Anyway, it is possible to observe how the distribution converges to 0%, with a maximum of 0.3% for CCT.
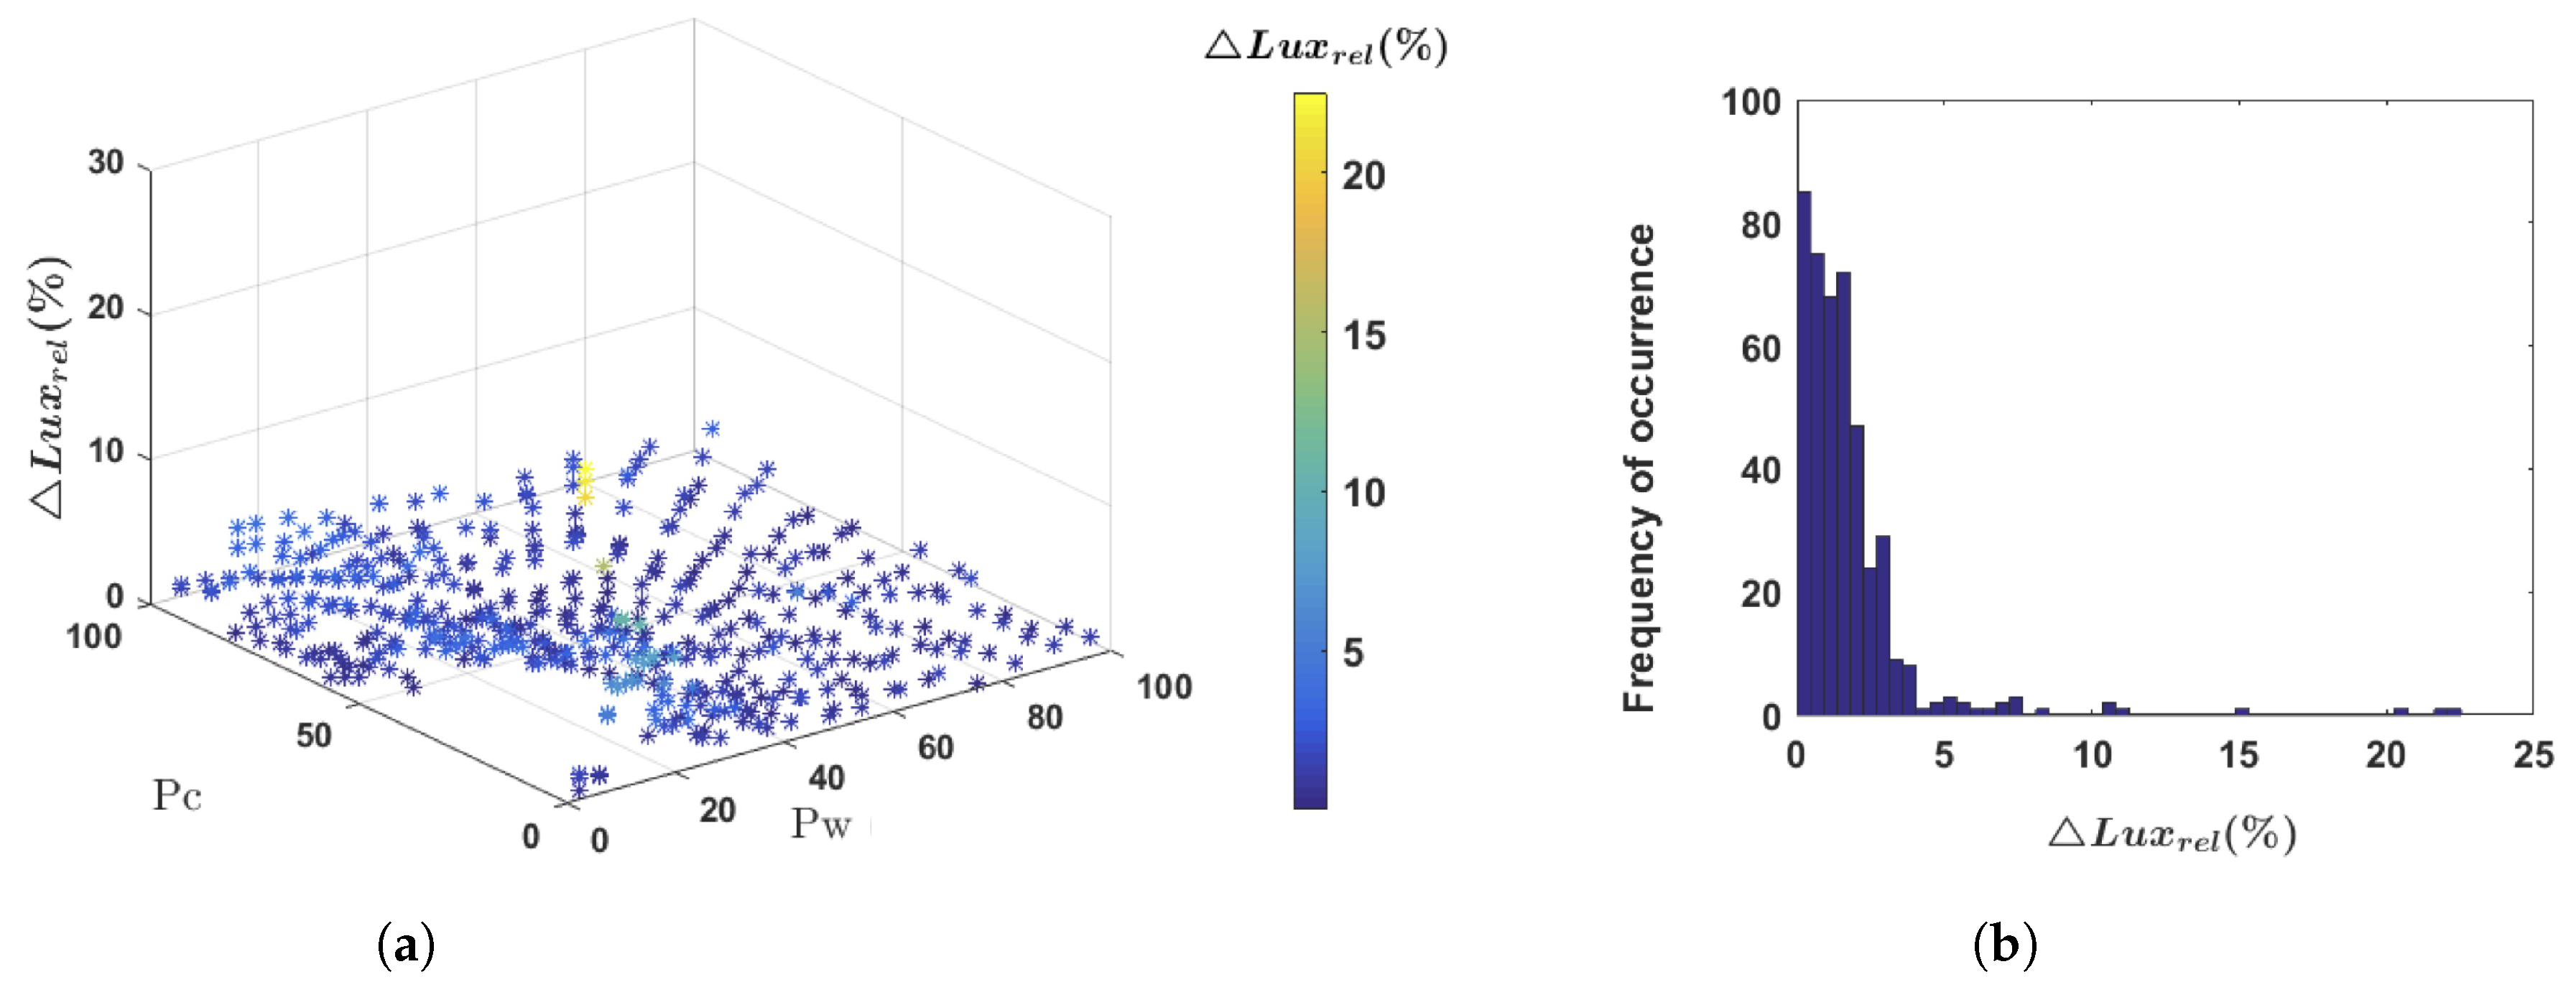
The obtained results for the illuminance are shown in Figure 10. Figure 10a shows the space distribution of the relative percentage values of the illuminance for a LED light source, reaching a maximum error percentage of 23% at low input power supply. The Figure 10b shows the overall results of both LED light sources used for the model validation. The results show a maximum error of 1.5%. Unlike the CCT, for illuminance, greater errors at low power values were obtained (Figure 10a). The higher error rate at low input powers is justified by the low reflection of the sphere at low light intensities and by the sensitivity of Minolta at low power values.
In 
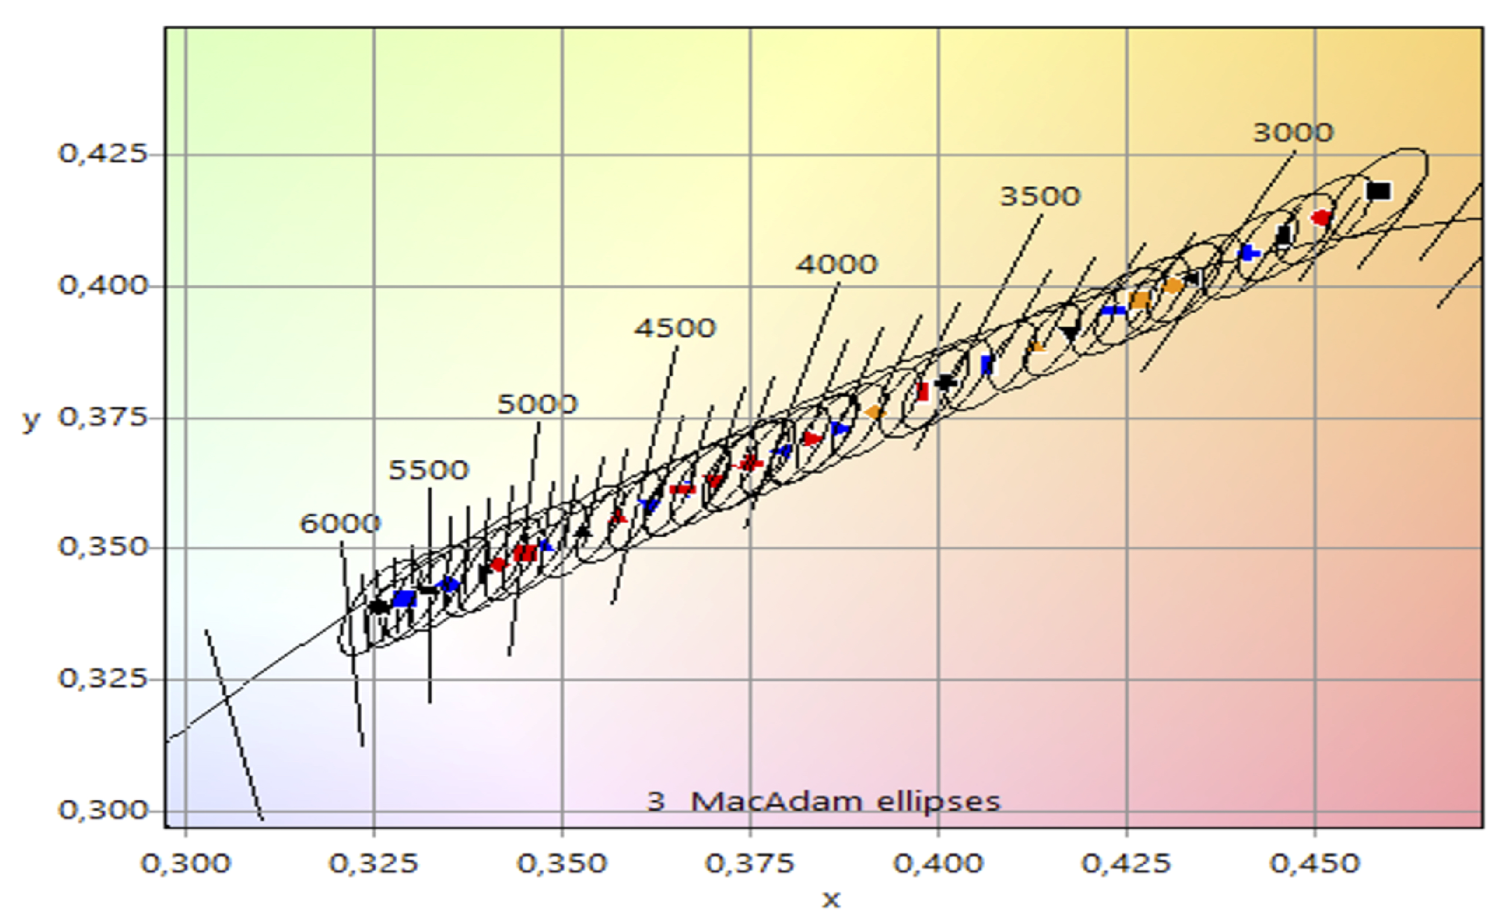
Figure 11 the response of the LED light source in CIE 1931 graph as a function of input powers is illustrated, in particular the regions of uncertainty (3-step MacAdam as reported in the LED’s datasheet), and so the error that can be committed with the developed model has been reported.

5. Conclusions

This paper presents an efficient method for characterizing the LED light sources used in the new lighting system installed in the Scrovegni Chapel, Padua, Italy. These LED light sources are based on Tunable White technology in which the LED drivers are generally controlled in power without knowing the exact values of illuminance and Correlated Color Temperature emitted by the LEDs. The work represents the first world example of LED light source characterization based on illuminance and Correlated Color Temperature measurements. In order to find a mathematical model to describe the response of the LED light source as a function of the expected values of CCT and illuminance, a series of measures has been performed in the training phase. Based on the least squares method, a mathematical model has been developed to estimate the right power supply of the warm and cool channels to obtain the desired values of illuminance and CCT. Subsequently, the model has been validated through a testing phase verifying the correspondence of CCT and illuminance values measured and those set in the mathematical model. Results show a low error rate between expected and measured values. The proposed mathematical model can be used to find the power values to be set to warm and cool channels of the LED light sources, obtaining an accurate characterization of the light emitted quality. Based on this study, the combined control of warm and cool LEDs generates the expected lighting performance, creating a system capable of controlling light in real-time, maintaining the lighting parameters at the expected constant values without exceeding the thresholds imposed by standards in cultural heritage applications. Therefore, using the developed mathematical model, it is possible to offer compliance with the specifications in lighting systems and the best visual perception in cultural heritage applications, such as the Scrovegni Chapel one. Moreover, the proposed method for model development can be useful and applicable in any other scenarios or to any other LED light source.

Author Contributions

Conceptualization, S.R., A.B., L.P. and P.P.; Data curation, S.R. and L.P.; Formal analysis, S.R., A.B., L.P. and P.P.; Investigation, S.R., A.B., L.P. and P.P.; Methodology, S.R., A.B., L.P. and P.P.; Project administration, P.C. and P.P.; Resources, S.R.; Software, S.R. and A.B.; Supervision, M.G. and P.P.; Validation, S.R., A.B., L.P. and P.P.; Visualization, S.R.; Writing—original draft, S.R., A.B., L.P. and P.P.; Writing—review and editing, S.R., A.B., L.P. and P.P.

Funding

This research was funded by Department of Information Engineering (DII), Università Politecnica delle Marche grant number RSA-B2018.

Acknowledgments

The authors are grateful to the iGuzzini Illuminazione S.p.A. (www.iguzzini.com) for the opportunity to carry out this research work, they also acknowledge for the technical support of the materials used for experiments.

Conflicts of Interest

The authors declare no conflict of interest.

References

  1. Rachev, I.; Djamiykov, T.; Marinov, M.; Hinov, N. Improvement of the Approximation Accuracy of LED Radiation Patterns. Electronics 2019, 8, 337. [Google Scholar] [Green Version]
  2. Soh, M.Y.; Teo, T.H.; Selvaraj, S.L.; Peng, L.; Disney, D.; Yeo, K.S. Heterogeneous Integration of GaN and BCD Technologies. Electronics 2019, 8, 351. [Google Scholar] [Green Version]
  3. Garcia, J.; Saeed, S.; Quintana, P.; Cardesin, J.; Georgious, R.; Dalla Costa, M.A.; Camponogara, D. Optimization of a Series Converter for Low-Frequency Ripple Cancellation of an LED Driver. Electronics 2019, 8, 664. [Google Scholar] [Green Version]
  4. Shur, M.S.; Zukauskas, R. Solid-state lighting: Toward superior illumination. Proc. IEEE 2005, 93, 1691–1703. [Google Scholar]
  5. Schubert, E.F.; Kim, J.K. Solid-state light sources getting smart. Science 2005, 308, 1274–1278. [Google Scholar] [PubMed]
  6. Wang, Y.; Alonso, J.M.; Ruan, X. A review of LED drivers and related technologies. IEEE Trans. Ind. Electron. 2017, 64, 5754–5765. [Google Scholar]
  7. Xiu, Z.; Li, H. Smart Lighting System with Brightness and Color Temperature Tunable. In Proceedings of the 2014 Seventh International Symposium on Computational Intelligence and Design, Hangzhou, China, 13–14 December 2014; Volume 2, pp. 183–186. [Google Scholar]
  8. Miki, M.; Hiroyasu, T.; Imazato, K. Proposal for an intelligent lighting system, and verification of control method effectiveness. Proc. IEEE CIS 2004, 1, 520–525. [Google Scholar]
  9. Bauer, M.; Glenn, T.; Monteith, S.; Gottlieb, J.F.; Ritter, P.S.; Geddes, J.; Whybrow, P.C. The potential influence of LED lighting on mental illness. World J. Biol. Psychiatry 2018, 19, 59–73. [Google Scholar]
  10. Trivellin, N.; Meneghini, M.; Ferretti, M.; Barbisan, D.; Dal Lago, M.; Meneghesso, G.; Zanoni, E. Effects and exploitation of tunable white light for circadian rhythm and human-centric lighting. In Proceedings of the 2015 IEEE 1st International Forum on Research and Technologies for Society and Industry Leveraging a better tomorrow (RTSI), Turin, Italy, 16–18 September 2015; pp. 154–156. [Google Scholar]
  11. Kim, D.; Ahn, S.; Park, S.; Whang, M. Interactive emotional lighting system using physiological signals. IEEE Trans. Consum. Electron. 2013, 59, 765–771. [Google Scholar]
  12. Royer, M.; Tuttle, R.; Rosenfeld, S.; Miller, N. Color Maintenance of LEDs in Laboratory and Field Applications; U.S. Department of Energy: Oak Ridge, TN, USA, 2013.
  13. Pierleoni, P.; Belli, A.; Palma, L.; Valenti, S.; Raggiunto, S.; Incipini, L.; Ceregioli, P. The Scrovegni Chapel Moves into the Future: An Innovative Internet of Things Solution Brings New Light to Giotto’s Masterpiece. IEEE Sens. J. 2018, 18, 7681–7696. [Google Scholar]
  14. Yang, W.; Zhong, P.; Mei, S.; Chen, Q.; Zhang, W.; Zhu, J.; Guo, R.; He, G. Photometric optimization of color temperature tunable quantum dots converted white LEDs for excellent color rendition. IEEE Photonics J. 2016, 8, 1–11. [Google Scholar]
  15. Hecht, S. The visual discrimination of intensity and the Weber-Fechner law. J. Gen. Physiol. 1924, 7, 235–267. [Google Scholar] [PubMed]
  16. Barbrow, L. International lighting vocabulary. J. SMPTE 1964, 73, 331–332. [Google Scholar]
  17. U.S. Department of Energy. Energy Efficiency and Renewable Energy, LED Color Characteristics. In Solid-State Lighting Technology Fact Sheet; U.S. Department of Energy: Oak Ridge, TN, USA, 2016. [Google Scholar]
  18. Wyszecki, G.; Stiles, W.S. Color Science; Wiley: New York, NY, USA, 1982; Volume 8. [Google Scholar]
  19. Narendran, N.; Deng, L.; Freyssinier, J.P.; Yu, H.; Gu, Y.; Cyr, D.; Taylor, J. Developing Color Tolerance Criteria for White LEDs; Lighting Research Center: Troy, NY, USA, 2004. [Google Scholar]
  20. Loo, K.; Lun, W.K.; Tan, S.C.; Lai, Y.; Chi, K.T. On driving techniques for LEDs: Toward a generalized methodology. IEEE Trans. Power Electron. 2009, 24, 2967–2976. [Google Scholar]
  21. Tamura, T.; Setomoto, T.; Taguchi, T. Illumination characteristics of lighting array using 10 candela-class white LEDs under AC 100 V operation. J. Lumin. 2000, 87, 1180–1182. [Google Scholar]
  22. Myers, R.H. Classical and Modern Regression with Applications; Duxbury Press: Belmont, CA, USA, 1990; Volume 2. [Google Scholar]
Figure 1. The right dimming curve of LED light sources (exponential) to have a linear perception of the increase in light intensity starting from a logarithmic trend of the eye’s sensitivity; the Dimming Signal (blue) represents the increase of illuminance curve.
Electronics 08 01089 g001
Figure 2. Linear controllers and exponential dimming curve in the LED drivers for exponential LED light source response are necessary; the Dimming Signal (blue) represents the increase of the illuminance curve.
Electronics 08 01089 g002
Figure 3. The mean values of the junction temperature of the cool channel (black) and warm channel (gray) of the LED light source increasing as a function of time.
Electronics 08 01089 g003
Figure 4. The Laser Blade is based on 7 cool Correlated Color Temperature (CCT) LEDs and 8 warm CCT LEDs positioned alternately with each other.
Electronics 08 01089 g004
Figure 5. The measurement setup: (a) the recommended sphere geometries by the standard for total luminous measurement of the product; (b) the architecture realized.
Electronics 08 01089 g005
Figure 6. The LED light sources distribution in the CIE 1931 graph: (a) powering at 100% first only the cool LEDs and then only the warm LEDs, in red the average of the samples; (b) zoom of cool channel; (c) zoom of warm channel.
Electronics 08 01089 g006
Figure 7. Average surface curves, representative of the entire family of LED light sources and the respective level sets; (a) CCT trend as a function of the power supply percentage; (b) illuminance trend as a function of the power supply percentage.
Electronics 08 01089 g007
Figure 8. Developed interface to estimate the channels power (cool and warm) as a function of the desired Correlated Color Temperature and illuminance, with the representation of the point in the CIE 1931 graph.
Electronics 08 01089 g008
Figure 9. Results of the testing phase: (a) distributions of the relative percentage differences of parameter between the expected andmeasured CCT as a function of the input power for the test point; (b) Histogram of the relative percentage differences calculated for the test point of the two LED light sources.
Electronics 08 01089 g009
Figure 10. Results of the testing phase: (a) distributions of the relative percentage differences of parameter between the expected and measured illuminance as a function of the input power for the test point; (b) Histogram of the relative percentage differences calculated for the test point of the two LED light sources.
Electronics 08 01089 g010
Figure 11. Distribution of some midpoints of the measurements of the training phase in the CIE 1931 graph is shown as a function of different input power for the warm and cool channel; the 3-step MacAdams represent the uncertainty of the mathematical model.
Electronics 08 01089 g011

