Article

A Controlled-Environment Quality Assessment of Android GNSS Raw Measurements

Department of Electronics and Telecommunications (DET), Politecnico di Torino, Corso Duca Degli Abruzzi 24, 10129 Torino, Italy
*
Author to whom correspondence should be addressed.
Electronics 2019, 8(1), 5; https://doi.org/10.3390/electronics8010005
Submission received: 8 November 2018 / Revised: 18 December 2018 / Accepted: 19 December 2018 / Published: 21 December 2018
(This article belongs to the Section Computer Science & Engineering)

Abstract

:
Raw Global Navigation Satellite System (GNSS) measurements have been available since 2016 in select Android smartphones. The availability of such observations allows smartphones users, in principle, to significantly improve the quality of GNSS-based positioning by applying customized and advanced positioning algorithms. However, the quality of such measurements is poor, mainly because of the low quality of smartphone hardware components and the nonideal environment in which phones are typically used. To overcome this problem and to separate the contribution of the hardware components and signal quality, dedicated test campaigns were carried out in a real environment and in a controlled-environment anechoic chamber using several different Android models. In addition, signal-processing techniques aimed at increasing the accuracy and precision of the solution were employed. Results show that the quality of the data captured in the anechoic chamber was significantly better than in real conditions. Furthermore, such analysis allows to underline certain phenomena in smartphones, such as the duty cycle, and to test the validity of anechoic environments for Android raw measurements.

1. Introduction

Nowadays, a variety of applications and services supporting our daily activities and needs, in a ubiquitous fashion, are based on mobile-communication technologies. Indeed, Location-Based Services (LBSs) are included in many mobile applications, widespread in our smartphones, and they constitute to an essential part of everyone’s daily life [1]. Global Navigation Satellites Systems (GNSSs), such as the Global Positioning System (GPS), Glonass, and Galileo, play a crucial role in enabling and improving positioning performance in smartphones. To support and encourage this rapid innovation trend, in 2016 Google made available raw GNSS measurements, retrieved from the enabled GNSS chipset for mobile devices. The measurements could be retrieved from the on-board GNSS chipset through Android’s Application Programming Interface (API) 24 on devices running Android 7+ equipped with enabled chips, thus improving their positioning and navigation performance. Starting from the availability of raw-code pseudoranges and Doppler measurements, developers implemented a number of precise-positioning algorithms based on such consumer-grade GNSS receivers [2,3]. Among these implementations, for instance, Doppler filtering and augmentation were investigated in Reference [4] to reach submeter accuracy. By exploiting carrier-phase observations on the enabled models, it is also possible to smooth code-based pseudorange measurements and reach decimeter-level accuracy without phase-ambiguity resolution, as successfully proposed in Reference [5]. The recent push to achieve precise positioning from Android smartphones thanks to the availability of their raw measurements has also been boosted by the release of a white paper from the European GNSS Agency (GSA) [6]. This allows for a clearer reference of the hardware performance of the devices, helping in more effective integration with other sensors and analysis of multiple GNSS constellations among many other applications. The aforementioned effective examples of improved positioning and navigation capabilities suggest valuable implementations of affordable smartphone GNSS hardware in different contexts.
Signal impairments, such as multipath, have been seen as the major deterrent in achieving accurate positioning affecting the Carrier to Noise Power Density Ratio ( C / N 0 ) up to 10 dB in certain Android devices, largely extending ambiguity-resolution time periods and causing cycle slips [7]. The problem of cycle slips, however, is mostly attributed to the presence of a power-saving function known as duty-cycling, a mode in which the GNSS chip is active only for a fraction of each second [8]. While code measurements are unaffected by interrupted signal tracking, the continuity of phase measurements is not achieved, resulting in cycle slips, which make any carrier-phase-based processing unusable [9]. Duty-cycle implementation is different in each Android phone and not explicitly declared by the manufacturer, which makes it difficult to distinguish from bad measurements. The option of switching duty cycle off has been implemented in the latest Android release (P), but not yet available at the time of writing.
To quantify the effects caused by signal impairments in a real environment, it is important to first determine the results of an ideal condition. In this work, differently from previous performance assessments [10], the performances of positioning algorithms based on raw GNSS measurements were investigated in a controlled environment: an anechoic chamber. The study allowed to determine the quality of the measurements without the presence of multipath and external spurious signals. The tests were performed by means of the record-and-replay technique [11] applied to simulated GNSS signals by means of an IFEN™NavX hardware signal generator and constellation simulator. Positioning solutions were evaluated with different carrier-smoothing algorithms to reach high precision and verify the performance of the obtained navigation solutions. First, a brief overview on GNSS technology and on how it is implemented in smartphones is provided in Section 2. Afterward, Section 3 describes the two key methodologies employed in the work to assess the quality of measurements in a controlled environment: the carrier smoothing technique and the use of an anechoic chamber. Section 4 reports all results and carefully compares the different scenarios. The conclusions are presented in Section 5.

2. GNSS Positioning and Basic Performance of Android Smartphones

GNSSs are space-based positioning systems developed starting from the early 1970s, offering to the users the capability to locate with at least meter-level accuracy anywhere on Earth, provided that at least four satellites are in good line-of-sight conditions [12,13]. GNSSs have been used for military, professional, and scientific reasons for a couple of decades and they entered the mass market only in the early 21st century. With the advent of powerful and cheap processors for mobile phones, GNSS naturally entered the world of smartphones, enabling such devices with positioning capabilities.

2.1. Pseudorange Measurements in GNSS Receivers

Positioning and navigation addressed by radio-navigation technologies, and in particular by GNSSs, concerns the solution to a problem called trilateration to determine time and space co-ordinates of a receiver with regard to a specific reference frame. The location of a GNSS receiver is, hence, expressed in Cartesian co-ordinates within a reference system such as the Earth-Centered Earth-Fixed (ECEF) frame, according to the addressed application. A generic positioning state can be defined as:
x ( t n ) b ( t n ) = x ( t n ) y ( t n ) z ( t n ) b ( t n ) T ,
where b ( t n ) is a biased term due to the clock misalignment of the receiver with regard to the reference time scale of the considered satellite constellation (e.g., GPS, Galileo, GLONASS, Beidou).
In order to estimate the terms in Reference (1), range measurements from GNSS satellites are collected to solve for the correspondent trilateration problem. Code-based pseudoranges are estimated by the receiver through the measurement of the time-of-flight of the signals from each visible satellite ( i ( 1 , 2 , , N ) ) collected as a measurements vector ρ ^ ( t n ) = ρ ^ 1 ( t n ) ρ ^ 2 ( t n ) ρ ^ N ( t n ) T . The generic pseudorange measurement, ρ ^ i ( t n ) , is typically observed as a random variable due to the nondeterministic impairments affecting the signal (e.g., ionospheric, tropospheric, ephemeris, and relativistic errors) [13]. A raw pseudorange measurement can be defined as:
ρ ^ i ( t n ) = | | x ( t n ) x i ( t n ) | | + c · b ( t n ) + Σ ρ ( t n ) ,
where Σ ρ ( t n ) collects all the error contributions affecting the measurement, while the clock bias term, b ( t n ) , is multiplied by the speed of light and is common to all the measurements. Once bias corrections are applied, a corrected pseudorange measurement can be defined as:
ρ i ( t n ) = | | x ( t n ) x i ( t n ) | | + c · b ( t n ) + ξ ρ ( t n ) .
Error term ξ ρ ( t n ) is the User Equivalent Range Error (UERE) that models the independent residual error term left after the corrections [14].
A Position, Velocity, and Time (PVT) solution can be solved by an iterative Weighted Least-Squares (WLS) approach. At each iteration, the linearized system of the equation can be expressed in vector notation as:
Δ x ^ ( t n ) Δ b ^ ( t n ) = ( H T W H ) 1 H T W Δ ρ ( t n ) ,
where H is an N × 4 Jacobian matrix referred as the observation matrix or directional cosine matrix, obtained from the known co-ordinates of the observed satellites. W is referred as the weighting matrix and it aims at optimizing estimation by exploiting the different qualities of the retrieved pseudorange measurements. There are different techniques to determine the weights. For example, the inverse of the variance of each pseudorange measurement can also be used as other metrics related to the quality of the incoming signals, as explained in the following. With b ( t n ) being estimated through Equation (4), it can be subtracted from Equation (2) to obtain the final estimate of satellite-to-receiver range r ˜ i = ρ i ( t n ) c · b ( t n ) .

2.2. Positioning and Navigation with Android Smartphones

Following the release of raw GNSS measurements in Android smartphones, it became possible to directly compute pseudoranges and, in turn, to solve the trilateration problem employing advanced and customized techniques [6]. Raw GNSS data can be obtained from any supported phone through the GNSSLogger App released by Google, or similar available apps. Subsequently, raw data can be postprocessed by implementing custom software or through the official Google tool. In this work, the GNSSLogger App and the Google ‘gps-measurement-tools-master’ MATLAB® open source Toolbox, both available from the Android Developers website [15] have been used. The postprocessing tool was forked and upgraded to account for ionospheric and tropospheric delay corrections and to compute carrier-smoothed solutions.

2.3. Basic PVT with Raw Measurements

The raw GNSS data used in this section were collected during a dedicated campaign at Politecnico di Torino premises, on 19 October 2018. Ten minutes of raw GNSS data were stored using the GNSSLogger App. L1 C/A signals from GPS constellation were considered. Three different devices have been used:
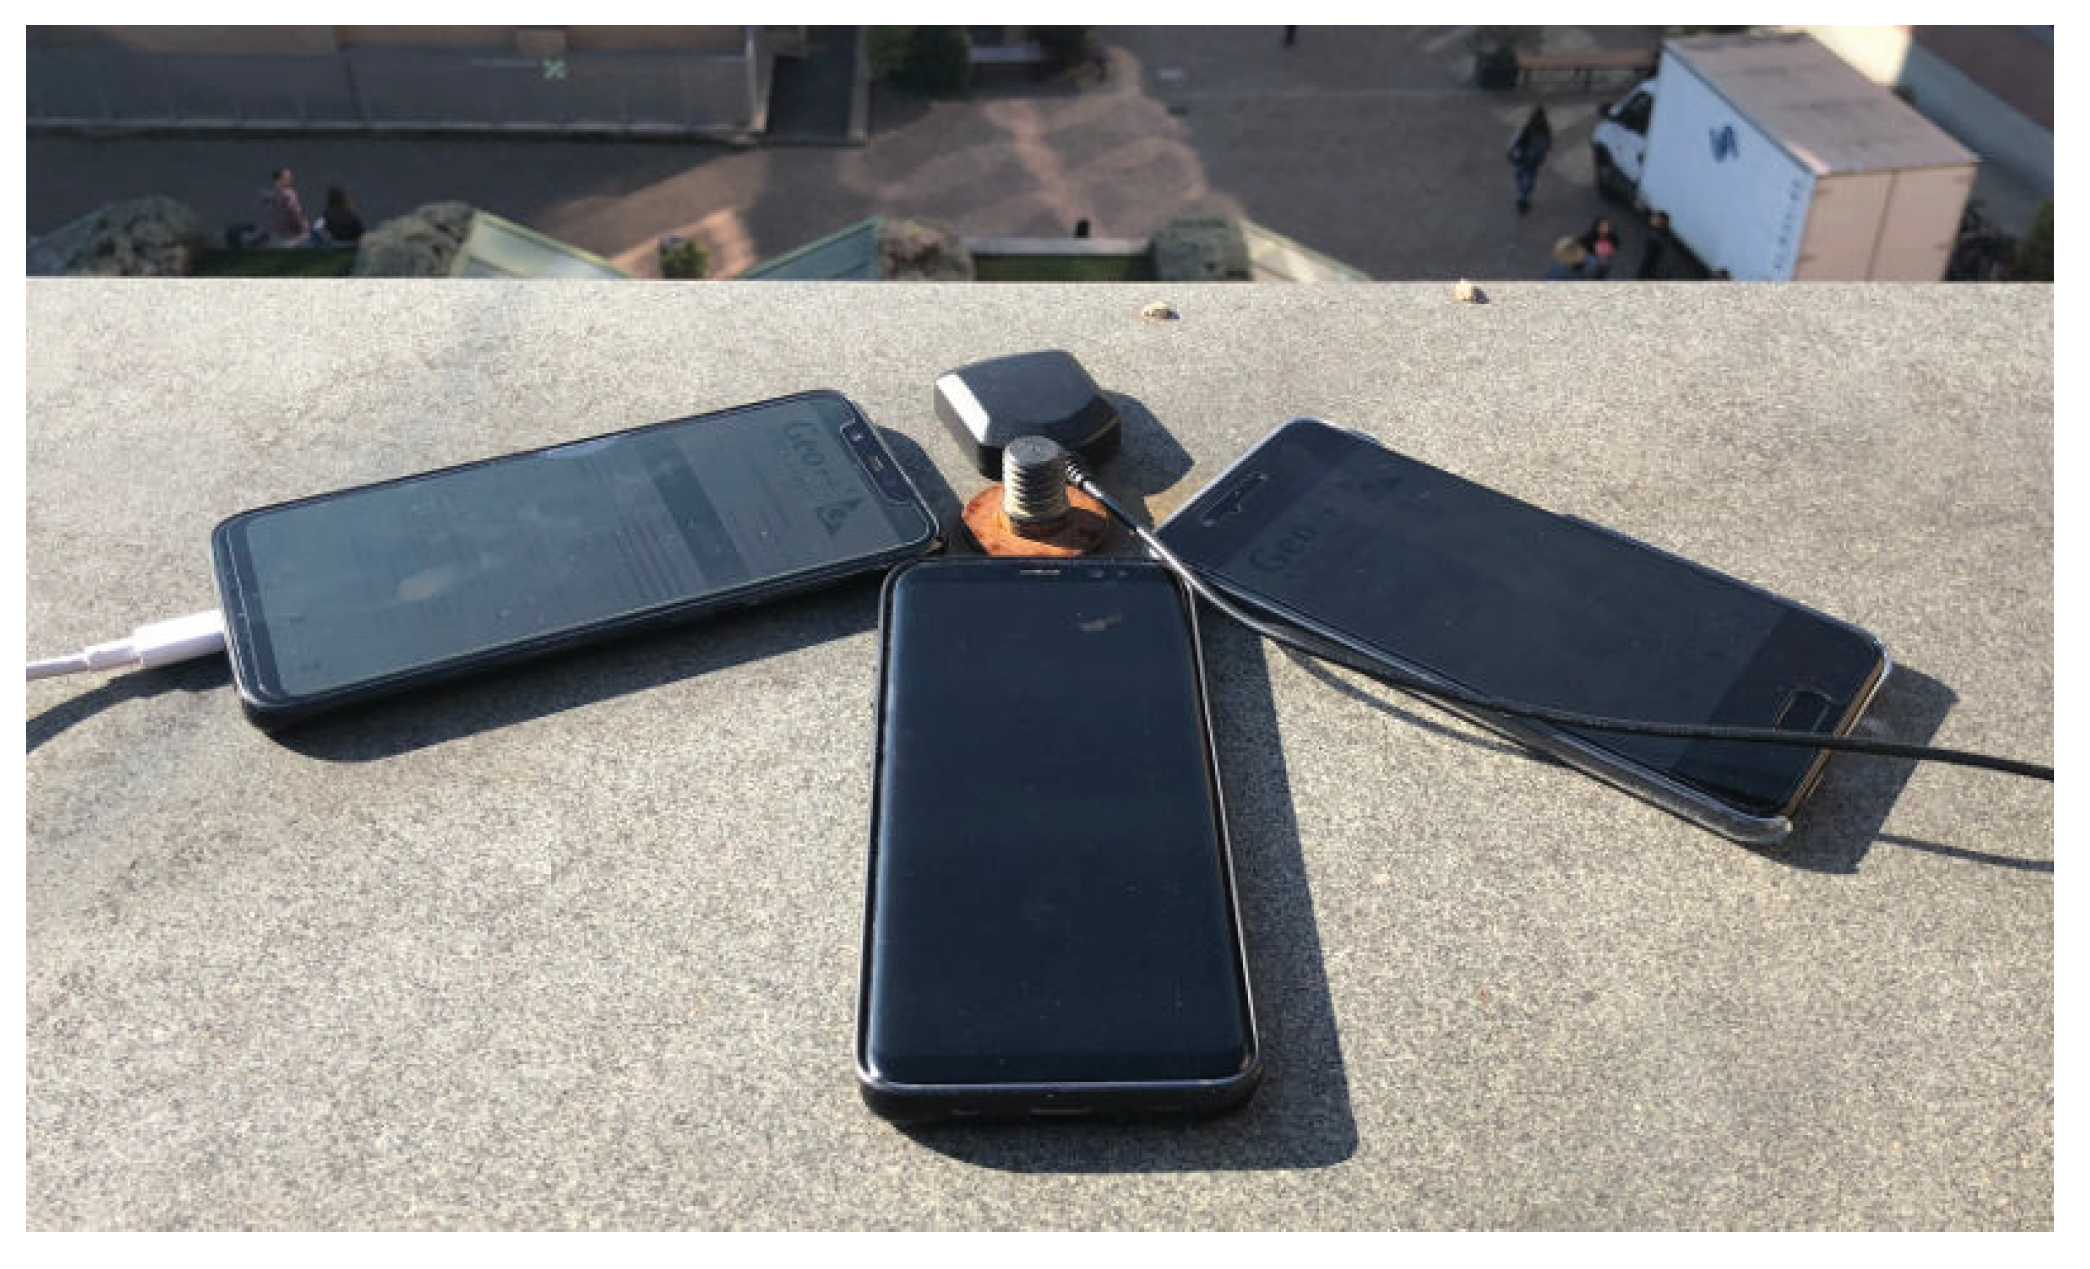
  • Xiaomi MI 8 (single-frequency mode) running Android 8, denoted as MI 8.
  • Samsung Galaxy S8 (Exynos 8895) running Android 8, denoted as S8.
  • Huawei P10 running Android 8, denoted as P10.
The position of the phones and of the georeferenced point are shown in Figure 1. The georeferenced point is used as a reference position for error computation. It has to be noted that, although it is a roof-top location, an incomplete open-sky view is available due to some higher buildings in the surroundings. Some known sky obstructions, as well as some multipath reflections are expected to affect the quality of the collected data.
GNSS signal strength is commonly evaluated through C / N 0 , defined as the ratio between carrier power C and noise power density N 0 [12]. C / N 0 is a good indicator of the quality of the signal and of the hardware components of the receiver, such as the antenna [16]. The C / N 0 of three GPS satellites, common to all three devices, was observed: Pseudo Random Noise (PRN) number 18 with the highest elevation ( 67 ), PRN number 20 with the lowest elevation ( 4 ), and PRN number 14 at medium elevation ( 31 ). Figure 2 displays the comparison between the C / N 0 as measured from the three different devices. The quality of the S8 and MI 8 devices is comparable, at least for the closer satellites, while the P10 device performed the worst in all cases. In the case of PRN 18, the three measurements differ by almost 5 dB. Furthermore, the S8 showed a more stable C / N 0 estimate. The MI 8, on the contrary, had the highest sensitivity, being able to gather measurements from a weaker signal, i.e., the farthest satellite, with more continuity and stability.
The comparison can also be made in terms of positioning solution errors. The position solutions obtained by running the Google Toolbox [17] were considered after the addition of atmospheric corrections to the toolbox by the authors. For this, the Klobuchar ionospheric model using broadcast ephemeris and the Hopfield troposphere model were implemented. For a fair comparison, a common subset of satellites were selected for all the smartphones, including GPS signals with PRN 1, 10, 11, 14, 18, 22, 27, and 32. Even though data collection was performed simultaneously and at the same location, it was not possible to ensure that all satellites were always in a tracking state for all the smartphones and, thus, to guarantee perfectly equal conditions. However, the appearance and disappearance of some of them is something to be expected considering the different hardware, and is indeed very representative of a realistic situation. For the sake of fairness, all signals that were in a tracking state for at least one epoch in all smartphones were considered. Furthermore, PRN 20 was excluded from analysis given its very low quality, also shown in Figure 2. Excluding a few outliers, Horizontal Dilution Of Precision (HDOP) always ranges between the excellent values of 1.1 and 1.3 for all smartphones, with a common slight increasing trend. The impact of the HDOP could then be considered negligible.
Figure 3 compares the horizontal positioning solutions of the three devices and of the reference control point obtained by means of Equation (4). The triangle indicates the average position of the three different models, while the colored points represent all the position solutions during the 10 min test. Covariance ellipses are also depicted by considering the 1- σ and 2- σ confidence interval of the horizontal joint distribution of the positioning solutions. It can be clearly seen that the Xiaomi MI 8 device outperforms the others, both in terms of accuracy and precision, by almost one order of magnitude. This is clearer in Figure 4, which shows the differences of the North and East co-ordinates of the devices from the true co-ordinates. Mi 8 measurements are, at the same time, more stable and accurate, while P10 and S8 measurements led to errors of up to tens of meters. A significant bias in the North direction was clearly visible on P10 and S8 devices.
Table 1 reports summary data that show the Huawei P10 having the worst performance, while the Samsung S8 seems to be slightly better. The MI8 outperforms all other devices, confirming that the quality of recent GNSS chipsets is higher and, in general, improving with time. Vertical positioning performance is poorer compared to the horizontal performance in all devices. Indeed, the algorithms used to remove the atmospheric biases were based on empirical models, able to remove, on average, 50% of the delay and thus residual uncompensated delay that could affect the results.

3. Methodology and Methods

The limitations of GNSS code pseudoranges are evident in the results presented in Section 2. To draw interesting conclusions it is then necessary to improve the quality of code measurements. On the one side, the large noise of code measurements is a limit to high accuracy LBSs in smartphones, and, in some cases, also prevents the possibility to benchmark the real capabilities of smartphone chipsets. A possible solution is given by signal-processing techniques based on measurement smoothing, as described in Section 3.1.
Furthermore, for professional receivers, an open-sky environment is a good scenario, while for mass-market devices, typically equipped with low-quality antennas and oscillators, it might still represent a challenging environment. This motivates the need to perform measurements in a controlled environment such as an anechoic chamber, as described in Section 3.2.

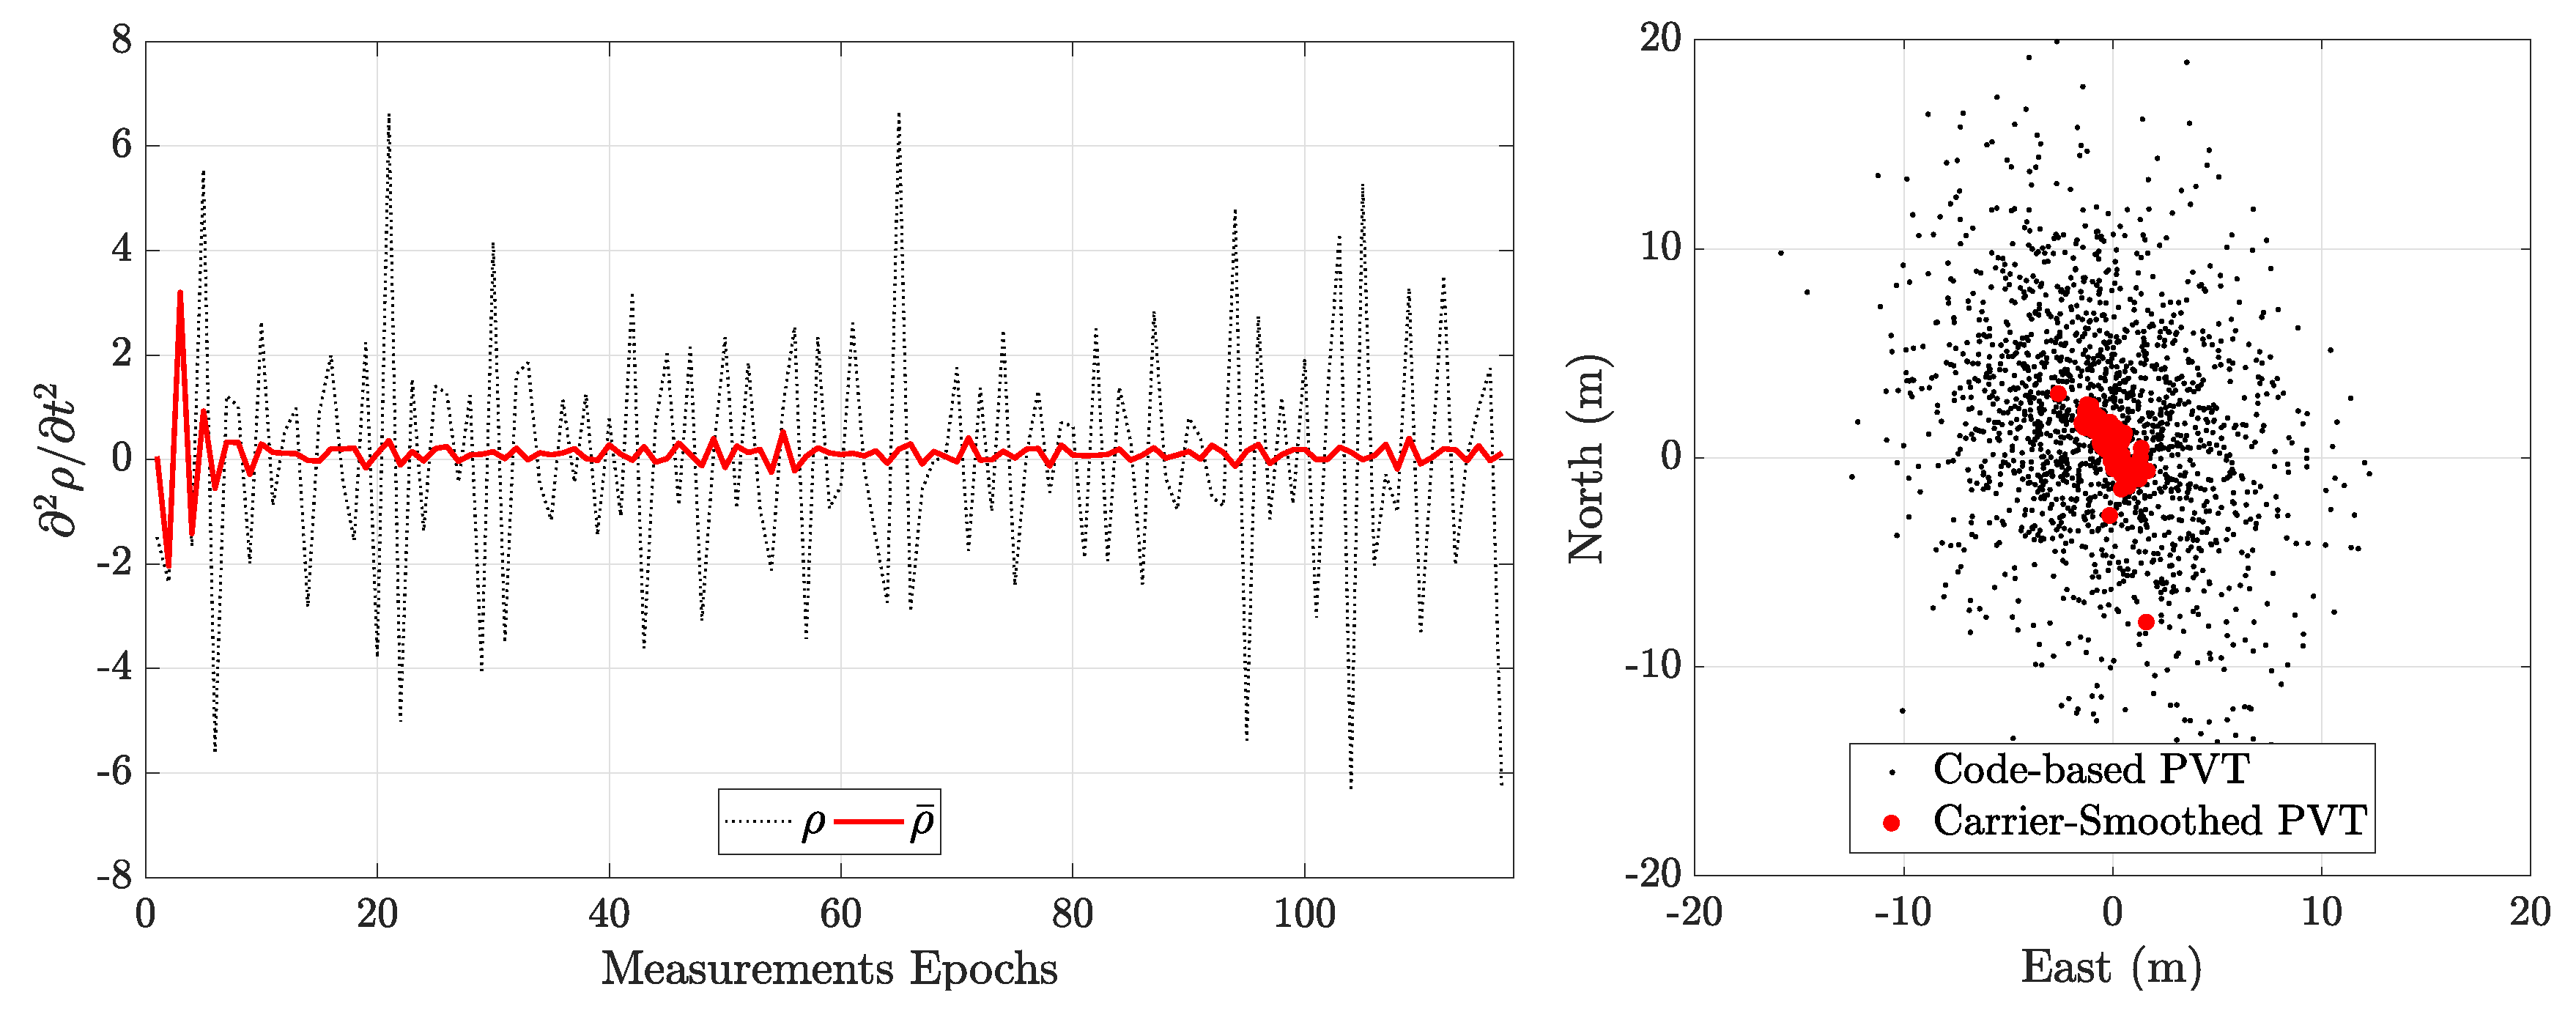
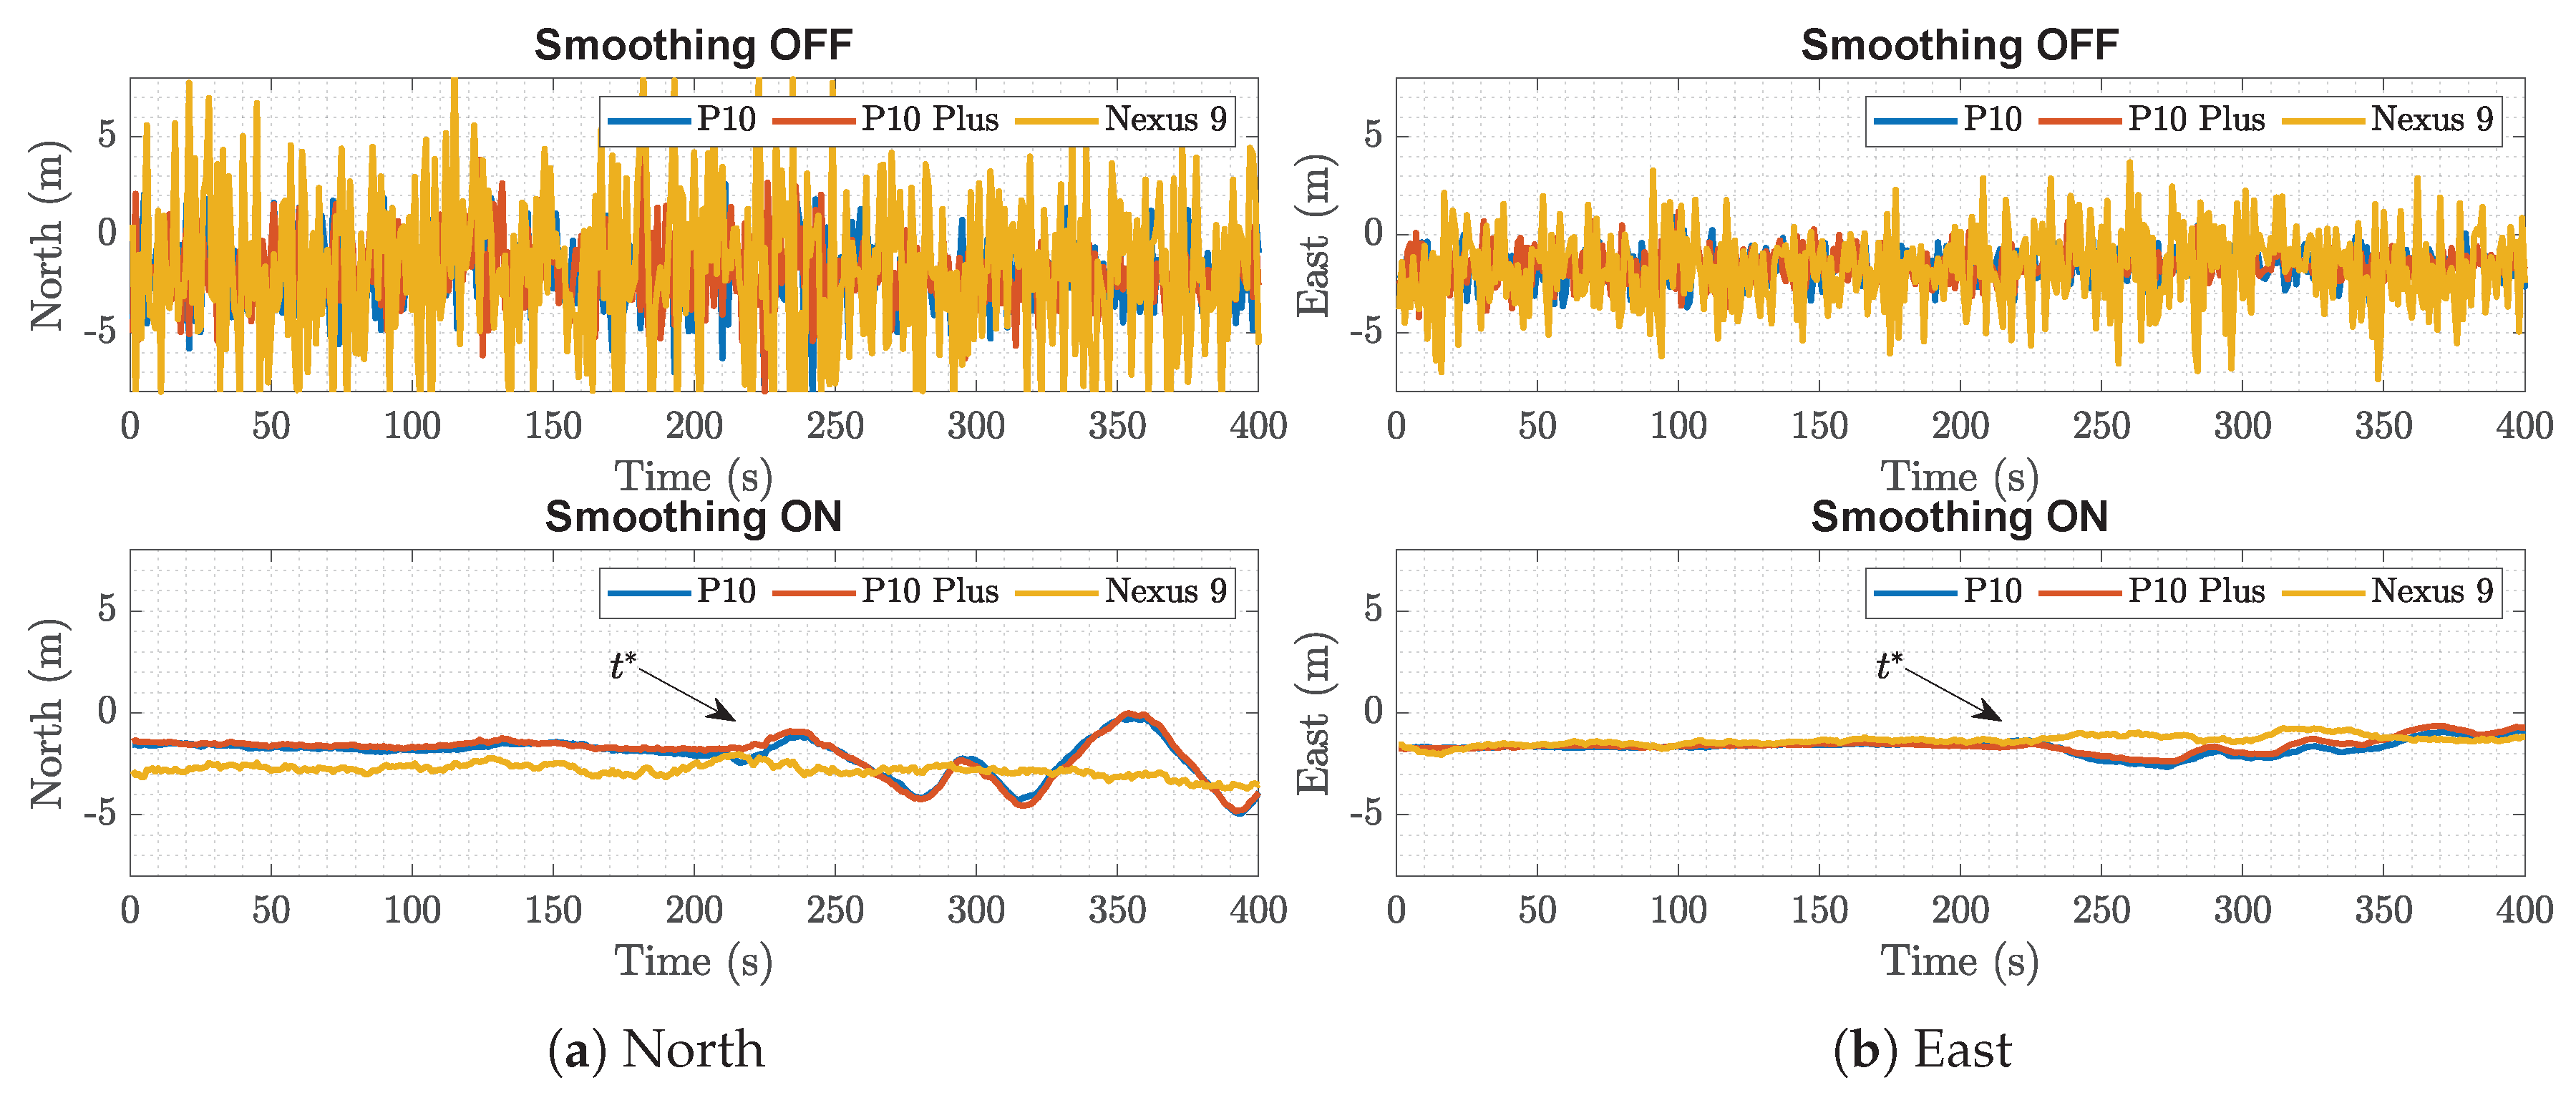
3.1. Smoothing of Code Pseudoranges

Code measurements are unambiguous but noisy; on the contrary, while carrier-phase measurements are much more precise but inherently ambiguous, and the process to solve for the integer ambiguity is non affordable by mass-market receivers [12]. An intermediate solution is based on the combination of code- and carrier-phase measurements through a process denoted carrier-smoothing filtering [18,19]. Let ρ ( t ) and Θ ( t ) be the code and carrier pseudorange, respectively. The smoothed pseudorange at epoch t n can then be defined by the following finite-difference equation:
ρ ¯ ( t n ) = 1 L ρ ( t n ) + L 1 L ρ ¯ ( t n 1 ) + Θ ( t n ) Θ ( t n 1 )
where L is a weight coefficient and Θ ( t n ) Θ ( t n 1 ) , called the delta pseudorange, which is obtained by differencing subsequent epochs. As long as no carrier-cycle slips occur, the integer-ambiguity term is constant and disappears thanks to the difference operation. While the noise term of code measurement ρ ( t n ) is at meter level, the noise term of the carrier-phase measurement Θ ( t n ) is at centimeter level. Furthermore, if the two measurement epochs are close enough to each other, in the order of a few seconds, the ionospheric delay term can be considered constant and thus disappears in the delta pseudorange. Parameter L controls the weight of the code and carrier contributions. A higher L assures lower noise variance, but introduces a bias in the smoothed code pseudorange due to the different sign of the ionospheric delay in code and phase measurements, known as code-carrier divergence. Carrier smoothing is indeed a valuable technique to improve the accuracy of the positioning solution in smartphones, which cannot employ pure carrier-phase measurements.
Figure 5 reports a comparison of raw pseudorange measurements and the correspondent smoothed version. The related positioning solution is obtained over 30 min of data. The error with respect to the true position, in East-North coordinates, is plotted on the right. The positioning obtained by exploiting code-based measurements is compared to the solution obtained exploiting carrier smoothing. The smoothing weight L was set to 100. The accuracy of the results improves by about one order of magnitude when smoothing is enabled. However, the carrier-smoothing measurements are valid as long as the phase measurements are stable and not affected by carrier-cycle slips. Impairments on the signal carrier phase can cause cycle slips, errors of one full cycle made by the receiver tracking loop in estimating the phase of the signal. Cycle slip, although being irrelevant for code-based measurements and for the purpose of estimating the carrier Doppler frequency, lead to errors in phase-based and carrier-smoothed measurements, and consequently to a degraded positioning performance.

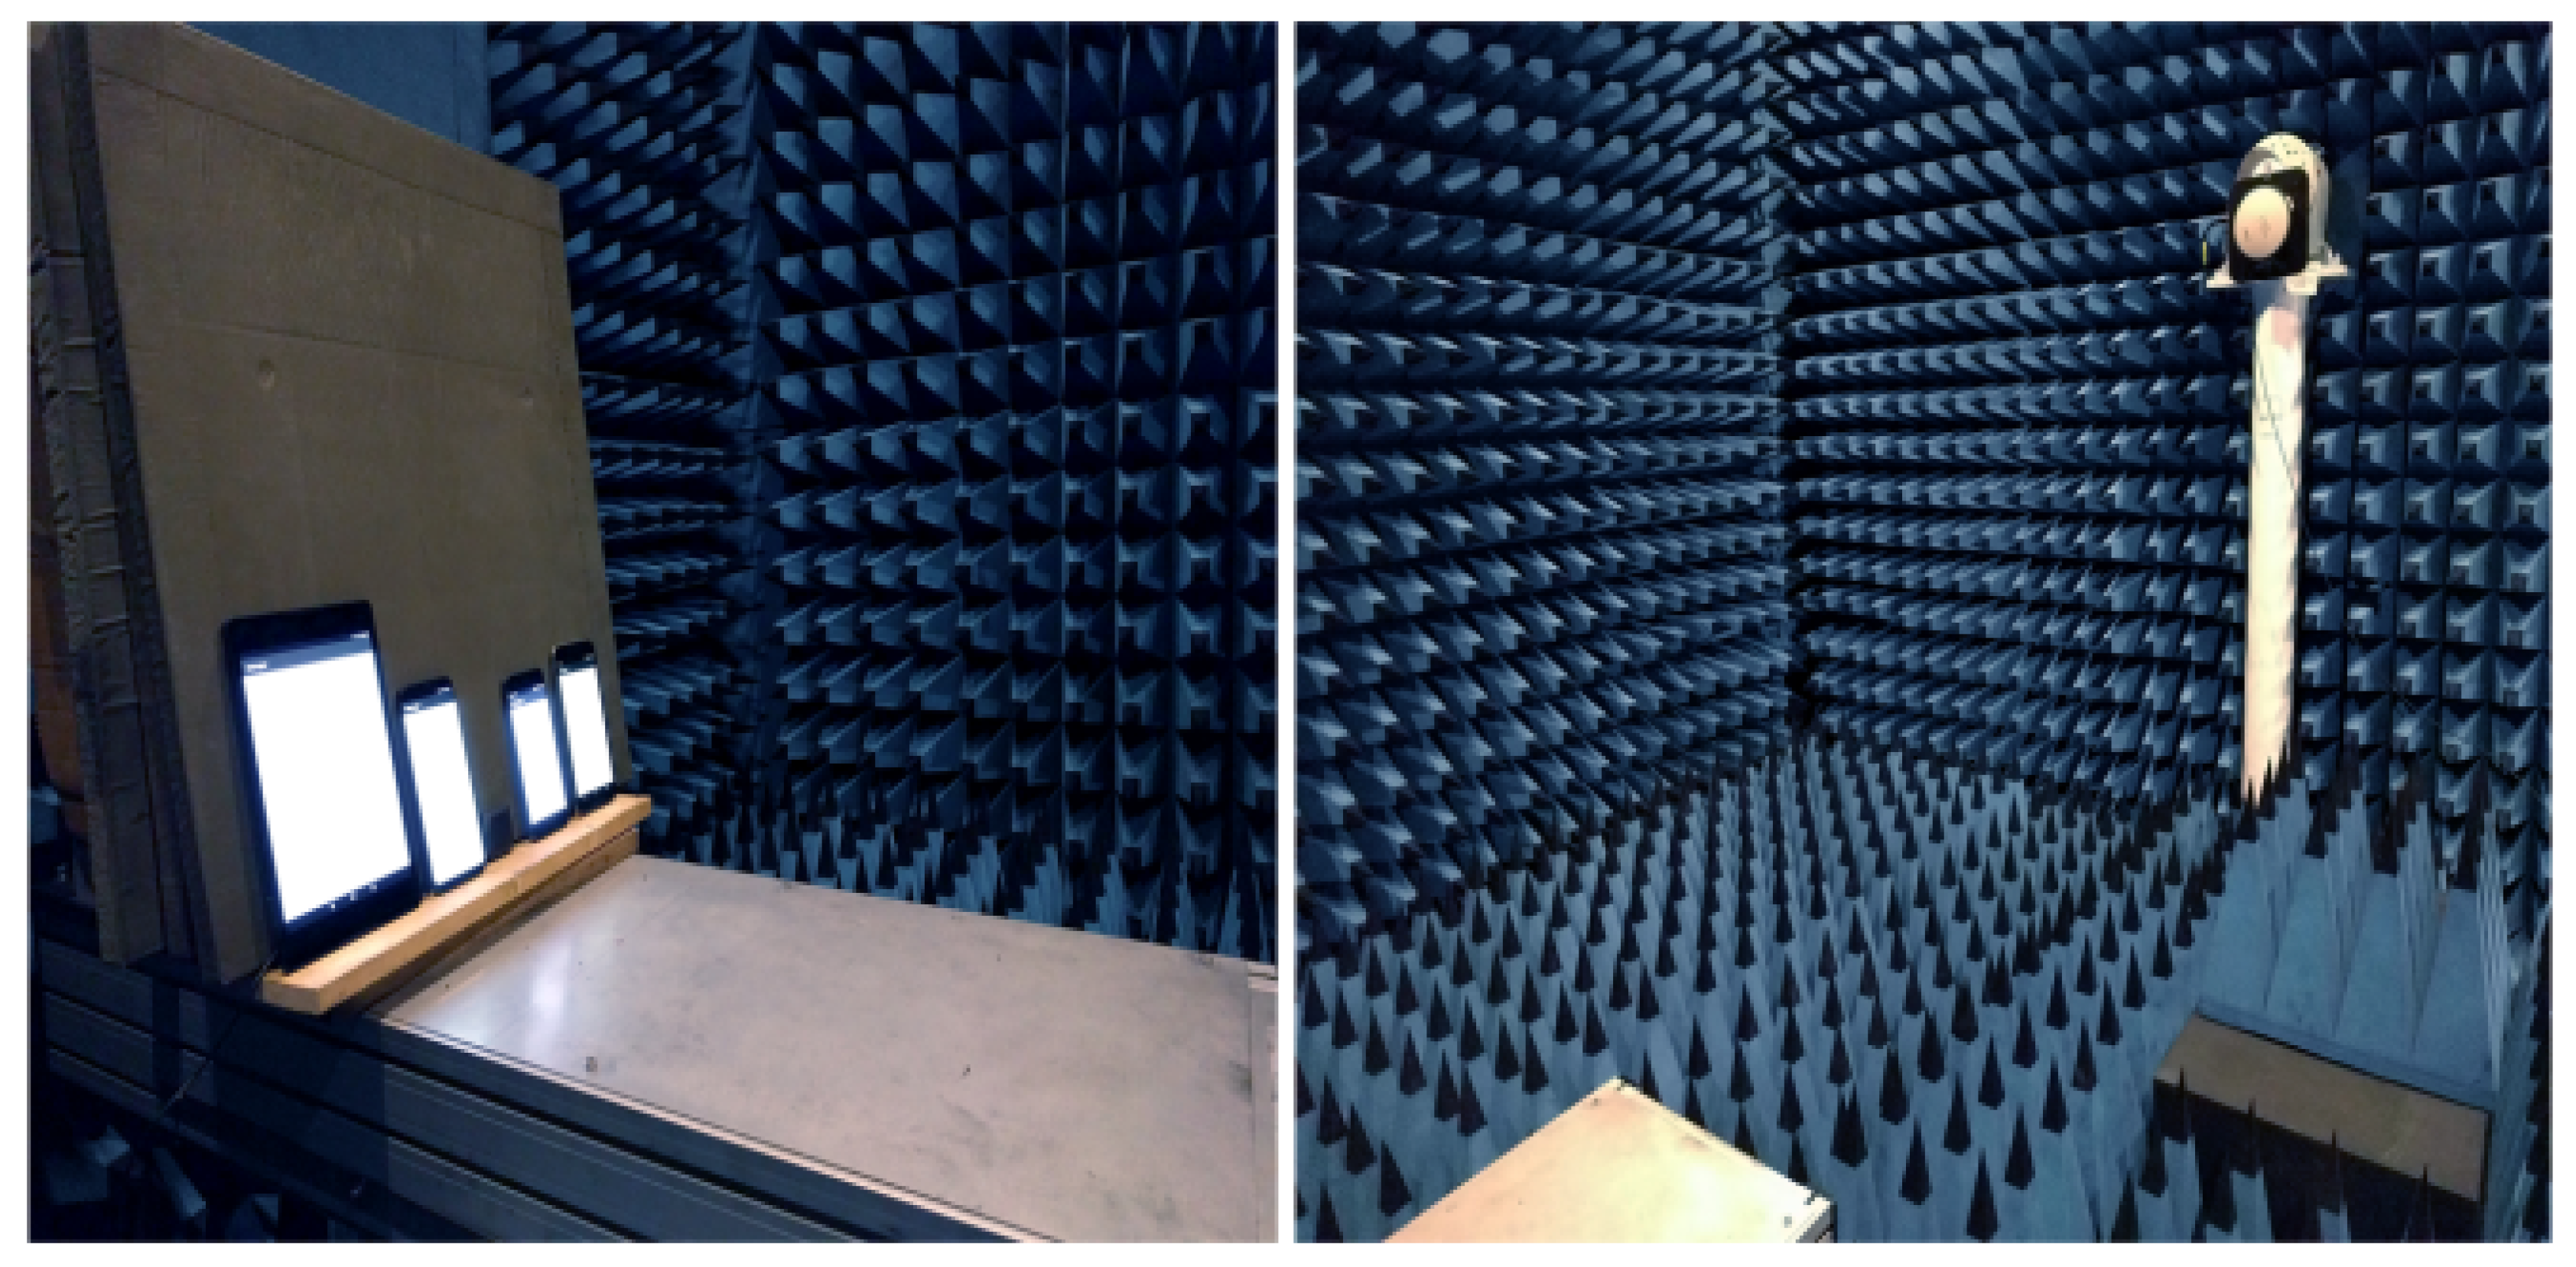
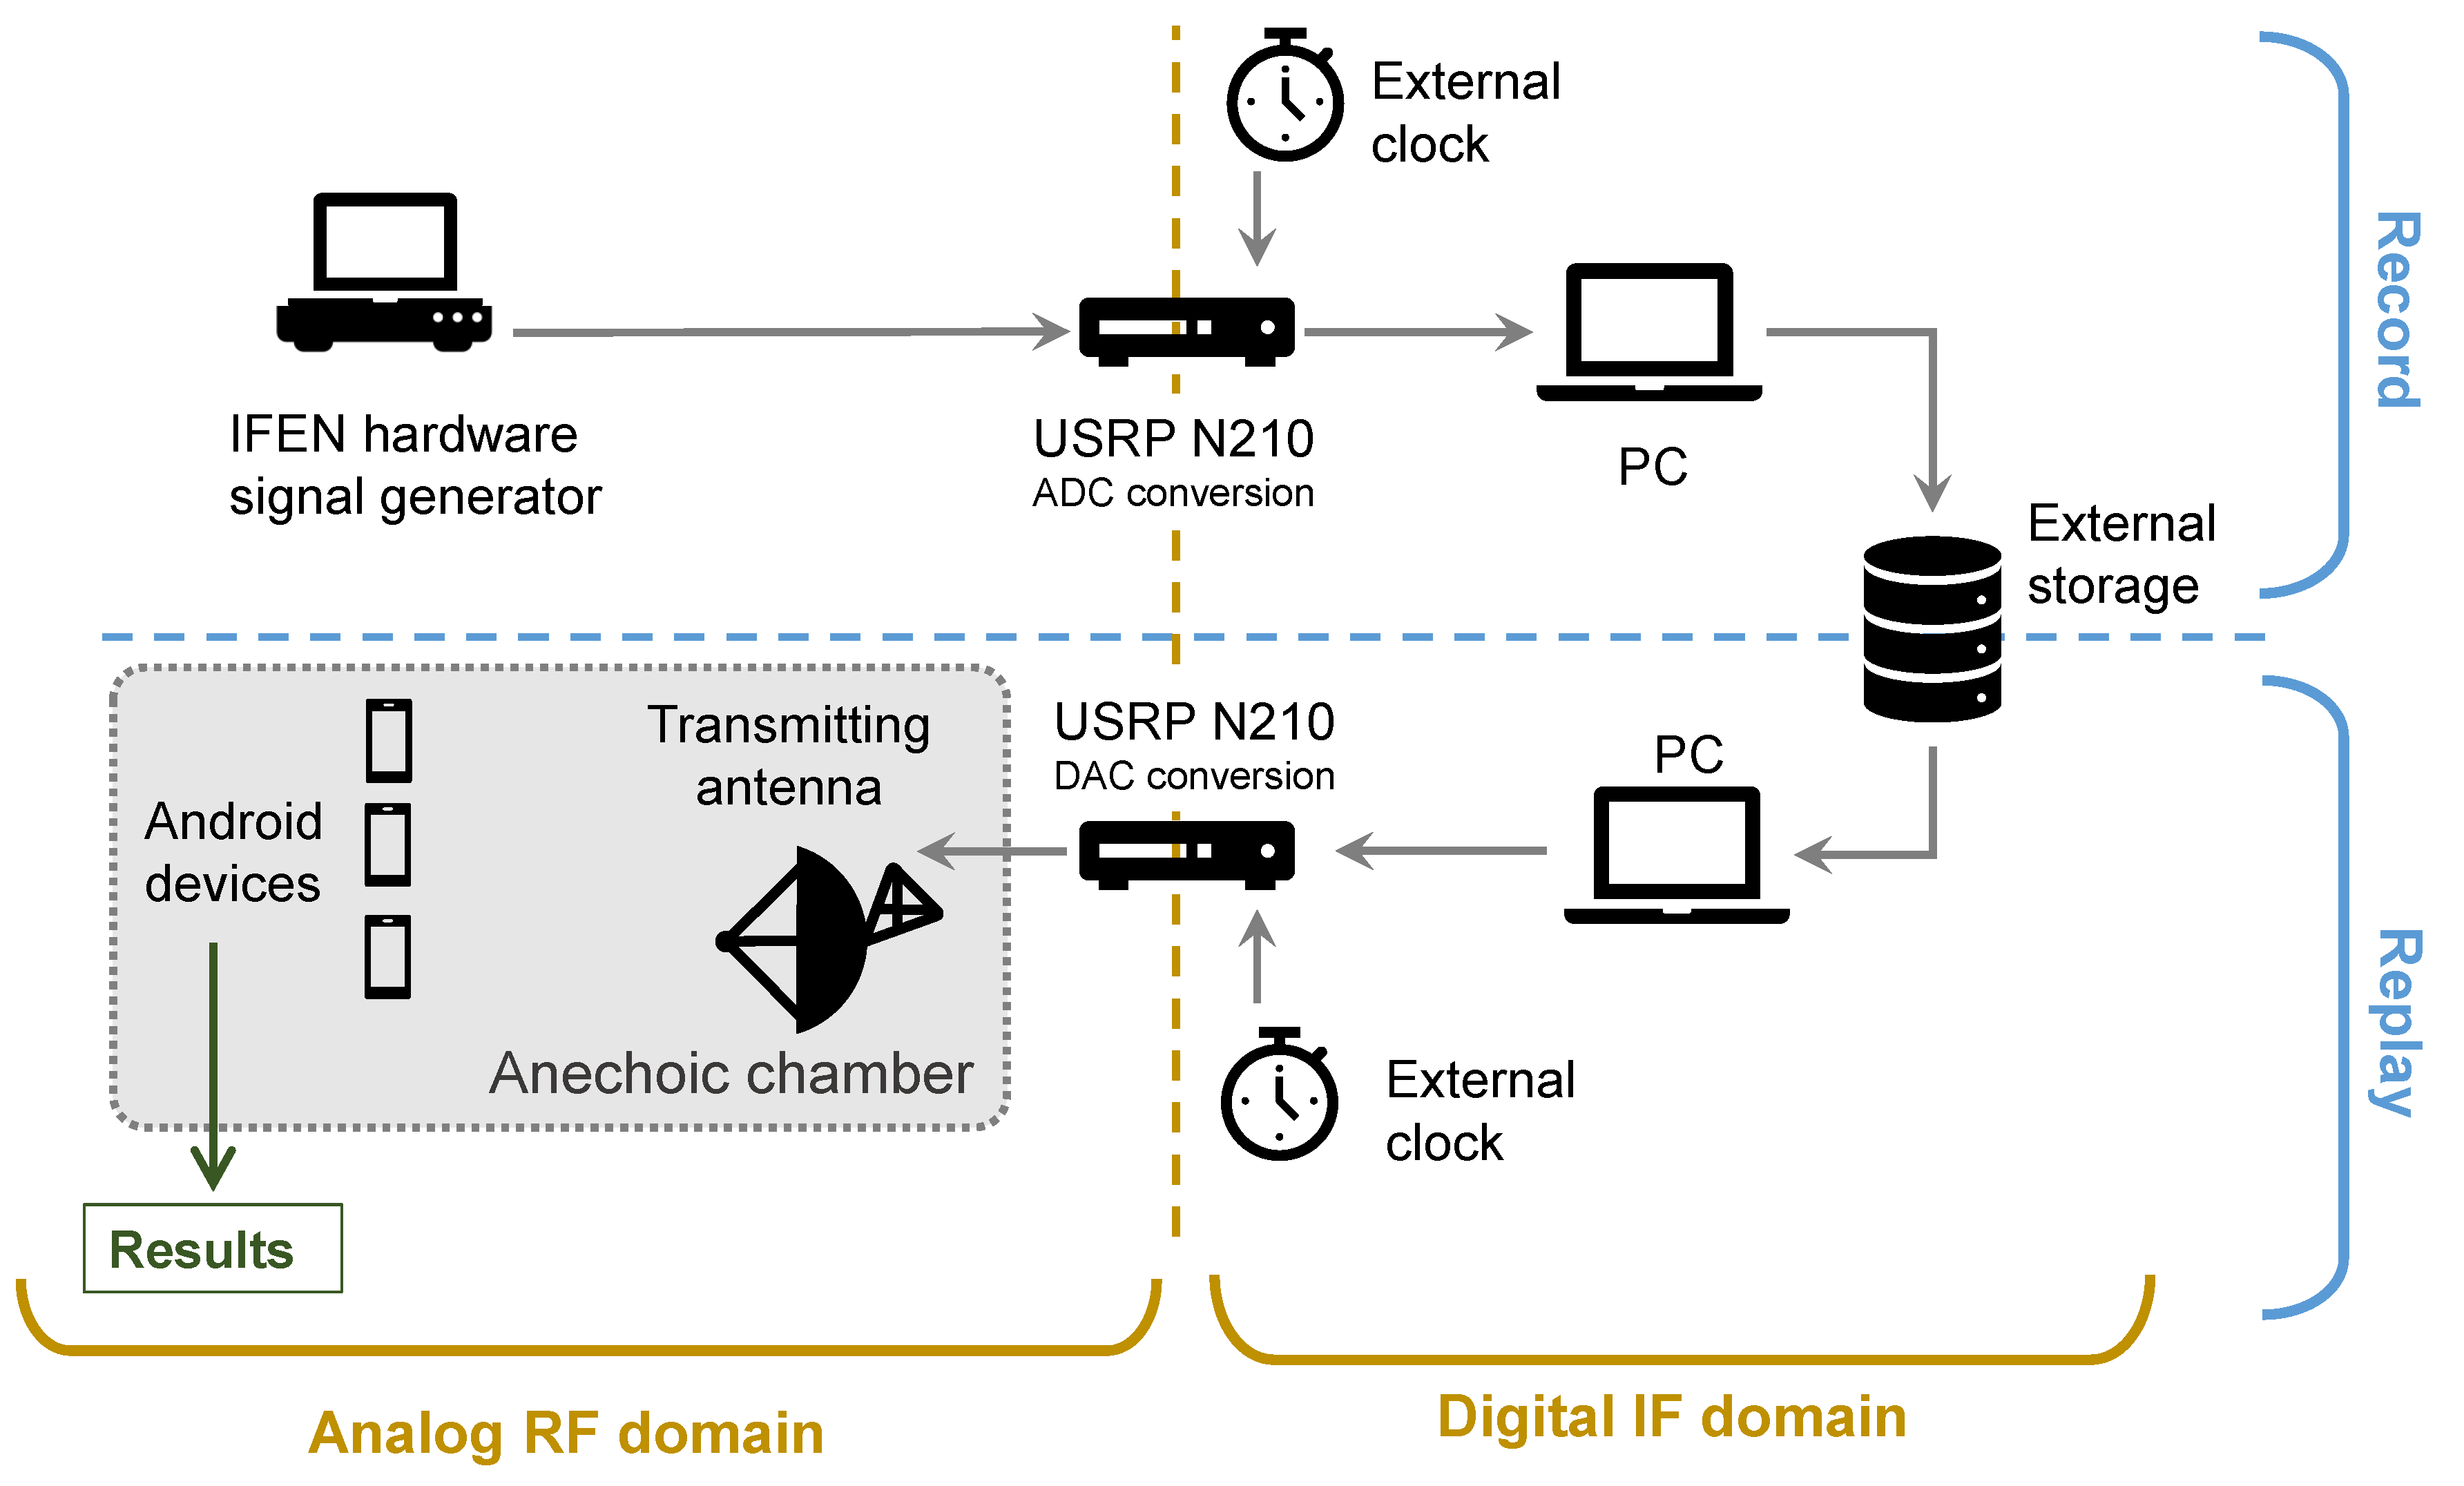
3.2. Controlled Environment Setup

An anechoic chamber is a testing facility designed to completely absorb Radio-Frequency (RF) waves thanks to the particular shape and material of the walls. Therefore, it can be used to simulate the ideal propagation condition. Being isolated from the surroundings, the chamber also reduces the impact of external RF impairments. In addition, the signals transmitted inside are not propagated through the walls, thus avoiding any jamming or spoofing situation while replaying a GNSS signal.
The anechoic chamber of the Department of Electronics and Telecommunications (DET) of Politecnico di Torino has been used for the test. Different Android devices and the GNSS antenna transmitting simulated GNSS signals are clearly visible in the left pictures reported in Figure 6.
The transmission and reception of GNSS signals was pursued according to the Record and Replay paradigm [11]. A block scheme of the setup is shown in Figure 7. The original transmitted GNSS signals were obtained in a controlled setup as well, exploiting an IFEN™NavX (IFEN GmbH, Poing, Germany) professional constellation and hardware signal generator, simulating a static position according to a set of given coordinates. L1 C/A signals from all visible satellites belonging to GPS constellation were simulated at RF and then digitized by means of a front end, connected to the simulator through a wired link. No receiving antenna was used for the record step, thus avoiding multipath effects due to RF propagation. Signals were recorded as digitalized raw samples by means of Ettus Research™Universal Software Radio Peripheral (USRP) N210 front end, equipped with an RFX OS364-13 (RFX Ltd., Livingstone, UK) Oven Controlled Crystal Oscillator (OCXO). The signal acquisition was performed at 5 Msps, at Intermediate Frequency (IF), and at 8 bit/sample for In-phase and Quadrature components to guarantee an adequate replication of the stream. Binary files were hence stored in an external memory, and then replayed through a second USRP, used in transmitting mode, directly in the anechoic chamber. The system was equipped with a Rubidium atomic clock to provide precise timing for the digital-to-analog conversion of the samples. Analog signals emitted by the USRP were amplified by a Low Noise Amplifier (LNA) to feed a passive Novatel hemispherical antenna, installed in the anechoic chamber for the transmitting test. The devices were located on a support aligned to the main axis of the nominal pattern of the transmitting antenna inside the anechoic chamber. The patch was connected to a u-Blox EVK-M8QCAM (u-blox Holding AG, Thalwil, Switzerland) benchmark receiver, used to verify the adequacy of power calibration of the transmitting front end and the actual visibility of the simulated signals (Figure 8).

4. Results and Discussion

Controlled tests of 10 min intervals were carried out in the anechoic chamber using the following devices:
  • Huawei P10 smartphone,
  • Huawei P10 Plus smartphone,
  • HTC Nexus 9 tablet.
Raw GNSS data were collected by means of the Google GNSSLogger App, and postprocessed using the Google Toolbox.

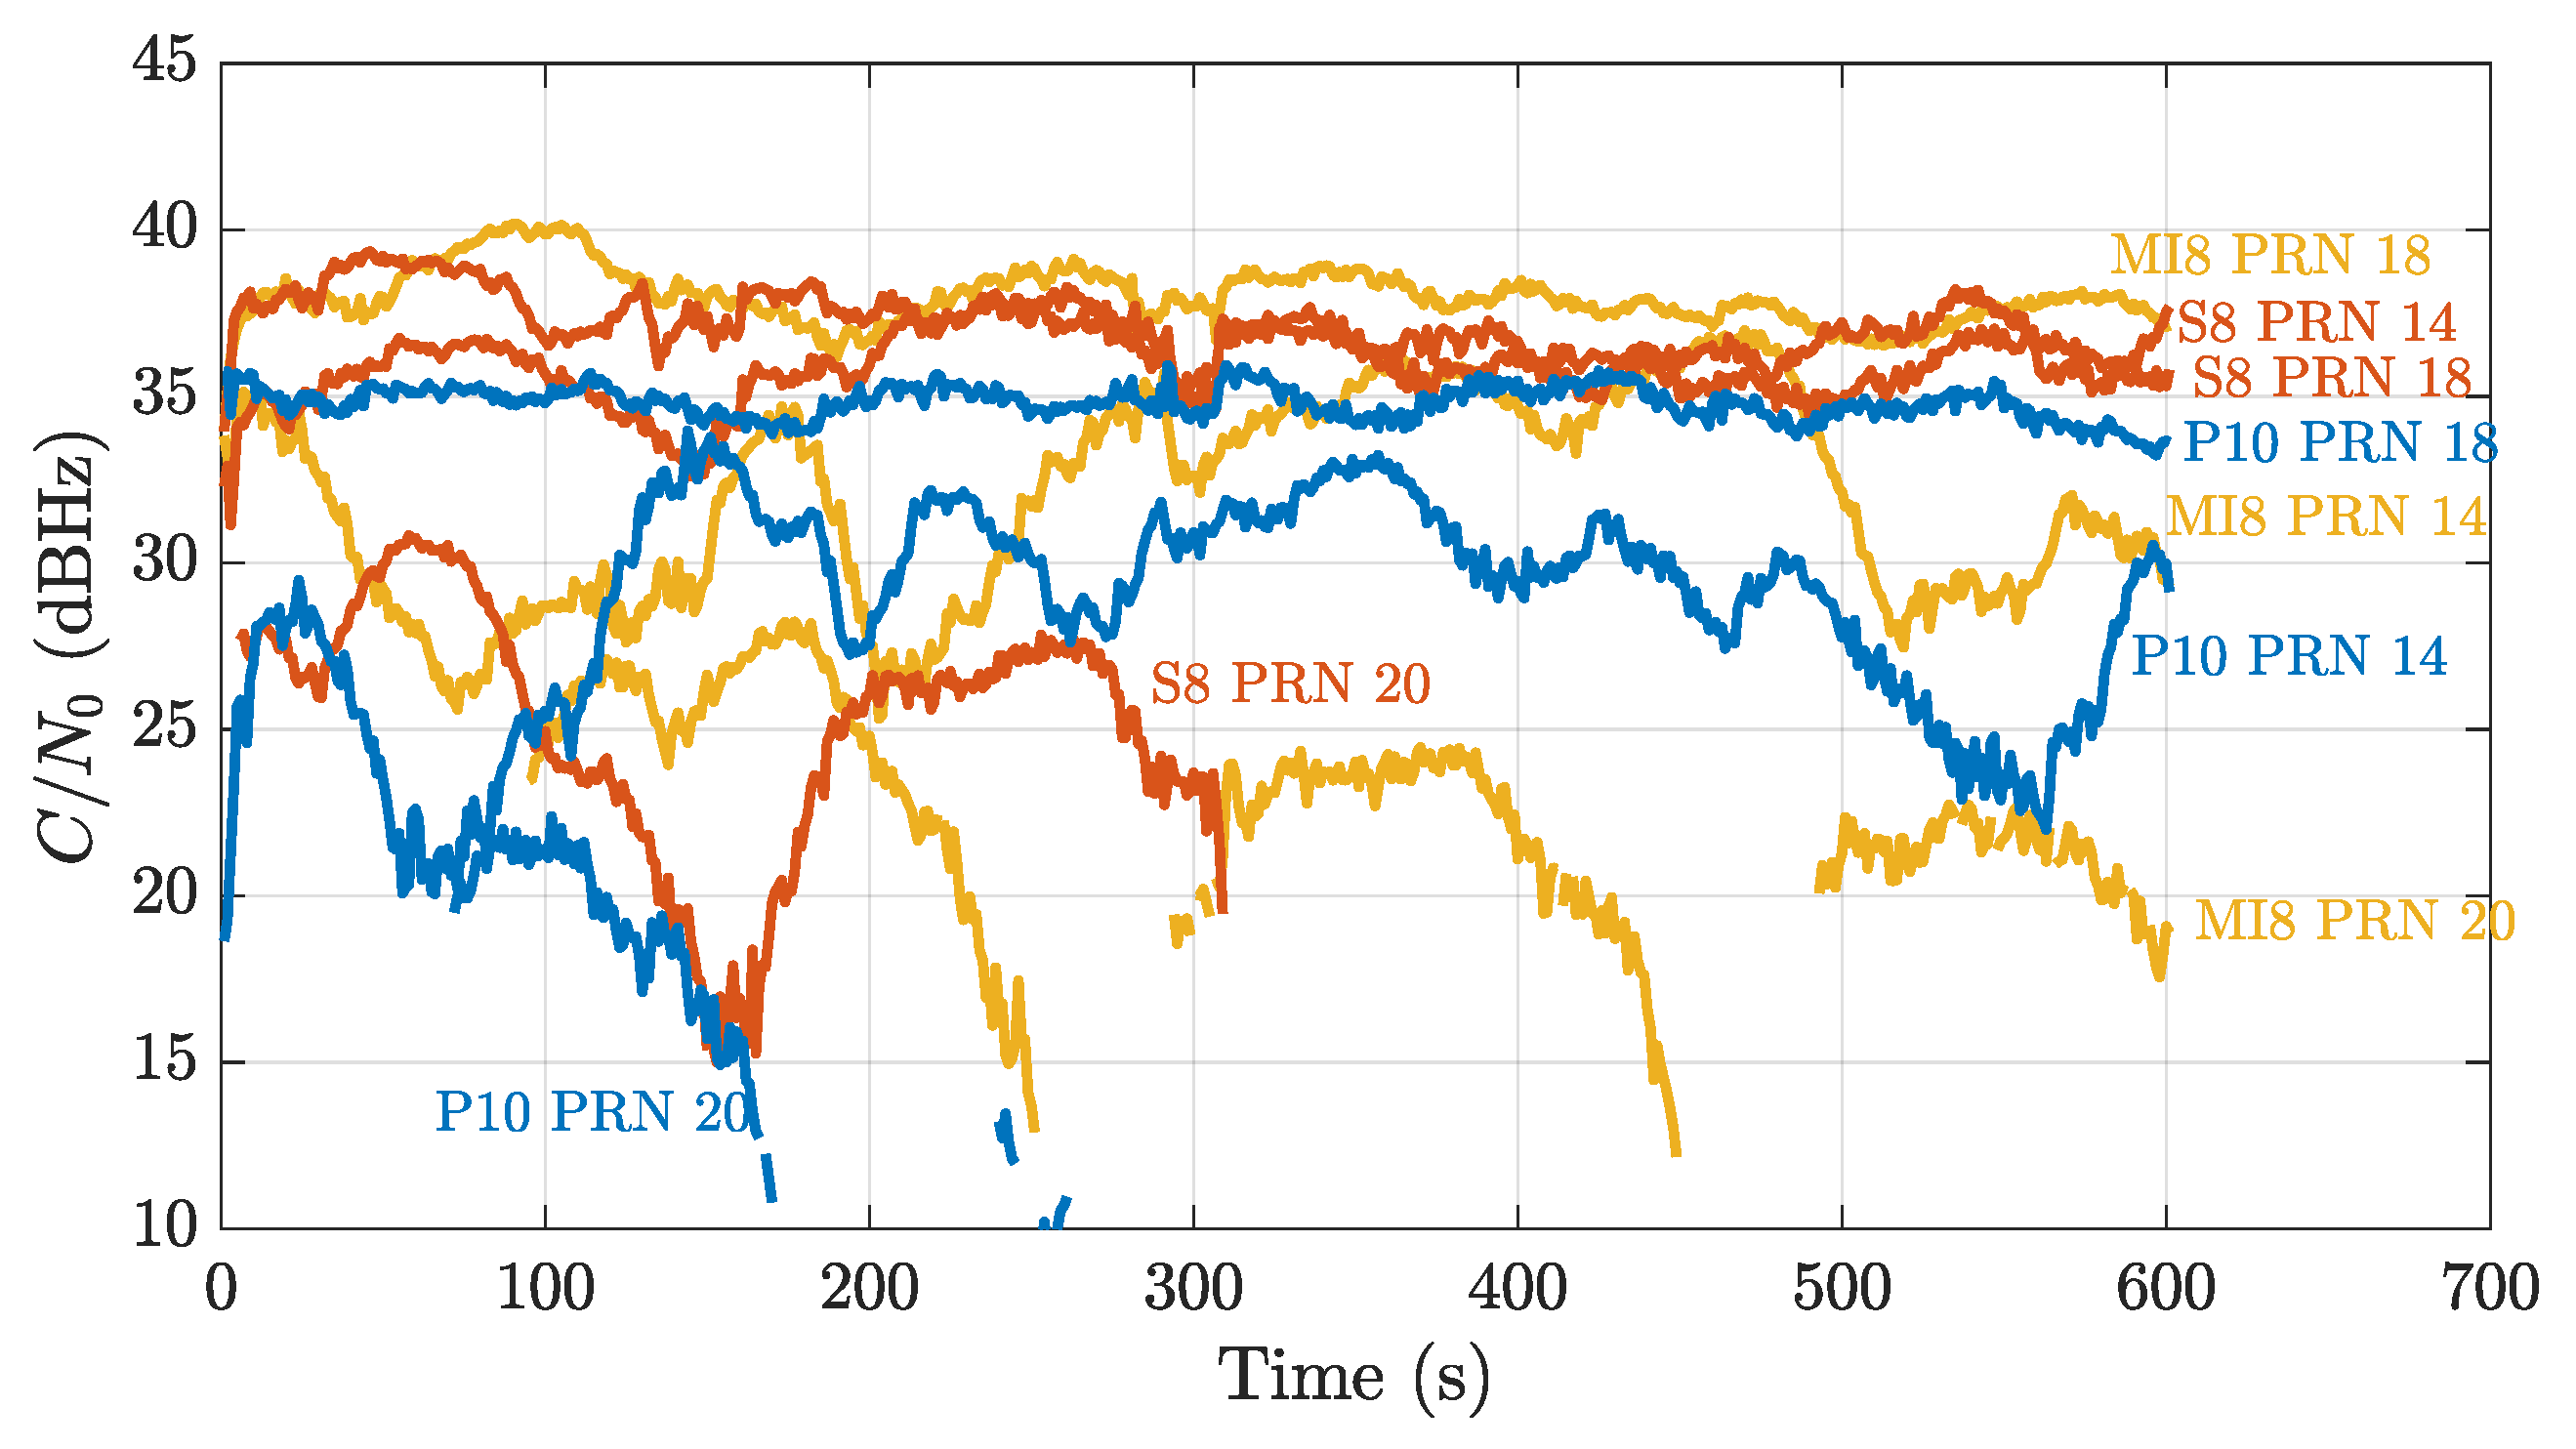
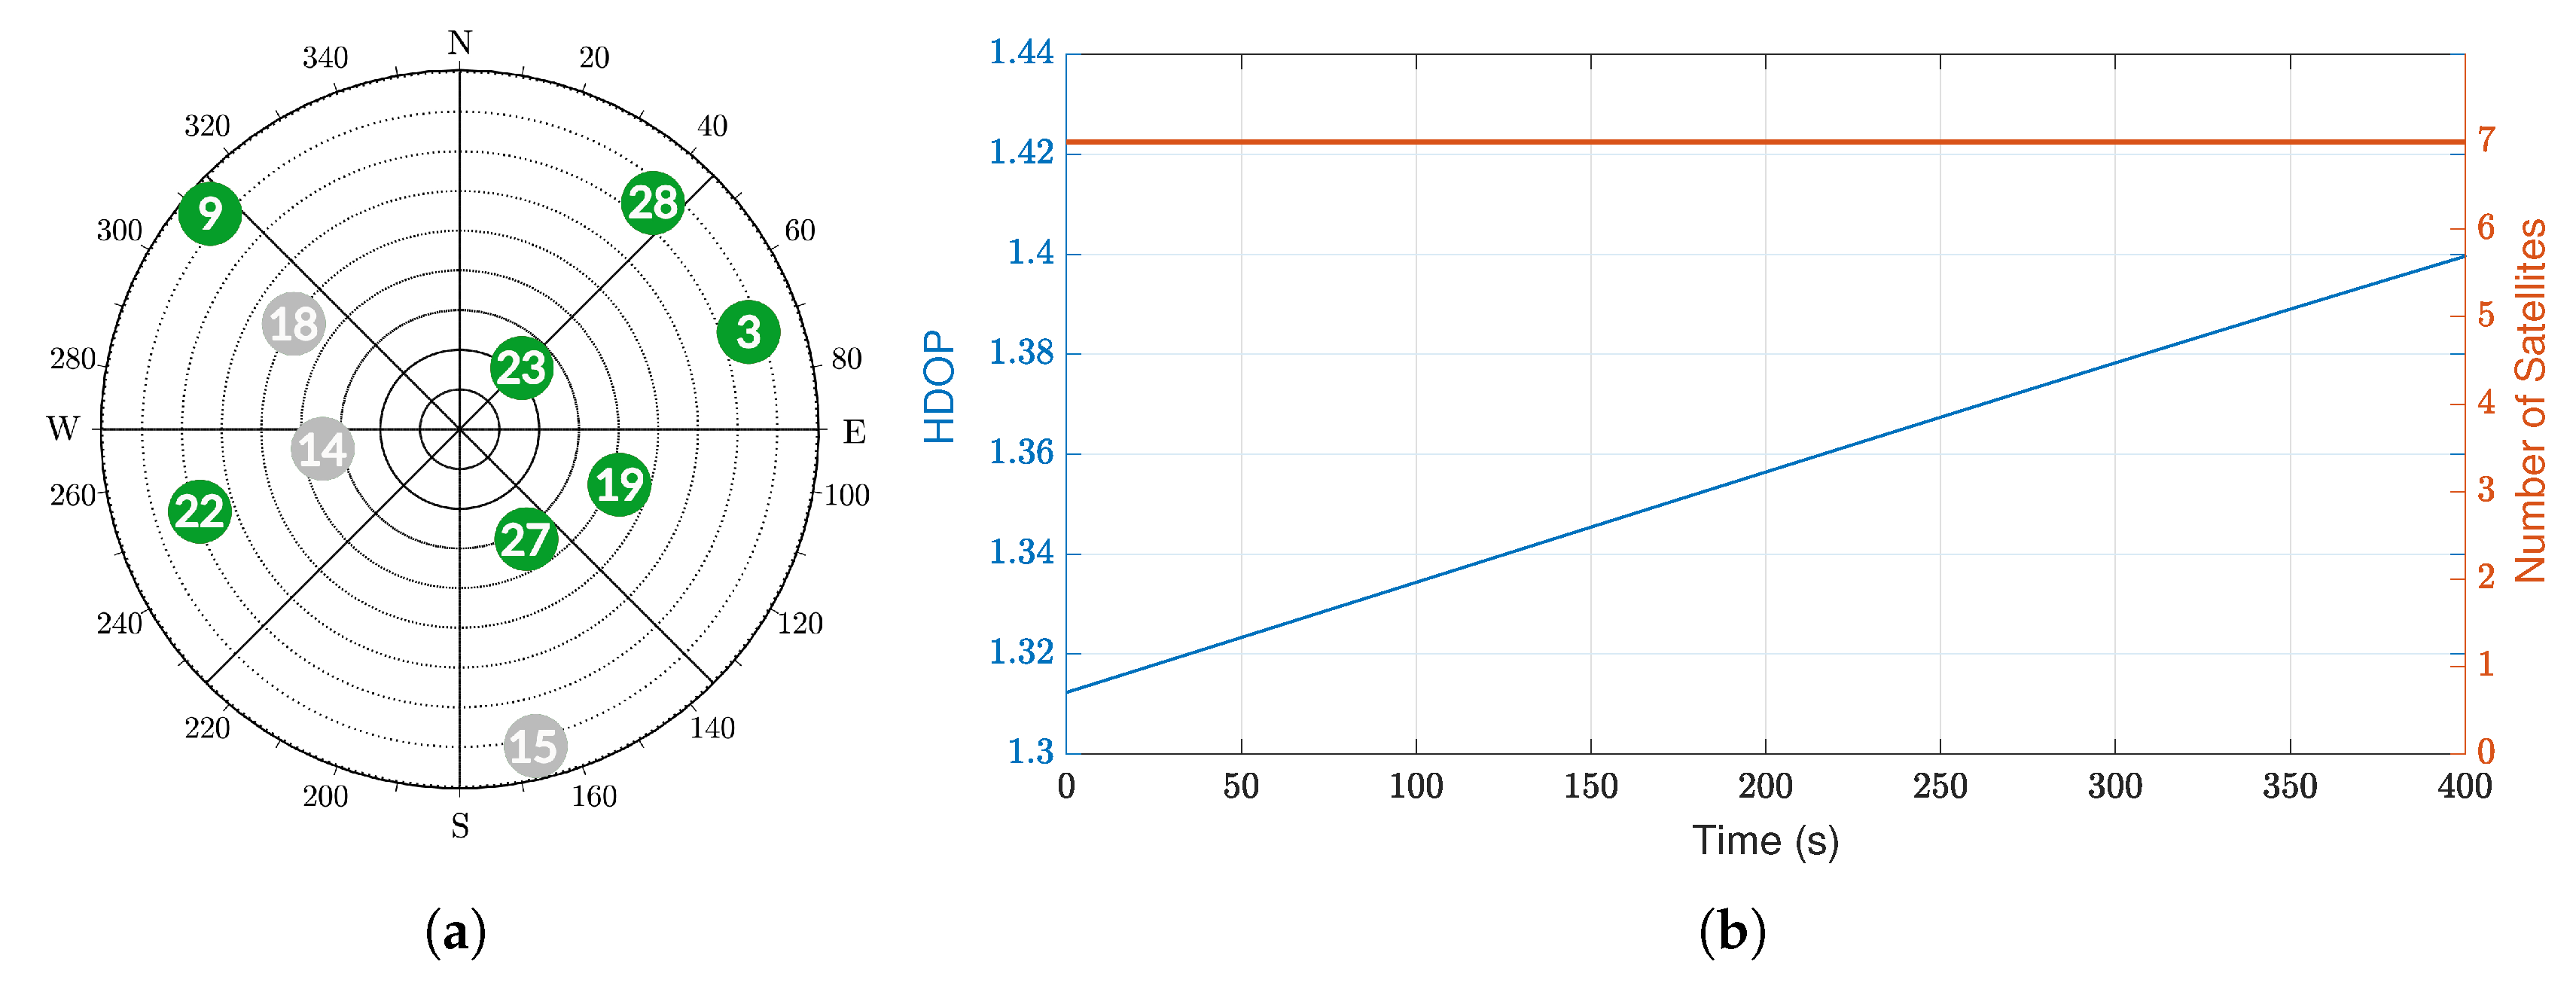
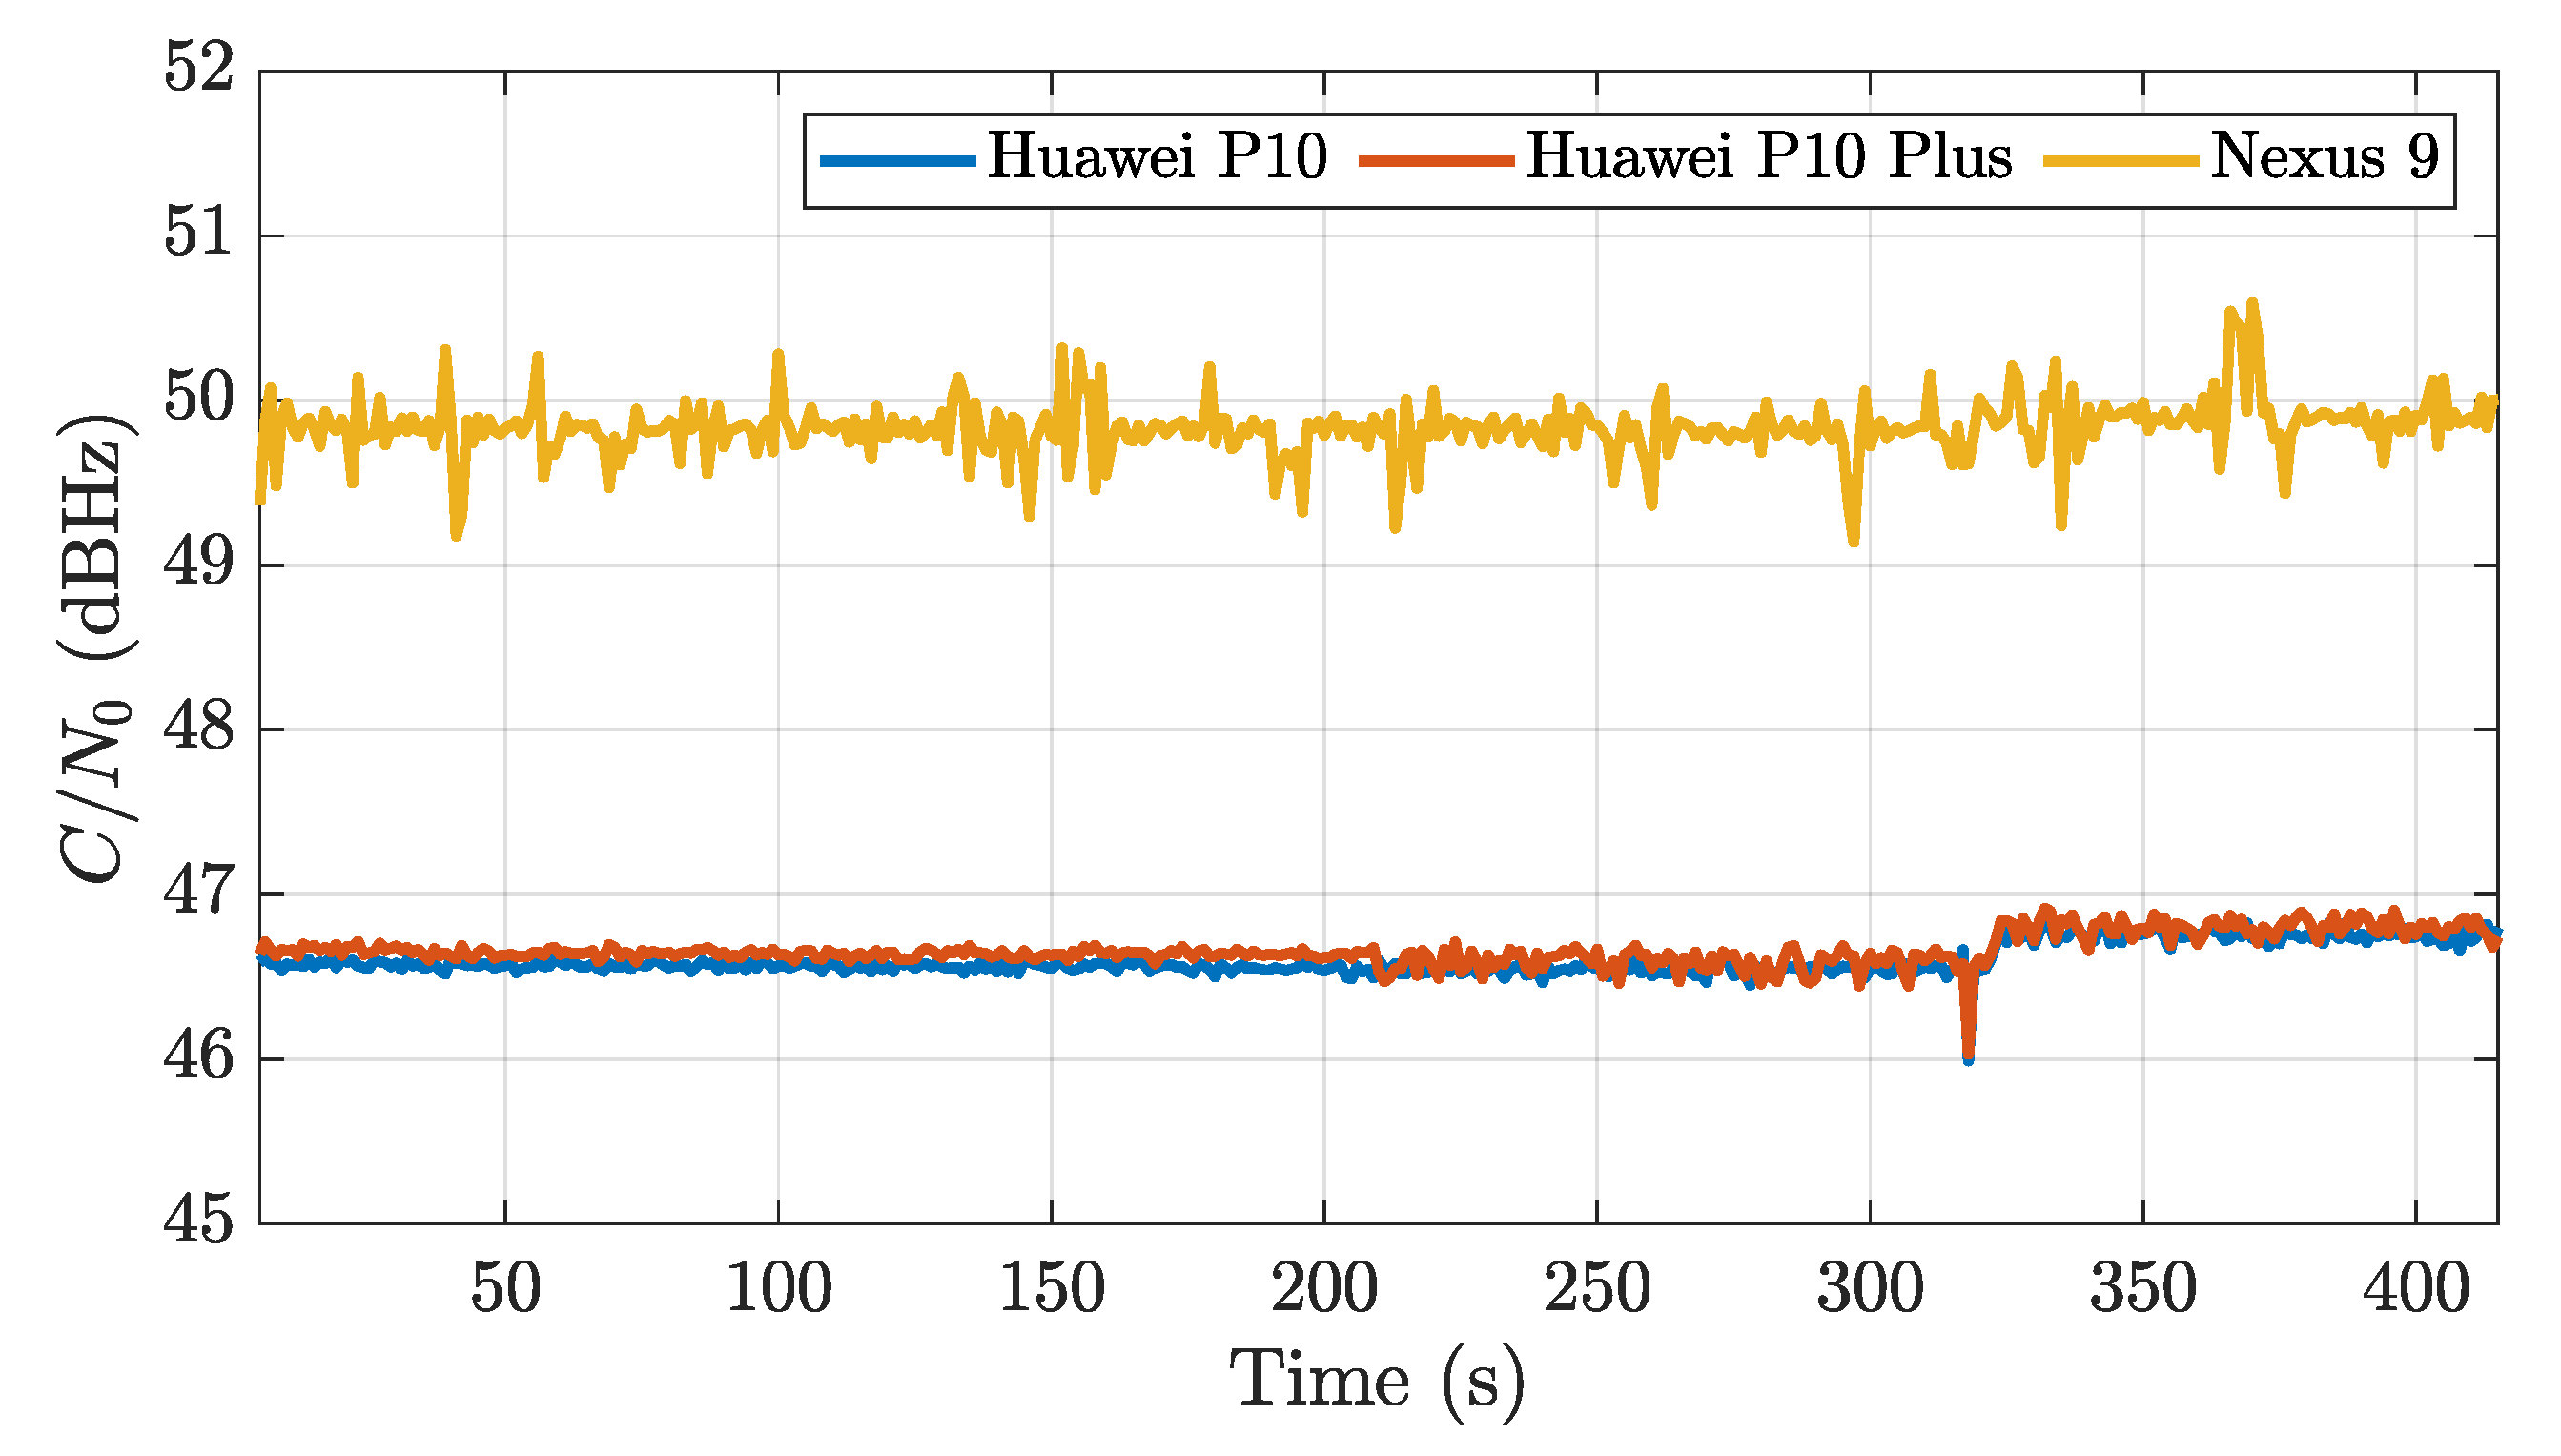
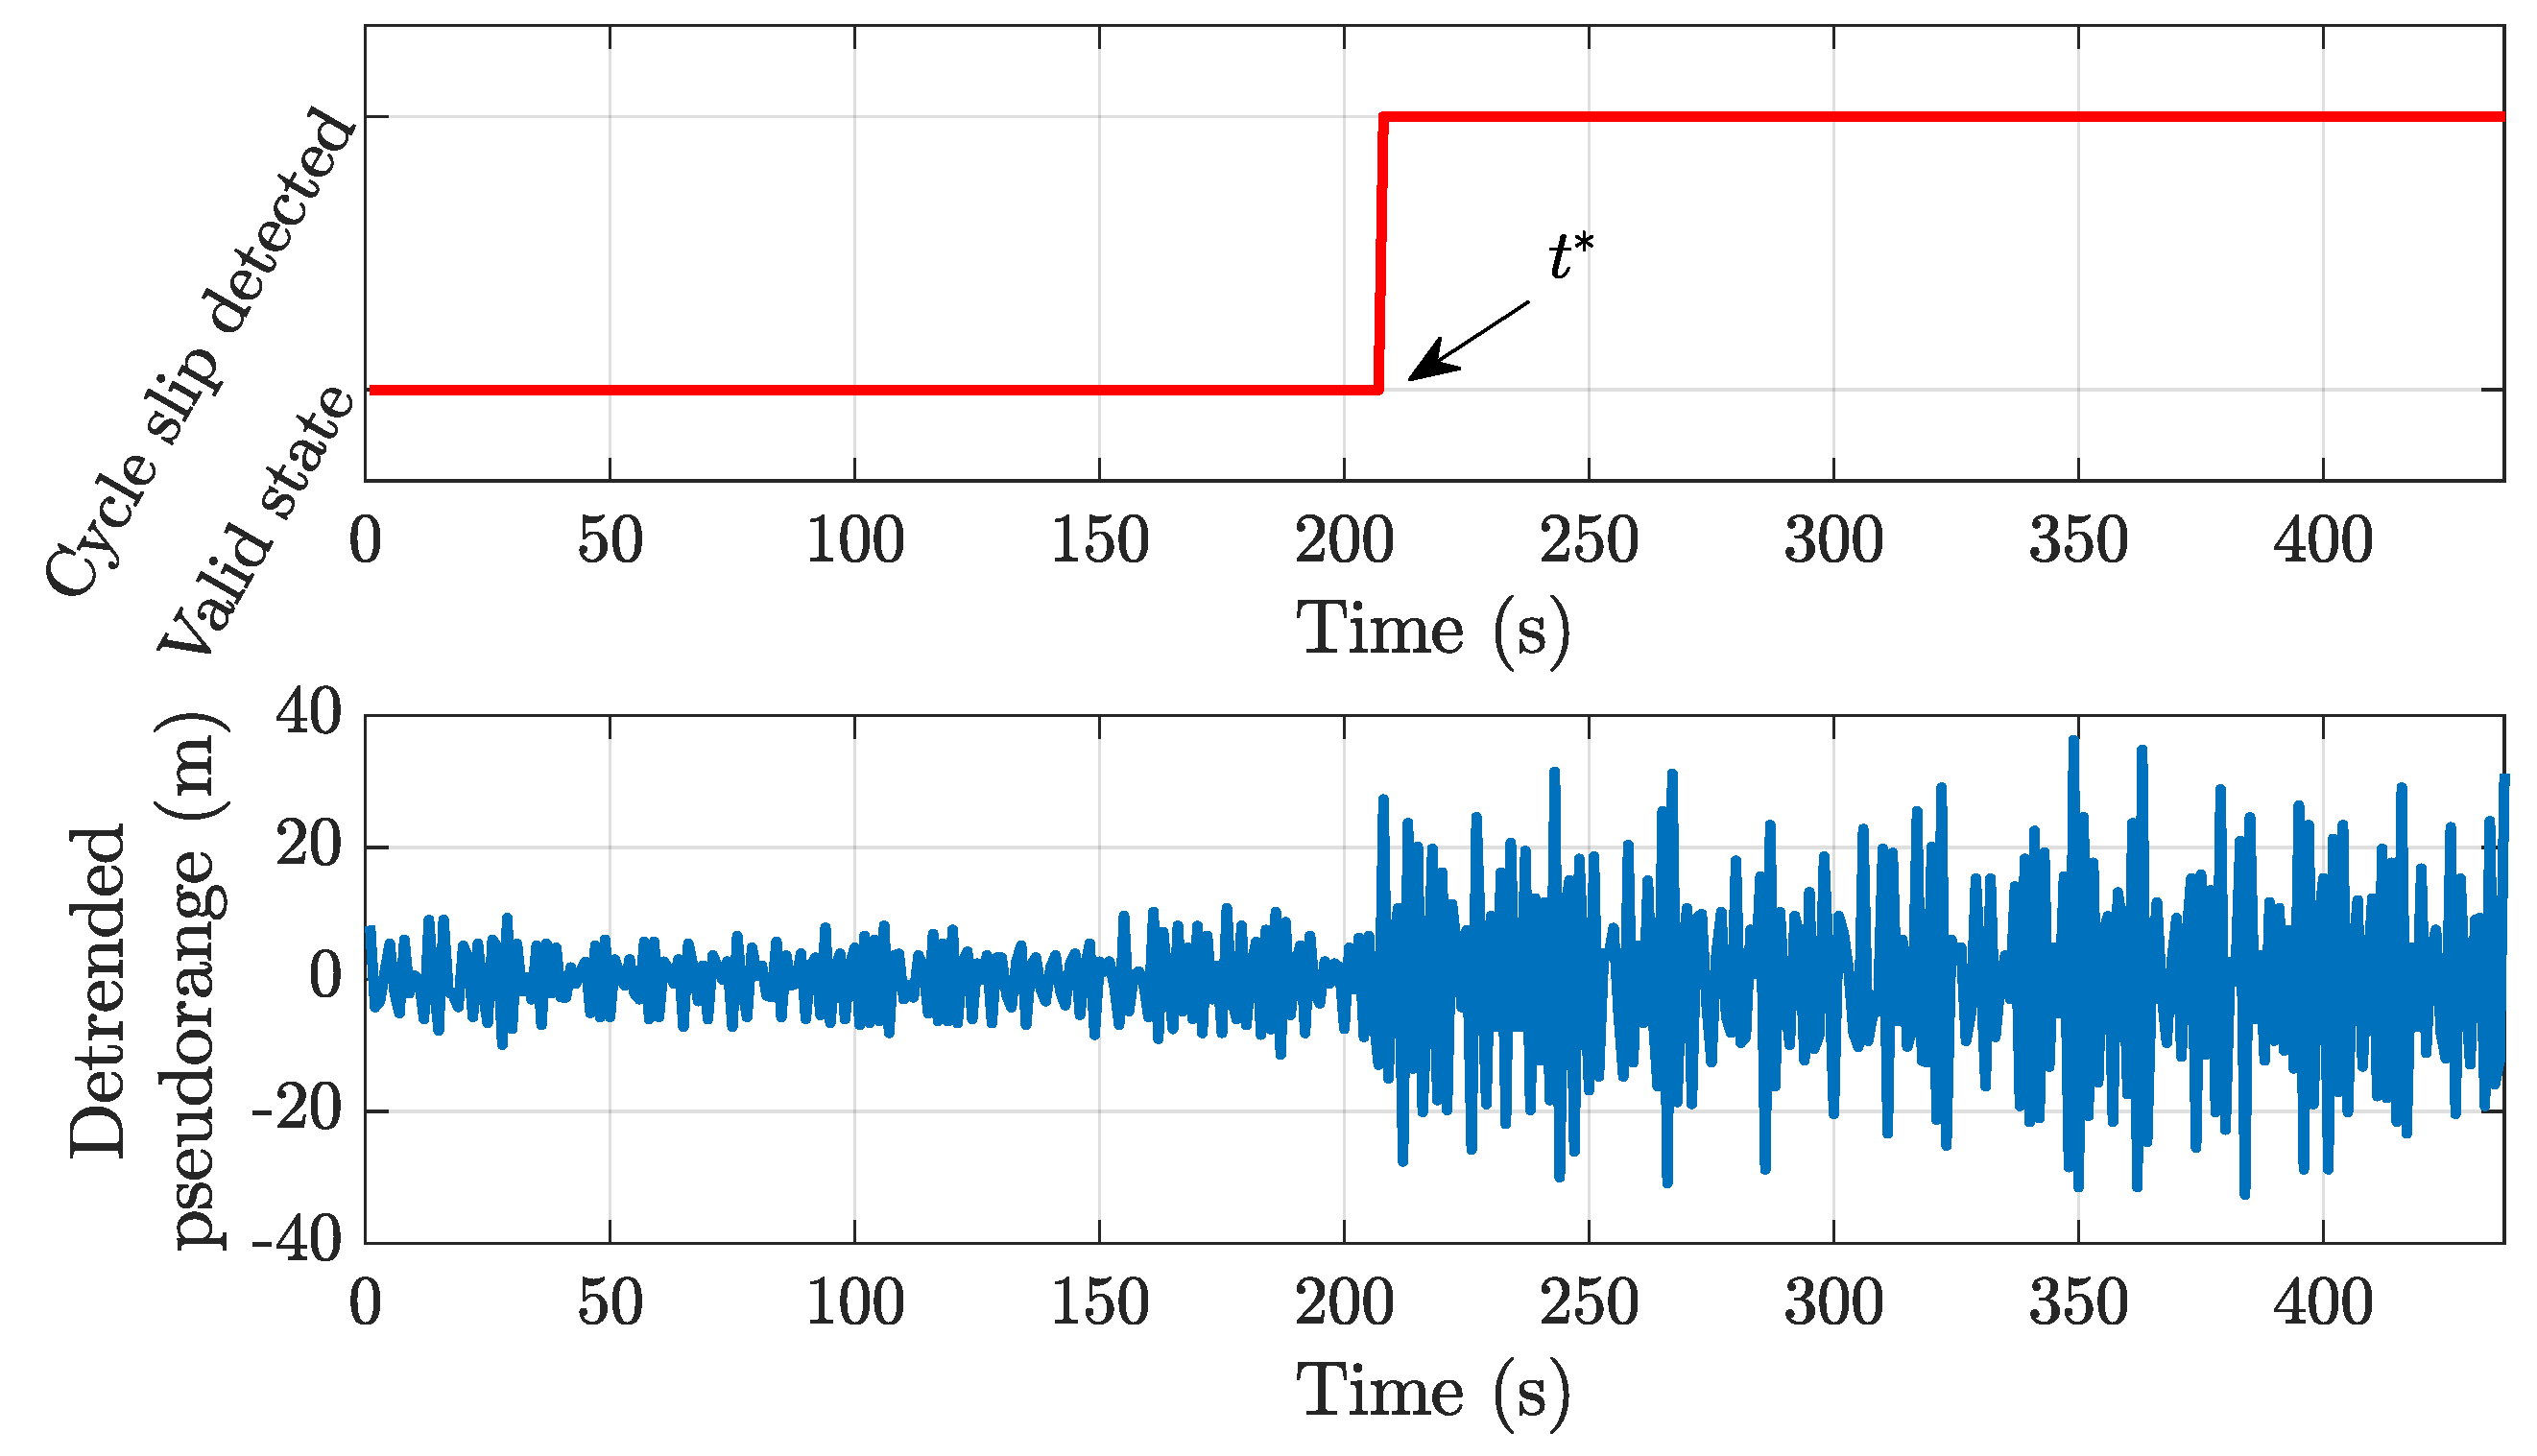
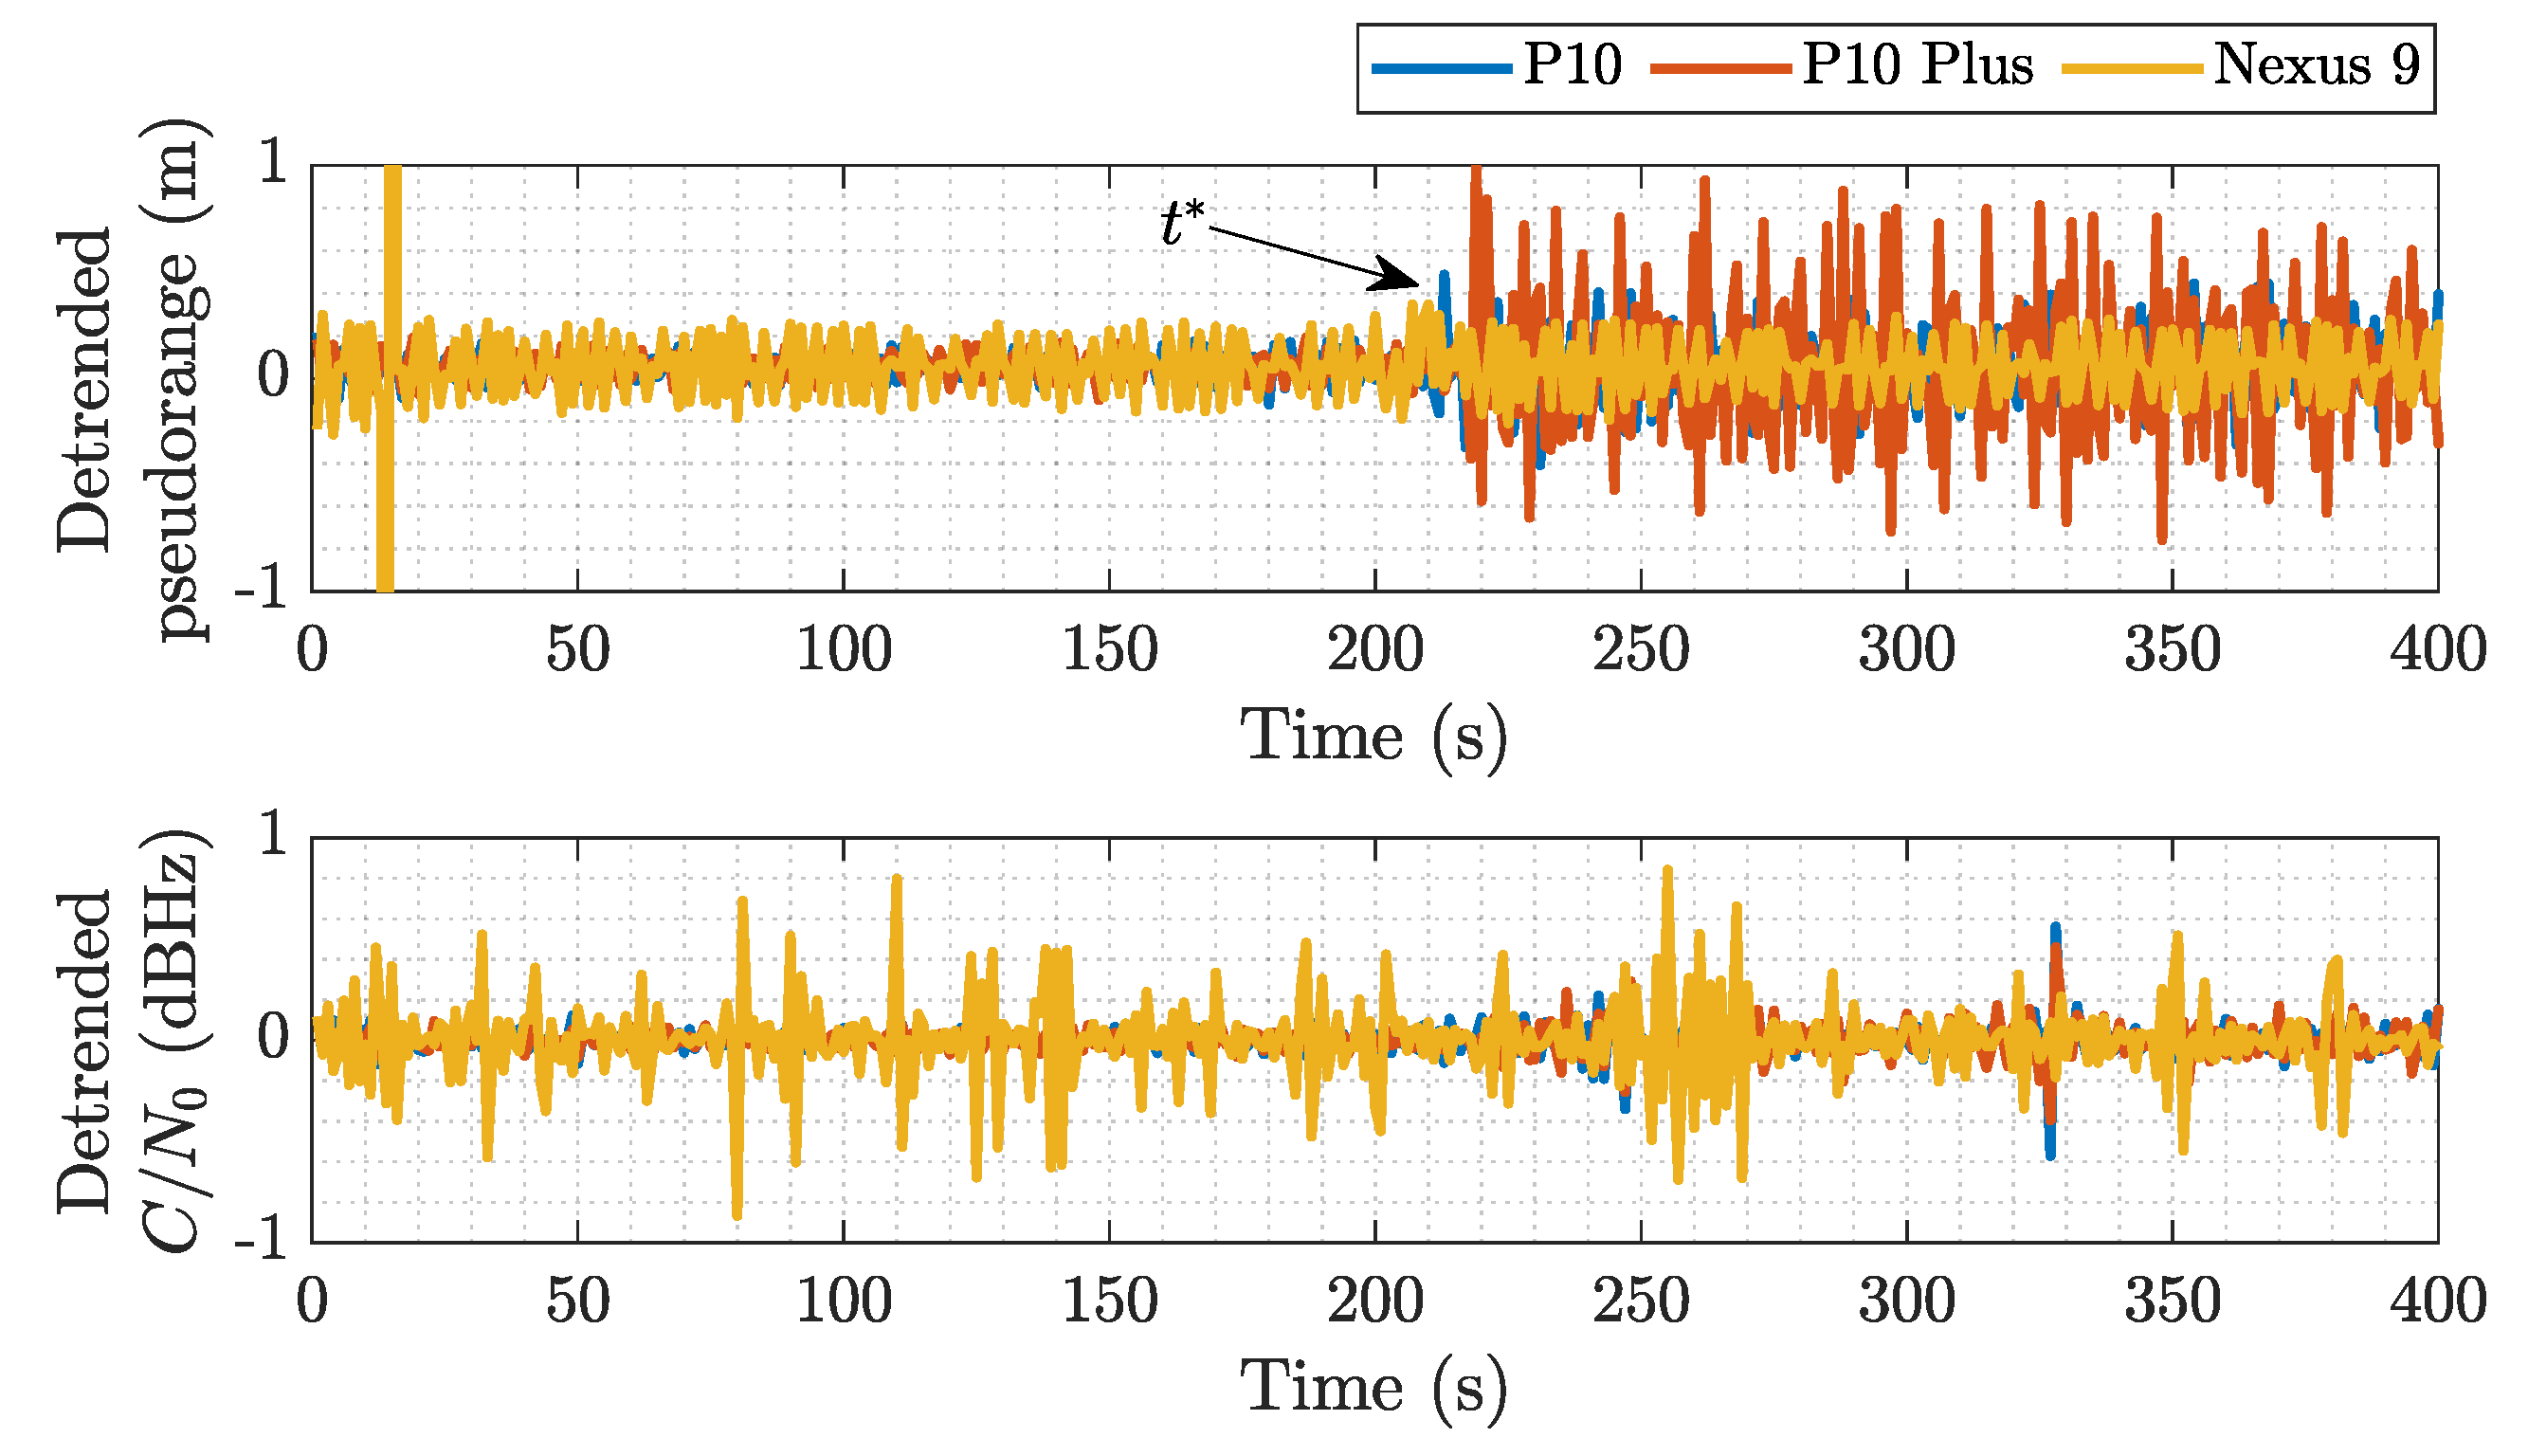
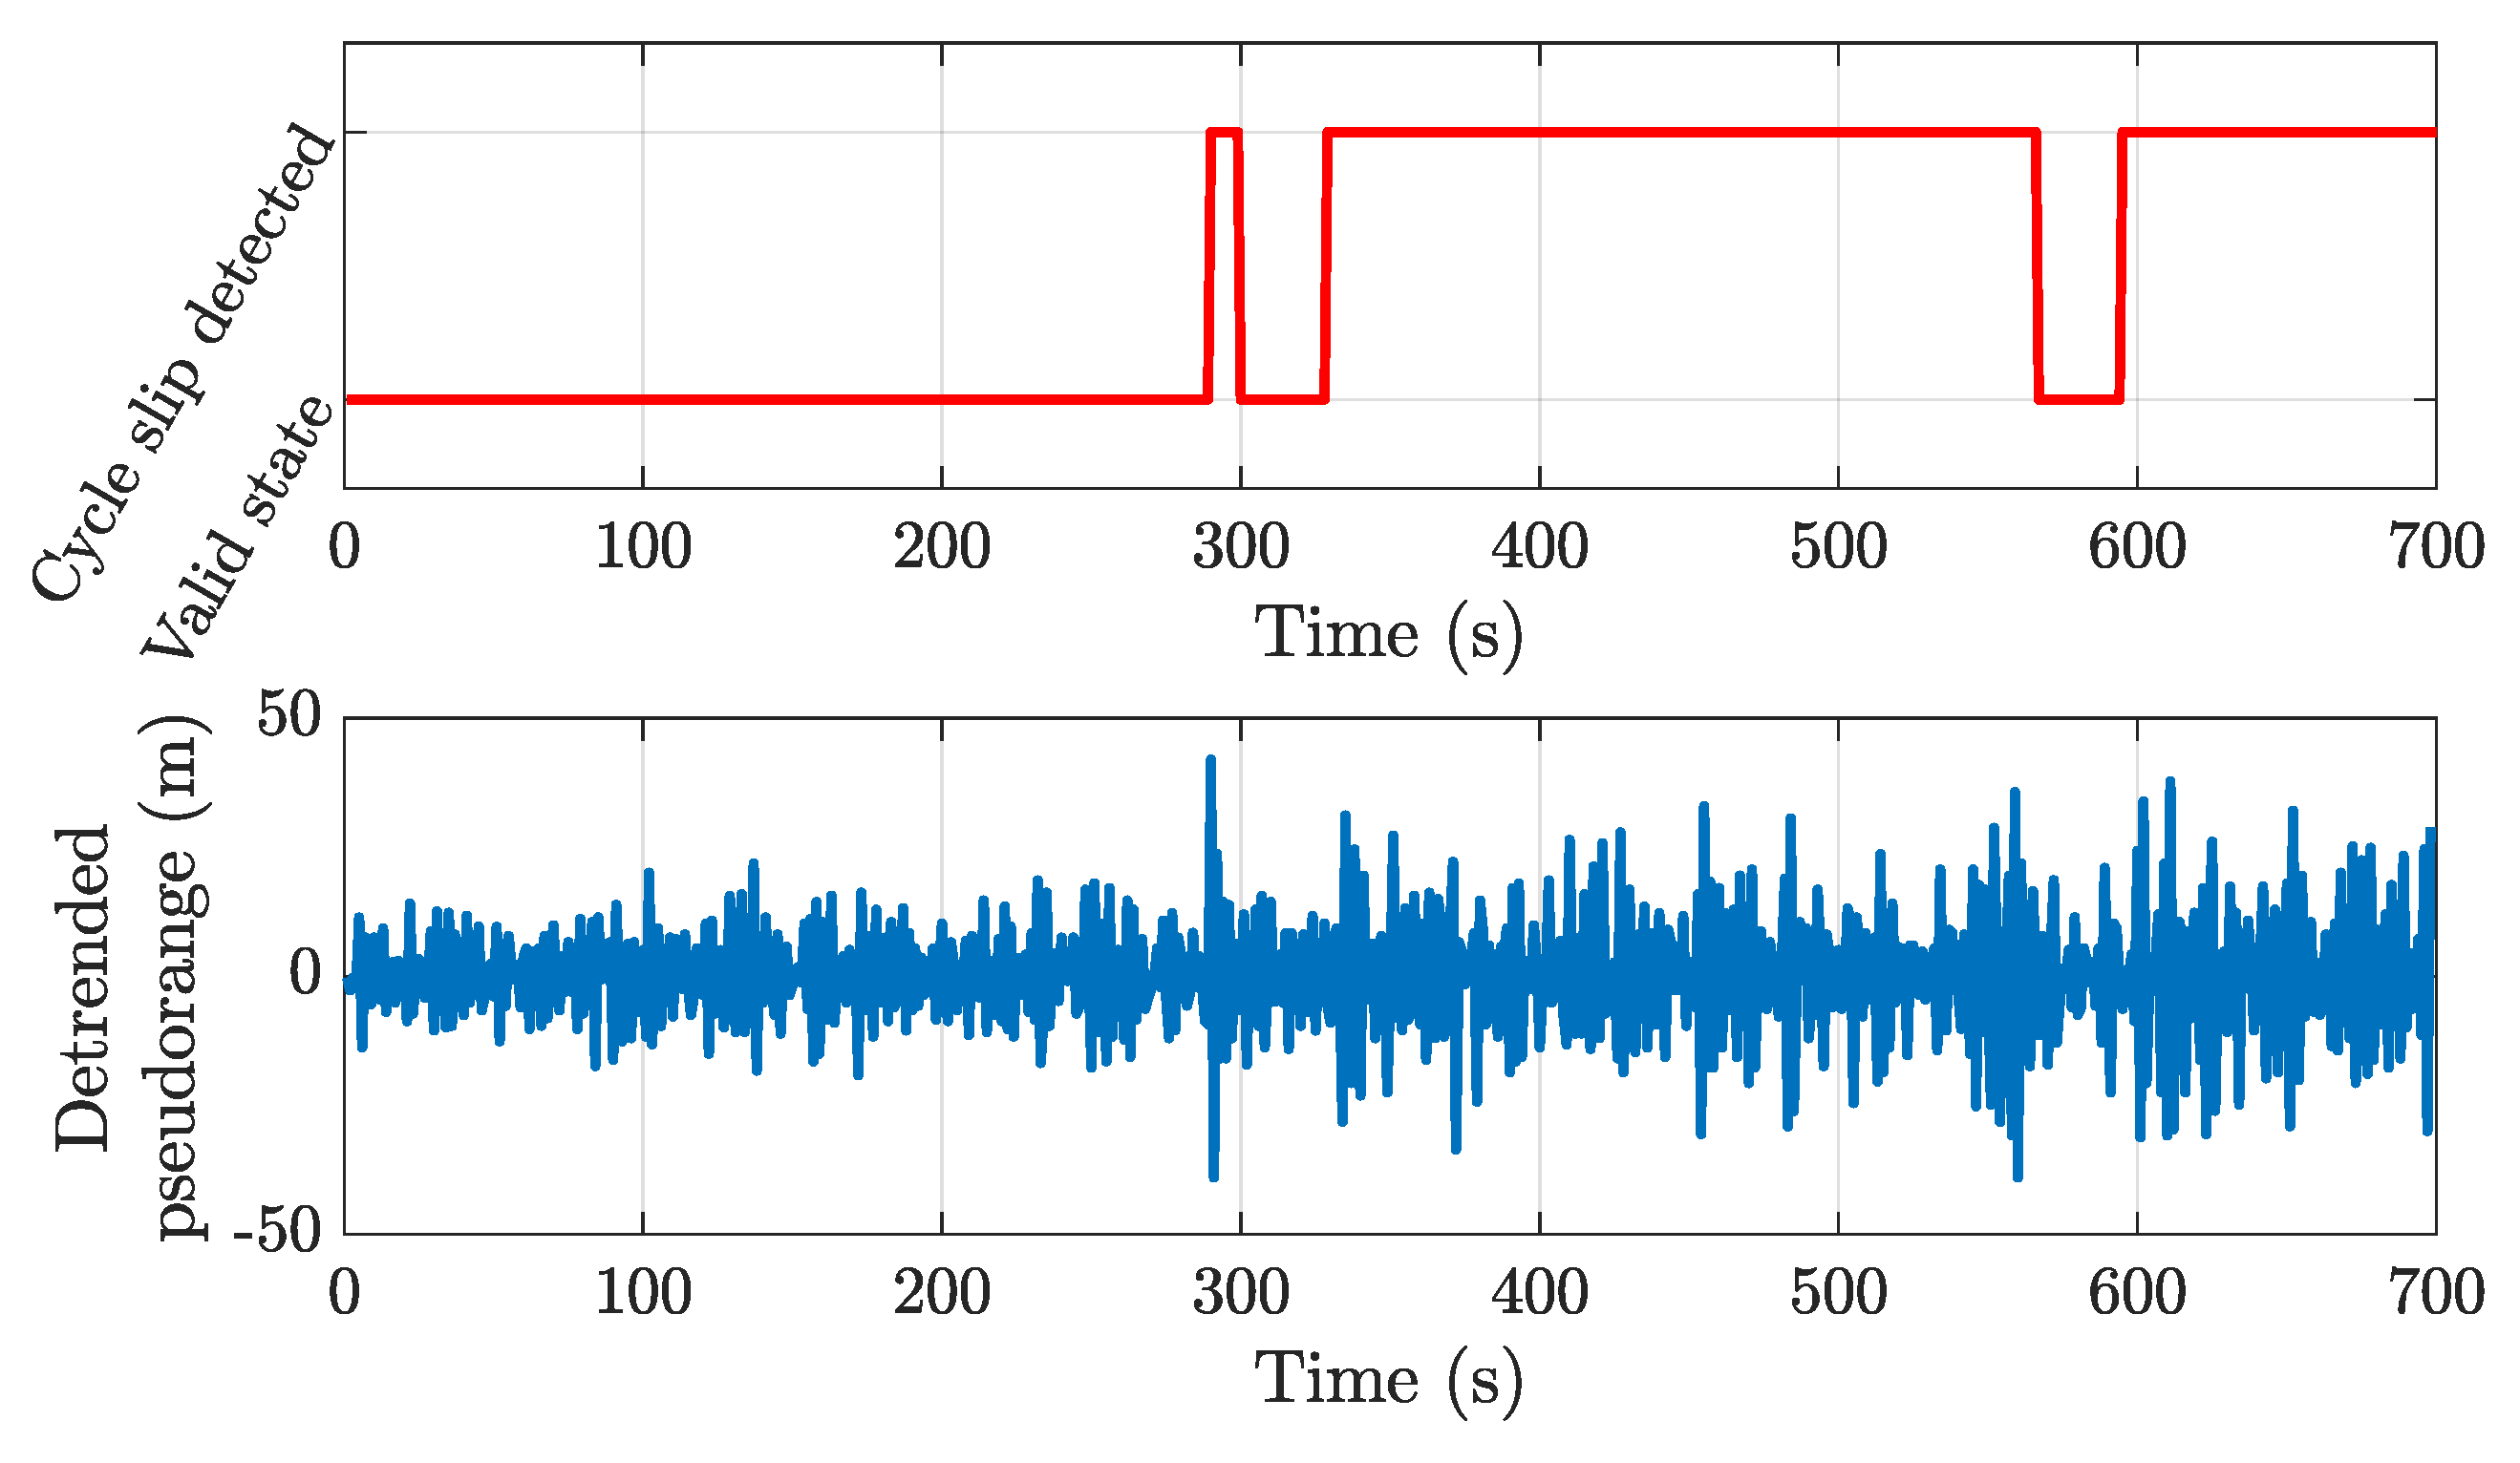
4.1. Analysis of Raw Measurements

Satellite visibility in all the devices was comparable, and raw measurements of seven GPS L1 signals that were visible throughout the observation period were processed. As an example, Figure 9 plots the C / N 0 values of GPS PRN 3 for all Android devices being tested. A similar trend could be seen for all other visible PRNs. The C / N 0 of both Huawei models was more stable, with standard deviations (STDs) of around 0.08 dB with respect to the Nexus 9, with around 0.14 dB STD. Nevertheless, values were 3 dB lower than the latter. Interestingly, the Nexus 9 C / N 0 values were also a close match to the reference benchmark receiver. The cause of a slight spike in C / N 0 value around 320 s in the Huawei devices could not be determined, and could be due to a manufacturer setting.
It was seen that, on the Huawei models, after t * = 210 s of the start of logging, the raw measurements considerably deteriorated. The STDs of the C / N 0 before and after this were around 0.04 dB and 0.09 dB, respectively. This deterioration caused a significant difference in measurements. On observing no change in the HardwareClockDiscontinuityCount parameter (which gives the count of the receiver clock discontinuities [6]) of the Google Toolbox output during the entire observation period, it could be assumed that, even though the primary TCXO clock was running, the GNSS tracking chipset was turned off.
Figure 10 plots the detrended code pseudorange deviation (lower panel) compared with the AccumulatedDeltaRangeState parameter for GPS PRN 23 (upper panel). Such a flag indicates whether the range measurements is reset or there is a cycle slip due to a loss of lock [6]. The quality between the code and carrier pseudorangeswasis compared by calculating their detrended STDs. For short time spans, detrended pseudorange measurements could be considered as an ergodic process, and were obtained through second-order differentiation [7]. From the figure, it can be seen that there was a failure to achieve an ambiguity fix in the Huawei models after t * , but there were no cycle slips before this mark. The pseudorange noise remains within 2 m for all PRNs before a duty cycle occurred. In the Nexus 9, there were no cycle slips during the tested 10 min interval, and the noise remained within 4 m. This was observed in all other available PRNs. The continuity of a high-variability detrended pseudorange is due to the switching of clocks when a duty cycle occurs [6]. The detrended code- and carrier-phase pseudorange STDs of the Huawei devices before the power-saving function were within 3 m and 12 mm, respectively, whereas, for the Nexus 9, they were within 6 m and 13 mm. In comparison, the detrended benchmark receiver-code pseudorange STDs were within 1.5 m.

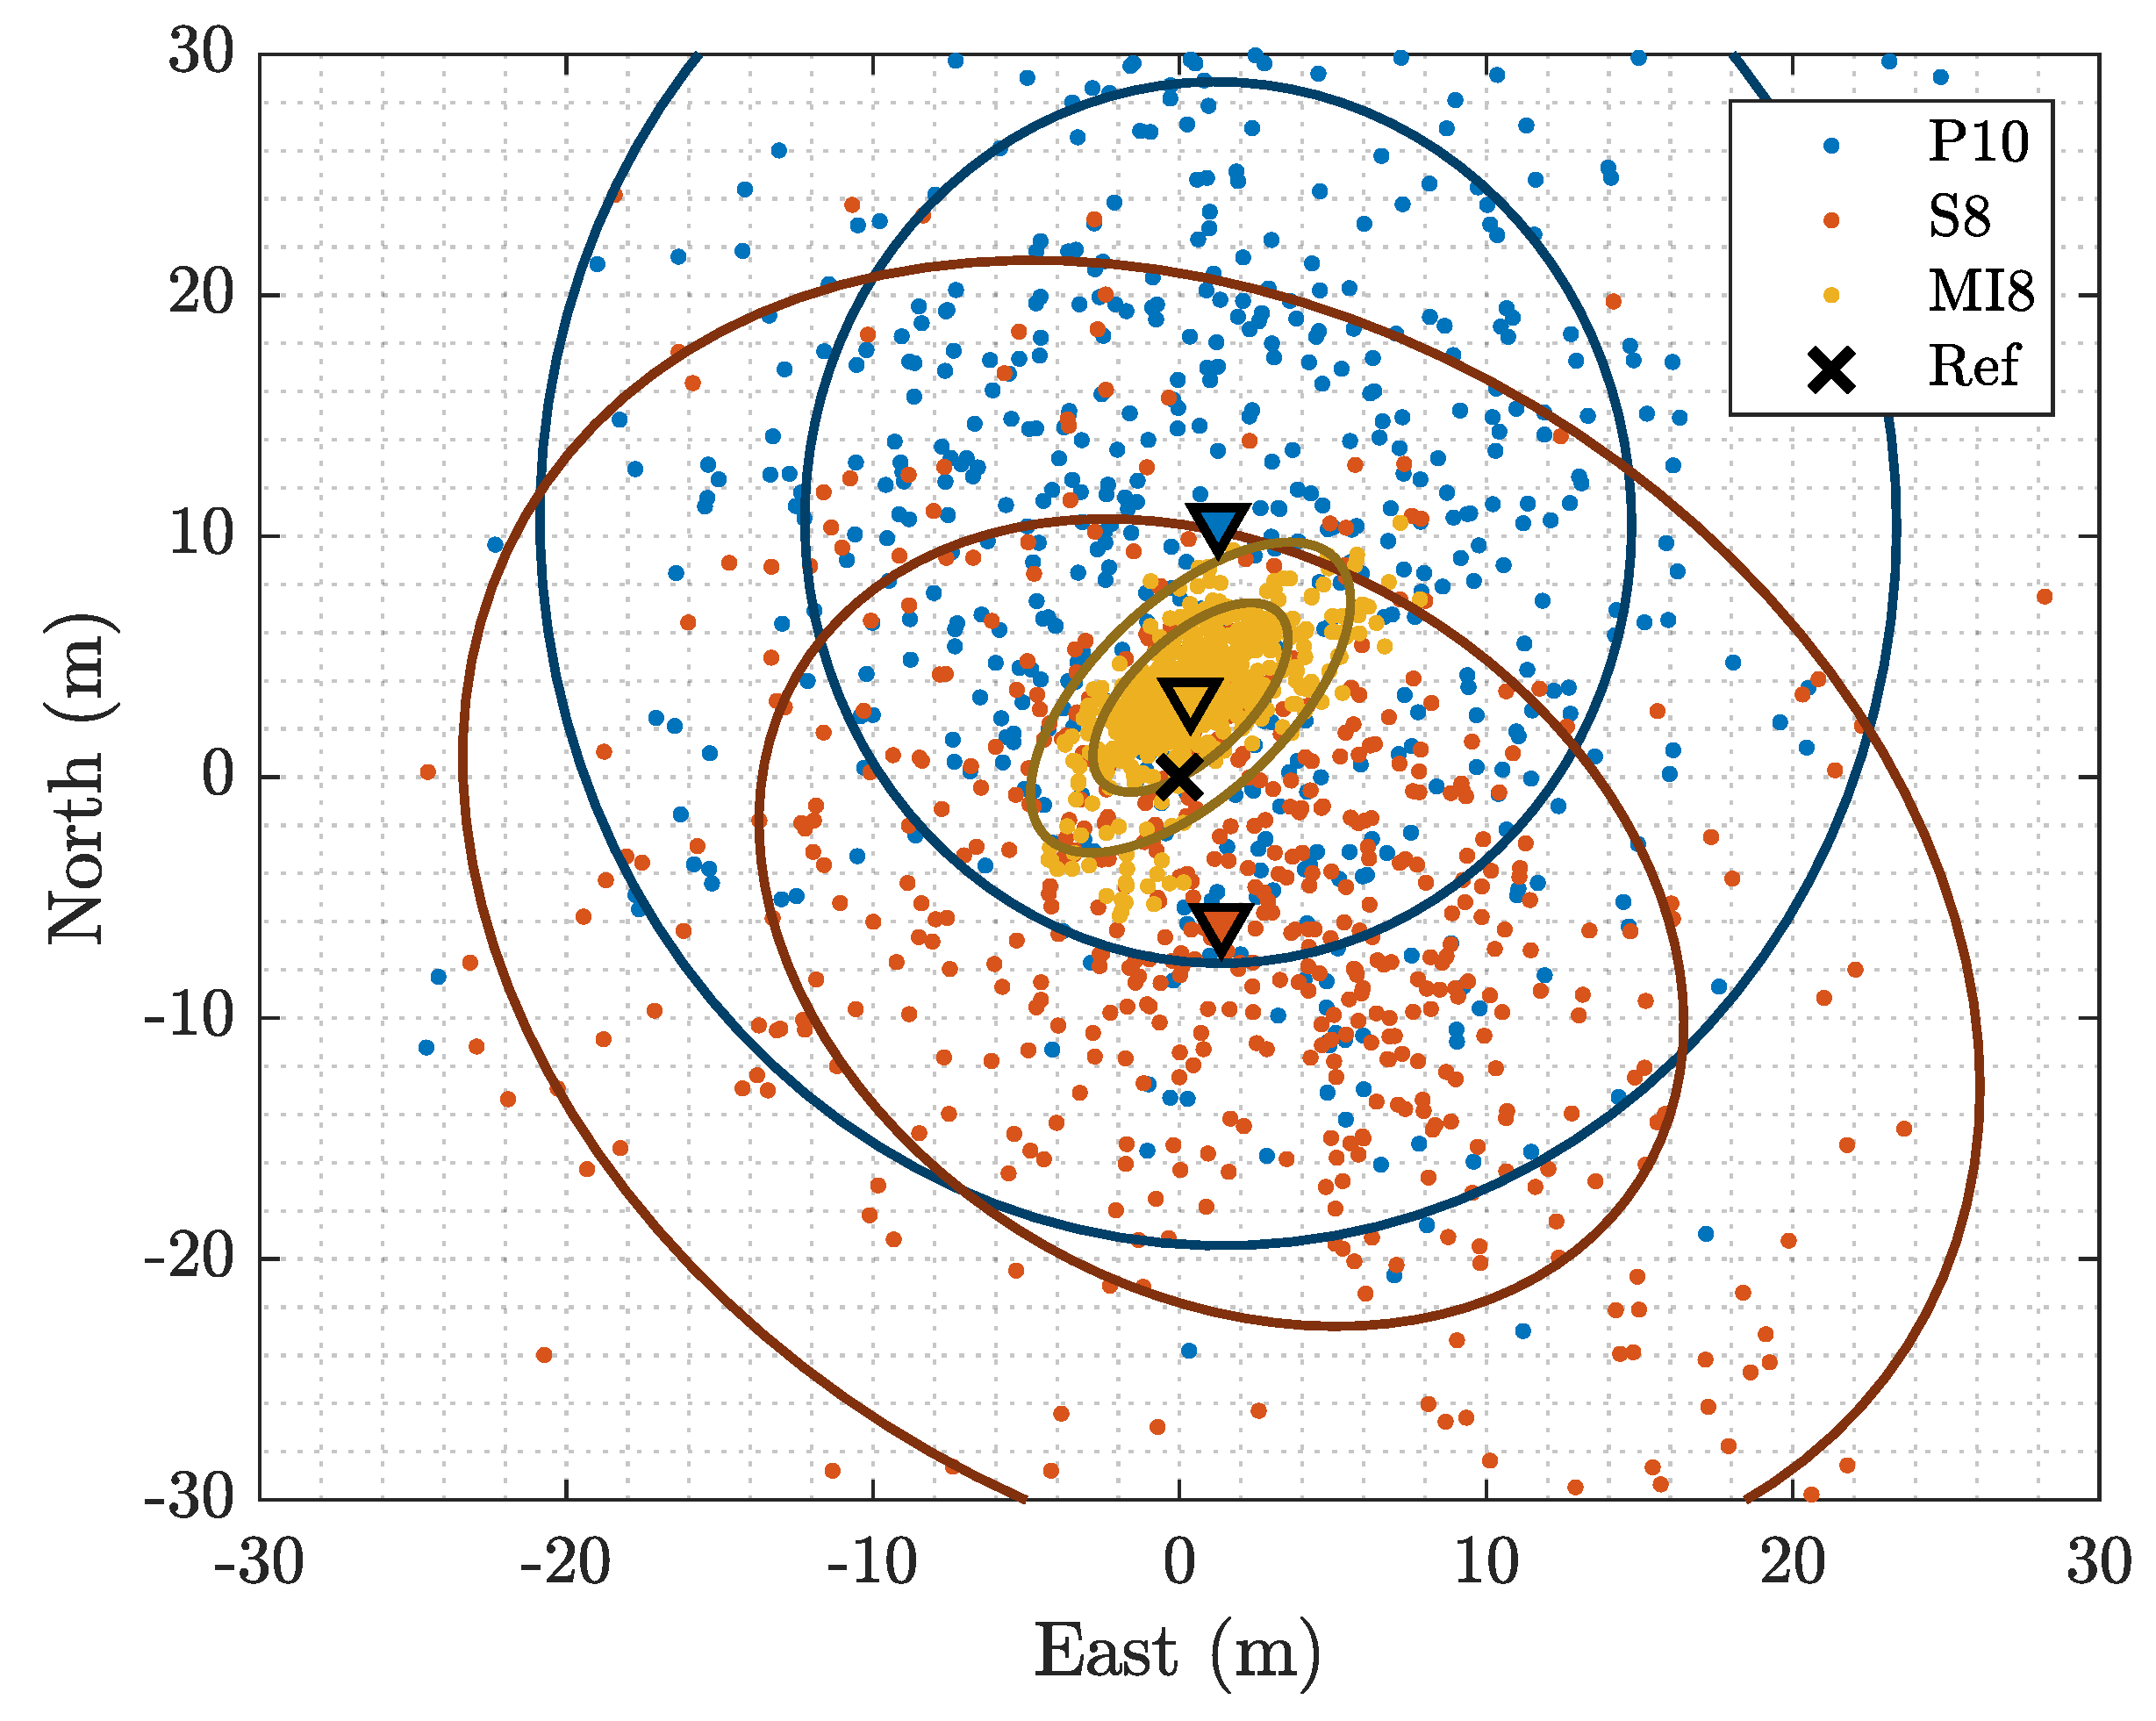
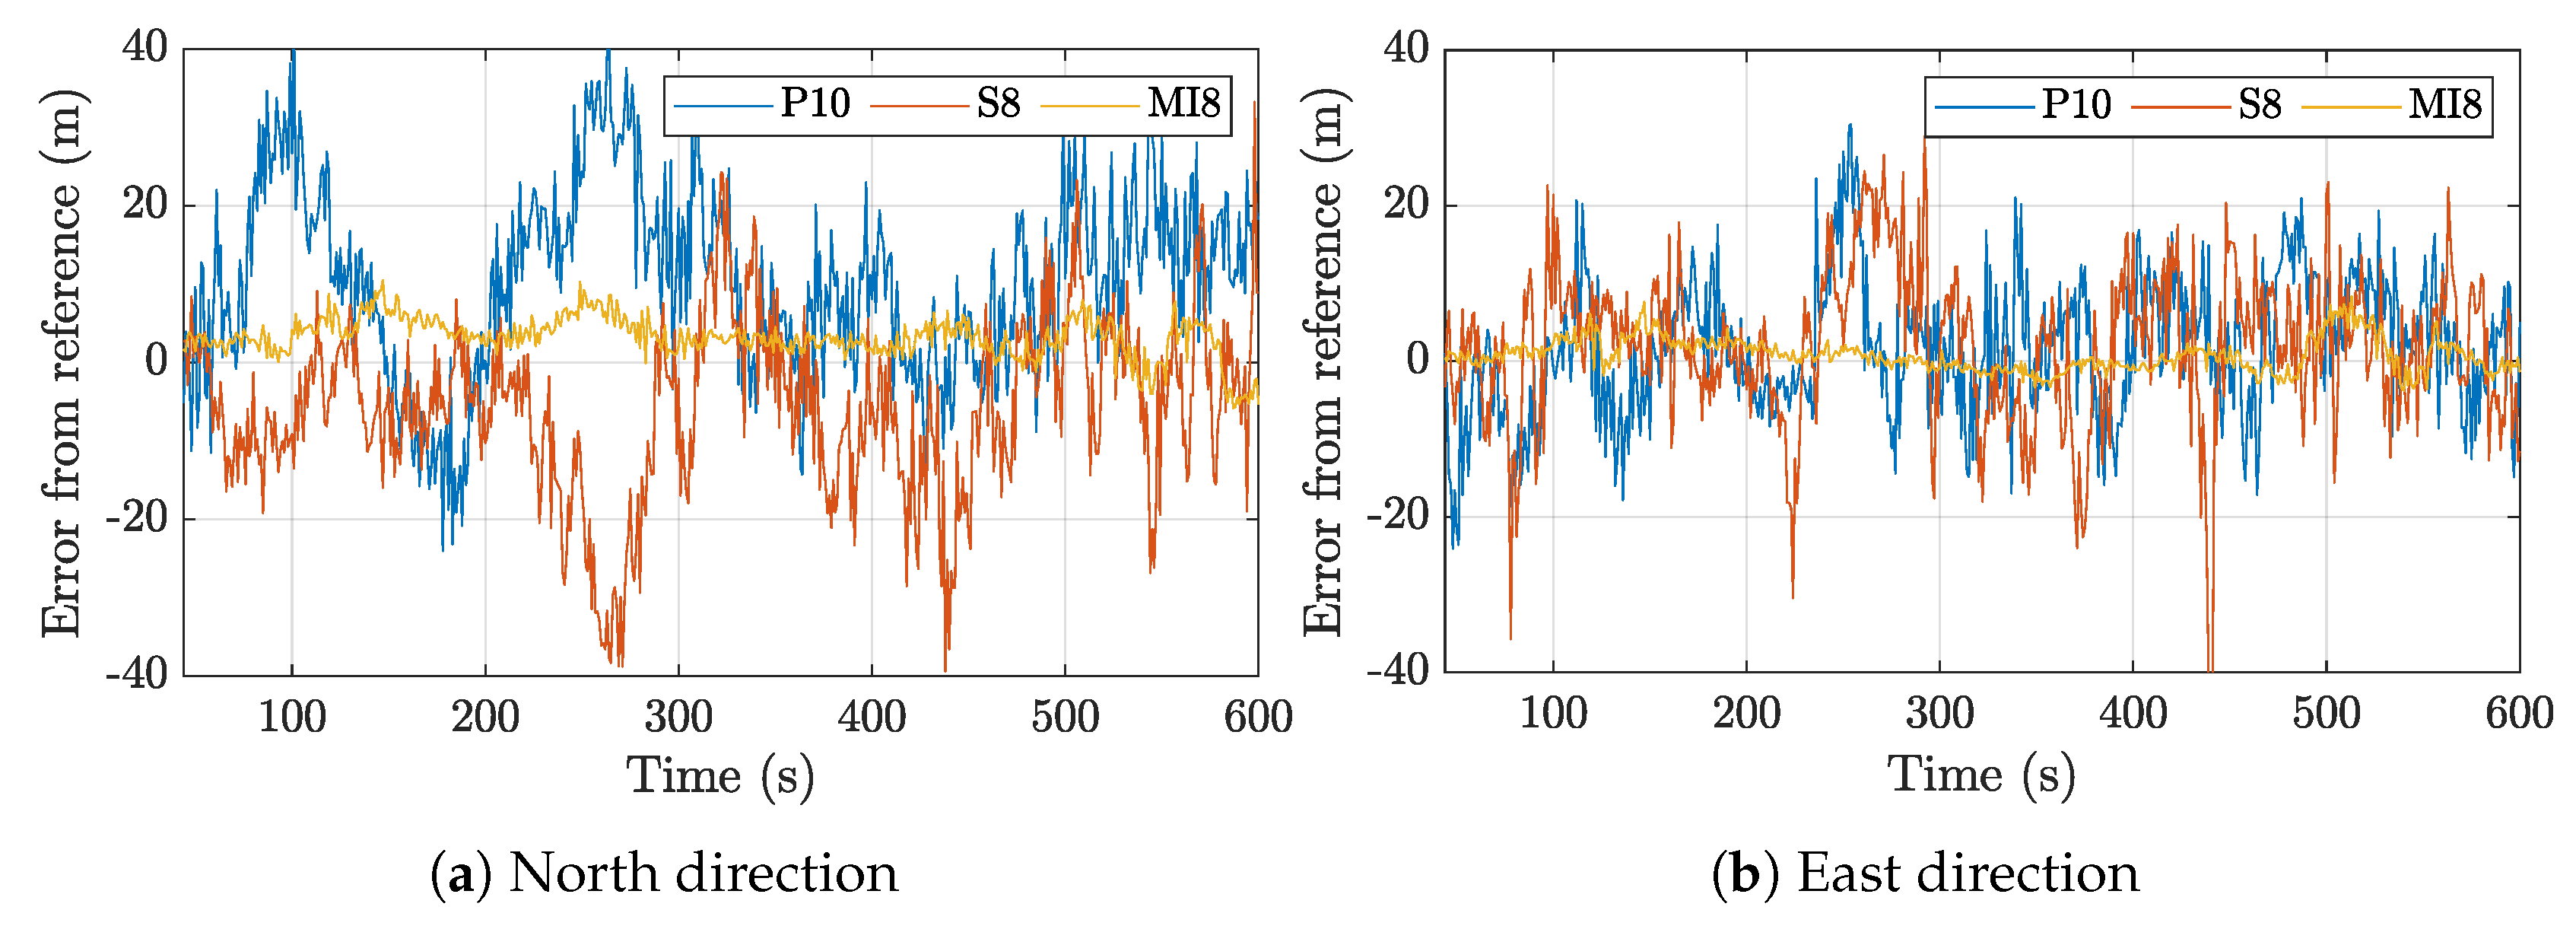
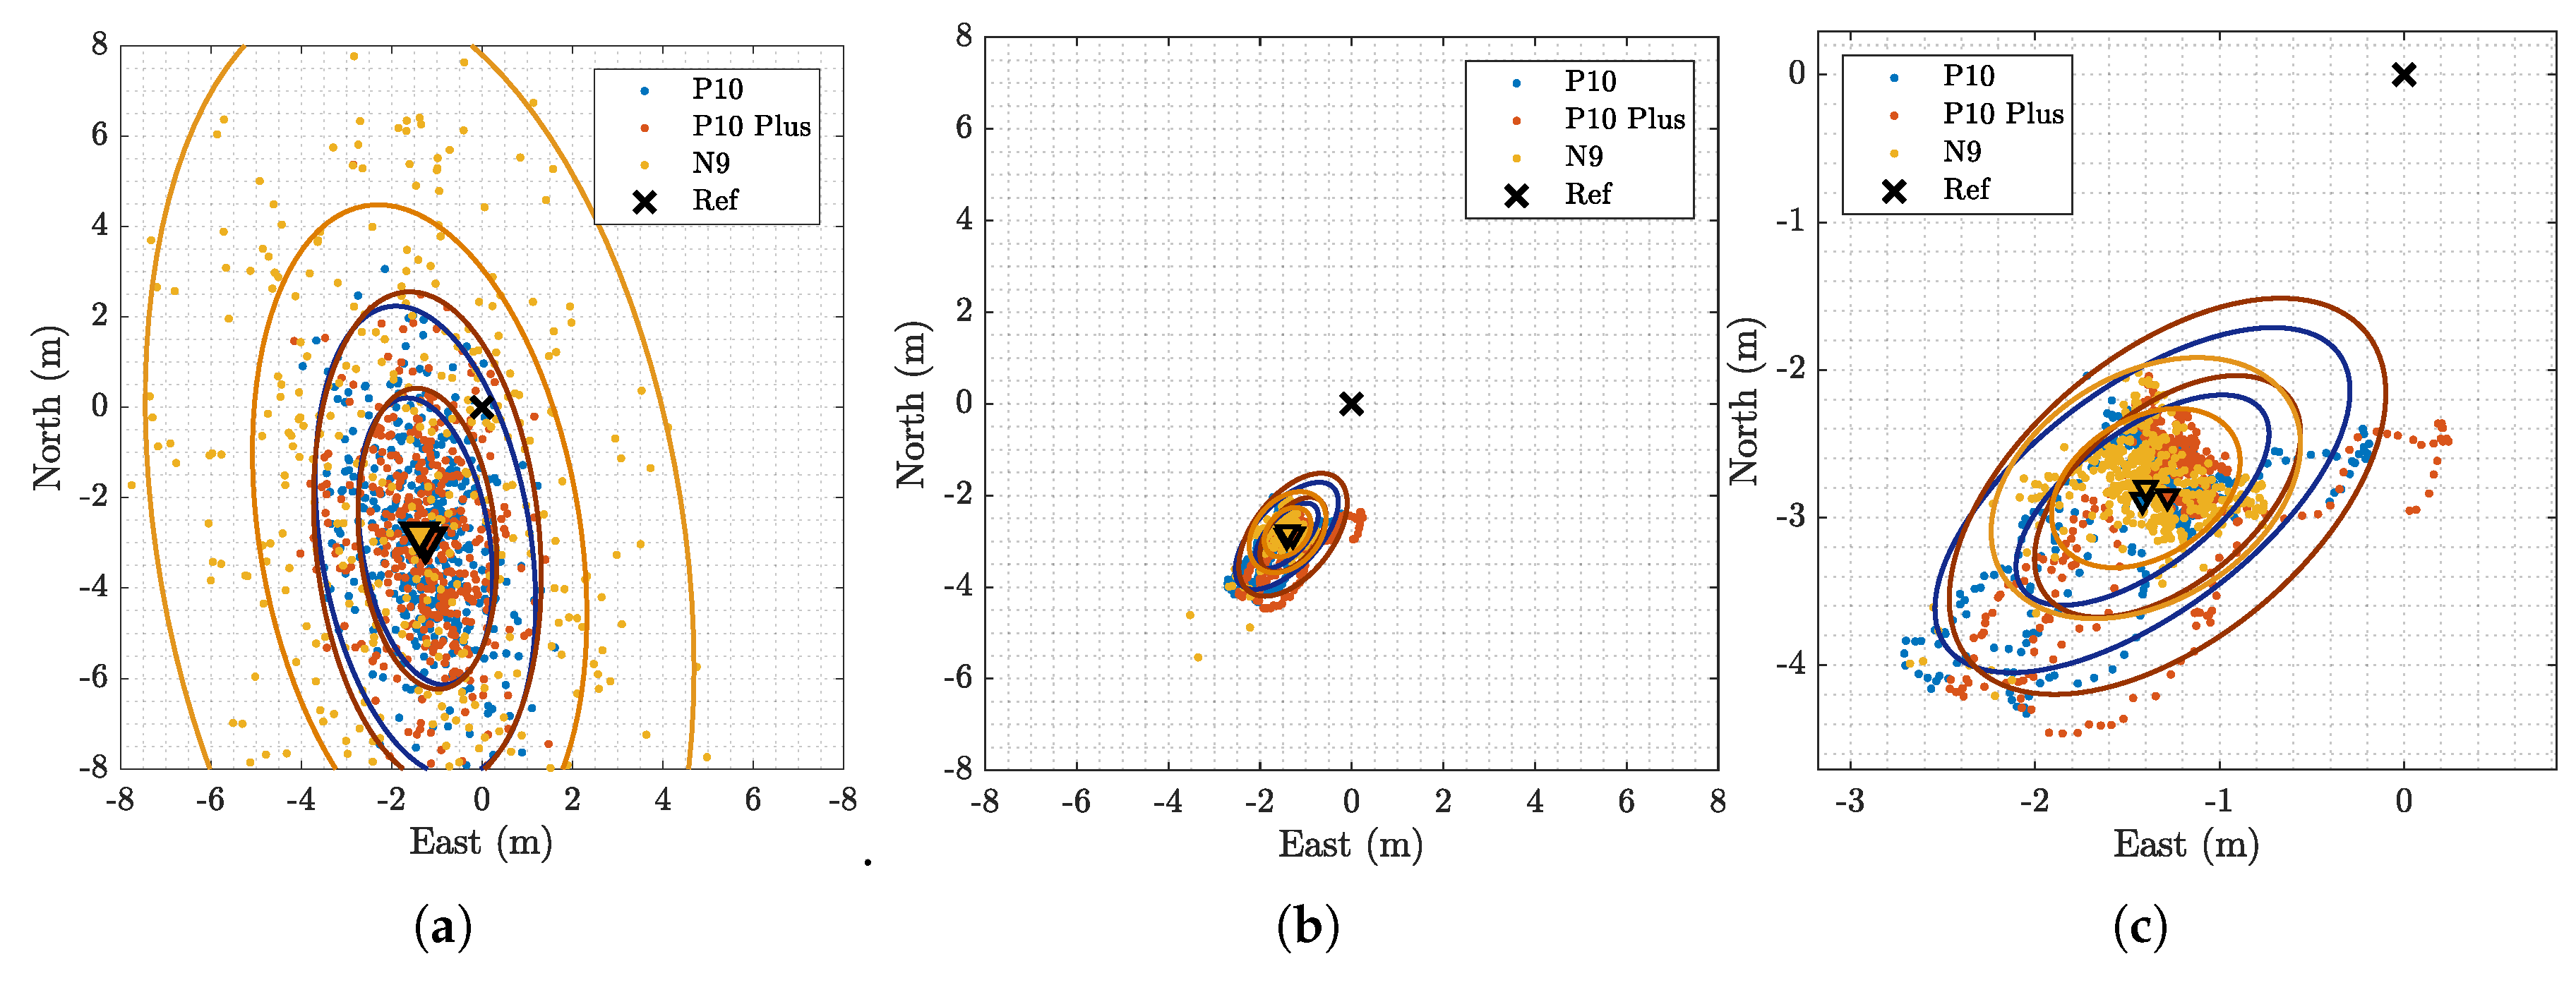
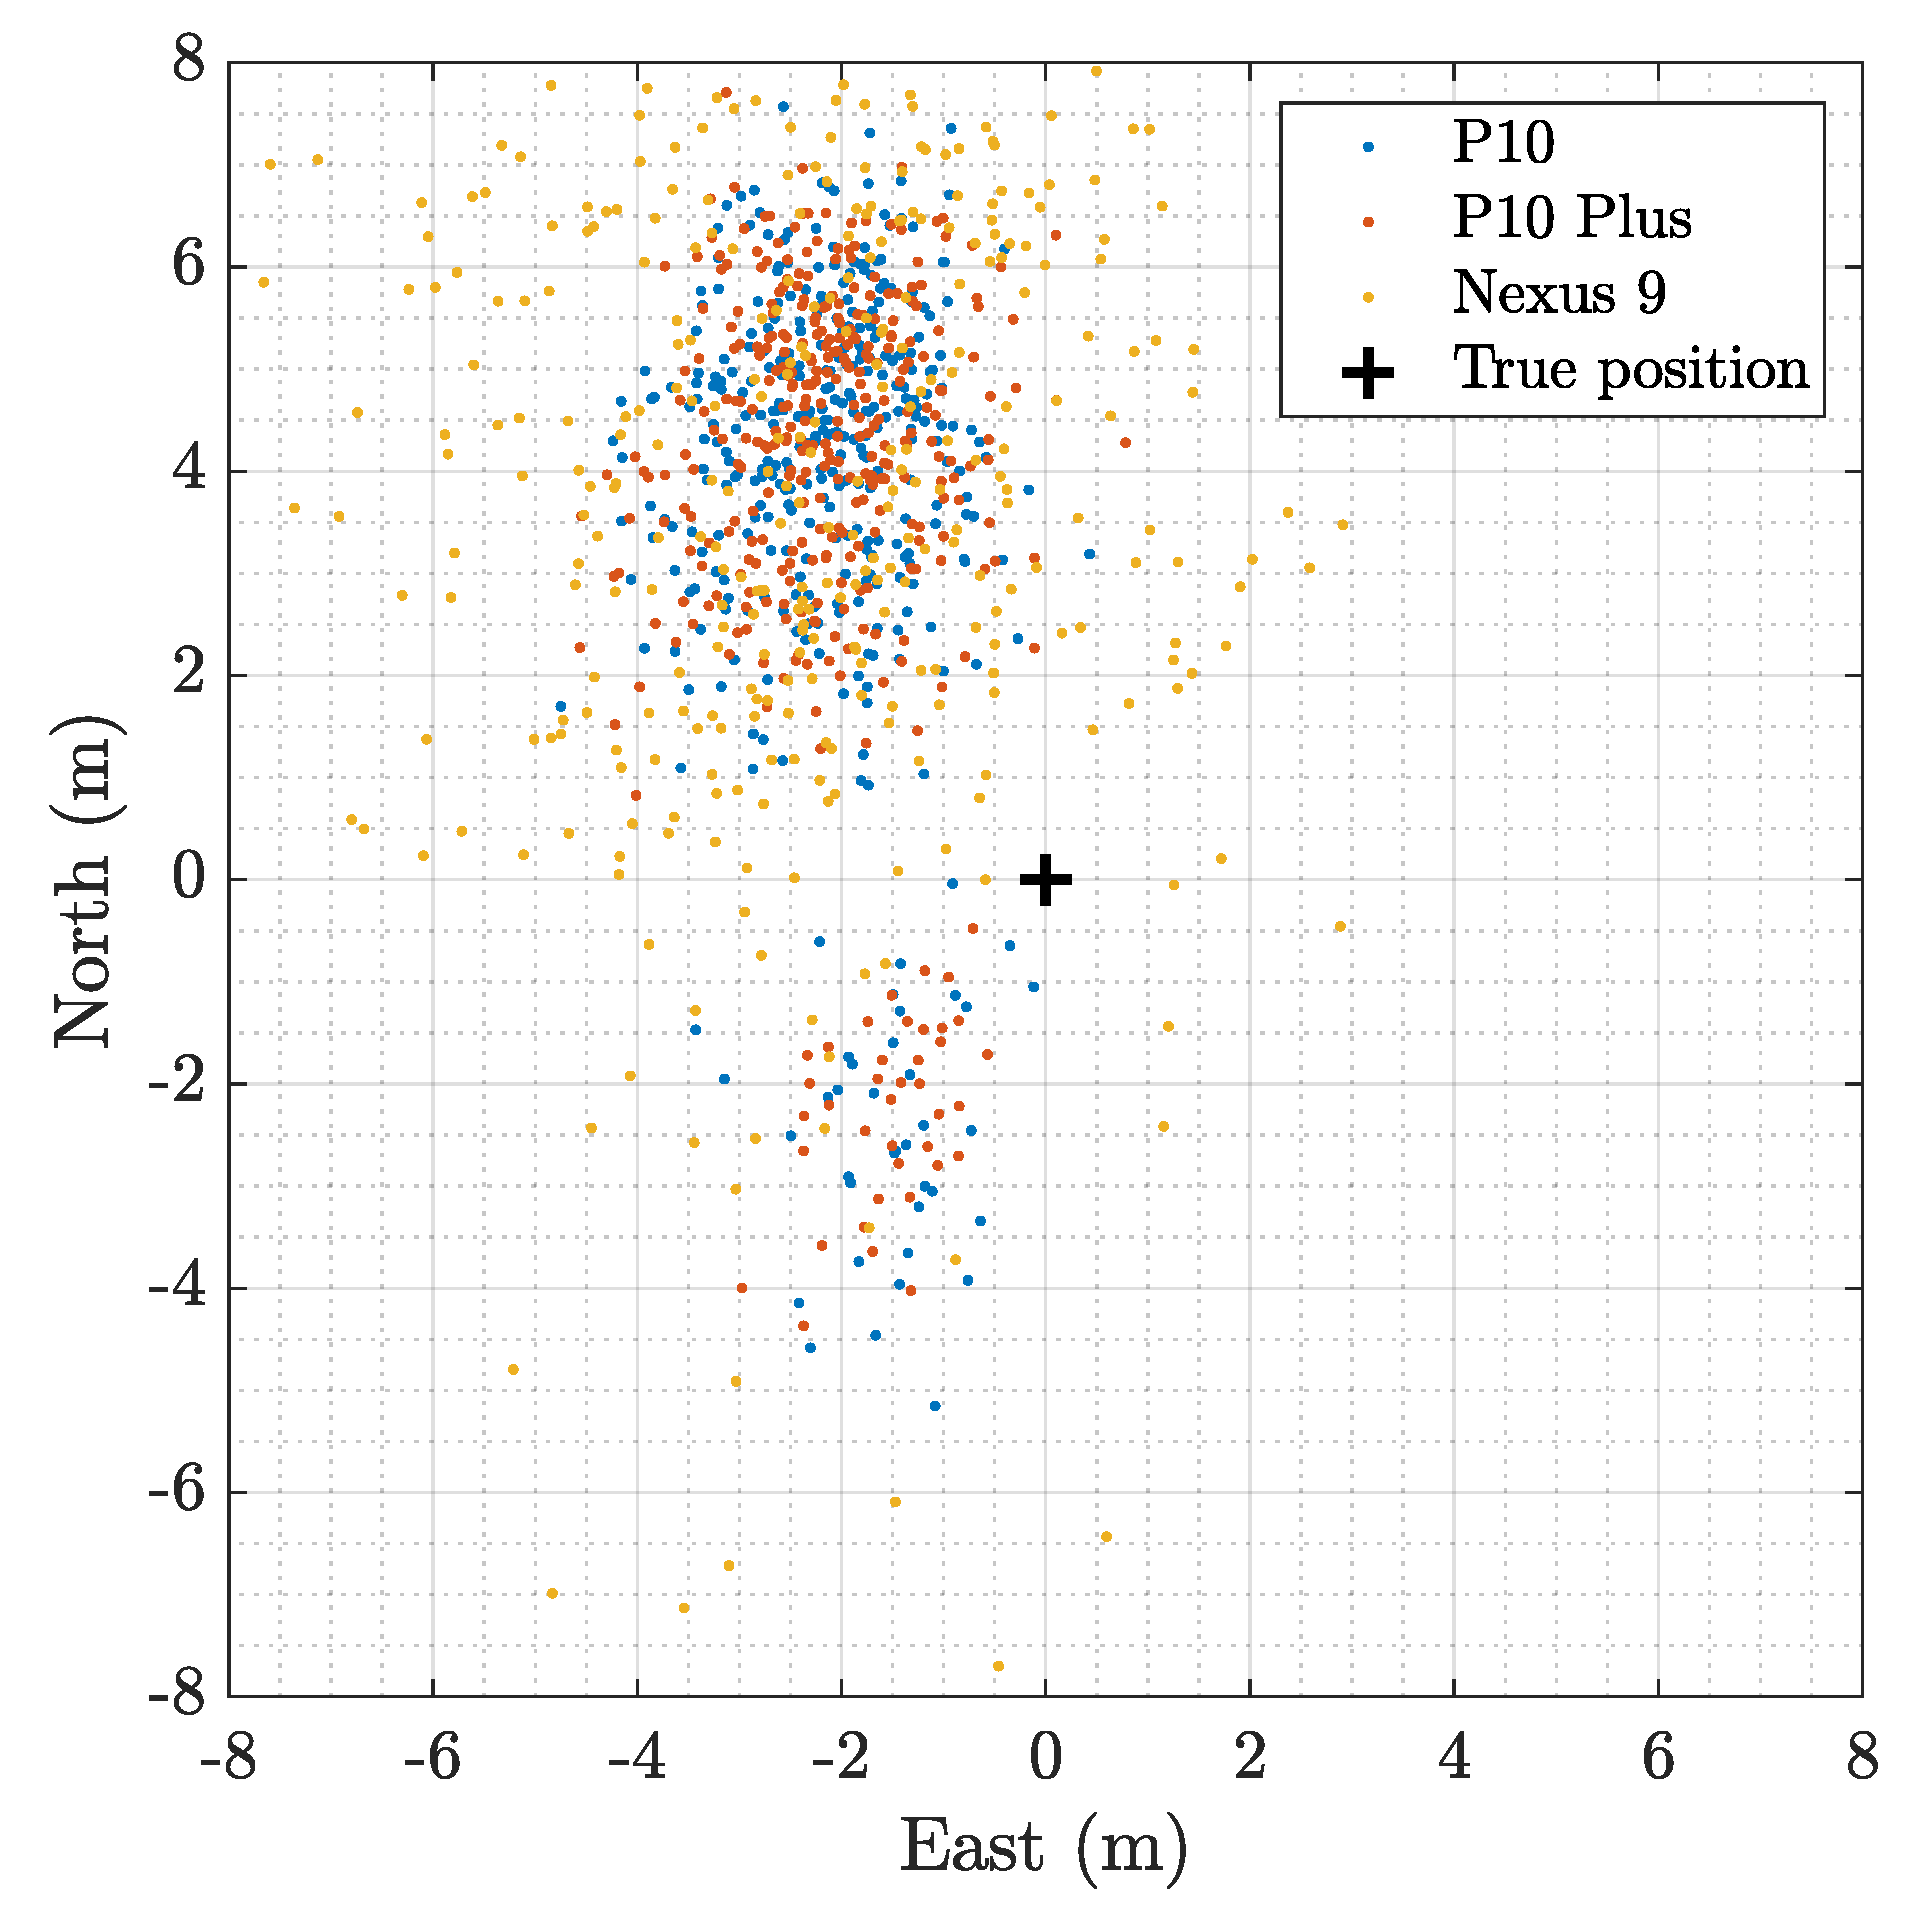
4.2. Positioning Solutions

The positioning solutions were first obtained by directly postprocessing the raw measurements through the WLS algorithm in the GNSS Toolbox without implementing atmospheric corrections. Figure 11 displays the horizontal two-dimensional position solutions of the devices with the true position at the origin in the absence (panel (a)) and in the presence of carrier smoothing (panel (b), while panel (c) is an enlargement of (b)). Looking at the left-sided unsmoothed scatter, there appears to be a bias. This is clearer on the smoothed solution on the right side. Precision improves the solution with smoothing, as expected, but with a slight decrease in accuracy, as seen from the figure and Table 2. There was also a deviation visible in the smoothed solution of the Huawei devices, which was not clear before.
To explore further, Figure 12 was reported to see the solutions against time, and it is seen that there was an event around t * , after which the stability of the Huawei devices worsened. This coincided with the duty-cycle effect seen in the raw measurements, and the comparison of the raw measurements with the positions can be seen in Figure 13. From the figure, it can be established that this event was limited to the Huawei devices and not due to any instability of the signal coming in, as there was no seen effect on the C / N 0 or the Nexus 9 device. Table 3 details the error and precision before and after the event in the devices, and it has to be noted that the North direction was affected the most, as seen from the above figures as well. The big changes in mean and standard deviation of the Huawei devices were evident when compared to the Nexus 9.
In Table 2 and Table 3, the bias in height measurements was around 20 meters and, although it was affected by the event and smoothing, it remained high. Applying ionospheric and tropospheric corrections, this reduced to around 6 meters, as a result of nonperfect correction models and generic uncompensated errors.
An important observation during position-measurement analysis was the effect of a low-elevation satellite on the position solution. There was significant deviation seen when including PRN 15, which was visible only partly during the test, and this was noticed in all three devices. Figure 14 shows the effects of such a satellite on the positioning results. When compared to Figure 11a, in which PRN 15 was excluded, it is clear that both accuracy and precision increased.
In the presence of this satellite, there was a shift mainly in the North component, as seen Figure 15a. Panel (b) depicts a similar low-elevation satellite scenario of real-environment measurements of P10, and it can be seen that, in general, such a minor shift should be drowned out in the noise.
On exploring further, it was seen that the problem lay with the use of a WLS-based PVT algorithm of the Google Toolbox while processing the anechoic-chamber measurements. In the toolbox, the quality of measurements is weighted based on the receiver-clock uncertainty of an incoming satellite measurement [17]. In the anechoic setup of this work, this uncertainty was the same for all satellite measurements due to the replay paradigm through one antenna, which makes weight matrix W an identity matrix in the WLS algorithm, leading to nonoptimized handling of the appearance and disappearance of signals.

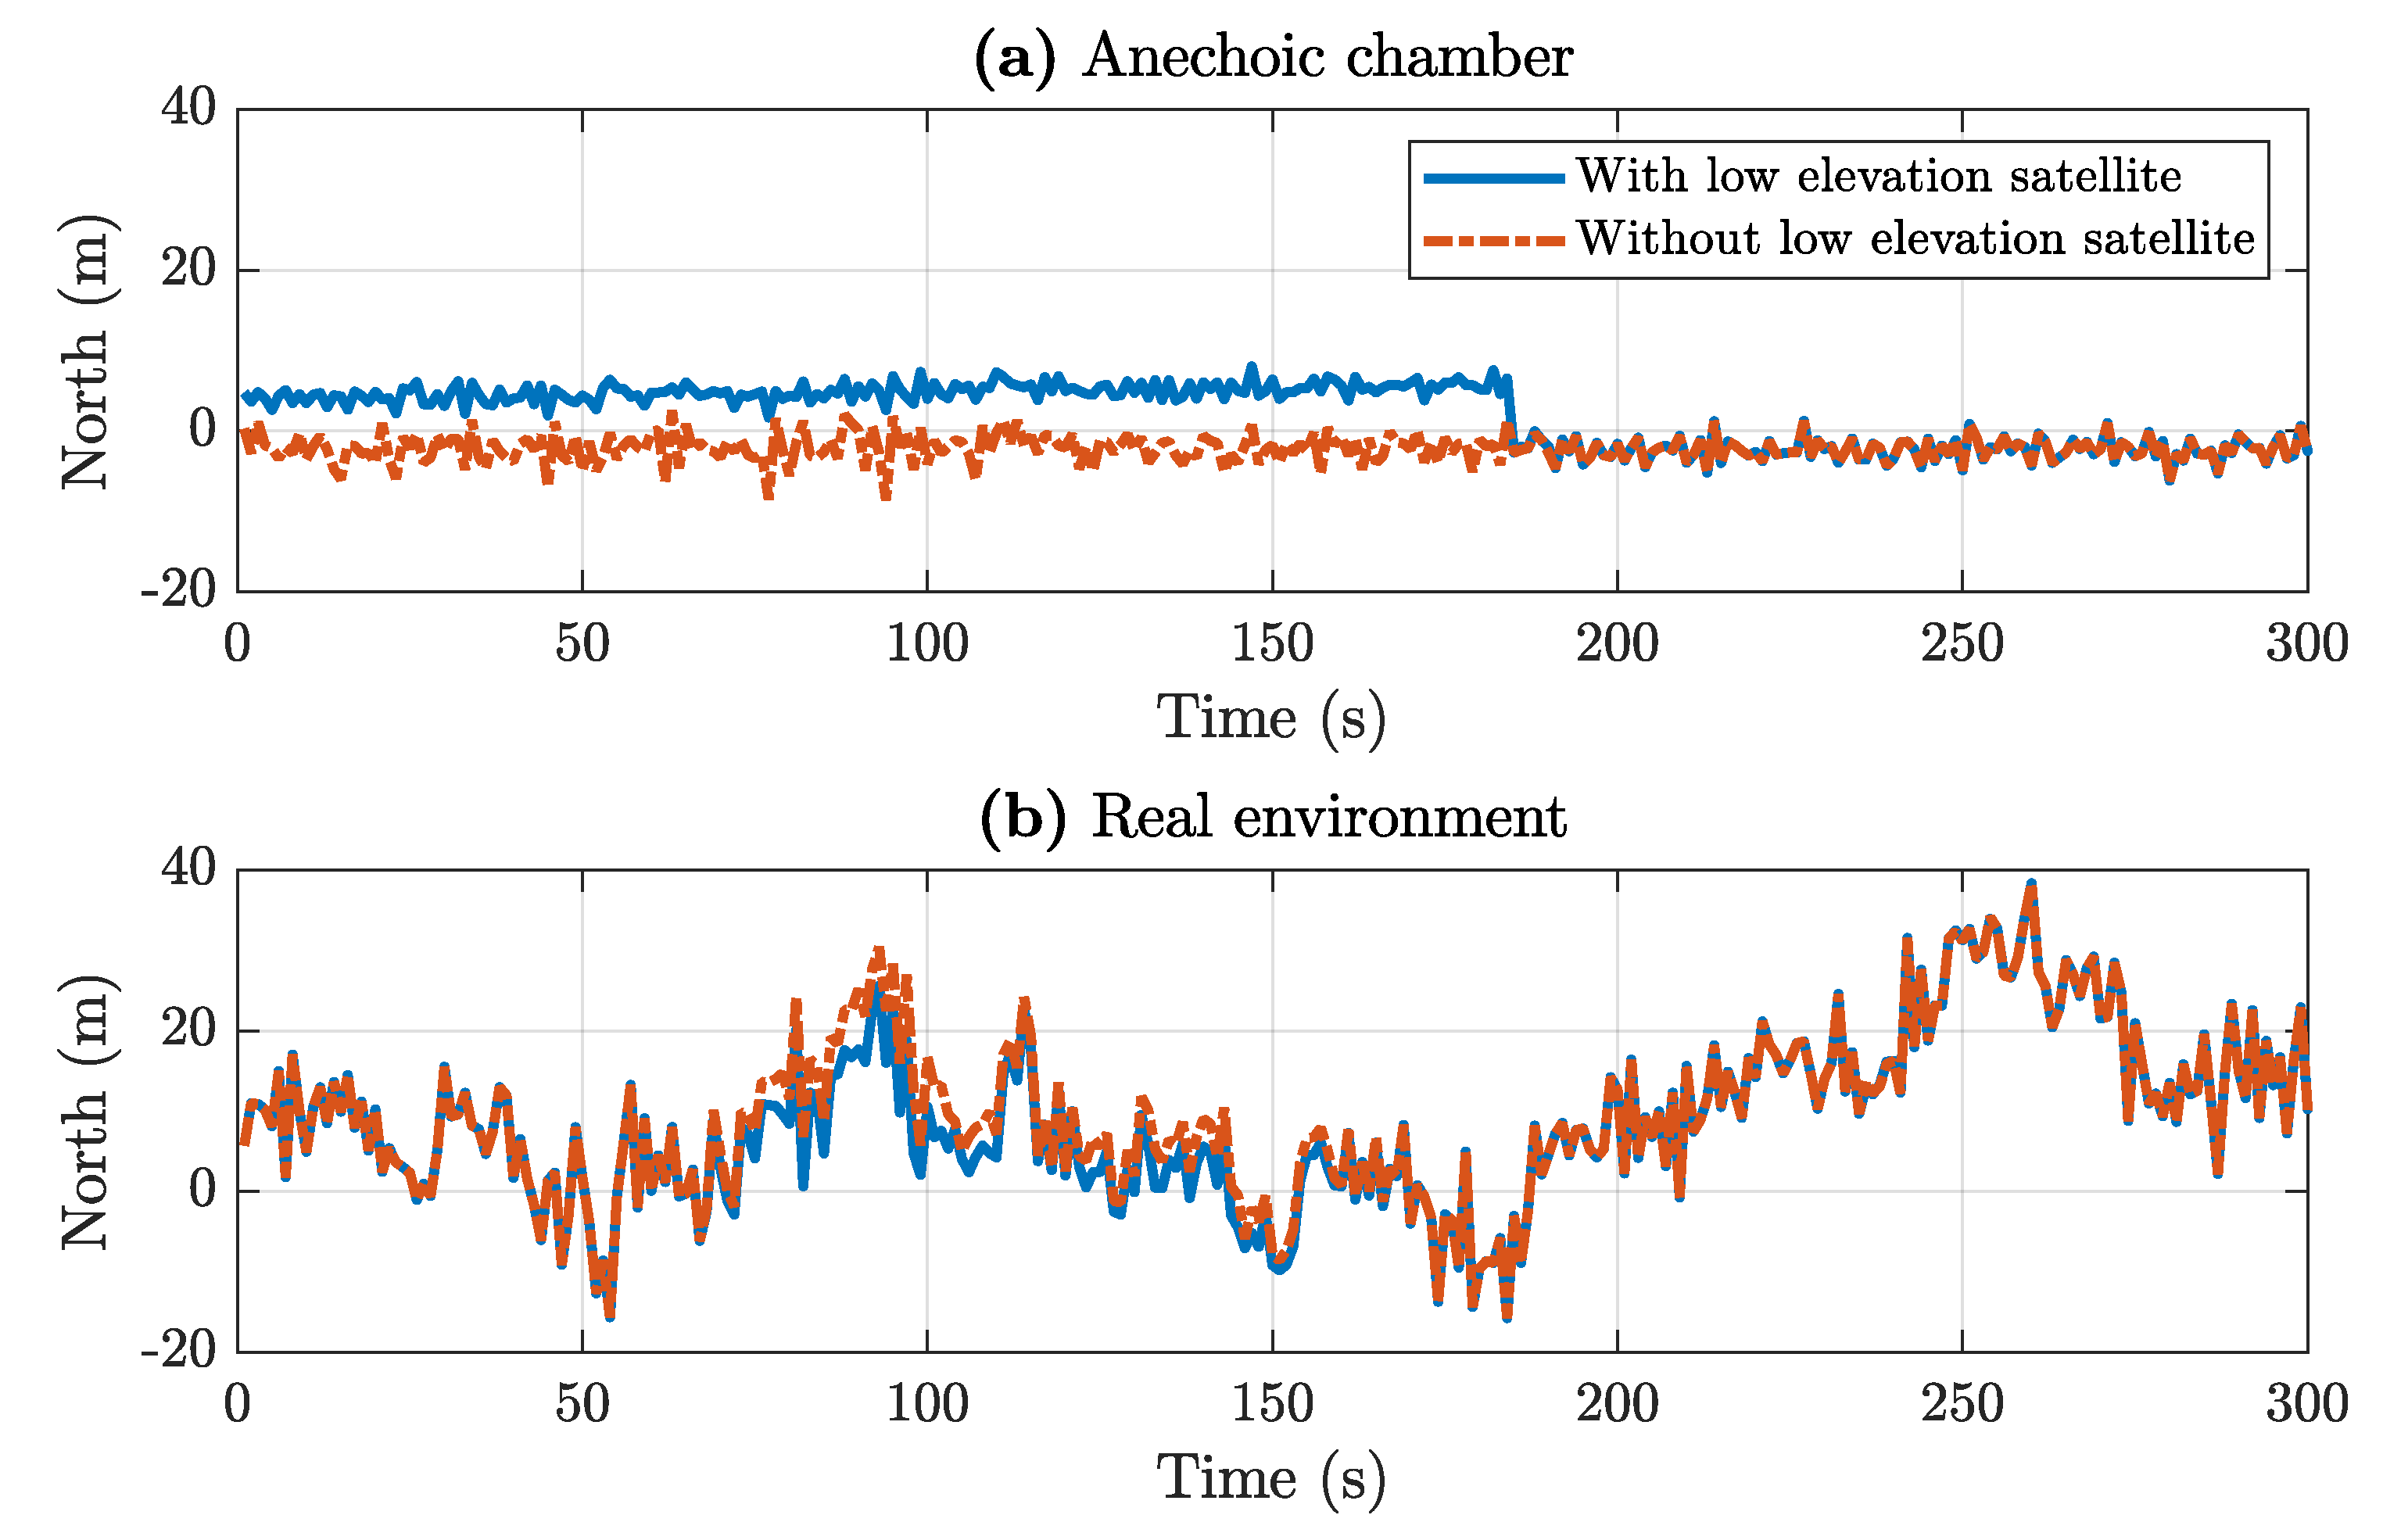
4.3. Duty-Cycle Effect on Anechoic and Real Environment

The anechoic-chamber experiment helps to understand vital details behind the performance and errors of GNSS in Android devices. Mitigating a number of error sources (multipath, interference, spurious signals, etc.) by taking the test to an anechoic environment helped zoom in to normally undetectable effects. One such analysed effect in this work was the duty cycle.
Replicating the detrending of pseudoranges to real-environment measurements shows the limits of quality assessment in such scenarios and, in turn, it justifies analysis in a controlled environment. Figure 16 reports the value of the AccumulatedDeltaRangeState flag (upper panel) and of the detrended pseudorange of GPS PRN 15 (lower panel). Even though, starting from epoch 300, cycle slips were detected, it was hard to make any conclusions about the quality of the pseudorange. This was due to the low quality of measurements under the effects of noise and other error sources, even when a close satellite with clear view from the receiver was selected. On the other hand, in the anechoic environment, it was clearly detected as the AccumulatedDeltaRangeState changed its state only when duty cycle was turned on (Figure 10).

5. Conclusions and Scope for Future

Analysis of the results of Android GNSS raw measurements under a completely controlled environment was not documented before. This represents a close match to the highest quality of raw measurements that may be achieved from the currently available Android devices in the market, barring the recently commercially available Xiaomi MI 8. Based on its comparison to real-environment-based peer research, the high stability of the C / N 0 in Android devices and significantly reduced pseudorange noises display the vital need for solving propagation nuisances that are troubling Android measurements today. Comparisons of position measurements between the anechoic chamber and a real environment reveal the nuances behind the large errors seen in GNSS-only Android positioning solutions, such as the duty-cycle occurrence. Understanding and mitigating them is vital toward the push to achieve higher performance through such devices. As mentioned in the work, the presented atmosphere models and smoothing corrections haven’t been fine-tuned to achieve maximum accuracies and, hence, a couple meters of biases remain. The low quality of the GNSS hardware on commercial Android devices also factor in these errors. Nexus 9 hardware emerges as the only viable device among those tested due to the problem of the duty cycle in others. Even under controlled conditions, there was no way to achieve an ambiguity fix after duty cycle was implemented by the devices. The limitation of the record-and-replay paradigm with one transmitting antenna is seen along with the unsuitability of the Google Toolbox PVT algorithm in such a scenario. Further controlled and real-world test comparisons need to be implemented, including more recent devices. Improvement to the positioning algorithm by refining correction models and integration with other sensors remain as future steps.

Author Contributions

A.M., N.L., and F.D. conceptualized the work; N.G., A.M., and N.L. curated the data and wrote the original draft; N.G. and N.L. performed formal analysis and contributed to the software development; N.G. and A.M. conceived the methodology; A.M. and N.L. performed validation of the work; all authors investigated and contributed to the writing, review, and editing; and F.D. supervised of the work.

Funding

This research received no external funding.

Acknowledgments

The authors would like to acknowledge Gianluca Dassano for providing access to the anechoic chamber; and Paolo Dabove and Vincenzo Di Pietra for assisting during the data-collection campaign, and for supplying the hardware.

Conflicts of Interest

The authors declare no conflict of interest.

Abbreviations

The following abbreviations are used in this manuscript:
APIApplication Programming Interface
CEPCircular Error Probable
C / N 0 Carrier to Noise Power Density Eatio
DETDepartment of Electronics and Telecommunications
ECEFEarth-Centered Earth-Fixed
GNSSGlobal Navigation Satellite System
GPSGlobal Positioning System
GSAEuropean GNSS Agency
HDOPHorizontal Dilution Of Precision
IFIntermediate Frequency
LBSLocation-Based Service
LNALow Noise Amplifier
OCXOOven Controlled Crystal Oscillator
PRNPseudo Random Noise
PVTPosition, Velocity, Time
RFRadio Frequency
RMSERoot Mean Square Error
STDStandard Deviation
USRPUniversal Software Radio Peripheral
WLSWeighted Least Squares

References

  1. Küpper, A. Location-Based Services: Fundamentals and Operation; John Wiley & Sons: Hoboken, NJ, USA, 2005. [Google Scholar]
  2. Zhang, X.; Tao, X.; Zhu, F.; Shi, X.; Wang, F. Quality assessment of GNSS observations from an Android N smartphone and positioning performance analysis using time-differenced filtering approach. GPS Solut. 2018, 22, 70. [Google Scholar] [CrossRef]
  3. Wang, B.; Liu, X.; Yu, B.; Jia, R.; Gan, X. Pedestrian Dead Reckoning Based on Motion Mode Recognition Using a Smartphone. Sensors 2018, 18, 1811. [Google Scholar] [CrossRef] [PubMed]
  4. Privat, A.; Pascaud, M.; Laurichesse, D. Innovative smartphone applications for Precise Point Positioning. In Proceedings of the 2018 SpaceOps Conference, Marseille, France, 28 May–1 June 2018; p. 2324. [Google Scholar]
  5. Realini, E.; Caldera, S.; Pertusini, L.; Sampietro, D. Precise gnss positioning using smart devices. Sensors 2017, 17, 2434. [Google Scholar] [CrossRef] [PubMed]
  6. GSA Working Group. Using GNSS Raw Measurements on Android Devices. Available online: https://www.gsa.europa.eu/system/files/reports/gnss_raw_measurement_web_0.pdf (accessed on 8 November 2018).
  7. Riley, S.; Landau, H.; Gomez, V.; Mishukova, N.; Lentz, W.; Clare, A. Positioning with Android GNSS observables. GPS World 2018, 29, 18–34. [Google Scholar]
  8. Linty, N.; Lo Presti, L.; Dovis, F.; Crosta, P. Performance analysis of duty-cycle power saving techniques in GNSS mass-market receivers. In Proceedings of the Position, Location and Navigation Symposium-PLANS 2014, Monterey, CA, USA, 5–8 May 2014; pp. 1096–1104. [Google Scholar]
  9. Humphreys, T.E.; Murrian, M.; Pesyna, K.M., Jr.; Podshivalov, S.; van Diggelen, F. On the feasibility of cm-accurate positioning via a smartphone’s antenna and GNSS chip. In Proceedings of the Radionavigation Laboratory Conference Proceedings, Savannah, GA, USA, 11–14 April 2016. [Google Scholar]
  10. Dabove, P.; Di Pietra, V.; Lingua, A.M. Positioning Techniques with Smartphone Technology: Performances and Methodologies in Outdoor and Indoor Scenarios. In Smartphones from an Applied Research Perspective; InTech: London, UK, 2017. [Google Scholar] [Green Version]
  11. Cristodaro, C.; Ruotsalainen, L.; Dovis, F. Benefits and Limitations of the Record and Replay Approach for GNSS Receiver Performance Assessment in Harsh Scenarios. Sensors 2018, 18, 2189. [Google Scholar] [CrossRef] [PubMed]
  12. Misra, P.; Enge, P. Global Positioning System: Signals, Measurements and Performance, 2nd ed.; Ganga-Jamuna Press: Lincoln, MA, USA, 2006. [Google Scholar]
  13. Kaplan, E.D.; Hegarty, C. Understanding GPS/GNSS: Principles and Applications; Artech House: Norwood, MA, USA, 2017. [Google Scholar]
  14. Zekavat, R.; Buehrer, R.M. Handbook of Position Location: Theory, Practice and Advances; John Wiley & Sons: Hoboken, NJ, USA, 2011; Volume 27. [Google Scholar]
  15. Raw GNSS Measurements|Android Developers. Available online: http://g.co/gnsstools (accessed on 8 November 2018).
  16. Borio, D.; Li, H.; Closas, P. Huber’s Non-Linearity for GNSS Interference Mitigation. Sensors 2018, 18, 2217. [Google Scholar] [CrossRef] [PubMed]
  17. Van Diggelen, F.; Khider, M. GNSS Analysis Tools from Google. Inside GNSS 2018, 13, 51. [Google Scholar]
  18. Petovello, M.; Lo Presti, L.; Visintin, M. Can you list all the properties of the carrier-smoothing filter? Inside GNSS 2015, 10, 32–37. [Google Scholar]
  19. Linty, N.; Minetto, A.; Dovis, F.; Spogli, L. Effects of Phase Scintillation on the GNSS Positioning Error During the September 2017 Storm at Svalbard. Space Weather 2018, 16, 1317–1329. [Google Scholar] [CrossRef]
Figure 1. Setup of the data campaign carried out using smartphones. The screw indicates the georeferenced known point.
Electronics 08 00005 g001
Figure 2. Comparison of the C / N 0 of three different satellites (low, medium, and high-elevated Pseudo Random Noises (PRNs)), as estimated by the three different devices.
Electronics 08 00005 g002
Figure 3. Comparison of the Position, Velocity, and Time (PVT) (Weighted Least-Squares) (WLS), as estimated by the three different devices, in a real environment. The true reference position is shown at the top, along with the average, the 1- σ , and the 2- σ ellipses for all the three smartphones.
Electronics 08 00005 g003
Figure 4. North (a) and East (b) position errors with respect to the reference position for all the three smartphones under the test in a real environment.
Electronics 08 00005 g004
Figure 5. Example of second order derivative of the raw and carrier-smoothed pseudorange measurements for a single Global Positioning System (GPS) satellite and related positioning solutions.
Electronics 08 00005 g005
Figure 6. Anechoic chamber setup: on the left, receivers in face-up orientation; on the right, the transmitting GNSS antenna.
Electronics 08 00005 g006
Figure 7. Record and Replay equipment and configuration for controlled experiments.
Electronics 08 00005 g007
Figure 8. Simulated satellite constellations and related Horizontal Dilution Of Precision (HDOP) for record and replay experimental scenarios. (a) Skyplot of simulated satellites; (b) number of visible satellites and HDOP.
Electronics 08 00005 g008
Figure 9. C / N 0 comparison between Android devices in a controlled environment.
Electronics 08 00005 g009
Figure 10. Effect of cycle slips in a controlled environment (PRN 23).
Electronics 08 00005 g010
Figure 11. Position comparison between devices in a controlled environment. (a) Smoothing OFF; (b) Smoothing ON with weight L = 50 ; (c) Smoothing ON with weight L = 50 (enlargement).
Electronics 08 00005 g011
Figure 12. North (a) and East (b) position error comparison between devices in a controlled environment.
Electronics 08 00005 g012
Figure 13. PRN 23 (closest) measurements in the controlled environment, highlighting the change around t * = 210 s.
Electronics 08 00005 g013
Figure 14. Clustering effect due to the presence of a low-quality signal (PRN 15) in a controlled environment.
Electronics 08 00005 g014
Figure 15. Comparison of the positioning results in controlled (a) and real (b) environment in the presence and in the absence of bad-quality measurements.
Electronics 08 00005 g015
Figure 16. Effect of cycle slips in a real environment (PRN 11).
Electronics 08 00005 g016
Table 1. Statistics of the positioning solutions obtained from smartphones in a real environment.
DeviceCEP (m)Horizontal
RMSE (m)
North (m)
μ ± σ
East (m)
μ ± σ
Height (m)
μ ± σ
Huawei P10 15.1 10.6 10.4 ± 12.1 1.7 ± 8.9 10.0 ± 37.1
Samsung S8 11.4 6.2 6.0 ± 11.1 1.8 ± 9.6 8.1 ± 33.1
Xiaomi MI 8 3.8 3.3 3.2 ± 2.6 0.8 ± 2.1 0.0 ± 7.5
Table 2. Statistics of the positioning solutions obtained from smartphones inside the anechoic chamber.
Smoothing OFFSmoothing ON
DeviceNorth (m)
μ ± σ
East (m)
μ ± σ
Height (m)
μ ± σ
North (m)
μ ± σ
East (m)
μ ± σ
Height (m)
μ ± σ
Huawei P10 3.0 ± 2.1 1.3 ± 1.0 20.1 ± 3.4 2.9 ± 0.5 1.4 ± 0.5 20.2 ± 0.6
Huawei P10 Plus 2.9 ± 2.2 1.2 ± 1.0 20.1 ± 3.2 2.9 ± 0.5 1.3 ± 0.5 19.9 ± 0.7
Nexus 9 2.8 ± 4.8 1.4 ± 2.4 20.2 ± 7.5 2.8 ± 0.4 1.4 ± 0.3 20.2 ± 0.6
Table 3. Statistics of the smoothed-positioning solutions obtained from smartphones inside the anechoic chamber before and after the event.
Before t * After t *
DeviceNorth (m)
μ ± σ
East (m)
μ ± σ
Height (m)
μ ± σ
North (m)
μ ± σ
East (m)
μ ± σ
Height (m)
μ ± σ
Huawei P10 2.6 ± 0.2 1.3 ± 0.1 20.2 ± 0.2 3.4 ± 0.6 1.3 ± 0.7 20.1 ± 1.1
Huawei P10 Plus 2.5 ± 0.2 1.3 ± 0.1 20.1 ± 0.1 3.6 ± 0.7 1.1 ± 0.8 20.1 ± 1.2
Nexus 9 2.8 ± 0.4 1.6 ± 0.3 19.9 ± 0.5 3.1 ± 0.4 1.1 ± 0.2 20.7 ± 0.3

