Article

Monitoring System for Laboratory Mice Transportation: A Novel Concept for the Measurement of Physiological and Environmental Parameters

by
Carlos González-Sánchez
1,
Juan-Carlos Fraile
2,
Javier Pérez-Turiel
2,*,
Ellen Damm
3,
Jochen G. Schneider
3,
Daniel Schmitt
1 and
Frank R. Ihmig
1
1
Fraunhofer-Institut für Biomedizinische Technik (IBMT), 66280 Sulzbach/Saar, Germany
2
ITAP (Instituto de las Tecnologías Avanzadas de la Producción)—Universidad de Valladolid, Paseo del Cauce 59, 47011 Valladolid, Spain
3
Luxembourg Centre for Systems Biomedicine, University of Luxembourg Esch-sur-Alzette L-4362, Luxembourg and Internal Medicine II, Saarland University Medical Center, 66421 Homburg, Germany
*
Author to whom correspondence should be addressed.
Electronics 2019, 8(1), 34; https://doi.org/10.3390/electronics8010034
Submission received: 14 November 2018 / Revised: 14 December 2018 / Accepted: 20 December 2018 / Published: 1 January 2019
(This article belongs to the Section Bioelectronics)

Abstract

:
Laboratory mice are used in biomedical research as “models” for studying human disease. These mice may be subject to significant levels of stress during transportation that can cause alterations that could negatively affect the results of the performed investigation. Here, we present the design and realization of a prototypical transportation container for laboratory mice, which may contribute to improved laboratory animal welfare. This prototype incorporates electric potential integrated circuit (EPIC) sensors, which have been shown to allow the recording of physiological parameters (heart rate and breathing rate) and other sensors for recording environmental parameters during mouse transportation. This allows for the estimation of the stress levels suffered by mice. First experimental results for capturing physiological and environmental parameters are shown and discussed.

1. Introduction

Animals are used in biomedical research as “models” for studying human biology and disease, and as test subjects for the development and testing of drugs and vaccines to improve human health, without putting the lives and safety of humans at risk.
A moral code that minimizes the impact of research on animals is needed. The European Directive 2010/63/EU indicates that animal-welfare considerations should be given the highest priority in the context of animal keeping, breeding, and use [1]. The European Commission has created the “Platform on Animal Welfare” [2] to promote an enhanced dialogue on animal welfare issues that are relevant at the European Union level among competent authorities, businesses, civil society, and scientists. International animal welfare regulations [3,4] oblige the scientific community to improve the welfare of laboratory animals used in biomedical research. Animal ethics committees supervise the research to avoid animal suffering and the unethical behavior of researchers.
In 1959, Russell and Burch [5] described the so-called “concept of the 3 Rs”: Replacement, Reduction, and Refinement. Replacement refers to the use of alternative methods as substitutes for in vivo techniques. Reduction refers to any strategy that will result in minimizing the number of animals needed. Refinement refers to the modification of experimental procedures to minimize the pain and distress of animals used in research. Millions of animals are used each year in laboratories around the world. In the European Union, nearly 11.5 million laboratory animals were used in 2011, about 75% of which were rodents [6].
In research, it is important to minimize all external influences (human interaction and environmental factors) that could deteriorate animal welfare. Studies describe the impact of environmental factors such as light, noise, cage cleaning, and transport on the welfare and stress of laboratory rodents to show that the integrity and well-being of the animals being transported are necessary for their welfare and the quality of the research data [7,8].
Laboratory animals may be subject to significant levels of stress during transport that can cause alterations that pass unnoticed to the researcher but certainly could negatively affect the results of the performed investigation [9]. Such alterations are, for example: confinement in a transport box; hours of travel; unknown environments; and changes in temperature, light, and humidity. These factors produce high stress levels in animals [10], which cause changes in their physiological parameters [11,12,13,14], such as heart rate (HR), breathing rate (BR), blood pressure, body temperature, and hormone levels. This stress is not limited to the transported animal, because it can also affect their offspring [14,15].
After enduring high stress levels, mice require a long time for their HR and BR values to return to normal levels [12,13,16]. Several authors [17,18] have described the need for 24–48 h of rest for the immune system and corticosterone levels to stabilize after transport. Others [10,19] found that mice were not completely acclimated after three to four days by monitoring stress indicators based on animal behavior and corticosterone level. For this reason, it is useful to be able to measure both the physiological signals of the mouse and the environmental parameters of the transport container. This would allow evaluating the stress level that the mouse “suffered” during its transport.
In general, heart rate variability (HRV) analysis provides a more accurate measurement of stress than simply observing cardiac rhythm, because the cardiac rhythm can vary greatly from one animal to another or can depend on physical activity. HRV is defined as beat-to-beat changes in HR or variations of the RR intervals (time between two R peaks in an electrocardiogram (ECG)) in consecutive cardiac cycles. Measuring interbeat intervals (IBI) and HRV are commonly used methods for monitoring the level of stress in small laboratory animals during transport [20,21].
Acquisition of HR in small laboratory animals is usually performed using invasive techniques with implantable radio link electrodes placed inside the animal [22,23]. With these invasive techniques, a complete ECG of the animal is obtained, but the placement of the electrodes causes stress on the animal and increases its risk of death. An alternative system for recording ECGs in conscious mice without anesthesia or implants is described in [24]. The system includes paw-sized conductive electrodes embedded in a platform configured to record ECGs when three single electrodes contact three paws.
The measurement of physiological signals in mice using conventional techniques, such as immobilization or anesthesia, causes stress in the animal [25], since they do not allow them to move freely during transport and, therefore, should not be used. It is of great importance to use noninvasive techniques for monitoring physiological signals because this allows the acquisition of information about the mice’s condition with the aim to improve it according to the three Rs principle. This may improve the performance that an animal provides for science, further decreasing the number of animals required for research.
We propose the use of noninvasive capacitive sensors to monitor the physiological signals of laboratory mice in order to avoid additional stress. Generally, capacitive sensors are used to measure HR in humans via either direct skin contact or through one and two layers of clothing with no dielectric gel and no grounding electrode [26,27,28] and also to measure BR in humans using a conductive textile-based wearable sensor [29,30]. However, we have not found reports of the use of capacitive sensors for monitoring physiological signals in mice during transport.
This paper presents a new concept for a monitoring system for laboratory mouse transportation that incorporates a matrix of electric potential integrated circuit (EPIC) sensors for recording mouse physiological parameters (HR and BR) and other sensors for recording environmental parameters. We have already evaluated EPIC sensors for noninvasive breathing and heart monitoring in nonrestrained, nonsedated laboratory mice [31]. Here, the design and control strategy for a 4 × 4 matrix of EPIC sensors is presented. The integration of hardware (matrix of EPIC sensors, webcam, visible light and infrared sensors, accelerometer, humidity sensor, buzzer, and circuits for the voltage adaptation of inputs and signals) and software (sensor selection, signal conditioning, and acquisition) in a prototypical transport container is also described. The first experimental results for capturing physiological and environmental parameters are shown and discussed.

2. Materials and Methods

2.1. Legislation about Laboratory Animals Transport

The international legislation on the transport of laboratory animals aims to achieve shipping compliance with the specific laws from each country through which the animals travel. The following documents may be used as reference:
  • EU Directive on the protection of animals during transport;
  • European Convention ETS 193 for the protection of animals during international transport;
  • International Air Transportation Association (IATA) Live Animal Regulations;
  • Guidelines for the Humane Transportation of Animals Research.
Based on information contained in these documents, a short summary of the rules that may affect this research is presented below.
Regulations on the design of container:
  • Adequate ventilation to avoid or minimize the entry of bacteria and viruses.
  • Provide appropriate gripping systems that do not compromise the animal (keeping the box horizontal, for example) or the personnel handling the container.
  • The material of which the container is made must be hard, rigid, and resistant, especially to moisture. For this, specially coated cardboard, fiberglass, aluminum, or more commonly, plastics may be employed. The interior surfaces should be durable and smooth, so that the animal cannot damage or gnaw them.
Regulations on the needs of space:
  • The space specified for each animal must be broad enough to allow the animal a normal posture and to move freely, avoiding claustrophobic feelings that can cause stress, but not so large as to allow the animal to hit the walls hard in any case or crush with other animals.
  • It should also allow sufficient space between the upper part of the body and the top of the container, so that air can circulate freely.
  • The publication “Guidance on the transport of laboratory animals” [32] includes information on the minimum dimensions for different species of rodent, depending on their weight.
Regulations on the environmental conditions:
  • Temperature: Suitable temperature for the transport of rodents may vary between 4 °C and 34 °C but should ideally be kept between 20 °C and 26 °C at all times.
  • Humidity: The acceptable range is between 40% and 70%. Very low humidity can cause respiratory problems and higher humidity favors the development of bacteria and microorganisms.
  • Amount of light: For common animals, the amount of light should be kept as small as possible, always less than 60 lux. Ideally, a 12 h ON and 12 h OFF pattern should be used, including dimmed simulation of sunrise and sunset.
  • Sound: Another major source of stress is the sound level, which must be kept as low as possible. Of course, this is often difficult during transport. Mice have the ability to make sounds between 23 Hz and 85 kHz, while the range for rats is between 250 Hz and 70 kHz. If they suffer stress, rats typically emit sounds at a frequency close to 22 kHz [33].

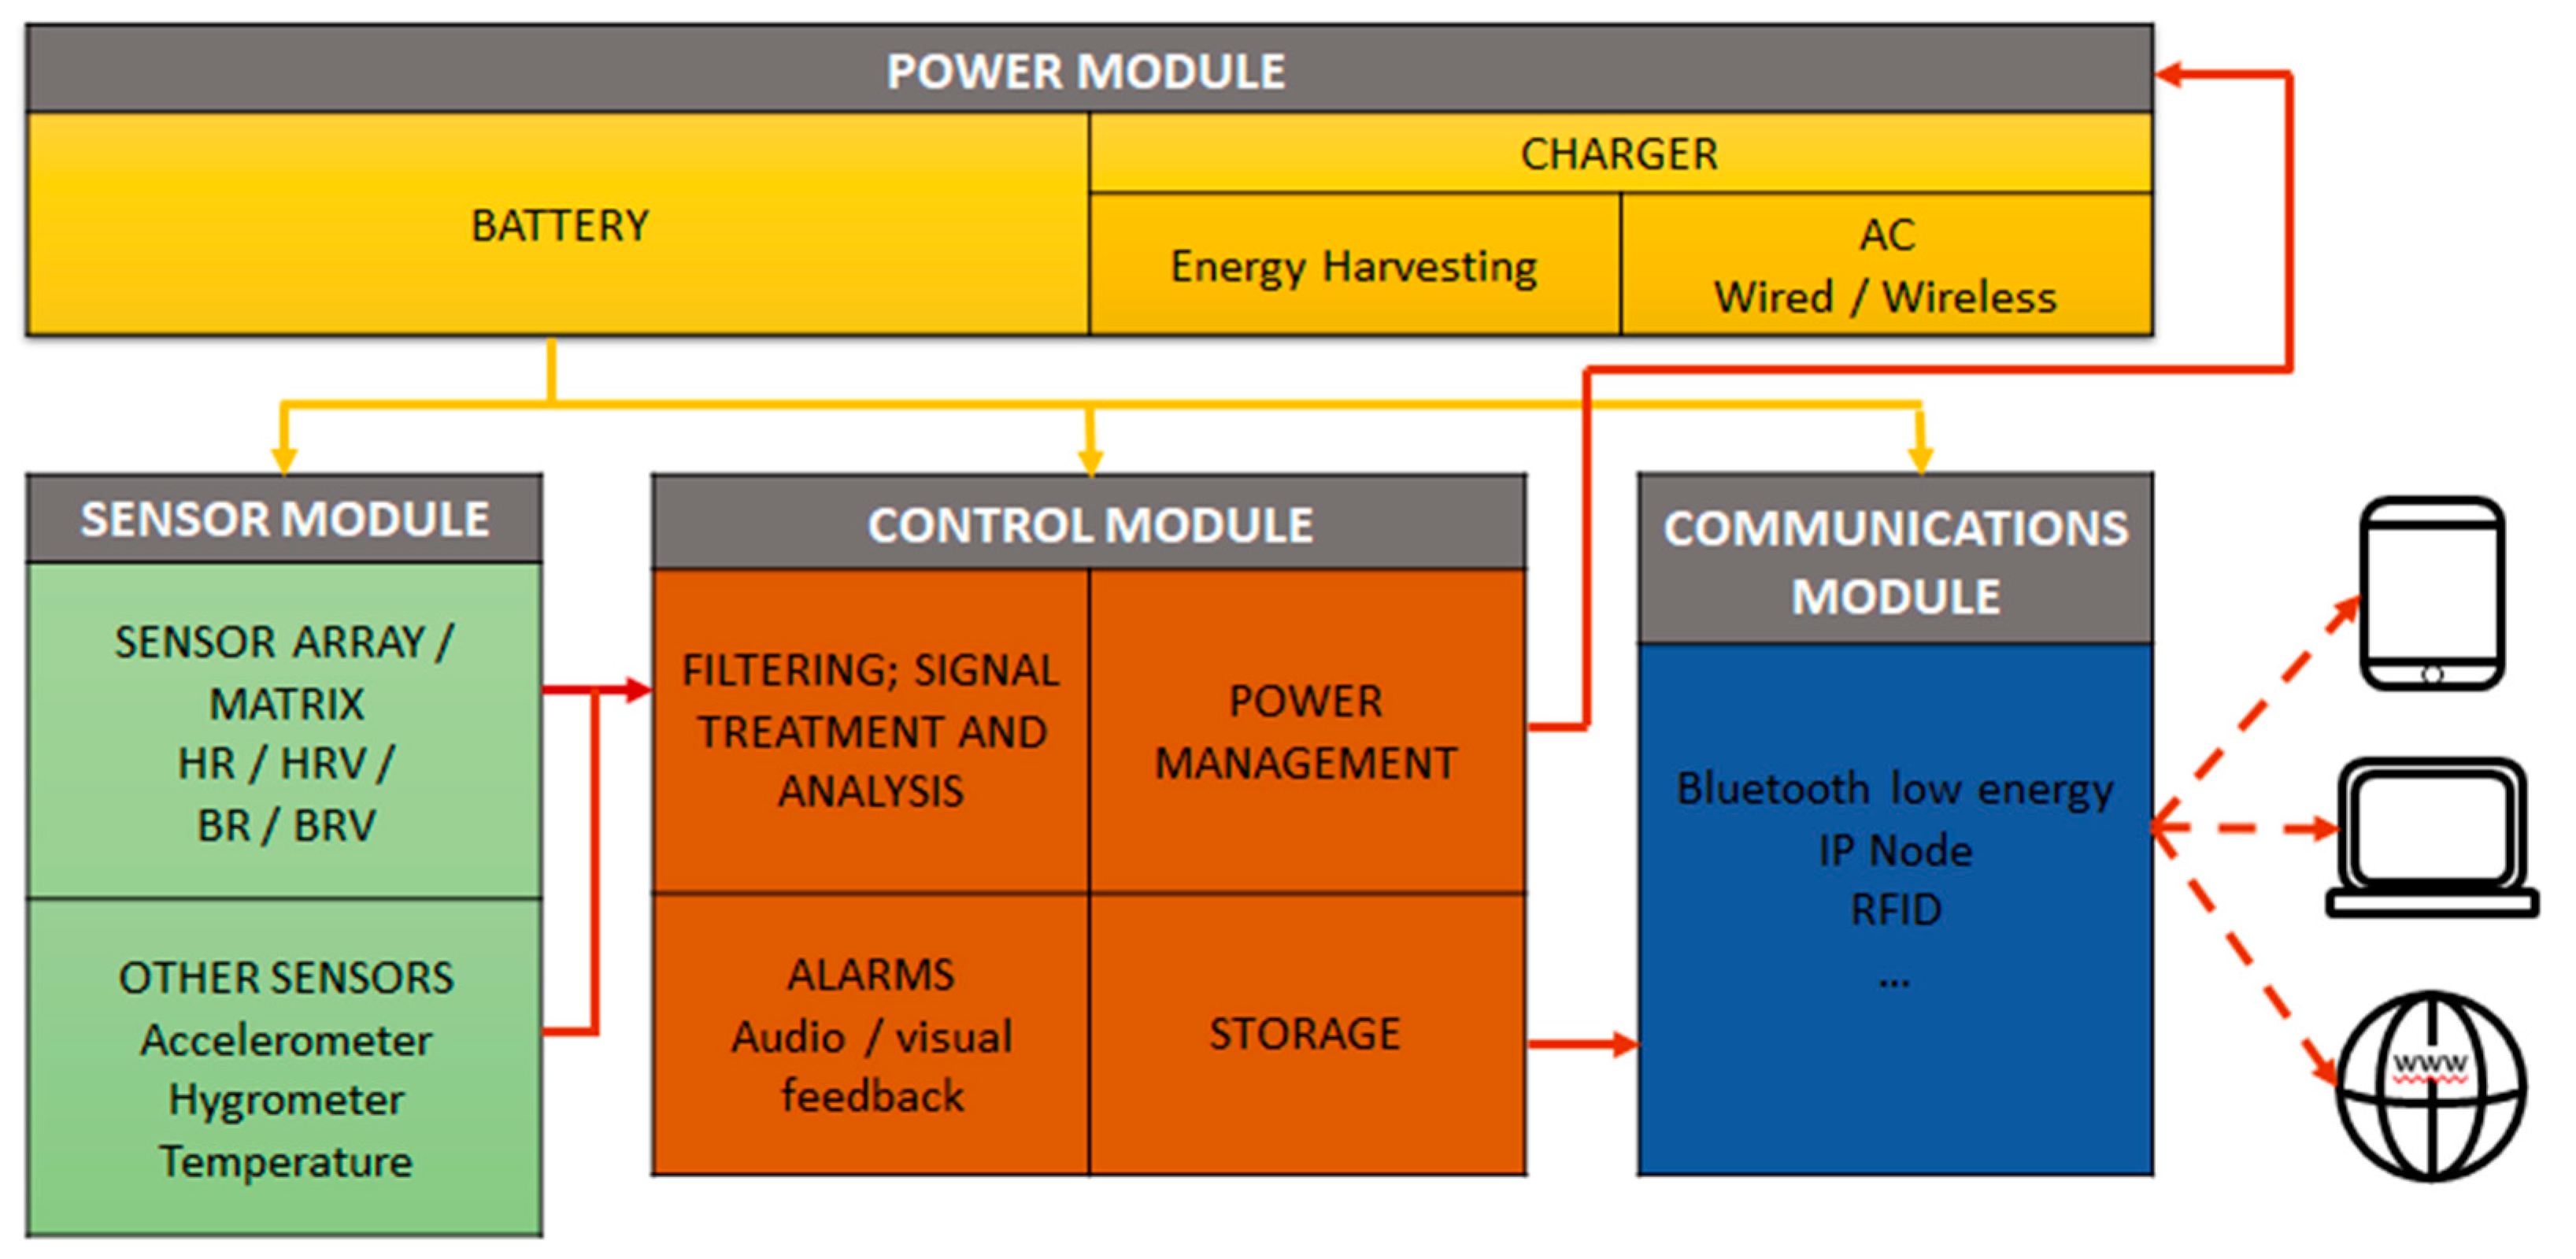
2.2. Design of Monitoring System and Transport Box

In the scientific literature, there are few designs of transport boxes that incorporate sensors to infer the stress level of the animal. A handling device for safely moving wild rats with physical partitions but without sensors is presented in [34]. A simple container, without sensors, consisting of a propylene tube, a high-efficiency particulate aerosol (HEPA) filter, and a rubber glove for transporting small animals to magnetic resonance imaging is described in [35].
The monitoring system for transportation of laboratory mice that we have designed incorporates a matrix of EPIC sensors and environmental sensors. EPIC sensors have the advantage of providing a strong and stable signal that can be captured even through dielectrics, such as plastic storage boxes and materials that form the nest and habitat of the animal (e.g., sawdust, paper, and bark).
There are other physiological or behavioral signals capable of indicating the level of stress of mice: the type and frequency of sounds the mouse makes, the number of times it gets up on its hind legs, or the distance traveled. So, including a camera and/or microphone in the mouse transport box might be interesting for better control. Figure 1 and Figure 2 gather all the information about the monitoring system concept and the transport box design.
The monitoring system must have the following characteristics:
  • Use of a rechargeable battery due to the portability of the system.
  • Capture, storage, and alarm management for the following environmental parameters: Temperature, humidity, movement, light intensity inside the box, and atmospheric pressure. A camera must be included to record the interior of the transport box for visual information about the state of the mice. This could also be used to calculate the position and movement of the mice and assess their level of activity.
  • Detection of the stress level of the mice using the matrix of EPIC sensors including power management as well as signal capture, filtering, and analysis.
  • Acoustical or optical alert for values outside the acceptable range.
  • Wireless access to information: The monitoring system must be able to exchange all data, preferably using WiFi, cellular networks, or RFID. This exchange could take place during transportation or once the transport box has already arrived at the destination, downloading the data to a tablet or similar device.

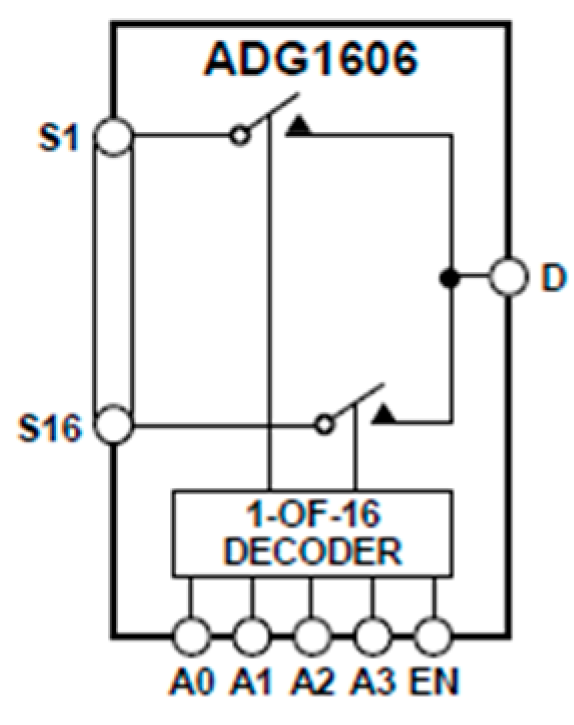
2.3. Matrix of EPIC Sensors for Capturing Physiological Signals in Mice

Our experiments for capturing physiological signals in laboratory mice were developed with C57BL6/J/LDLR−/− strain mice. Animal experiments were approved by the Saarland University Medical Center animal experimentation office (animal protocol 30/2012).
The measurement platform was composed of 16 EPIC sensors arranged in a 4 × 4 matrix. Figure 3a shows the printed circuit board (PCB) designed and built to control the matrix of EPIC sensors shown in Figure 3b. Each EPIC sensor covers an area of 10 × 10 mm.
We used PS25251 EPIC capacitive sensors (Plessey Semiconductors, Plymouth, UK) with the following features: input resistance (20 GΩ), dry-contact capacitive coupling, input capacitance as low as 15 pF, lower −3 dB point typically 200 mHz, and upper −3 dB point typically 10 kHz. It operated with a bipolar power supply from ±2.4 to ±5.5 V. We used the instrumentation amplifier INA128 (Texas Instruments, Dallas, USA) to remove the common mode noise. The captured physiological signals were fed into a first order high-pass filter and amplified with an OPA2131 (Texas Instruments, Dallas, USA), captured by a digital oscilloscope (MDO4104B-6, Tektronix, Beaverton, Oregon, USA), and stored on a PC.
Each EPIC sensor operated properly when the positive pin received a voltage (Vdd) less than 5.5 V, the negative pin a voltage (Vss) greater than −5.5 V, and the GND pin should be connected to 0 V. There are different approaches to control the powering of the EPIC sensor matrix, depending on the way the three power pins of EPIC sensor are connected. The solution we implemented into the self-designed PCB was based on two main components: the 8-bit shift register 74HC595 integrated circuit and the ADG1606 analog multiplexer (Analog Devices, Norwood, USA).
The integrated circuit 74HC595 is a very common shift register, which is capable of controlling up to eight outputs using only three signals: a clock signal, a switch, and the serial input signal. Another advantage is its ability to be daisy chained, that is, to use an output pin to transmit information to the input of a second integrated circuit. This could be connected to a third, and so on, requiring only three inputs for all of the shift registers. Because we needed to control 16 sensors, we used two daisy-chained integrated circuits and three signals for its control.
In order to select the sensors to power, we considered all different possible combinations. There are 16 EPIC sensors with two states (ON/OFF), so the total number of combinations is 216 = 65,536. This can be represented by 2 bytes of information in binary code. Decimal values corresponding to each position in the 4 × 4 matrix are shown in Table 1.
Any number between 0 and 65535 can be expressed as the sum of some of these terms. Its binary value is the 2-byte representation of the 4 × 4 matrix, in which each bit represents a sensor, where 0 = OFF, 1 = ON.
For example, the binary representation of the code “33284” is “1000001000000100” (bit less significant to the right), which activates the sensors (1,3), (3,2), and (4,4). Note that the positions in the binary number are reversed relative to those shown in the table above, since the positions (1,1) (code 1) and (4.4) (code 32768), respectively, correspond to the least and most significant positions.
The next part of our PCB circuit selected two of the outputs of the 16 EPIC sensors using two ADG1606 analog multiplexers (see Figure 4). By making use of four control signals (A0, A1, A2, and A3), we could select 1 of the 16 inputs (S1–S16), which was transmitted to the output D. Therefore, we needed eight signals to select a sensor.
To control both multiplexers, we could make use of eight outputs of the control board directly, but this would not be a very efficient solution. It was more efficient to use another shift register 74HC595, which allowed us to control the eight outputs using only three signals.
We provided a number to each EPIC sensor based on its position in the matrix (see Table 2). Its binary representation corresponded to the value that we provided to the multiplexer control signals to select the corresponding sensor. For example, to select the sensor output (4,2), which is assigned the number 13, the control signals must be 1, 1, 0, 1, respectively. It must be considered that when the selections are inverted, the output signal is also inverted. For example, combinations 11111010 (sensor #15 and #10) and 10101111 (sensor #10 and #15) generate the same signal but inverted. The proposed solution allowed flexible and stable operation using only six inputs for the power control and output selection.
In the last part of the PCB circuit, previously selected signals were carried to the instrumentation amplifier that computed the difference and then amplified the signal.

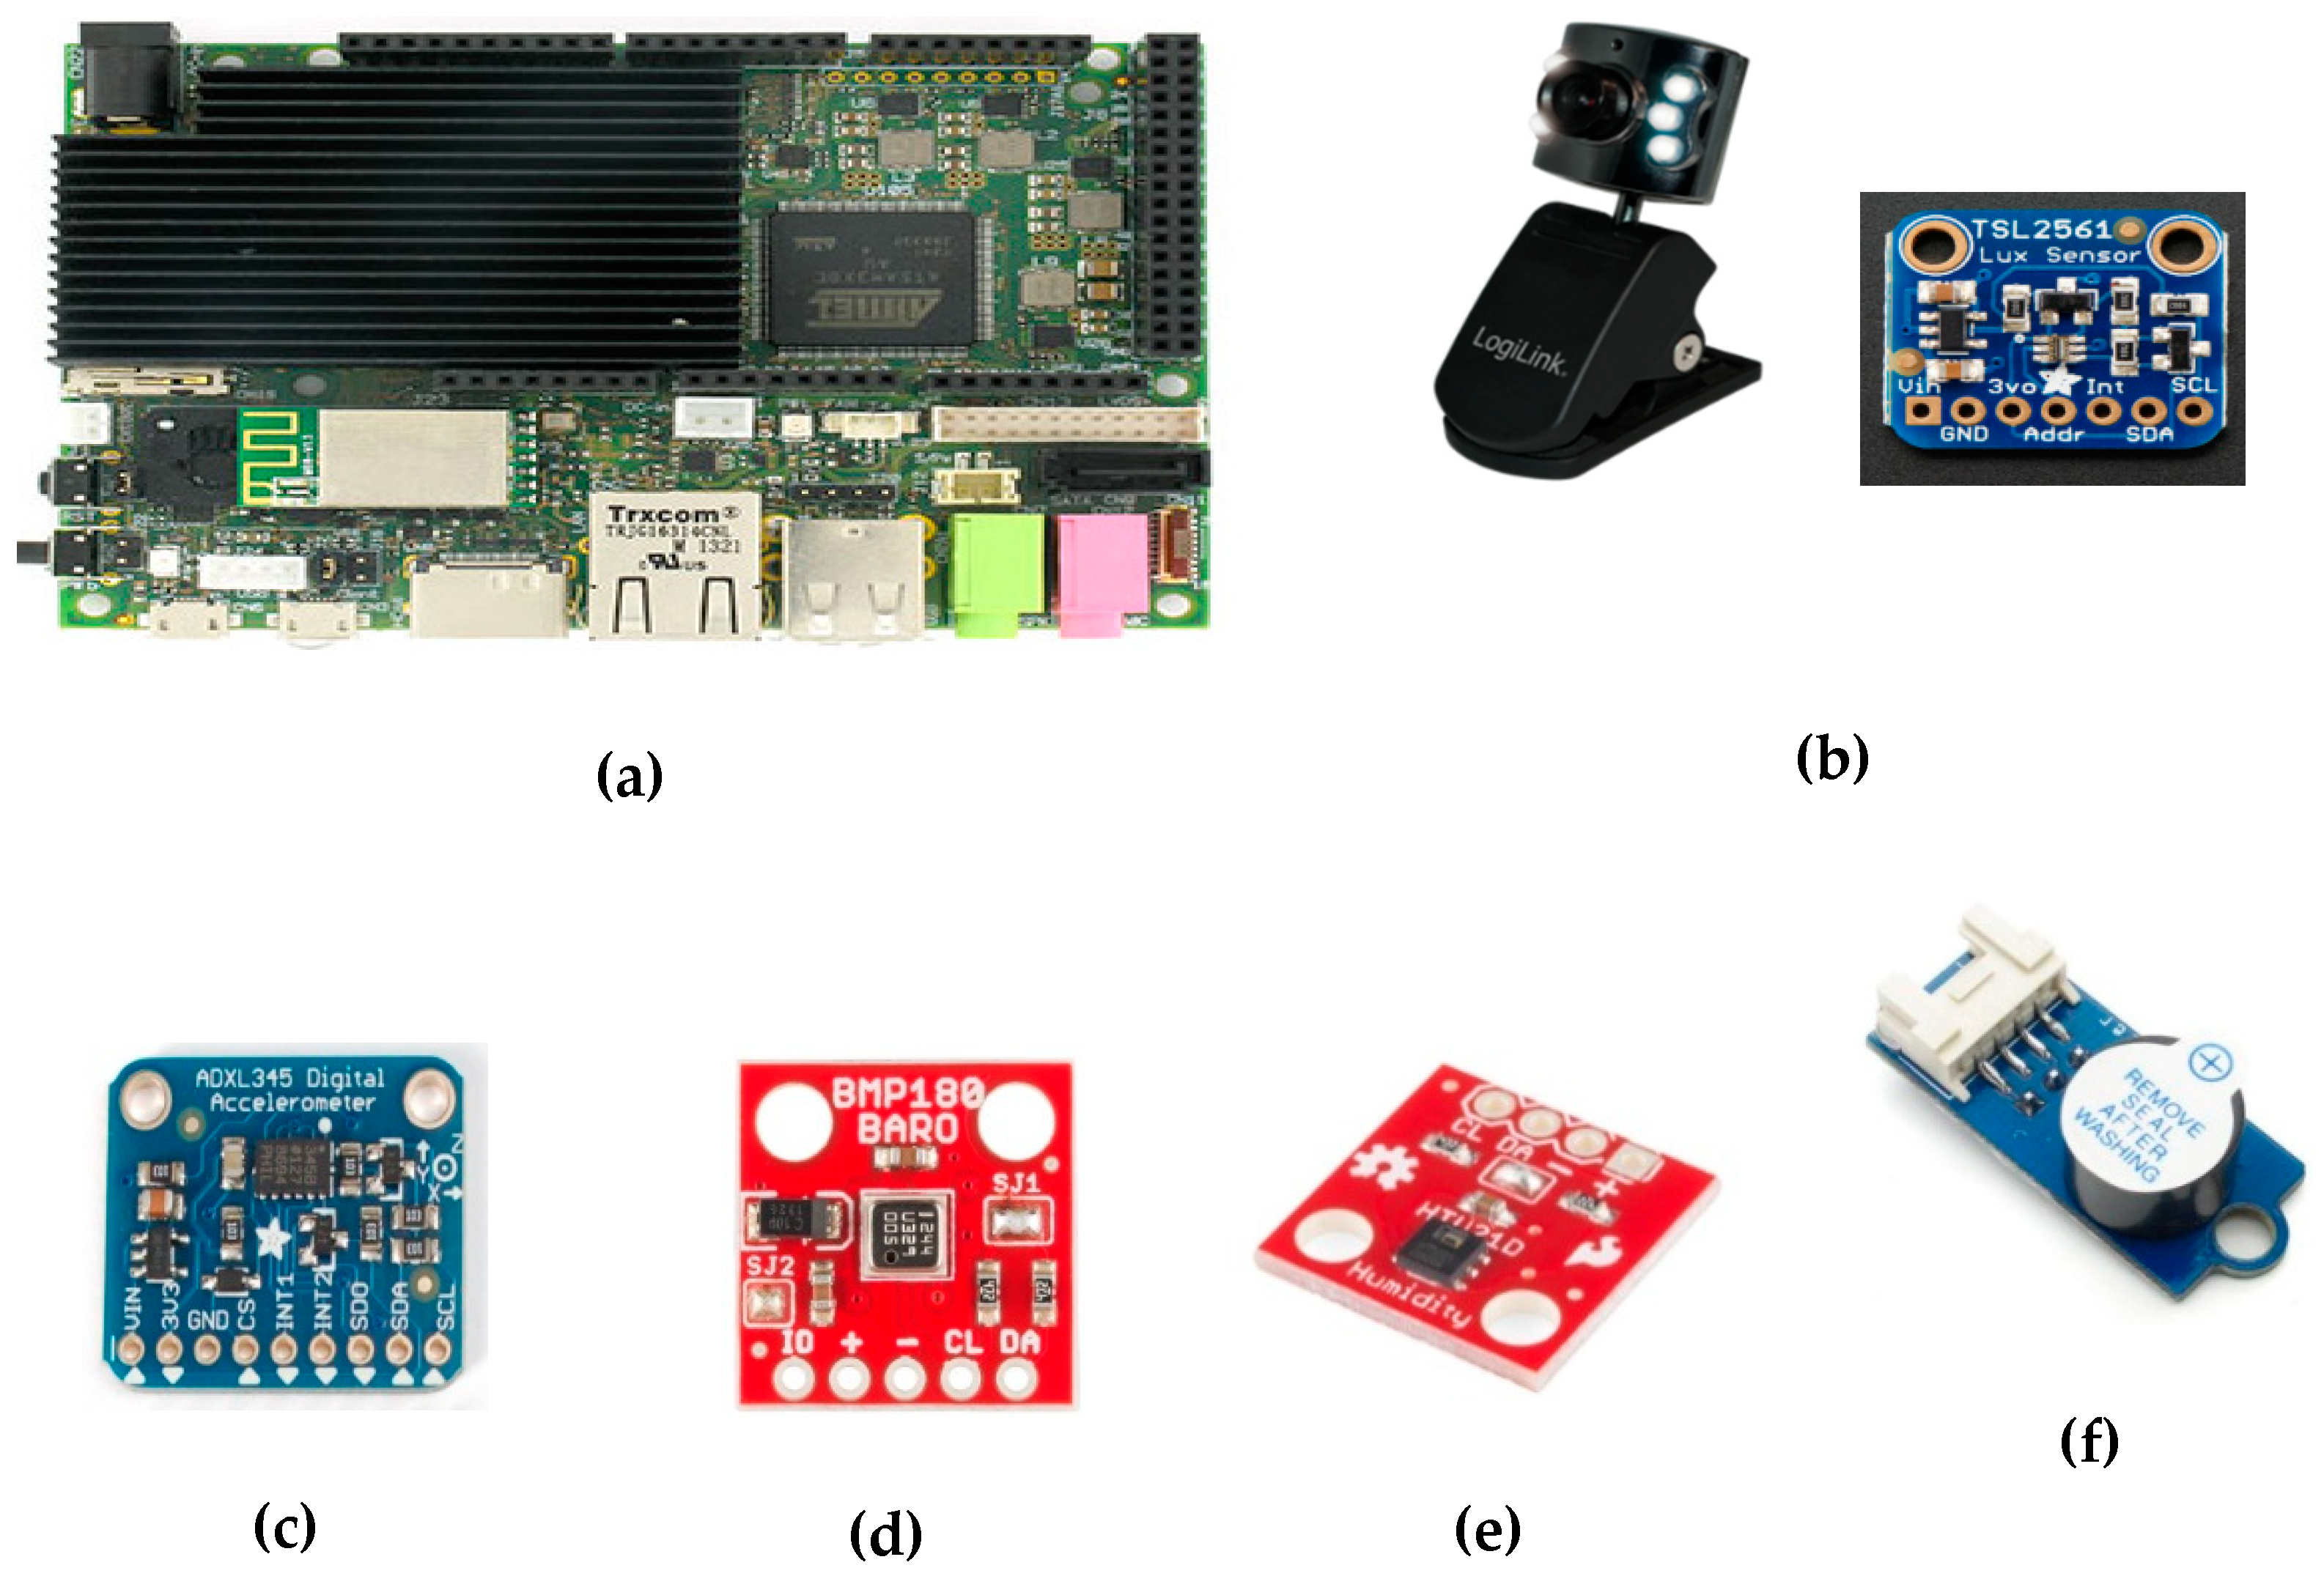
2.4. Selection of Commercial Components and Modules

The central processing unit (CPU) was responsible for carrying out the capture and analysis of the data obtained from the sensors, processing the information, and communicating with the user. For this purpose, the UDOO QUAD board (SECO USA Inc., Burlington, USA) was selected, which is a single board computer that can be equipped with Linux or Android operating systems. This development board had two microprocessors connected by serial communication. The main microprocessor corresponded to the NXP i.MX6 ARM® Cortex®-A9 quad core processor at 1 GHz performance. The second microprocessor was the Atmel SAM3X8E ARM Cortex-M3. This feature made the UDOO board compatible with all libraries developed for Arduino and all those accessories and development tools. The board also included a 1 Gb DDR3 RAM, a WiFi module, four USB ports (one of them OTG), an HDMI (touch-enabled), RJ45 Ethernet, analog input and output audio camera (CSI), hard disk (SATA) connectors, and an SD card connector that acted as a startup disk.
A circuit was developed to generate the appropriate voltage to power the CPU board that switched the EPIC sensors ON/OFF and acquired the signal. This circuit worked with two voltages: positive (Vdd, +5 V) and negative (Vss, −5 V), along with a reference (GND). We used a 9-V battery connected to a voltage regulator (Maxim MAX764), which regulated the output over a wide range of load currents and reduced power, capable of delivering up to 1.5 W, simultaneously. We decided to use commercially available sensors for the prototyping process of the transport box. Figure 5 shows the CPU board and the selected environmental sensors. The following sensors have been used:
  • Webcam—Logilink UA0072: For capturing images and video inside the transport box, we included a webcam featuring: 0.3 Megapixels, CMOS sensor (640 × 480), F14mm lenses, 54° angle, automatic exposure and brightness adjustments, USB 2.0 connection, refresh rate of 30 frames per second, and 24-bit color depth. In order to use infrared light, which does not interfere with mice since they are not sensitive to it, we removed the IR camera filter and replaced the integrated white power LEDs with 10 infrared ones.
  • Visible light and infrared sensor—TAOS TSL2561: This sensor is able to convert a light intensity to a digital output of up to 16 bits of precision. It counts with two photodiodes, one for visible radiation and other for infrared radiation. It also has automatic ripple filtering at 50 or 60 Hz and supports I2C communication.
  • Digital accelerometer—Analog Devices ADXL345: This small, very low power consumption accelerometer (0.1 μA in standby mode and 40 μA during measurement) is able to measure acceleration in three axes with at least 10 and up to 13 bits of precision. The measurement range is user adjustable and varies from ± 2 to ± 16 g. It allows to use serial peripheral interface (SPI) and I2C communication protocol.
  • Barometric pressure sensor—Bosch BMP180: Based on piezoresistive technology, this sensor offers high accuracy, linearity, and long-term stability. It includes a temperature sensor to correct the pressure value, having a resolution of up to 0.01 hPa for pressure and up to 0.1 °C for temperature. This sensor is capable of providing up to 128 measurements per second.
  • Humidity sensor—TE Connectivity HTU21: This low-cost sensor is able to measure temperature in the −40 to 125 °C range and the relative humidity on a scale from 0% to 100%. Its accuracy is 0.04% for relative humidity (12 bits) and 0.01 °C (14 bits) for temperature.
  • Buzzer: To implement sound alarms, a small piezoelectric buzzer was included. Its resonant frequency is 3 kHz, but using pulse width modulation (PWM), the pitch can be changed.
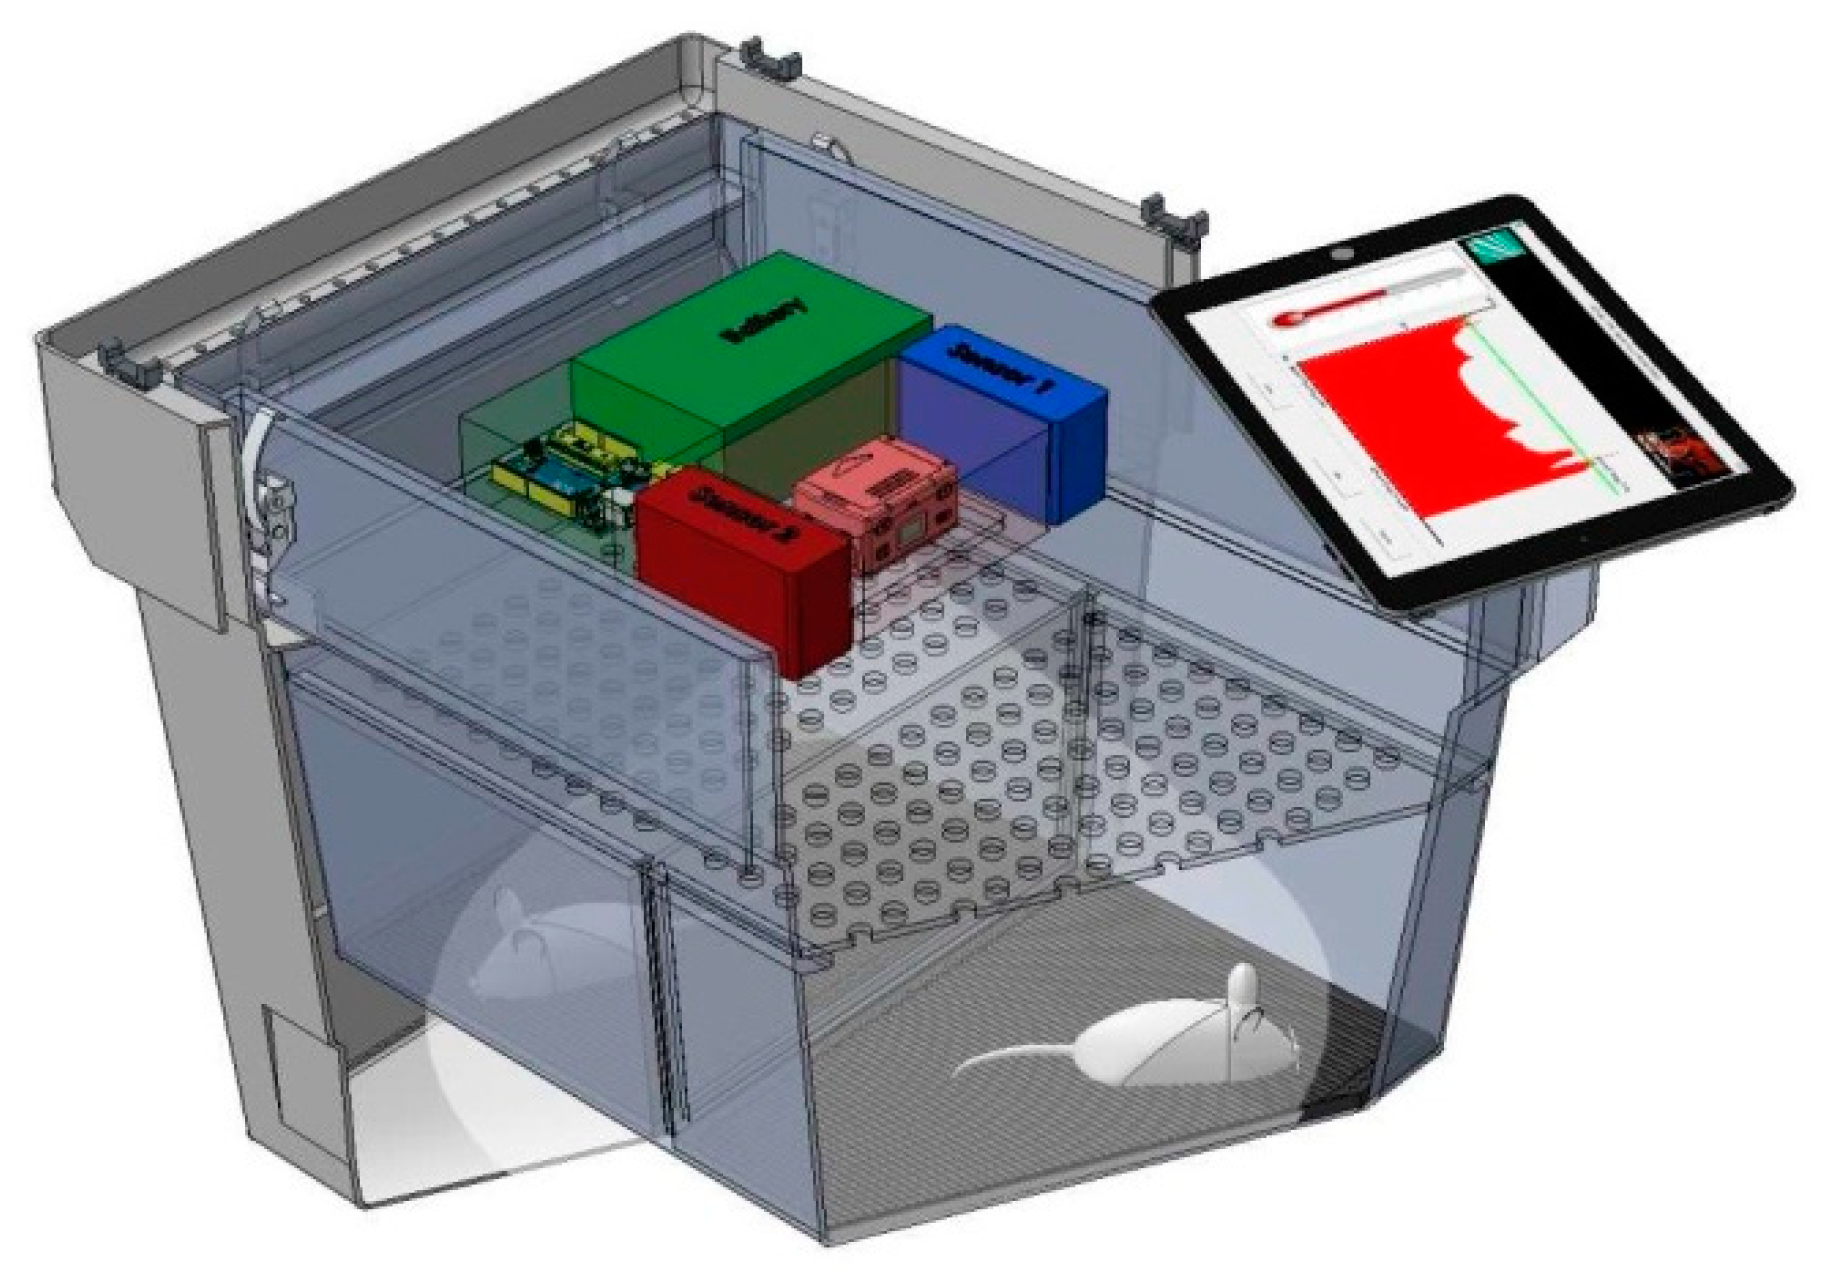
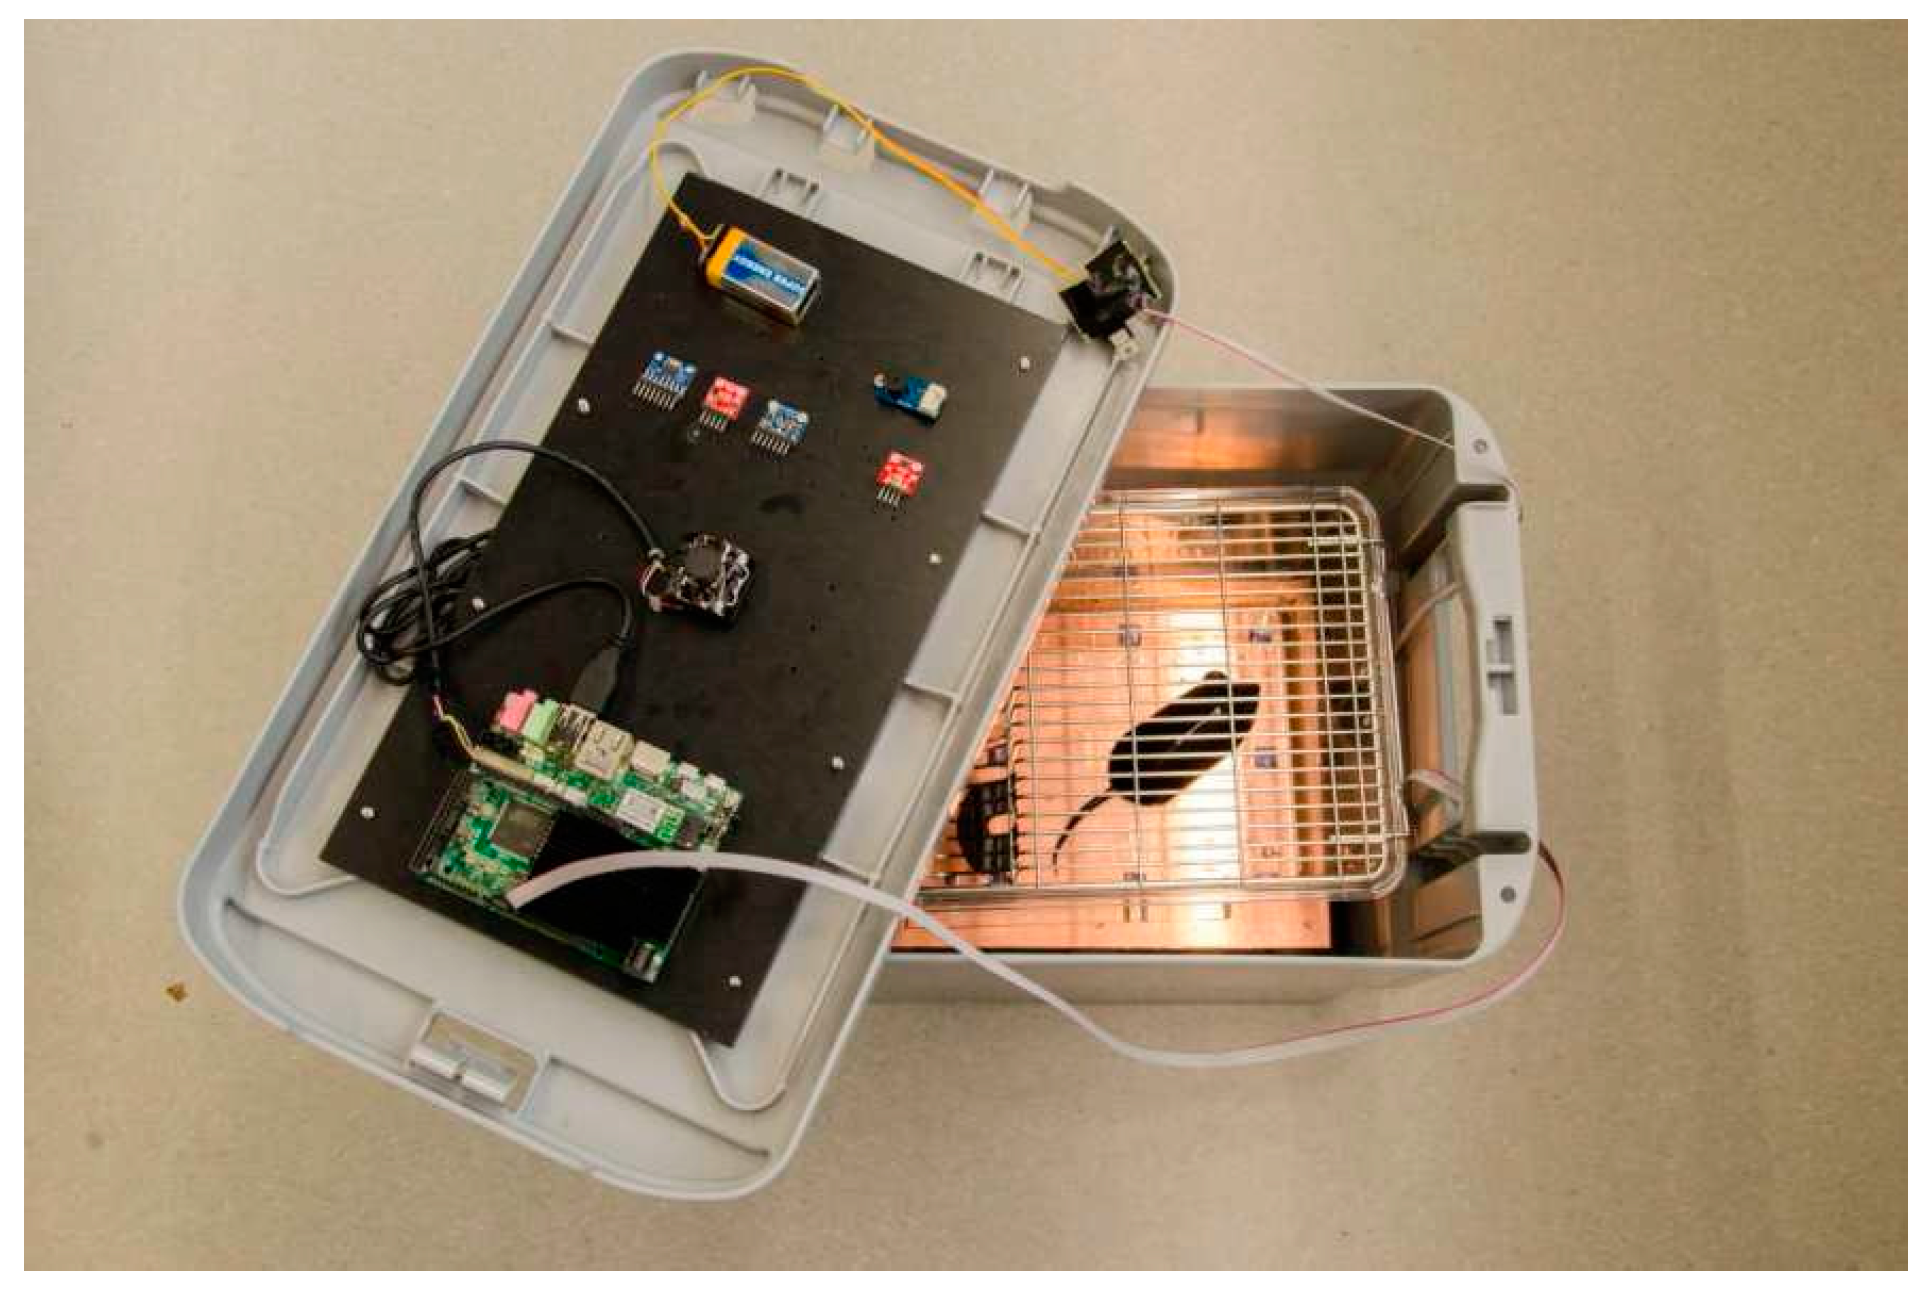
3. Results

A standard mail transport box with cover, purchased from Deutsche Post, was selected as the container for the system integration. The transport box weighed 1.6 kg, its outer dimensions were 47 × 26.7 × 28 cm, and its volume was 25 L. It was made of impact-resistant and antibreakage material. Figure 6 shows the functional transport box with the integrated monitoring system. It included two platforms:
  • A lower platform was fixed to the bottom of the transport box and served as support for the cage where animals were housed during transport. It also contained the 4 × 4 matrix of EPIC sensors.
  • An upper platform was fixed at the bottom of the box cover. It included the CPU board and the environmental sensors.

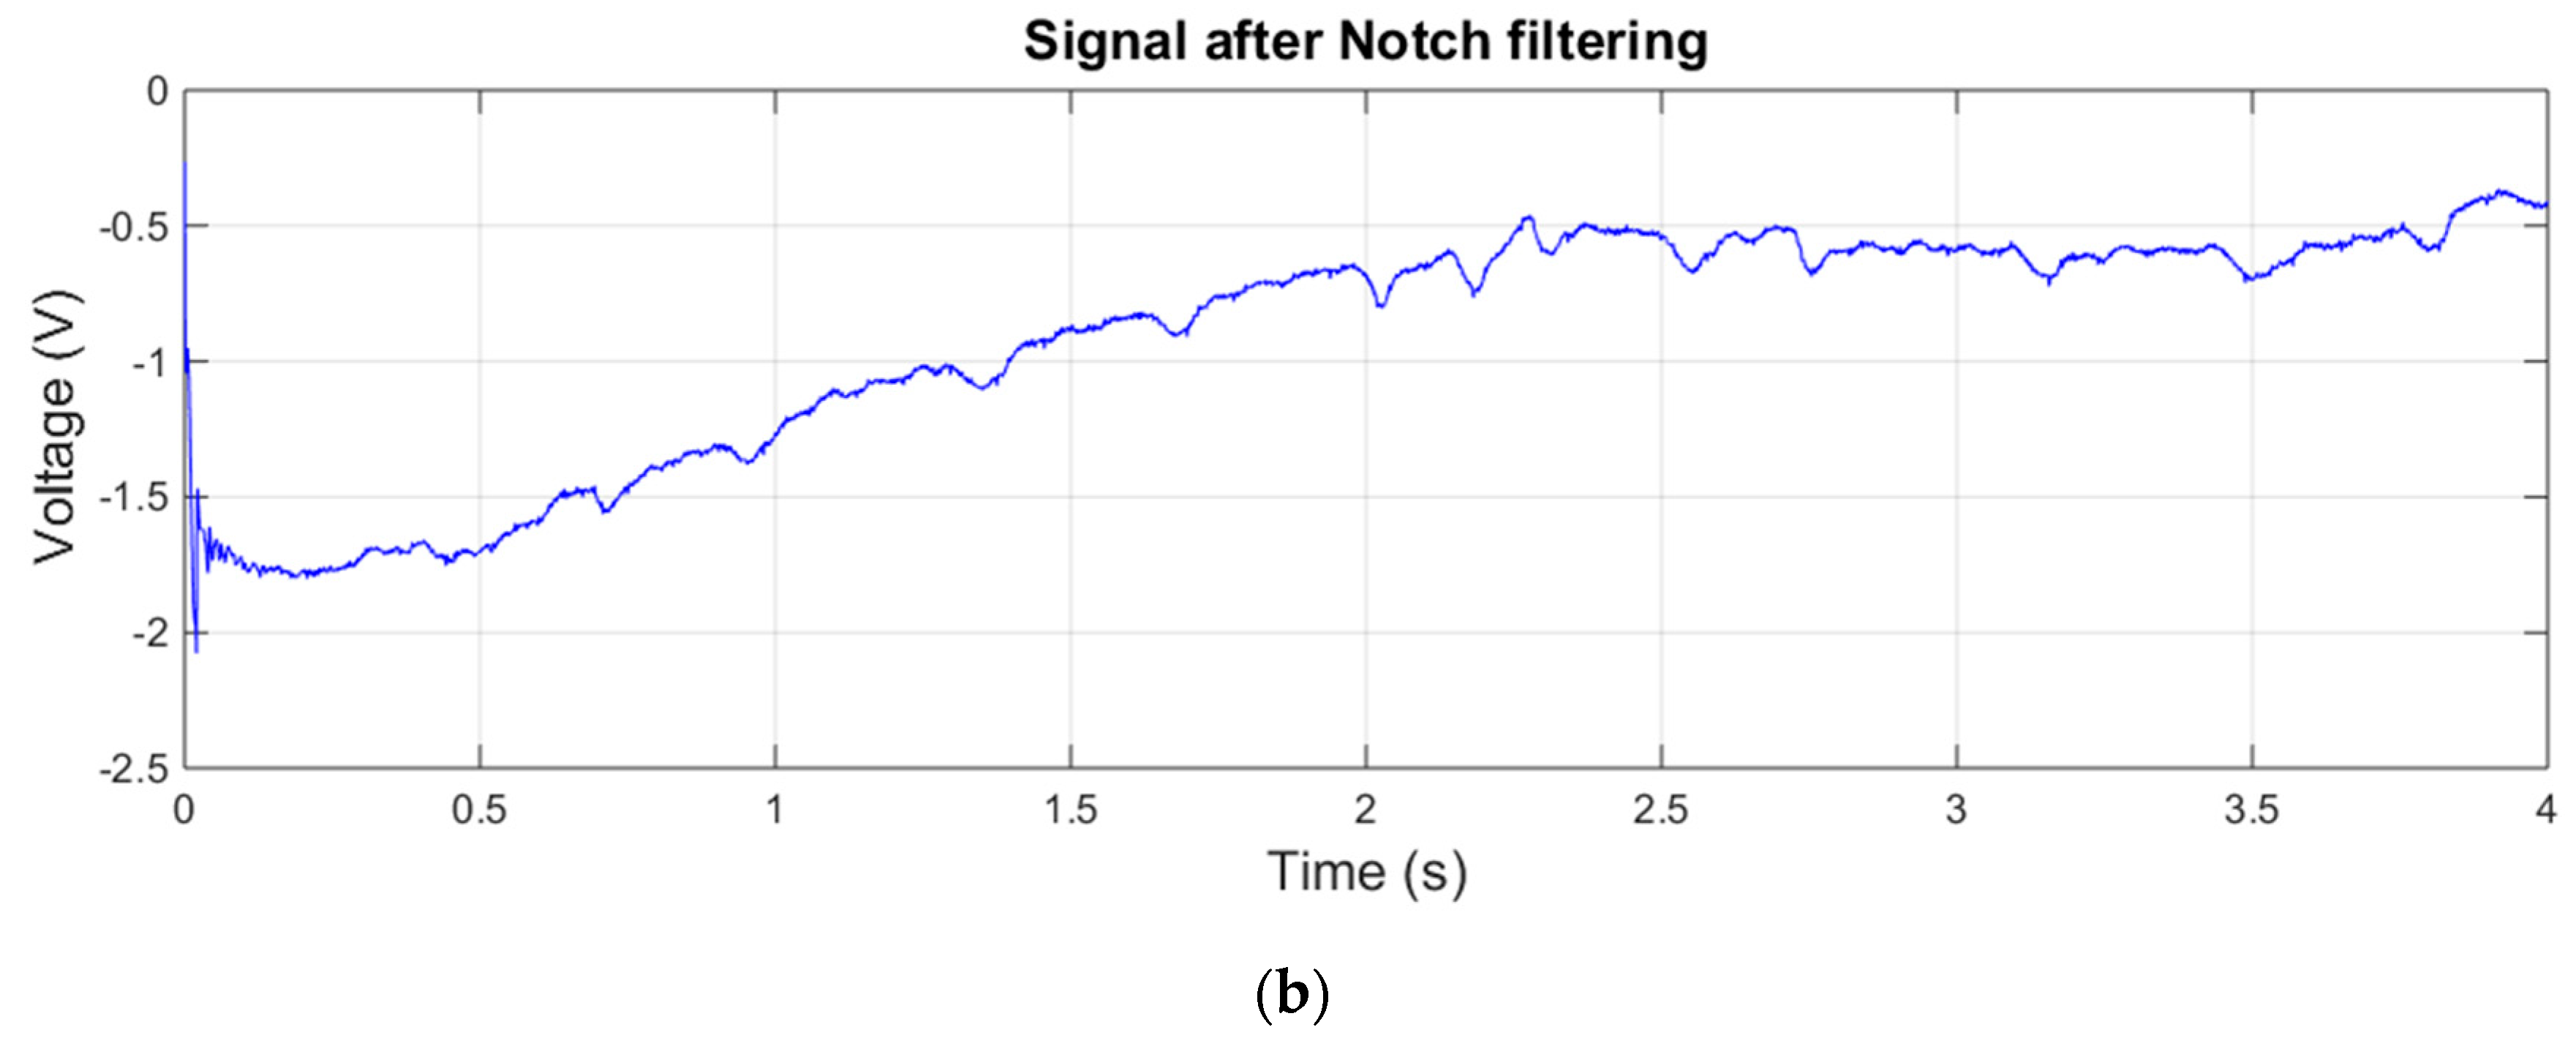
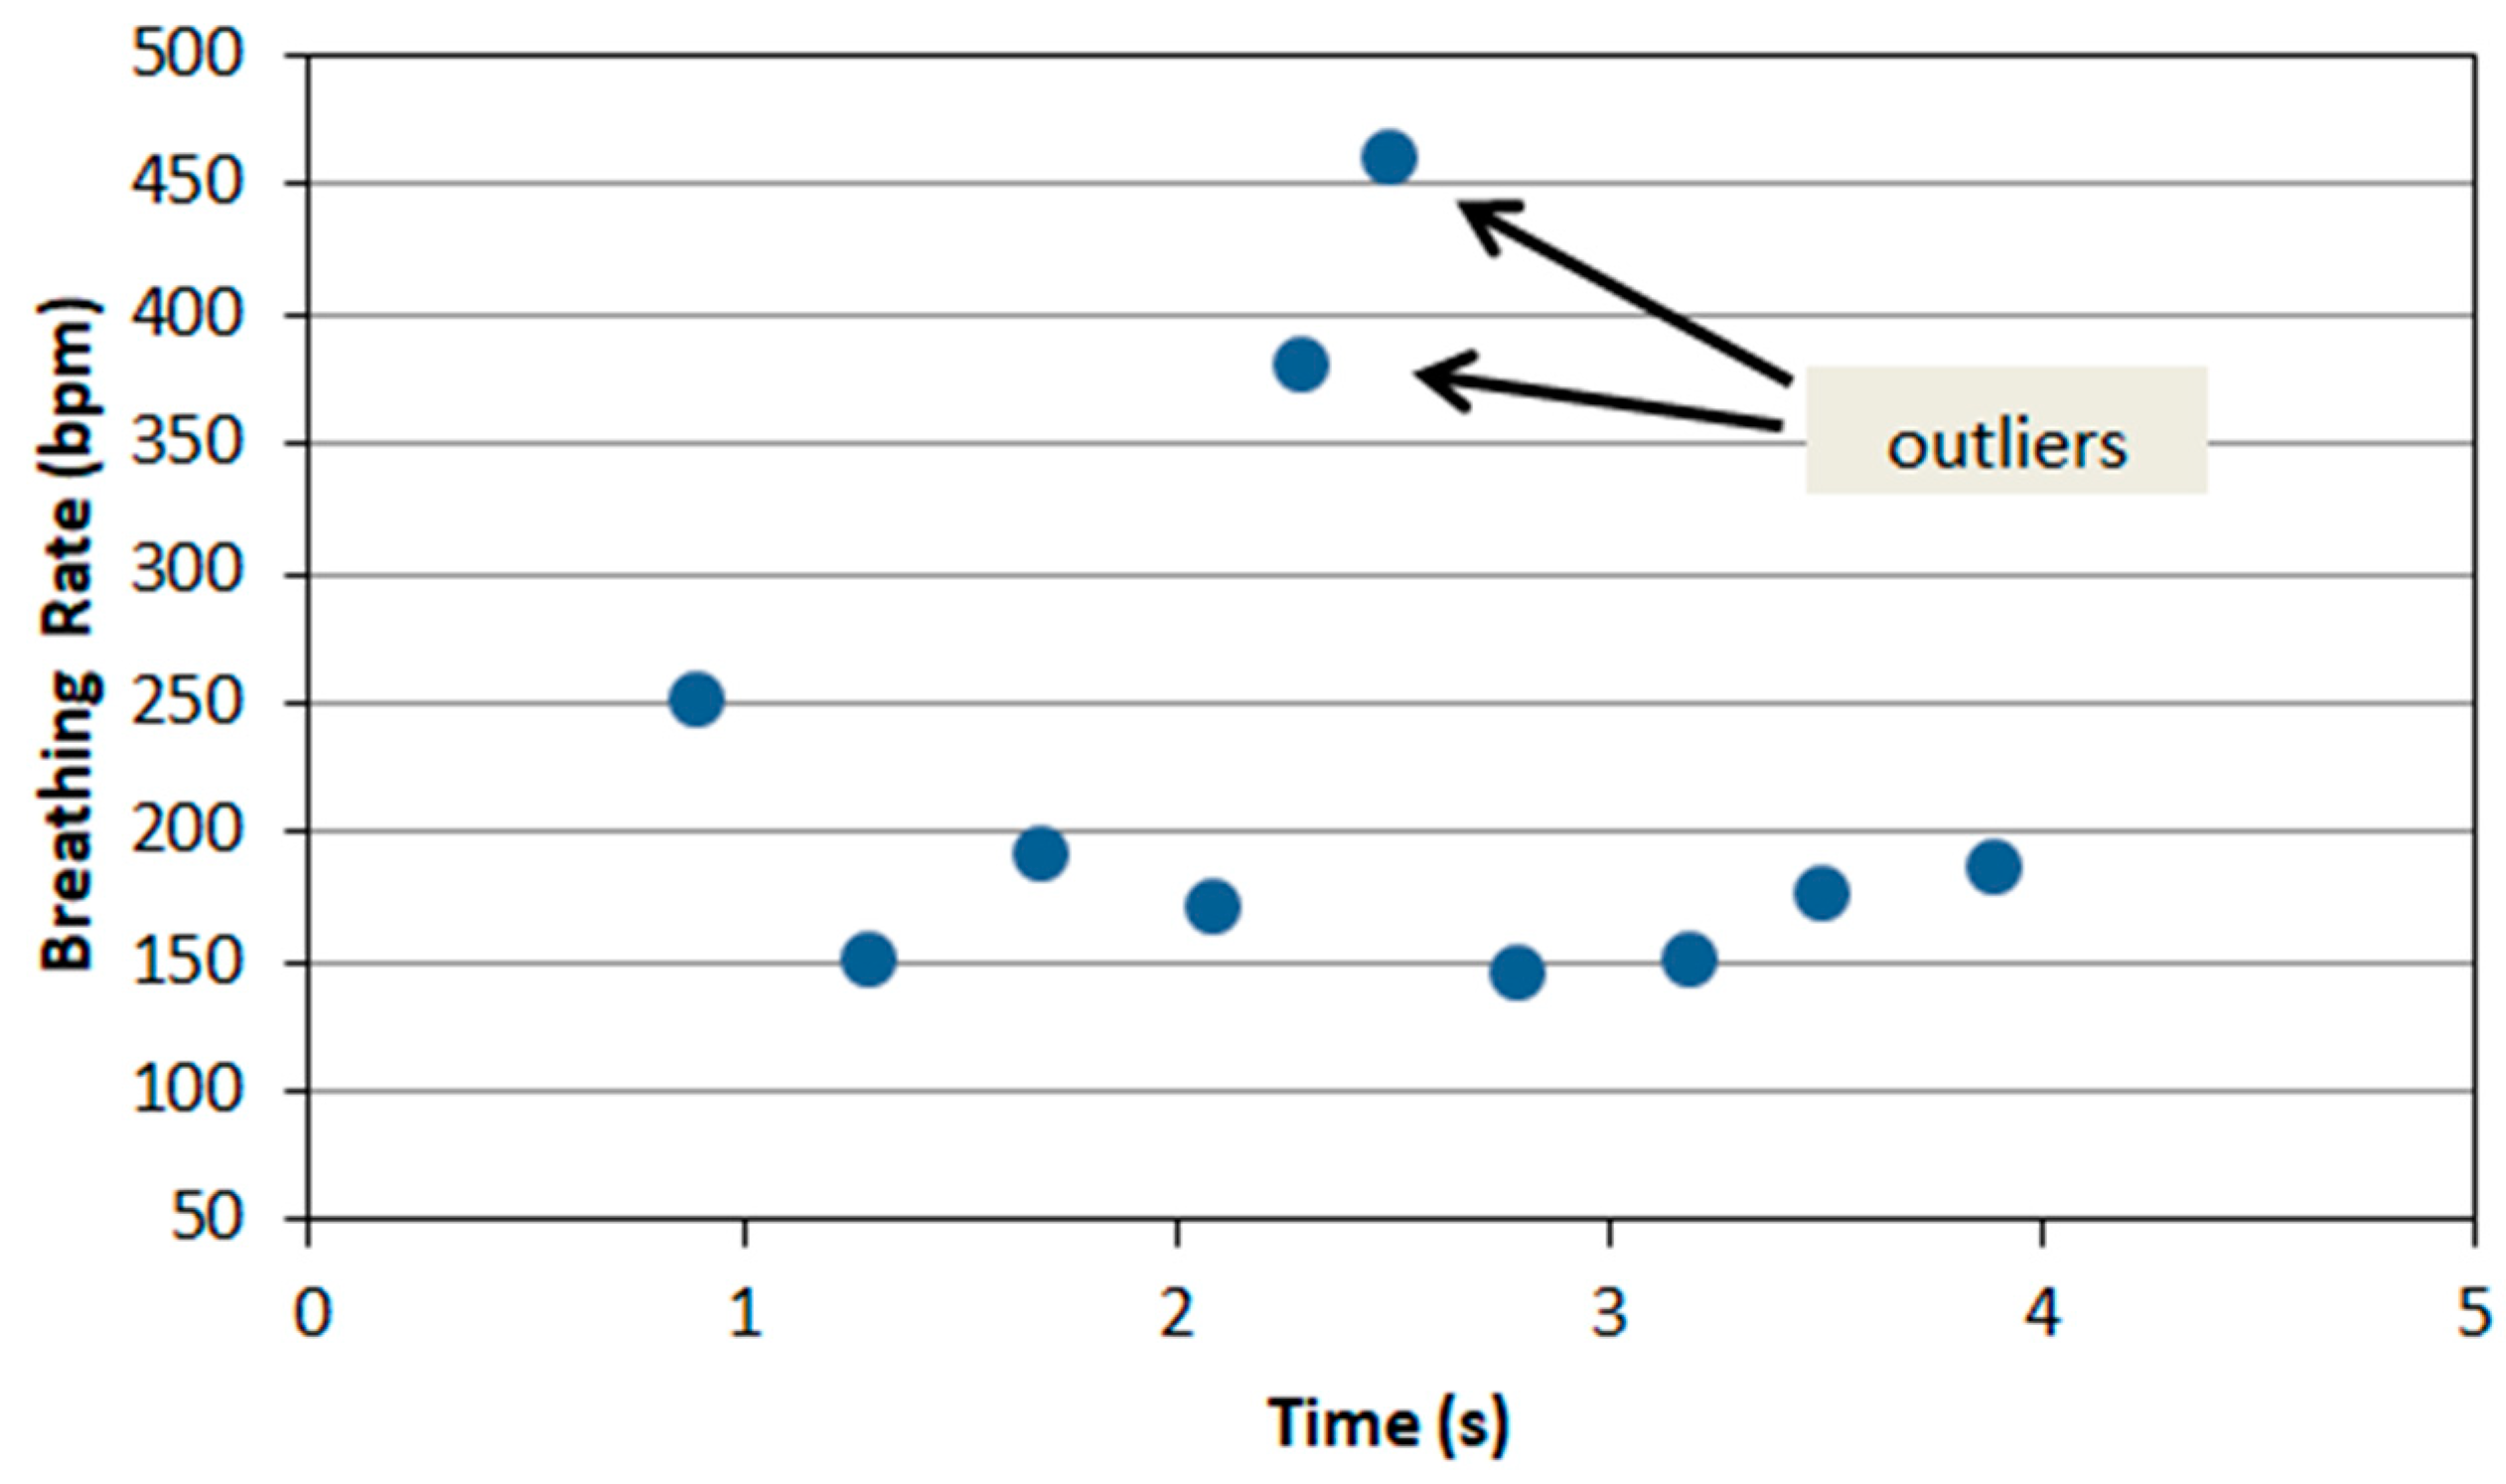
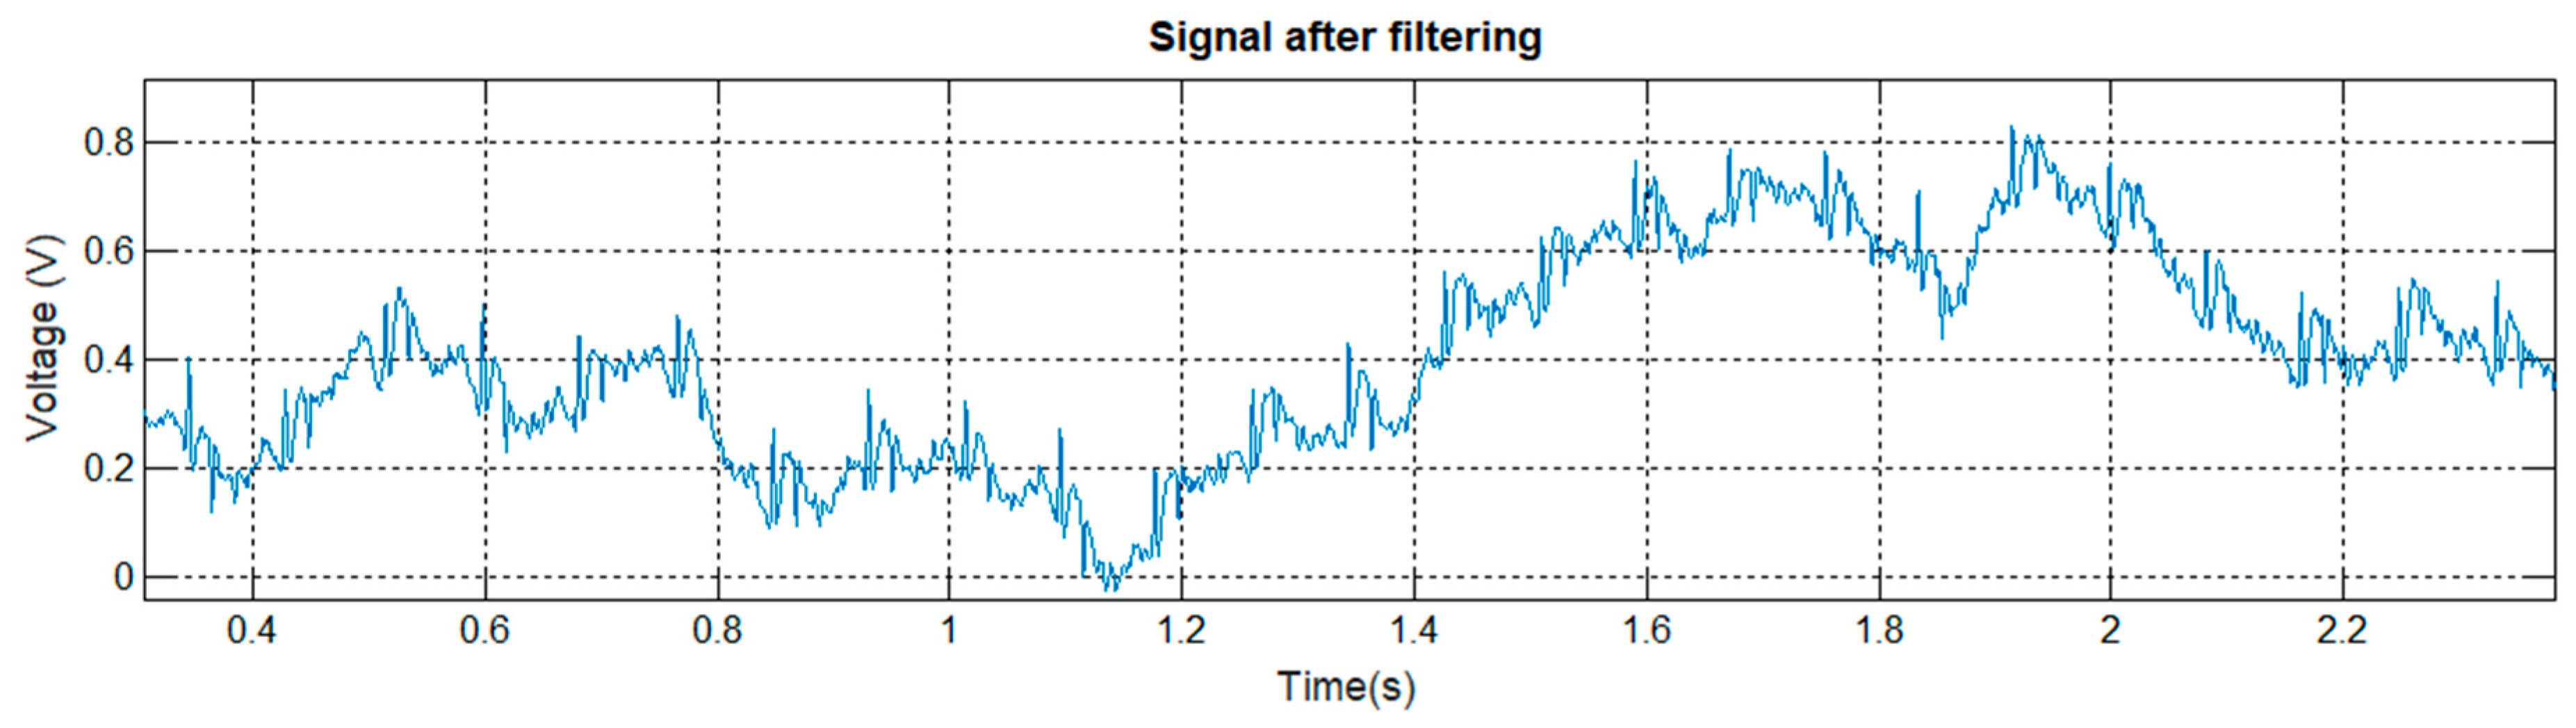
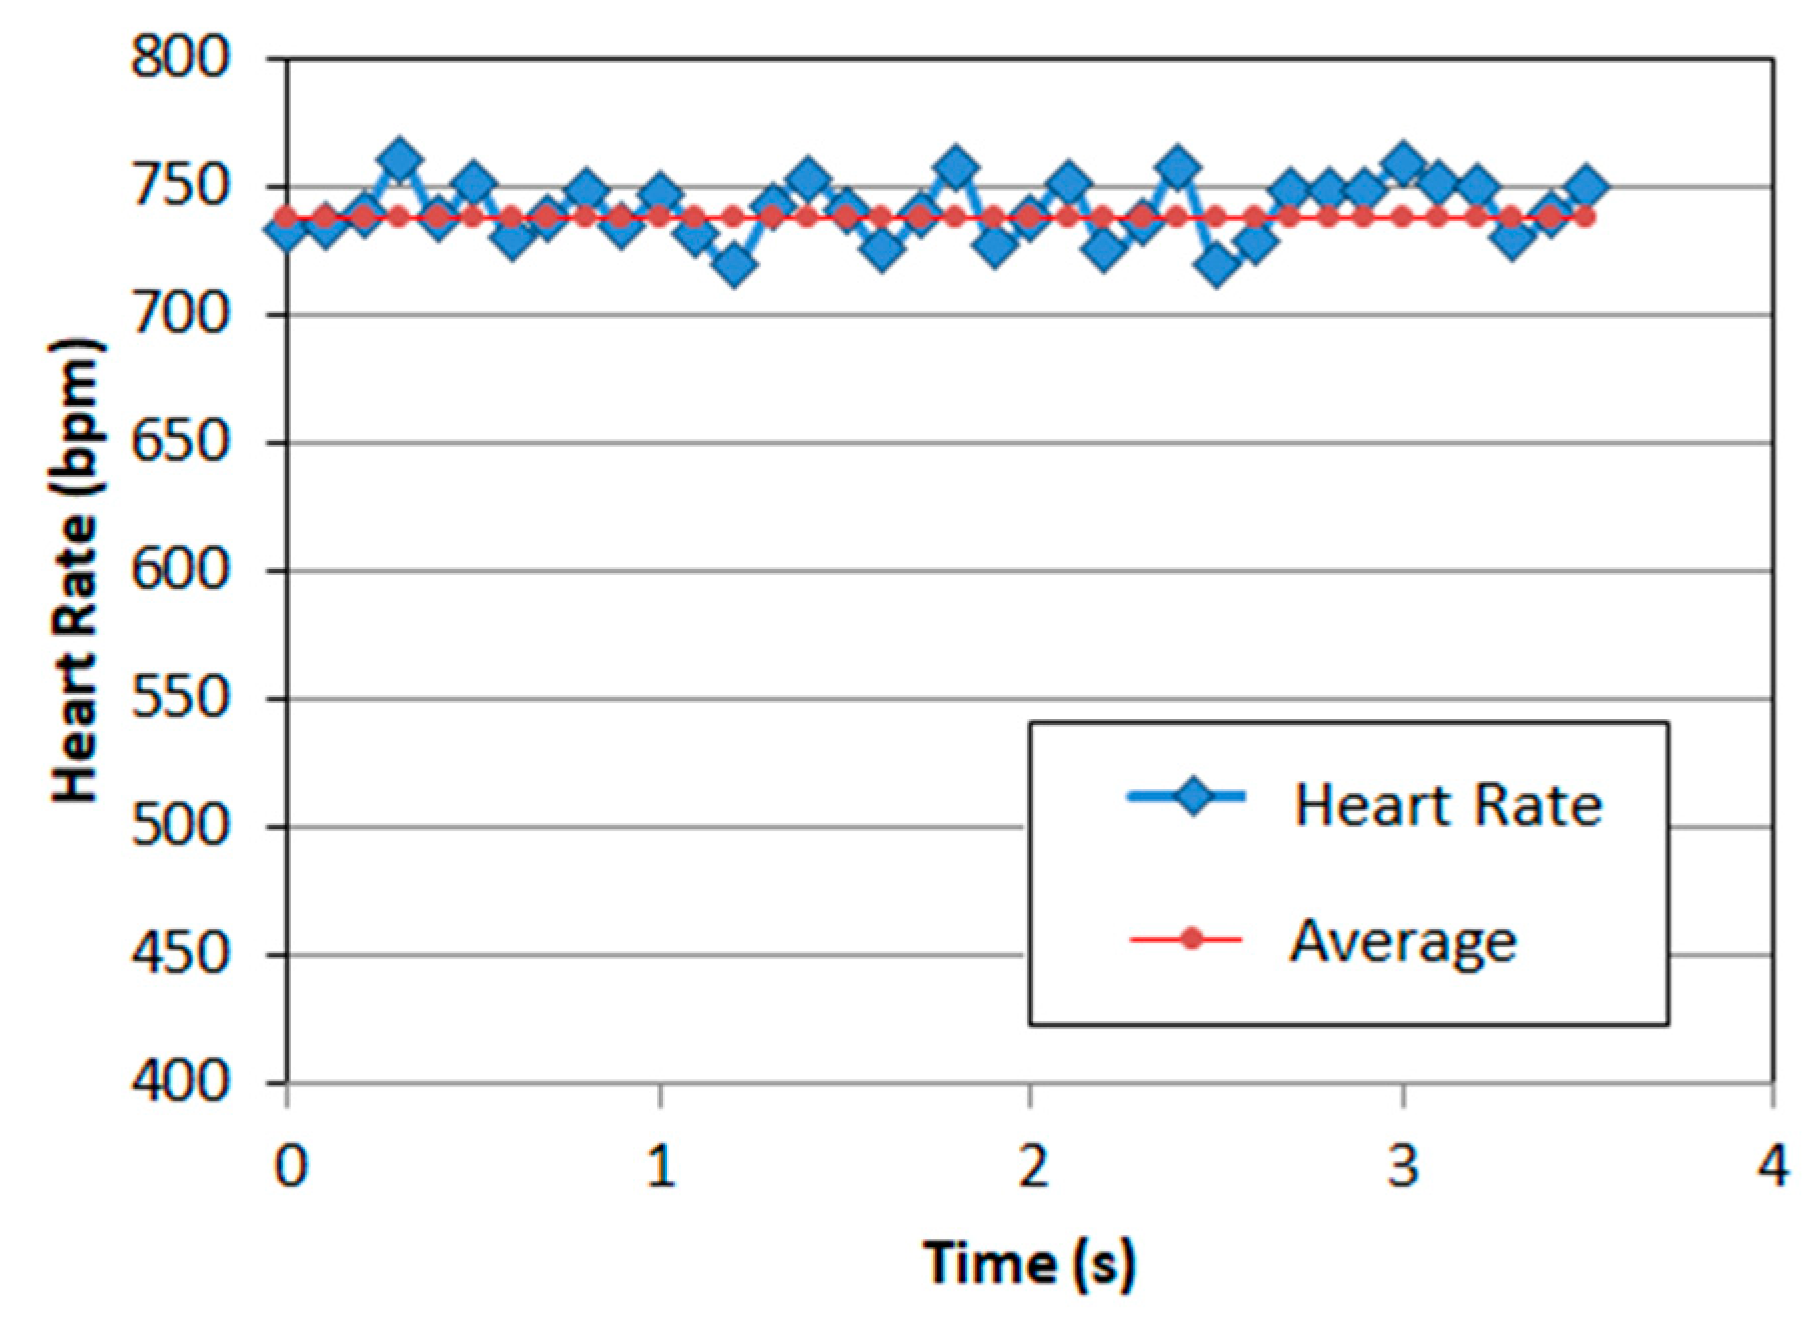
3.1. Measurements with Matrix of EPIC Sensors

This section shows exemplary results to validate the use of the EPIC sensor matrix. We used MATLAB software (version R2014b) to implement algorithms to improve the quality of the captured physiological signals in order to calculate HR and BR. We implemented a notch filter to remove 50 Hz noise (and its multiples) and a low-pass filter. This was followed by a polynomial spline fit and subtraction from the original signal. If the signal was still noisy, we used a fifth-order polynomial Savitzky–Golay filter or generalized moving average to smooth it. Time and frequency domain plots were generated after each one of these filters.
Figure 7a shows an exemplary result for a captured raw physiological signal while the mouse had one limb in contact with an EPIC sensor. Figure 7b shows the result after notch filtering the raw signal.
There is a slight variation in the signal of Figure 7b, the rhythm of which, given its frequency, may suggest a mouse respiratory signal. By eliminating the variation of the midline and filtering the signal using a low-pass filter (first-order cutoff frequency 80 Hz), we obtained a lower-frequency signal that could be the breathing rate of the mouse. In order to confirm this hypothesis, we proceeded to calculate its estimated breathing rate, which is displayed in Figure 8.
The normal breathing rate in relaxed mice usually ranges from 80 to 230 breaths per minute. Figure 8 shows that most of the points were in the range of 160–180 breaths per minute, but there were two points the frequency of which was much higher (outliers). This might have been produced by the mouse sniffing or moving.
Figure 9 shows an exemplary result for a filtered physiological signal while the mouse placed two paws on two different EPIC sensors. In this case, we obtained the cardiac component of the signal.
The signal quality was not excellent, but it allowed us to find a pattern similar to that of an ECG signal: QRS complex (combination of the Q, R, and S waves) and T wave.
Processing the signal shown in Figure 9, the instantaneous heart rate could be calculated from the time elapsed between any two consecutive events. The drawback of this method is that the calculated value may differ from the measured value due to variations in heart rate associated with breathing (known as respiratory sinus arrhythmia). Applying this method, we obtained the result shown in Figure 10, which shows a very regular pattern with an average value of 738 beats per minute. The typical heart rate in mice ranges from 310 to 840 beats per minute.
The methods and procedures to obtain the heart rate and breathing rate are described and discussed in detail in [31].
These results prove that the designed matrix of EPIC sensors can monitor HR. However, there are drawbacks of this methodology: First, the possibility of an animal correctly placing two paws on the sensors is small, even when minimizing the spacing between them, and difficult to capture properly. Second, cardiac signals have a small amplitude, which complicates their filtering and processing process. Furthermore, the correct identification of these cardiac signals is a challenging task to be automated.
Given these circumstances, and due to the more reliable way of measuring the respiratory signal (higher amplitude, simplicity, and easier detection), this was our physiological signal of choice that was used to infer the stress level of mice inside the transport box.

3.2. Software for Monitoring and Control of the Transport Box

We based the software development on openHAB open source software (openHAB Foundation e.V., Germany) that is aimed at home automation applications and the Internet of Things. openHAB offers the ability to create powerful user interfaces and easily add rules and event-based automatic control, with an emphasis on portability and integration with various systems and devices. The software is ready to run on Windows and Linux operating systems. We used a Linux platform on the CPU board and developed several sections:
  • “Items” section: It includes type, name, and appearance of the parameters displayed in the user interface.
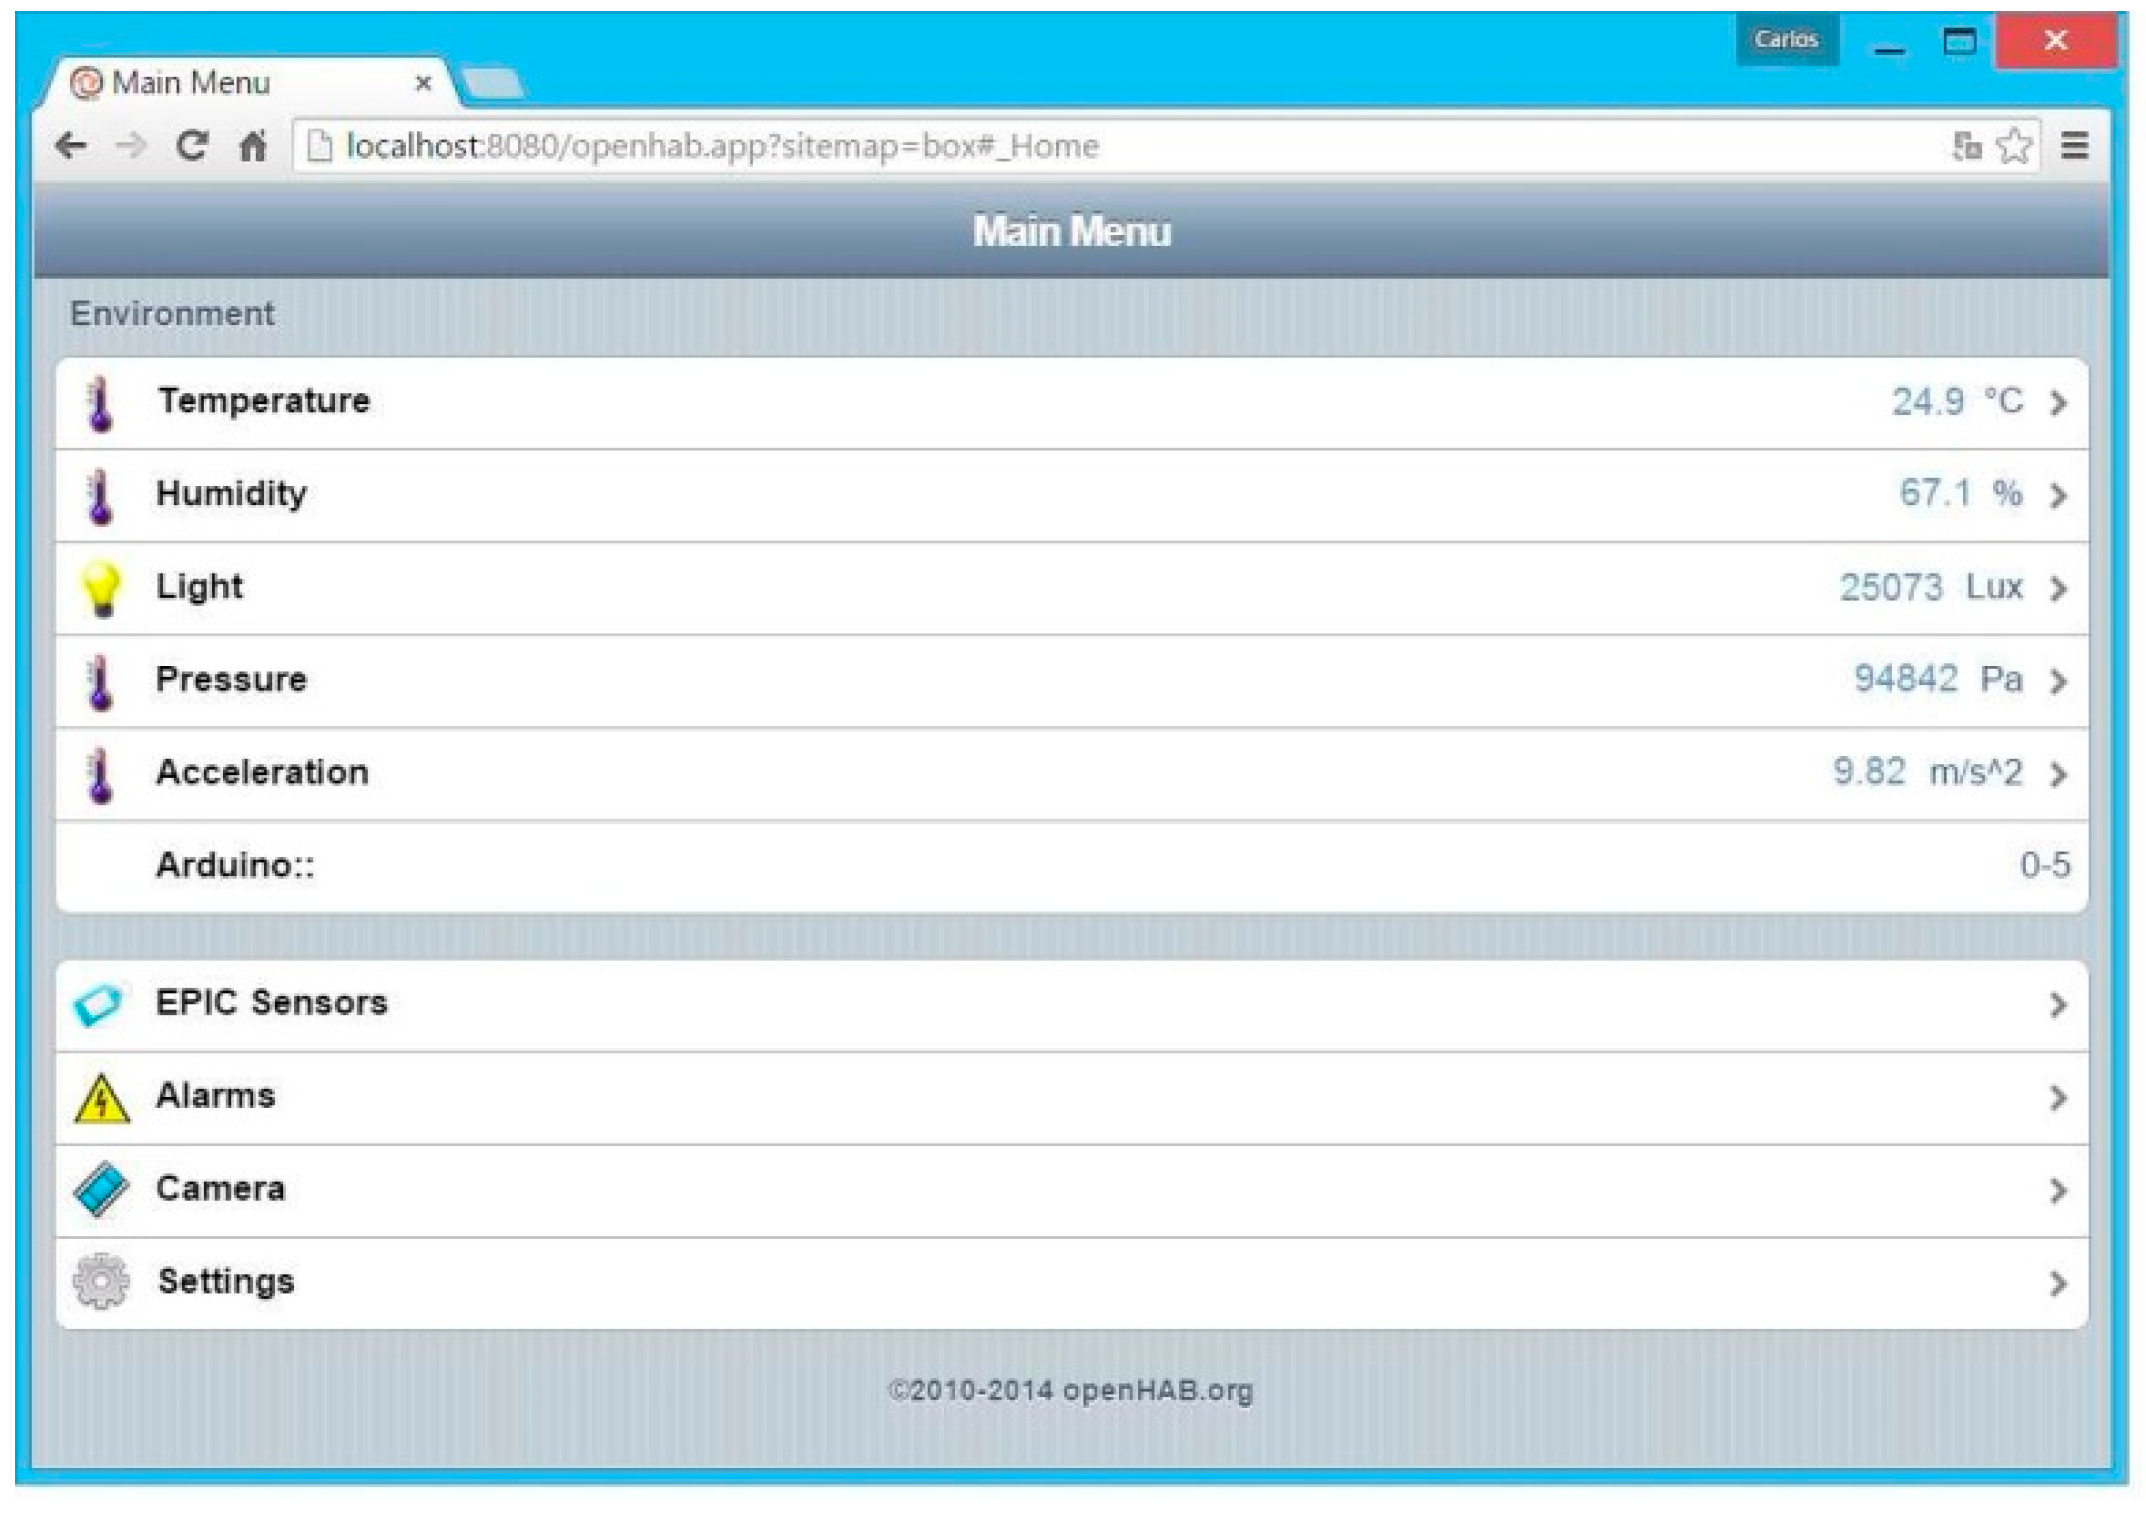
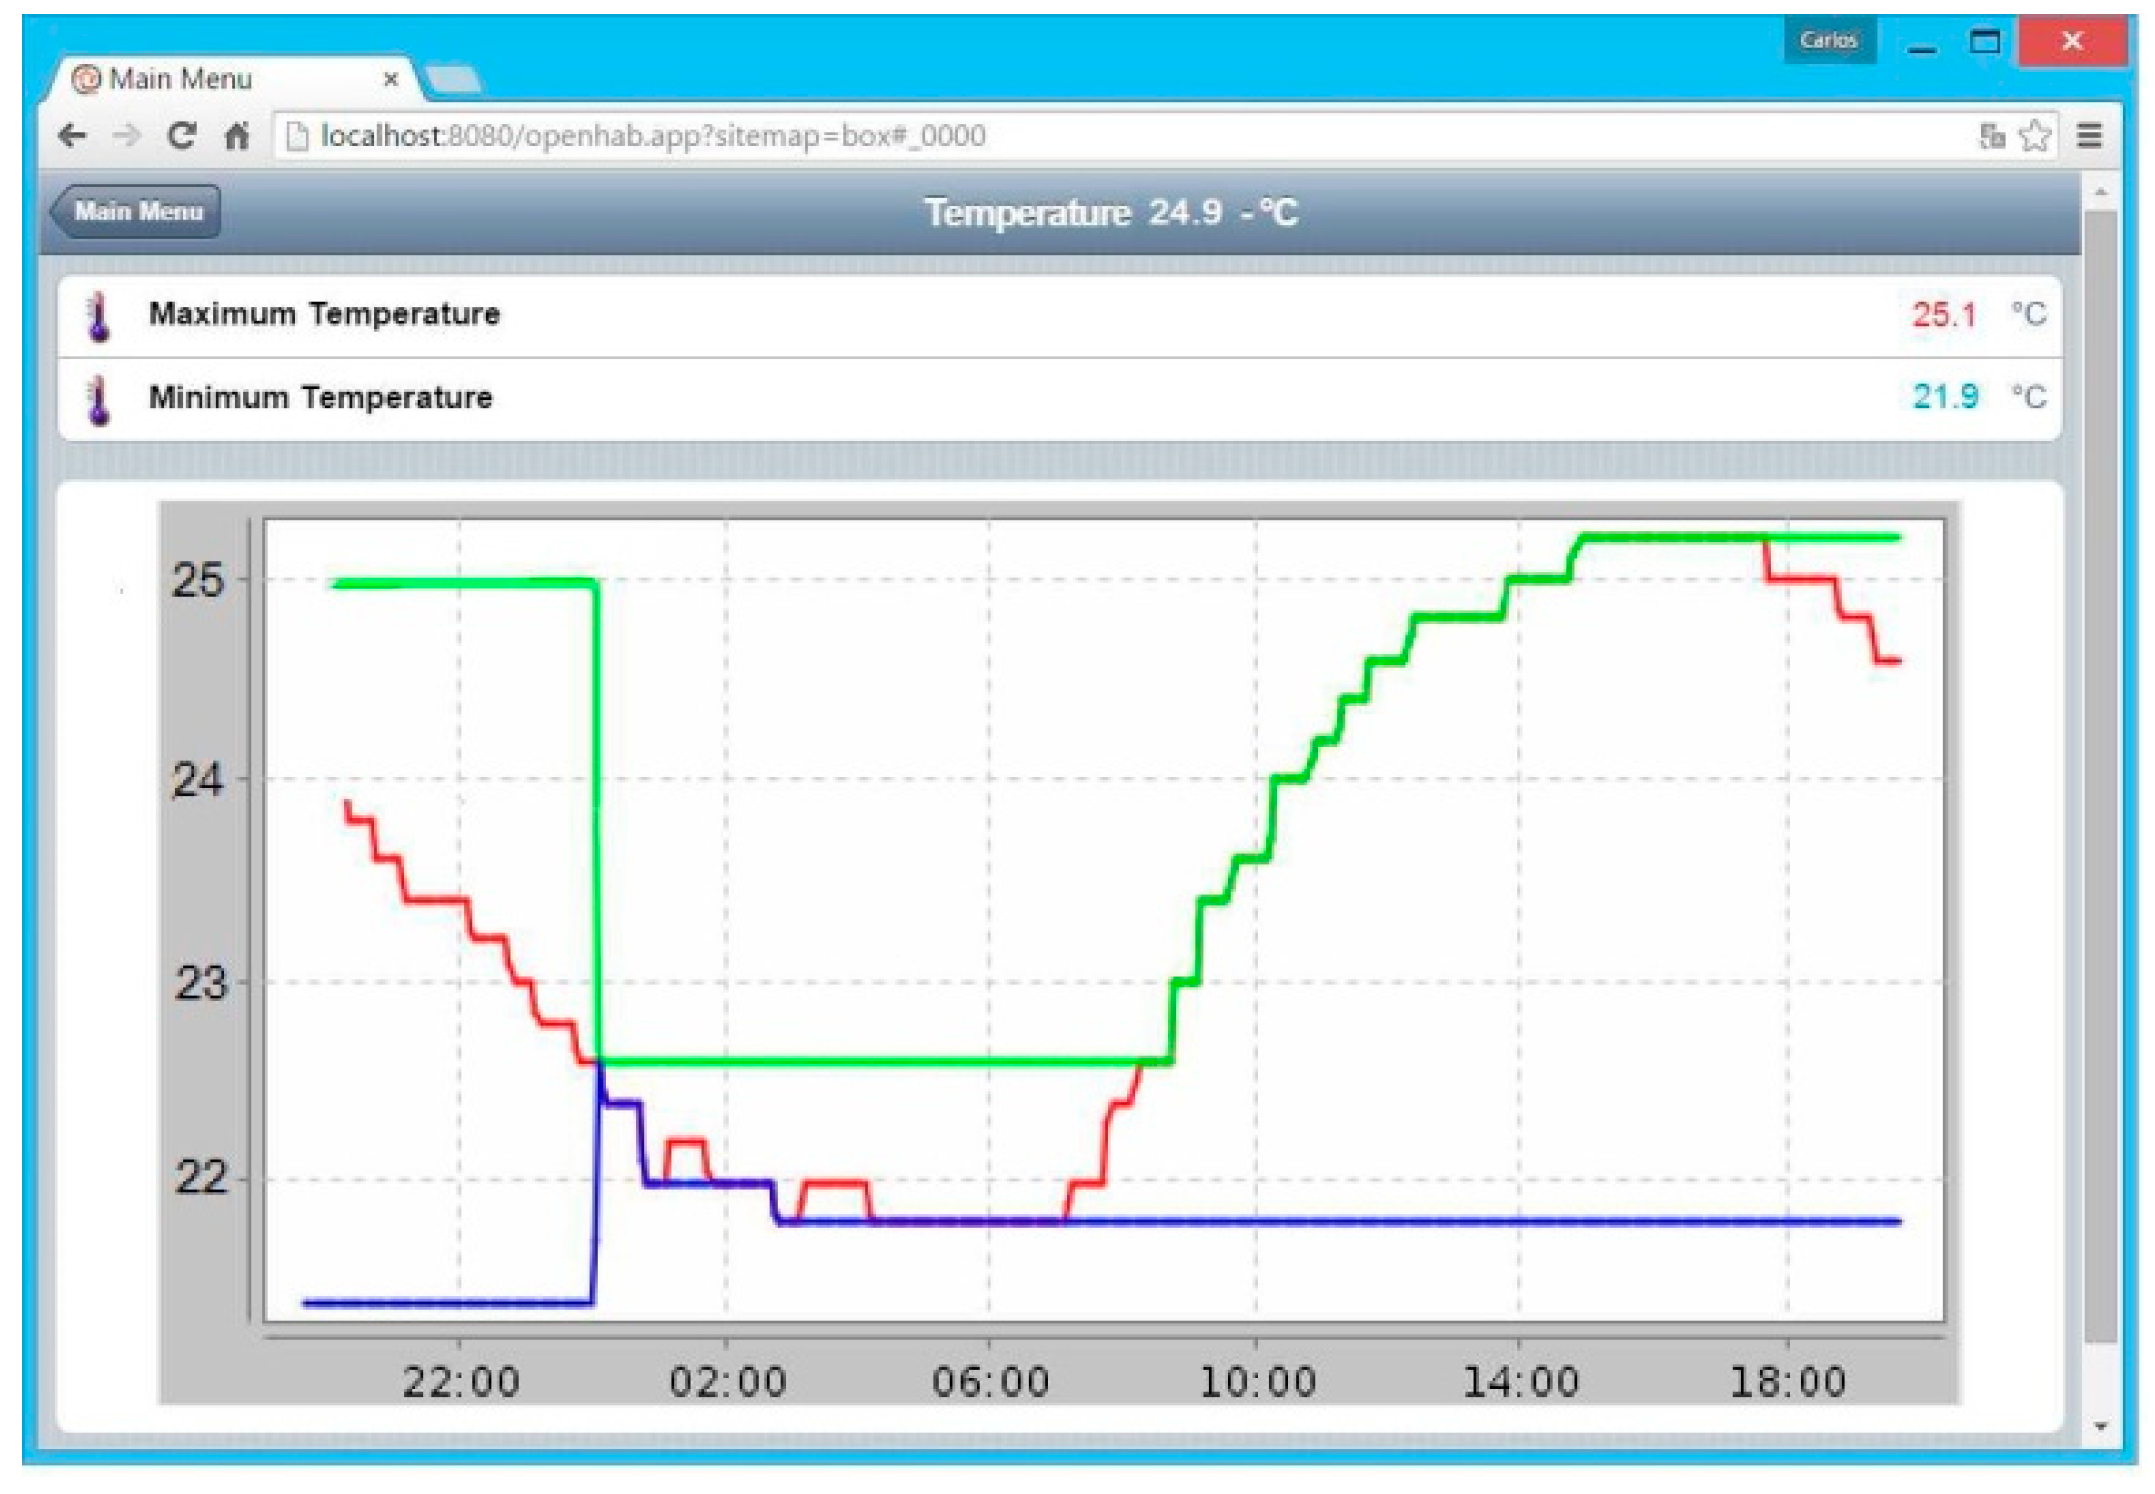
  • “Sitemaps” section: In this section, the graphical user interface is generated, defining the type of menus and submenus. A screenshot of the “main menu” is shown in Figure 11.
  • “Rules” section: It handles the automation, allowing the creation of event-based rules (changes of parameters, timers, etc.).
  • “Persist” section: It allows us to add different methods of creating and maintaining databases to store the parameters obtained.
From the main menu, each of the monitored parameters can be accessed showing its current value: temperature, humidity, light intensity, pressure, and acceleration. By selecting one of them, current, maximum, and minimum values of that parameter are displayed as a graph, showing its temporal variation. Figure 12 shows the exemplary variation of temperature inside the transport box.
Other menus were prepared to visualize the information collected by the matrix of EPIC sensors (the value of the BR and its variability), alarms, and webcam images. openHAB received information from the sensors through the microcontroller SAM3X8E, which was responsible for the initialization and control of the sensors through a program developed in Arduino code. This program analyzed openHAB requests and sent responses appropriately. For example, at a request for the current temperature value, the system first prepares the sensor, acquires the temperature value, and sends this value to the application in openHAB. This communication was carried out using three code parameters:
  • Address: This parameter was only 1 bit set to 0 or 1 depending on the direction of communication (0 for openHAB → Arduino and 1 in the opposite direction).
  • Type: The second parameter corresponded to a byte, which identified the type of data being processed (for example, 00000000 indicates temperature, 00000001 indicates humidity, and so on). This data type was not limited to sensor data identification and could also be used to modify alarms or switches.
  • Data: The third parameter indicated the value of the requested sensor.
Thus, the code 1-00000100-9.8725 indicated that a value was being transmitted from Arduino to openHAB (initial value of 1), corresponding to the accelerometer sensor (00000100), the value of which was 9.8725 (meters per second squared, in this case).

4. Discussion

We have developed a novel monitoring system and transport box for laboratory mice transportation, which may be used to infer the stress level to which mice are subjected during transport to research facilities. This prototype incorporates EPIC sensors for recording physiological parameters (HR and BR) and other sensors for recording environmental parameters (temperature, humidity, movement, light intensity inside the box, atmospheric pressure, and a camera). Throughout the system design, the international legislation on the transport of laboratory animals was taken into account.
A lower platform is fixed to the bottom of the transport box and serves as support for the cage where animals are housed during transport. This platform contains the 4 × 4 matrix of EPIC sensors for recording the physiological signals. The control of the EPIC sensor matrix is carried out by means of a custom PCB that has been designed and built. This PCB allows to select and enable different EPIC sensor combinations that must be active in every instant (in order to be able to capture the mouse’s physiological signals), which reduces power consumption since it is not necessary to power all the EPIC sensors at the same time. An upper platform is fixed at the bottom of the box cover, which includes the CPU board and the environmental sensors.
Our results from the measurements using the EPIC sensor matrix prove its ability to capture physiological signals in mice. Some results show cardiac and respiratory components in the signal and some are just respiratory signals. The latter showed high amplitude and were easy to analyze. Therefore, the breathing rate is the parameter we use to infer the stress level of mice during transport.
The software for monitoring and control of the transport box is based on an open source software framework. Future tasks are defined to implement additional features. This prototype and subsequent versions will allow studying the behavior of laboratory animals in situations of stress from transport and its relationship with environmental parameters, which may serve as a reference for improved laboratory animal welfare.
The results presented in this paper describe the design and realization of a prototypical transport box for laboratory mice with integrated monitoring of physiological and environmental parameters. The following is a list of some of the additional features that are planned as future tasks to overcome the current limitations:
(1)
Development of an algorithm for the stress detection of mice based on EPIC sensor signals: Although the ability of these sensors to capture physiological signals in mice has been proved, and the function for the activation and selection of different sensors has been implemented, the development of an adequate algorithm for the automated sensor selection and stress level classification is necessary.
(2)
Signal analysis and integration with the openHAB platform: An algorithm for the capture and automatic filtering of the signal (mainly focused around 50 Hz electrical noises) has been developed using MATLAB. This software has to be conveniently ported to Arduino or another programming language supported by the CPU board. The integration of the acquired signal on the openHAB platform is another important task to be performed.
(3)
Power management: The current version of the prototype is designed to be powered using lithium polymer batteries or similar. This adds weight to the transport box, which is far from ideal for such an application. It is necessary to optimize the power consumption of the system.
(4)
Secure wireless access to information: A sufficient level of encryption must be provided to prevent third parties from obtaining data captured or stored in the transport box.
(5)
Tests under realistic conditions: The number of measurements performed on laboratory mice under realistic conditions has not been as high as we would have liked due to a variety of limitations. Further tests should be carried out in a controlled environment, closer to the reality of transporting laboratory mice.

Author Contributions

Conceptualization, C.G.-S.; methodology, J.-C.F. and D.S.; software, C.G.-S. and J.P.-T.; validation, E.D. and J.G.S.; formal analysis, J.P.-T.; investigation, C.G.-S., D.S., and F.R.I.; resources, E.D.; data curation, C.G.-S. and J.G.S.; writing—original draft preparation, C.G.-S., J.-C.F., and J.P.-T.; writing—review and editing, J.-C.F., J.P.-T., and F.R.I.; supervision, F.R.I.; project administration, F.R.I.

Funding

This research was partially funded by the State Chancellery of the federal state Saarland (Germany), grant number C/1-LdZ-2011, and also partially funded by the Spanish Government (Ministerio de Economía y Competitividad) through research project DPI2016-80391-C3-3-R. J.G.S. was supported by the DFG (SCH682/3-1), CIG303682 and J.G.S. and E.D. by FNR CORE (Itgb3VascIn).

Conflicts of Interest

The authors declare no conflict of interest.

References

  1. European Directive 2010/63/EU on “The Protection of Animals Used for Scientific Purposes”. Available online: https://eur-lex.europa.eu/legal-content/EN/TXT/?uri=celex%3A32010L0063 (accessed on 5 November 2018).
  2. Commission Decision of 24 January 2017 Establishing the Commission Expert Group ‘Platform on Animal Welfare’. Available online: http://eur-lex.europa.eu/legal-content/EN/TXT/?qid=1485860312484&uri= CELEX:32017D0131%2801%29 (accessed on 5 November 2018).
  3. Public Health Service Policy on Humane Care and Use of Laboratory Animals; U.S. Department of Health and Human Services, National Institutes of Health: Bethesda, MD, USA, 2015. Available online: https://grants.nih.gov/grants/olaw/references/PHSPolicyLabAnimals.pdf (accessed on 5 November 2018).
  4. The Eighth Edition of the Guide for the Care and Use of Laboratory Animals. American Association for Accreditation of Laboratory Animal Care (AAALAC). National Research Council 2011. Available online: http://www.aaalac.org/resources/theguide.cfm (accessed on 5 November 2018).
  5. Russell, W.M.S.; Burch, R.L. The Principles of Humane Experimental Technique; Methuen: London, UK, 1959. [Google Scholar]
  6. Seventh Report from the Commission to the Council and the European Parliament on the Statistics on the Number of Animals Used for Experimental and Other Scientific Purposes in the Member States of the European Union. Available online: http://eur-lex.europa.eu/legal-content/EN/TXT/?uri=CELEX:52013DC0859 (accessed on 5 November 2018).
  7. Castelhano-Carlos, M.J.; Baumans, V. The impact of light, noise, cage cleaning and in-house transport on welfare and stress of laboratory rats. Lab. Anim. 2009, 43, 311–327. [Google Scholar] [CrossRef] [PubMed] [Green Version]
  8. The US Institute for Laboratory Animal Research (ILAR) NRC. Guidelines for the Humane Transportation of Research Animals; The National Academies Press: Washington, DC, USA, 2006. [Google Scholar]
  9. Obernier, J.A.; Baldwin, R.L. Establishing an appropriate period of acclimatization following transportation of laboratory animals. ILAR J. 2006, 47, 364–369. [Google Scholar] [CrossRef] [PubMed]
  10. Swallow, J.; Anderson, D.; Buckwell, A.C.; Harris, T.; Hawkins, P.; Kirkwood, J.; Lomas, M.; Meacham, S.; Peters, A.; Prescott, M.; et al. Guidance on the transport of laboratory animals. Lab. Anim. 2005, 39, 1–39. [Google Scholar] [CrossRef] [PubMed] [Green Version]
  11. Arts, J.W.; Kramer, K.C.; Arndt, S.S.C.; Ohl, F. The impact of transportation on physiological and behavioral parameters in Wistar rats: Implications for acclimatization periods. ILAR J. 2012, 53, E82–E98. [Google Scholar] [CrossRef]
  12. Arts, J.W.; Oosterhuis, N.R.; Kramer, K.; Ohl, F. Effects of transfer from breeding to research facility on the welfare of rats. Animals 2014, 4, 712–728. [Google Scholar] [CrossRef]
  13. Capdevila, S.; Giral, M.; Ruiz de La Torre, J.L.; Russell, R.J.; Kramer, K. Acclimatization of rats after ground transportation to a new animal facility. Lab. Anim. 2007, 41, 255–261. [Google Scholar] [CrossRef] [Green Version]
  14. Van Ruiven, R.; Meijer, G.W.; Wiersma, A.; Baumans, V.; Van Zutphen, L.F.M.; Ritskes-Hoitinga, J. The influence of transportation stress on selected nutritional parameters to establish the necessary minimum period for adaptation in rat feeding studies. Lab. Anim. 1998, 32, 446–456. [Google Scholar] [CrossRef] [Green Version]
  15. Claassen, V. Neglected factors in pharmacology and neuroscience research. In Techniques in the Behavioral and Neural Sciences; Huston, J.P., Ed.; Elsevier Science: Amsterdam, The Netherlands, 1994; Volume 12, pp. 422–459. [Google Scholar]
  16. Van Ruiven, R.; Meijer, G.W.; Van Zutphen, L.F.M.; Ritskes-Hoitinga, J. Adaptation period of laboratory animals after transport: A review. Scand. J. Lab. Anim. Sci. 1996, 4, 185–190. [Google Scholar]
  17. Landi, M.S.; Kreider, J.W.; Lang, C.M.; Bullock, L.P. Effects of shipping on the immune function in mice. Am. J. Vet. Res. 1982, 43, 1654–1657. [Google Scholar]
  18. Drozdowicz, C.K.; Bowman, T.A.; Webb, M.L.; Lang, C.M. Effect of in-house transport on murine plasma corticosterone concentration and blood lymphocyte populations. Am. J. Vet. Res. 1990, 51, 1841–1846. [Google Scholar]
  19. Tuli, J.; Smith, J.; Morton, D. Stress measurements in mice after transportation. Lab. Anim. 1995, 29, 132–138. [Google Scholar] [CrossRef] [PubMed] [Green Version]
  20. Von Borell, E.; Langbein, J.; Després, G.; Hansen, S.; Leterrier, C.; Marchant-Forde, J.; Marchant-Forde, R.; Minero, M.; Mohr, E.; Prunier, A.; et al. Heart rate variability as a measure of autonomic regulation of cardiac activity for assessing stress and welfare in farm animals—A review. Physiol. Behav. 2007, 92, 293–316. [Google Scholar] [CrossRef] [PubMed]
  21. Thayer, J.F.; Åhs, F.; Fredrikson, M.; Sollers, J.J.; Wager, T.D. A meta-analysis of heart rate variability and neuroimaging studies: Implications for heart rate variability as a marker of stress and health. Neurosci. Biobehav. Rev. 2012, 36, 747–756. [Google Scholar] [CrossRef] [PubMed]
  22. Harland, C.; Clark, T.; Prance, R. High resolution ambulatory electrocardiographic monitoring using wrist-mounted electric potential sensors. Meas. Sci. Technol. 2003, 14, 923–928. [Google Scholar] [CrossRef]
  23. Sato, S.; Yamada, K.; Inagaki, N. System for simultaneously monitoring heart and breathing rate in mice using a piezoelectric transducer. Med. Biol. Eng. Comput. 2006, 44, 353–362. [Google Scholar] [CrossRef] [PubMed]
  24. Chu, V.; Otero, J.M.; Lopez, O.; Morgan, J.P.; Amende, I.; Hampton, T.G. Method for non-invasively recording electrocardiograms in conscious mice. BMC Physiol. 2001, 1, 6. [Google Scholar] [CrossRef]
  25. Van Vliet, B.N.; Chafe, L.L.; Antic, V.; Schnyder-Candrian, S.; Montani, J.P. Direct and indirect methods used to study arterial blood pressure. J. Pharmacol. Toxicol. Methods 2000, 44, 361–373. [Google Scholar] [CrossRef]
  26. Arcelus, A.; Sardar, M.; Mihailidis, A. Design of a capacitive ECG sensor for unobtrusive heart rate measurements. In Proceedings of the IEEE International Conference in Instrumentation and Measurement Technology Conference, The Depot, MN, USA, 6–9 May 2013; pp. 407–410. [Google Scholar]
  27. Baek, H.J.; Chung, G.S.; Kim, K.K.; Park, K.S. A smart health monitoring chair for nonintrusive measurement of biological signals. IEEE Trans. Inf. Technol. Biomed. 2012, 16, 150–158. [Google Scholar] [CrossRef]
  28. Lee, H.J.; Hwang, S.H.; Yoon, H.N.; Lee, W.K.; Park, K.S. Heart Rate Variability Monitoring during Sleep Based on Capacitively Coupled Textile Electrodes on a Bed. Sensors 2015, 15, 11295–11311. [Google Scholar] [CrossRef] [Green Version]
  29. Kundu, S.K.; Kumagai, S.; Sasaki, M. A Wearable Capacitive Sensor for Monitoring Human Respiratory Rate. Jpn. J. Appl. Phys. 2013, 52, 04CL05-1–04CL05-7. [Google Scholar] [CrossRef]
  30. Oum, J.H.; Lee, S.E.; Kim, D.W.; Hong, S. Non-contact heartbeat and respiration detector using capacitive sensor with Colpitts oscillator. Electron. Lett. 2008, 44, 233–245. [Google Scholar] [CrossRef]
  31. González-Sánchez, C.; Fraile, J.-C.; Pérez-Turiel, J.; Damm, E.; Schneider, J.G.; Zimmermann, H.; Schmitt, D.; Ihmig, F.R. Capacitive Sensing for Non-Invasive Breathing and Heart Monitoring in Non-Restrained, Non-Sedated Laboratory Mice. Sensors 2016, 16, 1052. [Google Scholar] [CrossRef] [PubMed]
  32. Laboratory Animal Science Association (LASA). Guidance on the transport of laboratory animals. Report of the Transport Working Group established by LASA. Lab. Anim. 2005, 39, 1–39. [Google Scholar] [CrossRef] [PubMed]
  33. Fawcett, A.; Rose, M. Guidelines for the housing of mice in scientific institutions. Animal Welfare Unit, NSW Department of Primary Industries, West Pennant Hills. Anim. Res. Rev. Panel 2012, 1, 1–143. [Google Scholar]
  34. Stryjek, R. A transportation device for rats. Lab Anim. 2010, 39, 279. [Google Scholar] [CrossRef] [PubMed]
  35. Zhan, H.; Tada, T.; Fujikura, E.; Matsumoto, K.; Tanaka, Y.; Hongo, K. A container for transporting small laboratory animals for magnetic resonance imaging. J. Neurosci. Methods 2005, 144, 143–146. [Google Scholar] [CrossRef] [PubMed]
Figure 1. Modular concept of the monitoring system.
Electronics 08 00034 g001
Figure 2. Prototype design of the transport box.
Electronics 08 00034 g002
Figure 3. (a) Self-designed printed circuit board (PCB) used to control the 4 × 4 matrix of electric potential integrated circuit (EPIC) sensors. (b) Matrix of EPIC sensors used for physiological signals capturing in rodents.
Electronics 08 00034 g003
Figure 4. Functional block diagram of the ADG1606 multiplexer.
Electronics 08 00034 g004
Figure 5. Central processing unit (CPU) board and selected environmental sensors for the prototypical transport box: (a) UDOO QUAD board, (b) webcam and visible light/infrared sensor, (c) digital accelerometer, (d) barometric pressure sensor, (e) humidity sensor, and (f) buzzer.
Electronics 08 00034 g005
Figure 6. Functional transport box with integrated monitoring system. (Top) Backside of the box cover with all hardware components installed—CPU board and environmental sensors. (Bottom) Matrix of EPIC sensors to capture mouse physiological signals.
Electronics 08 00034 g006
Figure 7. Physiological signal obtained while the mouse had one limb in contact with an EPIC sensor of the matrix: before (a) and after (b) the notch filter.
Electronics 08 00034 g007aElectronics 08 00034 g007b
Figure 8. Calculated breathing rate.
Electronics 08 00034 g008
Figure 9. Physiological signal obtained while the mouse placed two paws on two different EPIC sensors of the matrix (after filtering).
Electronics 08 00034 g009
Figure 10. Calculated instantaneous heart rate based on the signal peaks series.
Electronics 08 00034 g010
Figure 11. Screenshot of the “main menu” developed for the transport box.
Electronics 08 00034 g011
Figure 12. Screenshot of the exemplary variation of temperature inside the transport box. Current value (red), minimum value (blue), maximum value (green).
Electronics 08 00034 g012
Table 1. Decimal values associated with each matrix position used for the sensors’ power supply.
(1,1)(1,2)(1,3)(1,4)
1248
(2,1)(2,2)(2,3)(2,4)
163264128
(3,1)(3,2)(3,3)(3,4)
25651210242048
(4,1)(4,2)(4,3)(4,4)
409681921638432768
Table 2. Values used for each matrix position that select the output to be processed.
(1,1)(1,2)(1,3)(1,4)
0–00001–00012–00103–0011
(2,1)(2,2)(2,3)(2,4)
4–01005–01016–01107–0111
(3,1)(3,2)(3,3)(3,4)
8–10009–100110–101011–1011
(4,1)(4,2)(4,3)(4,4)
12–110013–110114–111015–1111

