Article

Numerical-Sampling-Functionalized Real-Time Index Regulation for Direct k-Domain Calibration in Spectral Domain Optical Coherence Tomography

1
School of Electronics Engineering, College of IT Engineering, Kyungpook National University, 80, Daehak-ro, Buk-gu, Daegu 41566, Korea
2
Department of Biomedical Engineering, College of Engineering, Kyungil University, 50, Gamasil-gil, Hayang-eup, Gyeongsan-si, Gyeongsangbuk-do 38428, Korea
3
Institute of Biomedical Engineering, School of Medicine, Kyungpook National University, 680, Gukchaebosang-ro, Jung-gu, Daegu 41944, Korea
4
Future IT Innovation Laboratory, Department of Creative IT Engineering, Pohang University of Science and Technology (POSTECH), 77 Cheongam-ro, Nam-gu, Pohang-si, Gyeongbuk-do 37673, Korea
5
Department of Nuclear Medicine, Chonnam National University Medical School & Hwasun Hospital, Hwasun 58128, Korea
*
Authors to whom correspondence should be addressed.
These authors contributed equally to this work.
Electronics 2018, 7(9), 182; https://doi.org/10.3390/electronics7090182
Submission received: 9 August 2018 / Revised: 1 September 2018 / Accepted: 7 September 2018 / Published: 9 September 2018

Abstract

:
An index-regulation technique functionalized by numerical sampling for direct calibration of the non-linear wavenumber (k)-domain to a linear domain in spectral domain optical coherence tomography (SD-OCT) is proposed. The objective of the developed method is to facilitate high-resolution identification of microstructures in biomedical imaging. Subjective optical alignments caused by nonlinear sampling of interferograms in the k-domain tend to hinder depth-dependent signal-to-noise ratios (SNR) and axial resolution in SD-OCT. Moreover, the optical-laser-dependent k-domain requires constant recalibrated in accordance with each laser transition, thereby necessitating either hardware or heavy software compensations. As the key feature of the proposed method, a relatively simple software-based k-domain mask calibration technique was developed to enable real-time linear sampling of k-domain interpolations whilst facilitating image observation through use of an index-regulation technique. Moreover, it has been confirmed that dispersion can be simultaneously compensated with noise residuals generated using the proposed technique, and that use of complex numerical or hardware techniques are no longer required. Observed results, such as fall-off, SNR, and axial resolution clearly exhibit the direct impact of the proposed technique, which could help investigators rapidly achieve optical-laser-independent high-quality SD-OCT images.

1. Introduction

Optical-spectrometer-adopted SD-OCT [1,2,3] is one of the major Fourier domain OCT (FD-OCT) [3] categories capable of obtaining depth-dependent information by applying Fourier transforms over a given spectral range. SD-OCT systems have been extensively utilized in medical, industrial, and agricultural applications owing to their high data-acquisition speeds, higher sensitivity (when compared against time-domain OCT (TD-OCT) systems [4,5]), and lower manufacturing costs (when compared against swept-source OCT (SS-OCT) systems) [6,7,8,9,10,11,12,13]. During SD-OCT, optical spectrum of the interference fringe is subjected to a discrete Fourier transformation to perform image reconstruction. An optical spectrometer, tuned to a desired wavelength, is operated to uniformly collect measurements in terms of wavelengths (λ) with an equidistance of spectral readings according to wavenumbers given by k = 2π/λ (where k denotes the wavenumber) [14].
To ensure optimal performance of the SD-OCT system, Fourier transforming data points must be equally spaced in terms of wavenumber. Nevertheless, diffractive grating utilized in the optical spectrometer linearly separates spectral bands within a given wavelength (λ), thereby becoming unevenly sampled in the k-domain owing to the aforementioned inverse relationship between k and λ [15,16]. Owing to this nonlinear relationship, each pixel of line-scan camera of the spectrometer integrates a different spectral width, which in turn, broadens the point spread function (PSF), thereby reducing the efficacy. The desired compensation can be achieved by numerically resampling and uniformly spacing these unevenly sampled wavenumbers to enhance image reconstruction [17].
The above necessity for calibration has attracted considerable research interest, and as a result, diverse optical-hardware-based techniques and heavy complex-algorithm-based computational methods have been developed. Resampling schemes involving non-uniform fast Fourier transforms (FFT) and a graphic processing unit (GPU) have been proposed to offload wavelength to k-domain conversions, thereby simultaneously improving data-acquisition speeds [18,19]. The nonlinearity can, moreover, be compensated by approximating an SD-OCT system with a set of linear equations to formulate an inverse problem, such that solving it would directly reconstruct a given cross-section of the sample instead of individually estimating depth-direction intensity lines [17]. In addition, compressed-sensing-method-based k-domain linearization techniques have been developed to simplify conventionally complex numerical methods [20,21]. Examples of these resampling methods include linear and cubic spline interpolations, which serve to positively enhance data-processing speeds, but also generate interpolation errors. Apart from these complex computational resampling techniques, optical hardware solutions using prisms have been proposed to achieve real-time imaging [16,22,23,24]. The authors’ group has previously developed a wavelength scanning filter capable of generating lookup tables in real-time instead of interpolating nonlinear data [25].
This paper aims at introducing a numerical-sampling-functionalized real-time index-regulation technique to be applied on an entire pixel array to obtain ultra-fast k-domain mask calibration for SD-OCT. Compared to conventional techniques, the proposed linearization process can be performed during image observation, thereby enhancing cross-sectional image quality in real-time by varying the overall intensity of k-domain index values and simply interpolating numerical values. The proposed method further compensates for dispersion with noise residuals and also minimizes the necessity of repetitive calibration trials during successive optical hardware modifications. The robustness, potential applicability, and simplicity of the proposed technique were compared with previous recalibration techniques, such as wavelength filter based k-domain calibration and spline interpolations techniques. Acquired results demonstrate that the proposed index-regulation-based direct k-domain linearization achieves the best fall-off values of 21 dB, when compared against conventional methods, over the entire imaging depth without use of complicated numerical and/or hardware techniques.

2. Materials and Methods

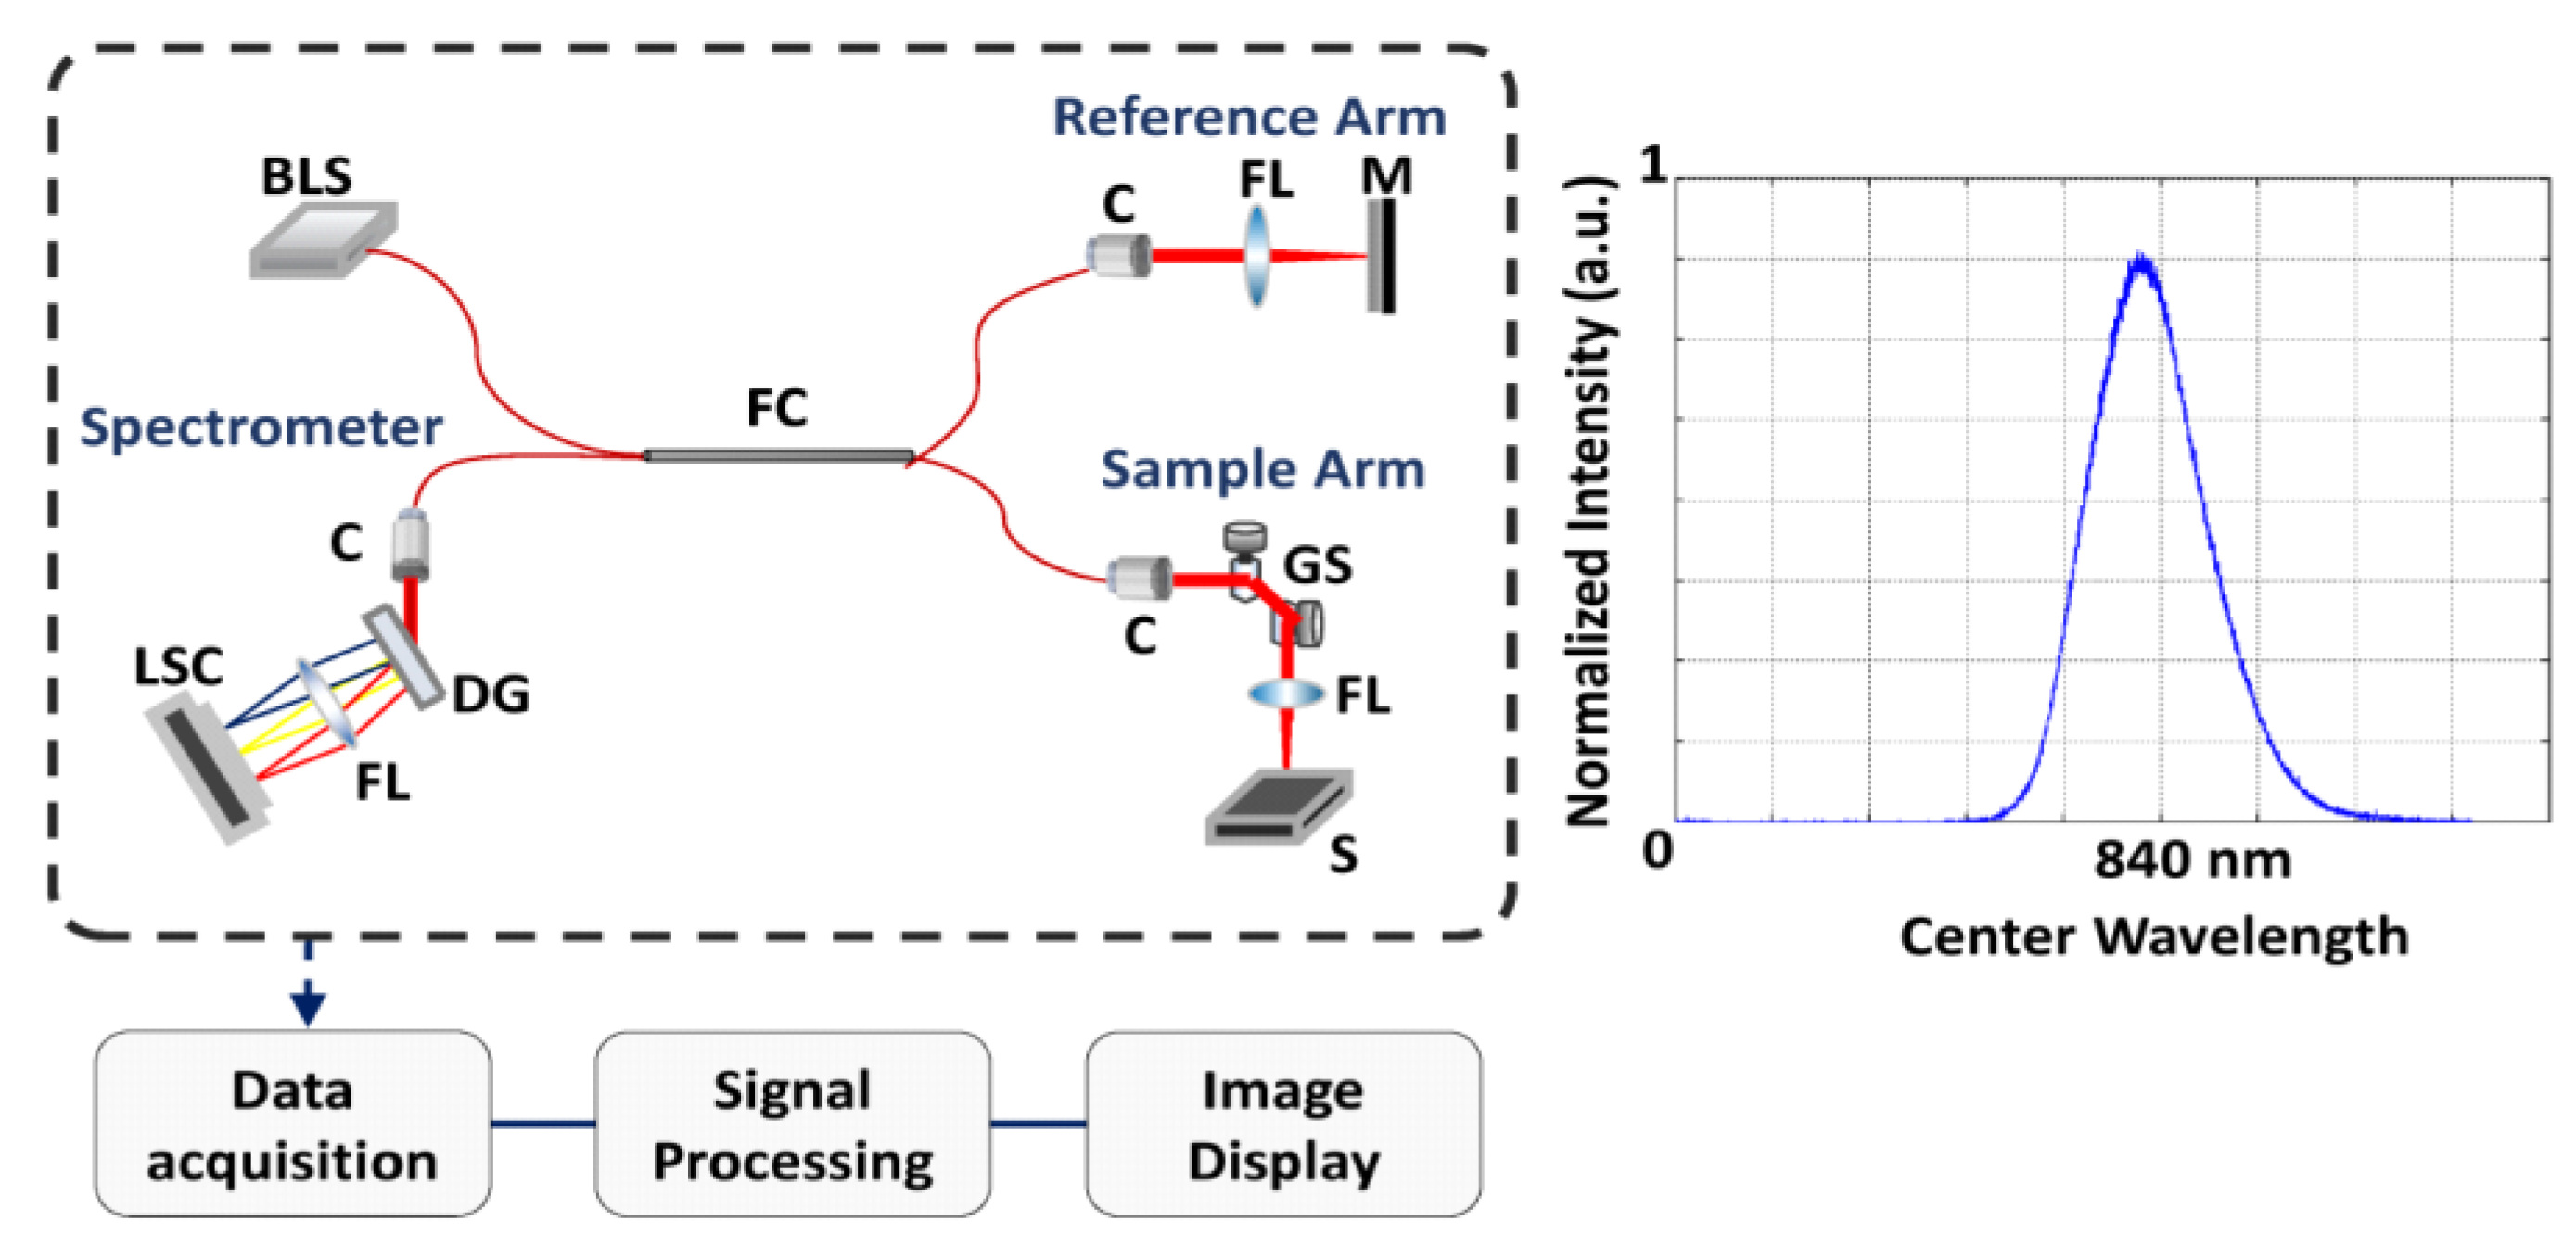
2.1. OCT System Configuration

The proposed SD-OCT system, as illustrated in Figure 1, comprised of a superluminescent light emitting diode with a central wavelength of 840 nm and bandwidth of 50 nm (i.e., a band of 815–865 nm). Detailed configurations of SD-OCT instrumentation are provided elsewhere [12]. Within the fiber-based interferometer, an optical coupler with a splitting ratio of 50:50 was used to divide the beam towards reference and sample arms. Backscattered beams were interfered and delivered to a laboratory customized spectrometer. Transmission-type diffraction grating (1800 lpmm. Wasatch Photonics, Durham, NC, USA) was employed in the interferometer, which also comprised a 12-bit complementary metal oxide semiconductor line-scan camera (Sprint spL2048-140k, Basler AG, Ahrensburg, Germany). During exposure, each pixel of a line-scan camera collects measurements that correspond to a single optical wavelength. With the entire pixel array, A-line data along the axial direction are collected. B-mode scanning was performed using galvanometer scanners installed on the sample arm.

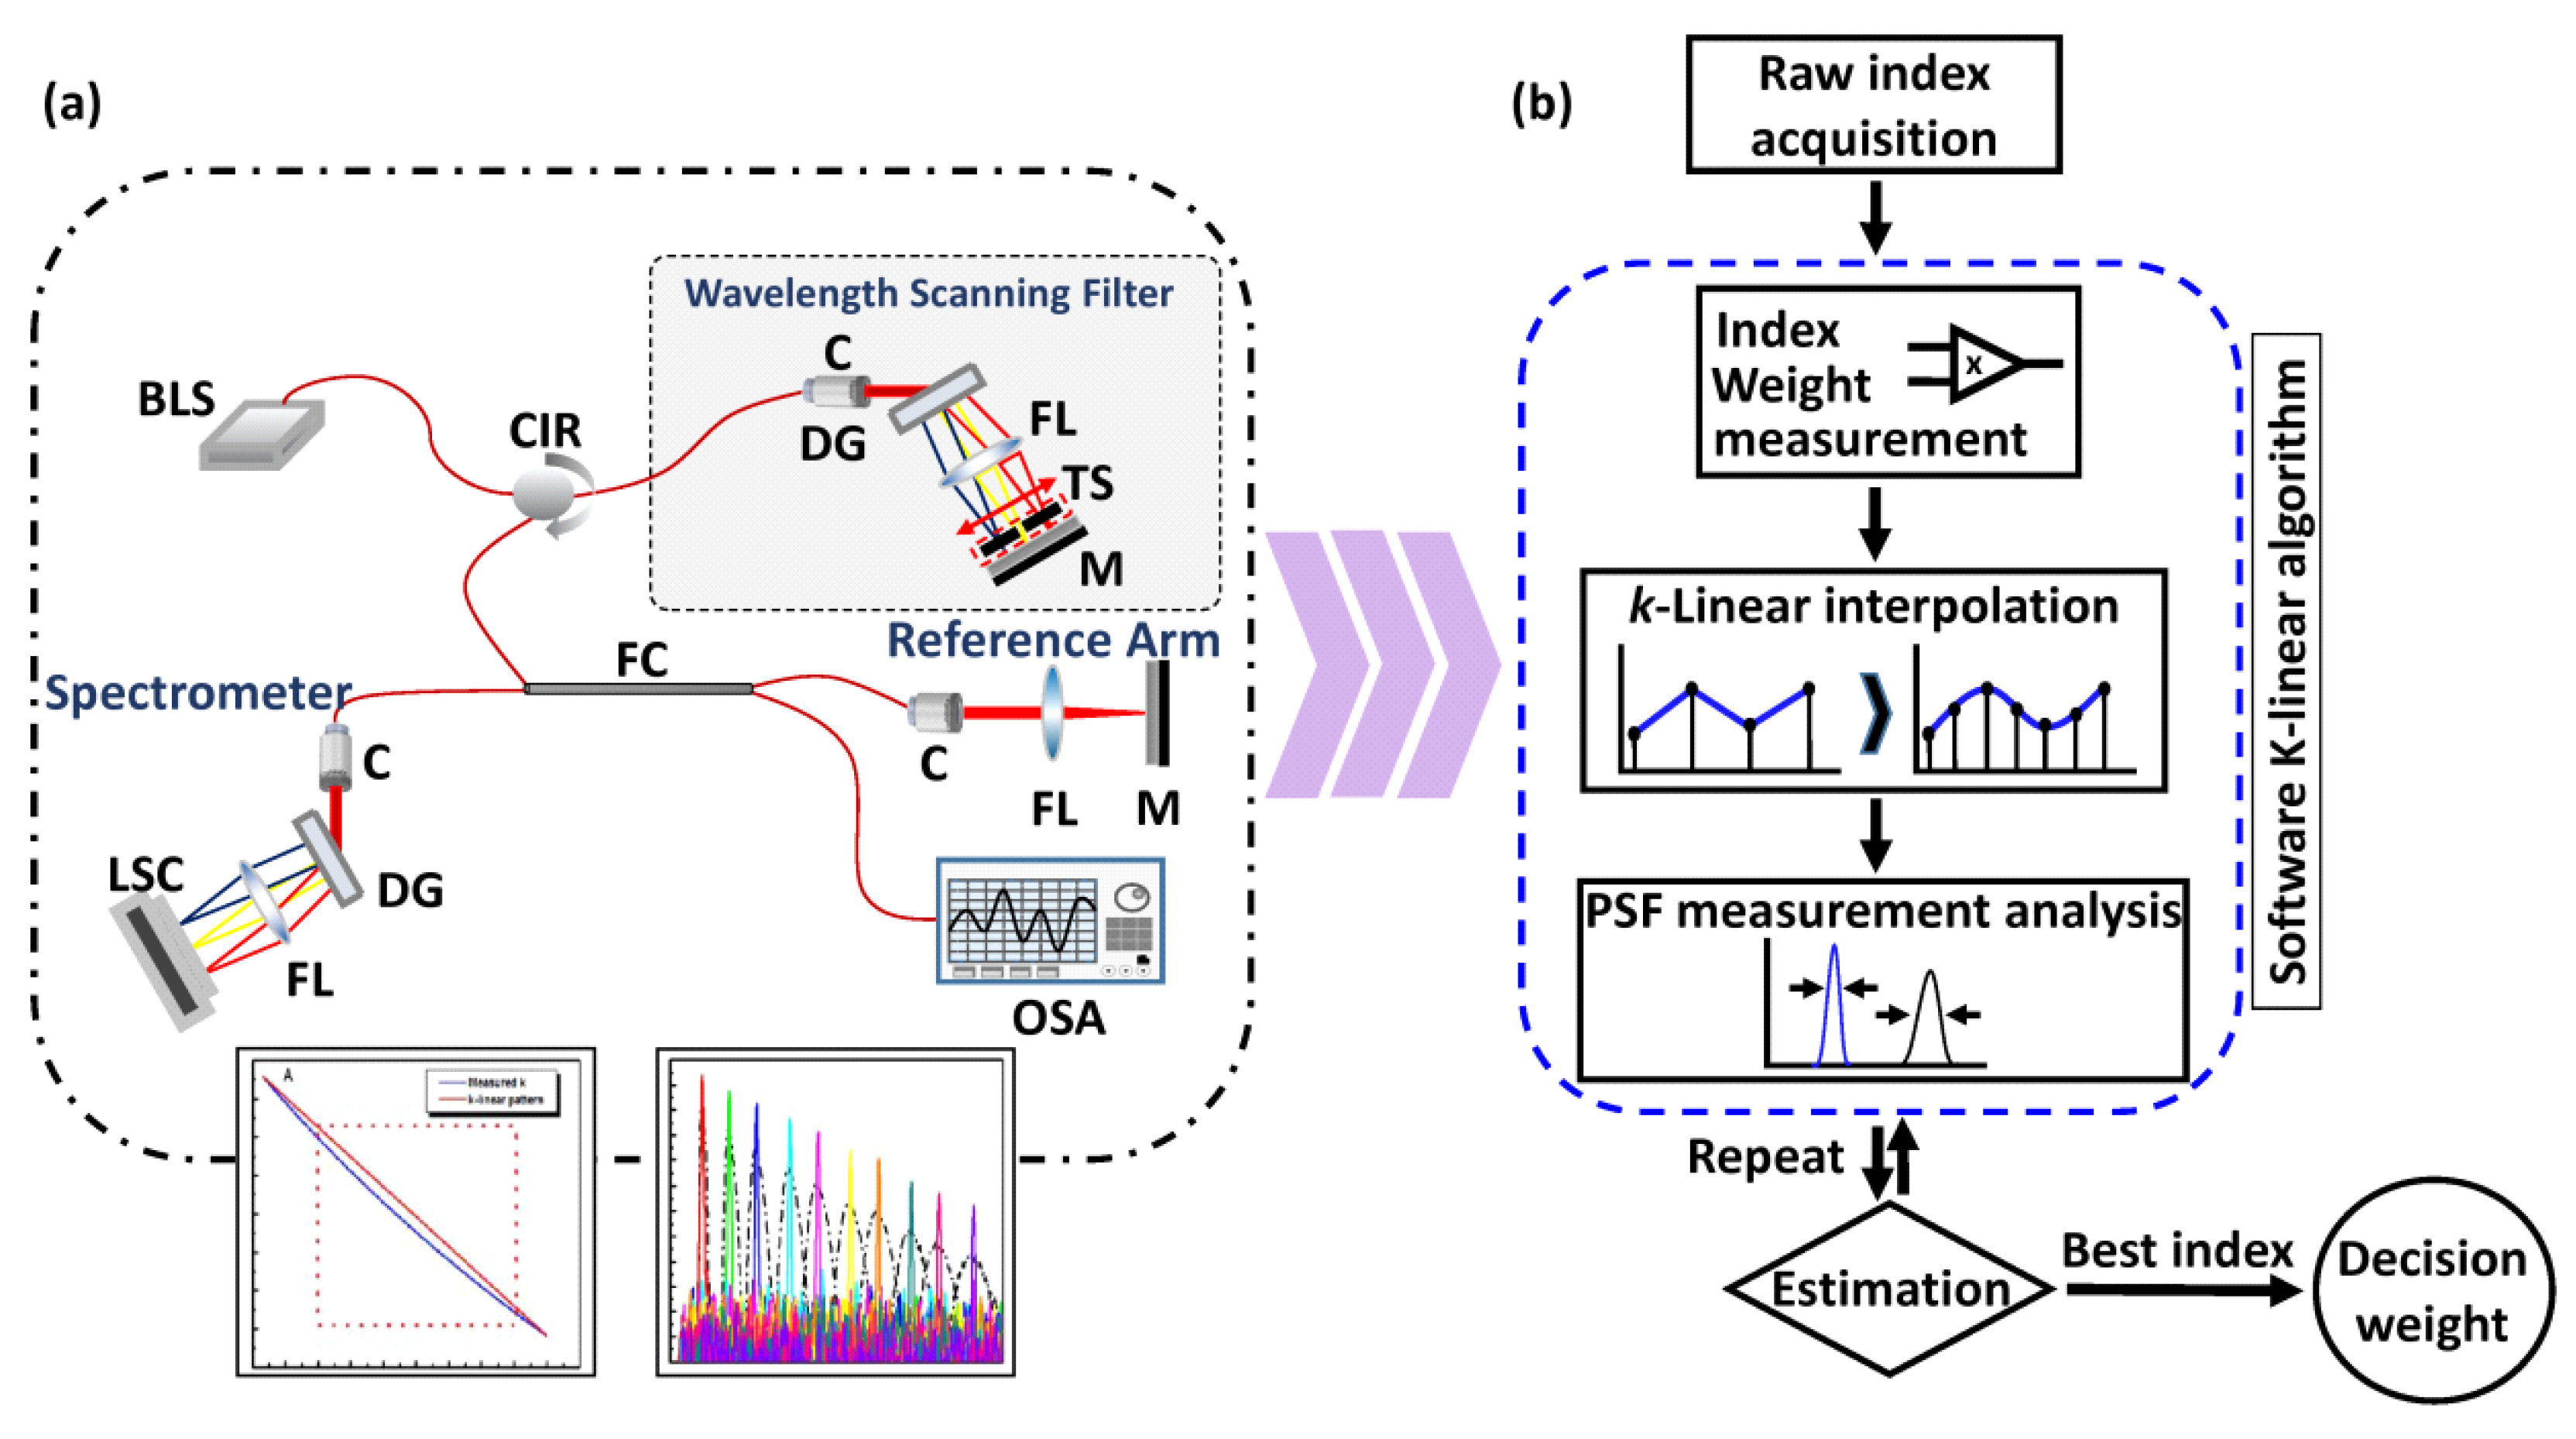
2.2. Comparison of the Direct Real-Time k-Domain Modeling Algorithm with Conventional Hybrid Wavelength Scanning Filter Calibration and Spline Interpolation Techniques

To highlight the potential applicability and fundamental performance of the proposed algorithm, an initial attempt at wavenumber linearization was made using the conventional OCT-hybrid wavelength scanning filter previously developed by our group. A schematic of the OCT-hybrid wavelength scanning filter is illustrated in Figure 2a. The implemented translating-slit-based wavelength scanner provides information concerning each wavenumber at each pixel location. The desired broadband laser was placed before the corresponding wavelength filter, and the spectrum was screened using a narrow line-width measuring 0.5 nm. Corresponding measurements were also simultaneously performed by the line-scan camera of OCT and an optical spectrum analyzer (OSA) to obtain pixel as well as wavelength measurements. Subsequently, a lookup table was generated, which could later be used to linearize the measured spectrum of the optical laser in the k-domain [25]. However, the aforementioned lookup table mapping was also employed during post data capture, which requires additional optical hardware components, such as the optical wavelength scanning filter and OSA. Moreover, the overall process is time-consuming as well. The most important drawback of this method is its optical-laser dependency, which requires repeated calibration trials and generation of new lookup tables at each optical-laser transition. Spline interpolation [19,26,27,28] is another complex numerical calibration technique, where the image pixels are stored in a compute unified device architecture (CUDA) array and bound to a designated region in a texture memory. A resampled interference spectrum is created by interpolating between the image pixels at predefined calibration values, which eventually provides evenly distributed wavenumber values. However, an averaging process of the spectrum has to be further performed for noise removal and to remove the autocorrelation signal of the reference arm. Moreover, a Fourier transformation of each individual A-scan, data conversion from Fourier space to real space, and finally data type conversion from 32-bit float to 16-bit integer towards host memory have to executed for a complete spectrum calibration.
To overcome the aforementioned complex optical and numerical calibration techniques, a direct real-time k-domain modeling algorithm was developed and illustrated in flowchart shown in Figure 2b. The initial raw index acquisition of the architecture represents the acquisition of nonlinear index array corresponds to the original image of the system. This main data stream contains different values between the line image cell index and the correlated index in the k-domain, which is the main cause for the non-linearized wavenumber domain. Once the raw index is arranged, the next step of the proposed algorithm is executed by varying the fundamental index intensity through the use of numerical multiplication factor (numerical unit with hundredth decimal point starting from 1). The utilization of this numerical factor results adjustments of the index weight and sampling of the entire array, which simply leads to an index interpolation to linearize the wavenumber domain. Next, the PSF representations were analyzed at each depth range qualitatively by imaging the reflectivity profile of mirror reflection to confirm the k-domain linearization for the whole depth range. The exact numerical factor, which linearizes the k-domain is verified after successful interpolation attempts, and the entire interpolated raw index array is Fourier transformed and log scaled for the image visualization. Simultaneously, the index intensity can be continuously varied to enhance the image quality until the k-domain linearization is satisfactorily accomplished. The fundamental index array can be determined in accordance with the bandwidth of the optical laser (50 nm; i.e., 815–865 nm, where values of k-domain indications include in the range of 7.77 to 7.26 μm−1). Thus, this software-based laboratory customized algorithm can simply overcome the above-mentioned necessity of index array reported in our previous attempt. Moreover, this algorithm can invert the index array according to the direction of the line camera and moves the index signal size and index direction left and right correcting the image finely by the decimal point unit using linear interpolation. The user can easily change the index shape while viewing the image to further optimize k-domain linearization, and the range of index arrays can be expanded by means of numerical sampling. This validates the potential high-speed and accuracy of the proposed technique with regard to any further optical-laser transition (with different central wavelengths).

3. Results and Discussion

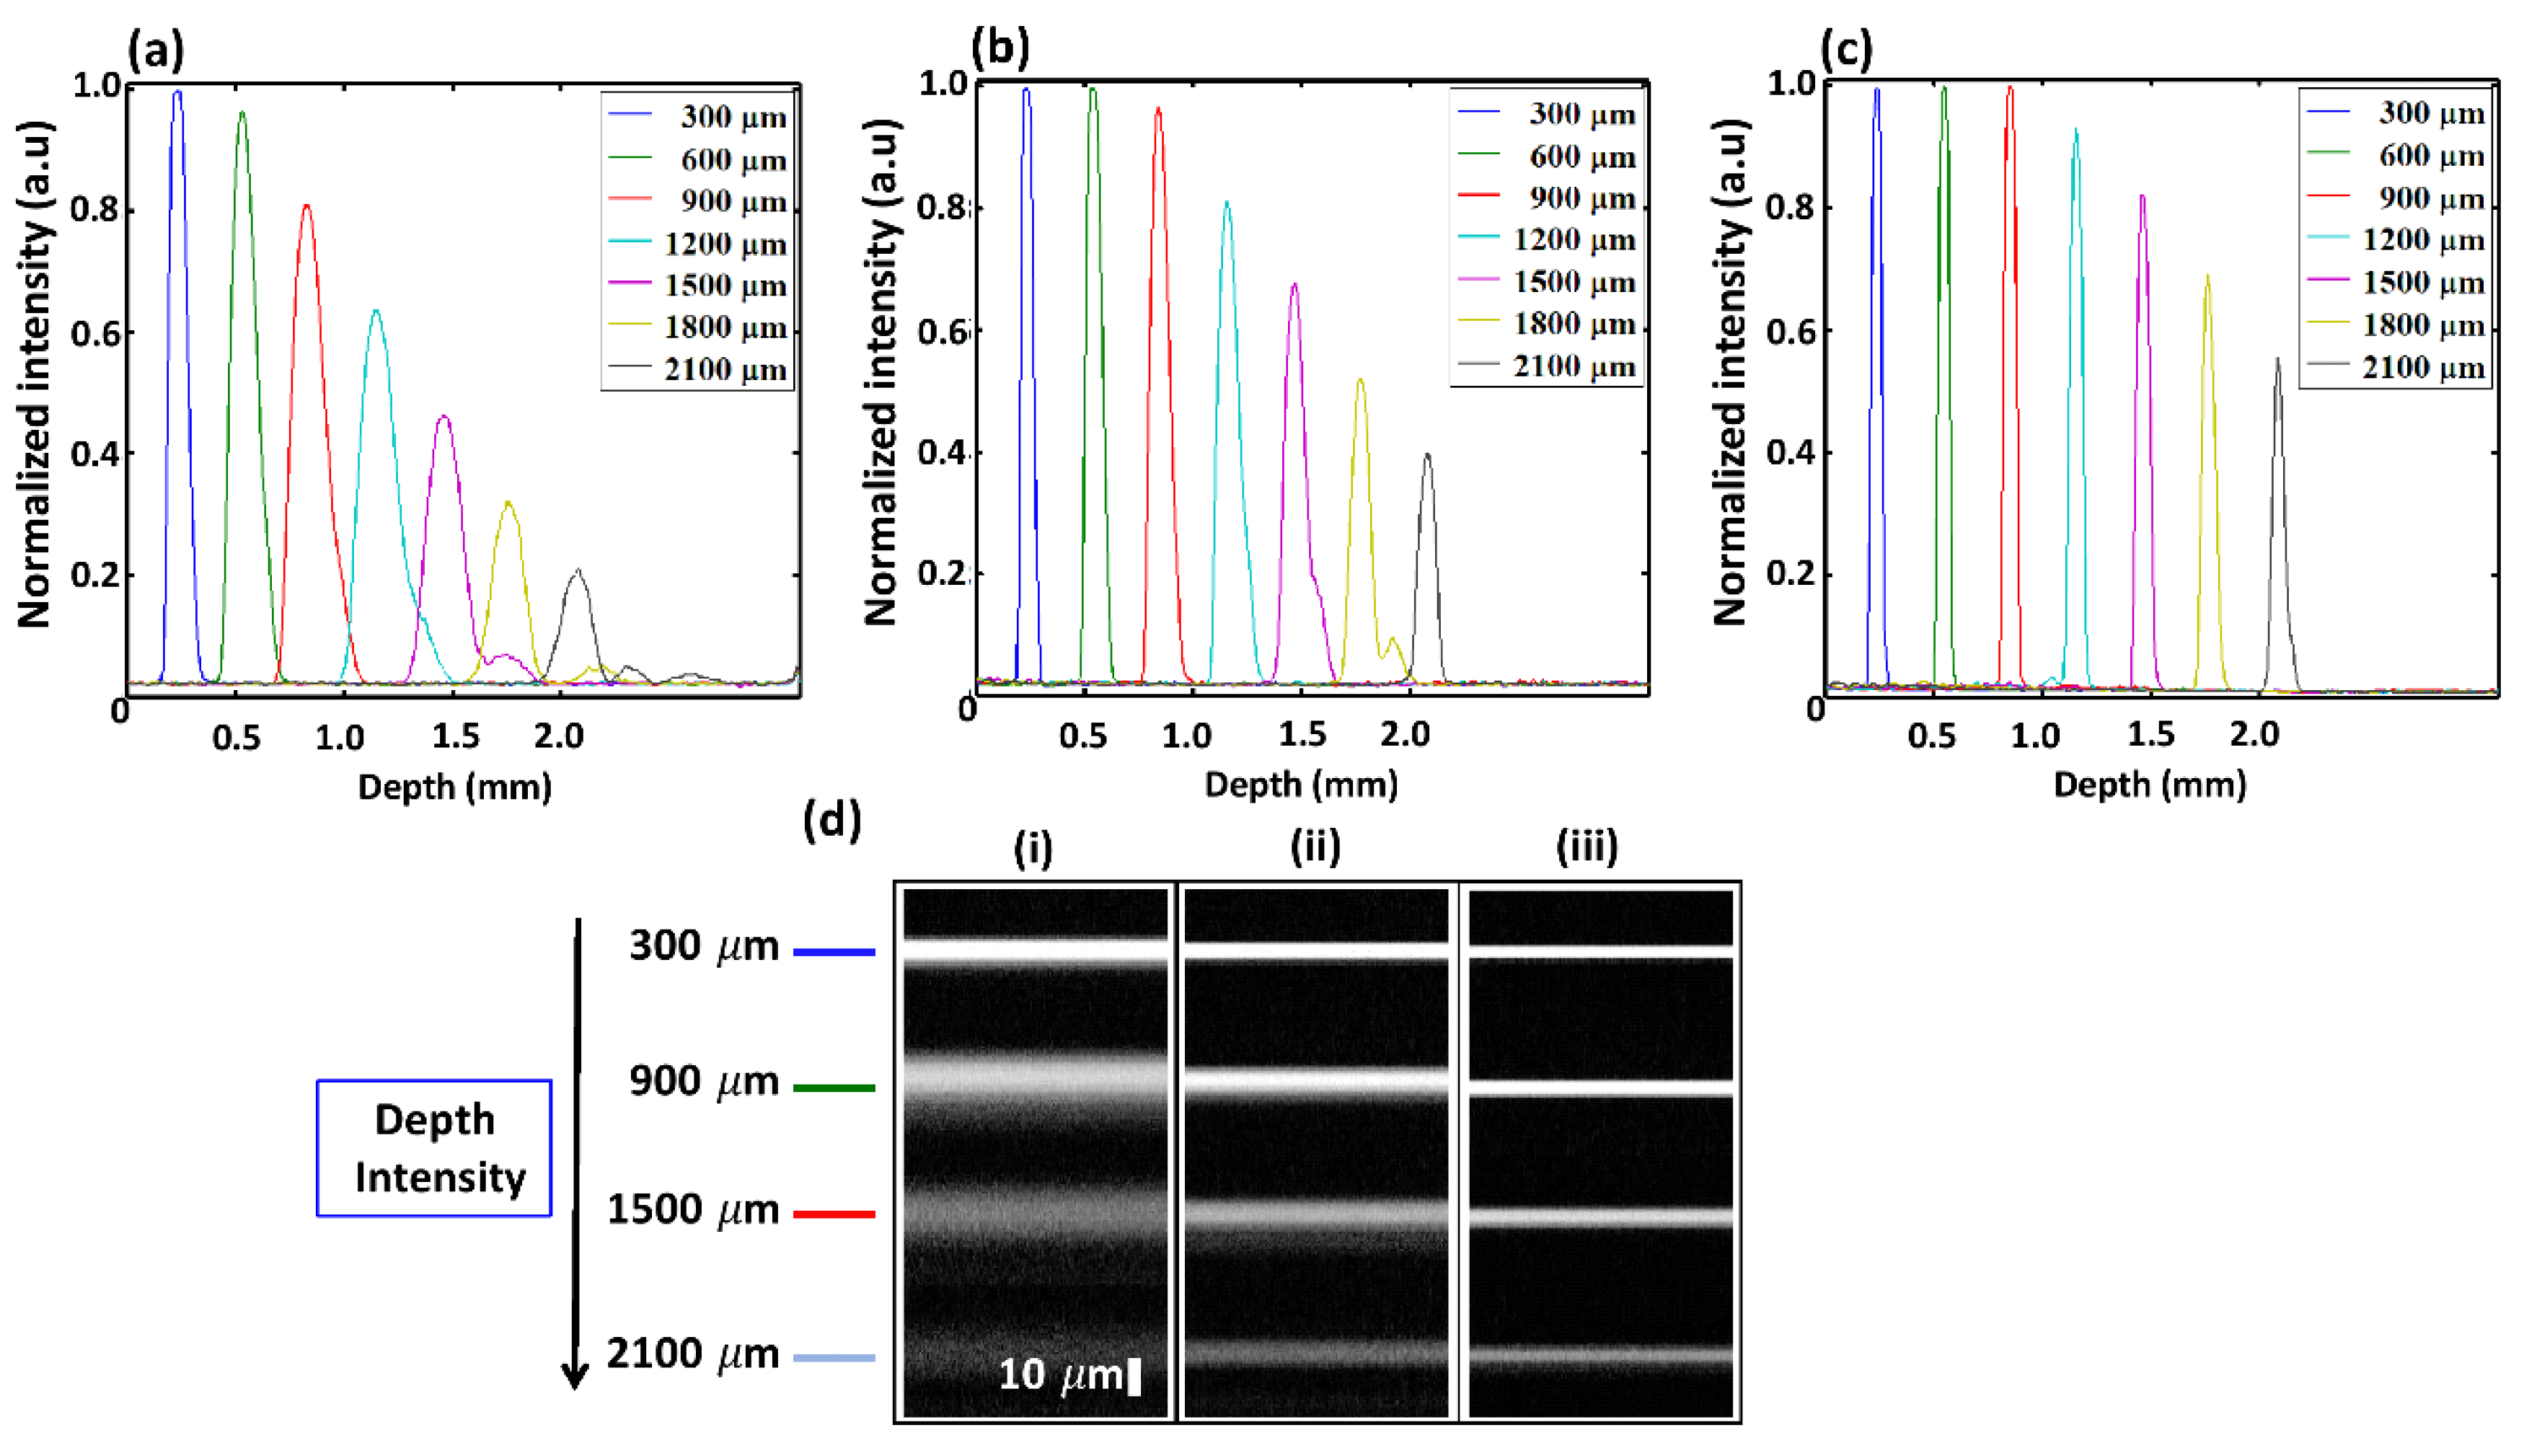
3.1. Experimental Validation of Sensitivity Roll-Off

The frequency domain was traced for seven different optical path differences incremented in steps of 300 μm at each instance up to 2.1 mm to measure PSF. The obtained normalized intensity results of three PSF trials including non-linearized k-domain, wavelength scanning filter based linearized k-domain, and proposed linearization based k-domain are depicted in Figure 3a–c. Since continuous variations of the laser source power were identified, the total output optical power value of the laser was hourly monitored prior to the experiment. The monitored values were measured, summed up, averaged, and normalized to compensate the power fluctuation. The depth-dependent fall-off curve corresponding to the non-linearized k-domain (Figure 3a) exhibits large decay with existence of side lobes when compared against those obtained for the two k-domain linearization techniques (78% normalized intensity fall-off between 0 and 2.1 mm). The maximum fall-off detected from the non-linearized k-domain spectrometer was 0.77 ± 0.05 a.u. at 2.1 mm. Intensity peaks shown in Figure 3b were observed to be much sharper and remain constant with changes in depth in cases corresponding to full-range calibrations. Also, much less decay (nearly 58.1% normalized intensity fall-off between 0 and 2.1 mm and maximum fall-off of 0.57 ± 0.05 a.u. at 2.1 mm) was detected for the case corresponding to the wavelength-scanning-filter-based linearized k-domain spectrometer when compared against the non-linearized k-domain, thereby indicating the reduction in imaging quality with increasing depth. Figure 3c shows the PSF representation obtained using the proposed technique, and it clearly confirms exceptional sharpness of the width of information at each peak without existence of side lobes. Results obtained through use of the proposed technique demonstrated the least decay (nearly 39% normalized intensity fall-off between 0 and 2.1 mm and maximum fall-off of 0.39 ± 0.05 a.u. at 2.1 mm). The above comparison demonstrates that the proposed k-space spectrometer effectively improves signal sensitivity and image contrast in the deeper imaging regions of a SD-OCT system. In addition to the benefit of improved sensitivity fall-off, the proposed k-domain linearization algorithm serves to remove artifacts by eliminating the existence shoulders or side-lobes, which have direct impact on signal-to-noise ratios. Figure 3d depicts the qualitative illustration of acquired PSF values within the range of 0.3 to 2.1 mm. The aforementioned intensity peak sharpness, blurring effect, and existence of side lobes are well-described and qualitatively confirmed by the acquired PSF information.

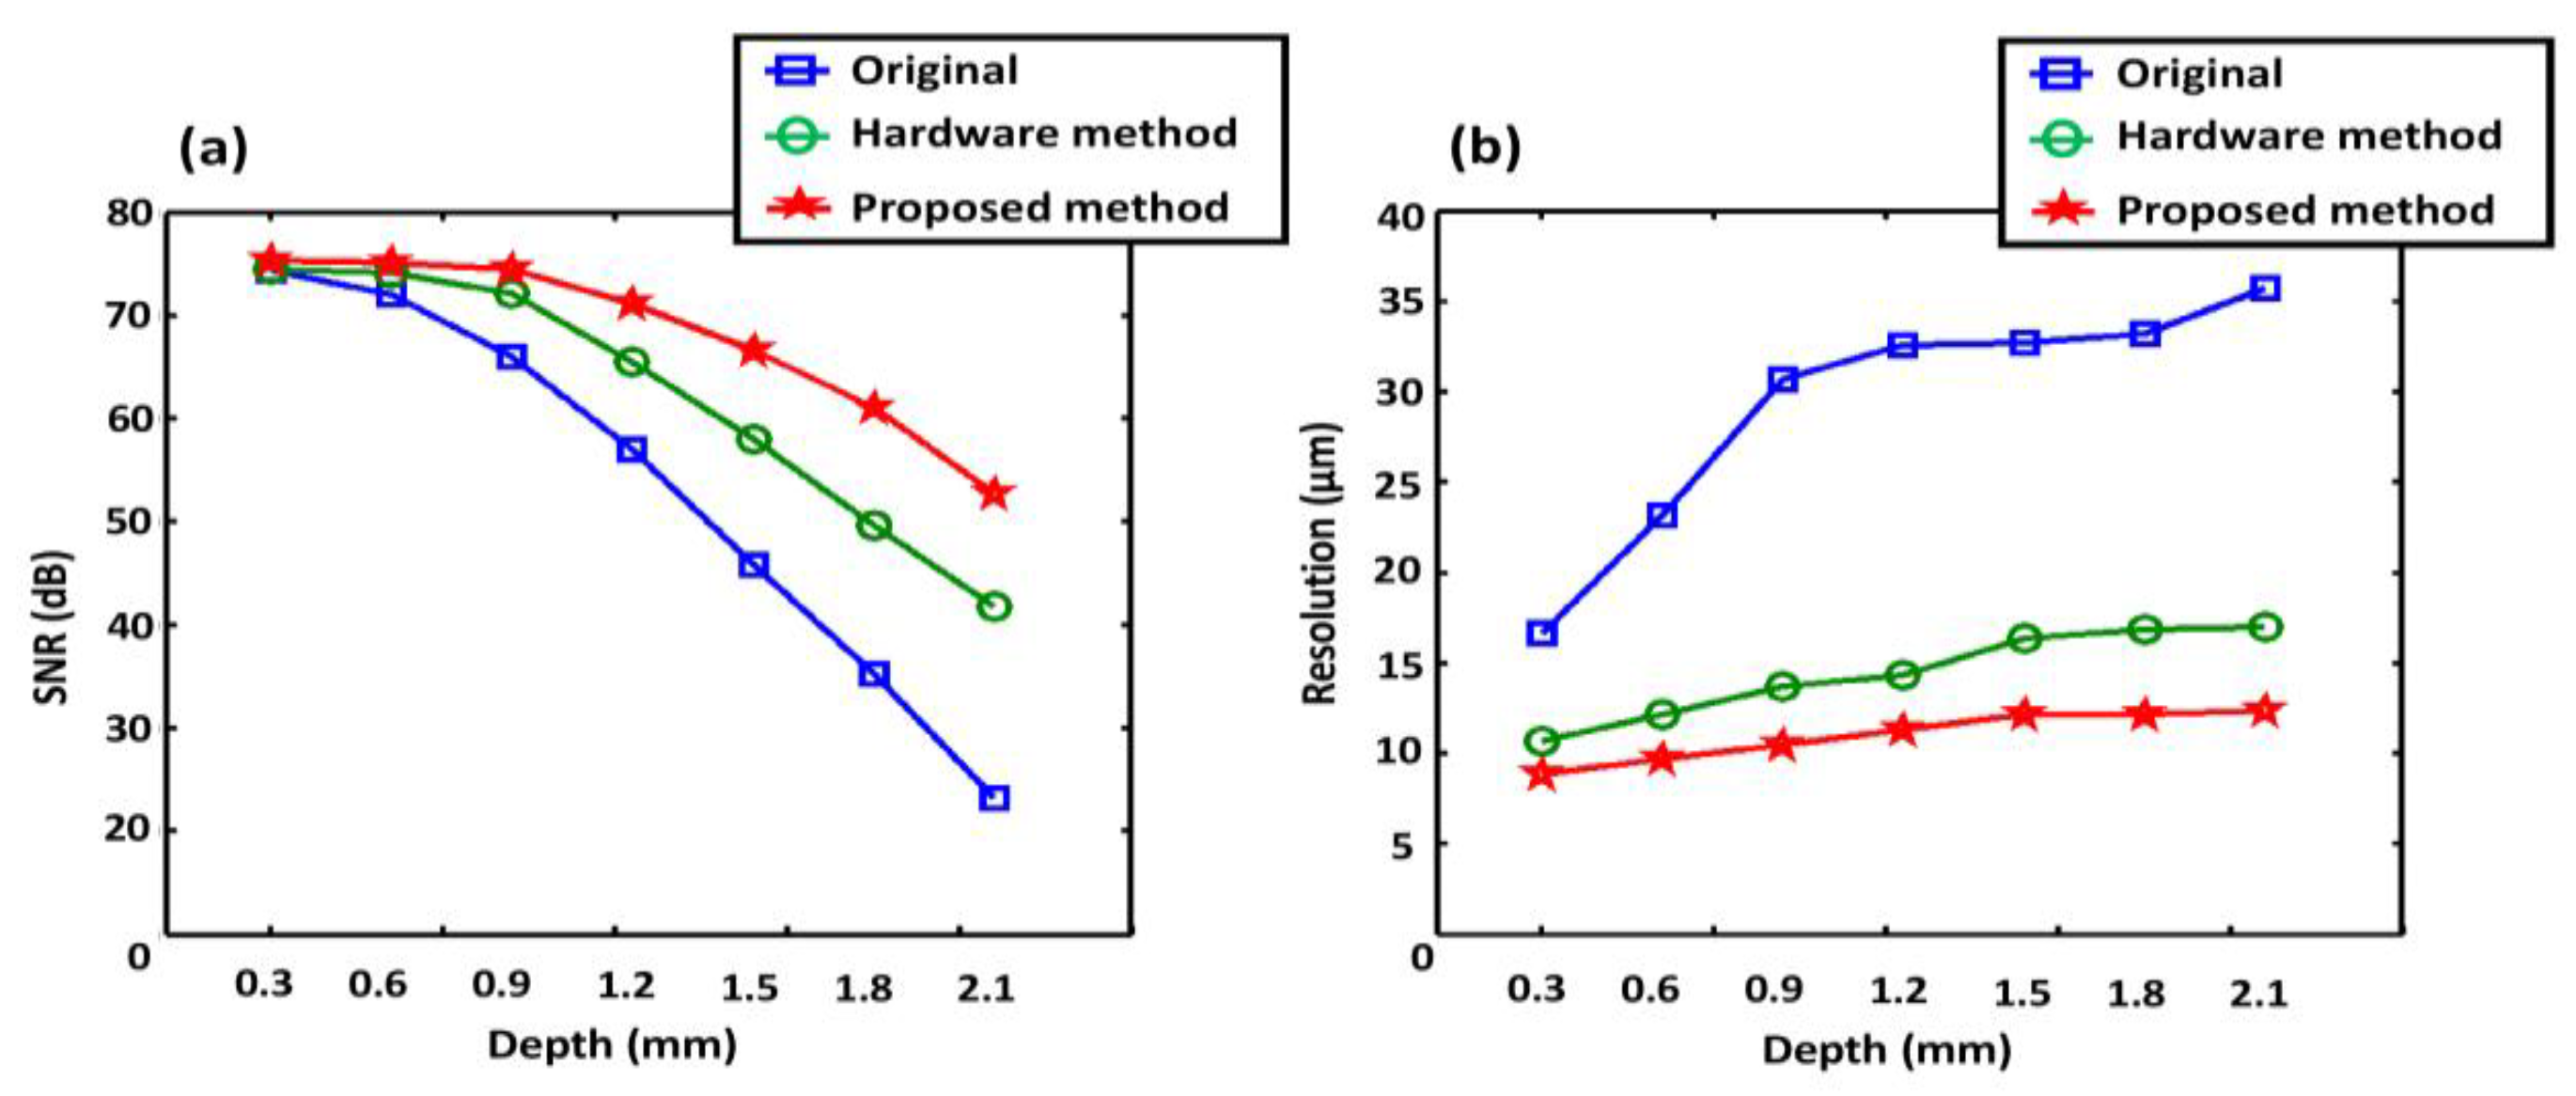
3.2. Evaluation of Depth Dependent Signal-To-Noise Ratio (SNR) and Axial Resolution Comparison

Figure 4a represents a comparison of SNR values obtained using the aforementioned non-linearized k-domain, linearized k-domain employing conventional wavelength scanning filter technique, and linearized k-domain employing the proposed technique. As shown in the Figure 4a, the highest SNR can be obtained at 0.3 mm was the order of 75 dB. The range of SNR values obtained using the proposed technique varies from 75 to 54 dB over a depth range of 0 to 2.1 mm. The SNR value range recorded for the non-linearized k-domain demonstrating an SNR variation between 75 to 22 dB over the aforementioned depth range. Corresponding SNR range obtained using the conventional wavelength scanning filter technique was 75–41 dB over the 0–2.1 mm depth range. It can be noted that a significant sensitivity loss occurs at greater axial depths in the non-linearized k-domain; although depth dependent sensitivity of the conventional calibration technique is higher than non-linearized k-domain state, particular sensitivity loss is occurred compared to the developed direct k-domain calibration method. Since two additional optical devices, such as optical wavelength scanning filter and OSA are involved apart from optical spectrometer, the possible reasons behind this discrepancy of the conventional k-domain linearization method are the calibration inaccuracy of OSA, misalignment of wavelength scanning filter, and the insertion losses of additionally utilized optical fibers. The proposed linearization algorithm demonstrated the minimum fall-off value of 21 dB across the entire depth range, whereas the other two systems suffered 53 dB and 34 dB decrease in sensitivity, thereby confirming the improvement in sensitivity fall-off obtained through use of the proposed algorithm. In a similar manner, comparison of quantitative representations of axial resolutions obtained for the above three cases is depicted in Figure 4b emphasizing a significant enhancement in axial resolution through the use of the proposed technique. Therefore, the proposed technique is capable of performing real-time index regulation to achieve the finest tuning of axial resolution of the OCT image, which potentially benefits for biomedical imaging and visualization of anatomical microstructures.

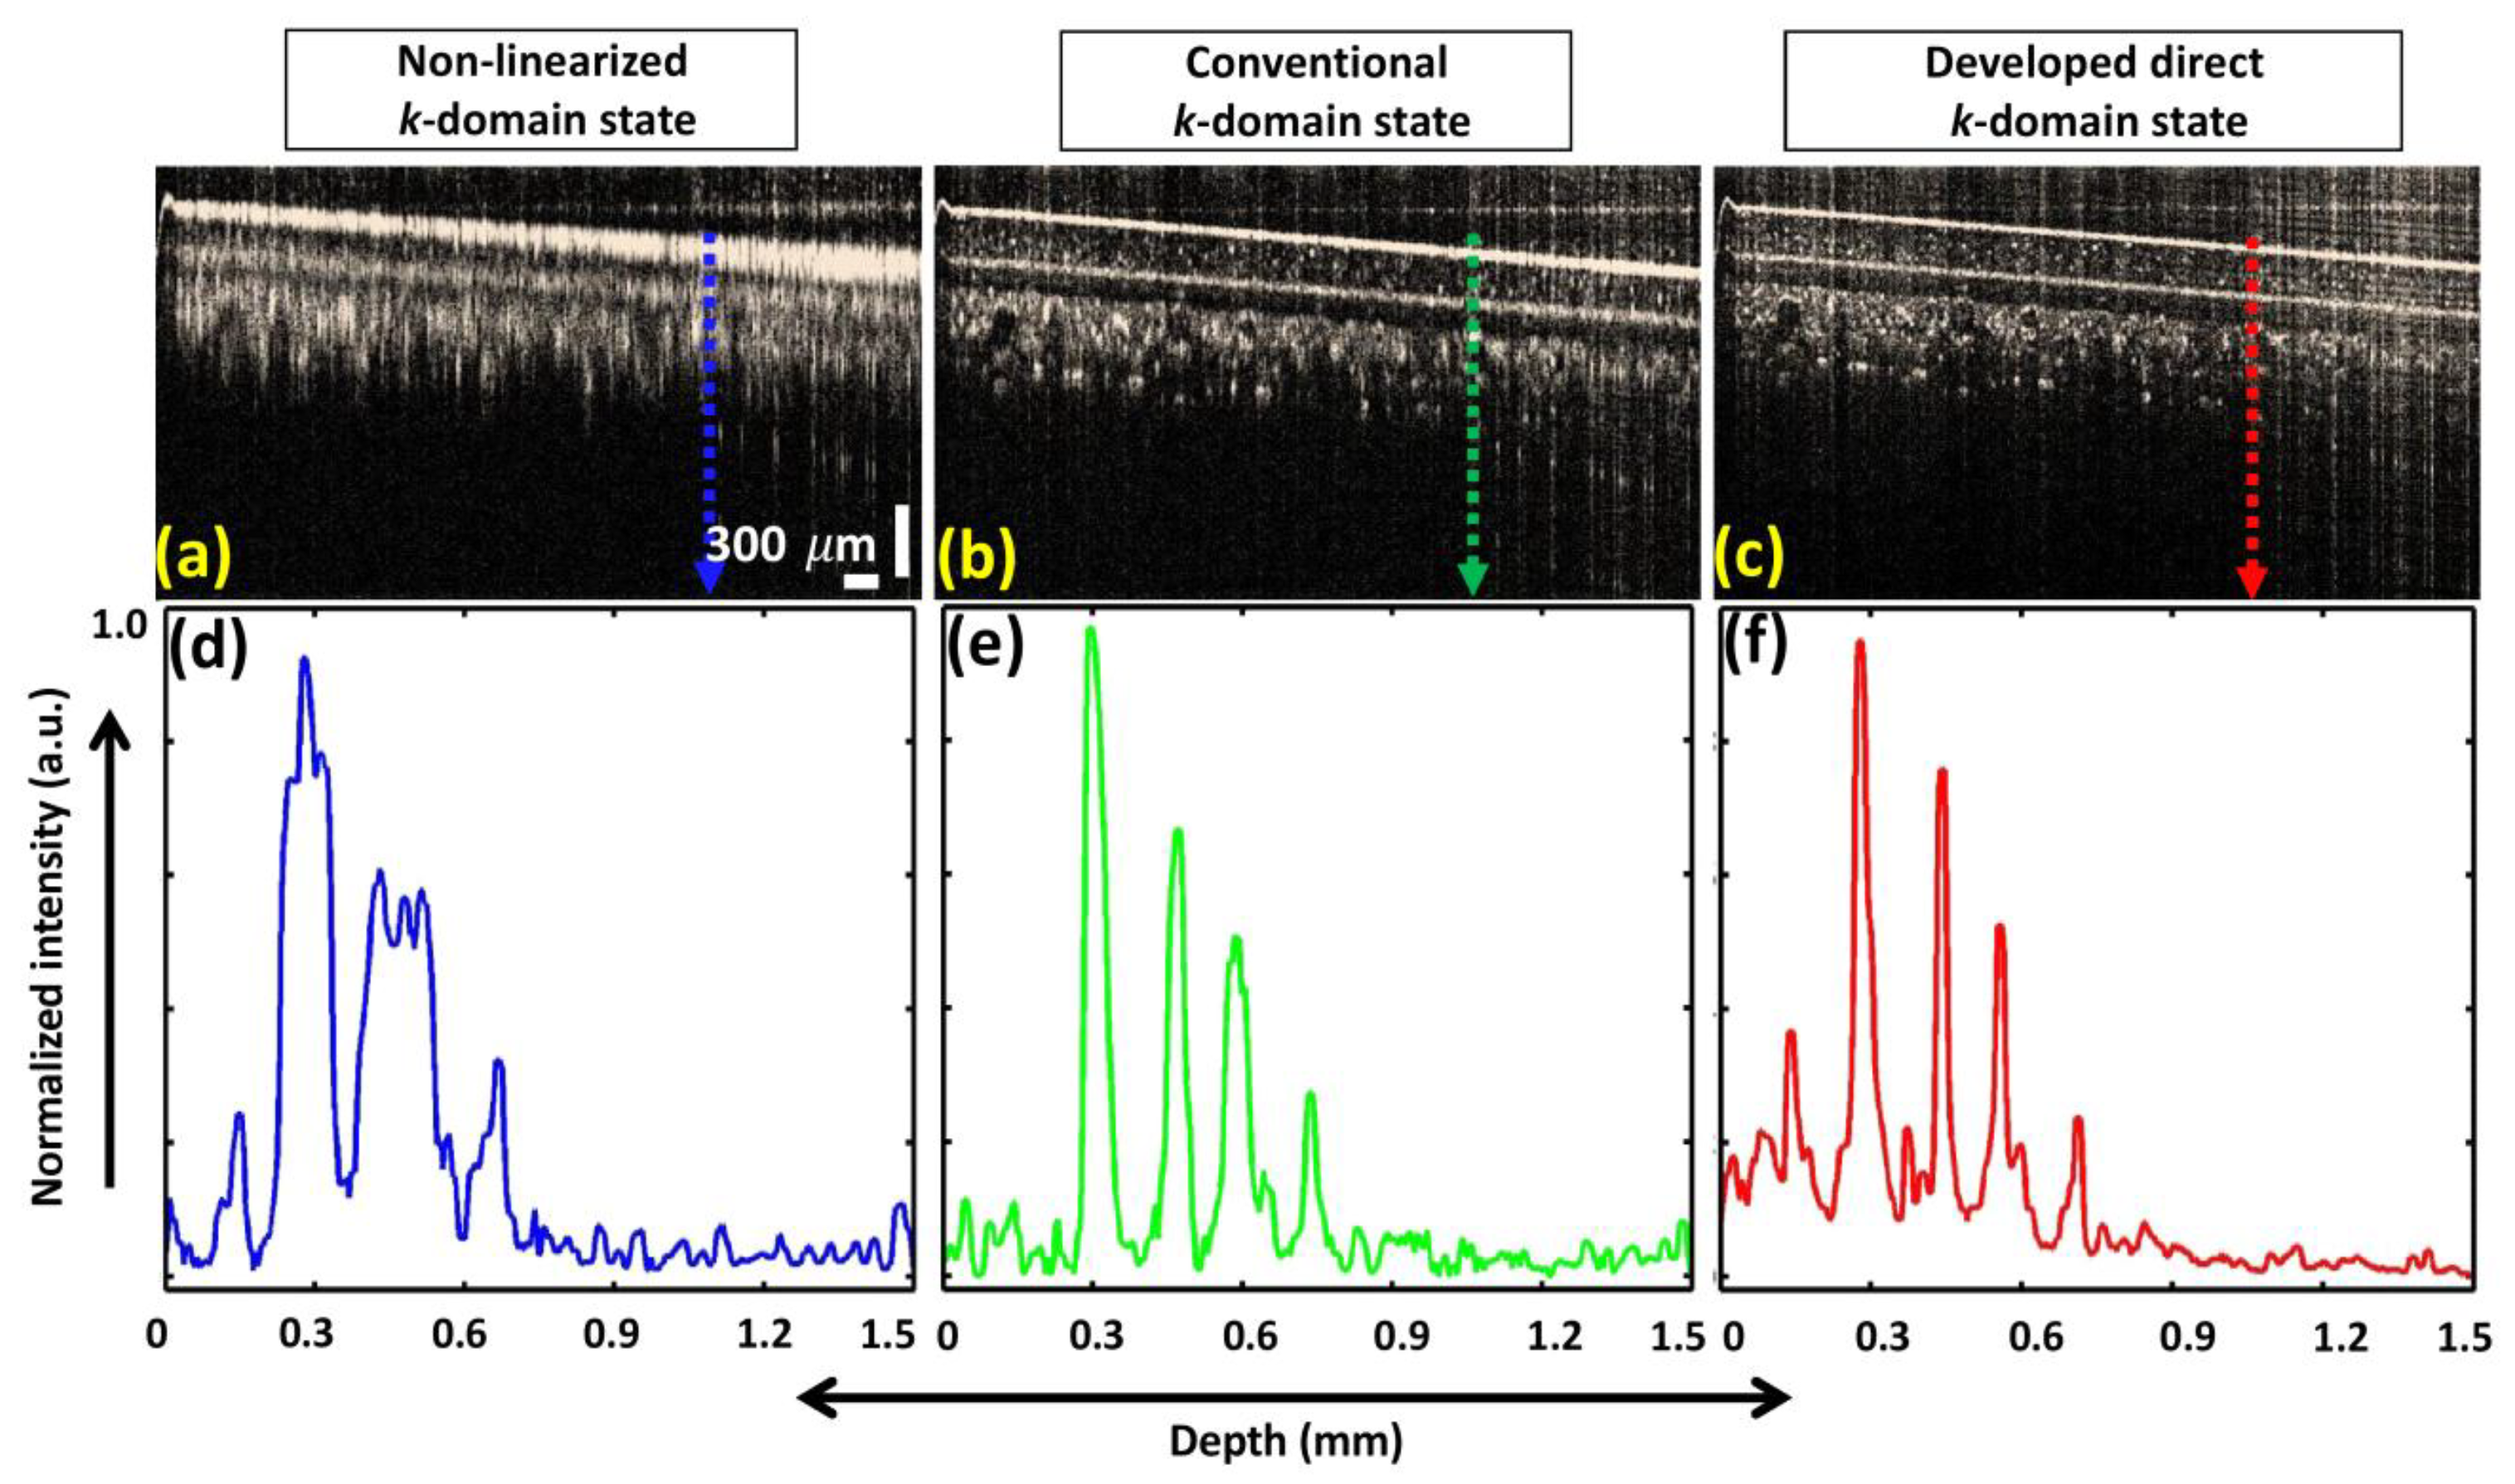
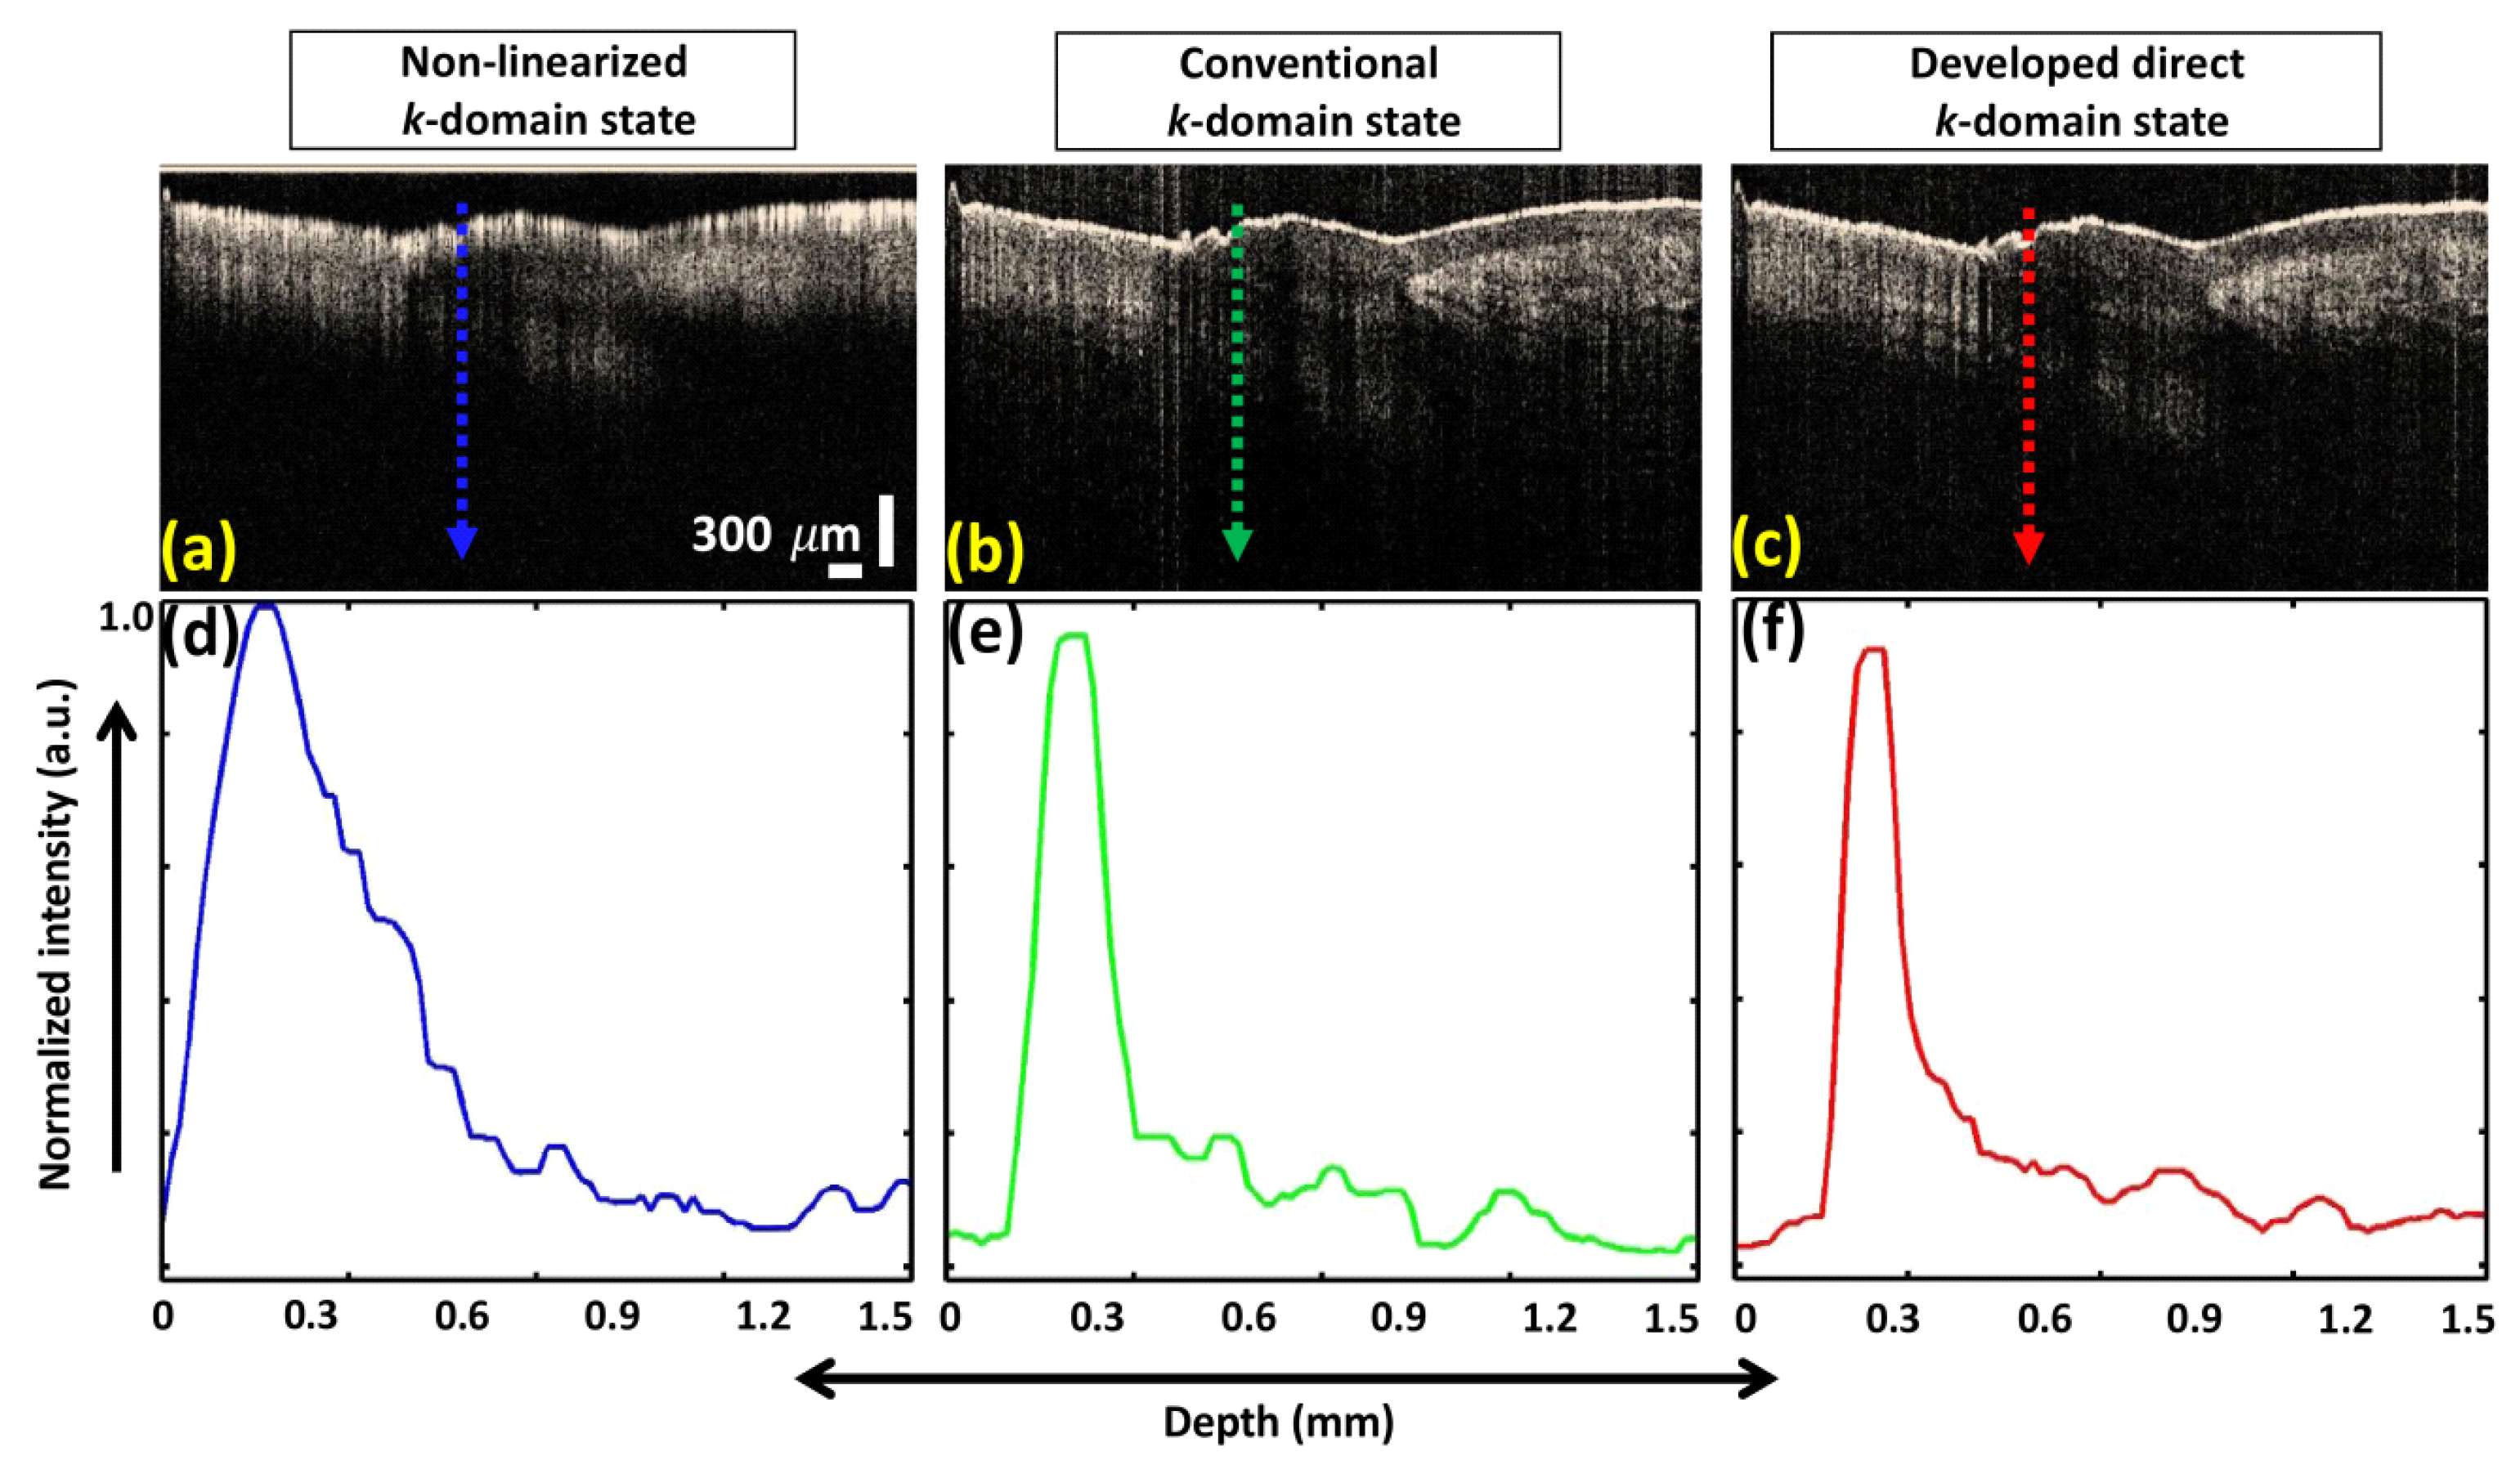
3.3. Image Quality Assessment and Comparison of Non-linearized, Conventional, and Proposed Techniques

Finally, performance of the proposed index-regulating direct k-domain linearization method was demonstrated on an infrared detection card whilst performing in vivo human finger nail imaging. The images were acquired over an integration time of 25 μs, and image acquisition was performed using the customized Labview application (Labview 2017, National Instruments, Austin, TX, USA), wherein all three cases (non-linearized, conventionally linearized, and linearized via proposed techniques) could be rapidly interchanged and visualized in real-time. The emphasized B-mode images corresponded to a static location and were obtained using three different states.
To evaluate our method quantitatively, a depth-profile analysis was performed to obtain quantified OCT signal information about the aforementioned infrared detection card and in vivo human finger nail. In Figure 5a–c, b-mode images were obtained for the non-linearized k-domain state, conventional k-domain linearization state, and lastly using the proposed direct k-domain technique. Figure 5d–f shows the representative normalized depth profile information. The vertical blue, green, and red color dashed arrows of the OCT images illustrate the exact location where the depth profile signals were analyzed. The fundamental algorithm of the utilized depth profile technique was reported in a past work [29]. Continuous depth profile peaks represent the infrared detection card layer information. Both cross-sectional layer information and depth profile intensity peak representations shown in Figure 5a,d appear to be largely blurred due to broad shoulder effects and the existence of side lobes, while Figure 5b,e and Figure 5c,f maintain more detailed structures comparatively. Although attempts at image enhancement were made using both the conventional and proposed techniques, the cross-sections and the corresponding sharp intensity peaks acquired after utilizing the developed direct k-domain technique (Figure 5c,f) confirm the most detailed structures with a greatly improved axial resolution over non-k-domain state and conventional k-domain state. Thus, the thickness of the sharp intensity peaks of the proposed technique (Figure 5f) confirms the sufficient applicability for SD-OCT systems compared to conventional spectral calibration techniques.
The same evaluation process was repeated to analyze the in vivo human finger nail specimen. Figure 6a–c depict two dimensional images, which were obtained at non-linearized k-domain state, conventional k-domain linearization state, and direct k-domain technique. Figure 6d–f show the representative normalized depth profile information. Similar to the previous analysis, vertical blue, green, and red color dashed arrows indicated on cross-sections illustrate the exact location of the depth profile signals, which were precisely chosen to observe and compare detailed morphological differences. As expected based on the previous qualitative and quantitative assessments, similar behavior was identified through acquired results. The intensity peak information detected from direct k-domain linearized results revealed the highest sharpness among all three methods confirming the spectral calibration capability of the developed method. Nevertheless, vertical artifacts can be observed as a result of high back reflection from the structural layers in both Figure 5 and Figure 6, which can be resolved by adjusting the overall optical power of the interferometer. The depth profiles were analyzed after extracting the artifacts of the 2D-OCT images.
Though both techniques adequately achieve k-domain linearization and compensate for the blurring effect, the proposed technique offers further advantages when compared against the conventional technique by successfully facilitating microstructure visualization at a much higher axial resolution by fine tuning the k-domain index in real-time. The obtained qualitative images and illustrations adequately confirm the applicability and positive impact of the proposed linearization technique in biomedical imaging. Moreover, the proposed technique was also demonstrated to be capable of compensating for the unbalanced dispersion of object-inspecting sample and reference arms within the OCT system. Along with accomplishment of k-domain linearization, dispersion compensation was simultaneously achieved via index manipulation through use of no additional computational or numerical algorithms. Although similar optical components were employed in the sample and reference arms, a certain amount of dispersion was required to be compensated for. It was confirmed that index manipulation performed using the proposed technique worked effectively in compensating for the dispersion, thereby facilitating better visualization of microstructures. Therefore, implementation of the proposed technique in ophthalmic applications, such as retinal and corneal inspections, would turn out to be ideal with regard to attainment of near-perfect dispersion compensation without the use of additional complex optical hardware in the reference arm.

4. Conclusions

The proposed study demonstrates the utility of the numerical-sampling-functionalized real-time index regulation technique for direct k-domain calibration to be employed for SD-OCT. The proposed technique is also capable of performing dispersion compensation, which is an additional advantage. The technique works equally well for small amounts of dispersion present over the entire imaging range as well as high dispersions concentrated at a single depth, and may, therefore, become an integral part of future optical coherence microscopy (OCM) systems. The proposed technique makes obsolete the necessity of hardware and/or software recalibration of the optical spectrometer after each successive laser transition, thereby facilitating the realization of real-time linear sampling of k-domain interpolation through index regulation during object inspection. Quantitative results obtained in this study reveal that the proposed technique demonstrates the least sensitivity roll-of decay and achieves the best SNR fall-off (21 dB) over the entire image depth range whilst also achieving higher axial resolution in images when compared against conventional techniques. Therefore, in view of future clinical imaging applications, the calibration method based on the proposed index-regulation technique demonstrates excellent stability and accuracy through use of the aforementioned linearization technique, thereby resulting in extraordinary image visualizations.

Author Contributions

Conceptualization, J.S. and J.K.; Data curation, S.H. and O.K.; Formal analysis, U.J.; Funding acquisition, C.L., M.J., and J.K.; Project administration, M.J.; Software, S.H. and O.K.; Supervision, C.L. and M.J.; Validation, P.K.; Writing—original draft, R.E.W.; Writing—review & editing, R.E.W.

Funding

This research was supported by the National Research Foundation of Korea (NRF) grant funded by the Korea government, MSIT (No. 2018R1A5A1025137), Basic Science Research Program through the NRF funded by the Ministry of Education (No. 2018R1D1A1B07043340). In part this research was also supported by the Bio & Medical Technology Development Program of the NRF funded by the Korean government (MSIP) (No.2017M3A9E2065282), the NRF grant funded by the Korea government (MSIT) (No. 2017R1C1B5018181) and the Pioneer Research Center Program through the NRF of Korea funded by the Ministry of Science, ICT & Future Planning (No. 2015M3C1A3056407).

Conflicts of Interest

The authors declare no conflicts of interest.

References

  1. De Boer, J.F.; Cense, B.; Park, B.H.; Pierce, M.C.; Tearney, G.J.; Bouma, B.E. Improved signal-to-noise ratio in spectral-domain compared with time-domain optical coherence tomography. Opt. Lett. 2003, 28, 2067–2069. [Google Scholar] [CrossRef] [PubMed]
  2. Spaide, R.F.; Koizumi, H.; Pozonni, M.C. Enhanced depth imaging spectral-domain optical coherence tomography. Am. J. Ophthalmol. 2008, 146, 496–500. [Google Scholar] [CrossRef] [PubMed]
  3. Leitgeb, R.; Hitzenberger, C.; Fercher, A.F. Performance of fourier domain vs. Time domain optical coherence tomography. Opt. Express 2003, 11, 889–894. [Google Scholar] [CrossRef] [PubMed]
  4. Fercher, A.F. Optical coherence tomography. J. Biomed. Opt. 1996, 1, 157–174. [Google Scholar] [CrossRef] [PubMed]
  5. Huang, D.; Swanson, E.A.; Lin, C.P.; Schuman, J.S.; Stinson, W.G.; Chang, W.; Hee, M.R.; Flotte, T.; Gregory, K.; Puliafito, C.A. Optical coherence tomography. Science 1991, 254, 1178–1181. [Google Scholar] [CrossRef] [PubMed] [Green Version]
  6. Cense, B.; Nassif, N.A.; Chen, T.C.; Pierce, M.C.; Yun, S.-H.; Park, B.H.; Bouma, B.E.; Tearney, G.J.; de Boer, J.F. Ultrahigh-resolution high-speed retinal imaging using spectral-domain optical coherence tomography. Opt. Express 2004, 12, 2435–2447. [Google Scholar] [CrossRef] [PubMed]
  7. Nassif, N.; Cense, B.; Park, B.; Pierce, M.; Yun, S.; Bouma, B.; Tearney, G.; Chen, T.; De Boer, J. In vivo high-resolution video-rate spectral-domain optical coherence tomography of the human retina and optic nerve. Opt. Express 2004, 12, 367–376. [Google Scholar] [CrossRef] [PubMed] [Green Version]
  8. Wijesinghe, R.E.; Park, K.; Jung, Y.; Kim, P.; Jeon, M.; Kim, J. Industrial resin inspection for display production using automated fluid-inspection based on multimodal optical detection techniques. Opt. Lasers Eng. 2017, 96, 75–82. [Google Scholar] [CrossRef]
  9. Cho, N.H.; Park, K.; Kim, J.-Y.; Jung, Y.; Kim, J. Quantitative assessment of touch-screen panel by nondestructive inspection with three-dimensional real-time display optical coherence tomography. Opt. Lasers Eng. 2015, 68, 50–57. [Google Scholar] [CrossRef]
  10. Wijesinghe, R.E.H.; Lee, S.-Y.; Kim, P.; Jung, H.-Y.; Jeon, M.; Kim, J. Optical sensing method to analyze germination rate of capsicum annum seeds treated with growth-promoting chemical compounds using optical coherence tomography. J. Biomed. Opt. 2017, 22, 091502. [Google Scholar] [CrossRef] [PubMed]
  11. Wijesinghe, R.E.; Lee, S.-Y.; Ravichandran, N.K.; Han, S.; Jeong, H.; Han, Y.; Jung, H.-Y.; Kim, P.; Jeon, M.; Kim, J. Optical coherence tomography-integrated, wearable (backpack-type), compact diagnostic imaging modality for in situ leaf quality assessment. Appl. Opt. 2017, 56, D108–D114. [Google Scholar] [CrossRef] [PubMed]
  12. Lee, C.; Kim, K.; Han, S.; Kim, S.; Lee, J.H.; kyun Kim, H.; Kim, C.; Jung, W.; Kim, J. Stimulated penetrating keratoplasty using real-time virtual intraoperative surgical optical coherence tomography. J. Biomed. Opt. 2014, 19, 030502. [Google Scholar] [CrossRef] [PubMed] [Green Version]
  13. Lee, D.; Lee, C.; Kim, S.; Zhou, Q.; Kim, J.; Kim, C. In vivo near infrared virtual intraoperative surgical photoacoustic optical coherence tomography. Sci. Rep. 2016, 6, 35176. [Google Scholar] [CrossRef] [PubMed]
  14. Hu, Z.; Rollins, A.M. Fourier domain optical coherence tomography with a linear-in-wavenumber spectrometer. Opt. Lett. 2007, 32, 3525–3527. [Google Scholar] [CrossRef] [PubMed]
  15. Wang, K.; Ding, Z. Spectral calibration in spectral domain optical coherence tomography. Chin. Opt. Lett. 2008, 6, 902–904. [Google Scholar] [CrossRef]
  16. Gelikonov, V.; Gelikonov, G.; Shilyagin, P. Linear-wavenumber spectrometer for high-speed spectral-domain optical coherence tomography. Opt. Spectrosc. 2009, 106, 459–465. [Google Scholar] [CrossRef]
  17. Ke, J.; Lam, E.Y. Image reconstruction from nonuniformly spaced samples in spectral-domain optical coherence tomography. Biomed. Opt. Express 2012, 3, 741–752. [Google Scholar] [CrossRef] [PubMed] [Green Version]
  18. Van der Jeught, S.; Bradu, A.; Podoleanu, A.G. Real-time resampling in fourier domain optical coherence tomography using a graphics processing unit. J. Biomed. Opt. 2010, 15, 030511. [Google Scholar] [CrossRef] [PubMed]
  19. Chan, K.K.; Tang, S. High-speed spectral domain optical coherence tomography using non-uniform fast fourier transform. Biomed. Opt. Express 2010, 1, 1309–1319. [Google Scholar] [CrossRef] [PubMed]
  20. Zhang, N.; Huo, T.; Wang, C.; Chen, T.; Zheng, J.-G.; Xue, P. Compressed sensing with linear-in-wavenumber sampling in spectral-domain optical coherence tomography. Opt. Lett. 2012, 37, 3075–3077. [Google Scholar] [CrossRef] [PubMed]
  21. Xu, D.; Huang, Y.; Kang, J.U. Compressive sensing with dispersion compensation on non-linear wavenumber sampled spectral domain optical coherence tomography. Biomed. Opt. Express 2013, 4, 1519–1532. [Google Scholar] [CrossRef] [PubMed]
  22. Lan, G.; Li, G. Design of a k-space spectrometer for ultra-broad waveband spectral domain optical coherence tomography. Sci. Rep. 2017, 7, 42353. [Google Scholar] [CrossRef] [PubMed] [Green Version]
  23. Hagen, N.; Tkaczyk, T.S. Compound prism design principles, iii: Linear-in-wavenumber and optical coherence tomography prisms. Appl. Opt. 2011, 50, 5023–5030. [Google Scholar] [CrossRef] [PubMed]
  24. Kwon, O.-J.; Kim, S.; Yoon, M.-S.; Han, Y.-G. All-fiber spectral-domain optical coherence tomography with high resolution by using a pcf-based broadband coupler and a k-domain linearization method. J. Korean Phys. Soc. 2012, 61, 1485–1489. [Google Scholar] [CrossRef]
  25. Jeon, M.; Kim, J.; Jung, U.; Lee, C.; Jung, W.; Boppart, S.A. Full-range k-domain linearization in spectral-domain optical coherence tomography. Appl. Opt. 2011, 50, 1158–1163. [Google Scholar] [CrossRef] [PubMed]
  26. Leitgeb, R.; Drexler, W.; Unterhuber, A.; Hermann, B.; Bajraszewski, T.; Le, T.; Stingl, A.; Fercher, A. Ultrahigh resolution fourier domain optical coherence tomography. Opt. Express 2004, 12, 2156–2165. [Google Scholar] [CrossRef] [PubMed]
  27. Kraus, M.F.; Potsaid, B.; Mayer, M.A.; Bock, R.; Baumann, B.; Liu, J.J.; Hornegger, J.; Fujimoto, J.G. Motion correction in optical coherence tomography volumes on a per a-scan basis using orthogonal scan patterns. Biomed. Opt. Express 2012, 3, 1182–1199. [Google Scholar] [CrossRef] [PubMed]
  28. Vergnole, S.; Lévesque, D.; Lamouche, G. Experimental validation of an optimized signal processing method to handle non-linearity in swept-source optical coherence tomography. Opt. Express 2010, 18, 10446–10461. [Google Scholar] [CrossRef] [PubMed]
  29. Wijesinghe, R.E.; Cho, N.H.; Park, K.; Jeon, M.; Kim, J. Bio-photonic detection and quantitative evaluation method for the progression of dental caries using optical frequency-domain imaging method. Sensors 2016, 16, 2076. [Google Scholar] [CrossRef] [PubMed]
Figure 1. Proposed spectral domain optical coherence tomography (SD-OCT) system along with the broadband laser spectrum. (BLS: broadband laser source; C: collimator; DG: diffraction grating; FC: fiber coupler; FL: focusing lens; GS: galvanometer scanners; LSC: line scan camera; M: mirror; S: sample).
Electronics 07 00182 g001
Figure 2. (a) Schematic of OCT-hybrid wavelength scanning filter. (b) Architecture of the proposed direct real-time k-domain modeling algorithm. (BLS: broadband laser source; C: collimator; CIR: circulator; DG: diffraction grating; FC: fiber coupler; FL: focusing lens; GS: galvanometer scanners; LSC: line-scan camera; M: mirror; OSA: optical spectrum analyzer; S: sample; TS: translation slit).
Electronics 07 00182 g002
Figure 3. (a) Sensitivity roll-off comparison between non-linearized k-domain, (b) linearized k-domain employing conventional wavelength scanning filter technique, and (c) linearized k-domain employing proposed linearization technique. (d) Qualitative illustration of the acquired point spread function (PSF) using the three different techniques.
Electronics 07 00182 g003
Figure 4. (a) SNR comparison between non-linearized k-domain, linearized k-domain using conventional technique, and linearized k-domain using proposed technique. (b) Comparison between quantitative representations of axial resolutions obtained in the above three cases.
Electronics 07 00182 g004
Figure 5. Cross-sectional and quantitative representations of infrared detection card at non-linearized k-domain state (a,d), conventional k-domain linearization state (b,e), and proposed direct k-domain state (c,f).
Electronics 07 00182 g005
Figure 6. Cross-sectional and quantitative representations of in vivo human finger nail specimen at non-linearized k-domain state (a,d), conventional k-domain linearization state (b,e), and proposed direct k-domain state (c,f).
Electronics 07 00182 g006

