Article

Detection and Frequency Estimation of Frequency Hopping Spread Spectrum Signals Based on Channelized Modulated Wideband Converters

College of Electronic Science, National University of Defense Technology, Changsha 410073, China
*
Author to whom correspondence should be addressed.
Electronics 2018, 7(9), 170; https://doi.org/10.3390/electronics7090170
Submission received: 6 August 2018 / Revised: 24 August 2018 / Accepted: 27 August 2018 / Published: 30 August 2018

Abstract

:
It is challenging to detect and track frequency hopping spread spectrum (FHSS) signals due to their wideband frequencies and the limitations of current hardware. In the implementation, there has been a trend of conducting compressive sensing for blind signal processing of FHSS signals. The modulated wideband converter (MWC) is a type of sub-Nyquist sampling system, which accomplishes the recovery of highly accurate broadband sparse signals by multichannel sub-Nyquist sampling sequences. However, it is difficult to adjust MWC to FHSS signals, because the support set and sparsity change with the hop. In this paper, we propose a channelized MWC scheme in order to solve these problems. First, the proposed method distributes the sub-bands to different channels. We can derive and refresh the frequency support set rapidly without recovery. Secondly, by reconstructing the low-pass filter and decimation, we reduced the computational cost to 1/m as the traditional m-channel MWC scheme, where m is the number of channels. Moreover, we propose a series of strategies to estimate carrier frequency. The numerical simulations show that our method can detect the channel, which contains FHSS signals in the case of a low signal-to-noise ratio. Furthermore, the estimation method leads to the successful estimation of the FHSS carrier frequency. This indicates that our method is also effective in the broadband non-cooperative spectrum sensing.

Graphical Abstract

1. Introduction

Due to its advantages, such as its strong anti-interference ability, good security and convenience for networking, the frequency hopping (FH) system has been applied not only in military communication, but also in civilian mobile communication [1]. In communication countermeasures, the advantages of the FH system are based on its wide bandwidth, randomness and paroxysms, which result in challenges to the blind reconnaissance and blind interference. Nowadays, great attention is put on the detection and parameter estimation of frequency hopping spread spectrum (FHSS) signals. There are many novel detection methods for FHSS signals. For instance, time-frequency analysis and wavelet analysis are applied in the time–frequency domain for detection of FHSS signals [2,3,4,5,6]. These methods take advantage of the sparsity of two-dimensional distribution. In [2], the non-cooperative FH signal detection based on the rearrangement algorithm of the Morlet wavelet scale spectrum are discussed to improve the time–frequency aggregation performance. In [3], an adaptive time–frequency local threshold, power-detection and time-statistic are used to remove the influence caused by the interferences and realize the blind detection of FH signals in the intricate electromagnetic environment. The approach of algorithms in [3,4,5] is short time Fourier transform (STFT) or Wigner–Ville distribution. In [6], a method using discrete stationery wavelet filter banks is proposed for detection. Although these methods are intuitive for processing, they suffer from enormous computing in practice. As a result, the computational complexity may exceed the capability of the hardware. Since FHSS signals hop over large frequency ranges, some studies have used channelized receivers for detection [7,8,9], in which a digital filter bank is used to detect energy in each channel. The performance of a channelized receiver in detecting a frequency hopping signal is analyzed [7], in which the number of parallel radiometers can be reduced when the signal-to-noise ratio (SNR) is relatively high. The frequency channelized receiver based on hybrid filter bank is a promising receiver structure for ultra-wideband radio because of its relaxed circuit requirements and robustness to interference [8]. In [8], the adaptive performance of the proposed channelized receiver to different propagation channels is similar to that of an ideal full band receiver. Furthermore, a detection method for the frequency channelized receiver when input noise is colored in ultra-wideband systems is proposed. The proposed receiver significantly outperforms the full band receiver. However, the FHSS signals should be sampled at a high enough rate to capture the full FHSS bandwidth in these receivers. This requires analog-to-digital converters (ADC) with a very high rate. The sweeping spectrum analyzer (SSA) is another method to detect energy over a large frequency range [10,11]. It can scan bands over the whole frequency for a certain period of time. However, if the scanning rate of the SSA is not high enough, there is a risk that the hopping signal might be missed. Briefly, conventional detectors cannot cover such a large bandwidth, since the FHSS signal is a non-stationary signal. Furthermore, time-varying and the sampling rates of ADC can be relatively high, which satisfies the Nyquist theorem. This requires a considerable amount of computations for further digital processing, especially when the communication is the form of non-cooperation.
A theory of compressive sampling (CS) has emerged for wideband sparse signals, such as FHSS signals. This exploits the sparsity and compression prior to performing signal recovery using fewer measurements than the number required by the Nyquist theorem. According to CS, we can obtain only a small amount of observation data through the inner-product operations. If these data conform to the restricted isometry property (RIP) principle, the original signals can be recovered perfectly with an overwhelmingly high probability. Some methods have been presented to apply this theory in practice, such as the Random Demodulation (RD) method [12,13], Multi-coset method [14], Modulated Wideband Converter (MWC) [15,16,17,18,19] and so on. Since the FHSS signals are obviously sparse in the time–frequency domain, using the CS theory for the recovery, estimation and detection of FHSS signals is a hot spot of recent research. In [20], Yidong Zhang focused on studying of the digital domain compressive sampling and reconstruction algorithm of FHSS signals by using the basic principles and methods of compressed sensing. In [21], Binwu Li proposed a novel adaptive synchronous estimation method of hopping frequency for FHSS signals without reconstructing the original signal. Several methods for compressive detection were proposed, which assume that the signal can be sparsely represented in the known dictionaries [22,23]. Some other methods take advantage of the CS theory for further processing of FHSS signals [24,25,26,27]. However, the major difficulties in using the CS theory for processing of FHSS signals are described as follows:
  • The support set of FHSS signals changes rapidly, which has critical real-time requirement.
  • There are significant performance penalties under a low SNR.
In [28], compressive detection strategies that sample the full FHSS spectrum in a compressive manner are proposed. This focuses on the use of random measurement kernels and specifically designed measurement kernels in the proposed architecture. However, the parameters of FHSS signals are not taken into consideration, which is important for further processing. In this paper, we propose methods for the detection of FHSS signals using MWC, which is based on channelization and energy detection. Our methods amplify the signals in the frequency domain and do not require an intermediate step of signal recovery. The proposed channelized MWC scheme has advantages in processing FHSS signals, such as the clear division of sub-bands, ease of implementation using existing devices and flexible structure. Furthermore, we improved the structure of MWC to reduce the computational cost and estimate the carrier frequency of FHSS signals. Although the analysis in this work focuses on the single-target FHSS signal detection, the extension of this framework to a multi-target setting is also possible.
The rest of this paper is organized as follows. In Section 2, we provide the basic information related to FHSS Signals. We present the detailed design of the channelized MWC method and further improve it in Section 3. The effect of some parameter settings and simulation results are given in Section 4 and we conclude our paper in Section 5.

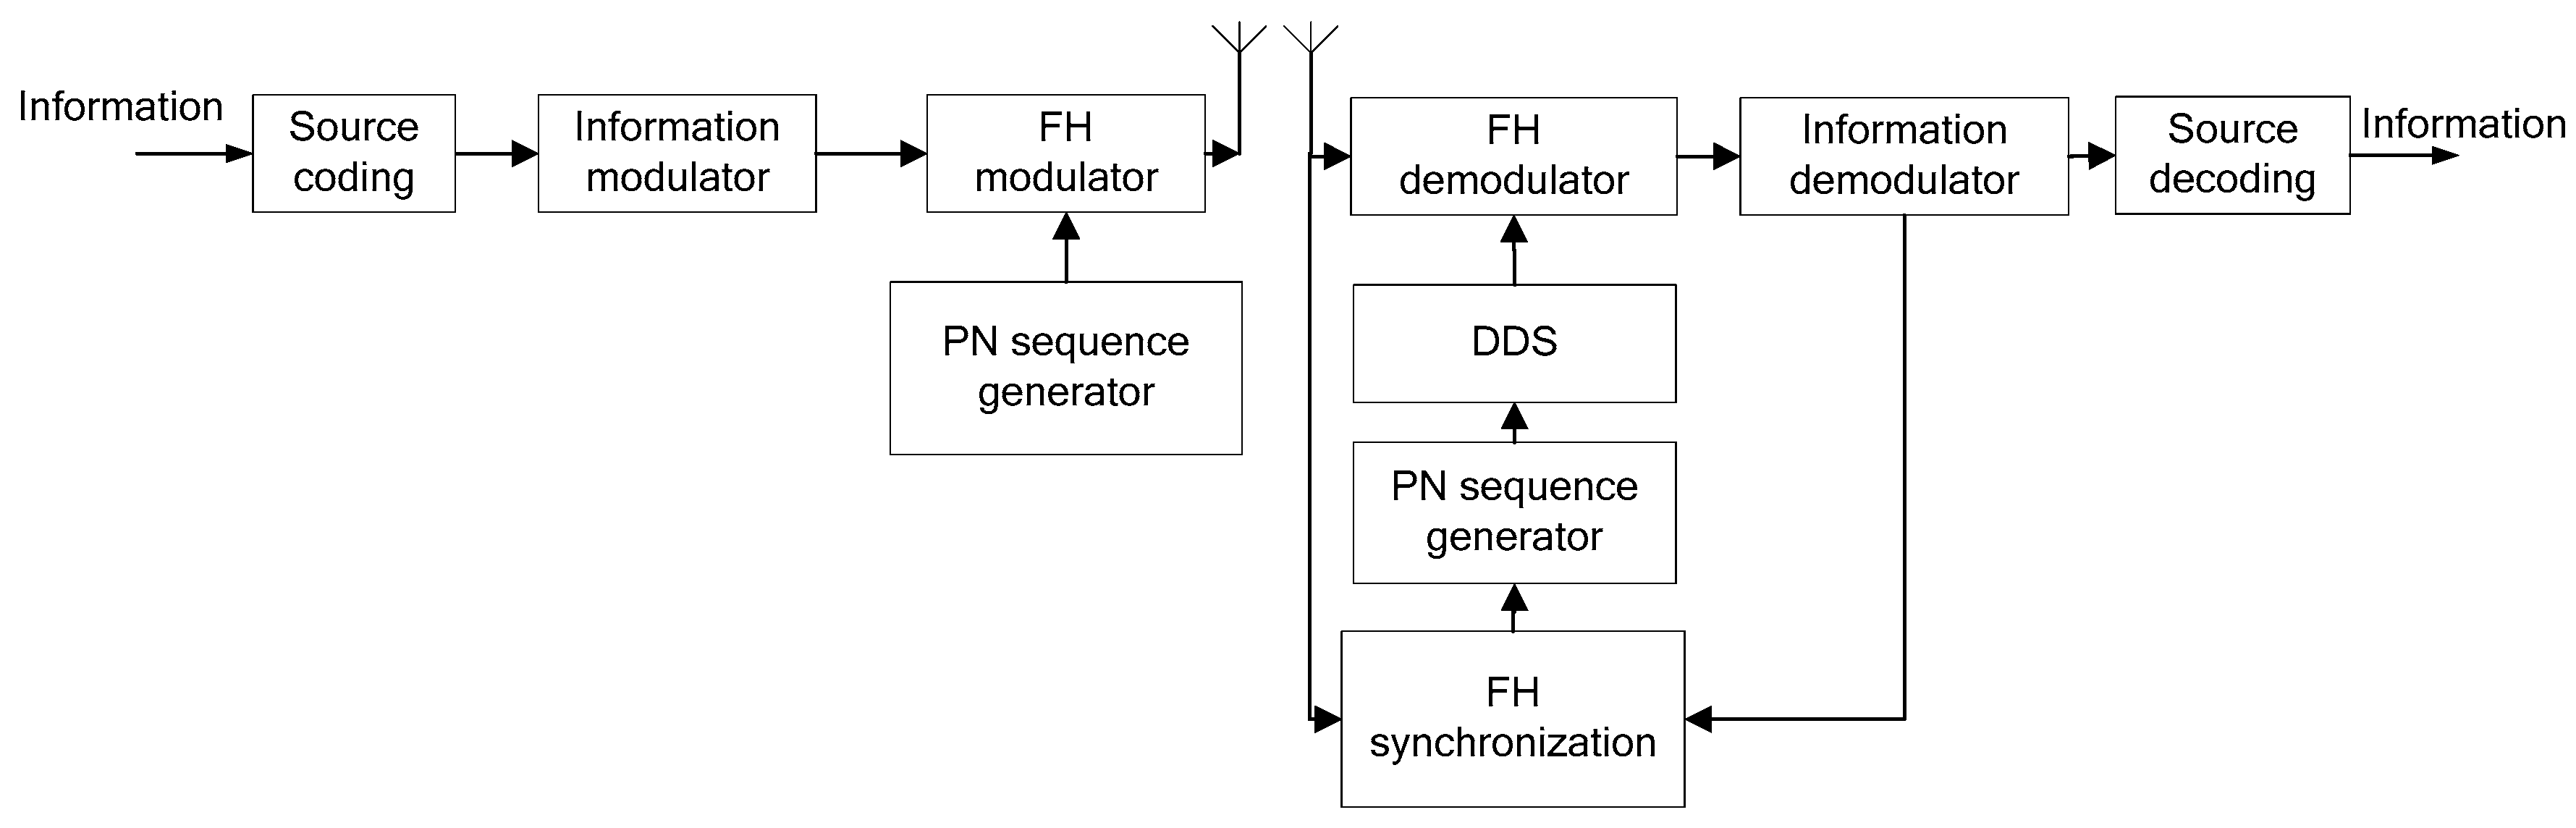
2. Fundamental of FHSS Signals

Traditional Structure of FH System

Figure 1 shows the traditional structure of the FH system.
The transmitter can encode the information before sending it to the information modulator. The PN sequence generator controls the FH modulator for each hop. The generator in the cooperation receiver, which is the same generator as that used in the transmitter, controls the direct digital frequency synthesizer (DDS) for the FHSS demodulator. In general, the interactions between the FH synchronization and information demodulator allow for FH tracking during the normal information collection phase. Assuming that there are L h hops during Δ t , with the first and last hops being partial and K hops in the middle being complete, the received clean signal can be expressed as:
x n ( t ) = α n ( t ) × { exp [ j ( ω n 0   t + j n 0 ) ] r e c t ( t Δ t n 0 ) + k = 1 K exp [ j ( ω n k + j n k ) ] r e c t ( t ( k 1 ) T H n Δ t n 0 T H n ) exp [ j ( ω n L h + j n L h ) ] r e c t ( t K T H n Δ t n 0 Δ t n 0 ) }
where T H n is the hop duration, α n ( t ) is the baseband complex envelope; ω n k is the carrier frequency; ϕ n k is the initial phase of kth hop and r e c t ( · ) is a rectangle window function.
During the blind processing of FHSS signals, the non-cooperation receiver does not have the generator and cannot get the frequency hopping pattern, this non-cooperation receiver includes detecting signals, estimating parameters, separating mixed signals and so on. The purpose of the non-cooperation receiver in this paper is to detect and follow the carrier frequency of FHSS signals from the estimation of ω n k under sub-Nyquist sampling.

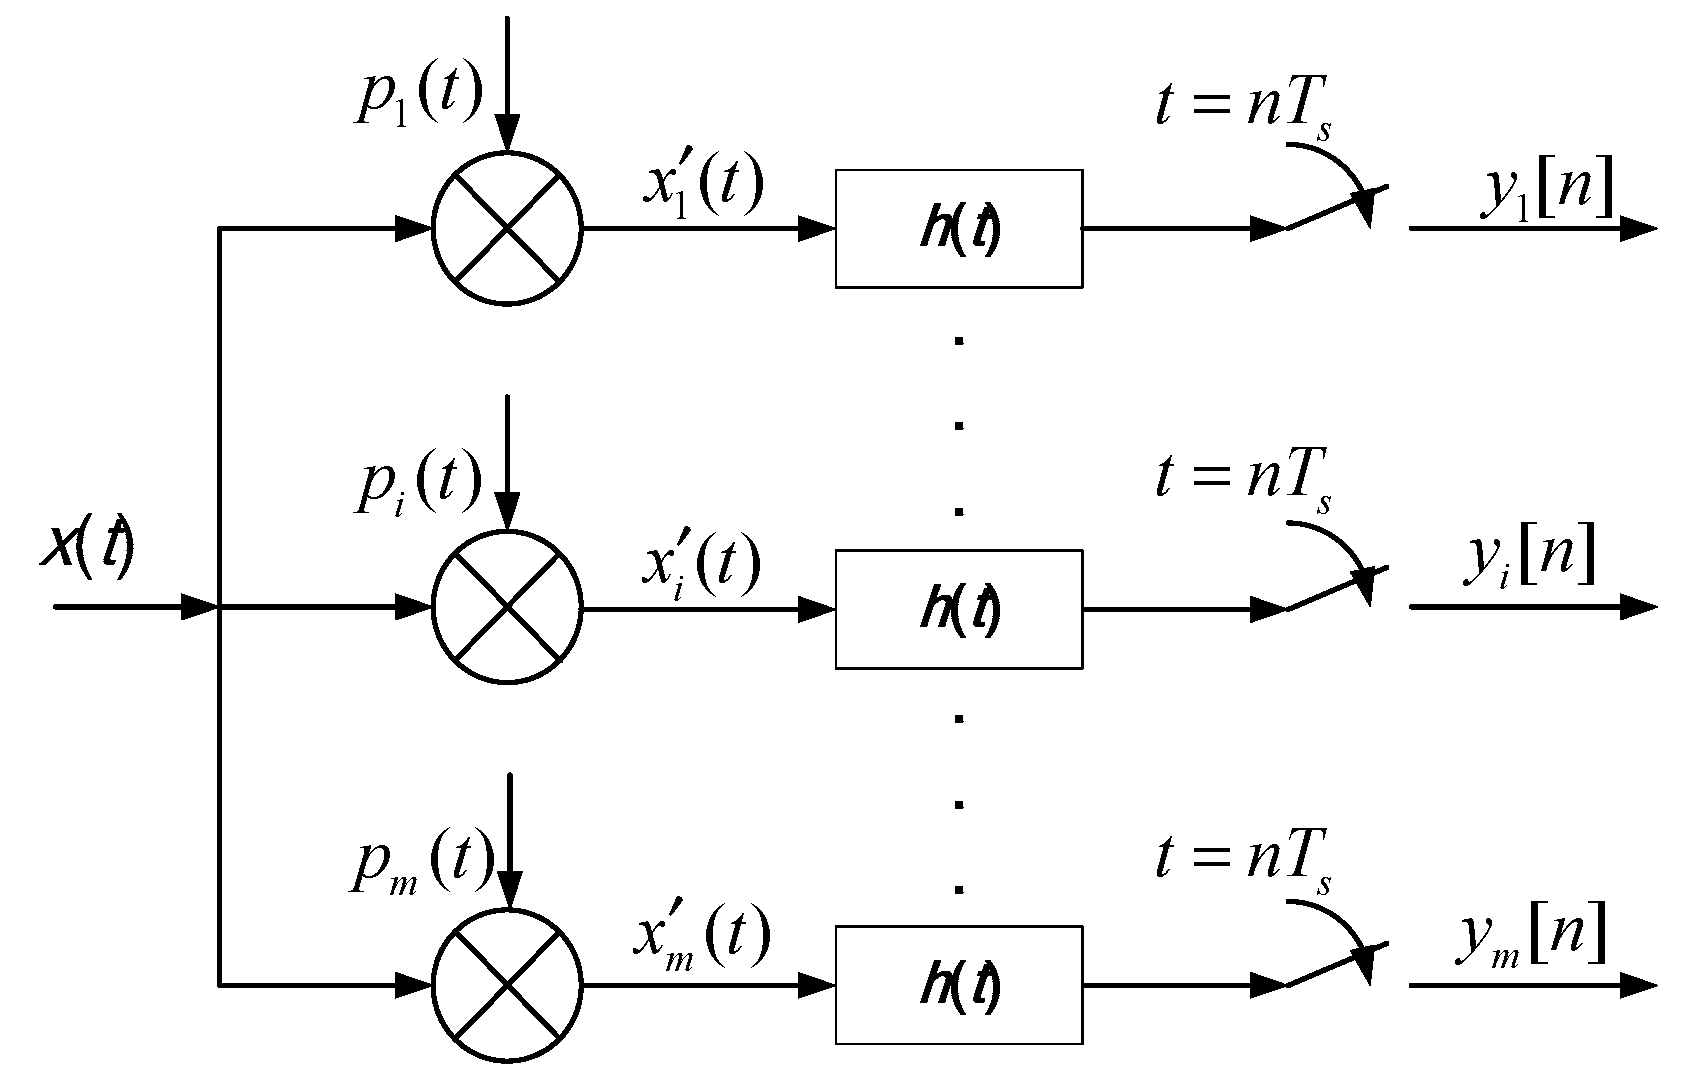
3. MWC for FH Signal

3.1. Channelized MWC

The basic structure of the MWC system is given in Appendix A. The core idea of MWC is based on spreading the information of the input signal to the whole spectrum by a set of analog mixers. This is achieved by applying a Tp–periodic function p i ( t ) so that all sparse sub-bands can be moved to the baseband. After this, we can truncate the baseband by a low-pass filter (LPF) and sample the baseband at a relatively low rate. Although FHSS signal is varies with time and does not meet the needs of the sparse requirements of MWC on a long time scale, it is stationary and sparse in the frequency domain during one hop or several hops. Thus, the following conditions should be satisfied in order to detect FHSS signals using MWC.
(1)
There should be the ability to rapidly derive and refresh the support set.
(2)
There must be enough sampling points for a single hop to obtain adequate information for MWC and subsequent processing.
(3)
The whole spectrum of FHSS signal must be covered.
To solve these problems, we propose a channelized MWC method as follows:
The received signal x ( t ) consists of the FHSS signal x h ( t ) and other signals x o ( t ) .
x ( t ) = x h ( t ) + x o ( t )  
Based on (A5), the discrete time Fourier transform (DTFT) of y i [ n ] can be expressed as:
Y i ( e j 2 π f T s ) = l = L 0 + L 0 c i l X h ( f l f p ) + l = L 0 + L 0 c i l X o ( f l f p ) f F s
where X h ( f ) and X o ( f ) are the DTFT of x h ( t ) and x o ( t ) respectively. It is clear that c i l is the weighting coefficient of sub-band l in the ith channel. To channelize MWC, we can restructure A = { c i l } 1 i m , 1 l L , while Y i selectively denotes the information of certain sub-bands selectively.
As described in Appendix A, the whole band is divided into L = 2 L 0 + 1 sub-bands, which should be covered by m channels. Since the real signal of a single hop takes up to 4 symmetrical sub-bands, for convenience, we distributed these four sub-bands into each channel, which is depicted in Figure 2. Thus, the number of channels should not be less than m = L / 4 + 1 = L 0 / 2 + 1 , which meets the basic parameter choice of m 4 N based on the theory presented in [16], where N is the number of non-overlapping sub-bands for X ( f ) .
Without a loss of generality, we take the ith channel containing X h ( f ) as an example, which corresponds to sub-band ± ( 2 i 3 ) and ± ( 2 i 2 ) ( i 1 ) . We obtain the new coefficient by using the following equation:
{ c ^ i 0 = ρ i 0 c i 0 c ^ i l = ρ i l c i l c ^ i l = μ i l c i l i = 1 l = ± ( 2 i 3 ) , ± ( 2 i 2 ) i 1 l ± ( 2 i 3 ) , ± ( 2 i 2 ) i 1
where μ l and ρ l are the fading factors of the lth sub-band, while ρ l = ρ l * , μ l = μ l * . Generally speaking, the sub-band that we choose for the channel should be enhanced and the other sub–bands should be attenuated, which essentially means that the information of X h ( f ) will be retained and the information of X o ( f ) will be eliminated. However, a necessary condition for accurate blind recovery using MWC is that the number of effective channels cannot be less than 2N [15]. It is better to keep as much information as possible for each channel to improve the precision of recovery. In this paper, we amplified the sub-bands that we distributed to the channels for FH signal detection and recovered these from other channels. The weighting factor ρ is flexible according to SNR. We will analyze and discuss it in Section 4.
For the convenience of analysis and design, we set the following rules:
{ ρ i 0 = 2 ρ ρ i l = ρ ρ i l = ρ * μ i l = 1 i = 1 l = + ( 2 i 3 ) , + ( 2 i 2 ) i 1 l = ( 2 i 3 ) , ( 2 i 2 ) i 1 l ± ( 2 i 3 ) , ± ( 2 i 2 ) i 1
Thus, the new sensing matrix A ^ can be expressed as follows:
Electronics 07 00170 i001
Based on (A1), we have the new measurement equation:
Y ( f ) = A ^ Z ( f ) f F s
where each channel keeps the information of its selective sub-bands. During one hop, the FH Signal may influence two channels at most. Figure 3 shows the relationship among Y ( f ) , X ( f ) and A ^ .
From Figure 3, it is clear that all the channels keep the information of the source signal while Y i ( f ) is amplified, which allows channelization of MWC.

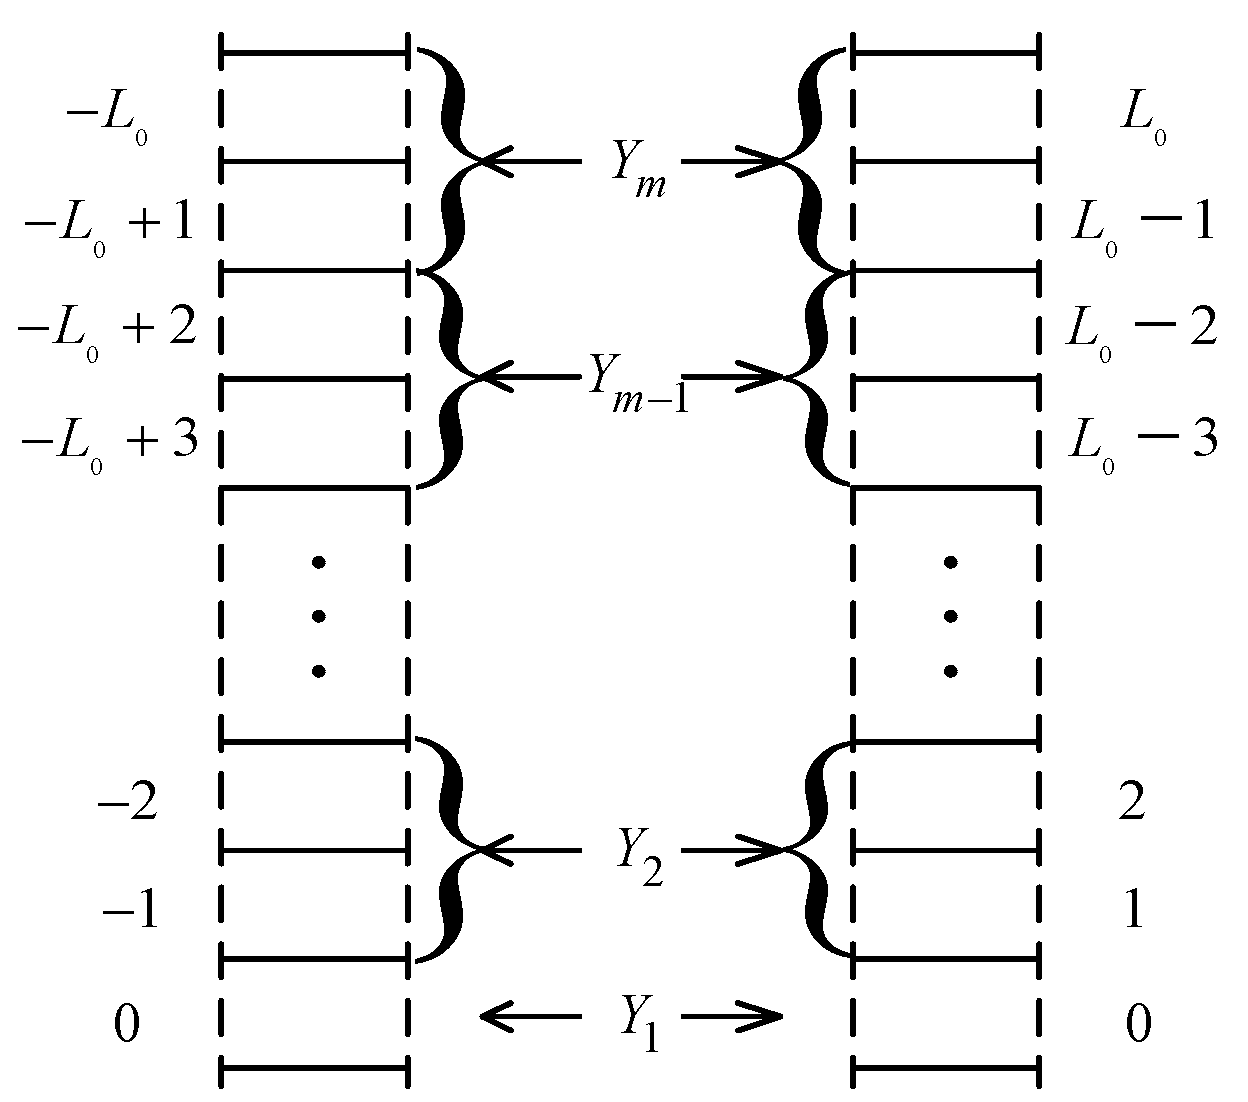
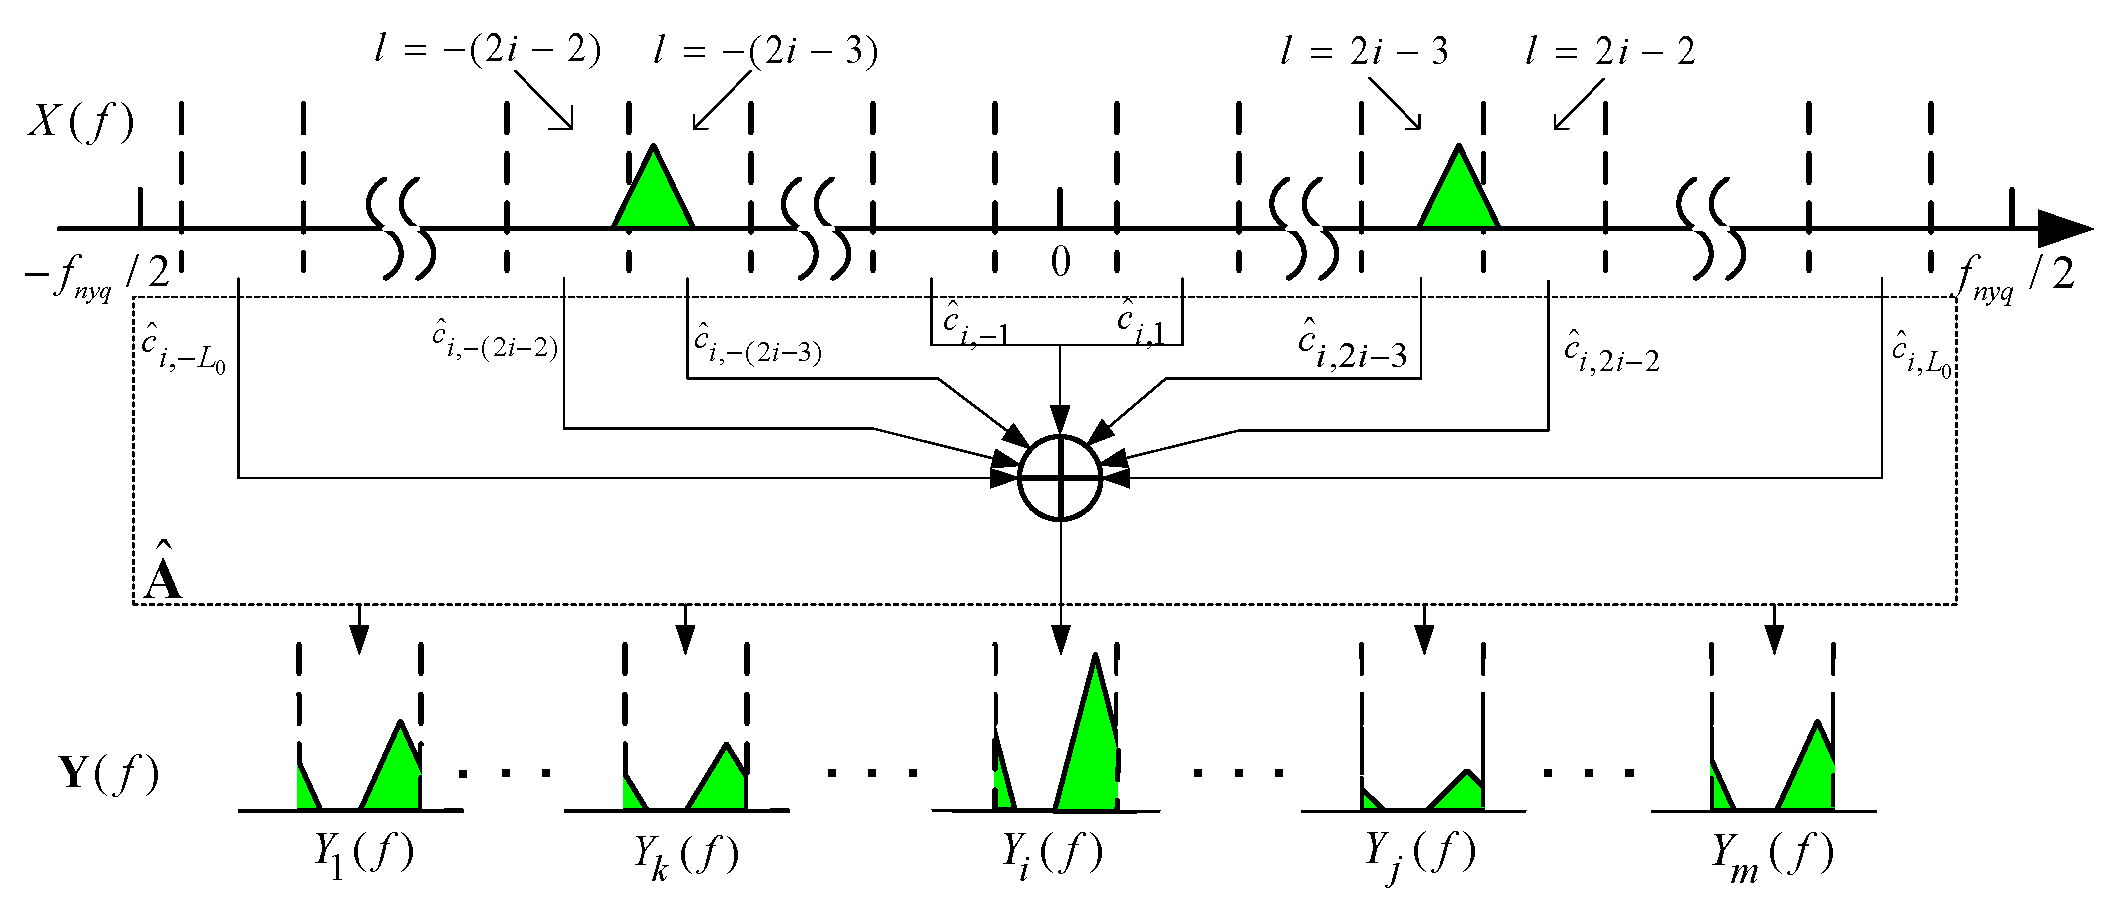
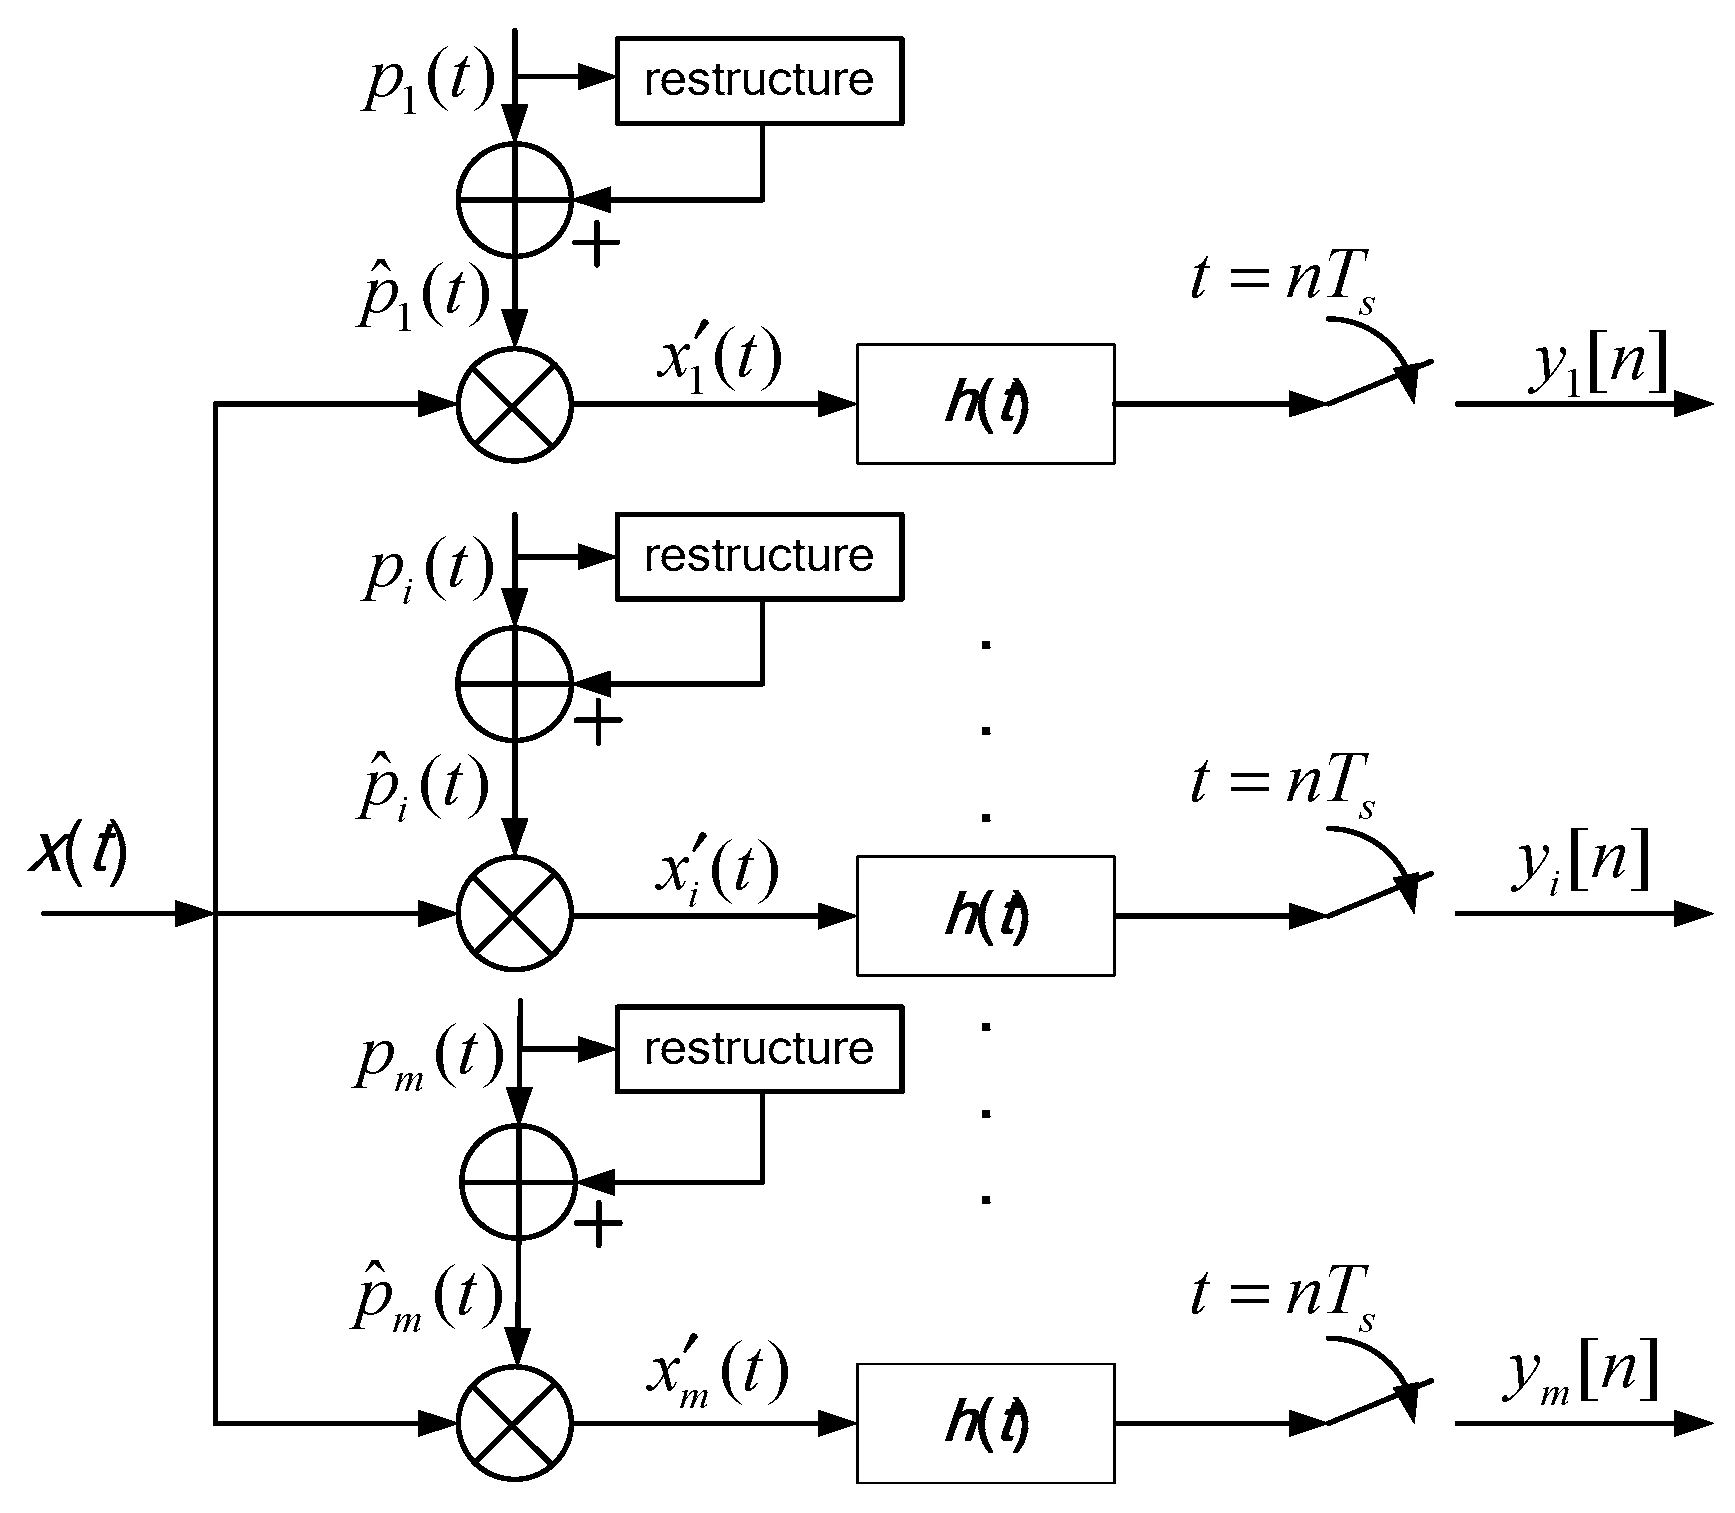
3.2. Structure Design of Channelized MWC

The relationship between the time domain waveform p i ( t ) and its Fourier series coefficient is given by (A2) and (A3). Thus, we can obtain the new time domain waveform:
p ^ i ( t ) = l = + c ^ i l e j 2 π l f p t = l = L 0 L 0 c ^ i l e j 2 π l f p t
Based on (4) and (5), the number of attenuated sub-bands is significantly smaller than others. Therefore, p ^ i ( t ) can be expressed as follows:
{ p ^ i ( t ) = p i ( t ) + ( 2 ρ 1 ) c i , 0     i = 1 p ^ i ( t ) = p i ( t ) + l = ± ( 2 i 3 ) l = ± ( 2 i 2 ) ρ c i l e j 2 π l f p t i 1
Thus, we have the structure of the channelized MWC, which is shown in Figure 4. Compared with the basic MWC system, it restructures the periodic sequence p i ( t ) .
In actual implementation, there must be enough transmission gain in the selective channel before restructuring. This means that the amplitude of the selective c i l should be relatively high in order to characterize the sub-band so we can detect the differences after the amplification by restructuring. To ensure that this condition is met, an undesirable periodic function should be replaced in the preprocessing before the system continues on with its regular functions.

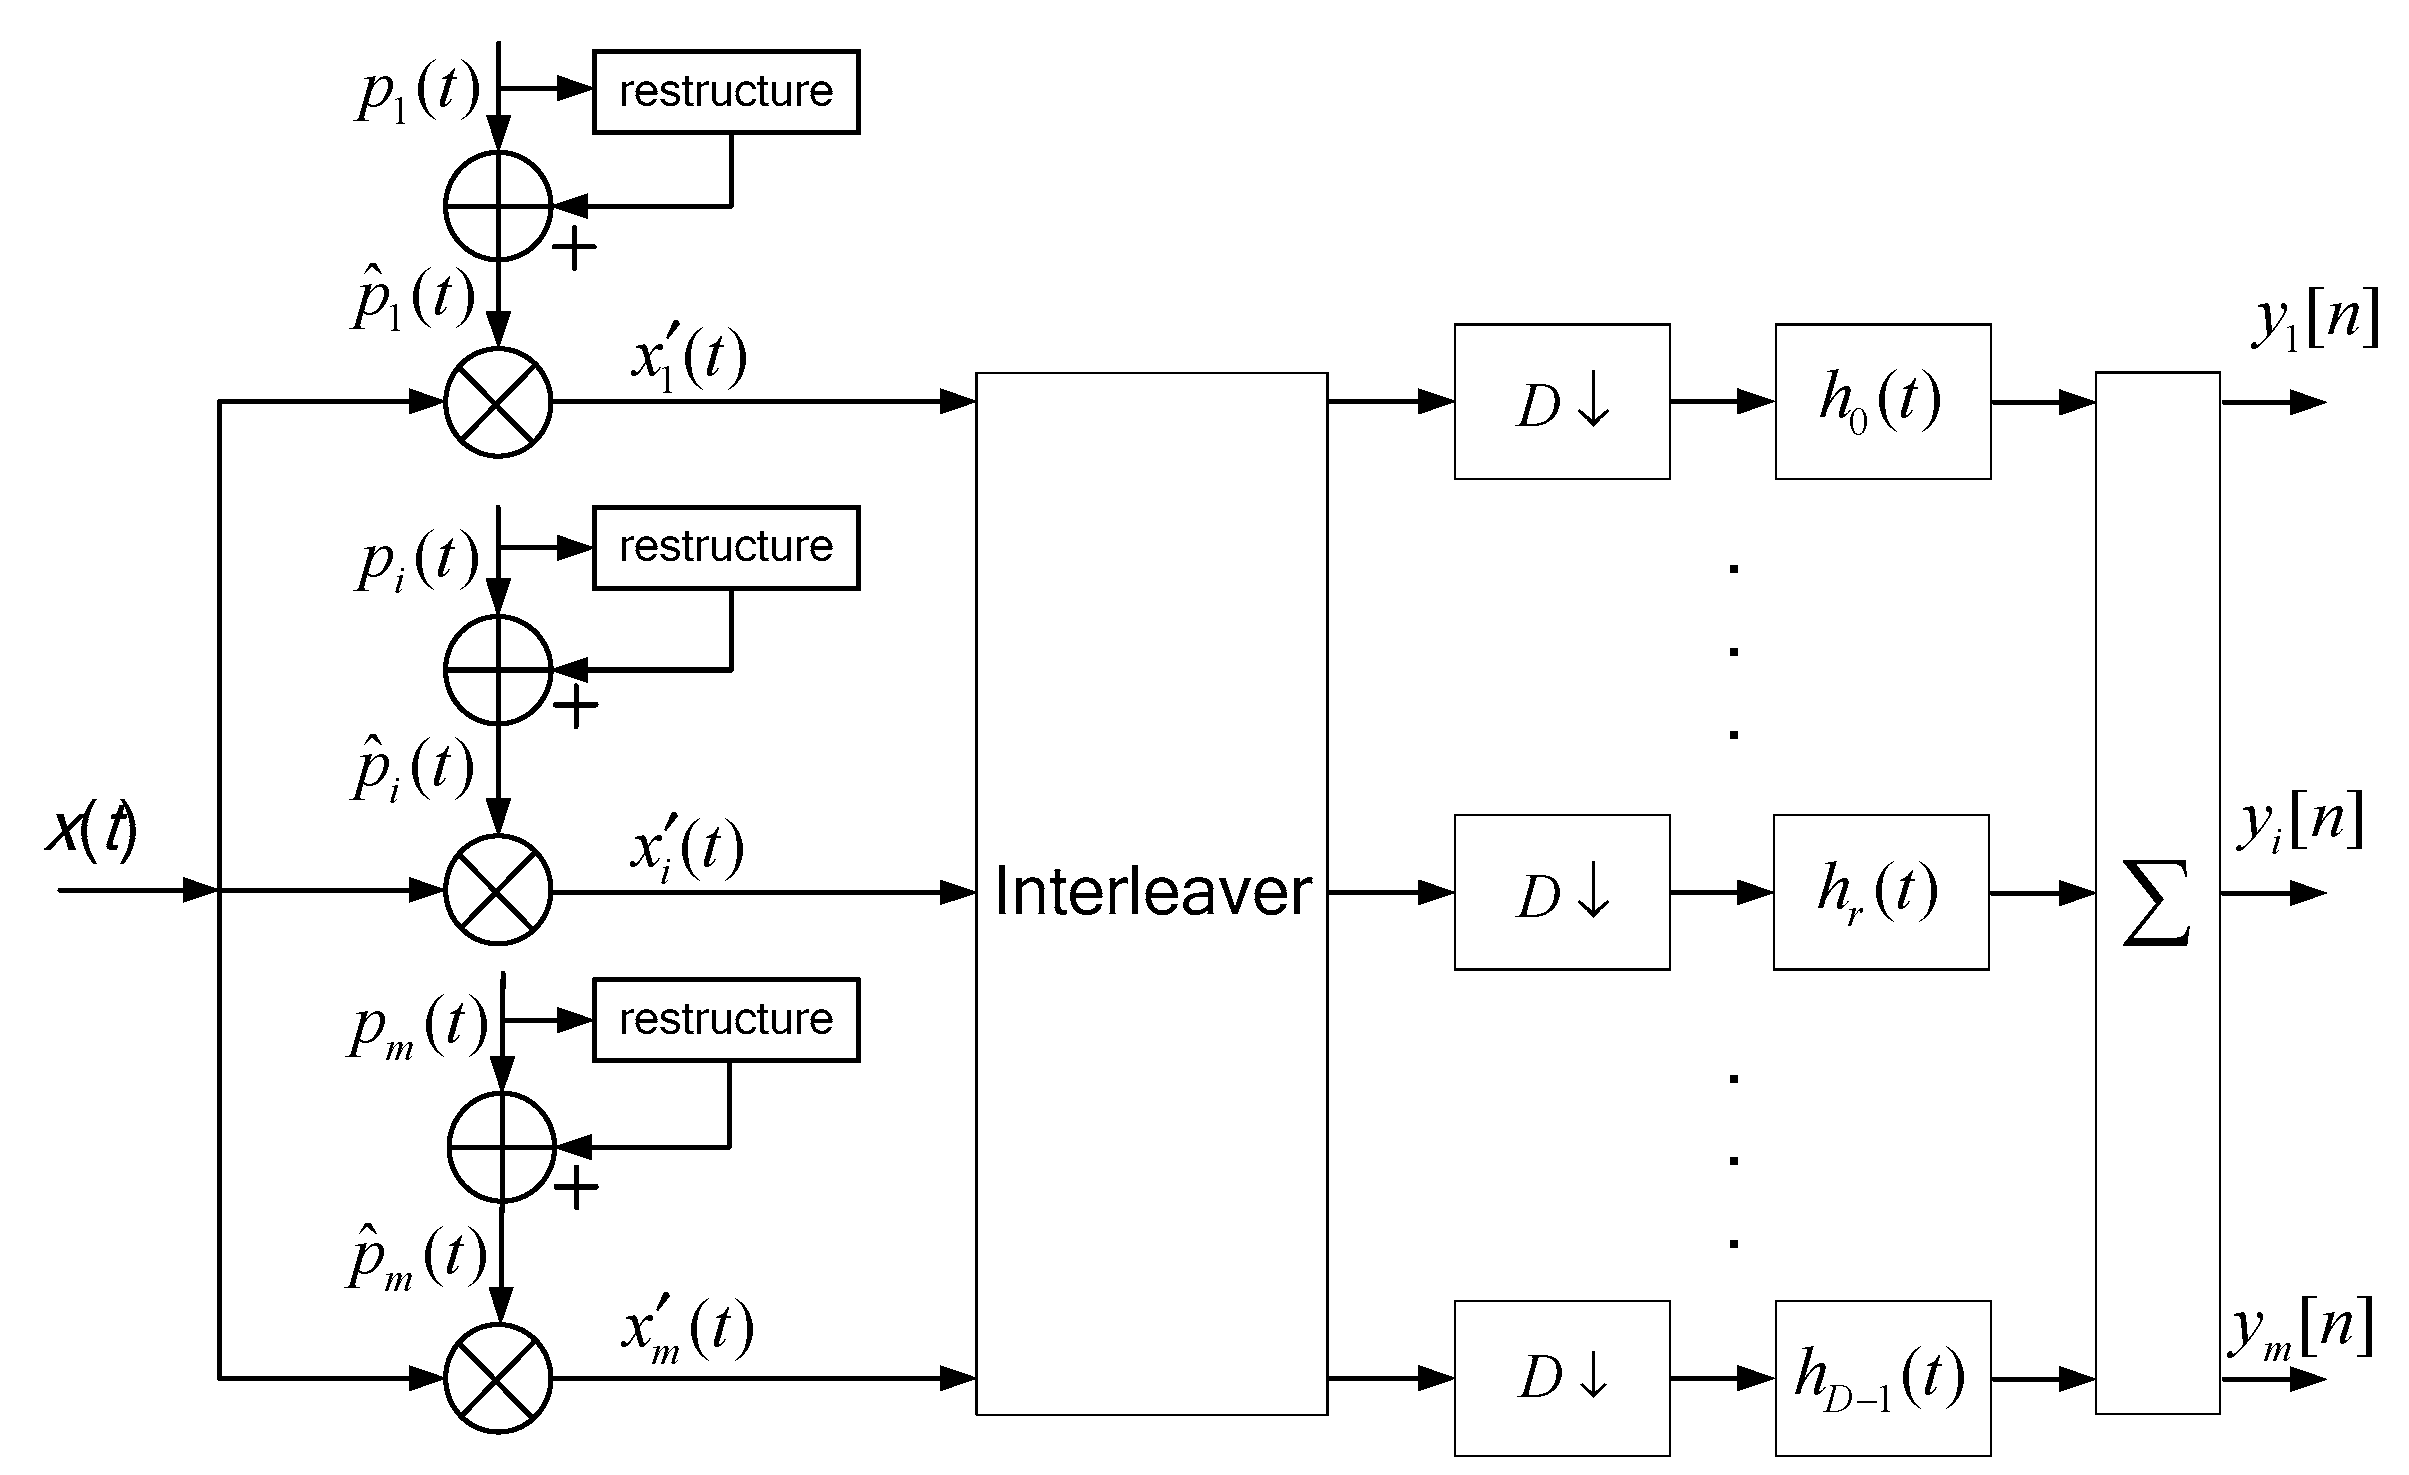
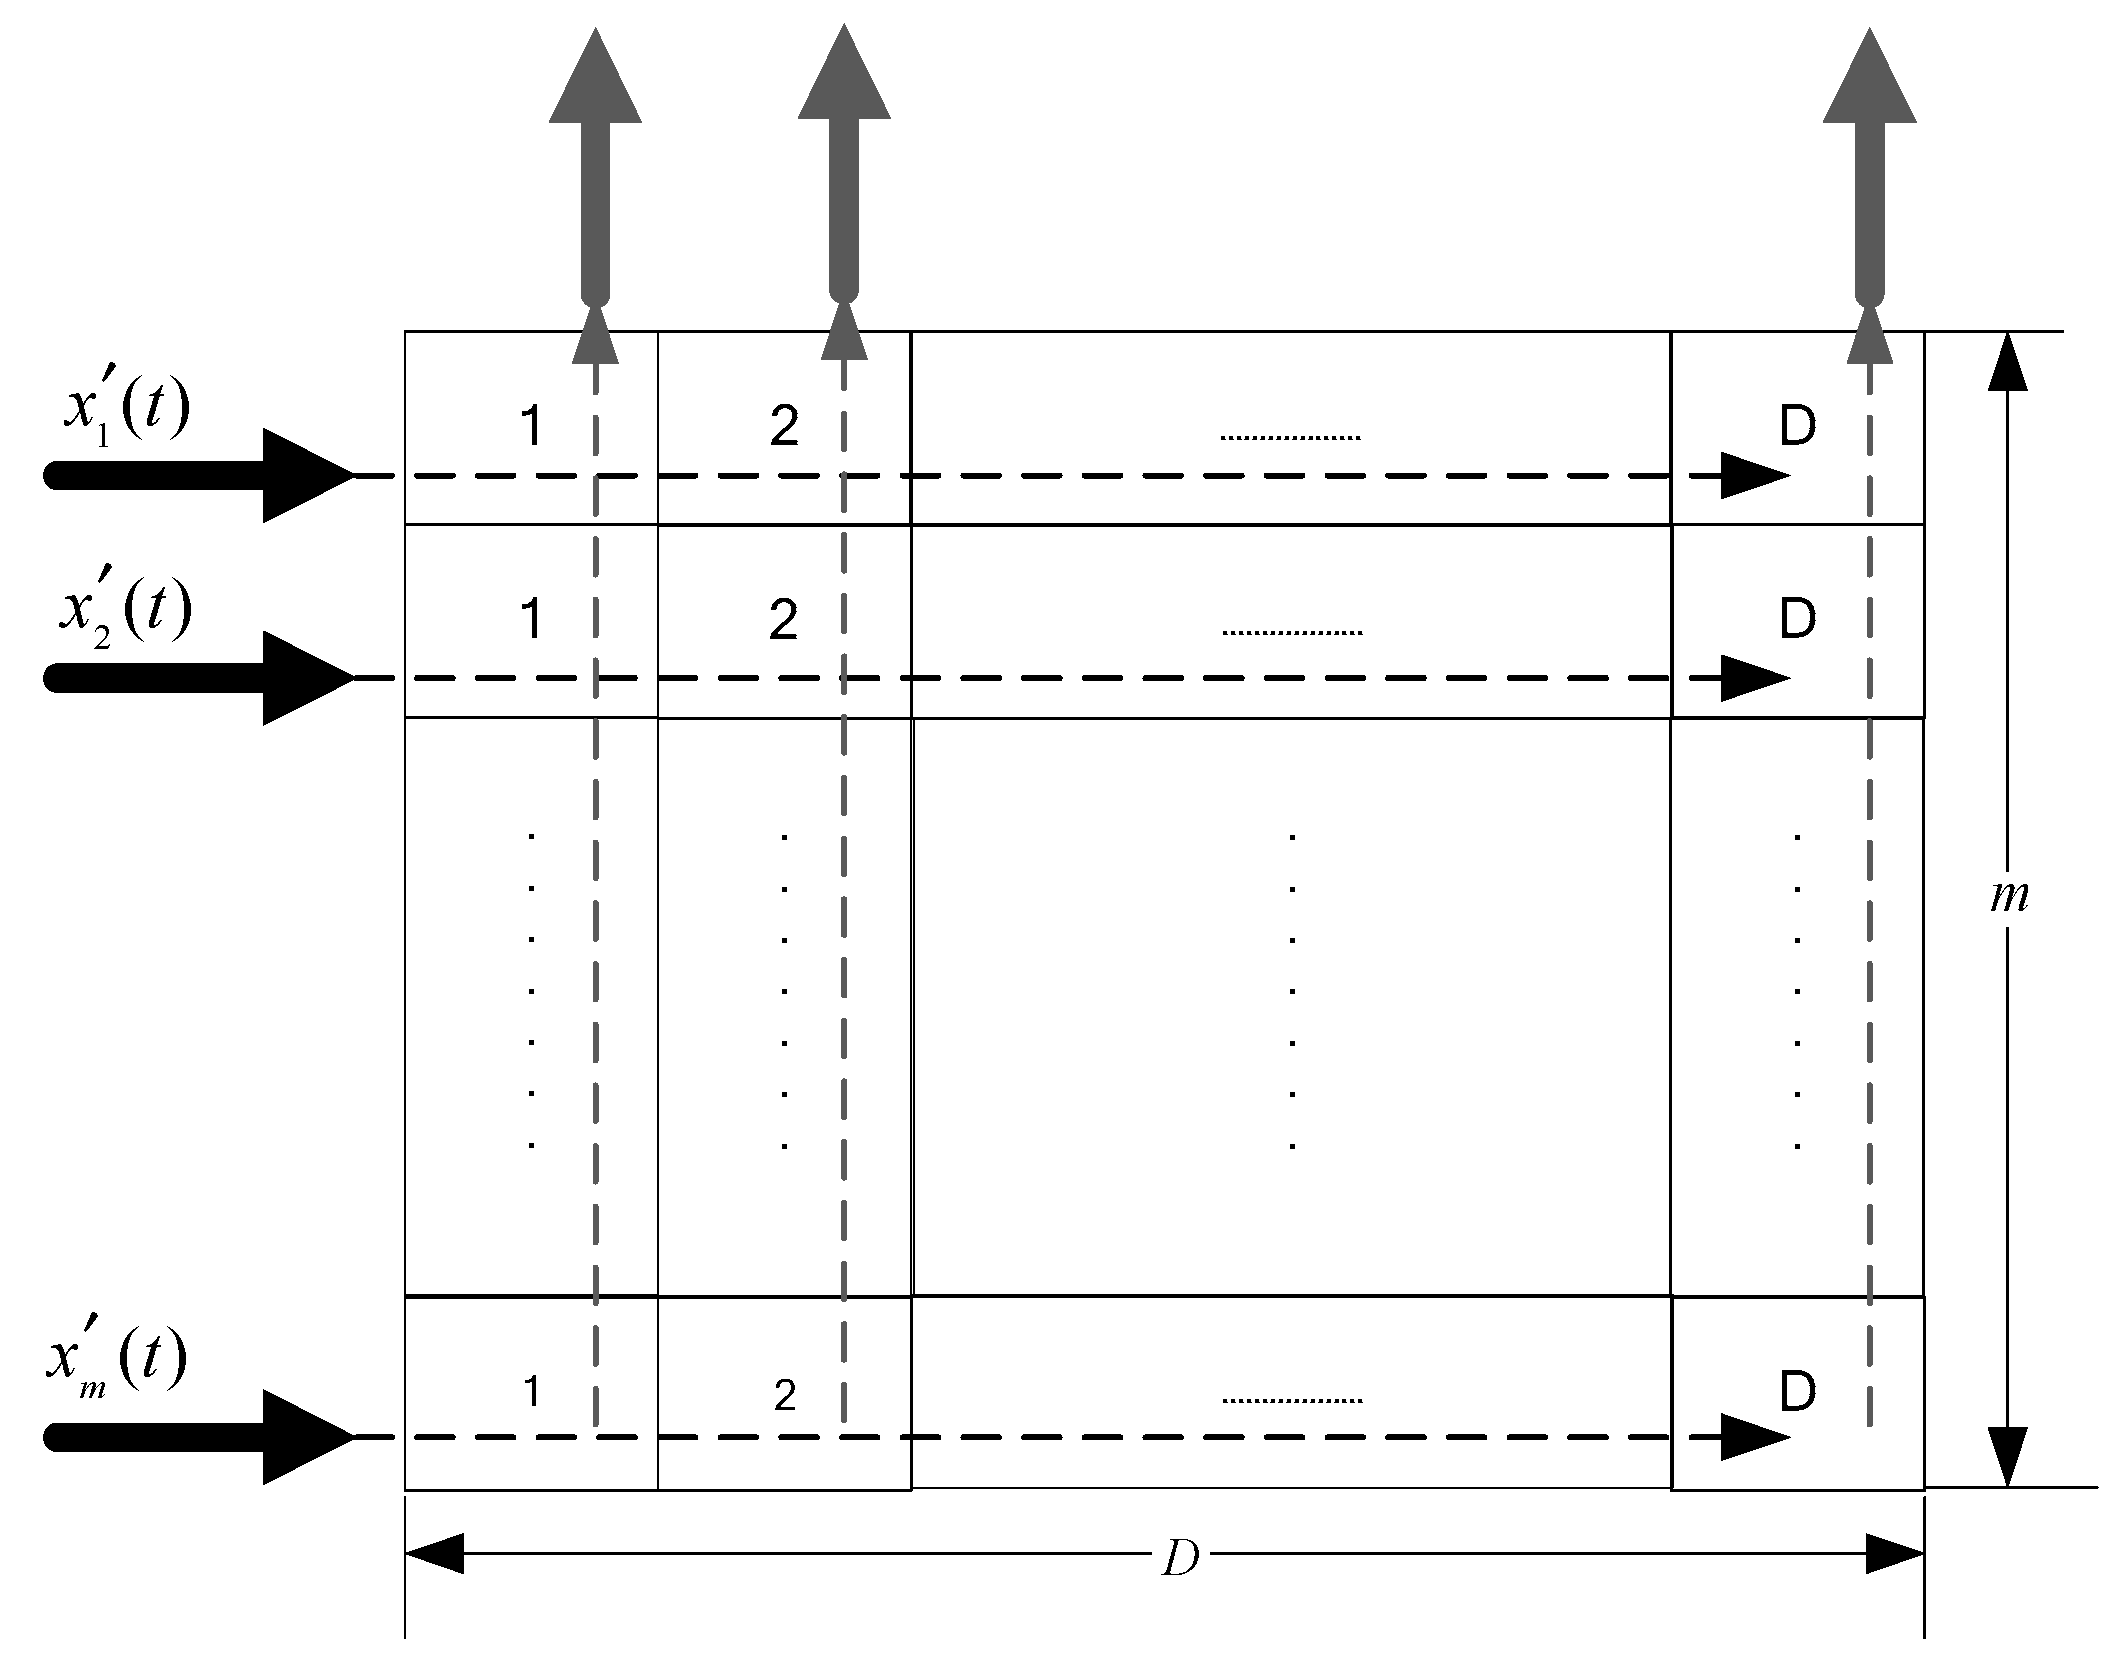
3.3. Improved Structure for Channelized MWC

Using the MWC theory (Appendix A), we can see that all sparse sub-bands are moved to the baseband. The information of a certain sub-band can be extracted by a mixer and a low-pass filter. For example, we extracted lth sub-band in ith channel. Assuming that x i ( k ) is sampling x i ( t ) at a Nyquist rate and decimation rate is D: D = f n y q / f s , we have:
y i ( n ) = { [ x i ( k ) e j 2 π l f p k   ] h ( k ) } | k = n D
where h ( ) is the same low-pass filter as that in Figure A1. It is difficult to implement MWC, especially when there is a high number of channels, because the order of h ( ) can be relatively high. Although an analog filter is used, this results in high computation requirements. We improve the structure for channelized MWC as follows:
We rewrote (10) as:
y i ( n ) = { τ = + x i ( k τ ) e j 2 π l f p ( k τ ) h ( τ ) } | k = n D = τ = + x i ( n D τ ) e j 2 π l f p ( n D τ ) h ( τ ) = r = 0 D 1 τ = + x i ( n D τ D r ) e j 2 π l f p ( n D τ D r ) h ( τ D + r )
From (11), x i ( t ) is tested and sampled at the same time. For ease of description, we defined the following:
x i r   ( n ) = x i ( n D r )
h r ( n ) = h ( n D + r )  
ω l p   = 2 π l f p
Thus, we have:
y i ( n ) = r = 0   D 1 τ = + x i r ( n τ ) h r ( τ ) e j ω l p ( n D τ D r ) = r = 0 D 1 [ τ = + x i r ( n τ ) e j ω l p ( n τ ) D h r ( τ ) ] e j ω l p r
We defined the following:
s i r   ( n ) = τ = + x i r ( n τ ) e j ω l p ( n τ ) D h r ( τ ) = [ x i r ( n ) e j ω l p D ] h r ( n )
Based on (15) and (16), we have:
y i ( n ) = r = 0   D 1 s i r ( n ) e j ω l p r
In MWC, since the baseband has all the information for the whole spectrum, we can extract the baseband by substituting ω l p = 0 into (17). Thus, we obtain the following:
y i ( n ) = r = 0   D 1 s i r ( n ) = r = 0 D 1 x i r ( n ) h r ( n )
where x i r ( n ) and h r ( n ) are defined in (12) and (13).
Based on (18), the source signal and low-pass filter is decimated. This structure can be reused by all m channels through an interleaver and a summer, which is shown in Figure 5.
The interleaver is different from the traditional interleaver. Instead of using a serial input and output, the inputs, which are the data of m channels, run in parallel with the outputs of data for decimation. Figure 6 depicts the interleaver model.
The main purpose of the interleaver used in this present study is storage and delay. In implementation, we used the same two interleavers as those used for the ping-pang operation. It is obvious that D > m so there is enough time for reading before the spillover of the other interleaver since it starts reading as soon as the matrix is full. From Figure 6, it can be concluded that the D time of decimation occurs before the filters. The filter in the improved channelized MWC is a multiphase version of the original low-pass filter, which only requires 1 / m computational cost. The real-time processing capability of the system has been greatly improved.

3.4. Detection and Frequency Estimation of FH Signal

Detection and estimation are most important during the blind signal processing of FH, which means catching and estimating time–frequency distribution of the signal. Although most of the compressive sensing methods aim to reconstruct a signal by exploiting its sparsity, our goal is not only to detect the presence of the FHSS signals, but also to estimate the channel that contains the FHSS signals in the frequency domain. Based on the above-mentioned system, we can rapidly determine the hopping frequency without recovering the original signal.
In Appendix A, we constructed the equation between the observed signals and original signals in the frequency domain. Furthermore, it is clear that the total power of a certain channel, which contains an FH signal, could be relatively high in the channelized MWC. The algorithm of the frequency estimation can be described as follows:
Step 1: Calculate fast Fourier transform (FFT) for y i [ n ] : y ^ i ( f ) , as the estimation of y i ( f ) . The estimation of power spectrum is:
R ^ y i   ( f ) = E [ y ^ i ( f ) y ^ i H ( f ) ]
Thus, we have:
R ^ y ( f ) = E [ y ^ ( f ) y ^ H ( f ) ] = l = L 0 L 0 | c i l | 2 P x ( f l f p ) = Λ R x ( f )
where P x ( f ) = E [ | X ( f ) | 2 ] and f F s . The new sensing matrix Λ is a column symmetric real matrix.
Step 2: Adopt the smoothing filter for R ^ y i ( f ) .
R ^ y i   ( f ) = R ^ y i ( f ) h s ( f )
The order of the smoothing filter is related to the width of signal power spectrum.
Step 3: Extract the channel as the support, which has a maximum value for the smoothed spectrum R ^ y i ( f ) that exceeds the threshold. The truncation threshold can be calculated or given by the host computer. Assume that the frequency point of the maximum value is f max .
Step 4: Eliminate the vagueness of the sub-band. In the above-mentioned channelized MWC, each channel corresponds to two pairs of sub-bands. We should analyze the channel which is extracted in Step 3, to distinguish the real sub-band for single support. Since the main energy source is from the support sub-band, we can obtain an estimation of the real support sub-band index l S , which is depicted as:
l S = arg min l [ σ ( Λ 1 ( i , l ) R ^ y i ( f max ) ) ] 1 i m
where Λ ( i , l ) is the element of Λ ; l corresponds to the extracted channel; and σ ( x ) represents the standard deviation of sequence x.
Step 5: Recover the power spectrum of the source signal.
R ^ x ( f ) = Λ l S R ^ y ( f ) f F s
The sub-matrix Λ l S consists of the column, which is indexed by l S . Λ l S is the pseudo-inverse matrix of Λ l S .
Step 6: Estimate the carrier frequency.
f ^ h = ( l s 0.5 ) f p + f ^ b
where f p is the width of the sub-band; f b is estimated from R ^ x ( f ) . In order to improve carrier frequency estimation performance, we utilized the gravity method for R ^ x ( f ) :
f ^ b = f · R ^ x ( f )   R ^ x ( f ) R ^ x ( f ) > η
where η is the threshold related to the specific scenes and SNR. In implementation, we can obtain the threshold using previous measurement data.

4. Numerical Simulations and Discussion

Numerical simulations are conducted in this section to evaluate the performance of our method. In this section, we discuss the performance of sub-band detection and frequency estimation. In order to clarify certain points, the intermediate results of the channelized MWC are also discussed. These will give guidance in selecting parameters for the system. Without loss of generality, the relative simulation parameters are shown in Table 1. The carrier frequency of source signals is transformed to [0, 5 GHz] as the input of our system.
In addition, f s f p is necessary condition to allow accurate spectrum-blind recovery [15]. According to Section 3.1, m should not be less than 50 for channelized requirement.

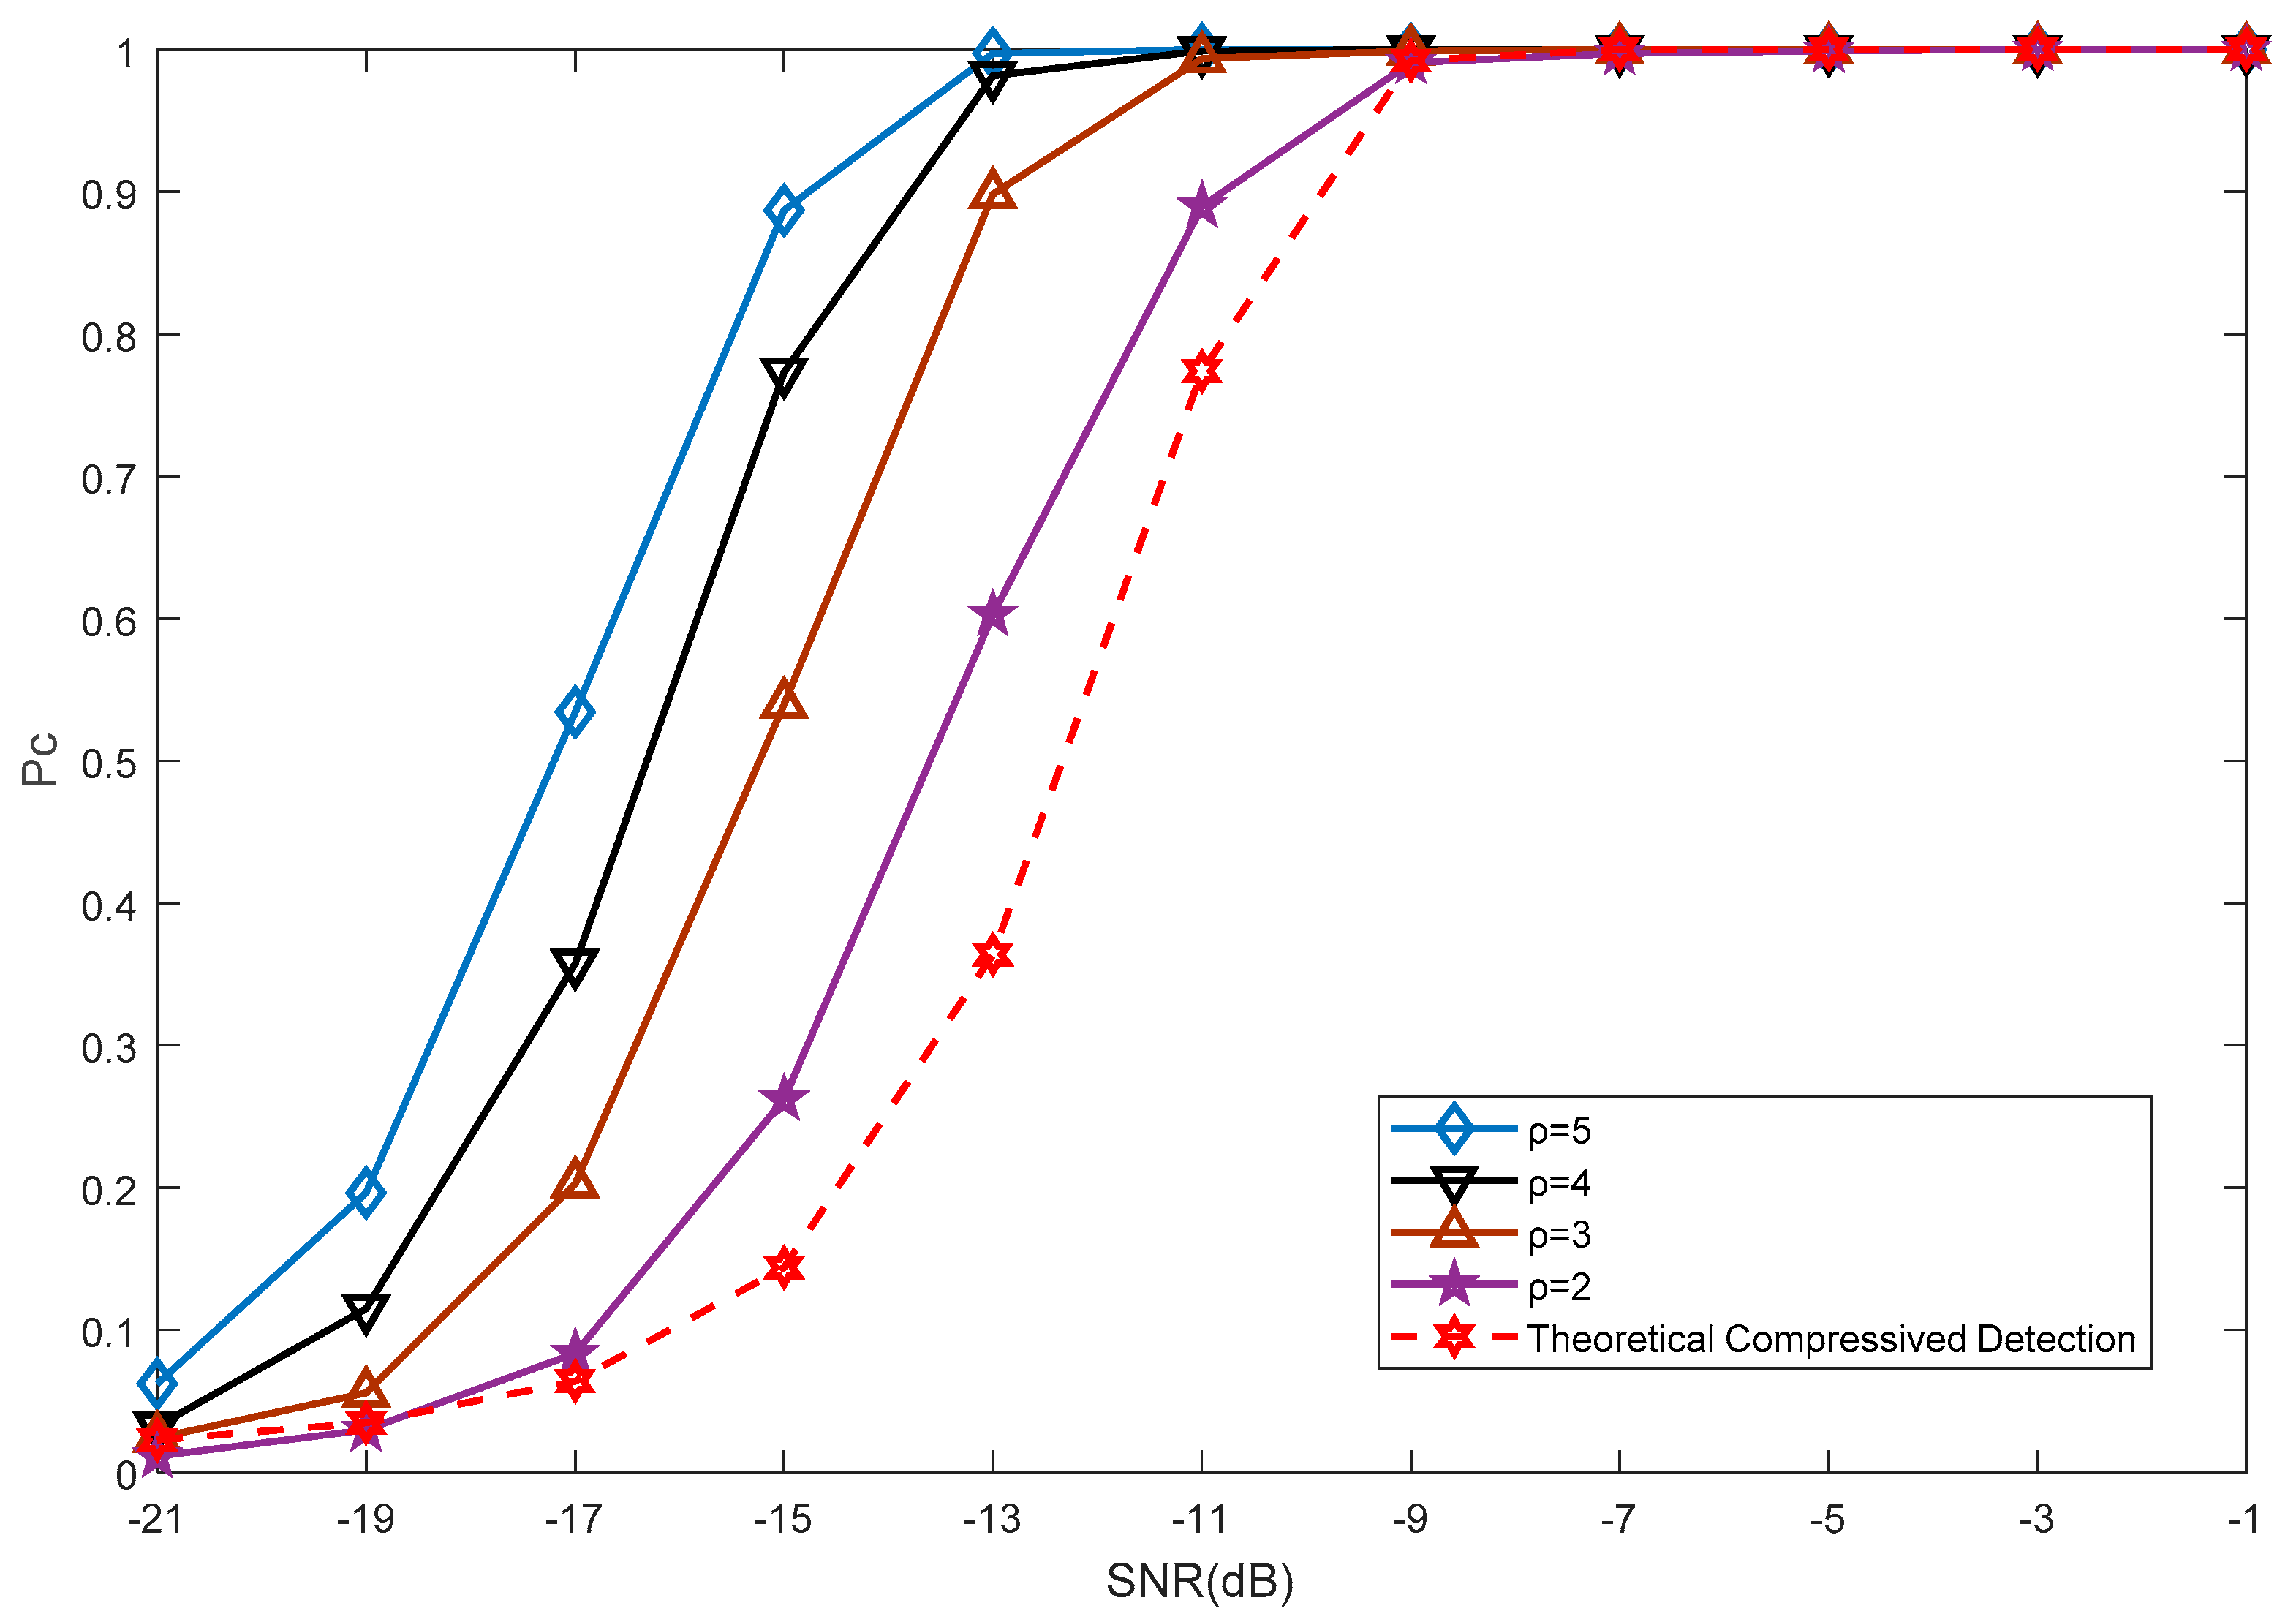
4.1. Channel Detection

In this part, we analyze the performance of the channel detection at different SNR levels. It is important to emphasize that this SNR is a whole bandwidth SNR rather than an SNR on the equivalent narrow band. In this present study, we assumed that each sub-band is already characterized before reconstructing. A comparison of the original periodic function and the reconstructed one is shown in Figure 7. It can be seen that one period of the original periodic function in the time domain (Figure 7a) is a pseudorandom binary sequence. In the frequency domain (Figure 7b), each sub-band gets an arbitrary coefficient and is moved to a baseband based on this coefficient. This revealed that the sub-bands cannot be distinguished in the original MWC before recovery. Figure 7c shows one period of the reconstructed periodic function in the time domain. Compared with the original function, the reconstructed one is multivalued and amplified. In the frequency domain (Figure 7d), it is obvious that the sub-band that we chose for the channel is amplified, while others stay the same as that in Figure 7b. The amplitude of the reconstructed function is expanded and diversified. In actual implementation, each channel can simply add the sinusoid signal to its relative frequency.
Figure 8 shows the spectrum of a single hop, which has a carrier frequency of 2.4098 GHz. Here, we assume that the single hop bandwidth is B = 10 MHz. We can see that the original spectrum has narrow bands under high resolution. The amplitude of the single hop spectrum is quite high in its equivalent narrow band. This characteristic makes it possible for the detection of FH signals in frequency domain. Figure 9 shows one result of the channel estimation. Here, we used the weighting factor ρ = 5 and SNR = −15 dB. It can be seen that the total power of the channel that contains the single hop is much higher than others.
For further discussion, we calculated the probability of successful channel detection P c by 1000 Monte Carlo simulations. Figure 10 shows the results under the condition of different SNR levels and weighting factors. We concluded that the weighting factor has a significant impact on the probability of detection, especially when the SNR is relatively low. Since the power of a single hop is relatively stable and the MWC system spreads all the information of input signals, including noise, to the baseband, the inherent systemic characteristics of the noise limit the sensitivity of detection. For practical applications, the choice of weighting factor should consider the channel condition and source power. If the channel condition is good and the SNR on the equivalent narrow band is relatively high, we prefer a low weighting factor to reduce power consumption.
In addition to the channelized MWC, a compressive detection with random measurement kernels, which was proposed in previous study [28], was also implemented as a reference. Although the compressive detection method can only detect the presence of the FHSS signals and cannot find the specific channel, it serves as a benchmark. As the paper points out, the distribution of measurement energy λ for the signal in the present case follows the central Chi-squared distribution given by:
p ( λ ) = λ ( M N b 1 ) e λ σ s 2 + σ n 2 ( σ s 2 + σ n 2 ) M N b Γ ( M N b )
where M is the number of measurements; and N b is the number of samples. The channel noise is modeled as complex zero-mean additive white Gaussian noise with a variance σ n 2 that covers the entire FHSS hopping range. To simplify our derivations, the FHSS signal is modeled as a complex zero-mean Gaussian white signal with variance σ s 2 . Based on (26), we can obtain the theoretical compressive detection performance, which is shown in Figure 10. It can be observed that the channelized MWC has a higher detection probability because it changes the SNR on the entire FHSS hopping range by amplifying the power of particular channels.
Channel detection is the foundation for further processing. Compared with orthogonal matching pursuit (OMP) algorithm [15] for support recovery methods, our method has the advantages of less calculation requirements and adjustability. The amount of calculation is shown in Table 2, where we set m channels and N samples for each channel.
Furthermore, FH code sequences always have the characteristics of a wide gap. The probability of two adjacent hops in different channels can be relatively high. It is beneficial for our system to sense changes in the hop.

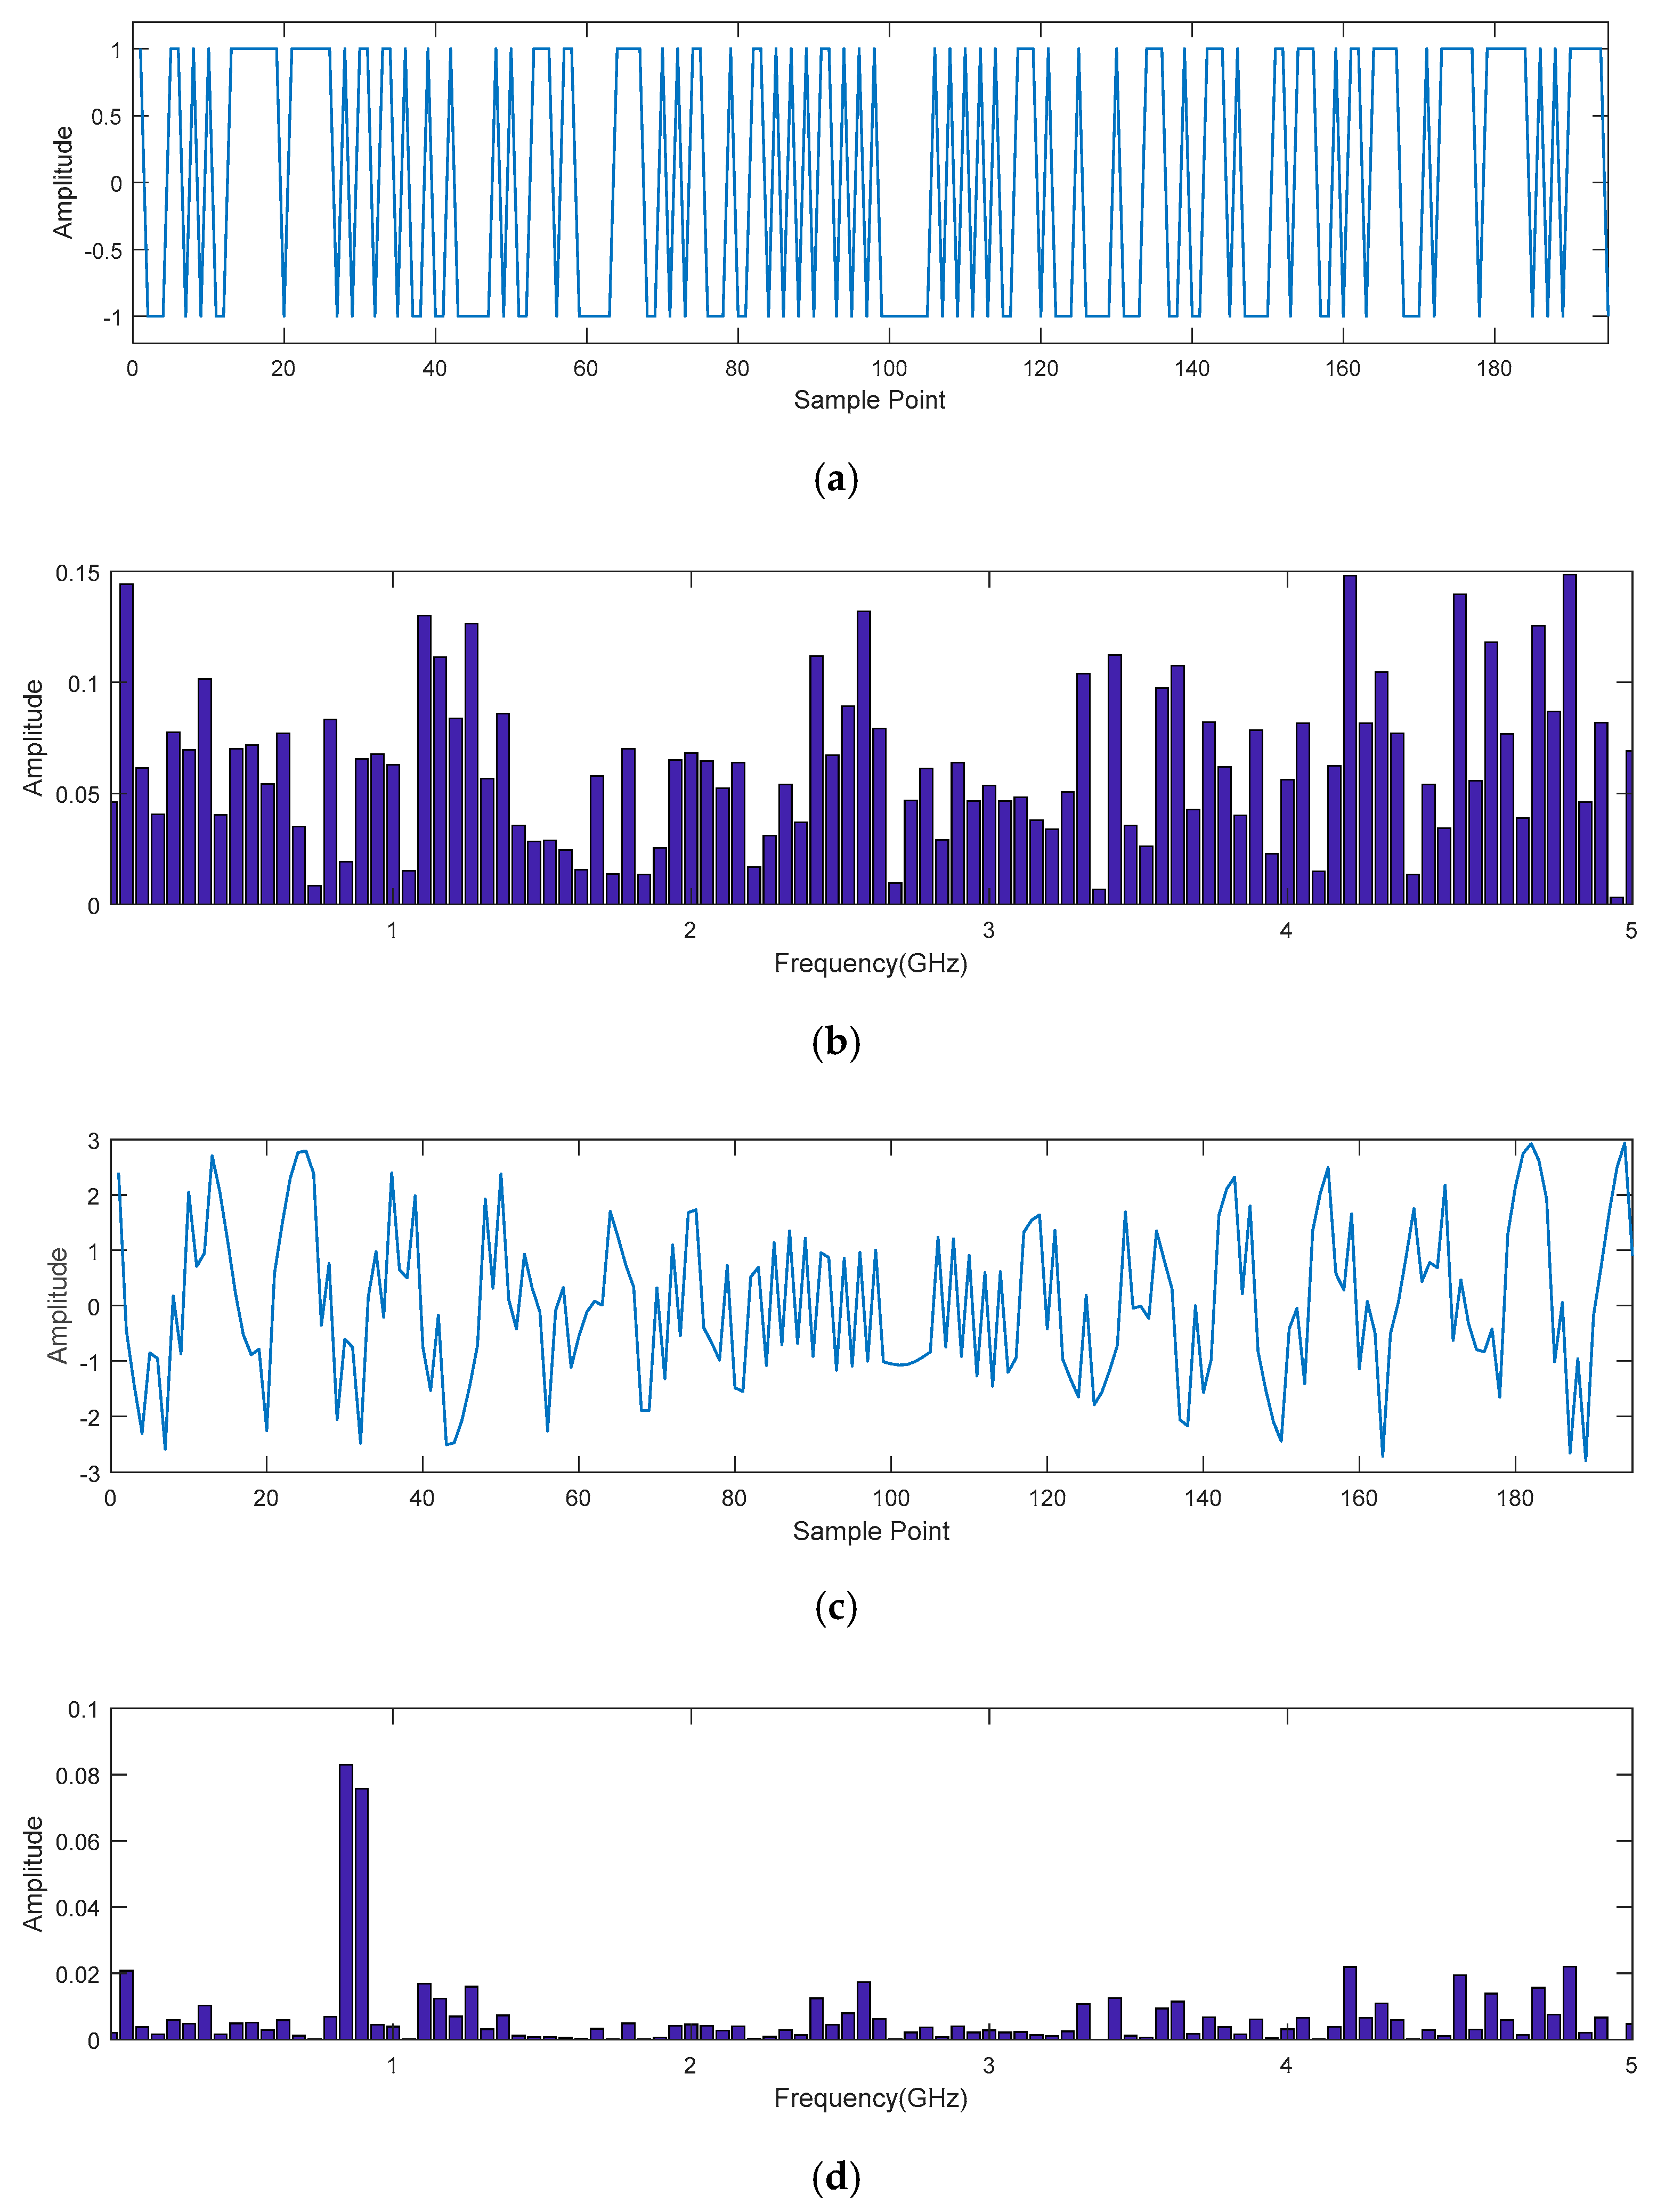
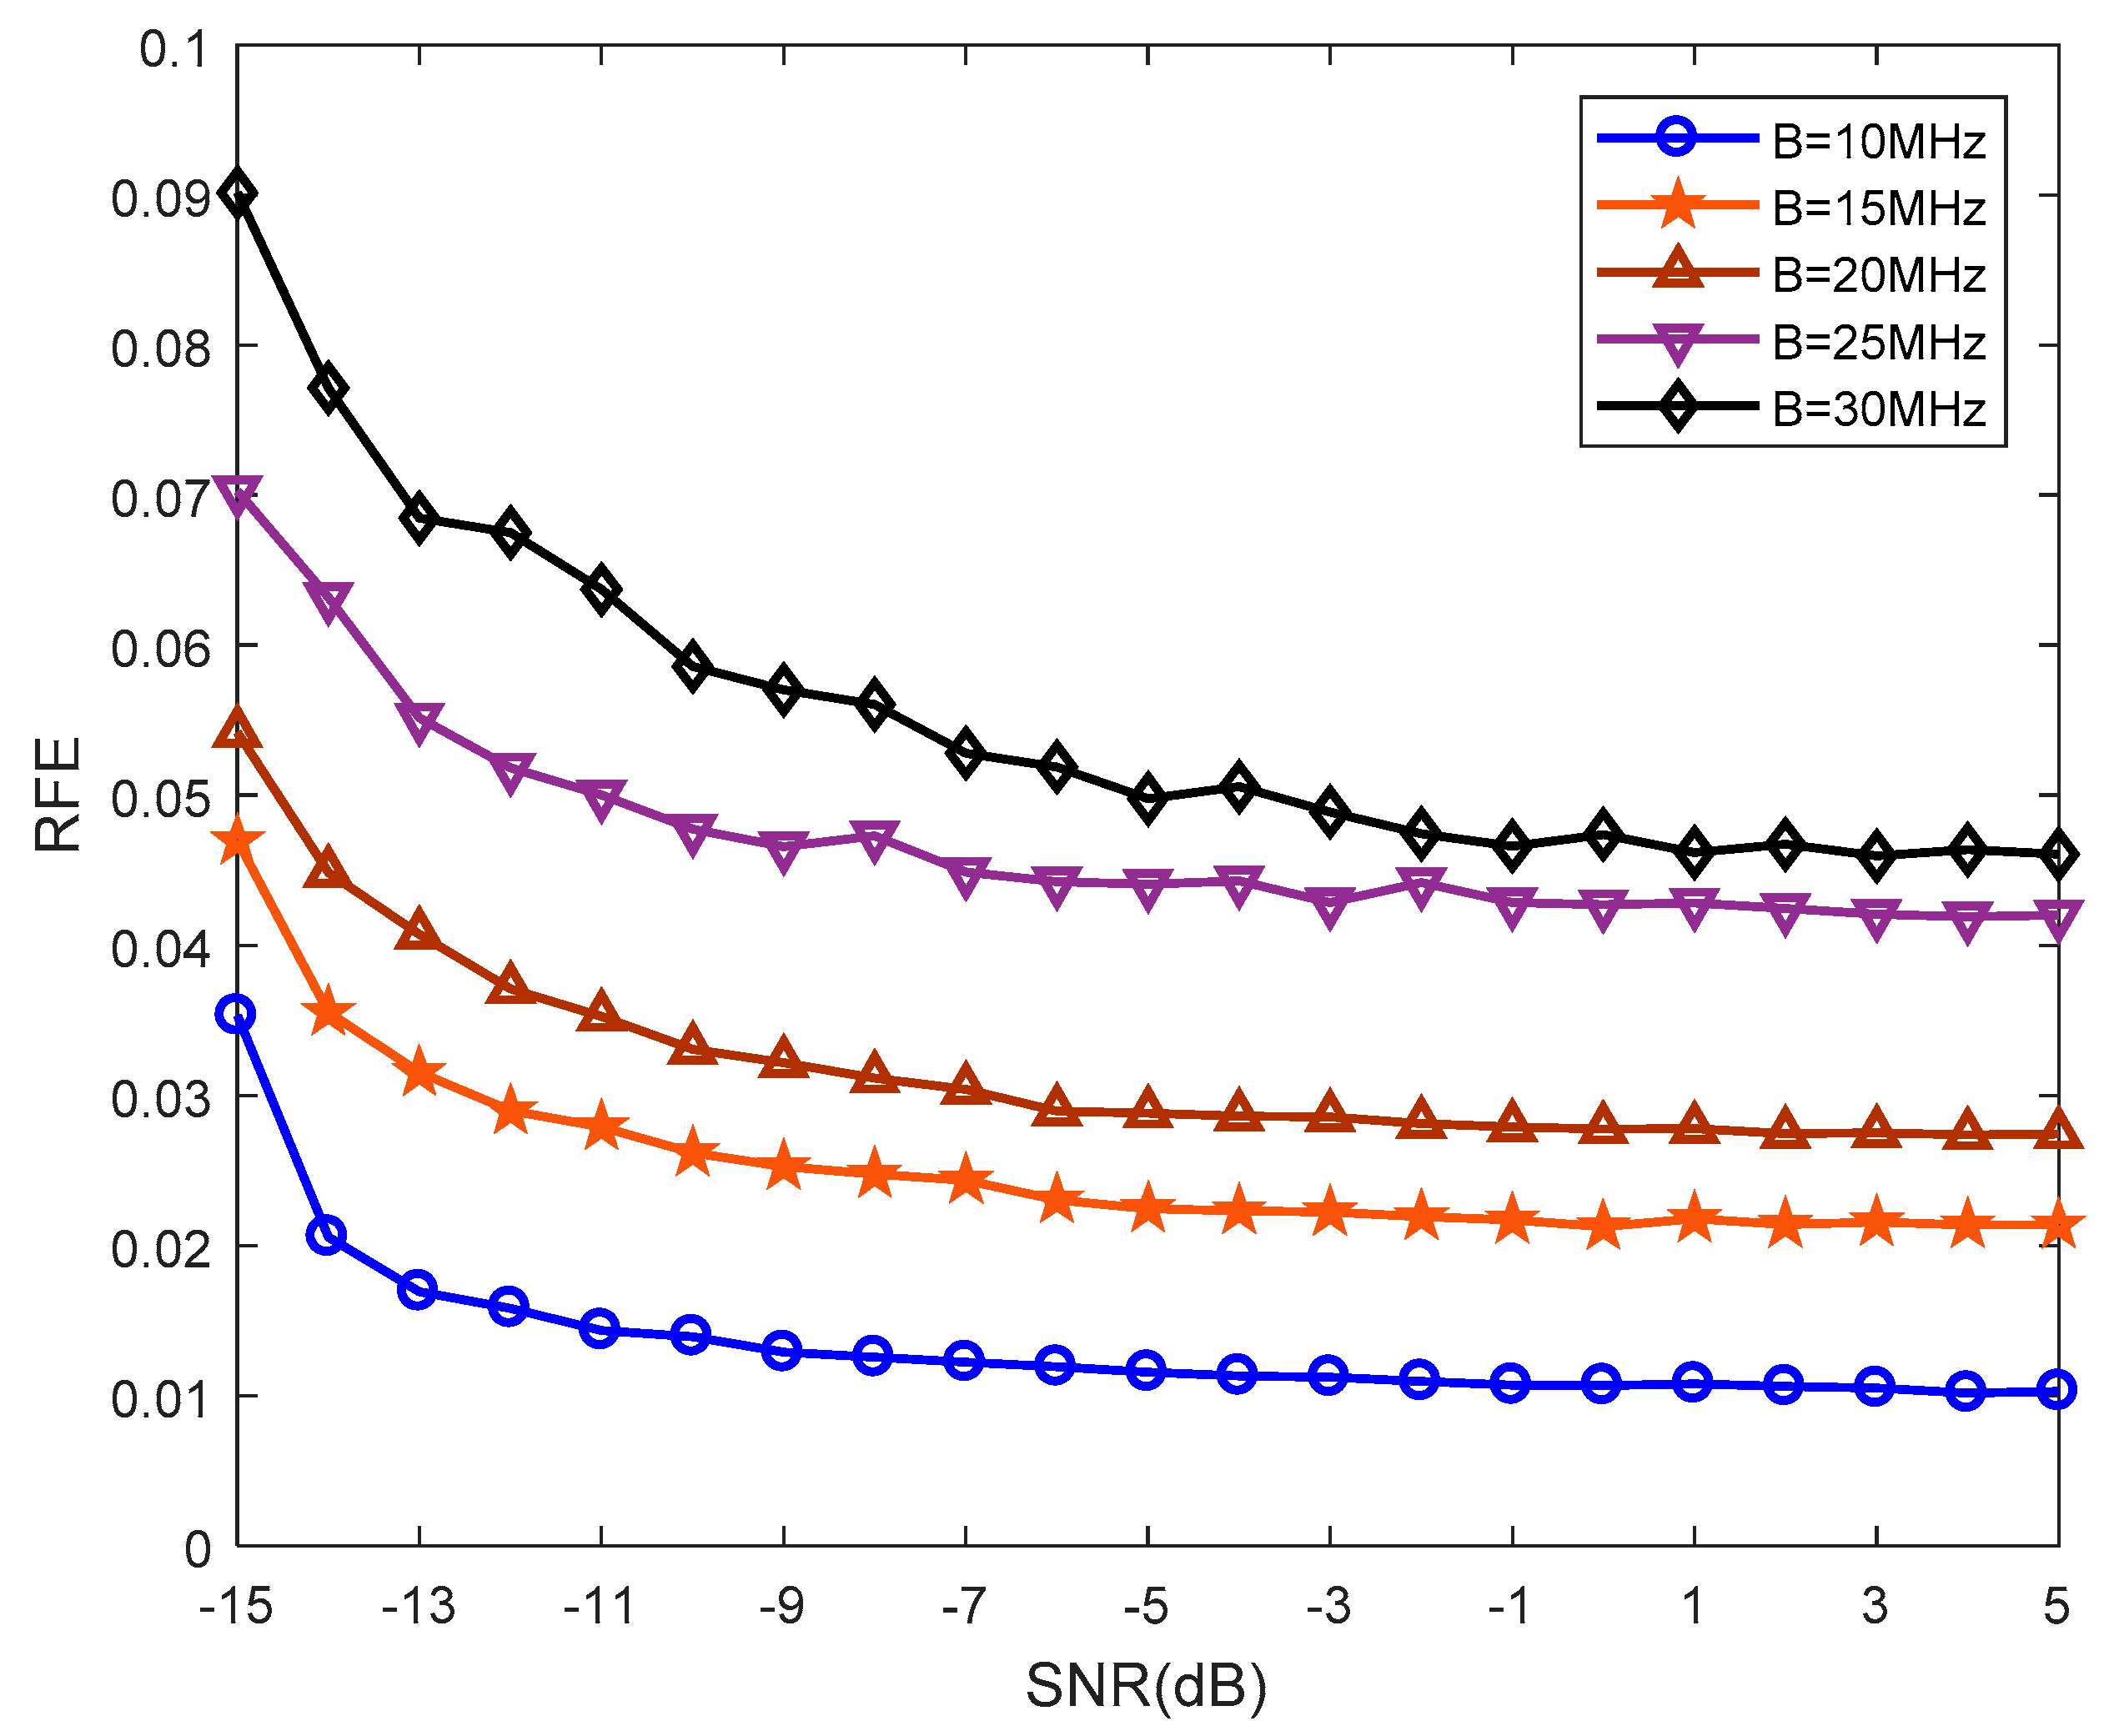
4.2. Frequency Estimation

Figure 11 shows the frequency estimation performance on different SNR levels and different single hop bandwidths. As the mode type is the differential quadrature phase shift keying (DQPSK), the carrier frequency of a single hop is suppressed, which will influence the estimation precision significantly. The simulations use the relative frequency error (RFE) to analyze the frequency estimation performance of the FH signals. The RFE of the frequency estimation can be modeled as:
R F E = 1 N n = 1 N | f ^ h n f h | f s
where N denotes the number of experiments; f ^ h n denotes the frequency estimation of the nth experiment; and f s denotes the sampling rate. The weighting factor here is ρ = 4 and the wrong channel estimation is eliminated. Monte Carlo experiments were conducted 100 times for each integer point of SNR. It can be concluded that the bandwidth results in lower precision in estimation. When the SNR is above −9 dB, the proposed method has a similar RFE and has good estimation performance for the signal. The main sources of error come from the precision of FFT and the spectrum offset.

5. Conclusions

In this paper, we propose an improved channelized MWC scheme for non-cooperative detection and frequency estimation of FHSS signals. Channelized MWC can capture the full FHSS bandwidth by distributing the sub-bands to each channel. Without an intermediate step of signal recovery, we detected the channel that contains FHSS signals in the frequency domain. The amount of calculation is significantly reduced compared to the traditional method. After this, we estimated the carrier frequency by directly processing the compressed sampling data. The theoretical analysis and numerical simulations demonstrate the validity and correctness of our method. The experimental results illustrate that the weighting factor of the channel and the width of a single hop have remarkable influence on the performance of detection and estimation in the channelized MWC. We can improve the sensitivity of the system by adjusting the weighting factor, which is flexible, SNR is relatively low. In future research, we would like to explore the real implementation of channelized MWC and extend the system to detect multi-target FHSS signals.

Author Contributions

Z.L. and P.Y. conceived the idea and wrote the paper. Z.L. designed and performed the experiments and analyzed the results. L.Z. contributed analysis tools and reviewed the paper.

Funding

This research received no external funding.

Acknowledgments

Our work had received important English editing from MDPI.

Conflicts of Interest

The authors declare no conflict of interest.

Appendix A

This part shows the basic Structure of the MWC compressed sampling system.
The MWC is mainly aimed at sparse multi-band signals. Assume that x ( t ) is a continuous time signal with a range within F = [ 1 / 2 T , 1 / 2 T ) , where Nyquist frequency f N Y Q = 1 / T . If x ( t ) is a sparse multi-band signal, it can be reconstructed from the low dimension projection of the original signal [15]. Figure A1 shows the basic structure of MWC under-sampling system.
Figure A1. MWC under-sampling system.
Electronics 07 00170 g0a1
MWC consists of m parallel channels. In each channel, the multiband signal x ( t ) is multiplied with a different mixing function, and p i ( t ) , i = 1 , 2 , , m . Each mixing function is periodic with period T p = 1 / f p . p i ( t ) is set as a sign function for each of the M equal time intervals and other forms are possible, since the system only requires p i ( t ) periods, which is expressed as follows:
α i k = p i ( t ) , k T p M t ( k + 1 ) T p M
where 0 k M 1 and α i k { + 1 , 1 } .
The purpose of this mixing function is to create aliases, so that the mixed signals x i ( t ) have information about the entire spectrum in the baseband F p = [ f p 2 , f p 2 ] . Taking the ith channel as an example, the Fourier expansion of p i ( t ) is as below:
p i ( t ) = l = + c i l e j 2 π l f p t
where c i l is Fourier series coefficient and is expressed as:
c i l = 1 T p 0 T p p i ( t ) e j 2 π l f p t d t
The Fourier transform of mixing signal x i ( t ) = x ( t ) p i ( t ) is:
X i ( f ) = l = + c i l X ( f l f p )
Suppose that the filter H ( f ) is an ideal rectangular function. Consequently, the uniform sequence y i [ n ] has only frequencies in the [ f s / 2 , f s / 2 ] . The DTFT of y i [ n ] is expressed as:
Y i ( e j 2 π f T s   ) = l = L 0 + L 0 c i l X ( f l f p ) , f F s
where L 0 is selected as the smallest integer as:
f s 2 + ( L 0 + 1 ) f p f n y q 2 L 0 = f n y q + f s 2 f p 1
where f s = 1 / T s is the sampling rate; and means round up.
From the above equation, c i l can be denoted as:
c i l = 1 T p 0 T p p i ( t ) e j 2 π l f p t d t = k = 0 M 1 α i k e j 2 π M l k ( 1 T p 0 T p M e j 2 π l f p t d t )
Setting θ = e j 2 π / M , the expression in the parentheses from the above equation can be written as:
d l = 1 T p 0 T p M e j 2 π l f p t d t = { 1 M l = 0 1 θ l j 2 π l l 0
Let F ¯ be the M × M discrete Fourier transform (DFT) matrix with the ith column, which is denoted by:
F ¯ i = [ θ 0 i , θ 1 i , , θ ( M 1 ) i ] T , 0 i M 1
Let F be the subset of F ¯ with columns [ F ¯ L 0 , F ¯ L 0 ] . Let S be the m × M sign matrix, with S i k = α i k , while D = d i a g { d L 0 , , d L 0 } is L × L diagonal matrix with d l defined by (A8). The Y ( f ) can be:
Y ( f ) = S F D Z ( f ) = A Z ( f )   f F s
where Z ( f ) = [ X ( f L 0 f p ) , , X ( f ) , , X ( f + L 0 f p ) ] T and A = S F D .
Recovering Z from Y involves finding the sparsest solution that satisfies (A10), which is equivalent to finding the set as support S = supp ( Z ( F p ) ) and it is an NP-hard problem. Furthermore, each X ( f ) is a function of f in F s and is interpreted as an infinite measurement vector (IMV) problem. Mishali and Eldar developed a two-stage process called the ‘Continuous-to-Finite’ (CTF) block [15,16], which forces (A1) to a finite dimensional problem.

References

  1. Torrieri, D. Cellular frequency-hopping cdma systems. In Proceedings of the IEEE Vehicular Technology Conference, Houston, TX, USA, 16–20 May 1999; 6451034. Volume 912, pp. 919–925. [Google Scholar]
  2. Lv, J. Application of the wavelet rearrangement algorithm in the detection of time–frequency analysis of non-cooperative frequency hopping signals. In Proceedings of the IEEE International Conference on Wireless Communication and Sensor Network, Beijing, China, 21–25 October 2012; 13430309. Volume 1, pp. 18–26. [Google Scholar]
  3. Luan, H.; Hua, J. Blind detection of frequency hopping signal using time–frequency analysis. In Proceedings of the IEEE International Conference on Wireless Communications Networking and Mobile Computing, Chengdu, China, 23–25 September 2010; 11594302. Volume 1, pp. 1–4. [Google Scholar]
  4. Wael, G.; Aawatif, H. Joint time–frequency spectrum sensing for cognitive radio. In Proceedings of the IEEE International Symposium on Applied Sciences in Biomedical and Communication Technologies, Rome, Italy, 7–10 November 2010; 11777564. Volume 1, pp. 1–4. [Google Scholar] [CrossRef]
  5. Luo, S.E.; Luo, L.Y. Adaptive detection of an unknown fh signal based on image features. In Proceedings of the IEEE International Conference on Wireless Communications, Networking and Mobile Computing, Beijing, China, 24–26 September 2009; 10952126. Volume 1, pp. 1–4. [Google Scholar] [CrossRef]
  6. Sirotiya, M.; Banerjee, A. Detection and estimation of frequency hopping signals using wavelet transform. In Proceedings of the IEEE Uk-India-Idrc International Workshop on Cognitive Wireless Systems, New Delhi, India, 13–14 December 2010; 11852048. Volume 1, pp. 1–5. [Google Scholar]
  7. Miller, L.E.; Lee, J.S.; Torrieri, D.J. Frequency-hopping signal detection using partial band coverage. IEEE Trans. Aerosp. Electron. Syst. 1993, 29, 540–553. [Google Scholar] [CrossRef]
  8. Feng, L.; Namgoong, W. An adaptive maximally decimated channelized uwb receiver with cyclic prefix. IEEE Trans. Circuits Syst. I 2005, 52, 2165–2172. [Google Scholar] [CrossRef]
  9. Feng, L.; Namgoong, W. Oversampled channelized receiver for transmitted reference uwb system in the presences of narrowband interference. In Proceedings of the IEEE Signal Processing Systems, Austin, TX, USA, 13–15 October 2004; 8323843. Volume 1, pp. 48–52. [Google Scholar]
  10. Zhang, Y.J.; Liu, R.Y.; Song, H.J. A method of the detection of frequency-hopping signal based on channelized receiver in the complicated electromagnetic environment. In Proceedings of the IEEE International Conference on Intelligent Information Hiding and Multimedia Signal Processing, Adelaide, SA, Australia, 23–25 September 2015; 15804697. Volume 1, pp. 294–297. [Google Scholar] [CrossRef]
  11. Lehtomäki, J.J.; Juntti, M. Detection of frequency hopping signals using a sweeping channelized radiometer. Signal Process. 2005, 85, 2030–2043. [Google Scholar] [CrossRef]
  12. Kirolos, S.; Laska, J.; Wakin, M.; Duarte, M.; Baron, D.; Ragheb, T.; Massoud, Y.; Baraniuk, R. Analog-to-information conversion via random demodulation, Design. In Proceedings of the IEEE Applications, Integration and Software, Richardson, TX, USA, 29–30 October 2006; 9308666. Volume 1, pp. 71–74. [Google Scholar] [CrossRef]
  13. Kirolos, S.; Ragheb, T.; Laska, J.; Duarte, M.F.; Massoud, Y.; Baraniuk, R.G. Practical Issues in Implementing Analog-to-information Converters. In Proceedings of the IEEE International Workshop on System-On-Chip for Real-Time Applications, Cairo, Egypt, 27–29 December 2006; 9365961. Volume 1, pp. 141–146. [Google Scholar]
  14. Feng, P.; Bresler, Y. Spectrum-blind minimum-rate sampling and reconstruction ofmultiband signals. In Proceedings of the IEEE International Conference on Acoustics, Speech, and Signal Processing, Atlanta, GA, USA, 9 May 1996; 5478381. Volume 1683, pp. 1688–1691. [Google Scholar]
  15. Mishali, M.; Eldar, Y.C. From theory to practice: Sub-nyquist sampling of sparse wideband analog signals. IEEE J. Sel. Top. Signal Process. 2010, 4, 375–391. [Google Scholar] [CrossRef]
  16. Mishali, M.; Eldar, Y.C.; Dounaevsky, O.; Shoshan, E. Xampling: Analog to digital at sub-nyquist rates. IET Circuits Devices Syst. 2011, 5, 8–20. [Google Scholar] [CrossRef]
  17. Liu, W.; Huang, Z.; Wang, X.; Sun, W. Design of a single channel modulated wideband converter for wideband spectrum sensing: Theory, architecture and hardware implementation. Sensors 2017, 17, 1035. [Google Scholar] [CrossRef] [PubMed]
  18. Lv, W.; Wang, H.; Mu, S. Spectrum sensing using co-prime array based modulated wideband converter. Sensors 2017, 17, 1052. [Google Scholar] [CrossRef] [PubMed]
  19. Mishali, M.; Eldar, Y.C.; Tropp, J.A. Efficient sampling of sparse wideband analog signals. In Proceedings of the IEEE Convention of Electrical and Electronics Engineers, Eilat, Israel, 3–5 December 2008; 10442876. Volume 1, pp. 290–294. [Google Scholar] [CrossRef]
  20. Zhang, Y.; Yang, W.; Cheng, Y.; Mao, X.; Sheng, S. Compressed sensing-based fh-bpsk signals’ digital domain compressive sampling and reconstruction. In Proceedings of the IEEE International Conference on Signal Processing, Electric Engineering and Computer, Chengdu, China, 6–10 November 2016; 16757023. Volume 1, pp. 153–158. [Google Scholar] [CrossRef]
  21. Li, B.; Li, Y.; Zhu, Y.; Niu, Y.; Gao, Z. Compressive sensing based adaptive synchronous estimation for frequency hopping signal. In Proceedings of the IEEE International Conference on Mechatronic Sciences, Electric Engineering and Computer, Shengyang, China, 20–22 December 2013; 14547456. Volume 1, pp. 978–982. [Google Scholar] [CrossRef]
  22. Deng, F.; Zeng, F.; Li, R. Clustering-based compressive wide-band spectrum sensing in cognitive radio network. In Proceedings of the IEEE Fifth International Conference on Mobile Ad-Hoc and Sensor Networks, Fujian, China, 14–16 December 2009; 11135304. Volume 1, pp. 218–222. [Google Scholar] [CrossRef]
  23. Davenport, M.A.; Boufounos, P.T.; Wakin, M.B.; Baraniuk, R.G. Signal processings with compressive measurements. IEEE J. Sel. 2010, 4, 445–460. [Google Scholar] [CrossRef]
  24. Emam, H.A.; Salem, S.G.; Megahed, M.H.; Hamed, G.M.A. Detection and estimation of fhss signals using enhanced orthogonal matching pursuit. In Proceedings of the IEEE Radio Science Conference, Alexandria, Egypt, 13–16 March 2017; 16792538. Volume 1, pp. 353–361. [Google Scholar] [CrossRef]
  25. Yuan, J.; Tian, P.; Yu, H. The detection of frequency hopping signal using compressive sensing. In Proceedings of the IEEE International Conference on Information Engineering and Computer Science, Wuhan, China, 19–20 December 2009; 11033220. Volume 1, pp. 1–4. [Google Scholar] [CrossRef]
  26. Wu, J.; Liu, N.; Zhang, Y.; Shen, C. Blind detection of frequency hopping signal based on compressive sensing. In Proceedings of the IEEE International Conference on Consumer Electronics, Communications and Networks, Yichang, China, 21–23 April 2012; 12745732. Volume 1, pp. 1691–1694. [Google Scholar] [CrossRef]
  27. Sha, Z.; Liu, Z.; Huang, Z.; Zhou, Y. Covariance-based direction-of-arrival estimation of wideband coherent chirp signals via sparse representation. Sensors 2013, 13, 11490–11497. [Google Scholar] [CrossRef] [PubMed]
  28. Liu, F.; Marcellin, M.W.; Goodman, N.A.; Bilgin, A. Compressive sampling for detection of frequency-hopping spread spectrum signals. IEEE Trans. Signal Process. 2016, 64, 5513–5524. [Google Scholar] [CrossRef]
Figure 1. Traditional structure of FH system.
Electronics 07 00170 g001
Figure 2. Sub-band distribution.
Electronics 07 00170 g002
Figure 3. The relationship between Y ( f ) , X ( f ) and A ^ .
Electronics 07 00170 g003
Figure 4. Channelized MWC under-sampling system.
Electronics 07 00170 g004
Figure 5. Improved channelized MWC under-sampling system.
Electronics 07 00170 g005
Figure 6. Interleaver model.
Electronics 07 00170 g006
Figure 7. Original periodic function: (a) time domain, (b) frequency domain and reconstructed periodic function: (c) time domain, (d) frequency domain.
Electronics 07 00170 g007
Figure 8. Single hop spectrum.
Electronics 07 00170 g008
Figure 9. Channel estimation.
Electronics 07 00170 g009
Figure 10. Detection probability of channel estimation.
Electronics 07 00170 g010
Figure 11. Relative frequency error of frequency estimation.
Electronics 07 00170 g011
Table 1. Simulation Settings.
ParameterValue
Carrier Frequency[2, 7 GHz]
Hop Rate[10, 100 khop/s]
Single Hop Bandwidth B [5, 30 MHz]
Mode TypeDQPSK
Sub-band Number L 195
Periodic Sequence Frequency f p 51.3 MHz
Sampling Rate f s 51.3 MHz
Channel Number m 50
Length of FFT128
Table 2. Amount of Calculation Required
OperationOMPChannelized MWC
Multiplication m 2 N + o ( m 3 ) m N 2 log 2 N
Addition m 2 N + o ( m 3 ) m N log 2 N

