1. Introduction
Organic light-emitting diodes (OLEDs) have received particular attention as a future display device for their many advantages such as their thinness, light weight, flexibility, high contrast ratio, and low power consumption [
1,
2,
3]. Full-colour active-matrix (AM) OLED panels have already been utilized in large-sized TVs as well as cellular phones. One of the merits of OLED displays compared to conventional liquid crystal displays is the outstanding colour quality of OLEDs [
4]. The colour gamut, which is usually an area of a triangle composed of red (R), green (G), blue (B) colour coordinates, can be one of the display evaluation factors. A large colour gamut means that the display can express much more luxuriant colours.
General OLEDs have broad electroluminescence (EL) spectra, and this can be a merit from a solid-state lighting sources point of view because broad EL spectra are able to achieve a high colour rendering index (CRI) value, which is one of the critical factors for lighting sources [
5,
6]. However, narrow EL spectra are required for a large colour gamut display because the colour purity increases as the full-width-half-maximum (FWHM) of EL spectra are reduced [
7]. The main emission-peak of EL spectra is also significant for deep colour expression. Optical design is needed to improve the colour purity of OLEDs. The micro-cavity resonance effect is commonly used for the optical design of a device structure [
8,
9]. Both electrodes in OLEDs should have high reflectance for strong micro-cavity resonance effects. Top-emission OLEDs typically use a thin-metal top electrode which has high reflectance as well as a highly reflective metal bottom electrode which enables a strong micro-cavity resonance effect [
10]. However, common bottom-emission OLEDs employ indium–tin–oxide (ITO) as a bottom electrode, which has low reflectance, and thus the micro-cavity resonance effect in bottom-emission OLEDs is relatively lower than that in top-emission OLEDs [
11].
In this work, we report a simple method to enhance the colour purity of bottom-emission OLEDs by embedding a micro-cavity structure in cathodes. We have fabricated R, G, and B OLEDs with micro-cavity structure embedded cathodes and changed the optical length of the micro-cavity structure. The devices with micro-cavity structure embedded cathodes show an improved colour gamut of 91.5% (National Television System Committee (NTSC)), 95.8% (Adobe RGB), 129.2% (sRGB) compared to those of the devices without micro-cavity structure embedded cathodes—59.2% (NTSC), 62.0% (Adobe RGB), and 83.6% (sRGB).
2. Materials and Methods
Glass substrates with patterned indium–tin–oxide (ITO) were used for device fabrication. The substrates were sequentially cleaned with sulfuric acid, acetone, methanol, and rinsed with deionized water, and the cleaned substrates were dried in a vacuum oven at 120 °C. Prior to the vacuum thermal evaporation process, the ITO surface was treated with oxygen plasma to eliminate contaminants. All organic materials and metals were deposited using the vacuum thermal evaporation method. The fabricated OLEDs were transferred to an inert environment glove-box, where they were encapsulated using a UV-curable epoxy and a glass cap containing a moisture absorbent. The emissive active area of the fabricated devices was 2 × 2 mm2.
The reflectance of the OLEDs were characterized using an ultraviolet-visible-near-infrared (UV-Vis-NIR) spectrophotometer (LAMBDA 750, PerkinElmer, Waltham, MA, USA). The current–voltage (
J-
V) characteristics were measured using a Keithley-238 source-measure unit, and the luminance (
L) and EL spectra were examined using a spectroradiometer (CS-2000, Konica Minolta, Ramsey, NJ, USA). All measurements were conducted at room temperature in a dark room. We used all of the measured refractive indices (refractive index (n) and extinction coefficients (k)) of the organic materials using an ellipsometer (M-2000D, J.A. Woollam Co., Lincoln, NE, USA). The n and k values of silver (Ag) are given in the literature [
12].
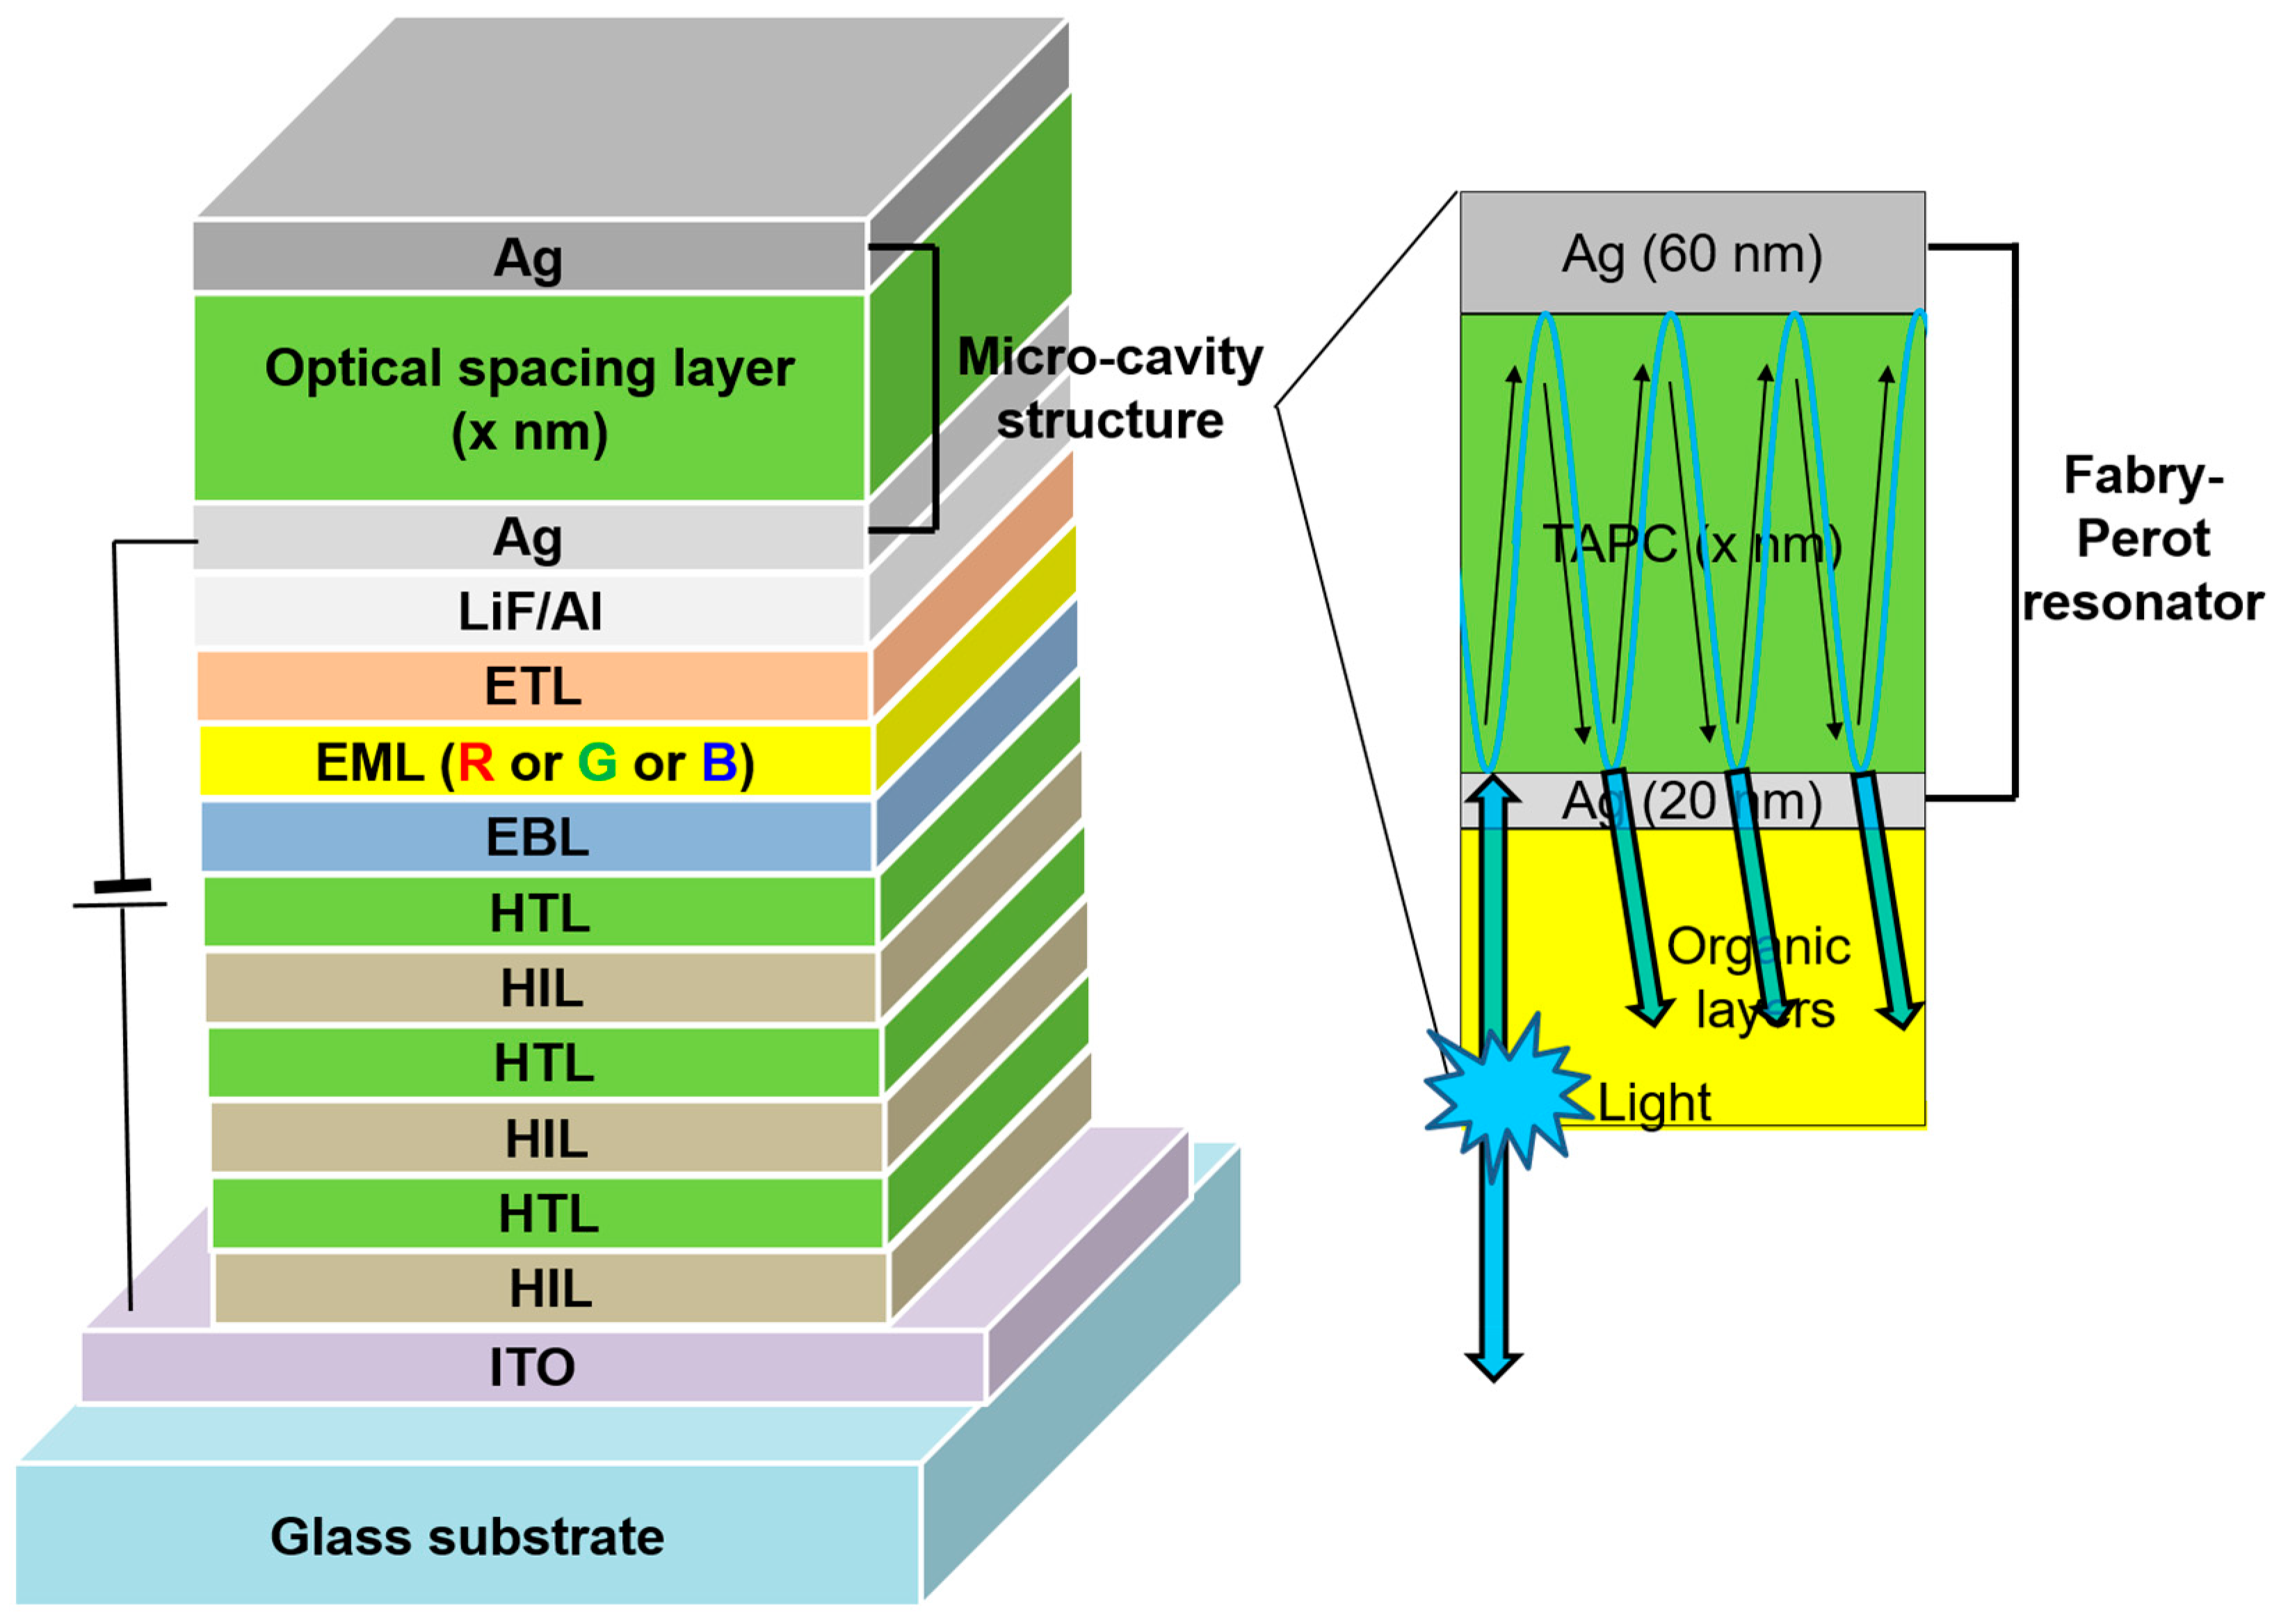
The OLEDs with micro-cavity structure embedded cathodes have the following structure, as shown in
Figure 1: ITO/1,4,5,8,9,11-hexaazatriphenylene-hexacarbonitrile (HAT-CN, 10 nm) as a hole-injecting layer (HIL)/1,1-bis((di-4-tolylamino)phenyl)cyclohexane (TAPC, 40 nm) for the red and the blue devices and N,N′-diphenyl-N,N′-bis(1-naphthyl)-1,1′-biphenyl-4,4’-diamine (NPB, 40 nm) for the green device as a hole-transporting layer (HTL)/HIL (10 nm)/HTL(40 nm)/HIL (10 nm)/HTL (40 nm)/4,4′,4″-tris(
N-carbazolyl)-triphenylamine (TcTa, 10 nm) as an electron-blocking layer (EBL) for the blue and the green devices/2,6-bis(3-(carbazol-9-yl)phenyl)pyridine (26DCzPPy) doped with bis(2-methyldibenzo(f,h)-quinoxaline) (acetylacetonate) iridium(III) ((MDQ)
2Ir(acac), 20 nm) as a red emitting layer (EML), PGH02 [
13] doped with GD (20 nm) as a green EML, BH doped with BD (20 nm) as a blue EML/1,3-bis(3,5-dipyrid-3-yl-phenyl)benzene (BmPyPB, 55 nm) for the red device, ETM1 (60 nm) for the green device, and ETM2 (30 nm) for the blue device as an electron-transporting layer (ETL)/lithium fluoride (LiF, 1 nm) as an electron-injecting layer (EIL)/aluminum (Al, 1.5 nm)/Ag (20 nm) as a semi-transparent reflective cathode/TAPC (
x nm,
x = 100, 110, 120, 130, 140, 150, 160, 170) as an optical spacing layer (OSL)/Ag (60 nm) as an optically reflective layer. The multi-layer structure of HIL/HTL was used to drive the voltage reduction in OLEDs [
14]. The thin metal cathode layer of Ag 20 nm may pose a problem for large-sized display panels due to the increase of electric resistance, but it can be sufficiently applied to a small-sized display panel [
15].
The micro-cavity structure embedded cathode can be a Fabry–Perot resonator [
16,
17], as shown in
Figure 1. The Fabry–Perot factor (
fFP(
λ)) is given by [
16]
in which
TAg(20 nm) is the transmittance through thin-metal cathode layer from the OSL (TAPC in this work) to the bottom side,
RAg(60 nm) and
RAg(20 nm) are the reflectance values at the OSL-Ag (60 nm) and OSL-Ag (20 nm) interfaces, respectively. Moreover, Δ
φ is the round-trip phase term given by
in which
φAg(60 nm) and
φAg(20 nm) are phase changes occurring upon reflections at interfaces with the OSL-Ag (60 nm) layer and OSL-Ag (20 nm) layer, respectively, and
nOSL and
dOSL are the refractive index and the thickness of the OSL. From Equations (1) and (2), the EL spectra of the devices with micro-cavity structure embedded cathodes can be changed depending on the thickness of the OSL.
3. Results and Discussion
To investigate the effect of the micro-cavity structure embedded cathodes, optical simulations of the devices with different OSL thicknesses were performed using commercial software (SETFOS 4.6, Fluxim) before fabricating the devices. The R, G, and B devices have different colour coordinates depending on the OSL thicknesses as shown in
Figure 2. This result suggests that the micro-cavity structure embedded cathodes can change the colour of the device by controlling the OSL thickness. We calculated the color gamut of the devices using simulated Commission Internationale de L’Eclairage (CIE) colour coordinates of R, G, and B. The devices with micro-cavity structure embedded cathodes show a colour gamut of 89.0% (NTSC), 93.1% (Adobe RGB), and 125.6% (sRGB) when the OSL thicknesses of R, G, and B devices are 120 nm, 120 nm, and 110 nm, respectively. We also calculated the colour gamut of the devices without micro-cavity structure embedded cathodes which were 68.2% (NTSC), 71.4% (Adobe RGB), and 96.3% (sRGB). The colour gamut of the device is increased by approximately 21–29%, and this result implies that the colour gamut of the bottom-emission OLEDs can be improved by using micro-cavity structure embedded cathodes.
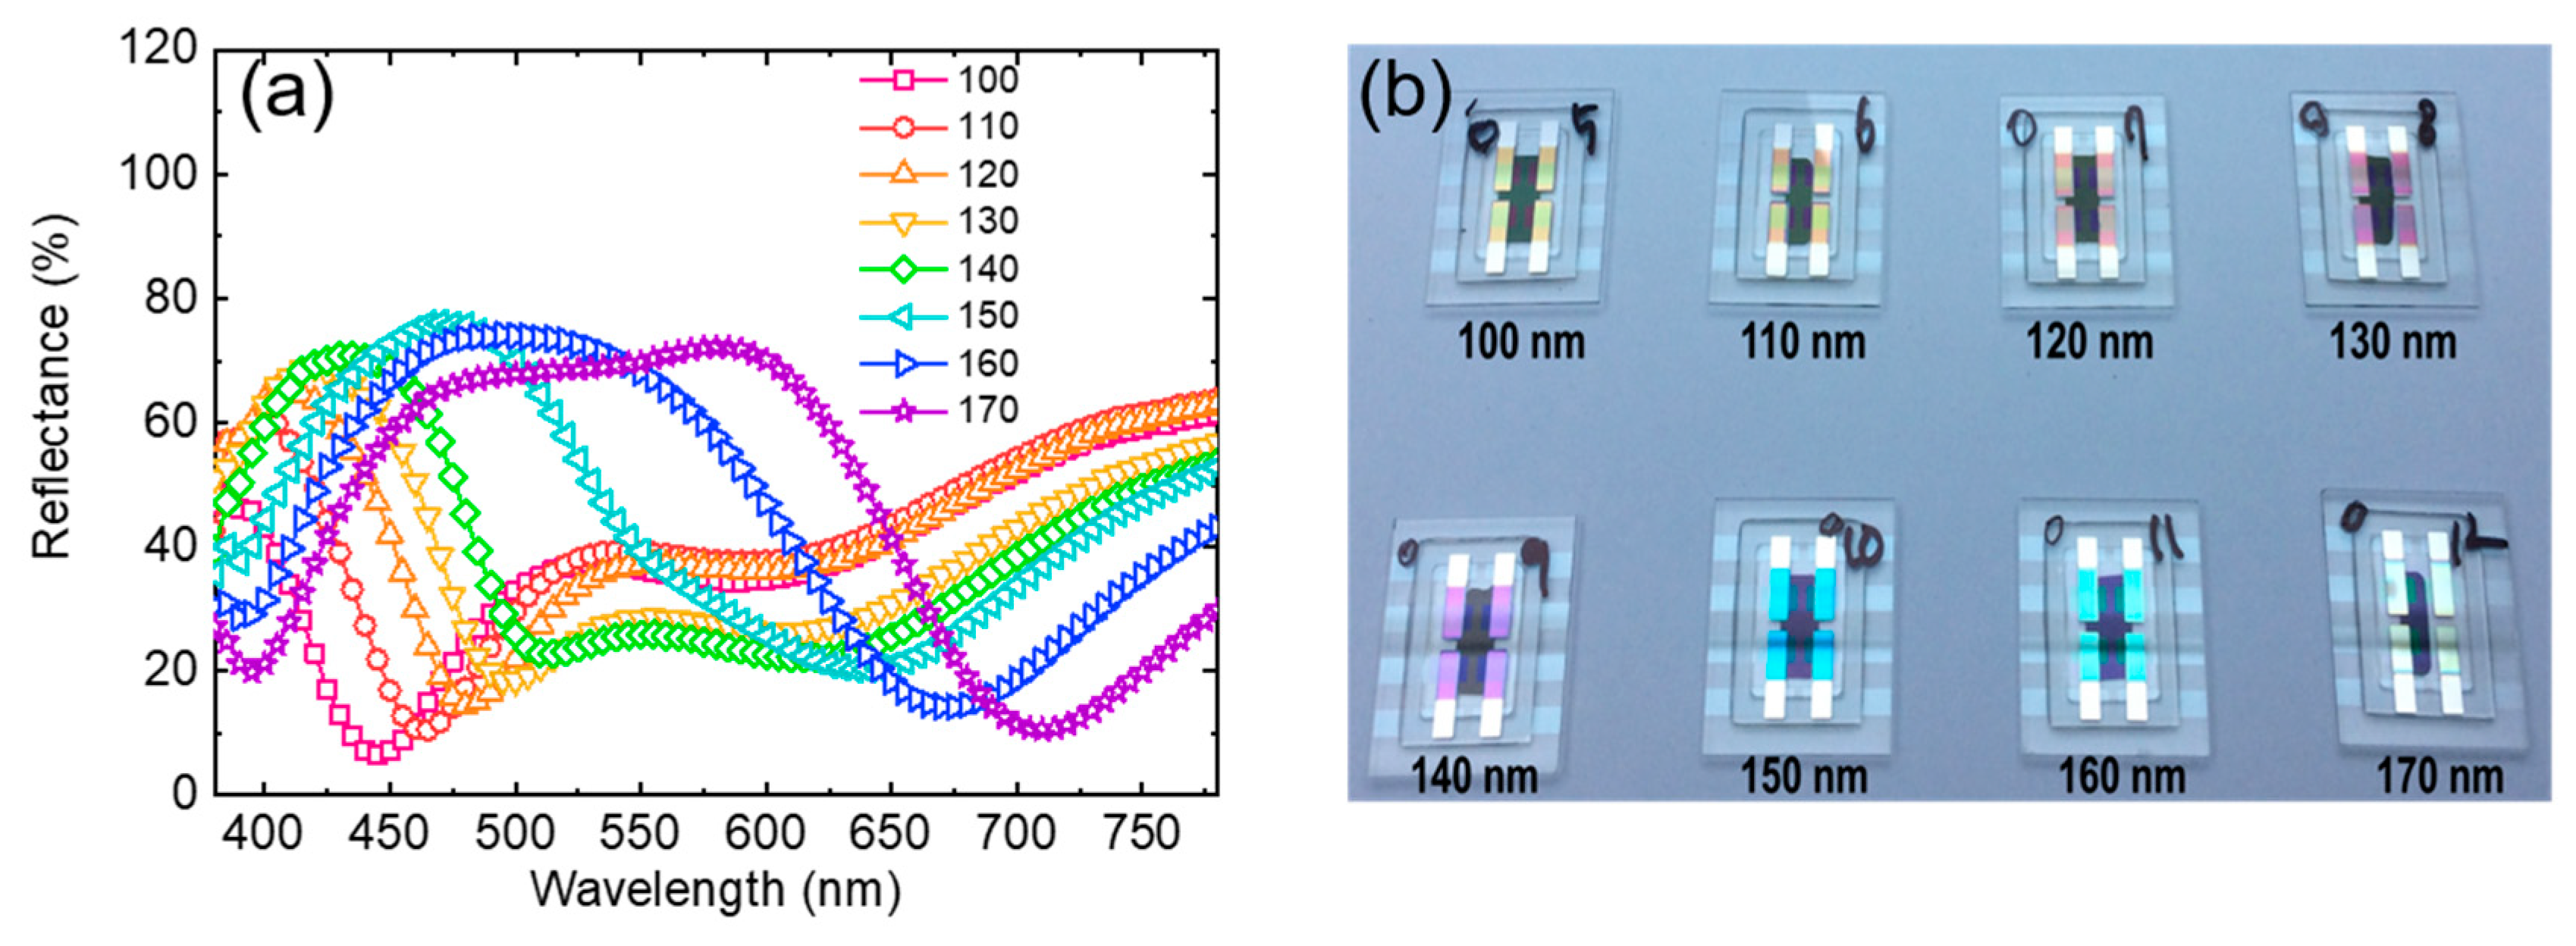
The fabricated OLEDs with micro-cavity structure embedded cathodes have different optical reflectance spectra depending on the OSL thicknesses, as shown in
Figure 3a. Consequently, each device has different colours depending on the OSL thicknesses when the device is in an off-state, as shown in
Figure 3b. For example, the devices with OSL thicknesses of 100 nm, 140 nm, and 150 nm represent yellow, violet, and blue colours, respectively. This result means that the Fabry–Perot resonator is successfully fabricated and effectively operated depending on the OSL thicknesses.
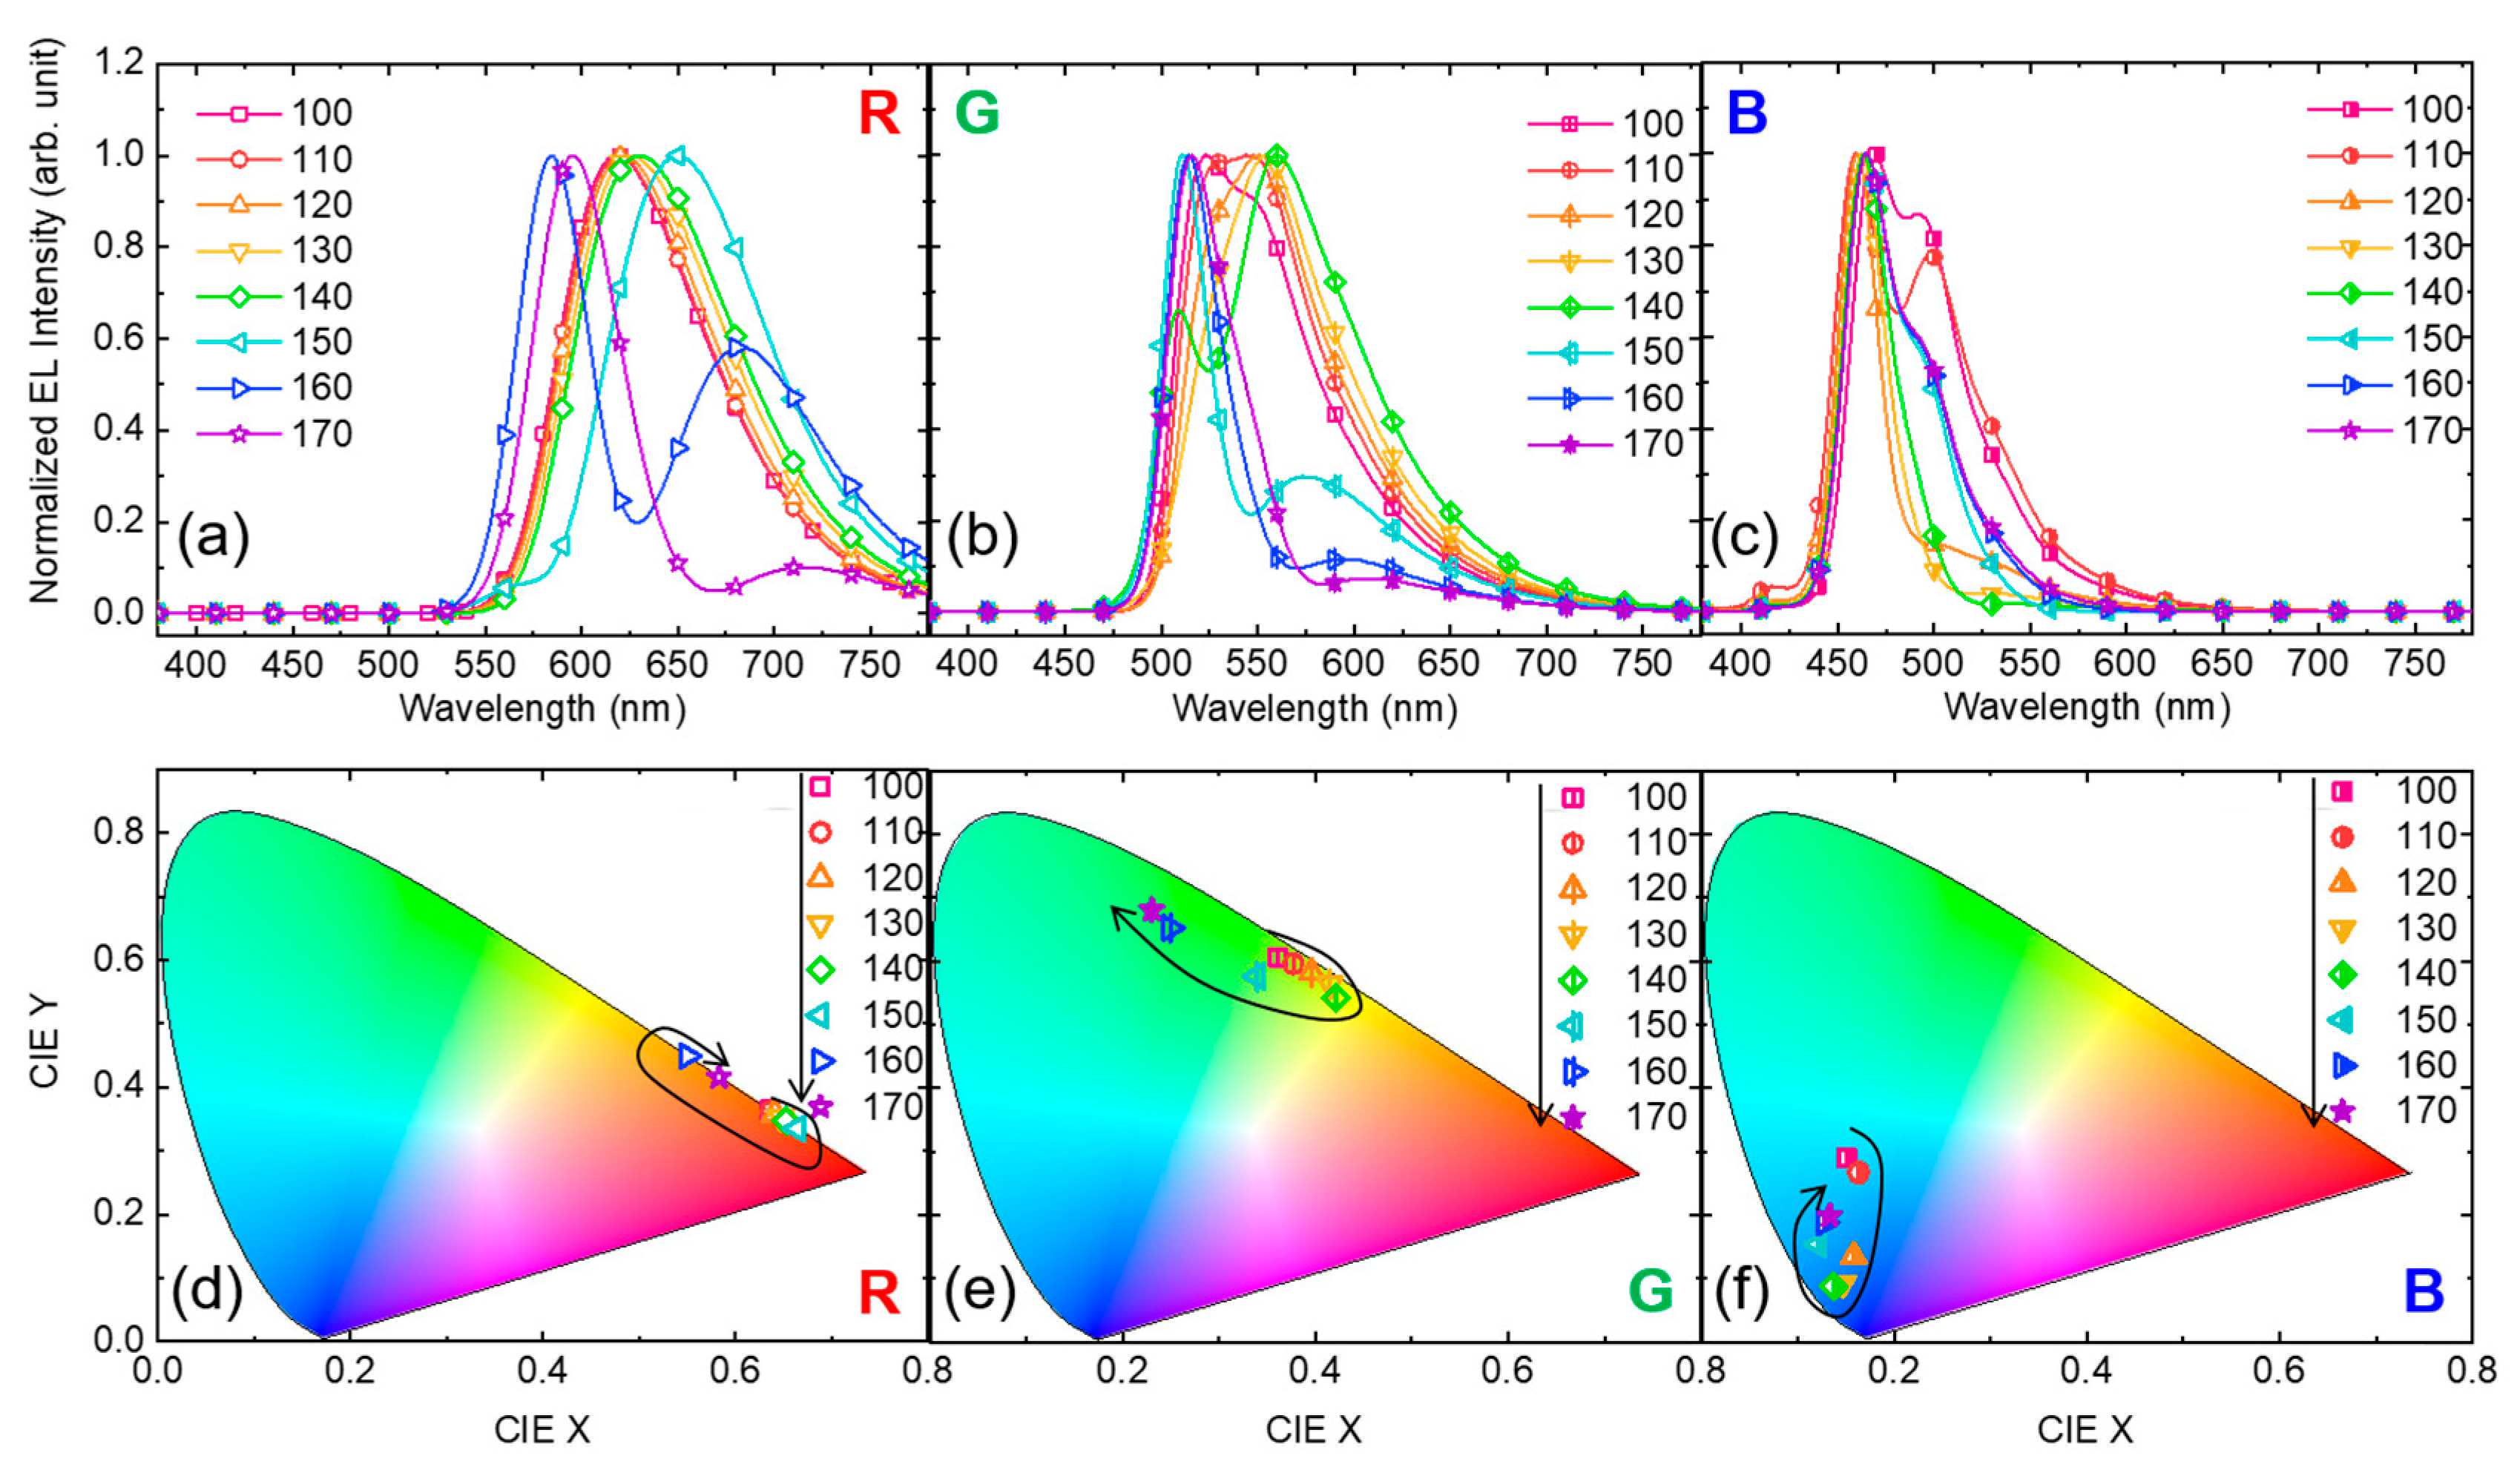
Figure 4 shows the EL spectra and CIE colour coordinates of red, green, and blue devices depending on OSL thicknesses. The emission-peak, FWHM, and colour of all devices dramatically change as the thickness of OSL increases from 100 nm to 170 nm. For example, the red device with 150 nm OSL shows a main emission-peak of 650 nm and FWHM of 97 nm, but 585 nm and 684 nm of first and second emission-peaks are shown in the red device with 160 nm OSL. Each peak has different FWHMs of 44 nm and 94 nm, respectively. In spite of the 10 nm OSL difference, two devices show very different colours, which have CIE colour coordinates of (0.664, 0.335) and (0.549, 0.449) for 150 nm and 160 nm OSL, respectively. The red device with a 150 nm OSL shows the deepest red colour among red devices with different OSL thicknesses. The green device with a 140 nm OSL shows first and second emission-peaks of 509 nm and 560 nm, respectively. The second emission-peak is higher than first emission-peak, resulting in a yellowish-green colour with a CIE colour coordinate of (0.421, 0.542). In contrast, the green device with a 170 nm OSL has a first emission-peak of 516 nm with a narrow FWHM of 43 nm. This device also has a second emission-peak at 610 nm, but the intensity of the second emission-peak is only about 7.4% of the first emission-peak’s intensity. The green device with a 170 nm OSL shows the deepest green colour with a CIE colour coordinate of (0.230, 0.681) among green devices with different OSL thicknesses. In the case of the blue device, the device with 140 nm OSL shows the deepest blue colour with an emission-peak of 464 nm, a FWHM of 30 nm, and CIE colour coordinates of (0.137, 0.088). Although the blue devices with 120 nm and 130 nm have a slightly narrower FWHM compared to that of the blue device with 140 nm, they show a lighter blue colour with CIE colour coordinates of (0.158, 0.135) and (0.147, 0.092). These results imply that the position of the main emission-peak, FWHM, and the intensity of the unintended second emission-peak are major factors to decide the colour and purity of devices, and we can simply control the colour of devices by changing the OSL thickness.
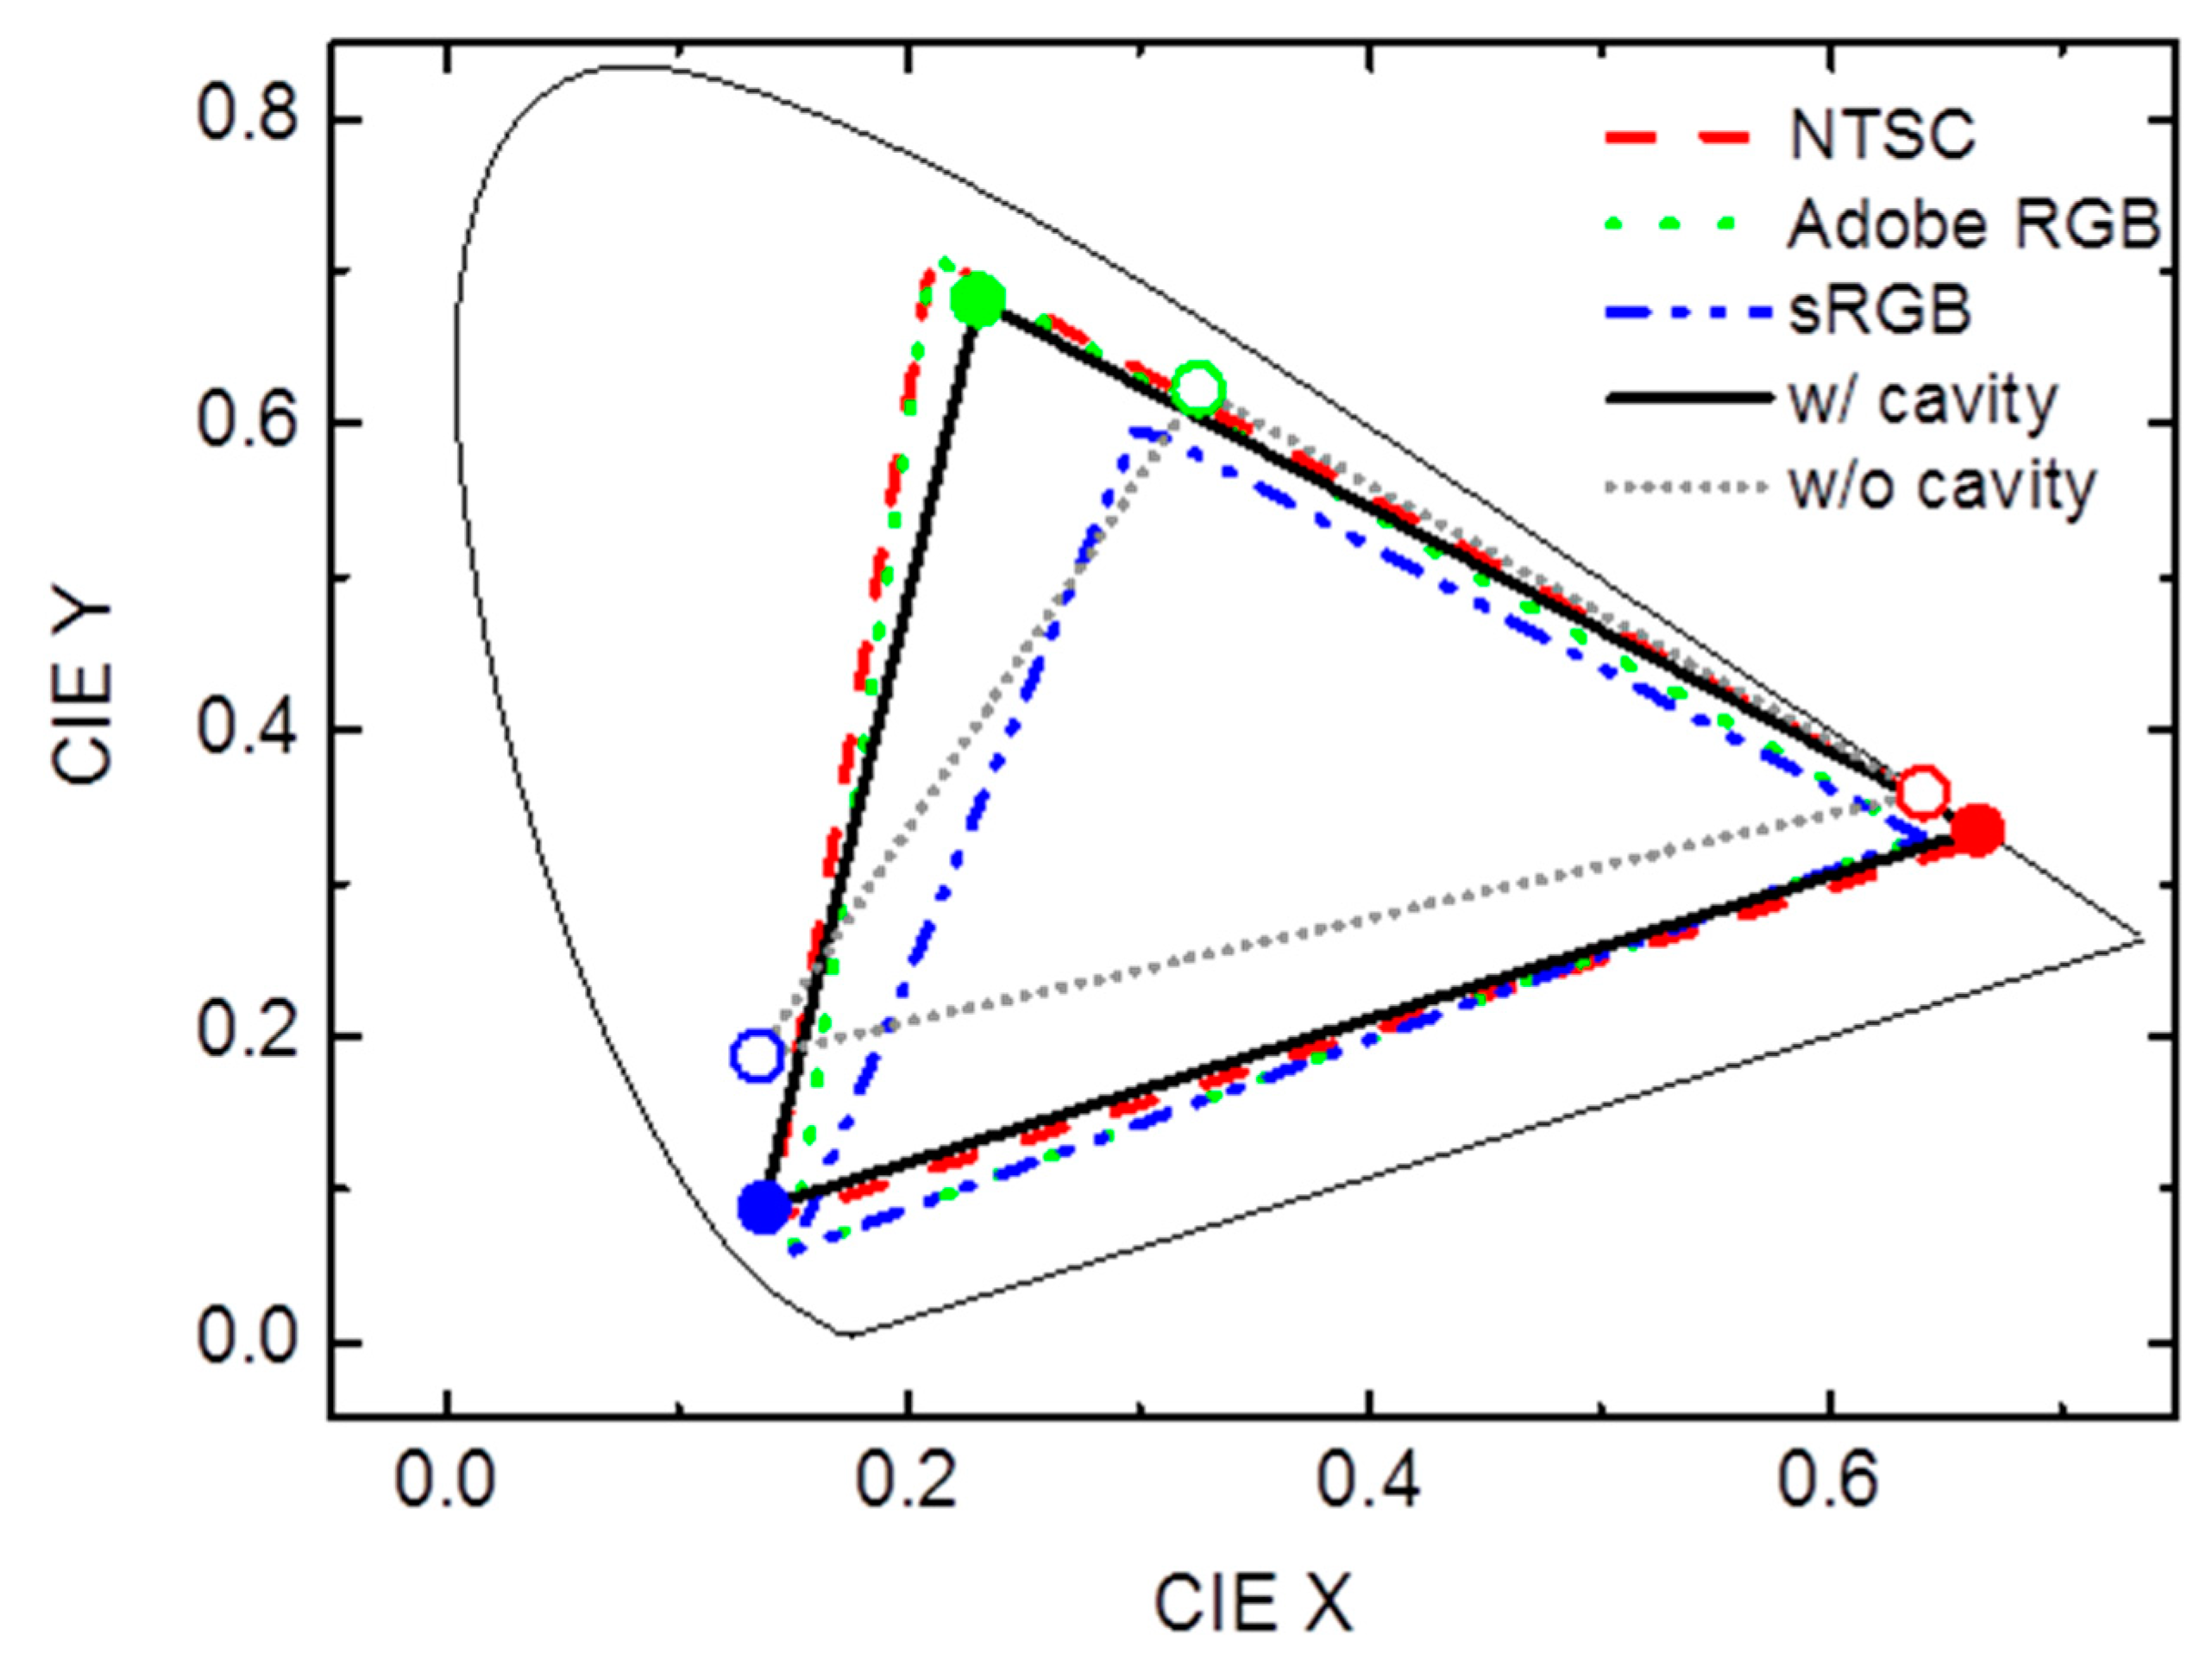
Figure 5 exhibits CIE colour coordinates and the gamut of NTSC, Adobe RGB, sRGB as well as R, G, B devices with and without micro-cavity structure embedded cathodes [
18]. We calculated the area of the triangle composed of CIE colour coordinates of R, G, B and compared the area with triangular areas of NTSC, Adobe RGB, and sRGB colour coordinates. As with the optical simulation results, the devices with micro-cavity structure embedded cathodes have a much larger triangle area compared with the devices without micro-cavity structure embedded cathodes. For example, the R, G, and B devices with OSL thicknesses of 150, 170, and 140 nm, respectively, have a colour gamut of 91.5% (NTSC), 95.8% (Adobe RGB), and 129.2% (sRGB) and these are approximately 32~46% higher values in comparison to the colour gamut of the devices without micro-cavity structure embedded cathodes—59.2% (NTSC), 62.0% (Adobe RGB), 83.6% (sRGB).
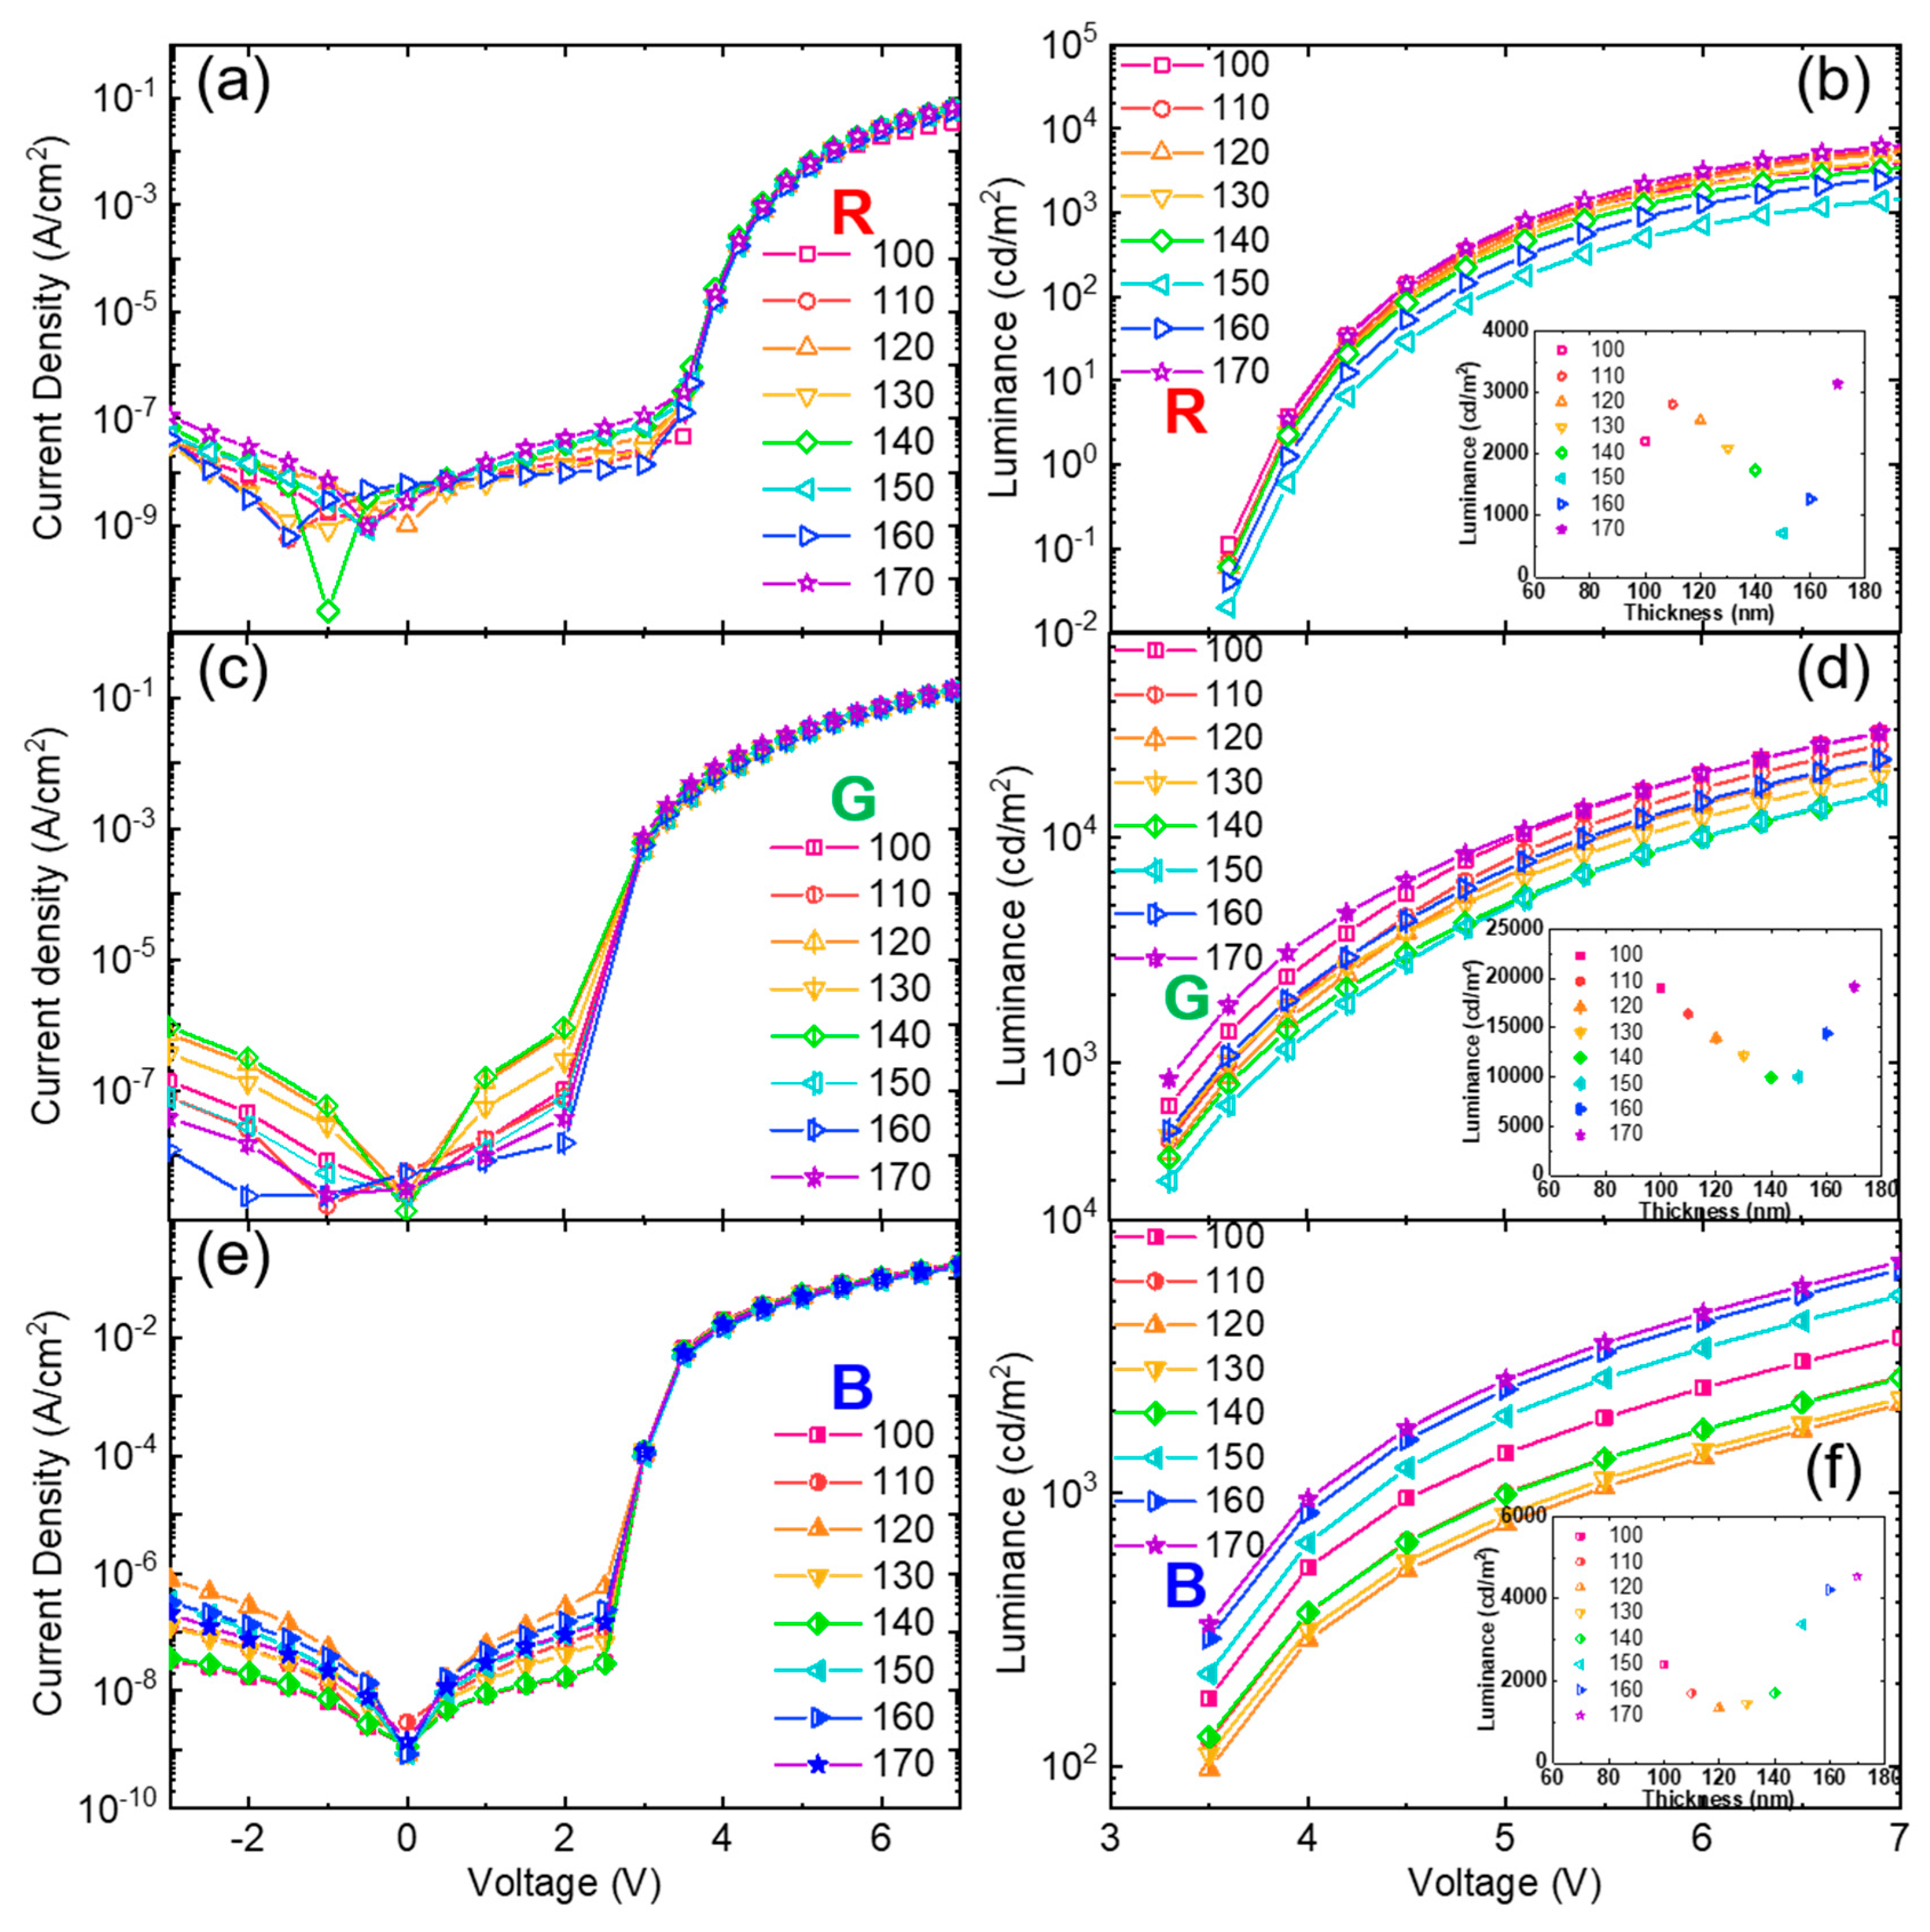
Figure 6 depicts the current density–voltage–luminance (
J-
V-
L) characteristics of R, G, B devices with micro-cavity structure embedded cathodes depending on OSL thicknesses. All devices show a low leakage current in the reverse bias region and each device shows nearly the same current in the forward bias region regardless of OSL thicknesses because the OSL of TAPC and the top reflective layer of Ag (60 nm) in the micro-cavity embedded cathode work only optically. This result indicates that a micro-cavity structure embedded electrode can be a good cathode and the micro-cavity structure rarely affects the electrical performance of the device. However, the luminance characteristics of devices are different depending on OSL thicknesses. For instance, the red device with a 170 nm OSL shows 1416 cd/m
2 at 5.4 V, but the red device with a 150 nm OSL shows 322 cd/m
2 at the same voltage. In the same manner, the green device exhibits 4621 cd/ m
2 with a 170 nm OSL but 1833 cd/m
2 in the device with a 150 nm OSL at the same voltage of 4.2 V. The blue devices with 140 nm and 170 nm OSLs have a luminance of 366 cd/m
2 and 952 cd/m
2, respectively, at 4 V. These results may be due to the different EL spectra and the distribution of devices resulting from different optical lengths of micro-cavity structure [
19,
20,
21].
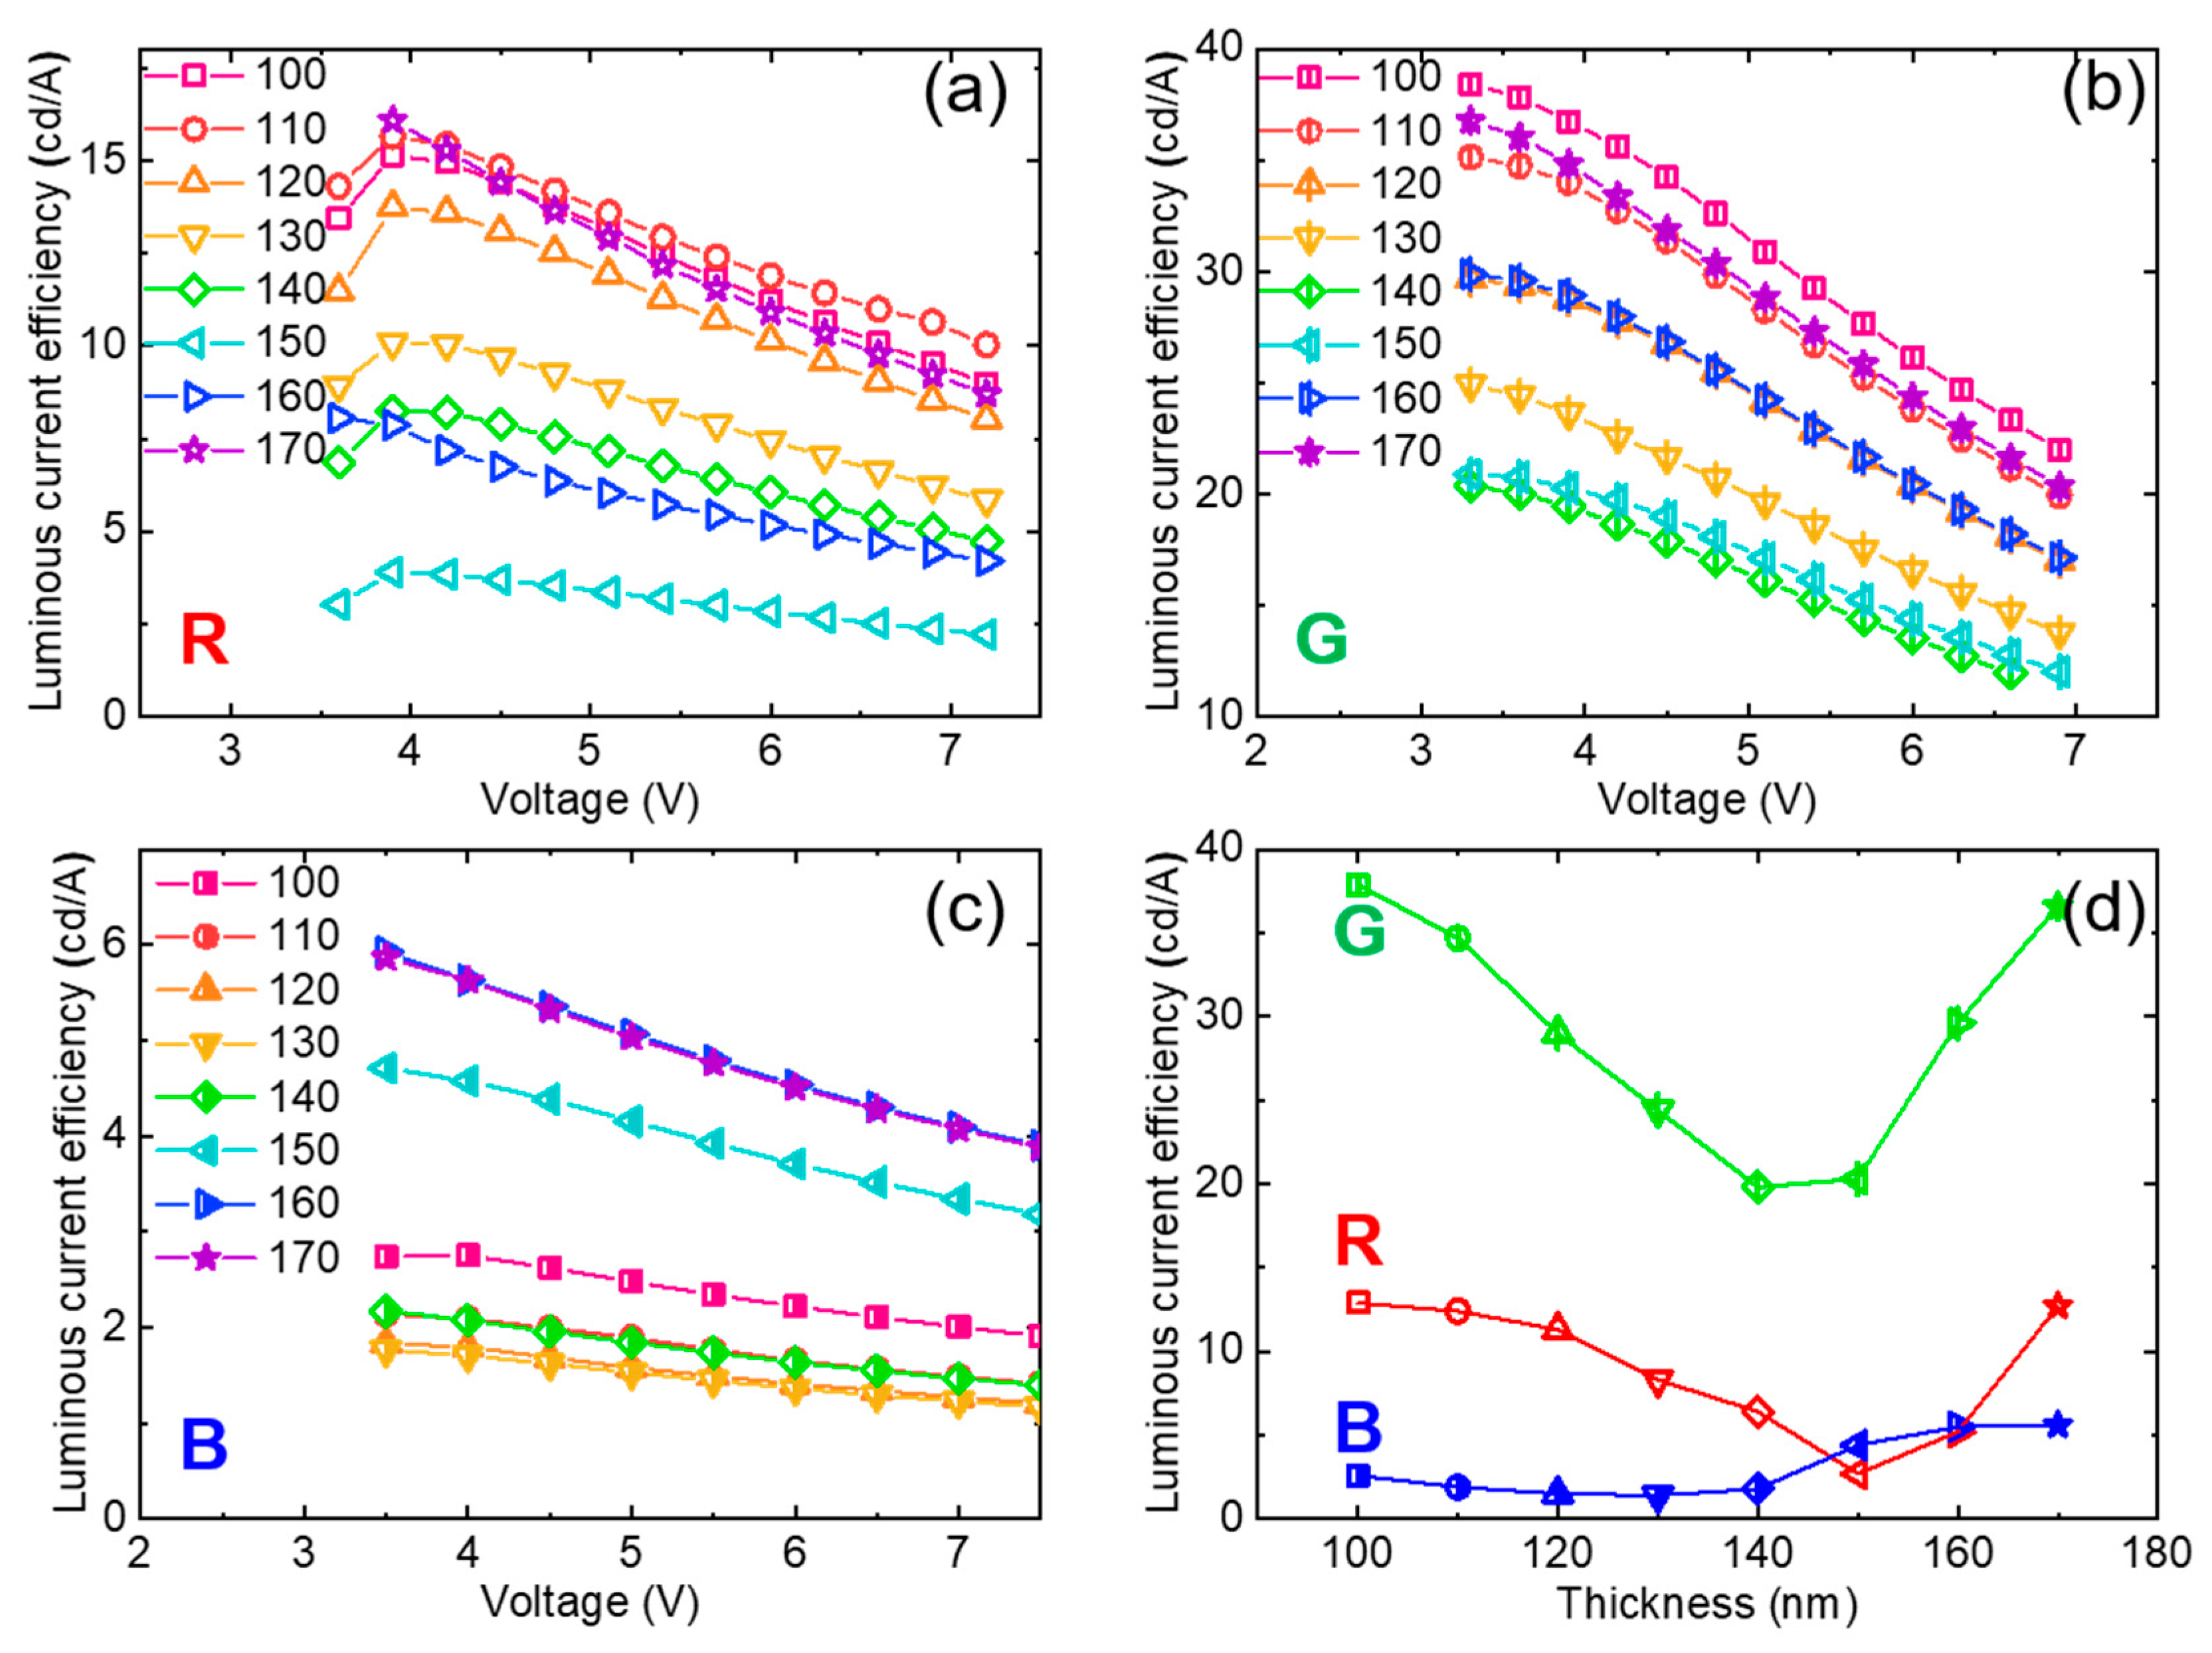
Figure 7 shows the luminous current efficiency of red, green, and blue devices with micro-cavity structure embedded cathodes. The devices have different efficiencies depending on the optical length of the micro-cavity structure. The red, green, and blue devices with a 170 nm OSL have 12.7 cd/A, 36.6 cd/A, and 5.6 cd/A at approximately 1000 cd/m
2, respectively. However, the red (OSL 150 nm), green (OSL 150 nm), and blue (OSL 140 nm) devices show 2.7 cd/A, 20.3 cd/A, and 1.8 cd/A, respectively, at about 1000 cd/m
2. The efficiency differences of these devices arise from the different luminance caused by the micro-cavity effect. The performance parameters of the R, G, and B devices with micro-cavity structure embedded cathodes are summarized in
Table 1.
4. Conclusions
The effects of micro-cavity structure embedded cathodes on the performance of red, green, and blue bottom-emission OLEDs were investigated using optical spacing layers with different thicknesses. The red, green, and blue devices show similar electrical characteristics, regardless of the optical length of their micro-cavity structure, but different optical characteristics such as luminance and EL spectra depending on the optical spacing layer thicknesses. The devices with micro-cavity structure embedded cathodes with OSL thicknesses of 150, 170, and 140 nm for R, G, and B, respectively, show an enhanced colour gamut of 91.5% (NTSC), 95.8% (Adobe RGB), and 129.2% (sRGB) compared with those of the devices without micro-cavity structure embedded cathodes—59.2% (NTSC), 62.0% (Adobe RGB), 83.6% (sRGB). Therefore, we believe that micro-cavity structure embedded cathodes can be a helpful and simple method for improving the colour gamut of OLEDs displays.


