
Universal Safety Distance Alert Device for Road Vehicles


Abstract
:
1. Introduction
2. Materials and Methods
2.1. Defining the Functional Requirements and Conceptual Design
- The device has to be able to measure the distance from the rear end of the host vehicle with sufficient range and sufficient accuracy to be able to operate at motorway speed limits (130 km/h).
- The device has to be able to measure the instant velocity of the host vehicle with sufficient accuracy to calculate the required safety distance.
- The device has to visually alert the driver(s) of the trailing vehicle(s) whenever their safety distance to the host vehicle is too short.
- The device has to alert the driver of the host vehicle of a possible or inevitable rear-end collision.
- The device has to be able to record all of the ride parameters (time, location, velocity, acceleration) for the last 1000 km of travel.
- The concept of the device must be such that a realization of a working prototype with the basic subset of functions will be possible by integrating components that are either readily available or can be made using the existing workshop equipment.
- The device must be installable into any motor vehicle with on-board electrical power without requiring any permanent changes to the vehicle or its systems.
- The previous seven requirements shall be fully fulfilled while minimizing the cost of the components.
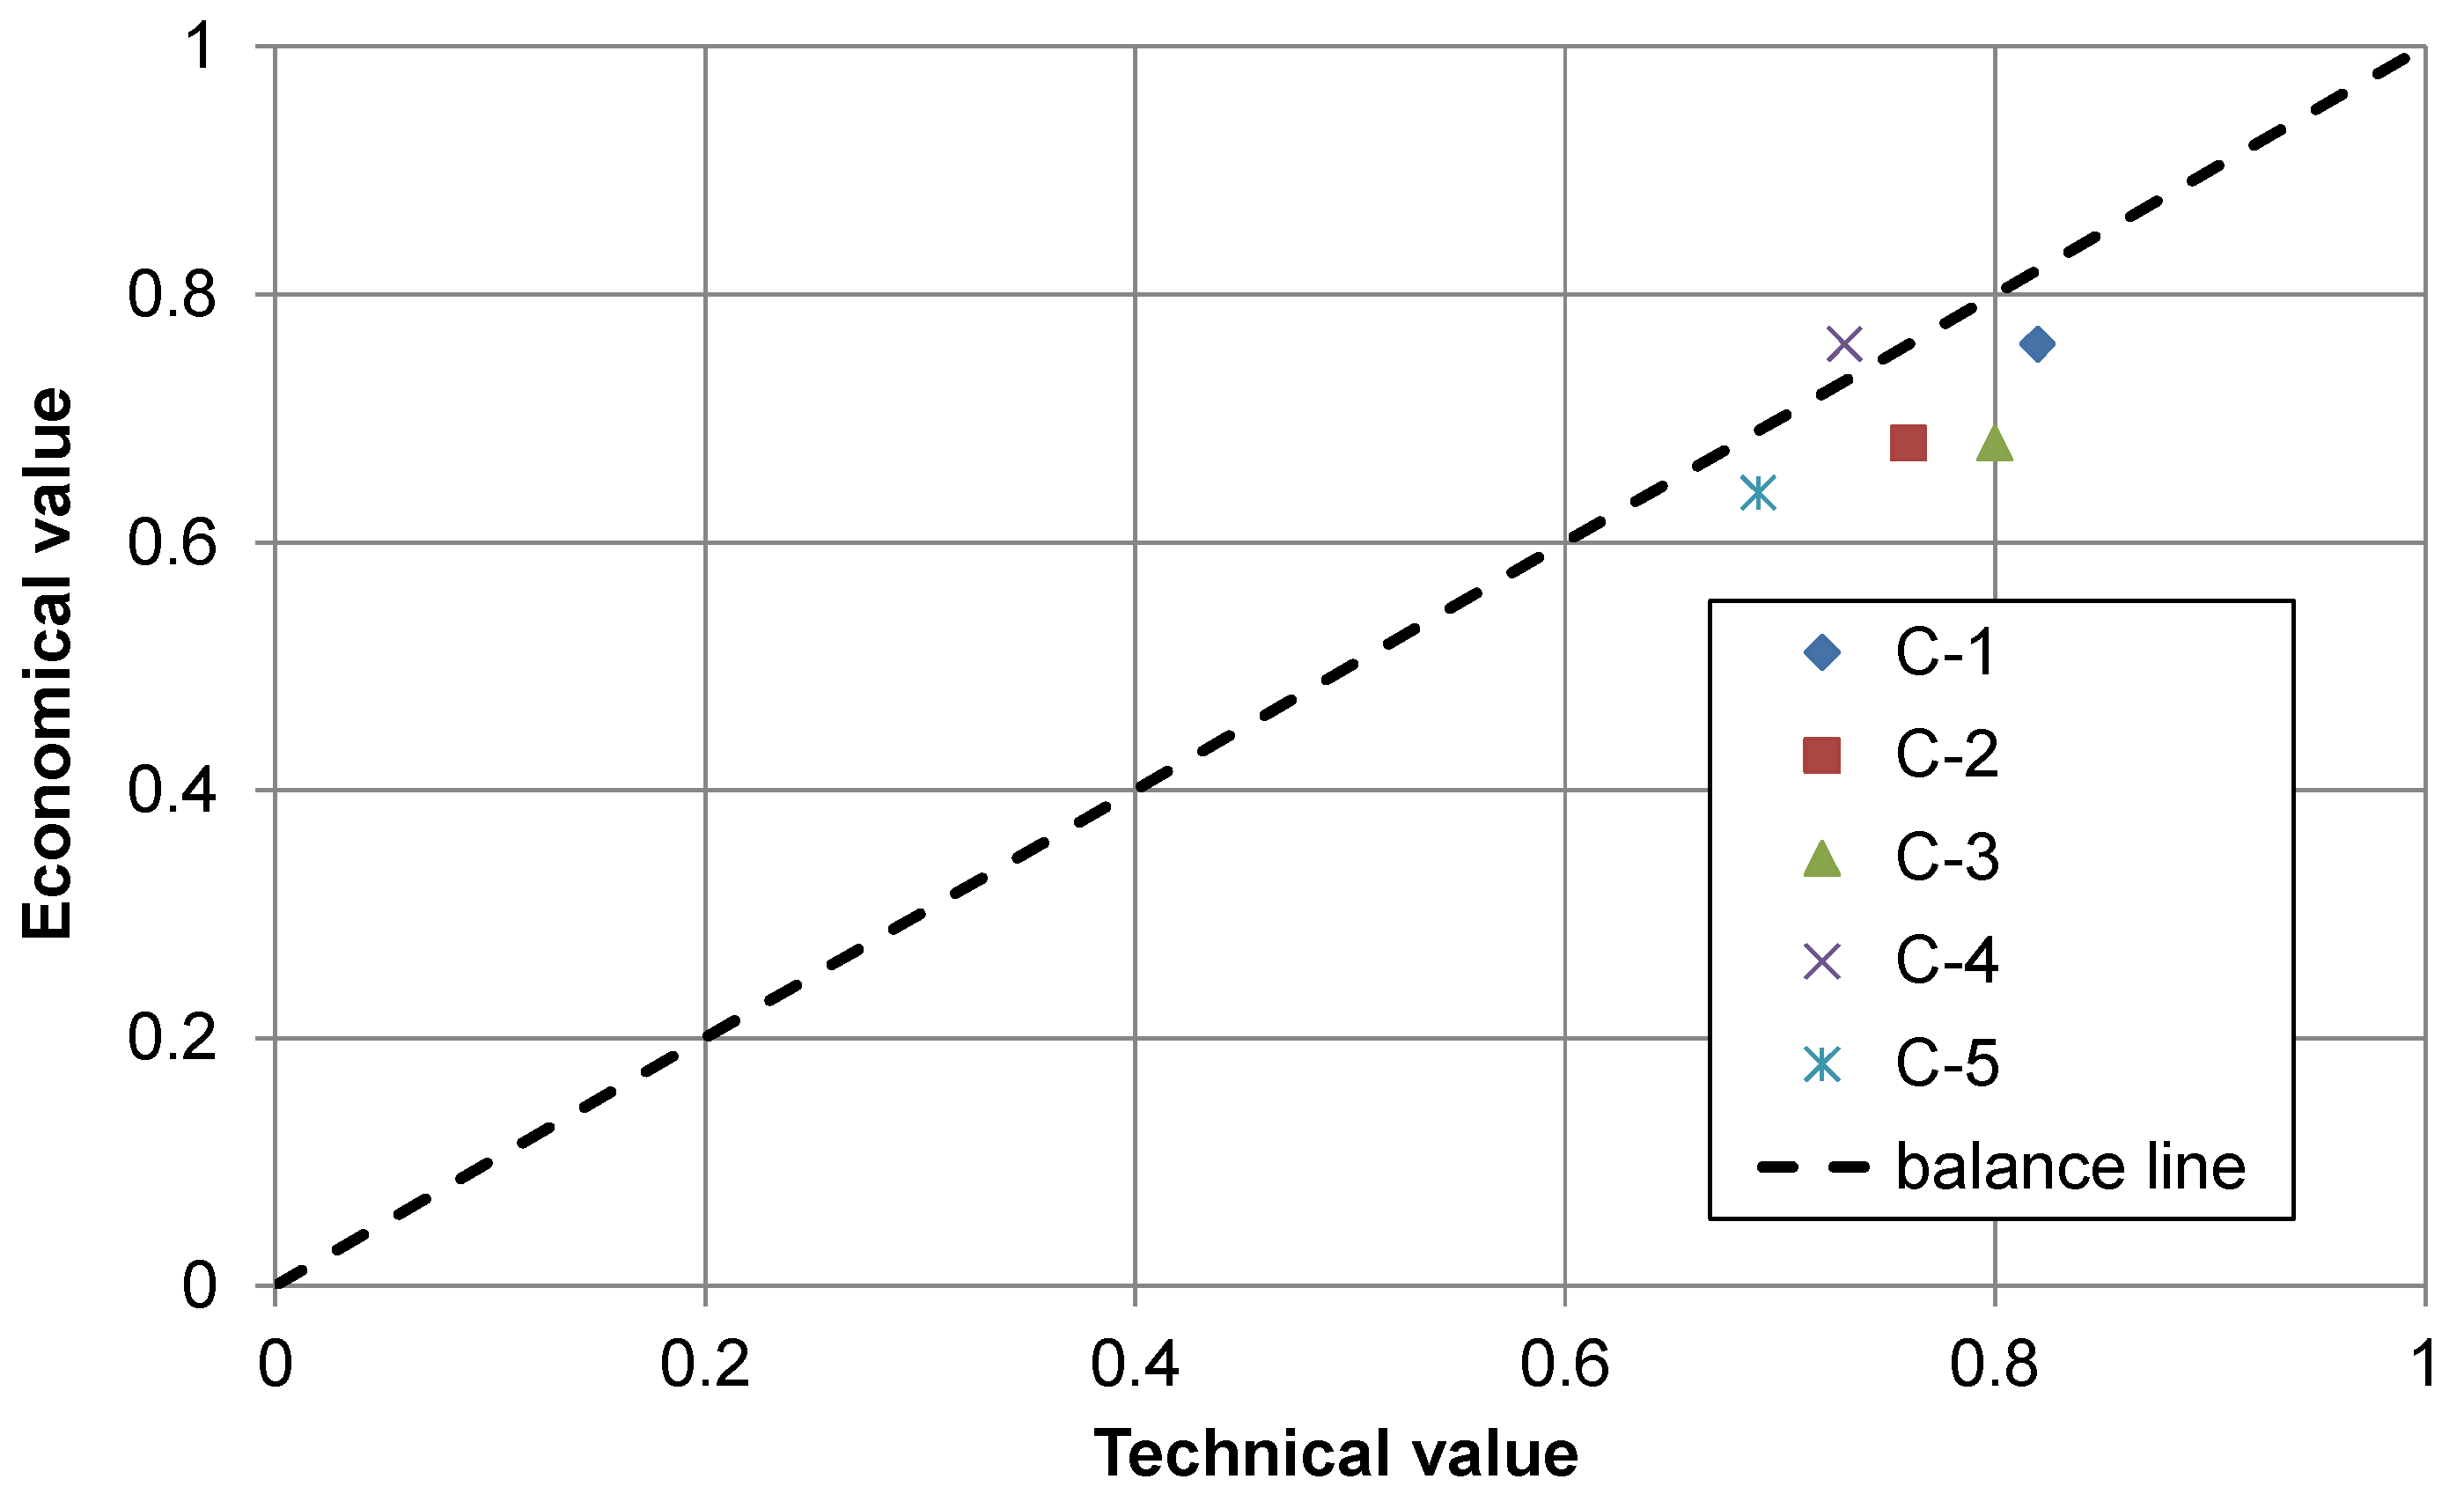
- C-1 = a2 + b1 + c2 + d1 + e1 + e2 + f1 + g1 + h2 + i1 + j2 + k2 + l3
- C-2 = a3 + b1 + c2 + d1 + e1 + e2 + f1 + g1 + h2 + i1 + j2 + k2 + l3
- C-3 = a2 + b3 + c2 + d2 + e1 + e2 + f1 + g1 + h2 + i1 + j2 + k2 + l3
- C-4 = a4 + b1 + c2 + d4 + e1 + e2 + f1 + g1 + h4 + i1 + j2 + k2 + l1 + l5
- C-5 = a2 + b2 + c2 + d5 + e1 + f3 + f4 + g1 + h2 + i1 + j1 + k1 + l1 + l3
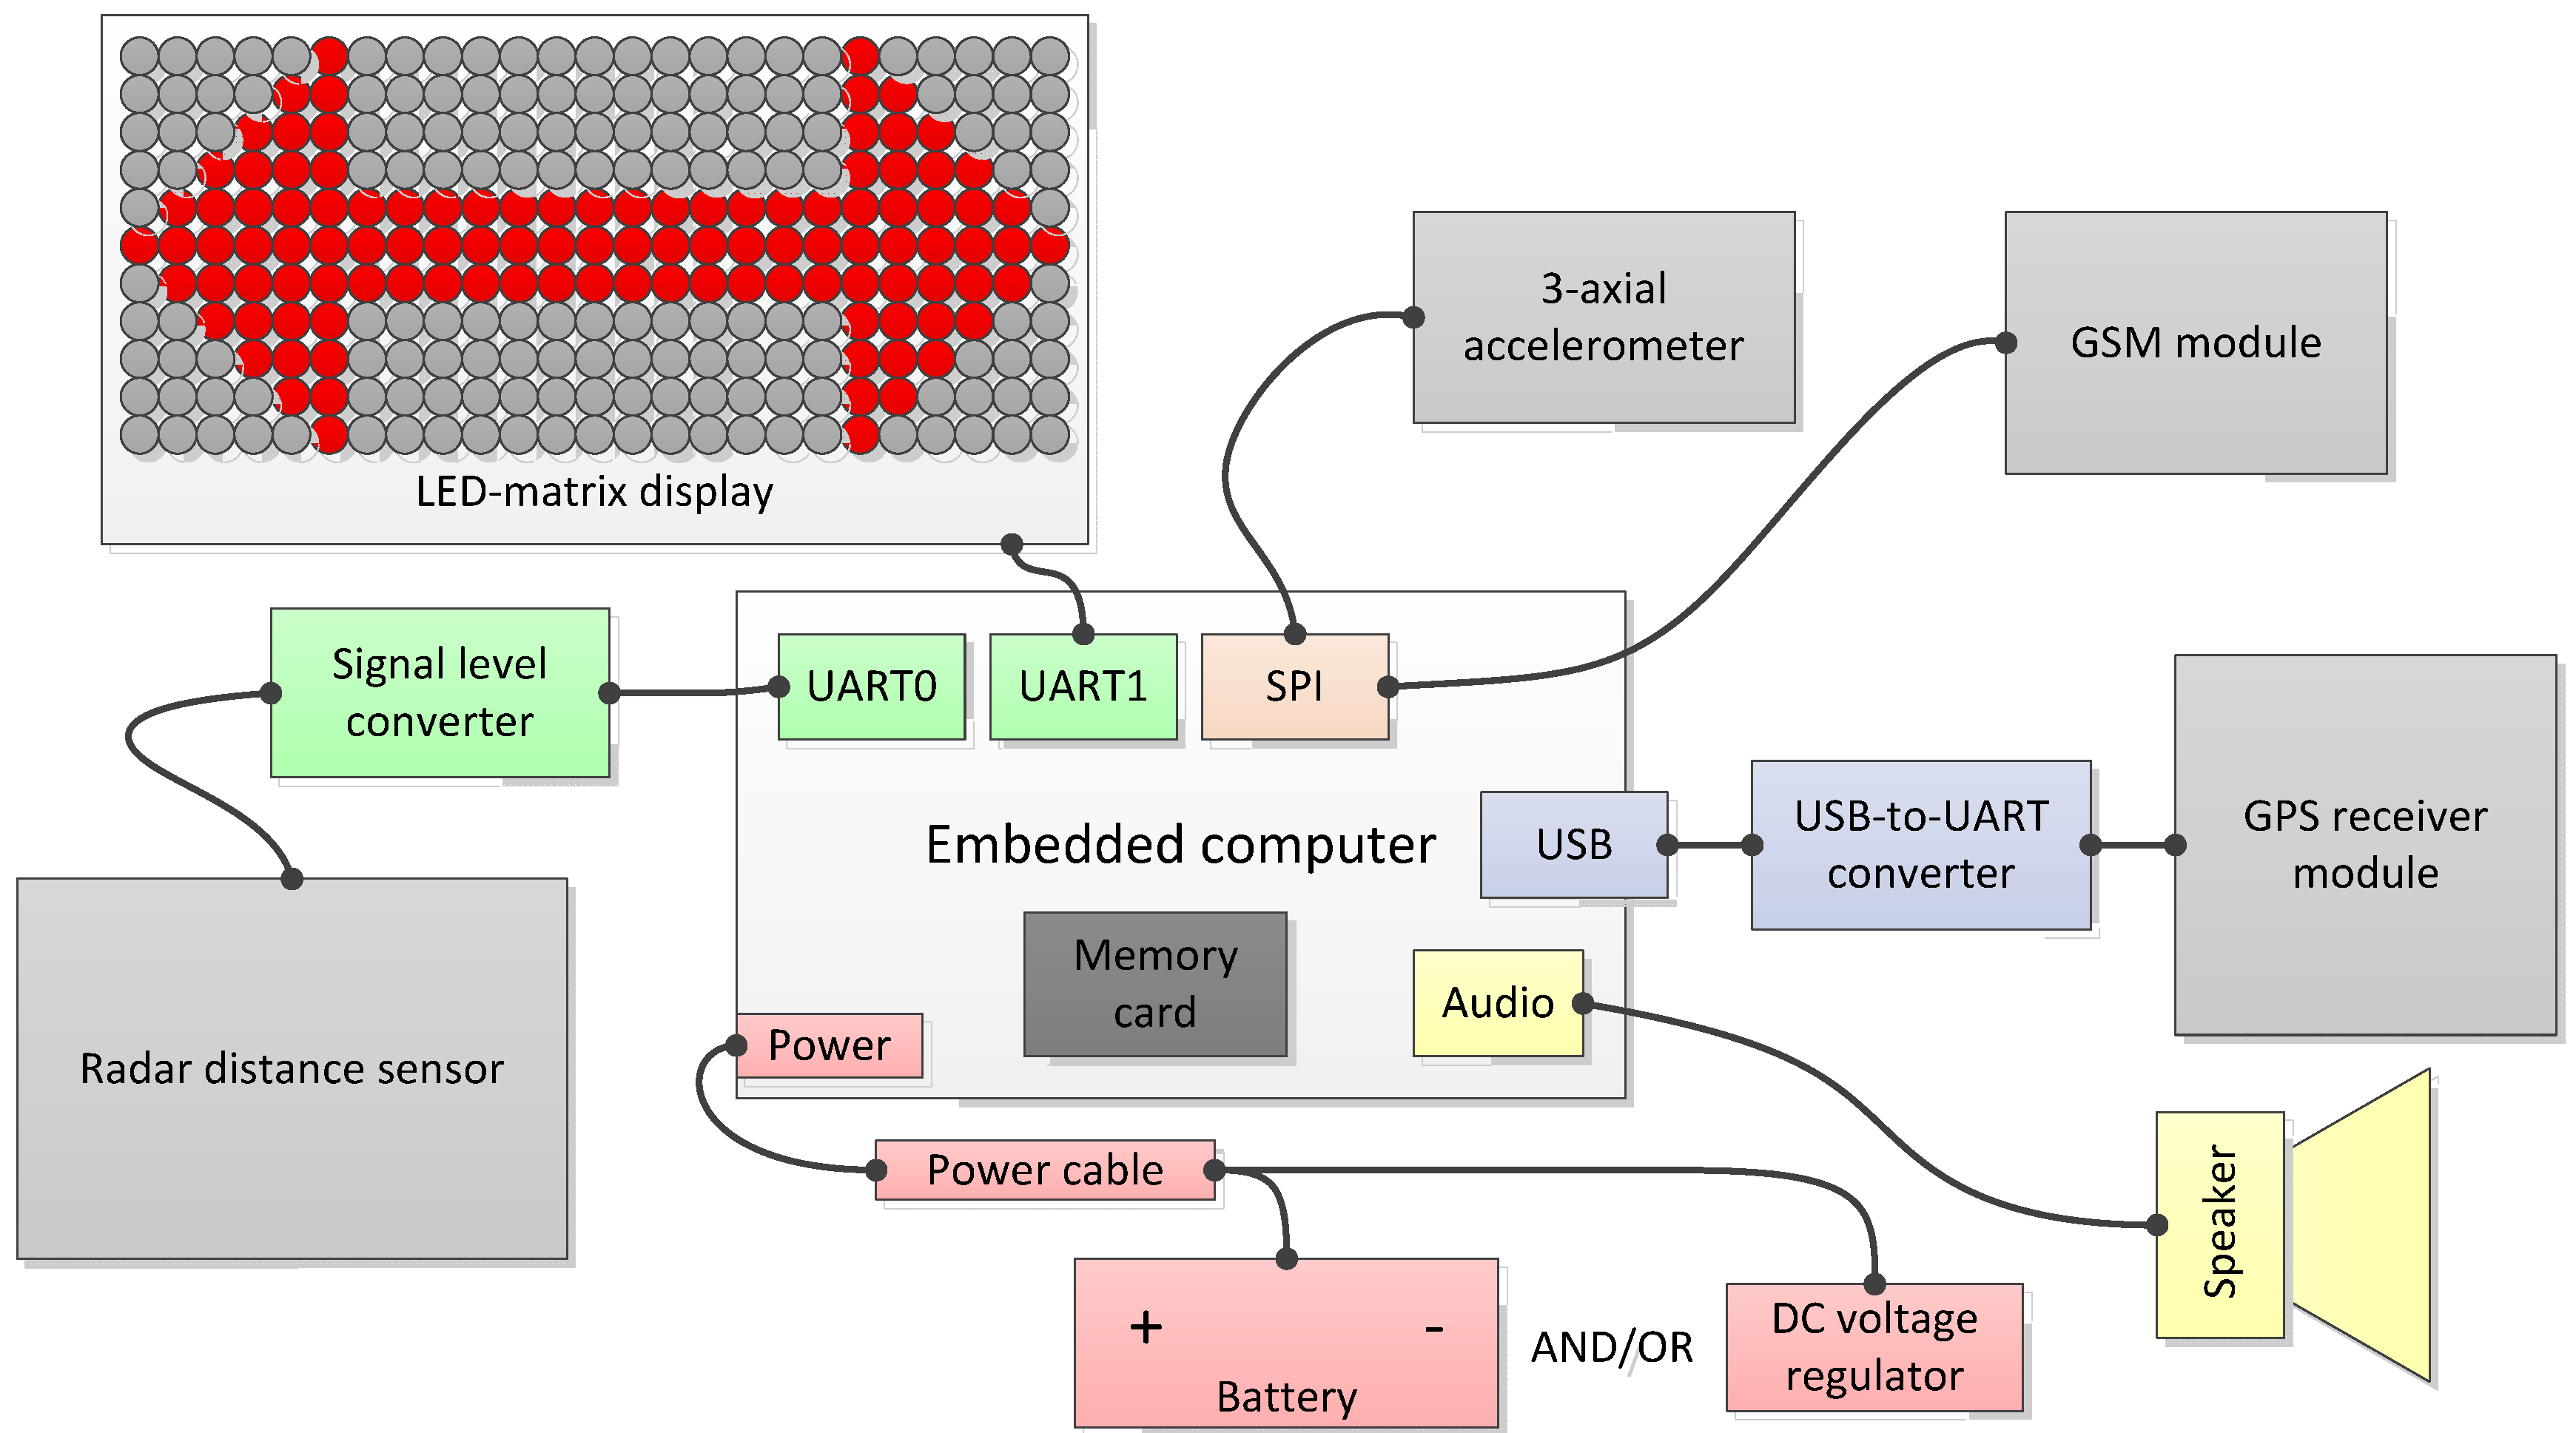
2.2. Design and Adaptation of the Selected Concept
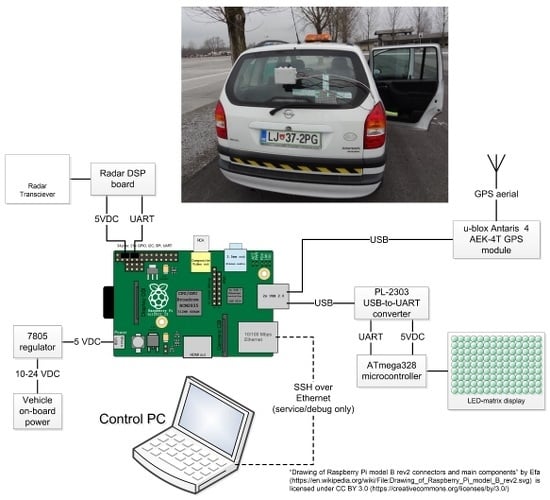
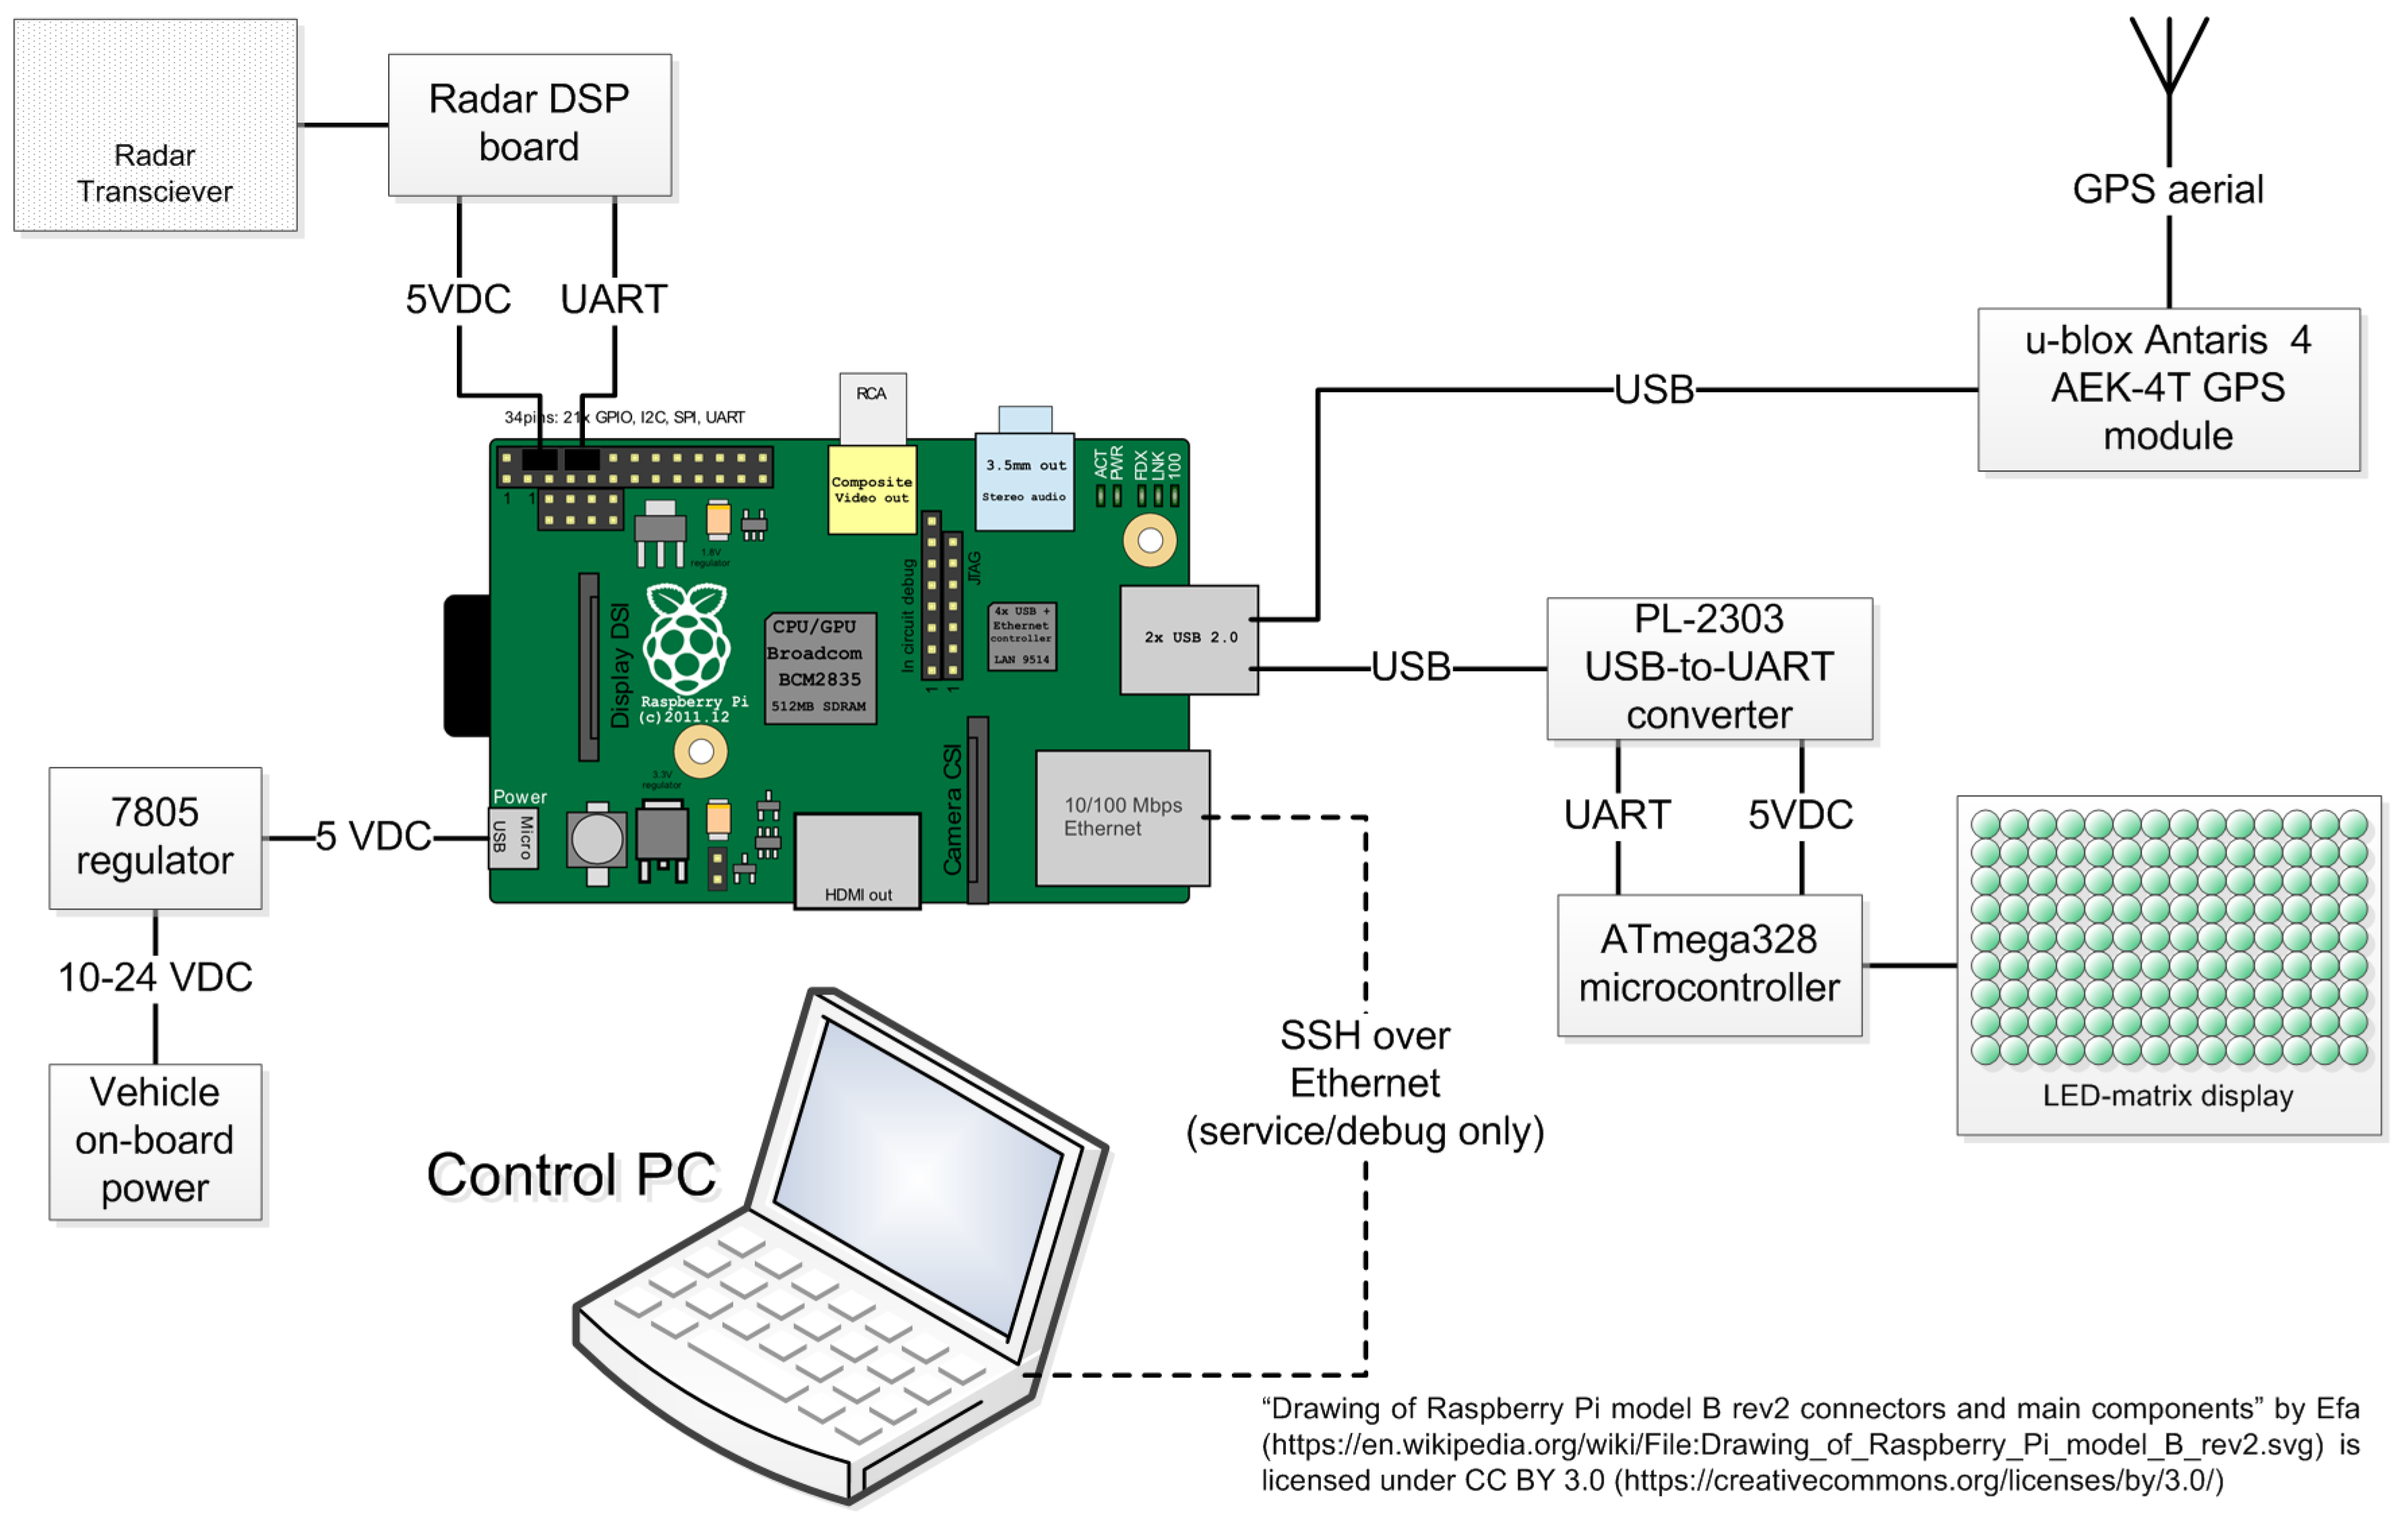
2.3. Selection of the Components
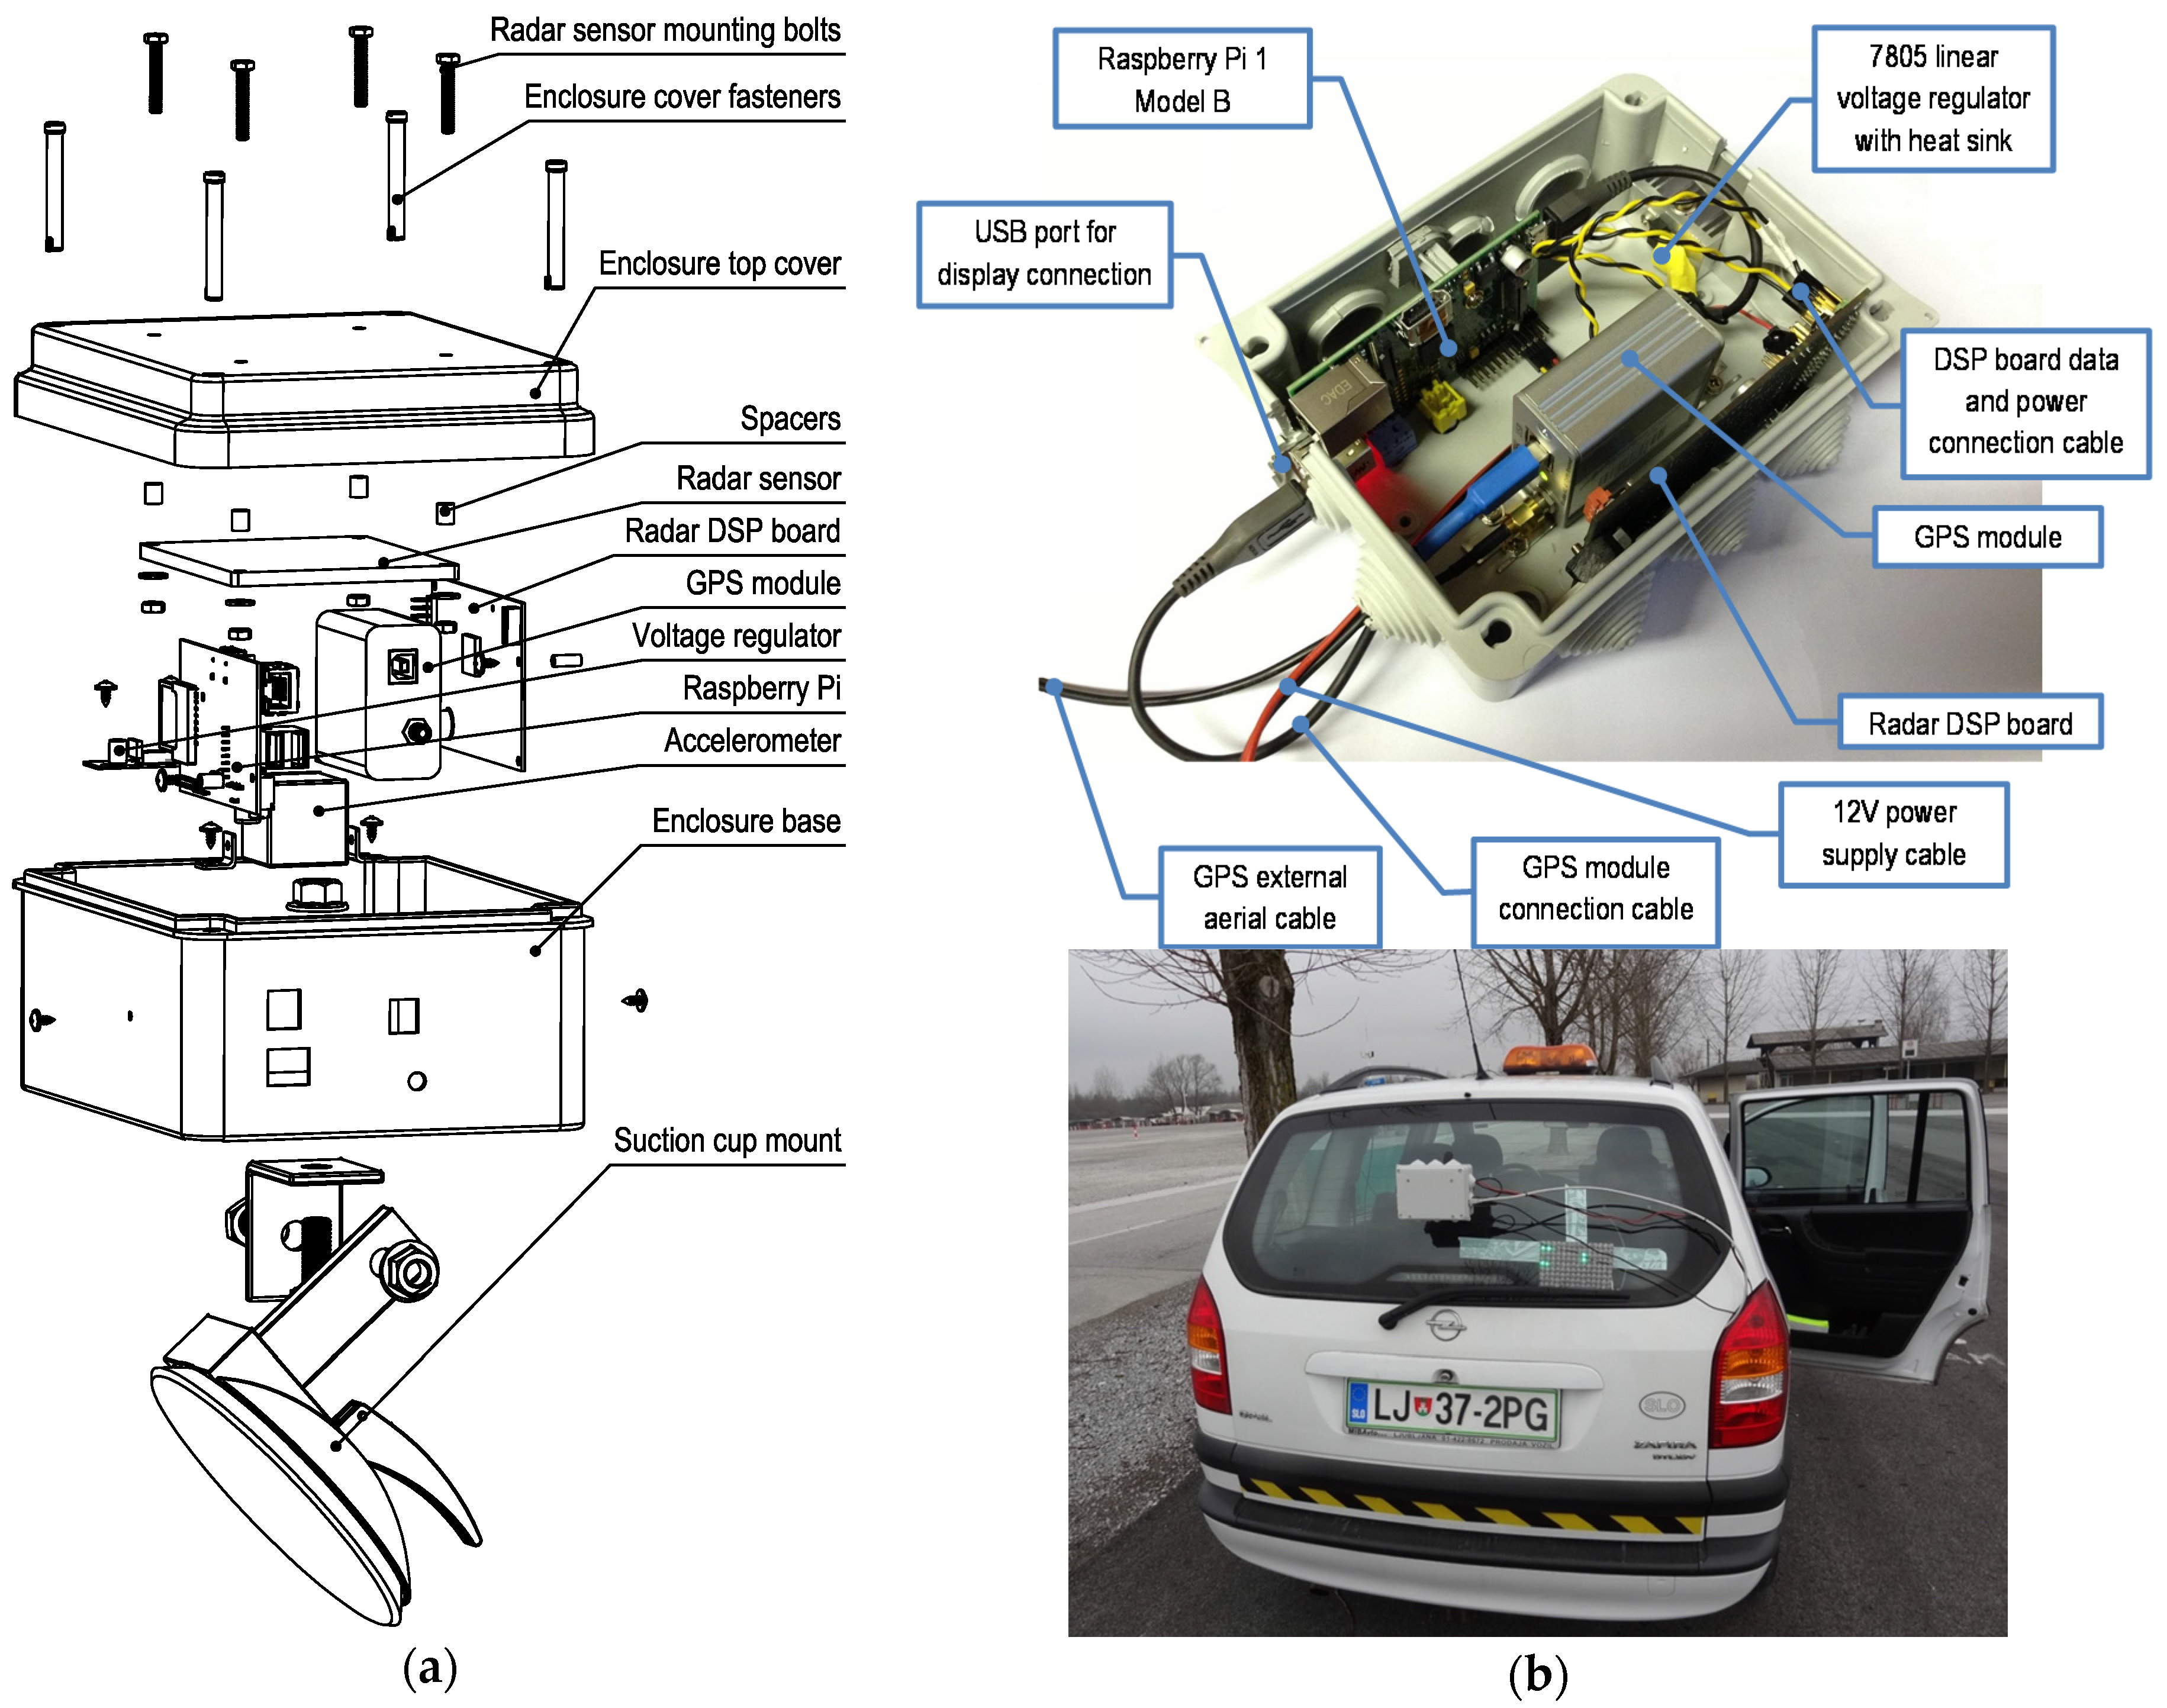
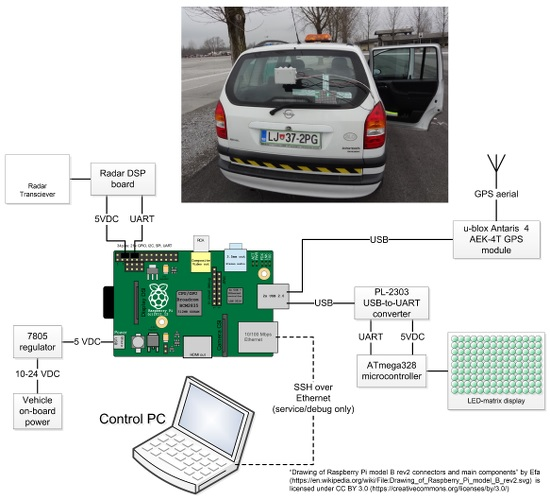
2.4. Prototype Assembly
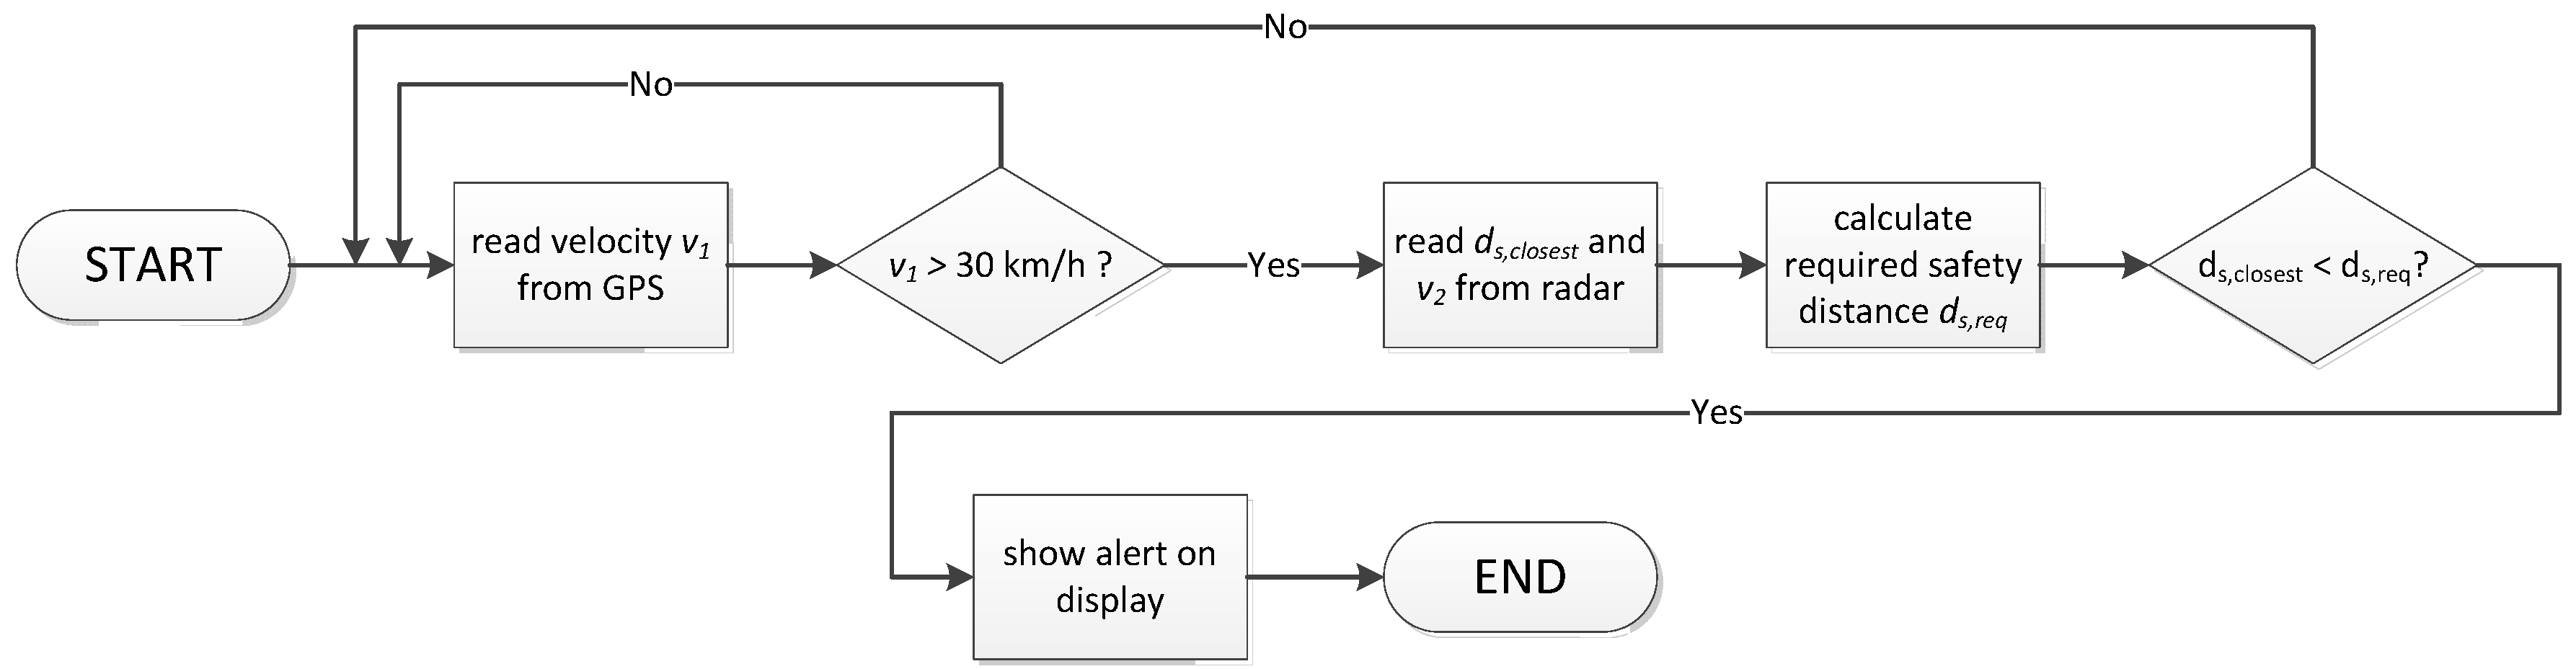
2.5. Software Setup and Development
2.6. Testing the Finished Prototype
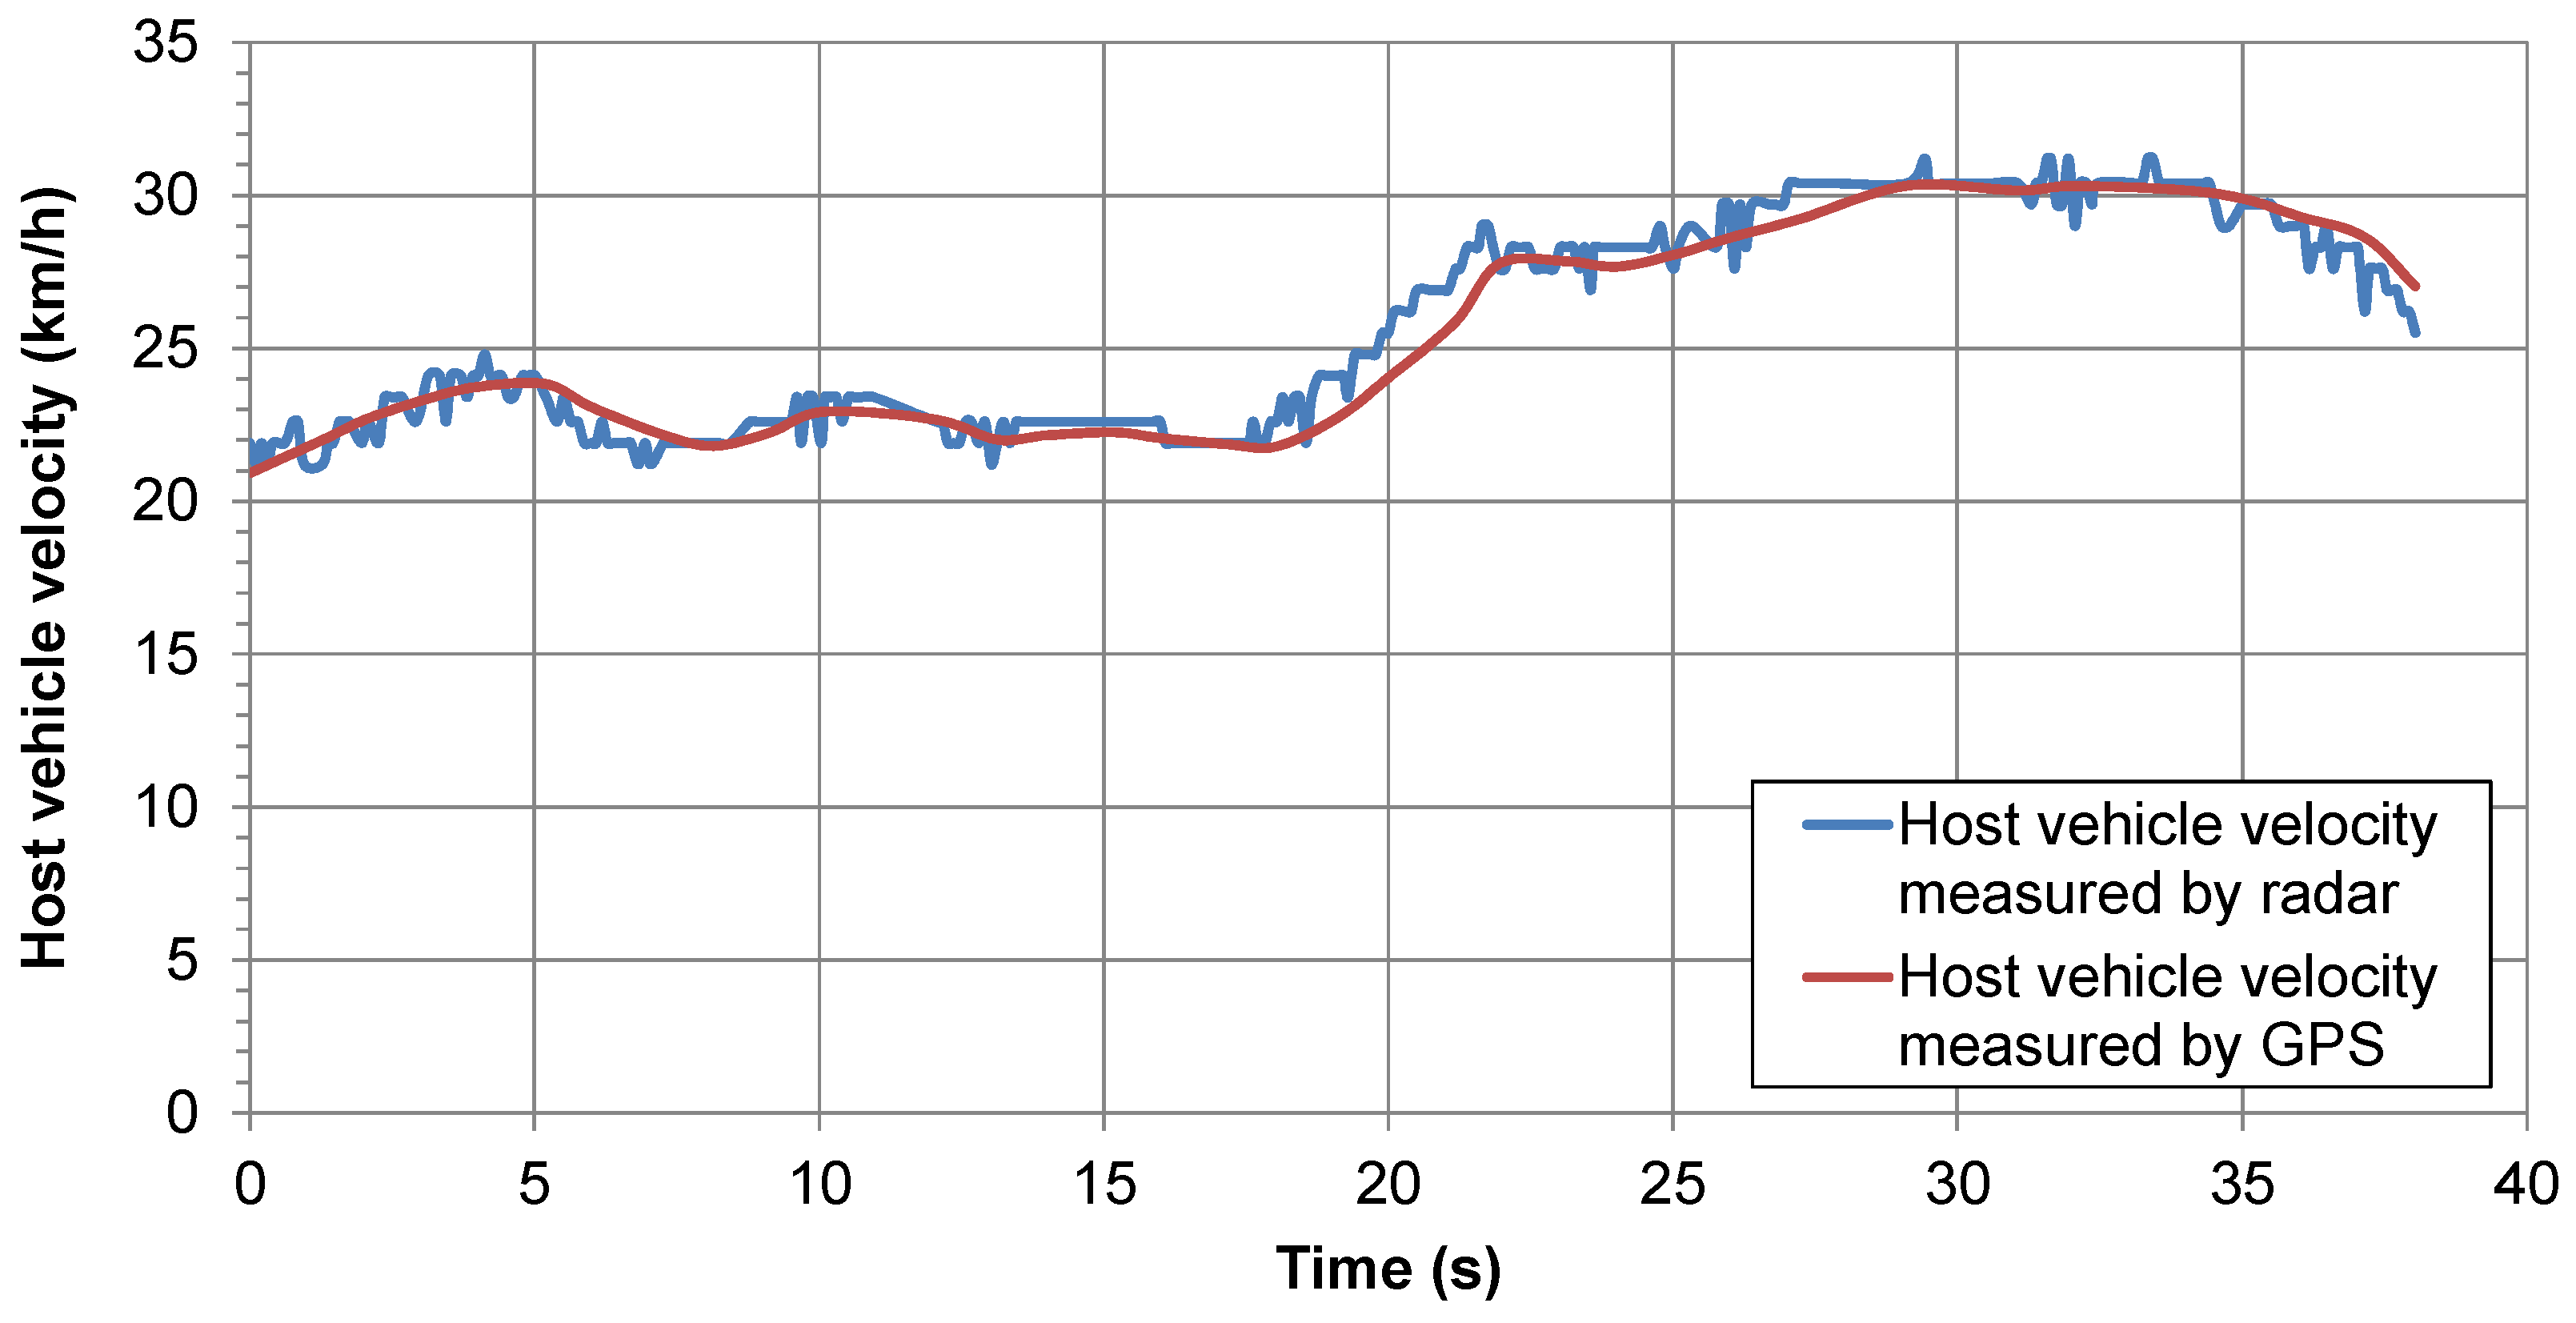
- The allowed relative measurement error of the host vehicle velocity (from the GPS module) in the 30–200-km/h range is below 5%.
- The allowed relative measurement error of the host vehicle velocity (from the radar sensor) in the 30–200-km/h range is below 10%.
- The allowed relative measurement error of the trailing vehicle velocity (from the radar sensor) in the 30–200-km/h range is below 10%.
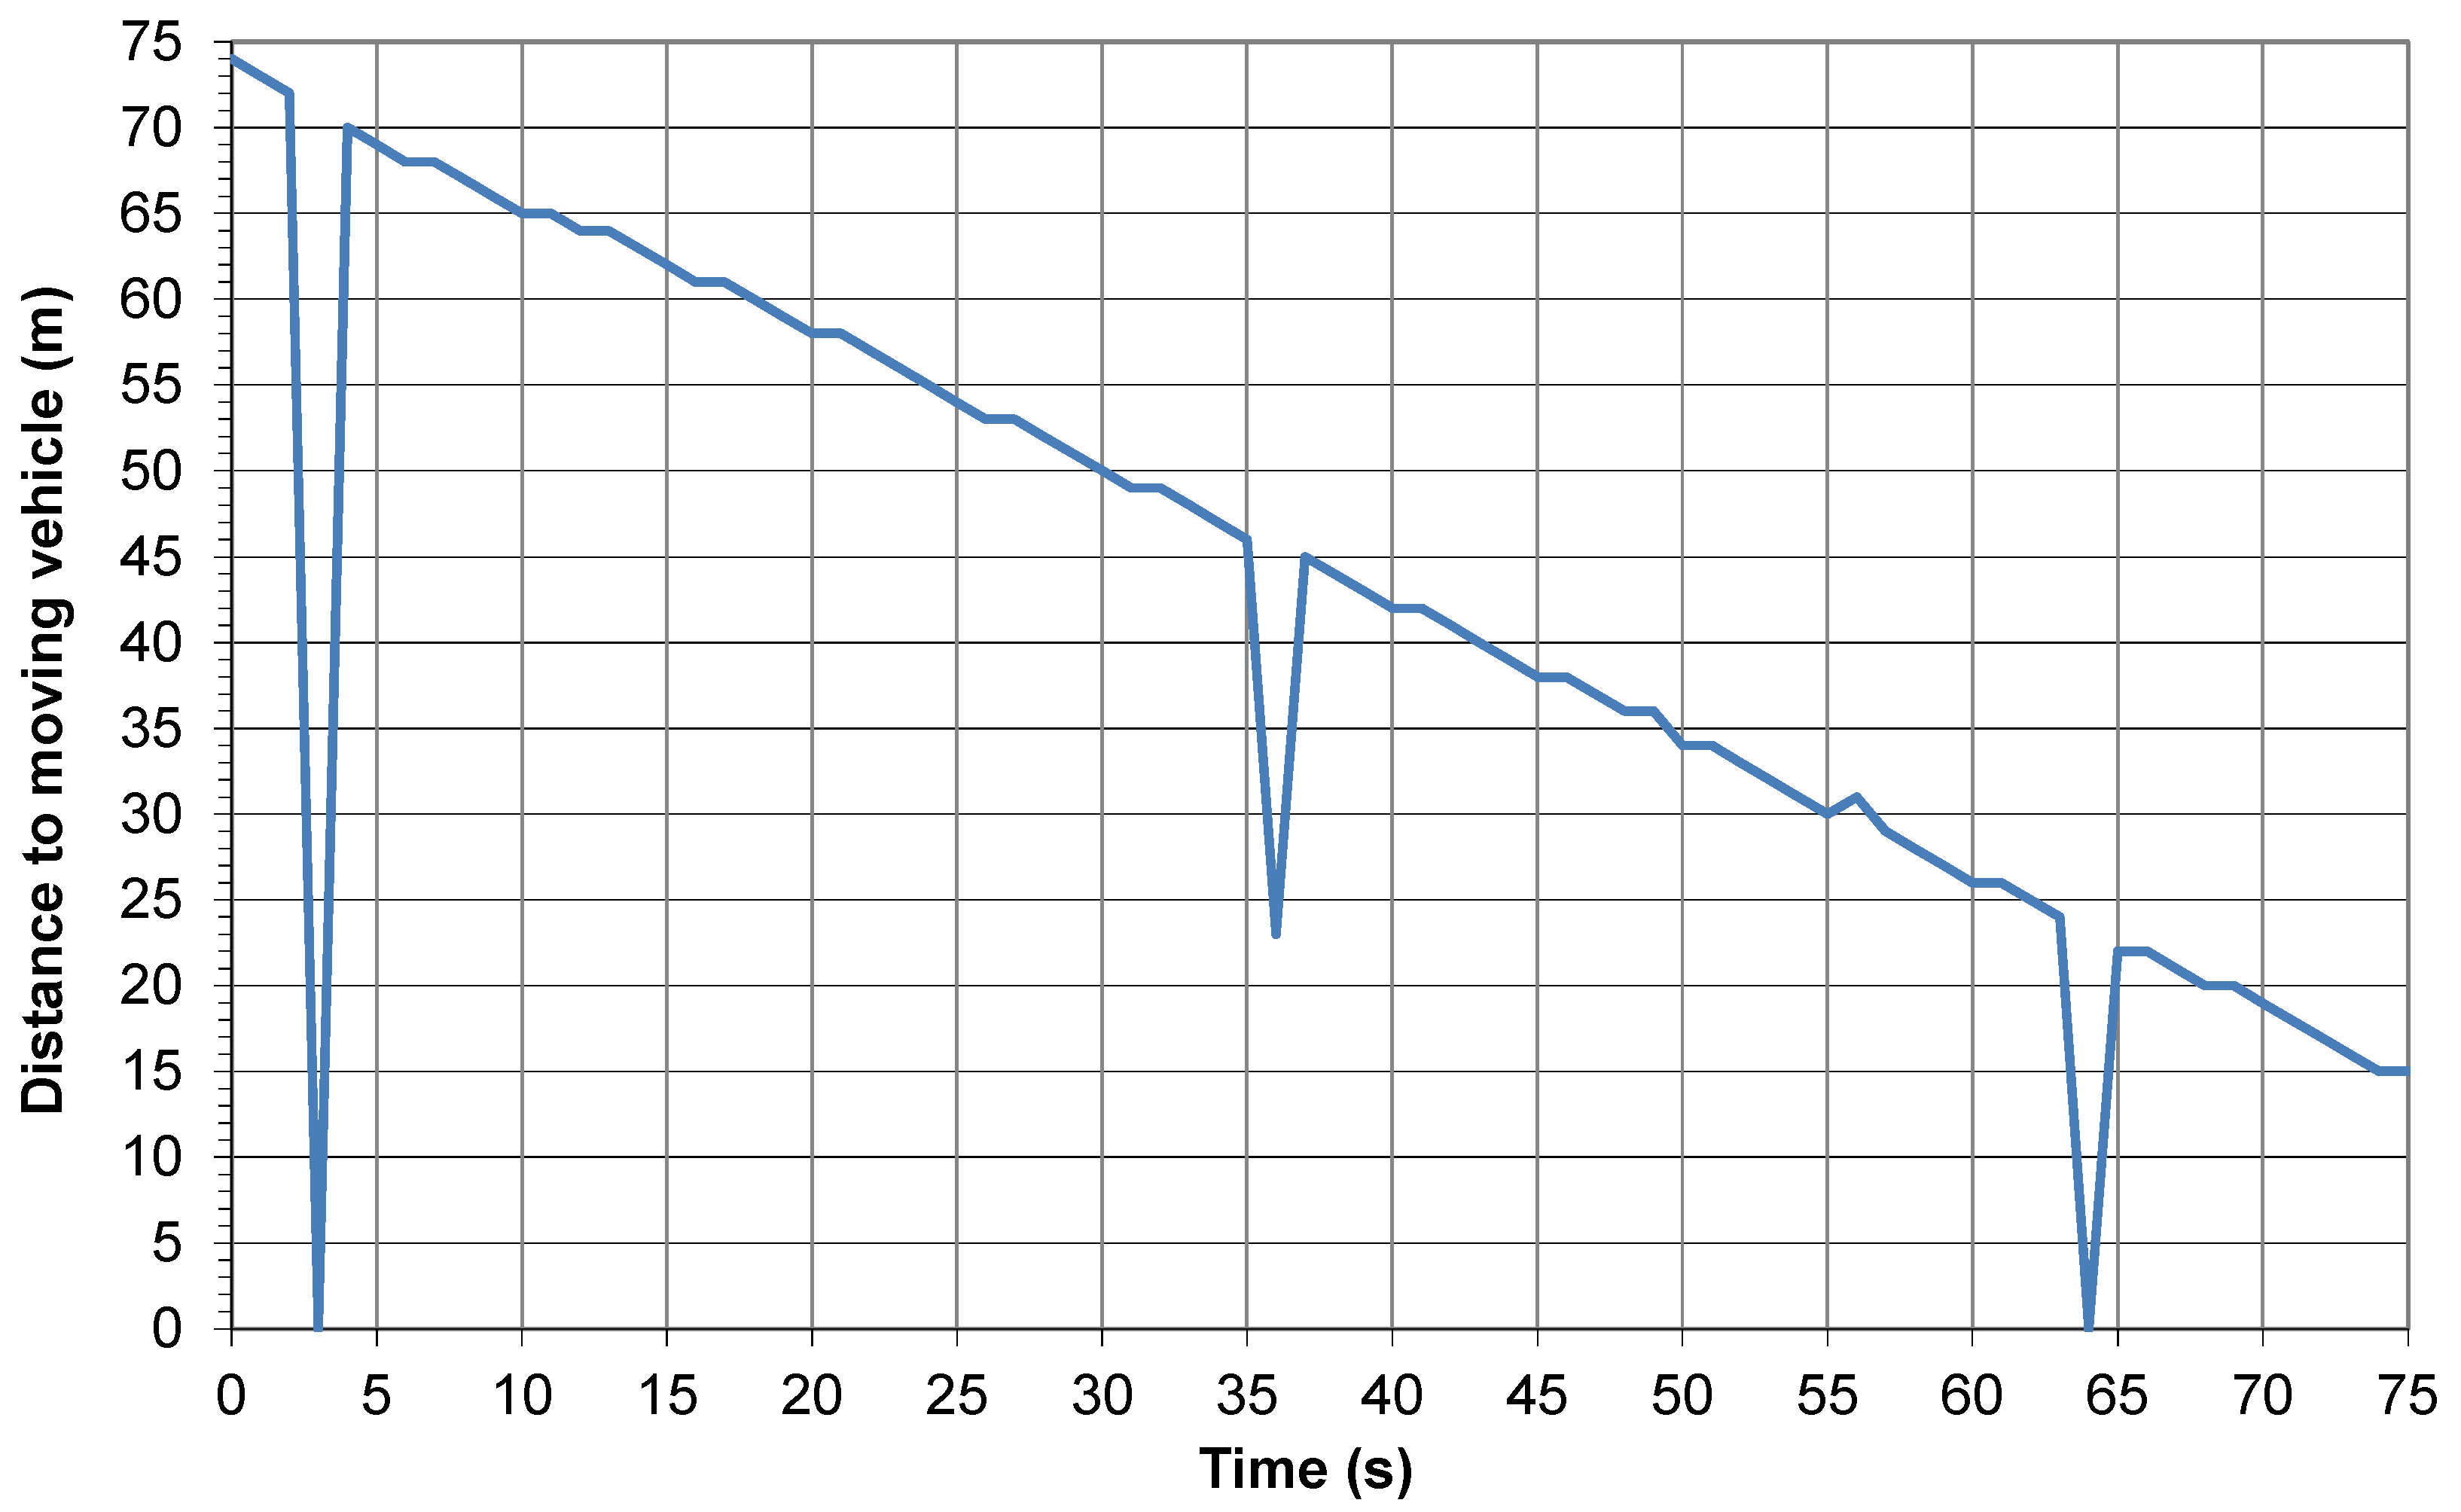
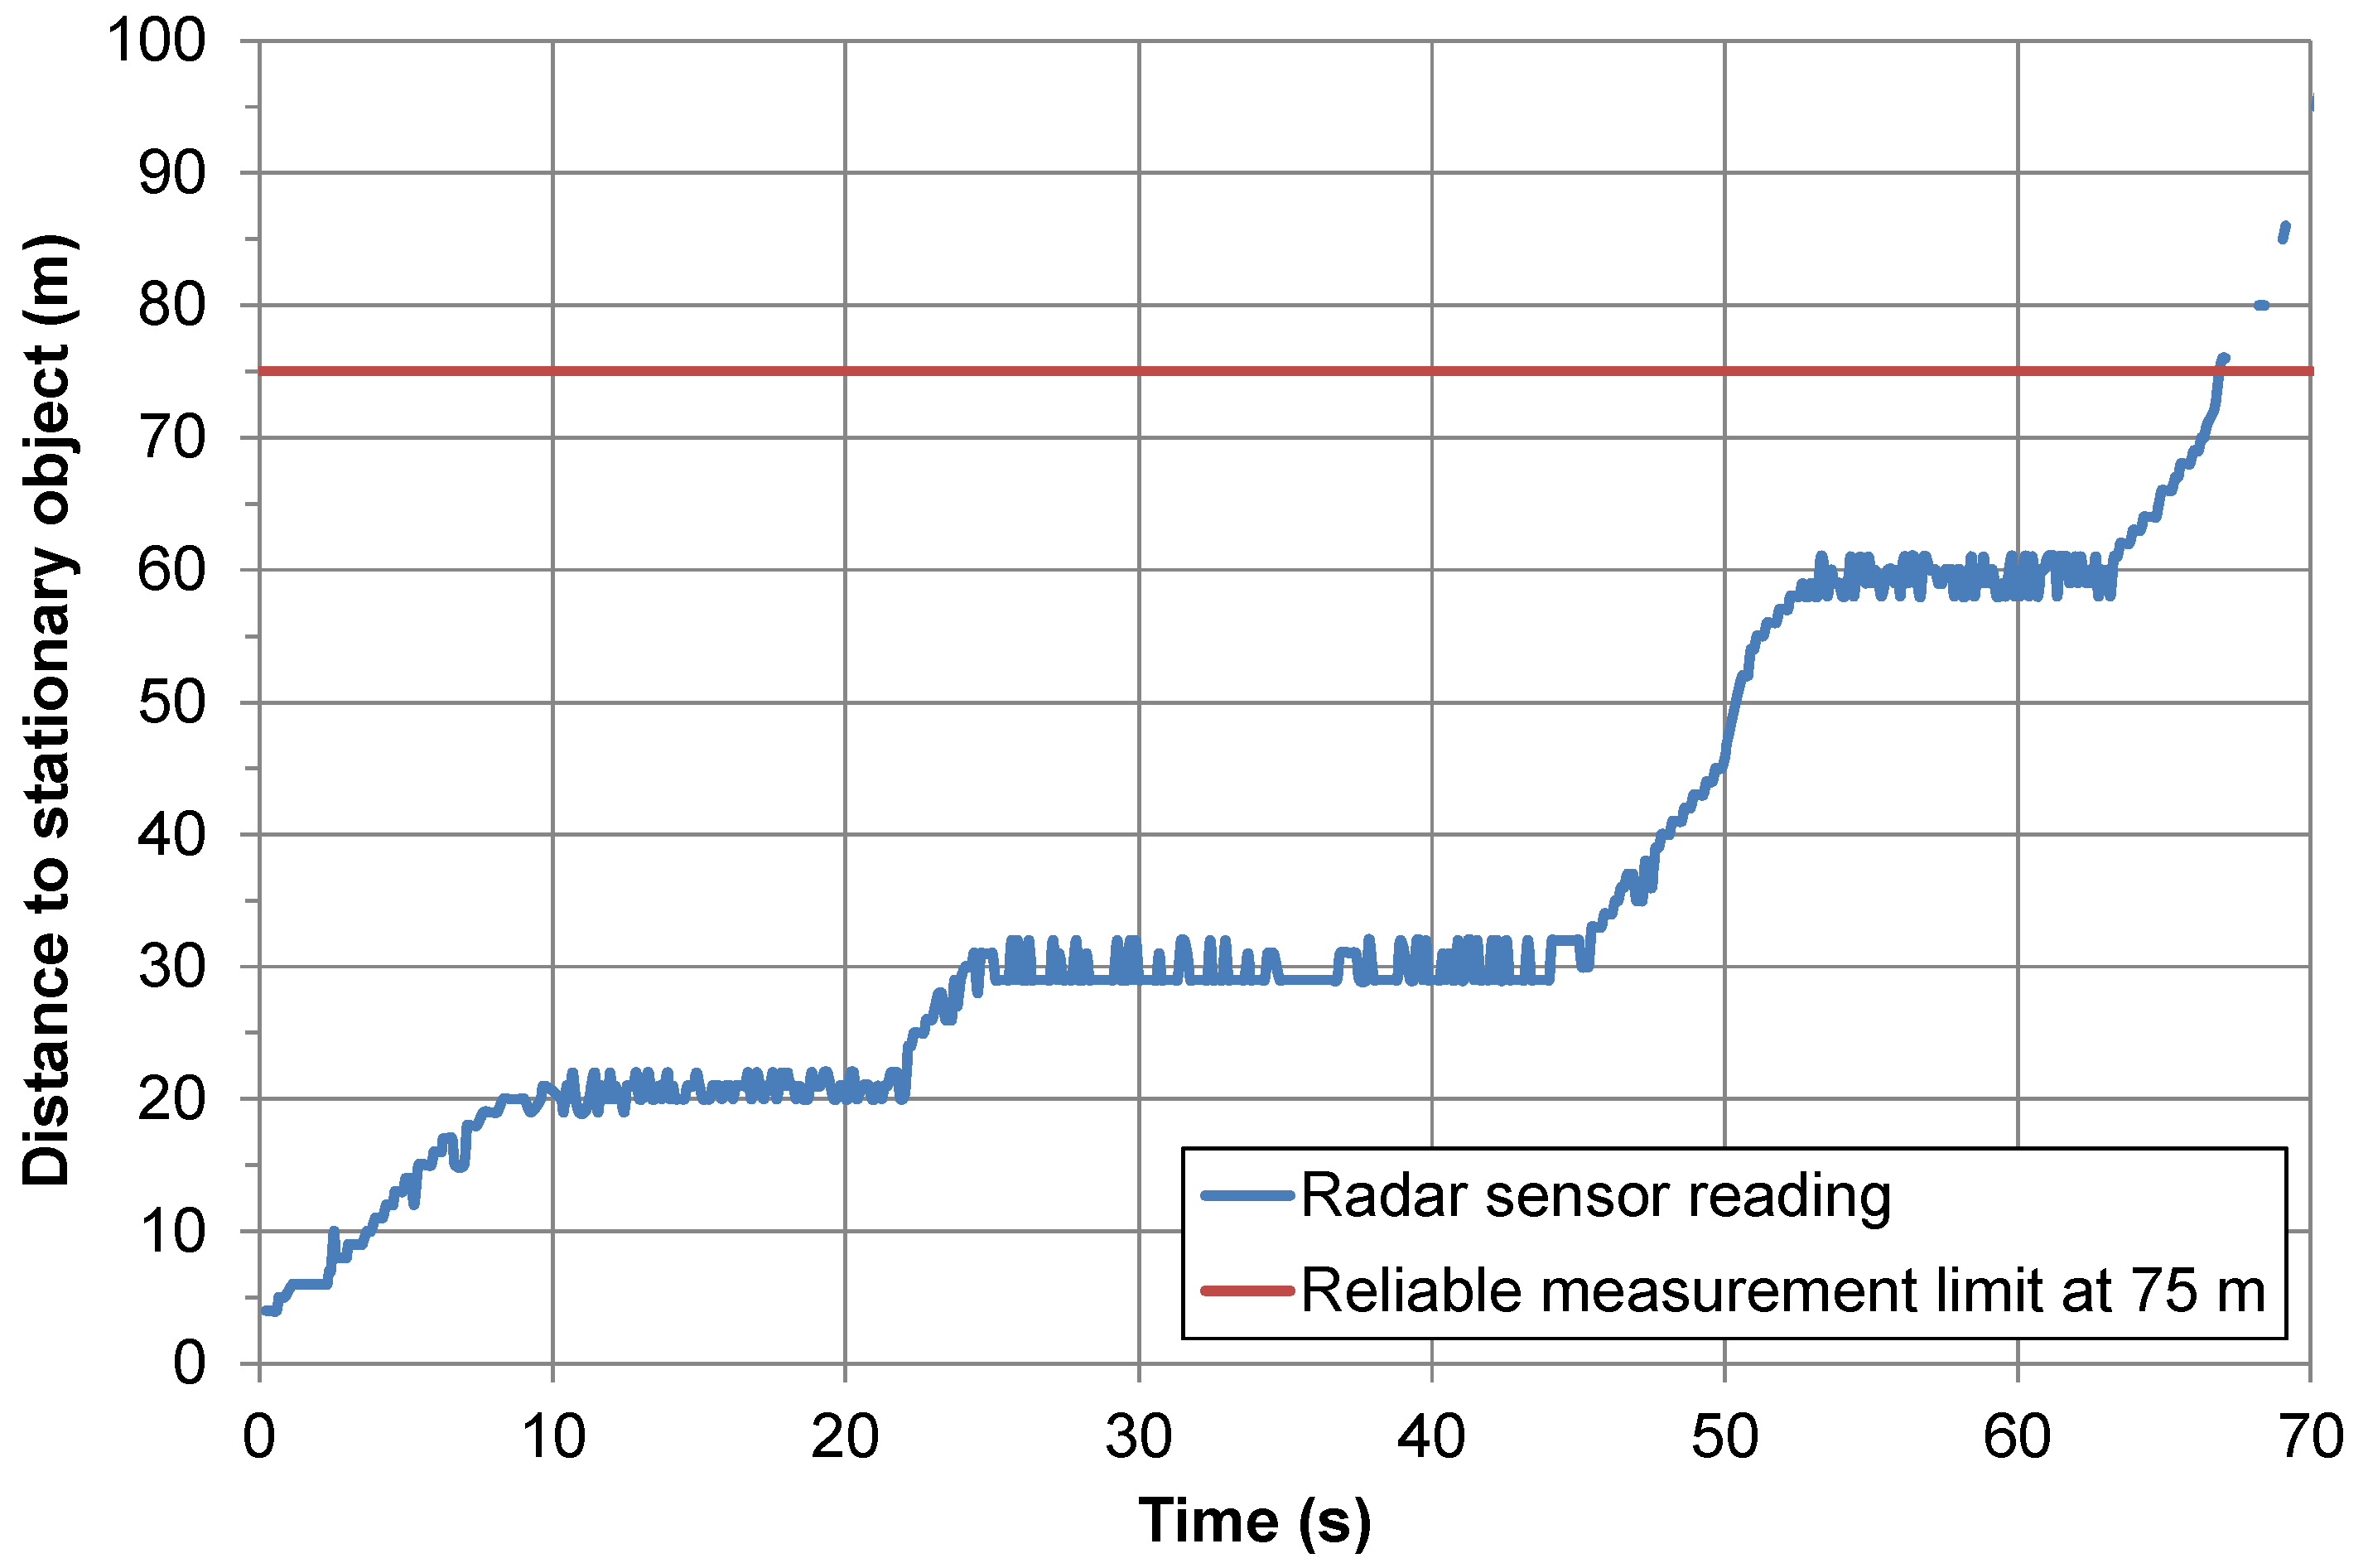
- The measurement range of the radar sensor when measuring the distance to target is within the 5–70-m range.
- The allowed relative measurement error of the measured distance from the rear-most point of the host vehicle to the front-most point of the trailing vehicle on the same traffic lane within the 5–110-m range is below 10%.
- The reliability of the alert activation when the measured safety distance of the trailing vehicle is too short must not be below 95%; in other words, the alert shall activate in at least 19 of 20 cases of safety distance rules violations.
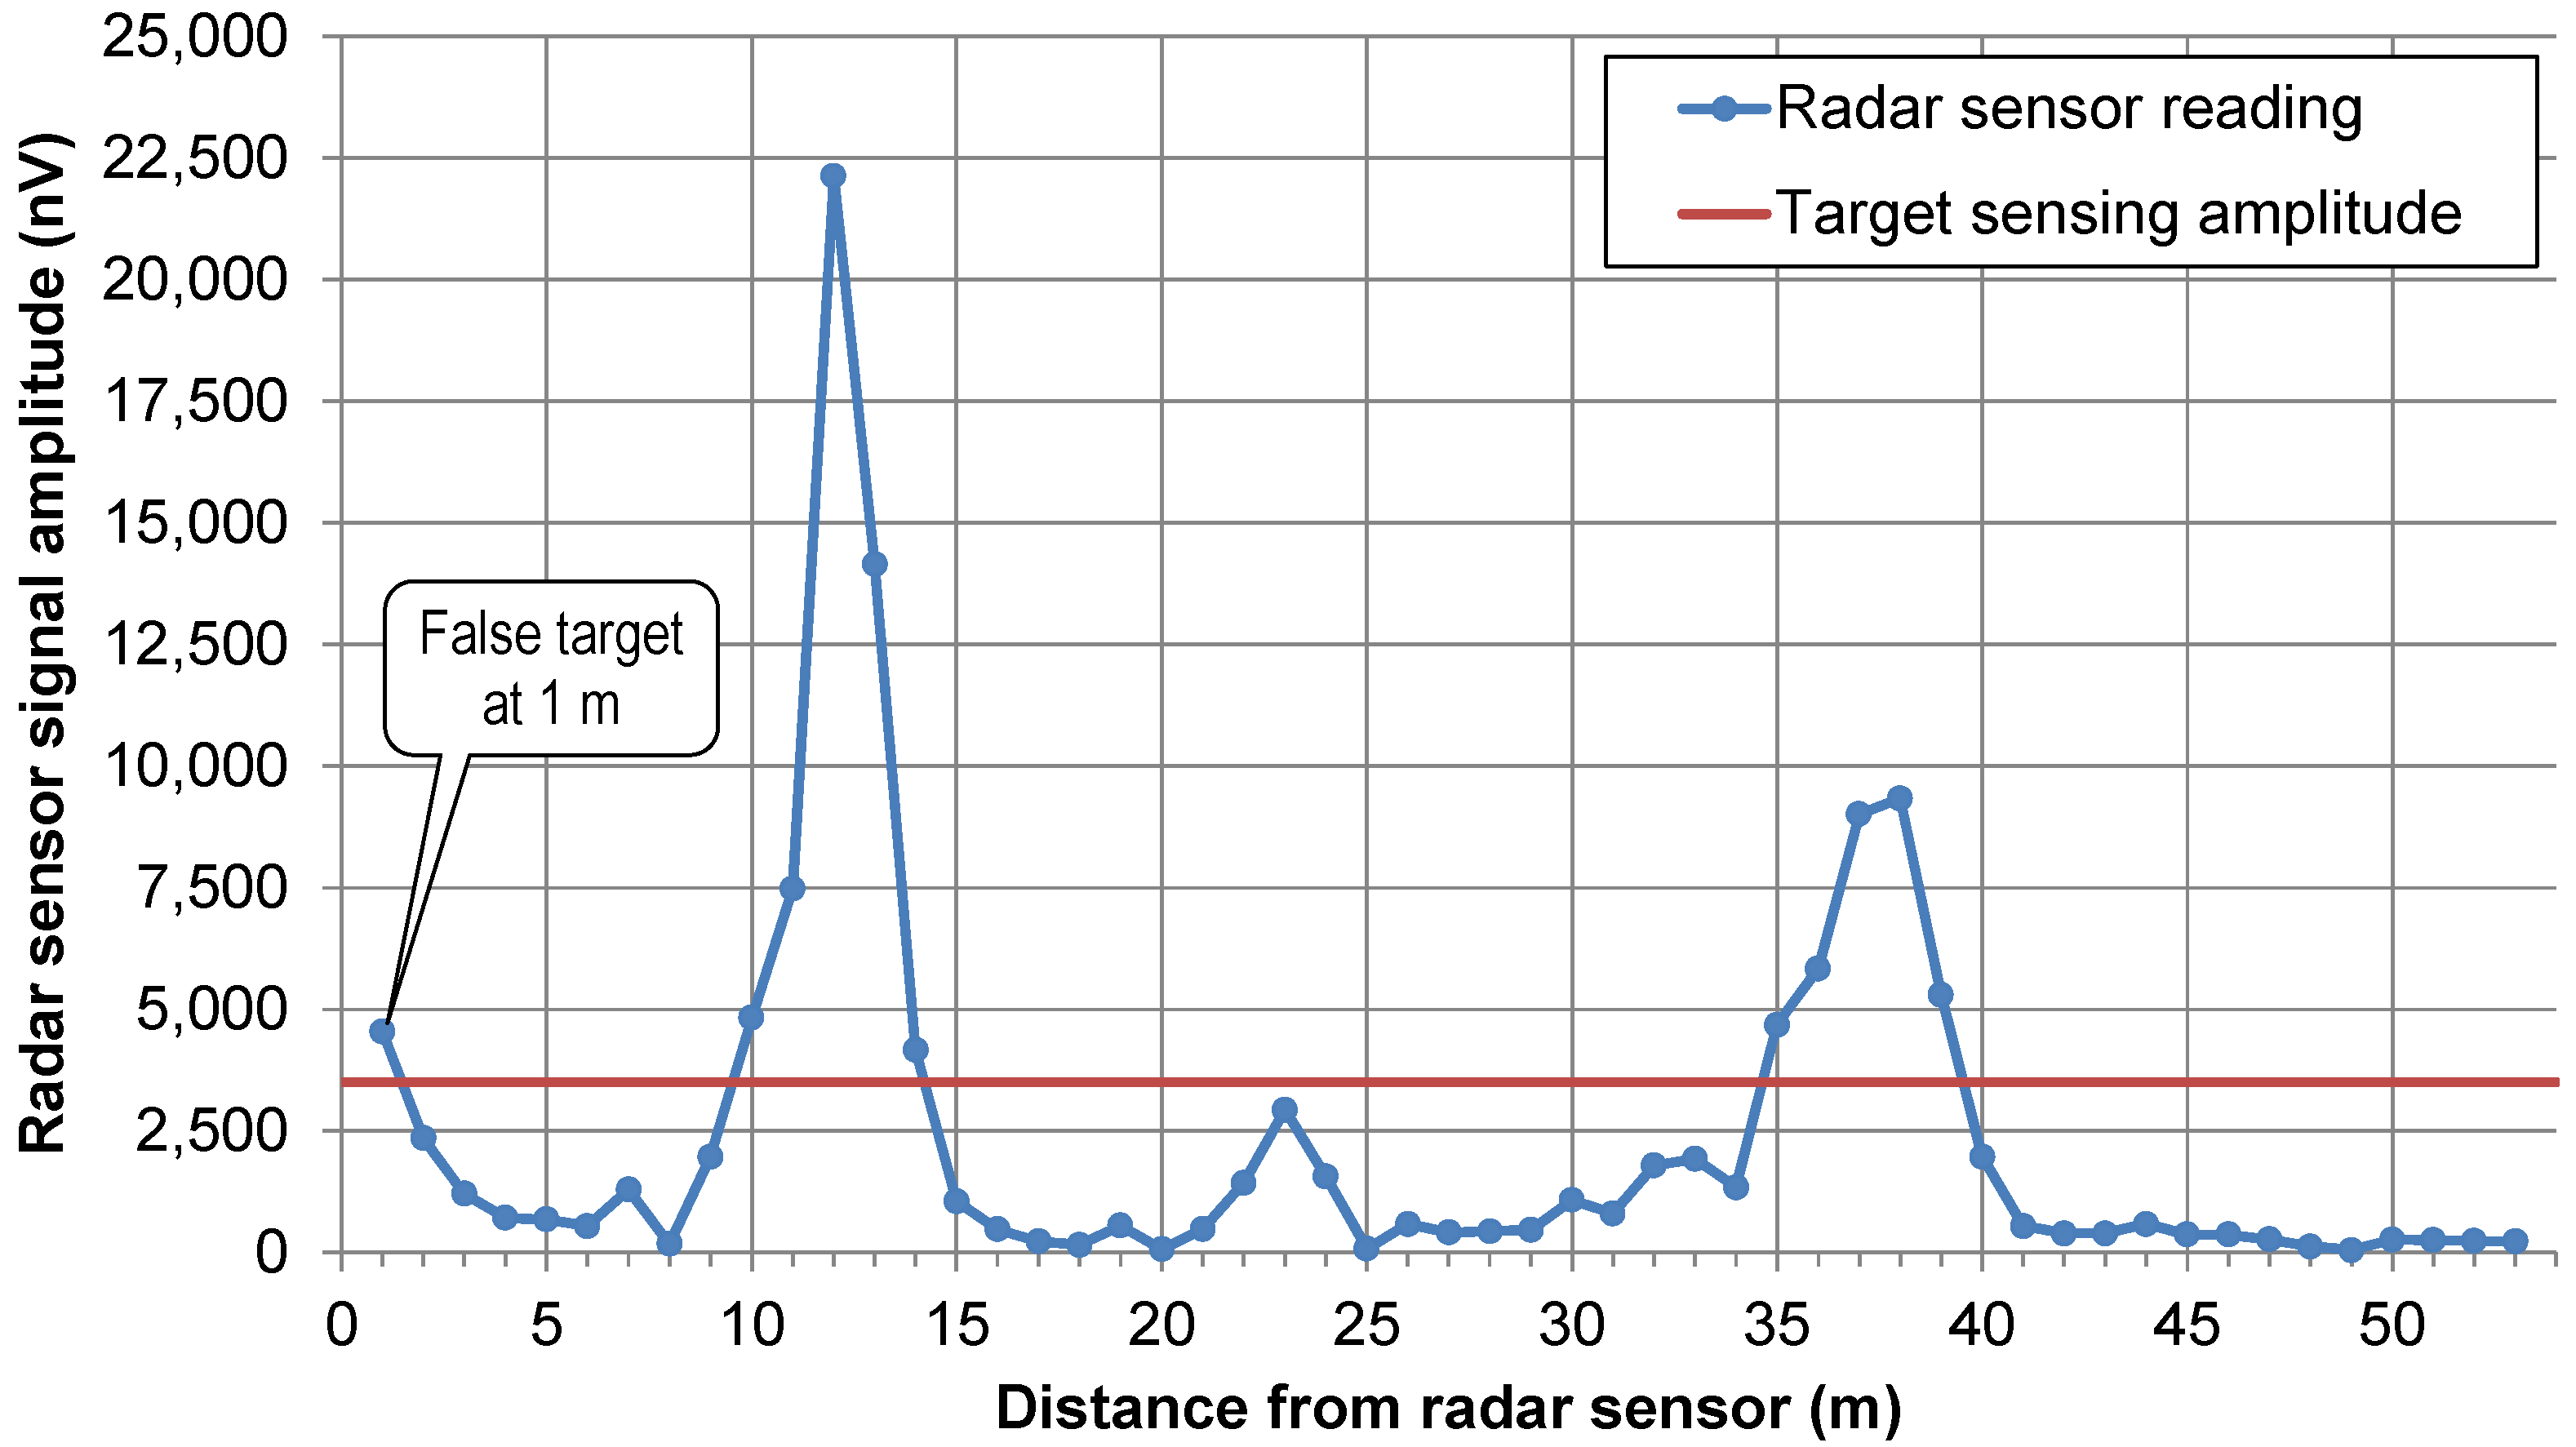
- The radar sensor must always provide reliable distance-to-target measurement without any disturbances in the form of unexplained values or significant oscillations.
- The radar sensor must be able to sense a vehicle abruptly cutting in onto the traffic lane on which the host vehicle is driving.
- The radar sensor must not sense objects outside the roadway or vehicles driving on other traffic lanes as a trailing vehicle.
3. Results
4. Discussion
Supplementary Materials
Acknowledgments
Author Contributions
Conflicts of Interest
Abbreviations
| GPS | Global Positioning System |
| LED | Light-Emitting Diode |
| RADAR (also “radar”) | RAdio Detection And Ranging |
| LIDAR | LIght Detection And Ranging |
| LASER | Light Amplification by Stimulated Emission of Radiation |
| LCD | Liquid Crystal Display |
| accmtr. | Accelerometer |
| GSM | Global System for Mobile Communications |
| USB | Universal Serial Bus |
| DSP | Digital Signal Processor |
| UART | Universal Asynchronous Receiver and Transmitter |
| OS | Operating System |
| SDHC | Secure Digital High-Capacity |
| MC | Microcontroller |
| PC | Personal Computer |
| IP | Internet Protocol |
| SSH | Secure Shell |
| NMEA | National Marine Electronics Association |
References
- Virant, M. Development of a System That Alerts Drivers if the Distance to The Preceding Vehicle Is Less Than Specified. Master’s Thesis, Faculty of Mechanical Engineering, University of Ljubljana, Ljubljana, Slovenia, June 2015. [Google Scholar]
- Prometne Nesreče (Total Traffic Accidents in Slovenia Caused by Insufficient Safety Distance—Statistics for 1994–2012, in Slovenian). Available online: http://nesrece.avp-rs.si/?layers=B00FFFFFFFFT&DatumOd=1.1.1994&DatumDo=31.12.2012&Vzrok=11 (accessed on 19 January 2016).
- Prometne nesreče (Traffic accidents with fatalities and serious injuries in Slovenia caused by insufficient safety distance—Statistics for 1994–2012, in Slovenian). Available online: http://nesrece.avp-rs.si/?layers=B00FFFFFFFFT&DatumOd=1.1.1994&DatumDo=31.12.2012&Vzrok=11&Klasifikacija=4%2C5 (accessed on 19 January 2016).
- Adell, E.; Várhelyi, A.; dalla Fontana, M. The effects of a driver assistance system for safe speed and safe distance—A real-life field study. Transp. Res. Part C 2011, 19, 145–155. [Google Scholar] [CrossRef]
- Vadeby, A.; Wiklund, M.; Forward, S. Car drivers’ perceptions of electronic stability control (ESC) systems. Accid. Anal. Prev. 2011, 43, 706–713. [Google Scholar] [CrossRef] [PubMed]
- Sagberg, F.; Fosser, S.; Sktermo, I.A.F. An Investigation of Behavioural Adaptation to Airbags and Antilock Brakes among Taxi Drivers. Accid. Anal. Prev. 1997, 29, 293–302. [Google Scholar] [CrossRef]
- Peterson, S.; Hoffer, G.; Millner, E. Are Drivers of Air-Bag-Equipped Cars More Aggressive? J. Law Econ. 1995, 38, 251–264. [Google Scholar] [CrossRef]
- Michael, P.G.; Leeming, F.C.; Dwyer, W.O. Headway on urban streets: observational data and intervention to decrease tailgating. Transp. Res. Part F 2000, 3, 55–64. [Google Scholar] [CrossRef]
- Highways Agency Warns Tailgaters That ‘Only a Fool Breaks the 2-Second Rule’. Available online: https://www.gov.uk/government/news/highways-agency-warns-tailgaters-that-only-a-fool-breaks-the-two-second-rule (accessed on 19 January 2016).
- TruCAM Laser Speed Gun. Available online: http://www.lasertech.com/TruCAM-Laser-Speed-Gun.aspx (accessed on 19 January 2016).
- ProVida 2000. Available online: http://www.petards.com/emergency_services/provida_2000.aspx (accessed on 19 January 2016).
- Varnostna Razdalja (Safety Distance, in Slovenian). Available online: http://www.dars.si/Dokumenti/Napotki/Pravilo_dveh_sekund_534.aspx (accessed on 19 January 2016).
- Die Fahrerassistenzsysteme (Driver Assistance Systems, in German). Available online: https://www.audi-mediacenter.com/de/vernetzte-mobilitaet-audi-auf-der-cebit-4172/die-fahrerassistenzsysteme-von-heute-4179 (accessed on 19 January 2016).
- BMW Techniklexikon: Dynamische Bremsleuchten (Dynamic Brake Lights, in German). Available online: http://www.bmw.com/com/de/insights/technology/technology_guide/articles/brake_force_display.html?content_type=&source=/com/de/insights/technology/technology_guide/articles/led_technology.html&article=brake_force_display (accessed on 19 January 2016).
- Mercedes-Benz TechCenter: Adaptive Brake Lights. Available online: http://techcenter.mercedes-benz.com/en/adaptive_brakelight/detail.html (accessed on 19 January 2016).
- Chen, Y.-L.; Wang, S.-C.; Wang, C.-A. Study on Vehicle Safety Distance Warning System. In Proceedings of the ICIT 2008. IEEE International Conference on Industrial Technology, Chengdu, China, 21–24 April 2008; IEEE: New York, NY, USA, 2008. [Google Scholar] [CrossRef]
- Adaptive Cruise Control (ACC): Volkswagen UK. Available online: http://www.volkswagen.co.uk/technology/adaptive-cruise-control-acc (accessed on 19 January 2016).
- RFbeam Microwave GmbH: K-MC3 RADAR Transciever Datasheet. 2011. Available online: http://www.rfbeam.ch/fileadmin/downloads/datasheets/Datasheet_K-MC3.pdf (accessed on 19 January 2016).
- Raspberry Pi 1 Model B. Available online: https://www.raspberrypi.org/products/model-b/ (accessed on 19 January 2016).
- Kissinger, D. Millimeter-Wave Receiver Concepts for 77 Ghz Automotive Radar in Silicon-Germanium Technology; Springer: New York, NY, USA, 2012. [Google Scholar]
- Hasch, J.; Topak, E.; Schnabel, R.; Zwick, T.; Weigel, R.; Waldschmidt, C. Millimeter-Wave Technology for Automotive Radar Sensors in the 77 GHz Frequency Band. IEEE Trans. Microw. Theory Techn. 2012, 60, 845–860. [Google Scholar] [CrossRef]
- FrontPage—Raspbian. Available online: https://www.raspbian.org/ (accessed on 19 January 2016).
- Download Raspbian for Raspberry Pi. Available online: https://www.raspberrypi.org/downloads/raspbian/ (accessed on 19 January 2016).
- Bevly, D.M.; Gerdes, J.C.; Wilson, C.; Gengsheng, Z. The use of GPS based velocity measurements for improved vehicle state estimation. In Proceedings of the 2000 American Control Conference (Volume 4), Chicago, IL, USA, 28–30 June 2000; IEEE: New York, NY, USA, 2000. [Google Scholar]
- Serrano, L.; Kim, D.; Langley, R.B.; Itani, K.; Ueno, M. A GPS Velocity Sensor: How Accurate Can It Be?—A First Look. In Proceedings of the 2004 National Technical Meeting of The Institute of Navigation, San Diego, CA, USA, 26–28 January 2004; The Institute of Navigation, Inc.: Manassas, VA, USA, 2004. [Google Scholar]
- Varley, M.C.; Fairweather, I.H.; Aughey, R.J. Validity and reliability of GPS for measuring instantaneous velocity during acceleration, deceleration, and constant motion. J. Sports Sci. 2012, 30, 121–127. [Google Scholar] [CrossRef] [PubMed]


| Function | Available Options | |||||||
|---|---|---|---|---|---|---|---|---|
| 1 | 2 | 3 | 4 | 5 | 6 | 7 | ||
| a | Distance measurement | LIDAR | RADAR | LASER | image analysis | ultrasound | active infrared | passive infrared |
| b | Host vehicle velocity measurement | GPS | vehicle Hall sensor | optical sensor | ||||
| c | Data processing | microcontroller | embedded computer | desktop computer | laptop computer | |||
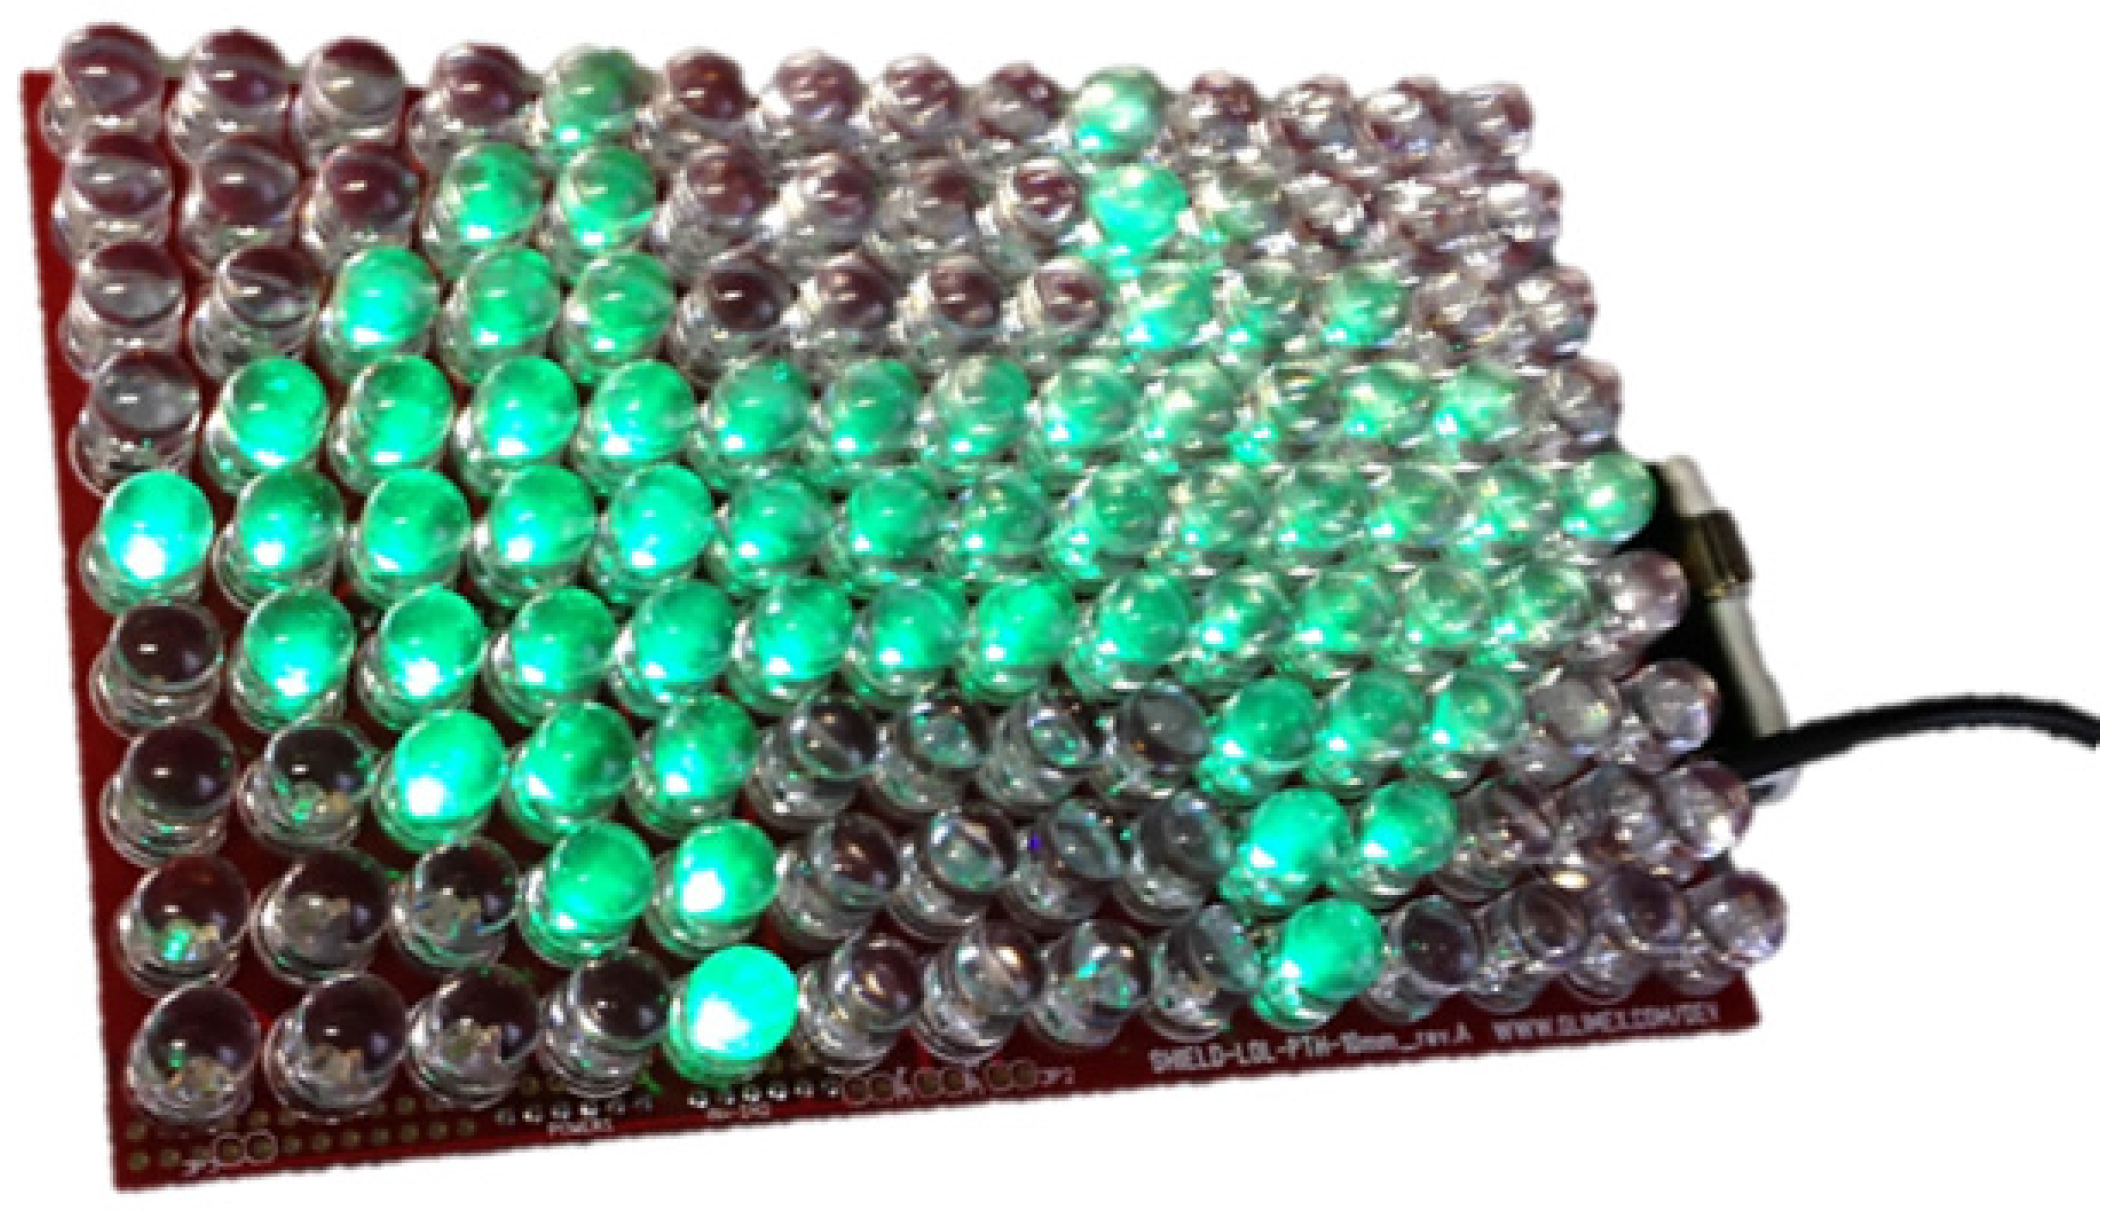
| d | Alerting the other vehicle’s driver | LED matrix display | transparent LED net | projection on glass | strobe flash | vehicle rear lights | LCD screen | |
| e | Power supply | vehicle on-board power | independent battery | solar cells | dynamo | |||
| f | Attachment to any vehicle | suction cups | adhesive | bolts | snap-in joints | |||
| g | Acceleration measurement | digital 3-axial accmtr. | analogue 3-axial accmtr. | |||||
| h | Automatic distress alert | GSM voice call | GSM text message | GSM data | Wi-Fi to mobile phone | Bluetooth | ||
| i | Alerting the host vehicle driver | audible: beep | audible: speech | visible: light | tactile: vibration | |||
| j | Parameter recording | hard disk | memory card | tachograph | ||||
| k | Recording locations with frequent violations | hard disk | memory card | tachograph | ||||
| l | Data transfer from the device for analysis | wired USB | wired serial | wired Ethernet | wireless Bluetooth | wireless Wi-Fi | ||
| Component | Manufacturer and Type | Cost Estimate (€) |
|---|---|---|
| Radar sensor with DSP board | RFbeam Microwave GmbH K-MC3 | 560 |
| Single-board computer | Raspberry Pi Foundation Model B | 30 |
| SDHC memory card | SanDisk Ultra (8 GB Class 10) | 8 |
| GPS module | u-blox AG Antaris 4 AEK-4T | 200 |
| Power supply voltage regulator + accessories (capacitors and heat sink) | Generic 7805-TO 220 | 4 |
| LED-matrix display (including a driver MC) | Olimex Shield-LOL-10 mm-Green | 25 |
| polypropylene (PP) enclosure | TRACON Electric Co. 200 × 150 × 75 mm | 6 |
| Suction cup mount | Bohle AG Veribor | 35 |
| Mounting accessories | various | 4 |
| Cables, connectors, adapters | various | 18 |
| Total | 890 |
| Measuring Wheel Distance (m) | Average Radar Measurement (m) | Average Absolute Error (m) | Average Relative Error (%) |
|---|---|---|---|
| 20.00 | 20.65 | 0.72 | 3.49 |
| 30.00 | 29.79 | 1.08 | 3.62 |
| 60.00 | 59.59 | 0.95 | 1.59 |
| Criterion Description | Pass | Fail | Remark | |
|---|---|---|---|---|
| 1 | GPS host vehicle velocity measurement error under 5% | - | - | not checked, GPS used as the reference |
| 2 | Radar host vehicle velocity measurement error under 10% | √ | ||
| 3 | Radar trailing vehicle velocity measurement error under 10% | - | - | not checked, assumed OK due to fulfilled Criterion 2 |
| 4 | Radar measuring range 5–70 m | √ | ||
| 5 | Radar distance measurement error under 10% | √ | ||
| 6 | Alert activation rate over 95% | √ | ||
| 7 | Radar provides reliable, disturbance-free distance measurement | x | false targets due to electrical interference | |
| 8 | Radar senses trailing vehicle cutting in onto the host vehicle lane | √ | ||
| 9 | Radar must not sense objects outside the roadway or vehicles on other lanes | x | false alerts in tight curves | |
© 2016 by the authors; licensee MDPI, Basel, Switzerland. This article is an open access article distributed under the terms and conditions of the Creative Commons Attribution (CC-BY) license (http://creativecommons.org/licenses/by/4.0/).
Share and Cite
Virant, M.; Ambrož, M. Universal Safety Distance Alert Device for Road Vehicles. Electronics 2016, 5, 19. https://doi.org/10.3390/electronics5020019
Virant M, Ambrož M. Universal Safety Distance Alert Device for Road Vehicles. Electronics. 2016; 5(2):19. https://doi.org/10.3390/electronics5020019
Chicago/Turabian StyleVirant, Matic, and Miha Ambrož. 2016. "Universal Safety Distance Alert Device for Road Vehicles" Electronics 5, no. 2: 19. https://doi.org/10.3390/electronics5020019
APA StyleVirant, M., & Ambrož, M. (2016). Universal Safety Distance Alert Device for Road Vehicles. Electronics, 5(2), 19. https://doi.org/10.3390/electronics5020019