Review

Wearable Photoplethysmographic Sensors—Past and Present

1
Osaka Electro-Communication University, Faculty of Biomedical Engineering /18-8, Hatsu-Cho, Neyagawa, Osaka 572-8530, Japan
2
Faculty of Engineering, Information and Systems, University of Tsukuba/1-1-1, Tennodai, Tsukuba, Ibaraki 305-8573, Japan
*
Author to whom correspondence should be addressed.
Electronics 2014, 3(2), 282-302; https://doi.org/10.3390/electronics3020282
Submission received: 25 February 2014 / Revised: 15 April 2014 / Accepted: 18 April 2014 / Published: 23 April 2014
(This article belongs to the Special Issue Wearable Electronics)

Abstract

:
Photoplethysmography (PPG) technology has been used to develop small, wearable, pulse rate sensors. These devices, consisting of infrared light-emitting diodes (LEDs) and photodetectors, offer a simple, reliable, low-cost means of monitoring the pulse rate noninvasively. Recent advances in optical technology have facilitated the use of high-intensity green LEDs for PPG, increasing the adoption of this measurement technique. In this review, we briefly present the history of PPG and recent developments in wearable pulse rate sensors with green LEDs. The application of wearable pulse rate monitors is discussed.

Graphical Abstract

1. Introduction

It is important to monitor the perfusion of the circulation. The most important cardiopulmonary parameter is blood pressure, but monitoring it is complicated. A second important parameter is blood flow, which is related to blood pressure. We can monitor the blood perfusion in large vessels using ultrasound devices, but it is not practical to use these routinely. Several devices for monitoring blood perfusion have been developed [1], but, unfortunately, it is difficult to find a practical device. However, the perfusion of blood flow and blood pressure can be determined easily using a pulse rate monitor.
Wearable pulse rate sensors based on photoplethysmography (PPG) have become increasingly popular, with more than ten companies producing these sensors commercially. The principle behind PPG sensors is optical detection of blood volume changes in the microvascular bed of the tissue. The sensor system consists of a light source and a detector, with red and infrared (IR) light-emitting diodes (LEDs) commonly used as the light source. The PPG sensor monitors changes in the light intensity via reflection from or transmission through the tissue. The changes in light intensity are associated with small variations in blood perfusion of the tissue and provide information on the cardiovascular system, in particular, the pulse rate. Due to the simplicity of this device, wearable PPG pulse rate sensors have been developed. This review describes the basic principles of PPG, previous and current developments in wearable pulse rate monitors with a light source, and the elimination of motion artifacts.

2. Photoplethysmography (PPG)

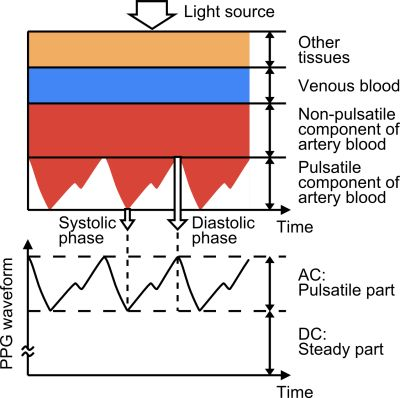
2.1. Principle of PPG

The principle of PPG has been reviewed previously [2,3,4], and is explained briefly here. Light travelling though biological tissue can be absorbed by different substances, including pigments in the skin, bone, and arterial and venous blood. Most changes in blood flow occur mainly in the arteries and arterioles (but not in the veins). For example, arteries contain more blood volume during the systolic phase of the cardiac cycle than during the diastolic phase. PPG sensors optically detect changes in the blood flow volume (i.e., changes in the detected light intensity) in the microvascular bed of tissue via reflection from or transmission through the tissue.
Figure 1 shows an example of a photoplethysmographic waveform, consisting of direct current (DC) and alternating current (AC) components. The DC component of the PPG waveform corresponds to the detected transmitted or reflected optical signal from the tissue, and depends on the structure of the tissue and the average blood volume of both arterial and venous blood. Note that the DC component changes slowly with respiration. The AC component shows changes in the blood volume that occurs between the systolic and diastolic phases of the cardiac cycle; the fundamental frequency of the AC component depends on the heart rate and is superimposed onto the DC component.
Figure 1. Variation in light attenuation by tissue.
Electronics 03 00282 g001

2.2. Light Wavelength

The interaction of light with biological tissue can be quite complex and may involve scattering, absorption and/or reflection. Anderson and Parrish examined the optical characteristics and penetration depth of light in human skin [5]; within the visible region, the dominant absorption peak corresponded to the blue region of the spectrum, followed by the green-yellow region (between 500 and 600 nm) corresponding to red blood cells. The shorter wavelengths of light are strongly absorbed by melanin. Water absorbs light in the ultraviolet and longer IR regime; however, red and near-IR light pass easily. As a result, IR wavelengths have been used as a light source in PPG sensors.
Blood absorbs more light than the surrounding tissue. Therefore, a reduction in the amount of blood is detected as an increase in the intensity of the detected light. The wavelength and distance between the light source and photodetector (PD) determine the penetration depth of the light. Green light is suitable for the measurement of superficial blood flow in skin. Light with wavelengths between 500 and 600 nm (the green-yellow region of the visible spectrum) exhibits the largest modulation depth with pulsatile blood absorption. IR or near-IR wavelengths are better for measurement of deep-tissue blood flow (e.g., blood flow in muscles). Thus, IR light has been used in PPG devices for some time [6]. However, green-wavelength PPG devices are becoming increasingly popular due to the large intensity variations in modulation observed during the cardiac cycle for these wavelengths [7,8,9].
A green LED has much greater absorptivity for both oxyhaemoglobin and deoxyhaemoglobin compared to infrared light. Therefore, the change in reflected green light is greater than that in reflected infrared light when blood pulses through the skin, resulting in a better signal-to-noise ratio for the green light source.
Several green-light-based photoplethysmographs are available commercially. For example, MIO Global has developed the MIO Alpha in cooperation with Philips; this measures the electrocardiogram (ECG) with 99% accuracy, even while cycling at speeds of up to 24 kmph [10]. For daily use, Omron has developed a green light pulse rate monitor (HR-500U, OMRON, Muko, Japan).
Furthermore, the use of video cameras using the signal based on the red green blue (RGB) colour space has been considered, as shown in Section 3.3. The green signal was found to provide the strongest plethysmographic signal among camera RGB signals [11,12]. Haemoglobin absorbs green light better than red and green light penetrates tissue to a deeper level than blue light. Therefore, the green signal contains the strongest plethysmographic signal.

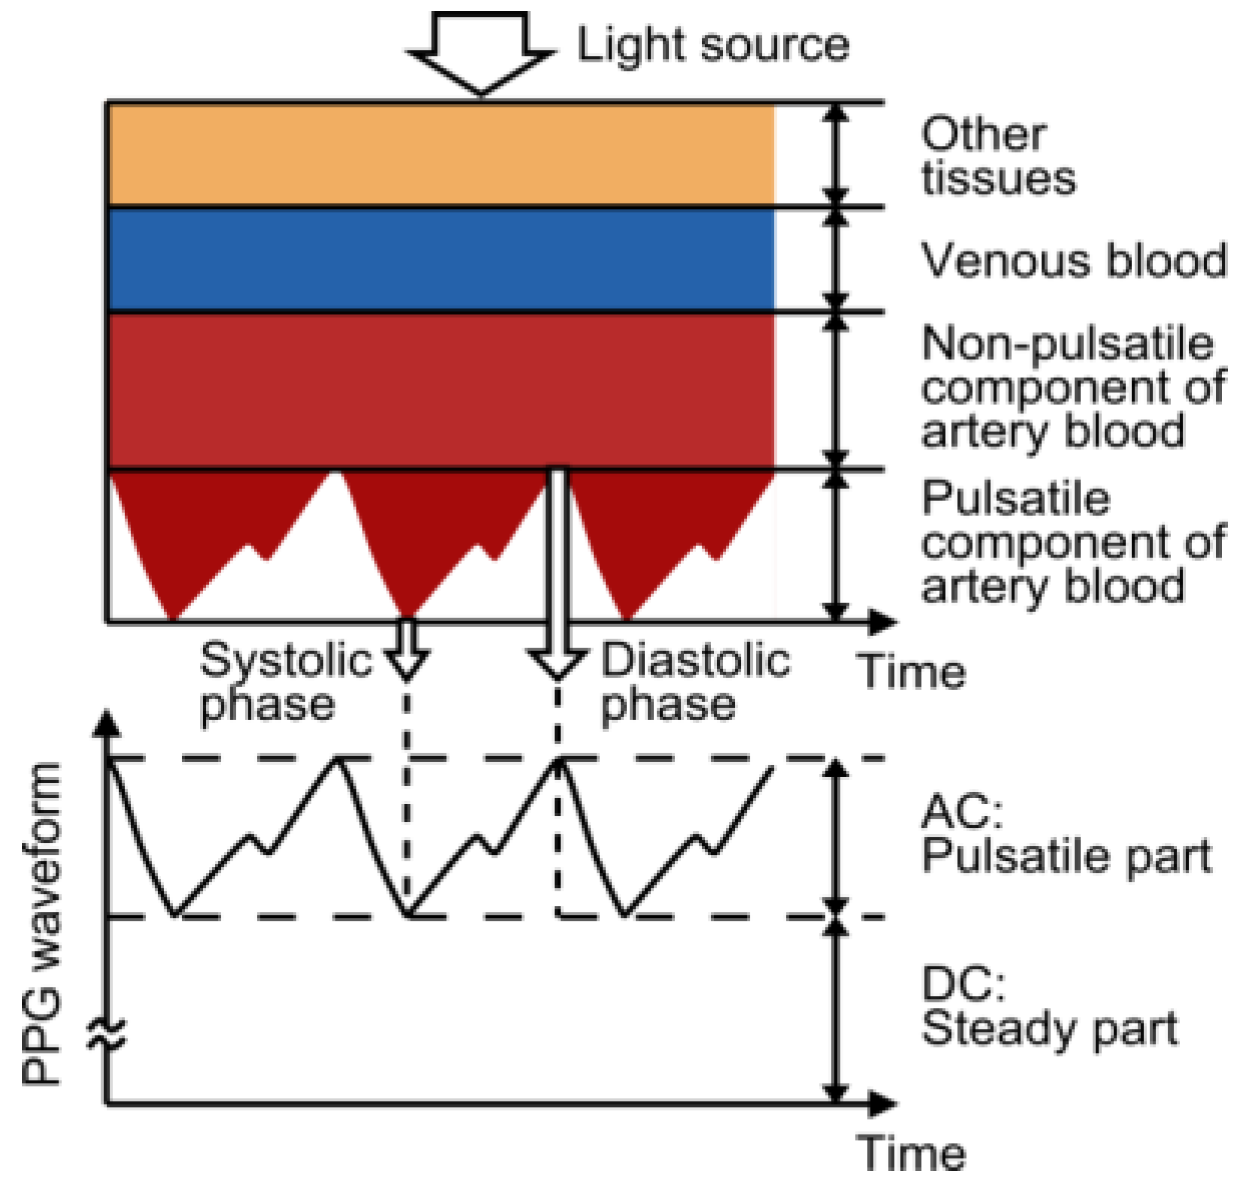
2.3. Reflected and Transmitted Signals

The wearable PPG has two modes—transmission and reflectance—as shown in Figure 2. In transmission mode, the light transmitted through the medium is detected by a PD opposite the LED source, while in reflectance mode, the PD detects light that is back-scattered or reflected from tissue, bone and/or blood vessels.
Figure 2. Light-emitting diode (LED) and photodetector (PD) placement for transmission- and reflectance-mode photoplethysmography (PPG).
Electronics 03 00282 g002
The transmission mode is capable of obtaining a relatively good signal, but the measurement site may be limited. To be effective, the sensor must be located on the body at a site where transmitted light can be readily detected, such as the fingertip, nasal septum, cheek, tongue, or earlobe. Sensor placement on the nasal septum, cheek or tongue is only effective under anesthesia. The fingertip and earlobe are the preferred monitoring positions; however, these sites have limited blood perfusion. In addition, the fingertip and earlobe are more susceptible to environmental extremes, such as low ambient temperatures (e.g., for military personnel or athletes in training). The greatest disadvantage is that the fingertip sensor interferes with daily activates.
Reflectance mode eliminates the problems associated with sensor placement, and a variety of measurement sites can be used (as discussed in the following section). However, reflection-mode PPG is affected by motion artifacts and pressure disturbances. Any movement, such as physical activity, may lead to motion artifacts that corrupt the PPG signal and limit the measurement accuracy of physiological parameters. Pressure disturbances acting on the probe, such as the contact force between the PPG sensor and measurement site, can deform the arterial geometry by compression. Thus, in the reflected PPG signal, the AC amplitude may be influenced by the pressure exerted on the skin.
Reflectance PPG sensors such as the MaxFast (Nellcor™, Mansfield, MA, USA) have been used clinically to measure continuous oxygen saturation non-invasively. Anecdotally, it gives false-positive readings occasionally. Further research is needed in this area.

3. Factors Affecting PPG Recordings

Previous research has identified several factors that affect PPG recordings, including the measurement site (i.e., probe attachment site), the contact force, mechanical movement artifacts, subject posture, and breathing, as well as ambient temperature. This chapter briefly discusses these factors.

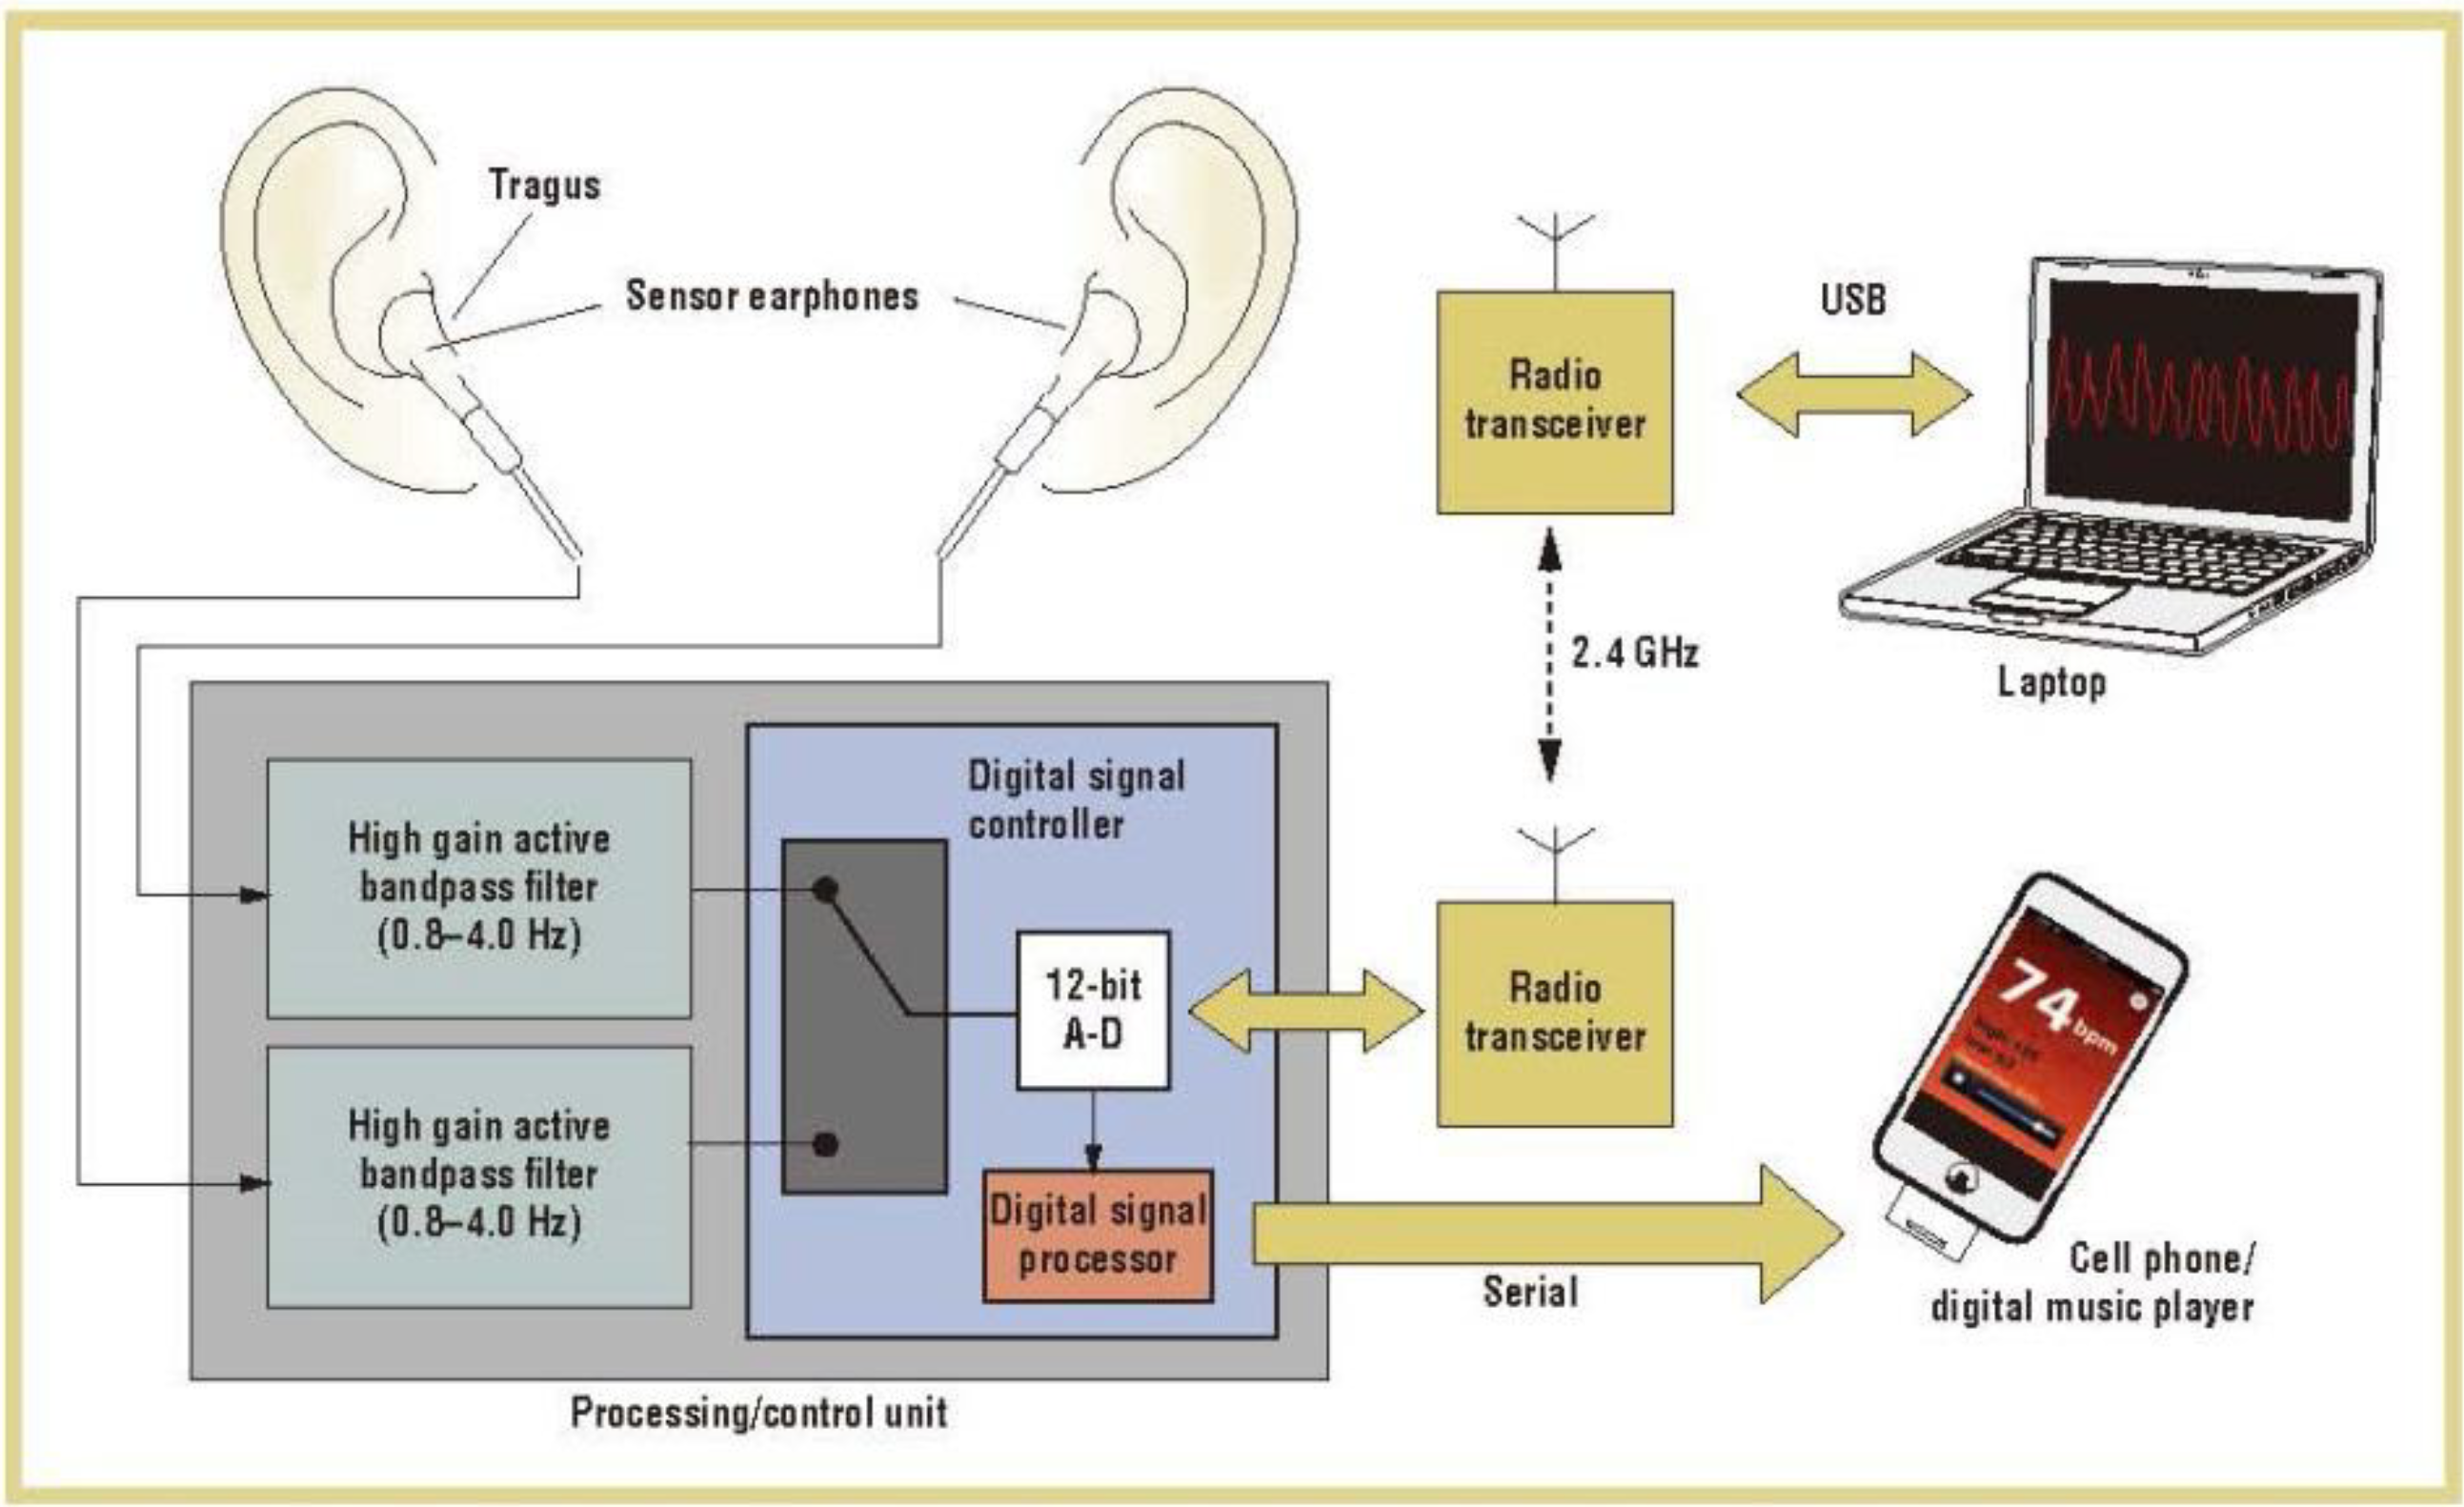
3.1. Measurement Site of Probe

The location of the LED and PD is an important design issue that affects the signal quality and robustness against motion artifacts. Therefore, suitable measurement sites must be located to optimize sensor performance. PPG sensors are commonly worn on the fingers due to the high signal amplitude that can be achieved in comparison with other sites [13]. However, this configuration is not well suited to pervasive sensing, as most daily activities involve the use of the fingers.
In recent years, different measurement sites for PPG sensors have been explored extensively, including the ring finger [14], wrist [15,16], brachia [9,17,18], earlobe [19,20,21], external ear cartilage [22,23,24], and the superior auricular region [25,26,27]. In addition, the esophageal region has been used in clinical practice [28,29,30]. Commercial clinical PPG sensors commonly use the finger, earlobe and forehead [31]. In addition, use of a glass-type wireless PPG has been examined [32].
The perfusion values of 52 anatomical sites in healthy subjects showed that the fingers, palm, face, and ears offer much higher perfusion values compared with other measurement sites [33]; the transmitted PPG signal amplitude from the earlobe provides the largest perfusion value. In addition, earlobe sensors are easy to fabricate, and have become popular as pulse rate monitors (Table 1). However, a spring-loaded ear-clip, although effective, can become painful over extended monitoring periods. There was little improvement in the wearable earlobe PPG sensor design until the development of micro-electromechanical system (MEMS) technology. MEMS facilitated the fabrication of a lightweight, comfortable, fully integrated, self-contained sensor earpiece. For example, an earring PPG sensor with magnetic attachment to the earlobe was developed that allowed good contact for monitoring during physical activity [22].
Table 1. Key features of a wearable ear photoplethysmography (PPG) device.
FeaturesIn-mountCUHKe-ARImperialMITMITPulsearSamsung
Year published2009 [20]2008 [26]2007 [19]2009 [27]2010 [22]2012 [24]2004 [23]2009 [21]
Sensing siteAuditory canalInferior auricleSuperior auricleSuperior auricleEarlobeExternal ear cartilageExternal ear cartilageEarlobe
Probe attachmentOtoplastic insertionEarhookEarhookTapeMagnetic earringEarphoneEarcup headphonesSpring-loaded clip
Wireless communicationYesYesNoNoYesYesNoNo
Motion cancellationNoneNonePassive motion cancellationNoneAutomatic noise cancellationAutomatic noise cancellationPCAAutomatic noise cancellation
Earphone/earbud PPG sensors are also available and provide greater comfort for the user. In this design, a reflective photosensor is embedded into each earbud, as shown in Figure 3. The sensor earbuds are inserted into the ear and positioned against the inner side of the tragus to detect the amount of light reflected from the subcutaneous blood vessels in the region. The PPG sensor earbuds look and work like a regular pair of earphones, requiring no special training for use [24].
Figure 3. Earpiece PPG sensor (with permission [24]).
Electronics 03 00282 g003
A headset with an ear-clip, transmission-type PPG sensor allows continuous, real-time monitoring of heart rate while listening to music during daily activities. In addition, the proposed headset is equipped with a triaxial accelerometer, which enables the measurement of calorie consumption and step-counting. However, over the course of a variety of daily activities (e.g., walking, jogging, and sleeping), the PPG sensor signal may become contaminated with motion artifacts [20].
The most common commercially available PPG sensor is based on finger measurement sites. Finger sites are easily accessed and provide good signal for PPG sensor probes. For example, a ring sensor can be attached to the base of the finger for monitoring beat-to-beat pulsations. Data from the ring sensor are sent to a computer via a radiofrequency transmitter, as shown in Figure 4. To minimize motion artifacts, a double ring design was developed to reduce the influence of external forces, acceleration and ambient light, and to hold the sensor gently and securely to the skin, so that the blood circulation in the finger remained unobstructed. Experiments have verified the resistance of the ring sensor to interfering forces and acceleration acting on the ring body. Benchmark testing with FDA-approved PPG and ECG sensors revealed that the ring sensor is comparable in the detection of beat-to-beat pulsations, despite disturbances [14,34].
Figure 4. PPG ring sensor.
Electronics 03 00282 g004
Wristwatch-type pulse oximetry and blood pressure sensors have been developed and commercialized by several companies. These devices, although much easier to wear, are not usually used in clinical settings, due to several technical issues. However, a novel PPG array sensor module with a wristwatch-type design has been developed. The proposed module measures the PPG signal from the radial artery and the ulnar artery of the wrist, whereas previous methods obtained signals from the capillaries in the skin. Phototransistors and IR-emitting diodes were placed in an array format to improve the PPG signal sensitivity and level of accuracy. Various arrays were considered for optimization. A conductive fiber wristband was used to reduce external noise. In the experiments, the proposed module was assessed and compared with the commercially available product produced by BIOPAC [16].
A reflective brachial PPG sensor has also been examined. Although the pulse amplitude is lower than those from the finger and earlobe, the PPG pulse waveforms from regions in the vicinity of a human artery could be detected and measured easily [17].
Forehead sensors have shown greater sensitivity to pulsatile signal changes under low perfusion conditions, compared with other peripheral body locations [31]. The thin-skin layer of the forehead, coupled with a prominent bone structure, helps to direct light back to the PD. Sensor placement on the forehead has been shown to result in decreased motion artifacts during certain types of physical activity.
Glass-type PPG sensors have also been investigated. A reflectance mode-PPG sensor, equipped with an accelerometer for detecting kinetic signals and a wireless controller for transmitting both signals to the receiver installed on the frame of the glass, was used to obtain PPG data from a user performing alternating sitting and sit-to-stand motions—the correlation between the peak-to-peak intervals in the signals of a BIOPAC device and the developed device was 97.5% and 87% for sitting and the sit-to-stand motion, respectively, given 100% data transmission without error [32].

3.2. Probe Contact Force

In reflectance-type PPG, the PPG signal waveform may be affected by the contact force between the sensor and the measurement site. The waveform of the obtained PPG signal differs depending on the PPG probe contact pressure. A number of studies have suggested that the PPG waveform coincides with arterial stiffness and vascular reactivity. Several studies have shown that moderate pressure on the sensor can improve the PPG signal. Ideally, the best PPG signal can be obtained under conditions of transmural pressure, defined as the pressure difference between the inside and outside of the blood vessel (i.e., the pressure across the wall of the blood vessel). Insufficient pressure results in inadequate contact and consequently low AC signal amplitude. However, PPG signal recording under excessive pressure conditions can also lead to low AC signal amplitude, as well as distorted waveforms caused by the occluded artery beyond the PPG probe. Optimal contact pressure corresponds to the maximal pulsatile amplitude; this occurs when the transmural pressure approaches zero (i.e., under maximal arterial compliance).
Despite numerous attempts, no generally accepted standards have been adopted for clinical or fundamental PPG measurements of contact pressure. Changes in the AC pulse amplitude, DC amplitude, ratio of AC/DC amplitudes and normalized pulse area of the reflected PPG signal have been investigated [35]. In one study, a contact force ranging from 0.2 to 1.8 N was applied to the finger [36]. As a result, the AC amplitude increased and then decreased with increasing contact force. For different arterial stiffness with gender and age, the pulse amplitude and the AC/DC ratio peaked at different contact forces ranging from 0.2 to 1.0 N; most subjects achieved their maximum pulse amplitude within 0.2–0.4 N. Note that a calibration load of 0.65 N was applied to the fingertip skin to provide a uniform pressure force during the experiment. A similar contact force study was conducted on the upper arm [37]; an average compression pressure of 30 mmHg (4 kPa) produced a PPG peak amplitude for IR and green light sources.
Studies have shown that contact pressures ranging from 8 to 12 kPa (60–90 mmHg) resulted in the largest PPG amplitude for a reflectance sensor attached to the forehead region above the eye, although the signal-to-noise ratio (SNR) did not improve significantly [38]. Note that in SpO2 studies, the ratio between the relative change in the red and IR light intensities (R/IR) was used to indicate accurate oxygen saturation; R/IR values varied from 0 to 80 mmHg for the forehead of a newborn infant, with a portion of the PPG signal derived from tissue underneath the skull [39,40,41].
Transmission-type PPG also affects the transmural pressure. Increasing the amplitude of arterial pulsations improves the PPG SNR. For example, when measuring the pulsatile amplitude of a finger-based PPG sensor, as the cuff pressure increases, the PPG amplitude increases and then decreases to zero when the arterial blood vessel becomes occluded. The largest PPG amplitude (i.e., approaching zero transmural pressure), in general, corresponds to the mean arterial pressure. However, this pressure is too high for application over any significant period. To prevent the collapse of capillary beds, the cuff pressure must be on the order of 10 mmHg, which is too low to obtain sufficient PPG amplitude. Thus, even for transmission-type photoplethysmographs, care must be taken in how the sensor is attached to the finger.
In one particular study, blood pressure and finger PPG waveforms were simultaneously measured in healthy volunteers under different contact pressures ranging from 0 to 200 mmHg [42]. The results of PPG regression indicated that the amplitude ratio was highest for a contact pressure of 60 mmHg.
The optimal contact pressure of the probe is important, particularly with regard to arterial stiffness. Arterial stiffness, estimated from the PPG pulse-wave second-derivative parameter, b/a, is strongly inconsistent when recorded at non-optimal probe contact pressures. To determine the optimal contact pressure, one group obtained in vivo PPG readings from conduit artery sites in five healthy subjects recorded with probe contact pressures ranging from 0 to 15 kPa [43]. In this study, an 880-nm reflectance-type sensor and force transducer derived the optimal contact pressure criterion from the PPG AC signal area; the b/a values showed high repeatability (coefficient of variability < 5%) for a contact pressure of 10 kPa (75 mmHg), indicating optimal contact [43].

3.3. Video Plethysmography

A video camera can be used as a PD; this is termed video plethysmography. There are two types of video plethysmography. One is non-contact for long distance measurements. This uses a charge coupled device (CCD) camera, such as a mobile phone camera or web camera, and examines the light reflected from skin. Plethysmographic signals can be measured remotely (>1 m) using ambient light and PD with either a simple consumer-level digital camera in movie mode or a cellular phone [11,44,45,46]. Although the green channel features the strongest plethysmographic signal, corresponding to an absorption peak by (oxy-) hemoglobin, the red and blue channels also contain plethysmographic information. These results suggest that ambient light PPG may be useful for medical purposes, such as the characterization of vascular skin lesions or remote sensing of vital signs for triage or sports purposes. The other is the contact type for short-distance measurements, such as placing the finger on the mobile phone camera to cover the entire camera view and using the phone camera flash LED light (white light) to illuminate the finger [47]. This type of PPG measurement method has been commercialized by Azumio [48].

3.4. Signal Processing

3.4.1. Introduction

Motion artifacts mainly consist of random low-frequency interference. Therefore, most artifact reduction is accomplished by signal processing. The signal-processing algorithm basically assumes that the original PPG signal has power only at certain frequencies and that the rest is noise. Several signal processing techniques can be applied, including those that use referencing from an acceleration signal or those that minimize the motion artifact with synthetic noise generation. However, attempts to minimize motion artifacts reported to date do not appear to correlate well with real-world noise sources. Moreover, studies have shown that a high degree of randomness is not necessarily correlated with true motion artifacts in PPG signals. This section briefly reviews current signal processing methods used to reduce motion artifacts.

3.4.2. Moving Average Filter

The moving average method is commonly used to reduce motion artifacts and works well for a limited artifact range. However, this method does not account for sudden changes. The periodic moving average filter (PMAF), based on the quasi-periodicity of the PPG signals, segments the PPG signal into periods and resamples each period. Thus, with PMAF, the motion artifacts are removed without degrading the signal [49].
In-band noise occurs when the spectra of the motion artifact and that of the PPG signal overlap significantly. However, it is not advisable to use fixed-frequency filtering techniques to eliminate motion artifacts due to in-band interference and the overlapping frequency spectra in the PPG signal. Instead, motion artifacts can be removed using a filter bank and a matched filter consisting of several frequency bands [50]. In this case, the adaptive filter exhibited many variations and errors due to amplitude variations during convergence when measuring PPG in real-time, whereas the moving average filter exhibited a more stable output. Compared with traditional adaptive filtering methods, the ratio variation was 50% lower than that of the moving average filter, allowing more stable measurement of oxygen saturation, despite the patient’s movement [50].

3.4.3. Fourier Analysis

A Fourier series is applicable only to periodic signals, and, therefore, cannot be directly applied to a PPG signal, which is non-stationary and quasi-periodic. To overcome this problem, Fourier series analysis can be applied on a cycle-by-cycle basis. In this case, the acquired data are first filtered using a Savitzky-Golay (SG) smoothing filter to remove high-frequency noise. Once the noise has been removed, the proposed cycle-by-cycle Fourier series (CFS) analysis is carried out, and the PPG signals (IR and red) are reconstructed on a cycle-by-cycle basis. Experimental results have verified the efficacy of the proposed method [51]. Moreover, the results showed that artifacts induced by patient movement were attenuated by at least 35 dB, reducing the measurement error of the PPG signal from 37% to 3% using the technique described above.

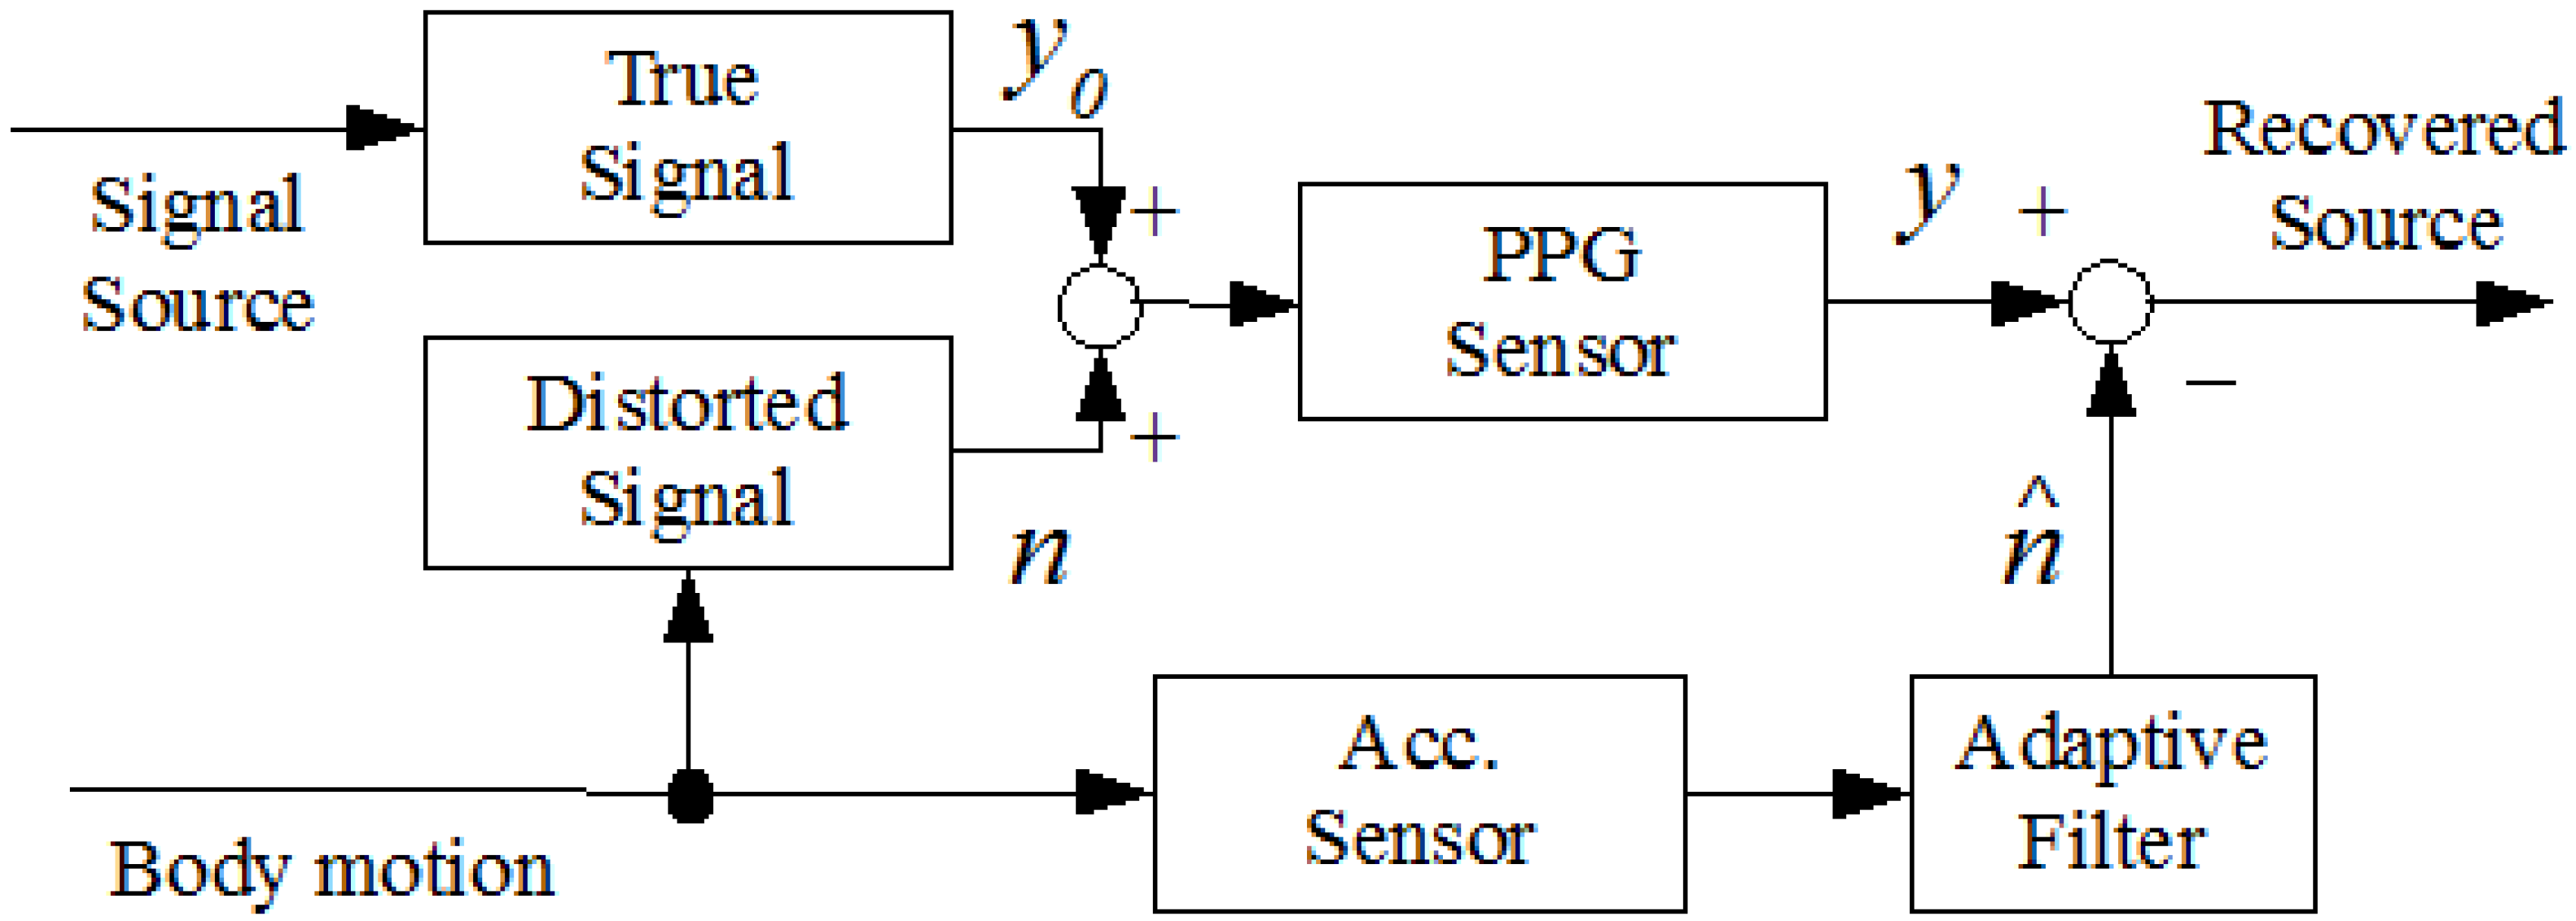
3.4.4. Adaptive Filter

The basic function of a filter is to remove the unwanted signal from the signal of interest. A commonly used filtering technique separates the signal from noise using the peak frequencies of the signal and artifact. In addition, the mean square of the error signal (the difference between the desired response and actual response of the filter) can be minimized. However, when the peak frequency of the pulse rate is similar to the noise frequency, the pulse rate cannot be separated from the noise. In PPG measurements, active noise cancellation with acceleration-based adaptive filters has been attempted by several groups (Figure 5). Obtaining the best design usually requires a priori knowledge of certain statistical parameters (such as the mean and correlation functions) within the useful signal. With this information, an optimal filter can be designed that minimizes the unwanted signals according to statistical criteria.
Figure 5. Block diagram of an adaptive filter with an accelerometer.
Electronics 03 00282 g005
Adaptive noise cancellation (ANC) is an alternative technique used to estimate signals corrupted by additional noise or interference. The adaptive filter is inherently self-designed through the use of a recursive algorithm that updates the filter parameters. This approach can be used to obtain the desired level of noise rejection, without a priori estimates of the signal or noise. Two inputs are required for this method: (i) the primary input containing the corrupted signal and (ii) a reference input containing some potential noise correlation to the primary noise; note that an acceleration sensor can be used as the reference input. Figure 5 shows a motion-tolerant wearable biosensor using a MEMS accelerometer [52,53], which operates based on adaptive noise cancellation utilizing an acceleration reference. This development has motivated new and improved PPG sensor design.

3.4.4.1. Least Mean Square Adaptive Algorithm

The least mean square (LMS) adaptive algorithm removes motion artifact noise by estimating the synthetic noise reference signal and adapting the filter coefficients based on filter order. LMS algorithms are a class of adaptive filters used to mimic the desired filter by finding the filter coefficients that relate to producing the least mean square of the error signal.
Many adaptive techniques have been applied to the reduction of motion artifacts from PPG signals, including the normalized least mean squares (NLMS) method, recursive least squares (RLS) filter, time varying step-size LMS (TVS-LMS), adaptive step-size LMS (AS-LMS), and Kalman filters. A LMS filter with automatic step-size control was used to mitigate the effects of motion artifacts in PPG recordings for long-term patient monitoring [54]. The experimental results indicated that the proposed variable step-size LMS filter provided better performance than the LMS filter with a fixed step-size. In another study, a two-dimensional (2-D) active noise cancellation algorithm was applied to compensate for motion-distorted signals using directional accelerometer data [55]; a NLMS adaptive filter (fourth-order) was used in the algorithm, resulting in a reduction in signal distortion from 52.34% to 3.53% over the frequency range of 1–2.5 Hz (the frequency range for daily motion, such as walking and jogging). In addition, this wearable health-monitoring device, equipped with a motion artifact reduction algorithm, can be integrated as a terminal in a so-called ubiquitous healthcare system, to provide continuous health monitoring without interrupting daily life.
In another study, a triaxial MEMS accelerometer was attached to a PPG sensor to detect wrist movement [56]. In this case, a fast transversal RLS algorithm was used to reduce the computational complexity of the adaptive filter, by providing an estimate of the linear motion-to-artifact transfer function. The resulting output represented an estimation of the noise, which was then minimized by the RLS algorithm. Experimental results showed that this device produced more reliable signals that were stable against motion artifact corruption under typical types of movement, such as the swinging of the arms [56].
A Laguerre series was implemented to compactly represent the system dynamics for joggers using a few parameters, such as the heart rate [57]. This study determined that the standard artifact reduction scheme does not work when the physiological signal is correlated with wearer motion. Thus, adaptive blind-source separation techniques can be used to recover the physiological signal. However, the success of this method is currently limited.
In one study, the correlations among six representative daily motions and patterns of motion artifacts were examined to obtain more precise analysis [58]. An artifact reduction algorithm was designed for the analysis using the motion data. In addition, in this study, the short operating times and small number of variables for the portable device required the use of an LMS adaptive filter. The results using this filter were compared with those using other noise reduction algorithms. For validation purposes, a real-time motion artifact reduction experiment was performed using a wearable device during the motions. The results indicated that the motion artifacts of wearable PPG devices can be effectively reduced using the proposed method and that such devices can potentially be used in daily life with any type of motion.
The TVS-LMS algorithm offers a fast convergence rate. However, performance studies have shown that the AS-LMS algorithm provides not only a fast convergence rate, but also minimal mean square error (MSE), as indicated by the high SNR values.
A simple, efficient approach, based on the AS-LMS adaptive filter, was applied to reduce motion artifacts in corrupted PPG signals [59]. In this study, a synthetic noise reference signal, representing motion artifact noise, was generated internally from the motion artifact-corrupted PPG signal itself, and therefore no additional hardware (e.g., accelerometer or source-detector pair) was used. The generated noise reference signal was then filtered through the AS-LMS adaptive filter for artifact removal. While experimental results confirmed the efficacy of the proposed scheme, the merits of the method were clearly demonstrated in convergence and correlation analysis. Thus, the results of this study suggested the usefulness of this technique for present-day pulse PPG oximeters operating under a single source-detector pair. Without using an accelerometer signal, singular value decomposition (SVD) and independent component analysis (ICA) can be used to generate a reference noise signal.
The adaptive comb filter (ACF) has also been proposed for reducing the effects of motion artifacts from PPG signals. The ACF algorithm consists of two cascading parts—the first estimates the fundamental frequency and enhances the harmonic component in the input, while the second estimates the harmonic amplitudes and phases [60]. An ACF, with an adaptive lattice infinite impulse response (IIR) notch filter (ALNF), successfully reduced the motion artifacts from quasi-periodic PPG signals [61]. Similarly, an adaptive scaled Fourier linear combiner (SFLC) was used to reduce motion artifacts in PPG signals without the need for additional sensors [62].

3.4.4.2. Kalman Filter

A fixed-interval Kalman smoother, along with an adaptive filtering algorithm (e.g., NLMS, RLS, and conventional Kalman filter algorithms), can be used to estimate motion artifact reduction, and has been shown to provide reliable information from the reconstructed PPG signals [63].
With the inclusion of a special data structure in the Kalman filter, estimation of the true PPG signal can be obtained. In one study, finger movement was simulated and used as reference noise. The contaminated PPG signal was used as the primary signal [64], and the proposed algorithm was able to extract the main signal from the disturbance within the same band, unlike conventional filtering methods.
A particle filter can be used to estimate the desired signal from corrupted signals. In computer experiments using real PPG signals acquired from a wristwatch-type PPG array sensor, the proposed algorithm was shown to reduce movement noise effectively and improve emotion recognition accuracy by 12.7% (8.3%) and 10.9% (8.2%) for arm movement and walking, respectively, compared with the conventional NLMS algorithm (conventional Kalman filter-based algorithm) [65]; the output SNR improved by 4.5 dB on average. A two-stage NLMS adaptive filter was also designed and experimental results indicated high correlation of heart rate (0.98) and SpO2 extraction (0.7) [66].

3.4.4.3. Time-Frequency Methods and Wavelet Transformation

Due to the nature of biological systems, biological signals tend to be non-stationary and their properties can change substantially over time. Thus, time–frequency methods (e.g., wavelet transforms [67] and smoothed pseudo Wigner-Ville distributions [68]) may provide better signal enhancement for PPG signals than traditional methods. A comparative study in the efficiency of wavelet transform and adaptive filtering techniques for restoring artifact-reduced PPG signals for heart rate estimations revealed that both methods introduce a phase shift to the PPG signals [69,70].
Wavelet analysis may be advantageous over Fourier transform (FT) techniques for non-stationary signals. Lee et al. (2003) [67] proposed a wavelet “denoising” approach for the reduction of motion artifacts from PPG recordings, in which the stationary wavelet transform (SWT) and wavelet transform modulus maxima (WTMM) were used to remove motion artifacts. In the experimental set-up, two identical PPG circuits were used. One of these circuits was attached to the subject’s left index finger that was held in a stable position to obtain a reference signal as standard. Meanwhile, the second circuit was attached to the right index finger that moved vertically or circularly to introduce motion artifacts. The corrupted PPG signals were decomposed by a seven-level SWT for circular motion. The signal was then reconstructed by applying the inverse of the SWT and WTMM to remove signal noise. By applying the proposed method, the researchers observed an 87% (61%) reduction in heart rate estimation error and a 66% (46%) reduction in instantaneous heart rate error for vertical motion (circular motion).
Wavelet-based signal processing techniques have been used to improve implantable blood perfusion monitoring systems. In this study [69], data were acquired from both in vitro and in vivo sources: a perfusion model and the proximal jejunum of an adult pig. The results showed that wavelet analysis was able to isolate the perfusion signals from raw, periodic, in vitro data, as well as fast Fourier transform (FFT) methods. However, for the quasi-periodic in vivo data segments, wavelet analysis provided more consistent results than FFT analysis for data segments 5, 10 and 50 s in length. Wavelet analysis has been shown to require fewer data points for quasi-periodic data than FFT analysis, making it a good choice for indwelling perfusion monitors where power consumption and reaction time are of paramount importance.
The smoothed pseudo Wigner-Ville distribution (SPWVD) has been applied to reduce motion artifacts affecting pulse oximetry. The SPWVD approach was compared with two other techniques commonly used in this field: the weighted moving average (WMA) and FFT. SpO2 and pulse rate were estimated from a PPG signal recorded when the subject was in the resting state, as well as when performing four types of motion: horizontal and vertical movements of the hand, and bending and pressing motions of the finger. For each condition, 24 sets of 30-s PPG signals were collected from six subjects. These signals were evaluated with respect to a PPG reference signal recorded simultaneously from the subject’s other hand that was stationary at all times. The SPWVD approach showed significant improvement in performance (p < 0.05), compared with traditional approaches, when subjects bent their finger or pressed their finger against the sensor. In addition, the SPWVD approach also significantly reduced the mean absolute pulse rate error (p < 0.05) from 16.4 bpm and 11.2 bpm for the WMA and FFT approaches, respectively, to 5.62 bpm [68].

3.4.4.4. Principle Component Analysis (PCA)

Adaptive filtering, combined with an improved mechanical design and probe configuration, increased the accuracy of the PPG signal received [14]. Motion robustness can be obtained using accurate motion reference signals from three-dimensional (3-D) low-noise accelerometers, together with dual-channel IR sensing. Nonlinear modeling and the spatial diversity of the sensor can be used to remove the motion contributions in optical signals and the reciprocal contributions in the two channels, respectively. Spatiotemporal principle component analysis (PCA) takes advantage of both the spatial and temporal correlations between and within observed noise signals. The basic concept of PCA-based noise reduction is to observe the noisy data in a large m-dimensional space of delayed coordinates. As the noise is assumed to be random, it extends in an approximately uniform manner in all directions in this space. In contrast, the dynamics of deterministic systems underlying the data confine the trajectories of useful signals to a lower dimensional subspace of dimension p < m. Consequently, the eigenspace of the observed noisy mixtures is partitioned into a noise and a signal-plus-noise subspace. In this case, noise reduction is performed by projecting the noisy mixtures onto the signal and noise subspace.
Multi-scale PCA (MSPCA) combines the ability of PCA to decorrelate the variable with wavelet analysis for motion artifact reduction from recorded PPG data. MSPCA performs PCA of the wavelet coefficients for each scale, and then combines the results at relevant scales. In experimental studies, MSPCA outperformed the basic wavelet-based processing techniques for motion artifact reduction of PPG signals and was shown to be best suited for pulse oximetry applications.

3.4.4.5. Independent Component Analysis (ICA)

The independent component analysis (ICA) model describes generation of the observed data in terms of mixing of components. ICA can be applied to pulse oximeter signals to separate PPG data from motion artifacts, ambient light and other interference in low-motion environments. ICA is attractive as it does not require prior knowledge of the system. However, ICA assumes that all source signal component pairs are mutually independent. It is important to assess the statistical independence of the source components in PPG data, especially if ICA is to be applied in ambulatory monitoring environments, where motion artifacts can have a substantial effect on the quality of data received from light-based sensors. Analyses have indicated that motion significantly affects arterial flow, so care must be taken when applying ICA to light-based sensor data acquired from wearable platforms [71]. In addition, by exploiting the independence between PPG and motion artifacts, Kim and Yoo proposed that the combination of ICA and block interleaving with a low-pass filter can reduce the motion artifacts under the conditions used in general dual-wavelength measurements [72].
Another application of ICA is for blind source separation (BSS). BBS is a technique used to remove the noise from signals. With a short time window (30 s) for ICA, a linear model provides a reasonable local approximation of BSS. The results verify its effectiveness for removing noise [45,46].

3.4.4.6. Widrow’s Adaptive Noise Cancellation (ANC)

In the context of motion artifact reduction for PPG sensors, Widrow’s adaptive noise cancellation (ANC) was applied for the removal of 60-Hz AC line noise from ECG signals [73]. The ANC approach had previously been applied to the PPG problem, but little consideration had been given to the validity of ANC signal corruption assumptions or the applicable motion range of the algorithm. ANC validity testing is based on a form of impact testing (approximate impulse testing) of the physical PPG system, and comparing the modeled response for a range of motion amplitudes. Testing revealed that the identified corruption model did not generally represent the true physical system, but locally approximated the true system. Further testing showed that if a similar motion amplitude was used for model tuning as the impact test, then an average peak deviation of 5.2% was obtained. However, if the motion amplitude was smaller than the impact amplitude by a factor of 5, then the peak deviation was 15%. ANC filtering of motion-corrupted data resulted in a heart rate estimation with an error <1.6% [74].
Although it has been shown that Widrow’s ANC can recover a motion-corrupted PPG signal for certain data sets using a collocated accelerometer to measure the corrupting motion, the motion is band-limited and provides little information for estimating motion-to-PPG noise transfer dynamics. Thus, without proper analysis, the recovery results can be unreliable. In this study, both finite impulse response (FIR) and Laguerre series black-box transfer dynamics models were evaluated on the basis of model confidence quantified in terms of variance of the transfer dynamics estimate for motion frequencies. For typical jogging motion, the standard deviation of the FIR model transfer dynamics is 30% of the mean value at the motion input frequency; the standard deviation of the Laguerre model transfer dynamics is only 1%. Time domain data shows how a Laguerre model outperforms a FIR model in accordance with computed model variance [75].

3.4.4.7. Laguerre Expansion

The Laguerre basis function provides robustness against calibration, as well as improvement of computational efficiency—symmetric decorrelation accommodates the management of correlated signals. The technique presented here requires no calibration for individual patients and is computationally efficient. In addition, the method used to determine the desired signal is presented with a means of partial signal recovery. Experiments demonstrated that the system can produce up to 85% reduction in wearable sensor error for accelerations up to 2G [76].

3.5. Model-Based Algorithm

An active noise cancellation method using a MEMS accelerometer was developed to recover corrupted wearable sensor signals from a finger ring PPG sensor [76], the signal of which is susceptible to the hand motion of the wearer. A MEMS accelerometer embedded in the PPG sensor detected hand acceleration. The correlation between acceleration and distorted PPG signal was analyzed, and a low-order FIR model relating the signal distortion to the hand acceleration was obtained. The model parameters were identified in real-time using the RLS method. The experimental results indicated that the active noise cancellation method was capable of recovering ring PPG sensor signals corrupted with 2G acceleration in the longitudinal direction of the digital artery [76].
A heuristic physical model for motion artifacts was introduced and experimentally verified, with an inversion of a physical artifact model with additional source-detector pair that resulted in a three-wavelength probe—red (600–680 nm), infrared (800–815 nm near isosbestic point) and infrared (850–950 mm)—for motion artifact reduction. A practical implementation was discussed with emphasis on the resultant rescaling of the static and dynamic portions of the signals. It should be noted that this implementation also had the desirable effect of reducing any residual ambient artifacts. The scope and power of this methodology was investigated based on the results obtained with a practical electronic system [77,78].

3.6. Passive Motion Cancellation

Photoplethysmography signals with an averaged AC/DC ratio of 0.001–0.01 and 10% relative strength compared with the finger-based approach were recorded from superior and posterior auricular skin [25]. An automated motion cancellation algorithm was designated to remove motion artifacts. This algorithm first determines the step frequency using the induced current readings from the reception channels. When the LEDs were switched off, the outputs of the PDs were dominated by the motion artifact. The step frequency band from the reception channel outputs was then removed when the LEDs were switched on—this was achieved using notch filtering within the step frequency span (0.2 Hz, or 6 BPM). The remaining spectrum peak represented the heart rate frequency peak. The integrity of the PPG signal and heart rate detection accuracy were then evaluated. The results indicated that using the proposed passive motion cancellation, the device was able to reliably detect heart rate during periods of both rest and moderate exercise [25].

4. Conclusions

Wearable PPG sensors have become very popular. Although a great deal of progress has been made in the hardware and signal processing, an acceptable wearable PPG sensor device has yet to be developed. Green light sources in PPG sensors minimize motion artifacts. Several filters and algorithms have been examined to mimic daily activities on limited time scales. However, better accuracy and reproducibility of real environments are required to eliminate motion artifacts. Further research is needed for the development of practical wearable PPG pulse rate monitors and pulse oximeters.

Acknowledgments

This work was partly supported by a grant-in-aid from the Regional Innovation Strategy Support Program 2011–2015.

Author Contributions

TT reviewed the articles and wrote the entire text. YM and SM collected martial and drew the figures. MY reviewed the text.

Conflicts of Interest

The authors declare no conflict of interest.

References

  1. Togawa, T.; Tamura, T.; Öberg, P.Å. Biomedical Sensors and Instruments, 2nd ed.; CRC Press: New York, NY, USA, 2011; pp. 19–190. [Google Scholar]
  2. Challoner, A.V.J. Photoelectric plethysmography for estimating cutaneous blood flow. In Non-invasive Physiological Measurement; Rolfe, P., Ed.; Academic Press: Oxford, UK, 1979; Volume 1, pp. 127–151. [Google Scholar]
  3. Kamal, A.A.R.; Harness, J.B.; Irving, G.; Mearns, A.J. Skin photoplethysmography—A review. Comput. Methods Programs Biomed. 1989, 28, 257–269. [Google Scholar] [CrossRef]
  4. Alen, J. Photoplethysmography and its application in clinical physiological measurement. Physiol. Meas. 2007, 28, R1–R39. [Google Scholar] [CrossRef]
  5. Anderson, R.R.; Parris, E.D. The optics of human skin. J. Invest. Dermatol. 1981, 77, 13–19. [Google Scholar]
  6. Giltvedt, J.; Sita, A.; Helme, P. Pulsed multifrequency photoplethysmograph. Med. Biol. Eng. Comput. 1984, 22, 212–215. [Google Scholar] [CrossRef]
  7. Cui, W.; Ostrander, L.E.; Lee, B.Y. In vivo reflectance of blood and tissue as a function of light wavelength. IEEE Trans. Biomed. Eng. 1990, 37, 632–639. [Google Scholar] [CrossRef]
  8. Zijlstra, W.G.; Buursma, A.; Meeuwsen-van der Roest, W.P. Absorption spectra of human fetal and adult oxyhemoglobin, de-oxyhemoglobin, carboxyhemoglobin, and Methemoglobin. Clin. Chem. 1991, 37, 1633–1638. [Google Scholar]
  9. Meada, Y.; Sekine, M.; Tamura, T. The advantage of green reflected photoplethysmograph. J. Med. Syst. 2011, 35, 829–834. [Google Scholar] [CrossRef]
  10. Mio Train with Heart. Available online: http://www.mioglobal.com/explore-mio-products.htm (accessed on 10 April 2014).
  11. Verkruysse, W.; Svaasand, L.O.; Nelson, J.S. Remote plethysmographic imaging using ambient light. Opt. Express 2008, 16, 21434–21445. [Google Scholar] [CrossRef]
  12. Tarassenko, L.; Villarroel, M.; Guazzi, A.; Jorge, J.; Clifton, D.A.; Pugh, C. Non-contact video-based vital sign monitoring using ambient light and auto-regressive models. Physiol. Meas. 2014, 35, 807–831. [Google Scholar] [CrossRef]
  13. Hertzman, A.B. The blood supply of various skin areas as estimated by the photoelectric plethysmograph. Amer. J. Physiol. 1938, 124, 328–340. [Google Scholar]
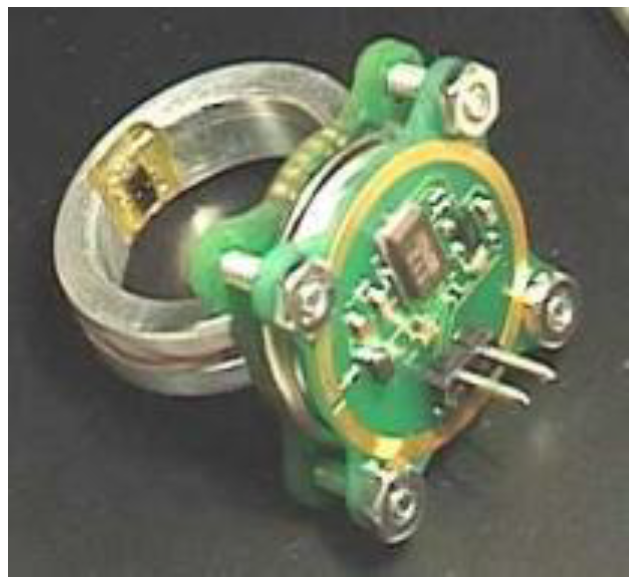
  14. Rhee, S.; Yang, B.-H.; Asada, H.H. Artifact-resistant, power-efficient design of finger-ring plethysmographic sensors. IEEE Trans. Biomed. Eng. 2001, 48, 795–805. [Google Scholar] [CrossRef]
  15. Jung, J.Y.; Lee, L.W. Zigbee device access control and reliable data transmission in Zigbee based health monitoring. Proc. Int. Conf. Adv. Commun. Technol. (ICACT 2008) 2008, 1, 795–797. [Google Scholar] [CrossRef]
  16. Lee, Y.; Shin, H.; Jo, J.; Lee, Y. Development of a wristwatch-type PPG array sensor module. In Proceedings of the IEEE International Conference on Consumer Electronics, Berlin, Germany, 6–8 September 2011; pp. 168–171.
  17. Maguire, M.; Ward, T. The design and clinical use of a reflective brachial photoplethysmograph. In Technical Report; National University of Ireland: Maynooth, Ireland, 2002; pp. 1–13. [Google Scholar]
  18. Maeda, Y.; Sekine, M.; Tamura, T. Relationship between measurement site and motion artifacts in wearable reflected photoplethysmography. J. Med. Syst. 2011, 35, 969–976. [Google Scholar] [CrossRef]
  19. Vogel, S.; Hülsbusch, M.; Henning, T.; Blazek, V.; Leonhardt, S. In-ear vital signs monitoring using a novel microoptic reflective sensor. IEEE Trans. Inform. Tech. Biomed. 2009, 13, 882–889. [Google Scholar] [CrossRef]
  20. Shin, K.; Kim, Y.; Bae, S.; Park, K.; Kim, S. A novel headset with a transmissive PPG sensor for heart rate measurement. Proc. Int. Conf. Biomed. Eng. IFMBE 2009, 23, 519–522. [Google Scholar] [CrossRef]
  21. Poh, M.-Z.; Swenson, N.C.; Picard, R.W. Motion-tolerant magnetic earring sensor and wireless earpiece for wearable photoplethysmography. IEEE Trans. Inform. Tech. Biomed. 2010, 14, 786–794. [Google Scholar] [CrossRef]
  22. Celka, P.; Verjus, C.; Vetter, R. Motion resistant earphone located infrared based heart rate measurement device. In Proceedings of the 2nd International Conference on Biomedical Engineering, Innsbruck, Austria, 16–18 February 2004; pp. 582–585.
  23. Poh, M.-Z.; Kim, K.; Goessling, A.; Swenson, N.; Picard, R. Cardiovascular monitoring using earphones and a mobile device. Pervasive Comput. 2012, 11, 18–26. [Google Scholar]
  24. Budidha, K.; Kyriacou, P.A. The human ear canal: Investigation of its suitability for monitoring photoplethysmographs and arterial oxygen saturation. Phys. Meas. 2014, 35, 111–128. [Google Scholar] [CrossRef]
  25. Wang, L.; Lo, B.; Yang, G.Z. Multichannel reflective PPG earpiece sensor with passive motion cancellation. IEEE Trans. Biomed. Circuits Syst. 2007, 1, 235–241. [Google Scholar] [CrossRef]
  26. Wang, C.Z.; Zheng, Y.P. Home-telecare of the elderly living alone using a new designed ear-wearable sensor. In Proceedings of the 5th International Workshop Wearable Implantable Body Sensor Networks, Hong Kong, China, 1–3 June 2008; pp. 71–74.
  27. Patterson, J.A.C.; McIlwraith, D.G.; Yang, G.-Z. A flexible, low noise reflectiveG sensor platform for ear-worn heart rate monitoring. In Proceedings of 6th International Workshop Wearable Implantable Body Sensor Networks, Berkeley, CA, USA, 3–5 June 2009; pp. 286–291.
  28. Kyriacou, P.A.; Moye, A.R.; Gregg, R.M.; Choi, D.M.A.; Langford, R.M.; Jones, D.P. A system for investigating oesophageal photoplethysmographic signals in anaesthetised patients. Med. Biol. Eng. Comput. 1999, 37, 639–643. [Google Scholar] [CrossRef]
  29. Kyriacou, P.A.; Powell, S.; Langford, R.M.; Jones, D.P. Esophageal pulse oximetry utilizing reflectance photoplethysmography. IEEE Trans. Biomed. Eng. 2002, 49, 1360–1368. [Google Scholar] [CrossRef]
  30. Kyriacou, P.A. Direct pulse oximetry within the esophagus, on the surface of abdominal viscera, and on free flaps. Anesth. Analg. 2013, 117, 824–833. [Google Scholar] [CrossRef]
  31. Mendelson, Y.; Pujary, C. Measurement site and photodetector size considerations in optimizing power consumption of a wearable reflectance pulse oximeter. Conf. Proc. IEEE EMBS 2003, 4, 3016–3019. [Google Scholar]
  32. Lee, E.M.; Shin, J.Y.; Hong, J.H.; Cha, E.J.; Lee, T.S. Glass-type wireless PPG measuring system. Conf. Proc. IEEE EMBS. 2010, 1, 1433–1436. [Google Scholar]
  33. Tur, E.; Tur, M.; Maibach, H.I.; Guy, R.H. Basal perfusion of the cutaneous microcirculation: Measurements as a function of anatomic position. J. Invest. Dermatol. 1983, 81, 442–446. [Google Scholar]
  34. Asada, H.H.; Shaltis, P.; Reisner, A.; Rhee, S.; Hutchinson, R.C. Mobile monitoring with wearable photoplethysmographic biosensors. IEEE Eng. Med. Biol. Mag. 2003, 22, 28–40. [Google Scholar]
  35. Teng, X.F.; Zhang, Y.T. The effect of contacting force on photoplethysmographic signals. Physiol. Meas. 2004, 25, 1323–1335. [Google Scholar] [CrossRef]
  36. Spigulis, J. Optical non-invasive monitoring of skin blood pulsations. Appl. Opt. 2005, 44, 1850–1857. [Google Scholar] [CrossRef]
  37. Maeda, Y.; Sekine, M.; Tamura, T.; Mizutani, K. The effect of contact pressure to the photoplethysmographic sensor during walking. Conf. Proc. EMBS. 2013. Available online: http://embc.embs.org/files/2013/3170_FI.pdf (accessed on 22 April 2014).
  38. Dresher, R.; Mendelson, Y. Attachment of a wearable skin reflectance pulse oximeter. In Proceedings of the 2005 BMES Annual Fall Meeting, Baltimore, MD, USA, 28 September–1 October 2005.
  39. Dassel, A.C.M.; Graaff, R.; Sikkema, M.; Meijer, A.; Zijlstra, W.G.; Aamoudse, J.G. Reflectance pulse oximetry at the forehead improves by pressure on the probe. J. Clin. Monit. 1995, 11, 237–244. [Google Scholar] [CrossRef]
  40. Dassel, A.C.M.; Graaff, R.; Meijer, A.; Zijlstra, W.G.; Aarnoudse, J.G. Reflectance pulse oximetry at the forehead of newborns. The influence of varying pressure on the probe. J. Clin. Monit. 1996, 12, 421–428. [Google Scholar] [CrossRef]
  41. Dassel, A.C.M.; Graaff, R.; Aardema, M.; Zijlstra, W.G.; Aarnoudse, J.G. Effect of location of the sensor on reflectance pulse oximetry. Br. J. Obstet. Gynaecol. 1997, 104, 910–916. [Google Scholar] [CrossRef]
  42. Hsiu, H.; Hsu, C.L.; Wu, T.L. Effects of different contacting pressure on the transfer function between finger photoplethysmographic and radial blood pressure waveforms. J. Eng. Med. 2011, 225, 575–583. [Google Scholar] [CrossRef]
  43. Grabovskis, A.; Marcinkevics, Z.; Rubins, U.; Kviesis-Kipge, E. Effect of probe contact pressure on the photoplethysmographic assessment of conduit artery stiffness. J. Biomed. Opt. 2013, 18. [Google Scholar] [CrossRef]
  44. Hu, S.; Zheng, J.; Chouliaras, V.; Summers, R. Feasibility of imaging photoplethysmography. In Proceedings of the International Conference on Biomedical Engineering and Informatics, Sanya, Hainan, China, 27–30 May 2008.
  45. Poh, M.Z.; McDuff, D.J.; Picard, R.W. Non-contact, automated cardiac pulse measurements using video imaging and blind source separation. Opt. Express 2010, 18, 10762–10774. [Google Scholar] [CrossRef]
  46. Poh, M.Z.; McDuff, D.J.; Picard, R.W. Advancements in noncontact, multiparameter physiological measurements using a webcam. IEEE Trans. Biomed. Eng. 2011, 58, 7–11. [Google Scholar] [CrossRef]
  47. Jonathan, E.; Leahy, M. Investigating a smartphone imaging unit for photoplethysmography. Physiol. Meas. 2010, 31, N79–N83. [Google Scholar] [CrossRef]
  48. Instant Hear Rate. Available online: http://www.azumio.com/apps/heart-rate/ (accessed on 10 April 2014).
  49. Lee, H.-W.; Lee, J.-W.; Jung, W.-C.; Lee, G.-K. The periodic moving average filter for removing motion artifacts from PPG signals. Int. J. Ctrl. Autom. Syst. 2007, 5, 701–706. [Google Scholar]
  50. Lee, J.; Jung, W.; Kang, I.T.; Kim, Y.; Lee, G. Design of filter to reject motion artifact of pulse oximetry. Comput. Stand. Interfaces 2004, 26, 241–249. [Google Scholar] [CrossRef]
  51. Reddy, K.A.; George, B.; Kumar, V.J. Use of Fourier series analysis for motion artifact reduction and data compression of photoplethysmographic signals. IEEE Trans. Instrum. Meas. 2009, 58, 1706–1711. [Google Scholar] [CrossRef]
  52. Asada, H.H.; Jiang, H.H.; Gibbs, P. Active noise cancellation using MEMS accelerometers for motion-tolerant wearable bio-sensors. Conf. Proc. IEEE EMBS 2004, 3, 2157–2160. [Google Scholar]
  53. Gibbs, P.T.; Wood, L.B.; Asada, H.H. Active motion artifact cancellation for wearable health monitoring sensors using collocated MEMS accelerometers. Proc. SPIE Smart Struct. Mater. Sens. Smart Struct. Technol. Civil Mech. Aerosp. Syst. 2005. [Google Scholar] [CrossRef]
  54. Chan, K.W.; Zhang, Y.T. Adaptive reduction of motion artifact from photoplethysmographic recordings using a variable step size LMS filter. Proc. IEEE Sens. 2002, 2, 1343–1346. [Google Scholar] [CrossRef]
  55. Han, H.; Kim, M.-J.; Kim, J. Development of real-time motion artifact reduction algorithm for a wearable photoplethysmography. Conf. Proc. IEEE EMBS 2007, 3, 1538–1541. [Google Scholar]
  56. Wei, P.; Guo, R.; Zhang, J.; Zhang, Y.T. A new wristband wearable sensor using adaptive reduction filter to reduce motion artifact. In Proceedings of the 2008 International Conference on Information Technology and Applications in Biomedicine (ITAB 2008), Shenzhen, China, 30–31 May 2008; pp. 278–281.
  57. Wood, L.B. Motion artifact reduction for wearable photoplethysmogram sensors using micro accelerometers and Laguerre series adaptive filters. MIT MS Thesis, Degree-Granting University, Cambridge, MA, USA, 2008; pp. 1–74. [Google Scholar]
  58. Han, H.; Kim, J. Artifacts in wearable photoplethysmographs during daily life motions and their reduction with least mean square based active noise cancellation method. Comput. Biol. Med. 2012, 42, 387–393. [Google Scholar] [CrossRef]
  59. Ram, M.R.; Madhav, K.V.; Krishna, E.H.; Komalla, N.R.; Reddy, K.A. A novel approach for artifact reduction in PPG signals based on AS-LMS adaptive filter. IEEE Instrum. Meas. 2012, 61, 1445–1457. [Google Scholar] [CrossRef]
  60. Nehorai, A.; Porat, B. Adaptive comb filtering for harmonic signal enhancement. IEEE Trans. Acoust. Speech Signal Proc. 1986, 34, 1124–1138. [Google Scholar] [CrossRef]
  61. Lee, B.; Kee, Y.; Han, J.; Yi, W.-J. Adaptive comb filtering for motion artifact reduction from PPG with a structure of adaptive lattice IIR notch filter. Conf. Proc. EMBS 2011, 2011, 7937–7940. [Google Scholar]
  62. Kim, S.C.; Hwang, E.J.; Kim, D.W. Noise reduction of PPG signal during free movements using adaptive SFLC (scaled Fourier liner combiner). IFMBE Proc. 2007, 14, 1191–1194. [Google Scholar] [CrossRef]
  63. Lee, B.; Han, J.; Baek, H.-J.; Shin, J.-H.; Park, K.-W.; Yi, W.-J. Improved estimation of motion artifacts from a photoplethysmographic signal using a Kalman smoother with simultaneous accelerometry. Physiol. Meas. 2010, 31, 1585–1603. [Google Scholar] [CrossRef]
  64. Seyeditabaii, S.; Seyedtabaii, L. Kalman filter based adaptive reduction of motion artifact from photoplethysmographic signal. Proc. World Acad. Sci. Eng. Technol. 2008, 39, 173–176. [Google Scholar]
  65. Lee, Y.-K.; Jo, J.; Lee, Y.; Shin, H.-S.; Kwon, O.-W. Particle filter-based noise reduction of PPG signals for robust emotion recognition. In Proceedings of the IEEE International Conference on Consumer Electronics (ICCE), Las Vegas, NV, USA, 13–16 January 2012; pp. 598–599.
  66. Yousefi, R.; Nourani, M.; Ostadabbas, S.; Panashi, I. A motin-tolenrat adaptive algorithm for wearable photoplethymographic biosesnors. IEEE J. Biomed. Health Inform. 2013, 18, 670–681. [Google Scholar]
  67. Lee, S.-M.; Zhang, Y.-T. Reduction of motion artifacts from photoplethysmographic recordings using a wavelet denoising approach. In Proceedings of the IEEE EMBS Asian-Pacific Conference on Biomedical Engineering, Kyoto-Osaka-Nara, Japan, 20–22 October 2003; pp. 194–195.
  68. Yan, Y.; Poon, C.C.Y.; Zhang, Y.T. Reduction of motion artifact in pulse oximetry by smoothed pseudo-Wigner-Ville distribution. J. Neuroeng. Rehabil. 2005, 2, 3. [Google Scholar] [CrossRef] [Green Version]
  69. Lee, S.; Ibey, B.L.; Xu, W.; Wilson, M.A.; Ericson, M.N.; Coté, G.L. Processing of pulse oximeter data using discrete wavelet analysis. IEEE Trans. Biomed. Eng. 2005, 52, 1350–1352. [Google Scholar] [CrossRef]
  70. Foo, J.Y.A. Comparison of wavelet transformation and adaptive filtering in restoring artifact-induced time-related measurement. Biomed. Signal Process. Control 2006, 1, 93–98. [Google Scholar] [CrossRef]
  71. Yao, J.; Warren, S. A short study to assess the potential of independent component analysis for motion artifact separation in wearable pulse oximeter signals. Conf. Proc. IEEE EMBS 2005, 4, 3585–3588. [Google Scholar]
  72. Kim, B.S.; Yoo, S.K. Motion artifact reduction in photoplethysmography using independent component analysis. IEEE Trans. Biomed. Eng. 2006, 53, 566–568. [Google Scholar] [CrossRef]
  73. Widraw, B.; Glover, J.R., Jr.; McCool, J.M.; Kaunitz, J.; Williams, C.S.; Hearn, R.H.; Zeidler, J.R.; Dong, E., Jr.; Goodlin, R.C. Adaptive noise cancellation: Principles and applications. Proc. IEEE 1975, 63, 1692–1716. [Google Scholar] [CrossRef]
  74. Wood, L.B.; Asada, H.H. Noise cancellation model validation for reduced motion artifact wearable PPG sensors using MEMS accelerometers. In Proceedings of the IEEE 28th Annual International Conference on Engineering in Medicine and Biology Society, New York, NY, USA, 30 August–3 September 2006; pp. 3525–3528.
  75. Wood, L.B.; Asada, H.H. Low variance adaptive filter for cancelling motion artifact in wearable photoplethysmogram sensor signals. In Proceedings of the IEEE 29th Annual International Conference on Engineering in Medicine and Biology Society (EMBS 2007), Lyon, France, 22–26 August 2007; pp. 652–655.
  76. Wood, L.B.; Asada, H.H. Active motion artifact reduction for wearable sensors using Laguerre expansion and signal separation. In Proceedings IEEE Conference on EMBS, Shanghai, China, 17–18 January 2005; pp. 652–655.
  77. Hayes, M.J.; Smith, P.R. Artifact reduction in photoplethysmography. Appl. Opt. 1998, 37, 7437–7446. [Google Scholar] [CrossRef]
  78. Hayes, M.J.; Smith, P.R. A new method for pulse oximetry processing inherent insensitivity to artifact. IEEE Trans. Biomed. Eng. 2001, 48, 452–461. [Google Scholar] [CrossRef]

