Article

A Pulse-Width Phase-Shift Triangle Modulation (PSTM-PWM) Technique to Reduce Transformer Heating


by
Juan Ramón Heredia-Larrubia
1,
Francisco M. Perez-Hidalgo
2,
Antonio F. Ruiz-Gonzalez
2,* and
Mario J. Meco-Gutierrez
2
1
Department of Electronic Technology, University of Malaga, 29071 Malaga, Spain
2
Department of Electrical Engineering, University of Malaga, 29071 Malaga, Spain
*
Author to whom correspondence should be addressed.
Electronics 2026, 15(9), 1808; https://doi.org/10.3390/electronics15091808
Submission received: 27 February 2026 / Revised: 9 April 2026 / Accepted: 16 April 2026 / Published: 24 April 2026
(This article belongs to the Special Issue Innovative Technologies in Power Converters, 3rd Edition)

Abstract

Power transformers are fundamental devices in electrical power transmission and distribution systems as they regulate voltage levels, which helps reduce system losses. However, their operation can be affected by temperature, with increases in temperature causing a decrease in their efficiency and lifetime. In addition, the presence of harmonics in the electrical current can cause overheating and distortions in transformer performance. A significant proportion of these harmonics are caused by the increasingly widespread use of DC renewable energies. To control such renewable sources, power inverters are used, which generate harmonics and cause overheating in transformers connected to the grid. One solution to this problem is to reduce the harmonic content generated by these converters to avoid transformer overheating and improve their lifetime. In this work, a modulation technique for H-bridge multilevel inverters is presented with the aim of reducing both harmonics and transformer heating. To test the technique’s effectiveness, the recommendations of a standard have been followed, which include the use of a dry transformer prototype for temperature measurements. The proposed technique has been compared with classical techniques for H-bridge multilevel inverters, and the experimental results indicate a reduction in the hottest-spot temperature.

1. Introduction

In the field of electrical engineering and renewable energies, the design, operation and maintenance of transformers are critical to system performance [1]. One of the most important challenges in this context is transformer heating, which can significantly affect their performance and lifetime. Excessive heating occurs when energy losses in the core (hysteresis, Foucault and excess losses) and transformer windings result in a rise in temperature. To address this problem, it is essential to understand how temperature impacts the transformer lifetime [2].
The lifetime of transformers is closely related to the operating temperature. Research has shown that dielectric insulation aging is accelerated at elevated temperatures [3]. Therefore, maintaining an appropriate temperature is essential to ensuring a long equipment lifetime. This involves designing transformers with not only high-quality, efficient materials, but also with a convenient size to optimize the construction materials. Power inverters are increasingly being used in distribution networks, especially for connecting renewable energy sources such as solar or wind power. These inverters are nonlinear elements that generate harmonics that are injected into the distribution network. Harmonics have a significant impact on the average life of transformers due to several factors, including overheating due to increased core and winding losses [4]. Core losses increase due to eddy current, hysteresis losses and excess losses, which are highly dependent on the frequency of these harmonics. In the windings, additional losses occur due to the circulation of harmonic currents that generate heat, which also induce eddy currents in the core and metallic structures of the transformer [5,6].
In the field of power inverters, multilevel inverter technology is of great importance for power conversion. These electronic devices stand out for their high efficiency and superior output wave quality, making them an excellent choice for renewable energy applications [7,8]. Their operation is based on the generation of output voltages through the combination of several voltage levels, which helps to reduce switching losses and optimize the quality of the output waveform [9,10,11].
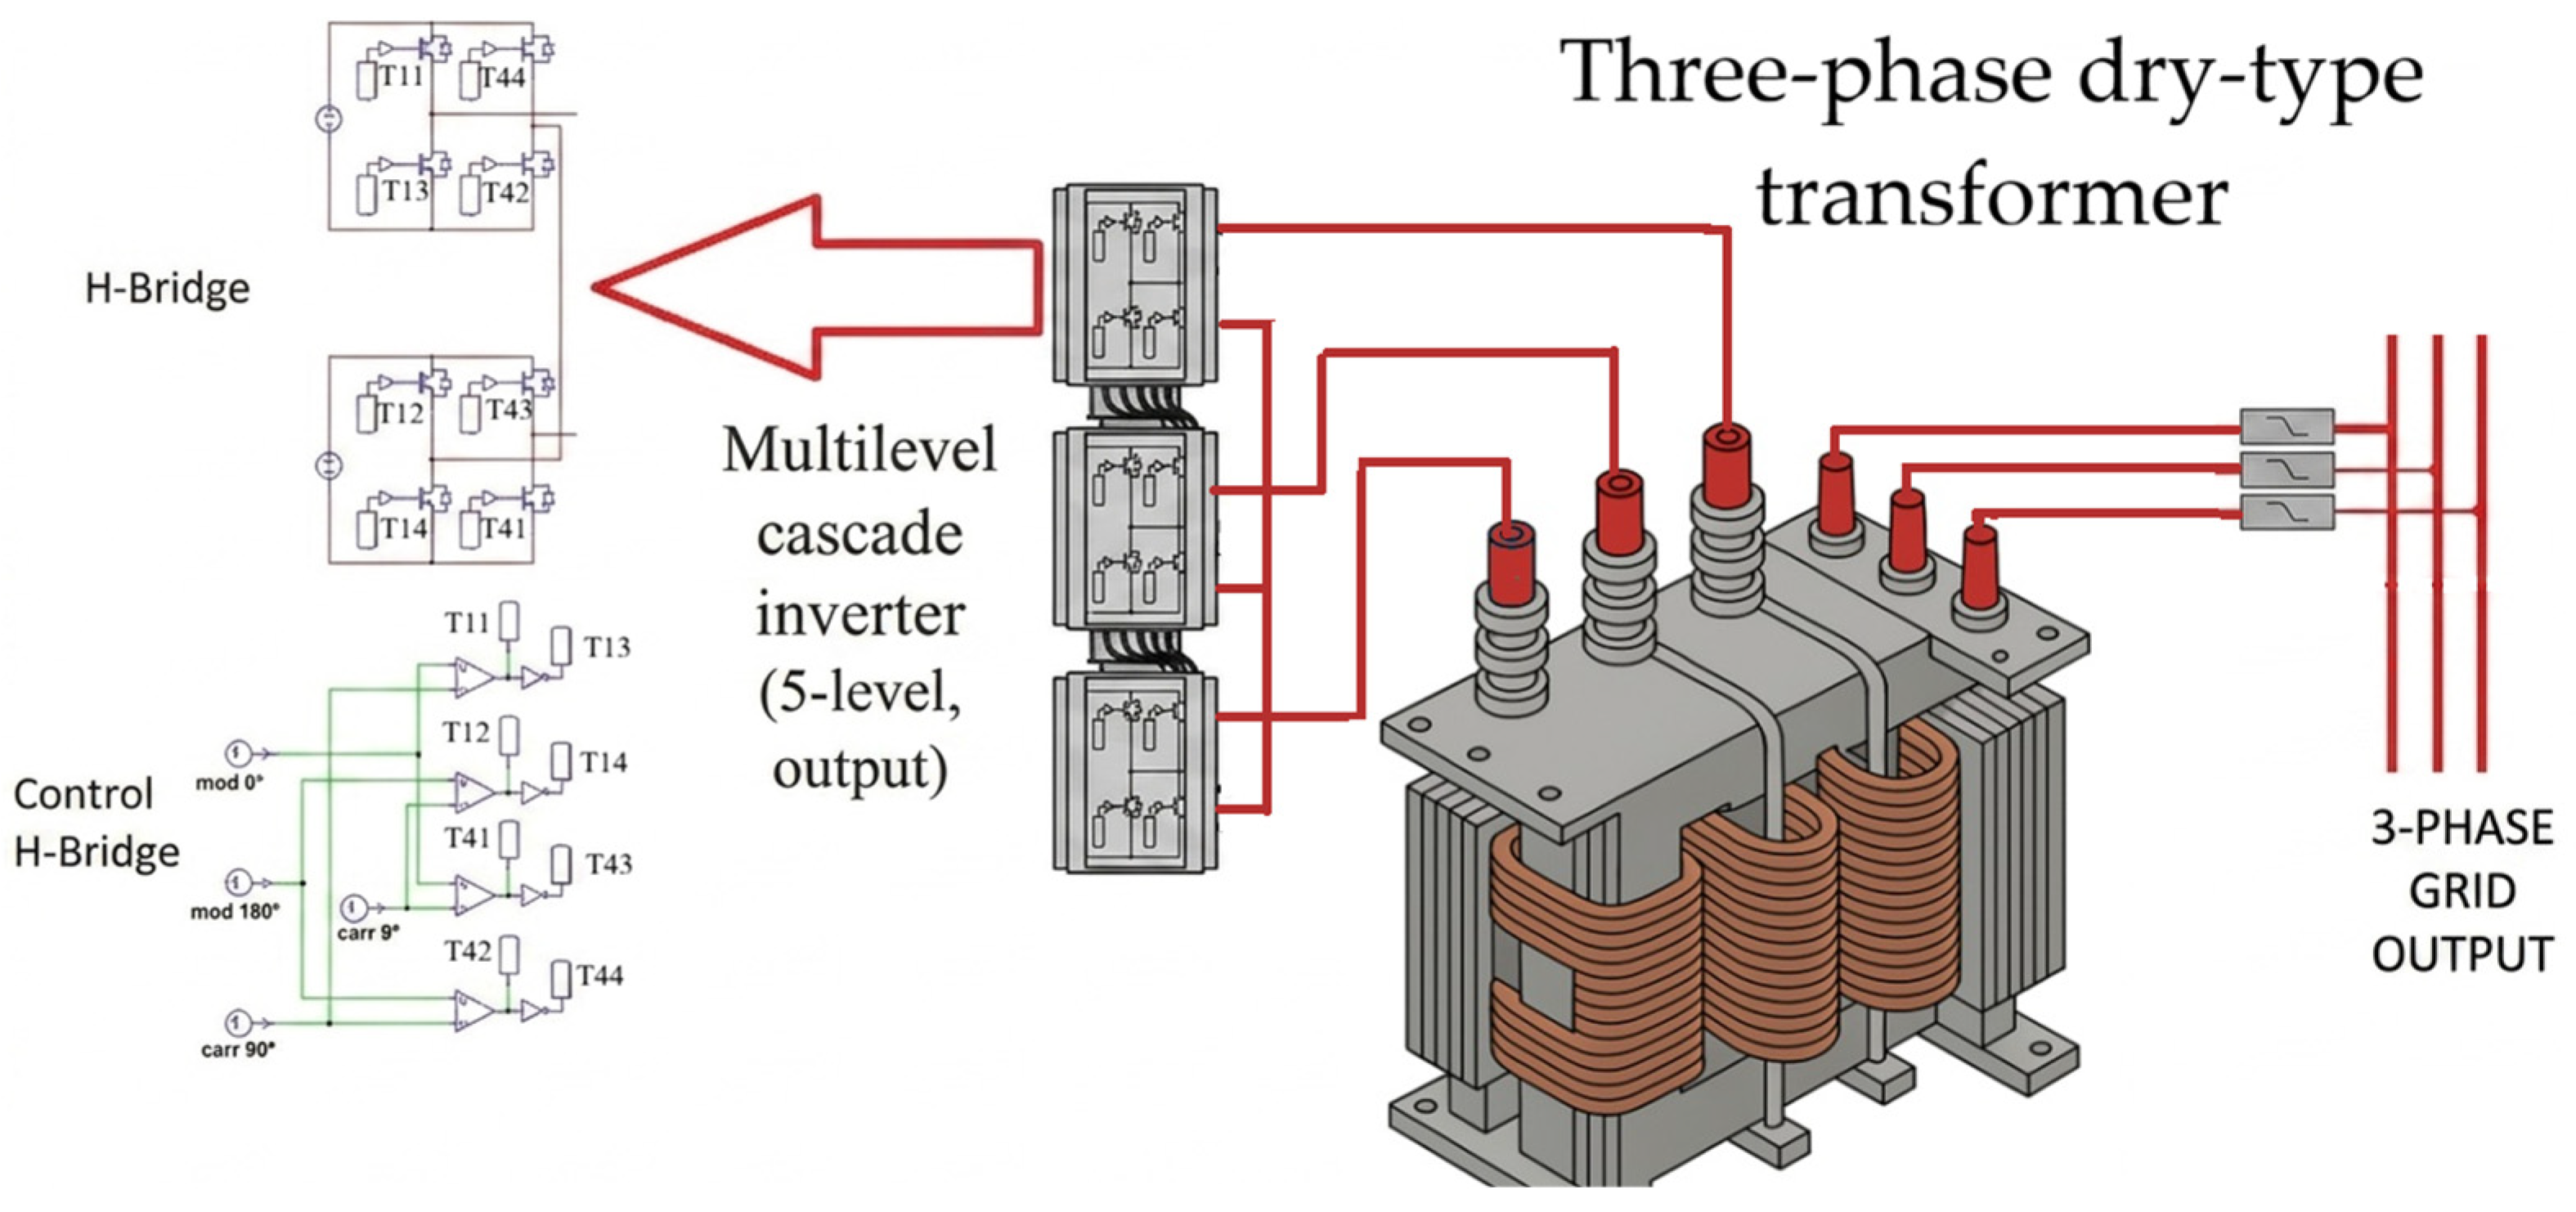
Photovoltaic plants represent an important application for multilevel inverters [12]. These installations harness solar energy to generate electricity through solar panels. Power electronic converters, particularly multilevel inverters, are essential for transforming the direct current (DC) produced by photovoltaic installations into a current compatible with the electrical grid. Among the different multilevel inverter configurations, the cascaded H-bridge (CHB) structure is considered particularly appropriate for next-generation photovoltaic plant inverters. This suitability arises from its requirement for several independent low-voltage DC sources, which are naturally provided by photovoltaic systems [13,14,15]. The structure of these inverters includes several H-bridge (full-bridge) modules linked together in series, see Figure 1. This topology is based on a connection of string inverters with independent DC sources (formed by groups of PV arrays). In photovoltaic generation systems, each PV string is commonly interfaced with a dedicated DC/DC converter that features a Maximum Power Point Tracking (MPPT) algorithm, with the aim of maximizing the energy harvested from the solar modules under varying environmental conditions [16,17,18]. This avoids high voltage transformation, as the multilevel inverters output a larger voltage than conventional three-level inverters.
As noted above, power transformers are used to step up the voltage generated by solar inverters to the medium or high voltage levels required for efficient power transmission. During operation, these transformers are subjected to thermal stress due to electrical losses and varying load conditions. Elevated temperatures accelerate the aging of insulation materials and other internal components, which can lead to a gradual deterioration in transformer performance and reliability. Therefore, proper thermal management and continuous temperature monitoring are essential to ensure long-term operation and safety in power transformers in grid-connected photovoltaic systems [19]. Unlike design methods aimed at reducing the heating of power transformers (improvements in forced ventilation, winding separation, ventilation channels, etc.), this study aims to reduce the losses in existing transformers using a discontinuous modulation technique.
The technique has been compared with classical modulation techniques using a dry transformer prototype. The experimental results highlight the strong performance of the proposed technique.

2. Influence of Temperature on Transformer Aging

Aging is caused by temperature-activated chemical reactions. Actual aging depends not only on the temperature but also on thermal cycles, temperature gradients, mechanical stress, and humidity [20,21].
The main processes are oxidation and the breakdown of polymer chains, which lead to a loss of mechanical strength and a deterioration in dielectric properties. Thermal aging models for insulation have evolved from simple empirical observations (Montsinger) [22] without a physicochemical basis to tools that model physicochemical behavior to predict the service life of insulation and inform design decisions, such as the Arrhenius equation or the Dakin model, which allow for specific predictions by material type.
To study the influence of temperature on aging in power transformers, the correlation or rule established by Montsinger has traditionally been used, which states that each 8 °C increase in temperature doubles the machine’s aging rate, and for practical purposes, an increase of 10 °C can be safely applied. However, there is virtually no thermal aging below 50 °C [22]. A gradual increase in power per unit volume causes the temperature gradient to rise and negatively affects the chemical properties of the insulating materials. This is when accelerated aging can occur in the dielectric insulation. Experience has shown that Montsinger’s Rule is realistic and reliable [23].
The critical variable for estimating the remaining lifetime of a transformer is the Hottest-Spot Temperature (HST) [24]. Calculating this variable is a complex task, but it can potentially be estimated or controlled via direct measurement. IEC 60076-12 [25] addresses the assessment of transformer lifetime as a function of temperature. In general terms, this standard describes how the operating temperature of a transformer influences its lifetime, especially regarding the transformer insulation, one of the most critical components [26]. In this standard, the concept of the weighted insulation paper temperature is used to evaluate the impact of temperature on service life. The HST is the highest temperature reached by the insulation in any part of the transformer and is a critical factor in insulation aging.
The standard is based on the exponential relationship between the insulation aging rate and temperature, known as the Arrhenius law, the expression of which is as follows [27,28]:
V = V o e E a k T
where V is the aging velocity, Vo is a constant, Ea is the activation energy of the aging process, k is Boltzmann’s constant and T is the temperature in Kelvin.
In the context of IEC 60076-12 and the Arrhenius equation, the constant V0 represents the aging rate constant at a specific reference temperature. However, to simplify the analysis of power transformer lifetime as a function of temperature, Vo is not usually required to be determined explicitly. Instead, the Relative Life Factor (RVF) is used to evaluate how variations in temperature affect the rate of insulation aging. The RVF is a coefficient that indicates how much faster or slower the insulation ages at a specific temperature compared to a reference temperature (typically 98 °C, following IEC 60076-7:2018) [25,29]. It is calculated as:
R V F = 2 ( H S T 98 ) 6
For example, if a transformer is designed for a service life of 20 years at 98 °C, operating at an HST of 110 °C will reduce its service life to one quarter of the original, that is, 5 years, assuming steady-state operation.
Because the location of the HST must be known, some theoretical and experimental studies in the technical literature have studied its physical location, as well as calculations of the average winding temperature of dry-type transformers. Halacsy [30] presented a simplified analytical model to predict the average winding temperature rise in dry-type transformers, and Satterlee [31] performed physical studies on air-cooled dry-type transformers, revealing that the HST is located closer to the top than the bottom of the windings. Stewart and Whitman [32], after analyzing dry-type transformers, reported that the HST is located around the highest part of the coil, depending on the windings’ height. Whitman [33] concluded that the temperature gradient in transformer windings depends on several design factors, including the number and configuration of the windings, the number of insulation layers, the vertical height of the winding, the radial arrangement of the windings, and the presence of ventilation ducts within the winding structure. Pierce [34,35] proposed a mathematical model to estimate the increase in hot-spot temperature in ventilated dry-type transformers by analyzing how different parameters affect its relationship with the average winding temperature. Among these parameters, the winding height was identified as the most significant factor influencing this relationship. This model specifically provides predictions of the hot-spot temperature in layer-type windings, but due to the complexity of accurately determining the hottest point in a transformer, the IEC 60076-12 standard itself recommends performing experimental tests to determine this value [28].
Losses in power transformers (PTL) are divided into core losses—no-load (PNL)—and winding losses—load (PLL) [36,37,38].
P T L = P N L + P L L
PLL losses can also be divided into different loss components:
P L L = P + P E C + P O S L
while PNL losses are calculated using the following expression:
P N L = k f e · h = 2 h 2 · V ( h ) 2
where P’ denotes the losses due to load current and D.C. winding resistance (this loss is disregarded because there are only sine components), PEC is the parasitic winding losses and POSL refers to other parasitic losses in clamps and oil reservoirs. At present, current harmonics are considered a major problem that affects transformer performance. These harmonic components of the current cause additional losses in windings and other structural parts. Winding eddy current losses due to any non-sinusoidal load current can be expressed as [39]:
P E C = P E C R L h = 1 h = h m a x I h I R 2 h 2
where PEC-RL is the winding eddy current loss at fundamental frequency, Ih is the harmonic order current h and IR is the rated current. Heating due to other parasitic losses, POSL, is not usually considered for dry-type transformers.

3. Phase-Shift Triangle Modulator (PSTM-PWM)

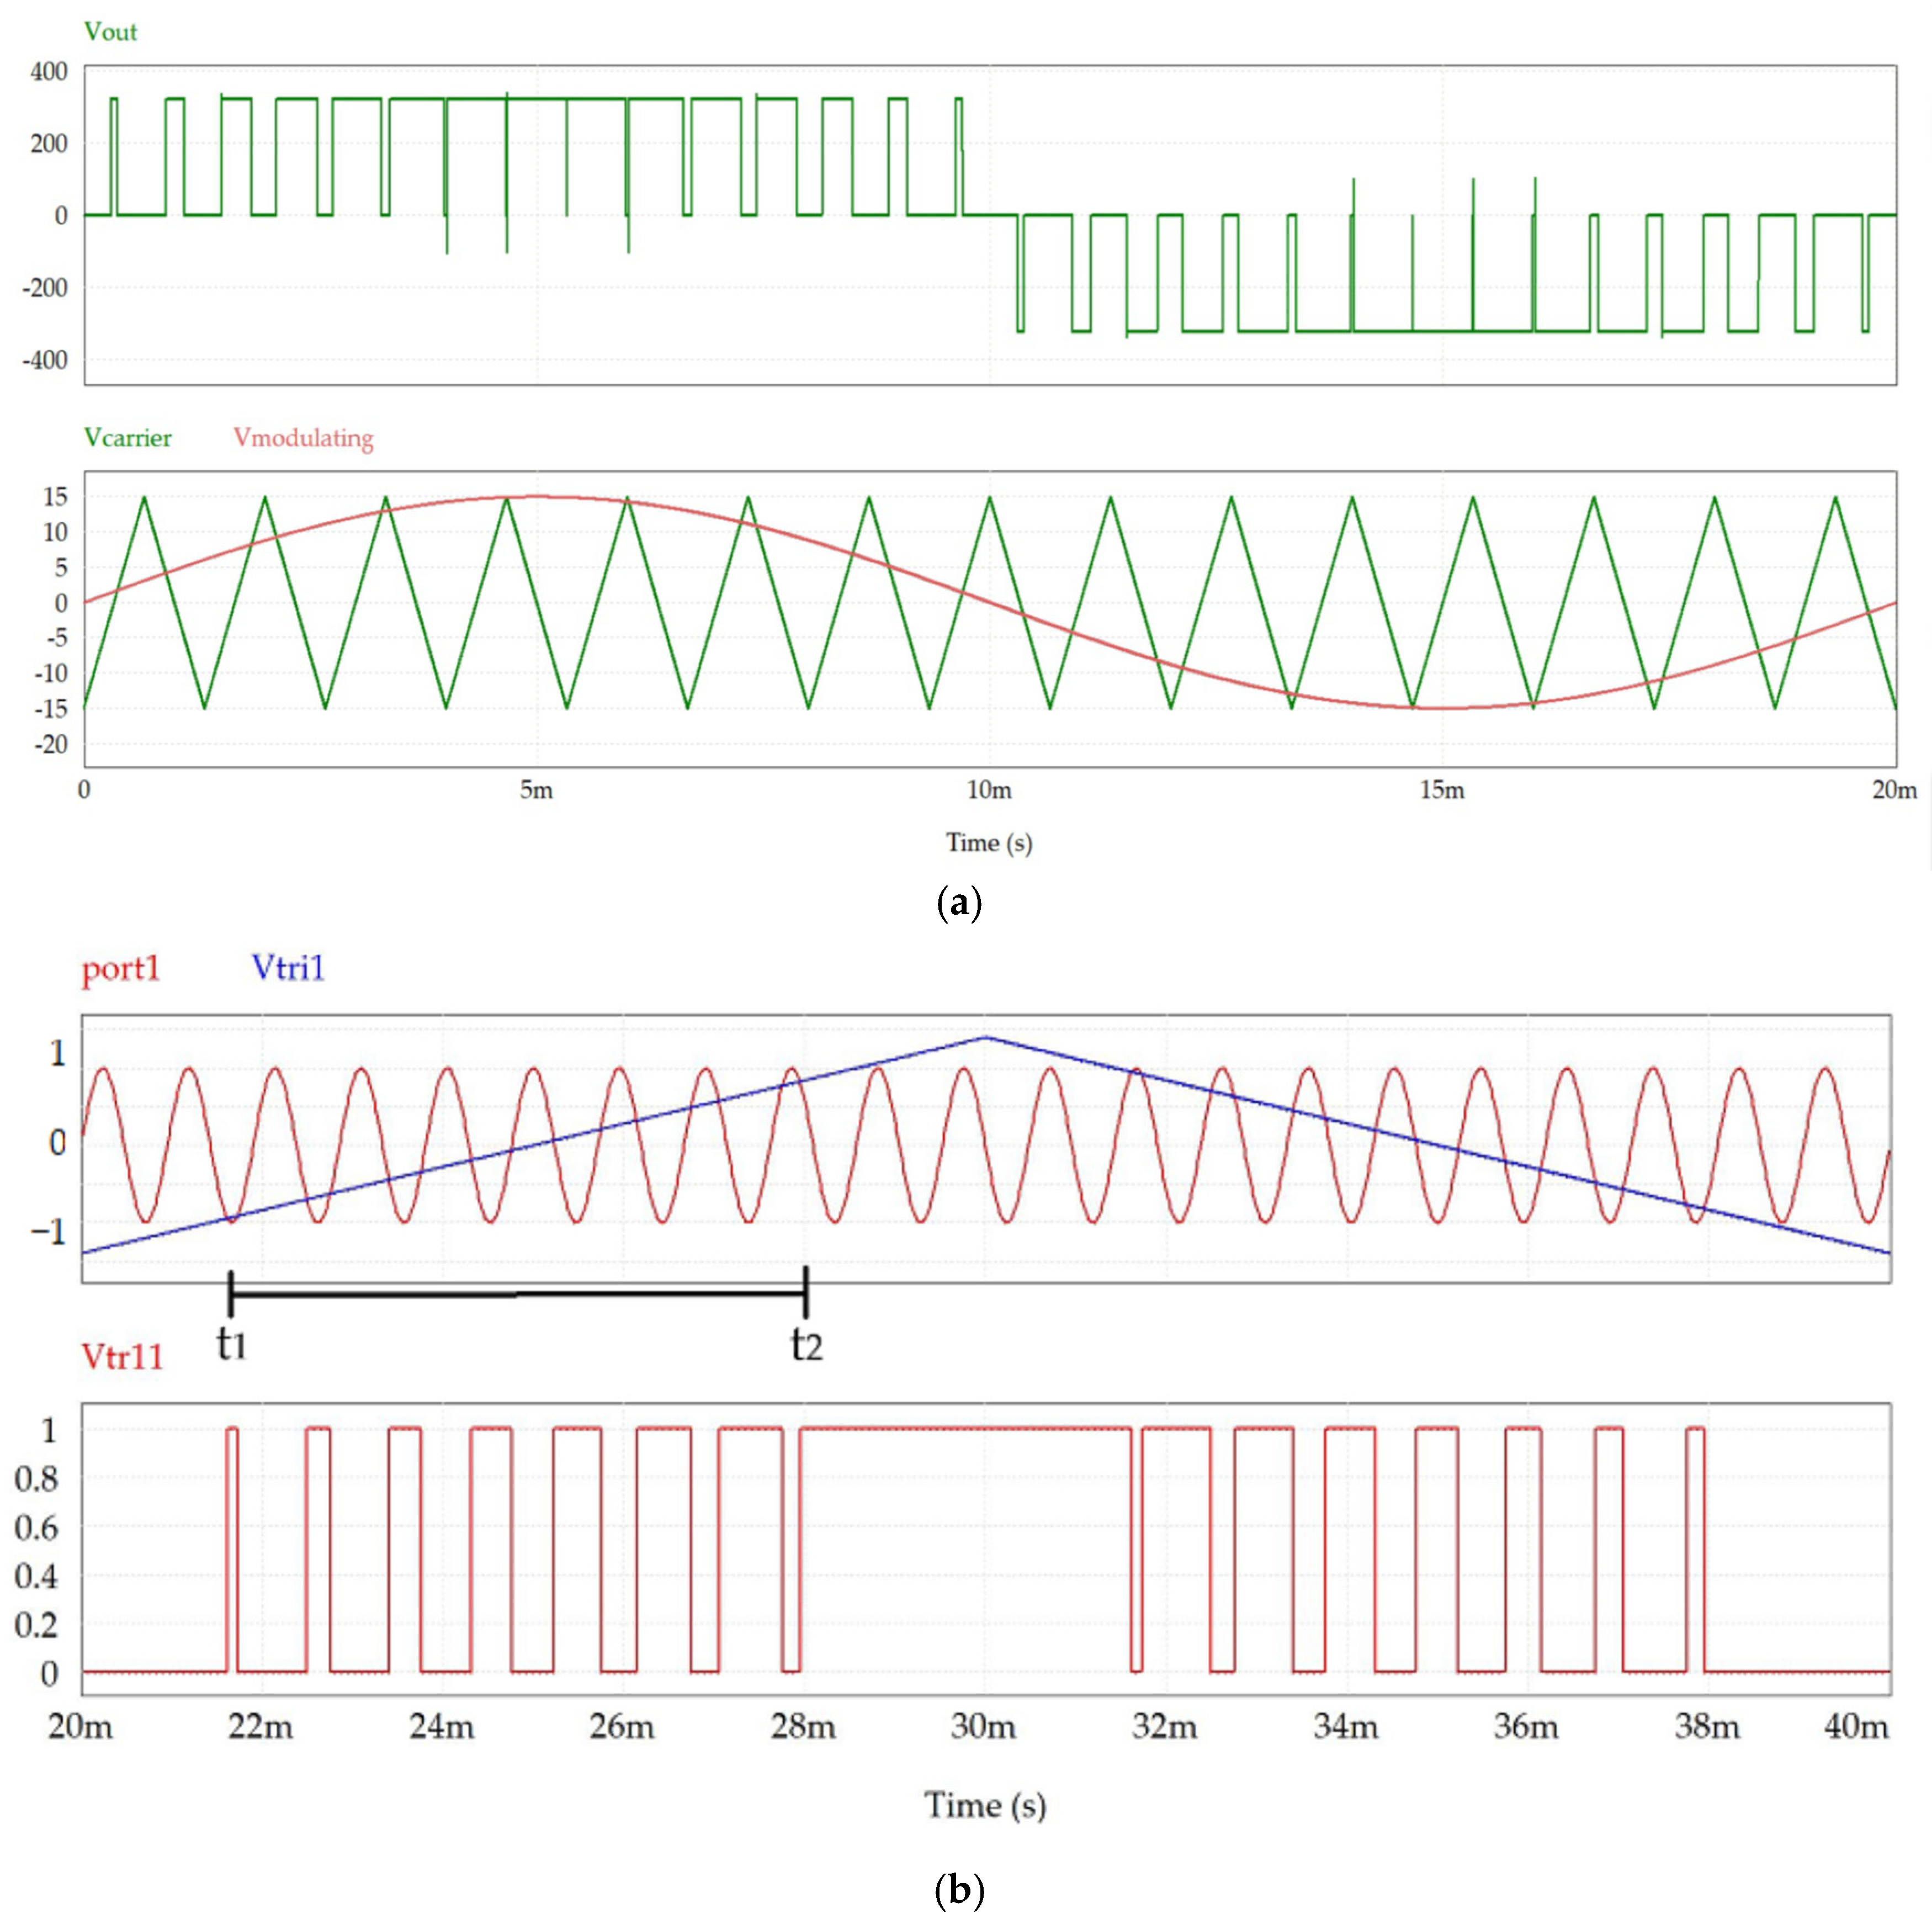
Using traditional PWM modulation methods, when the amplitudes of the modulating and carrier waves approach their maximum (or minimum) values, the instantaneous switching frequency of the transistors increases. Figure 2a shows a sinusoidal PWM signal (modulation order 15), in which as the amplitude of the modulating (sinusoidal) signal increases, the pulse frequency becomes very high. As a result, these pulses contribute practically no effective (RMS) value to the output and only cause the transistors to overheat. This leads to a reduction in the modulation order if the objective is to decrease transistor losses. It would be desirable to be able to have the option to exclude this central area where the values of the carrier and modulating wave are equal to modulate this area, so the switches do not have to be activated, keeping the same modulation order. A compromise must be found between the modulation order and the carrier frequency.
When the modulation order is increased, the frequency of the first undesirable harmonics will also increase. Note that EN50160 [40] only covers up to the first 25 harmonics. On the other hand, a high carrier frequency increases the switching in the transistors and therefore increases the switching losses. There are several classical PWM control methods for multilevel inverters in the technical literature. Among them are the amplitude-shifting (LS-PWM) [41], phase-shifting (PS-PWM) [42] and harmonic-injected phase-shifting (HPS-PWM) techniques.
The modulation technique proposed in this article seeks to mitigate the undesirable effect of a high switching frequency when the amplitudes of the modulating and carrier waveforms are similar in order to reduce the number of switching events in the power switches. To achieve this, PWM modulation is used with a sine wave as the carrier and a phase shift triangular wave as the modulator. The triangular wave will have a higher value than the sinusoid, and thus the period in which the triangular wave is not modulated will increase and there will be no switching at that time; the signal will be overmodulated. The technique is referred to as Phase-Shift Triangle Modulator (PSTM) [43,44]. To maintain the same number of switches, the frequency of the carrier will have to vary according to the peak value of the modulator, i.e., the triangular wave. In this way, the modulation order M (ratio between carrier and modulator frequencies) will be maintained. Figure 2b shows the signal control for one H-bridge, where M = 15 and U = 1.4 volt.
As shown in [43], the times t1 and t2 are calculated as follows:
t 1 = π ( U 1 ) 2 U ω m
t 2 = π ( 1 + U ) 2 U ω m
where ωm is the pulsation of the triangular wave. Then, the duration of modulation is:
t = t 2 t 1 = π U ω m
Between ωmt1 and ωmt2, there must be M/2 switches, and between ωmt3 and ωmt4, there must be another M/2 switches. The carrier frequency is obtained from the number of pulses generated over half of the modulation period, i.e., the pulses contained in π rd. Since the amplitude of the carrier signal is always greater than or equal to that of the modulating signal, the theoretical number of pulses obtained, Mt, will always be greater than or equal to the number of implemented pulses, M. The total number of pulses in half a period will be:
M t 2 = π M 2 ( ω m t 2 ω m t 1 ) = π M 2 ω m ( t 2 t 1 )
where Mt and M, are the theoretical and real modulation orders. Given that the angle (ωmt1 − ωmt2) is less than π rd, the value of Mt exceeds that of M (overmodulation). Conversely, when the angle is exactly equal to π rd, Mt and M coincide and there is no overmodulation. The angular frequency of the carrier must be UM times that of the modulating signal:
ω c = U M ω m f c = U M f m
where U is the peak value of the modulation wave. Considering a modulation order of 15 pulses, a triangular carrier of 2.5 V peak voltage, a modulating signal of 1 V peak voltage, and a fundamental frequency of 50 Hz, the corresponding carrier frequency f c is 1875 Hz.
As is well known, increasing the number of switching operations per cycle causes the power inverter transistors to overheat and reduces their efficiency. Therefore, the minimum number of switching operations required to meet technical quality standards must be implemented; for the purposes of this study, the EN50160 standard has been selected. To determine which peak values are most suitable for achieving low THD and a high RMS value of the fundamental, a sweep of the control variable (U) was carried out.
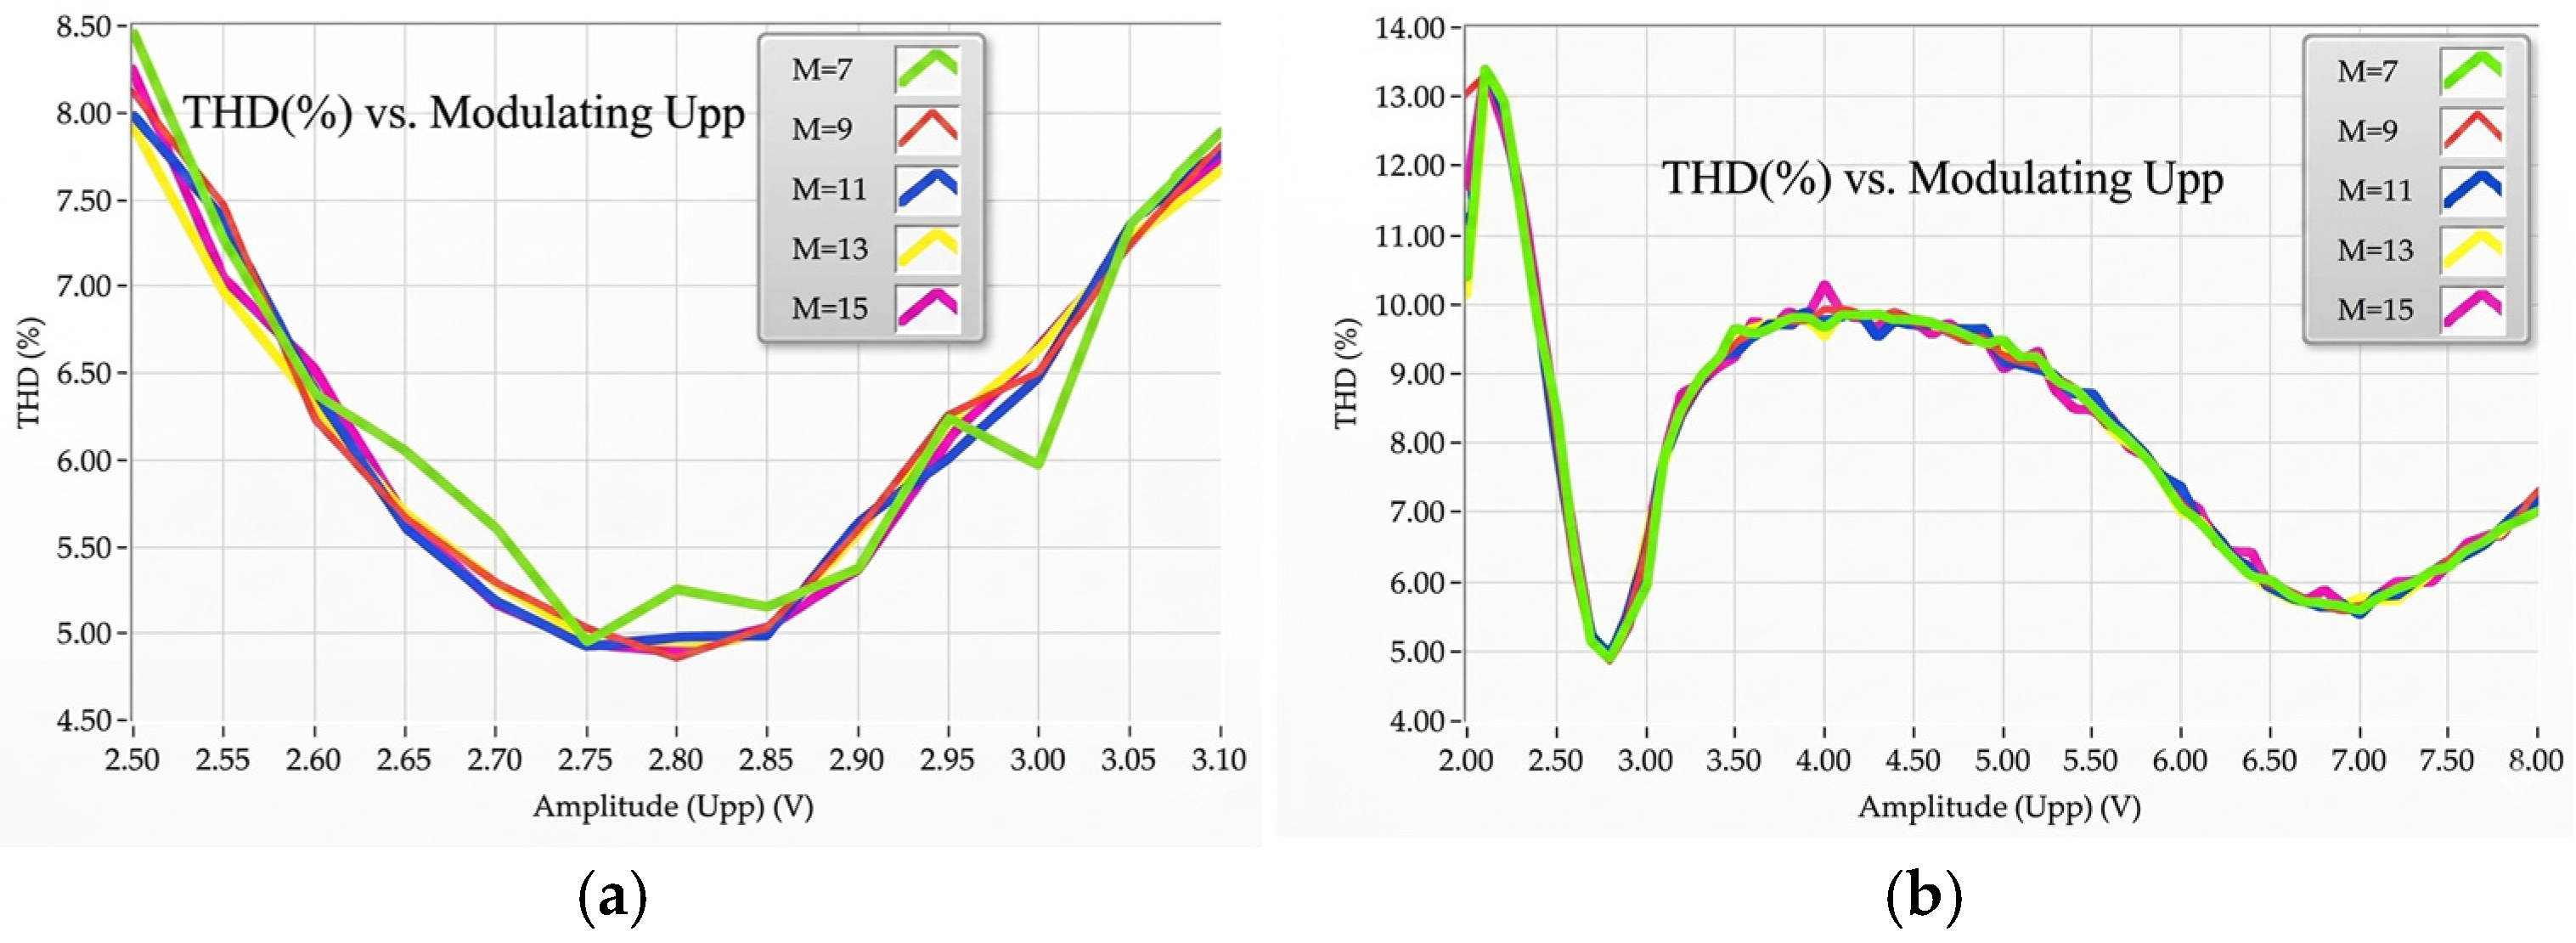
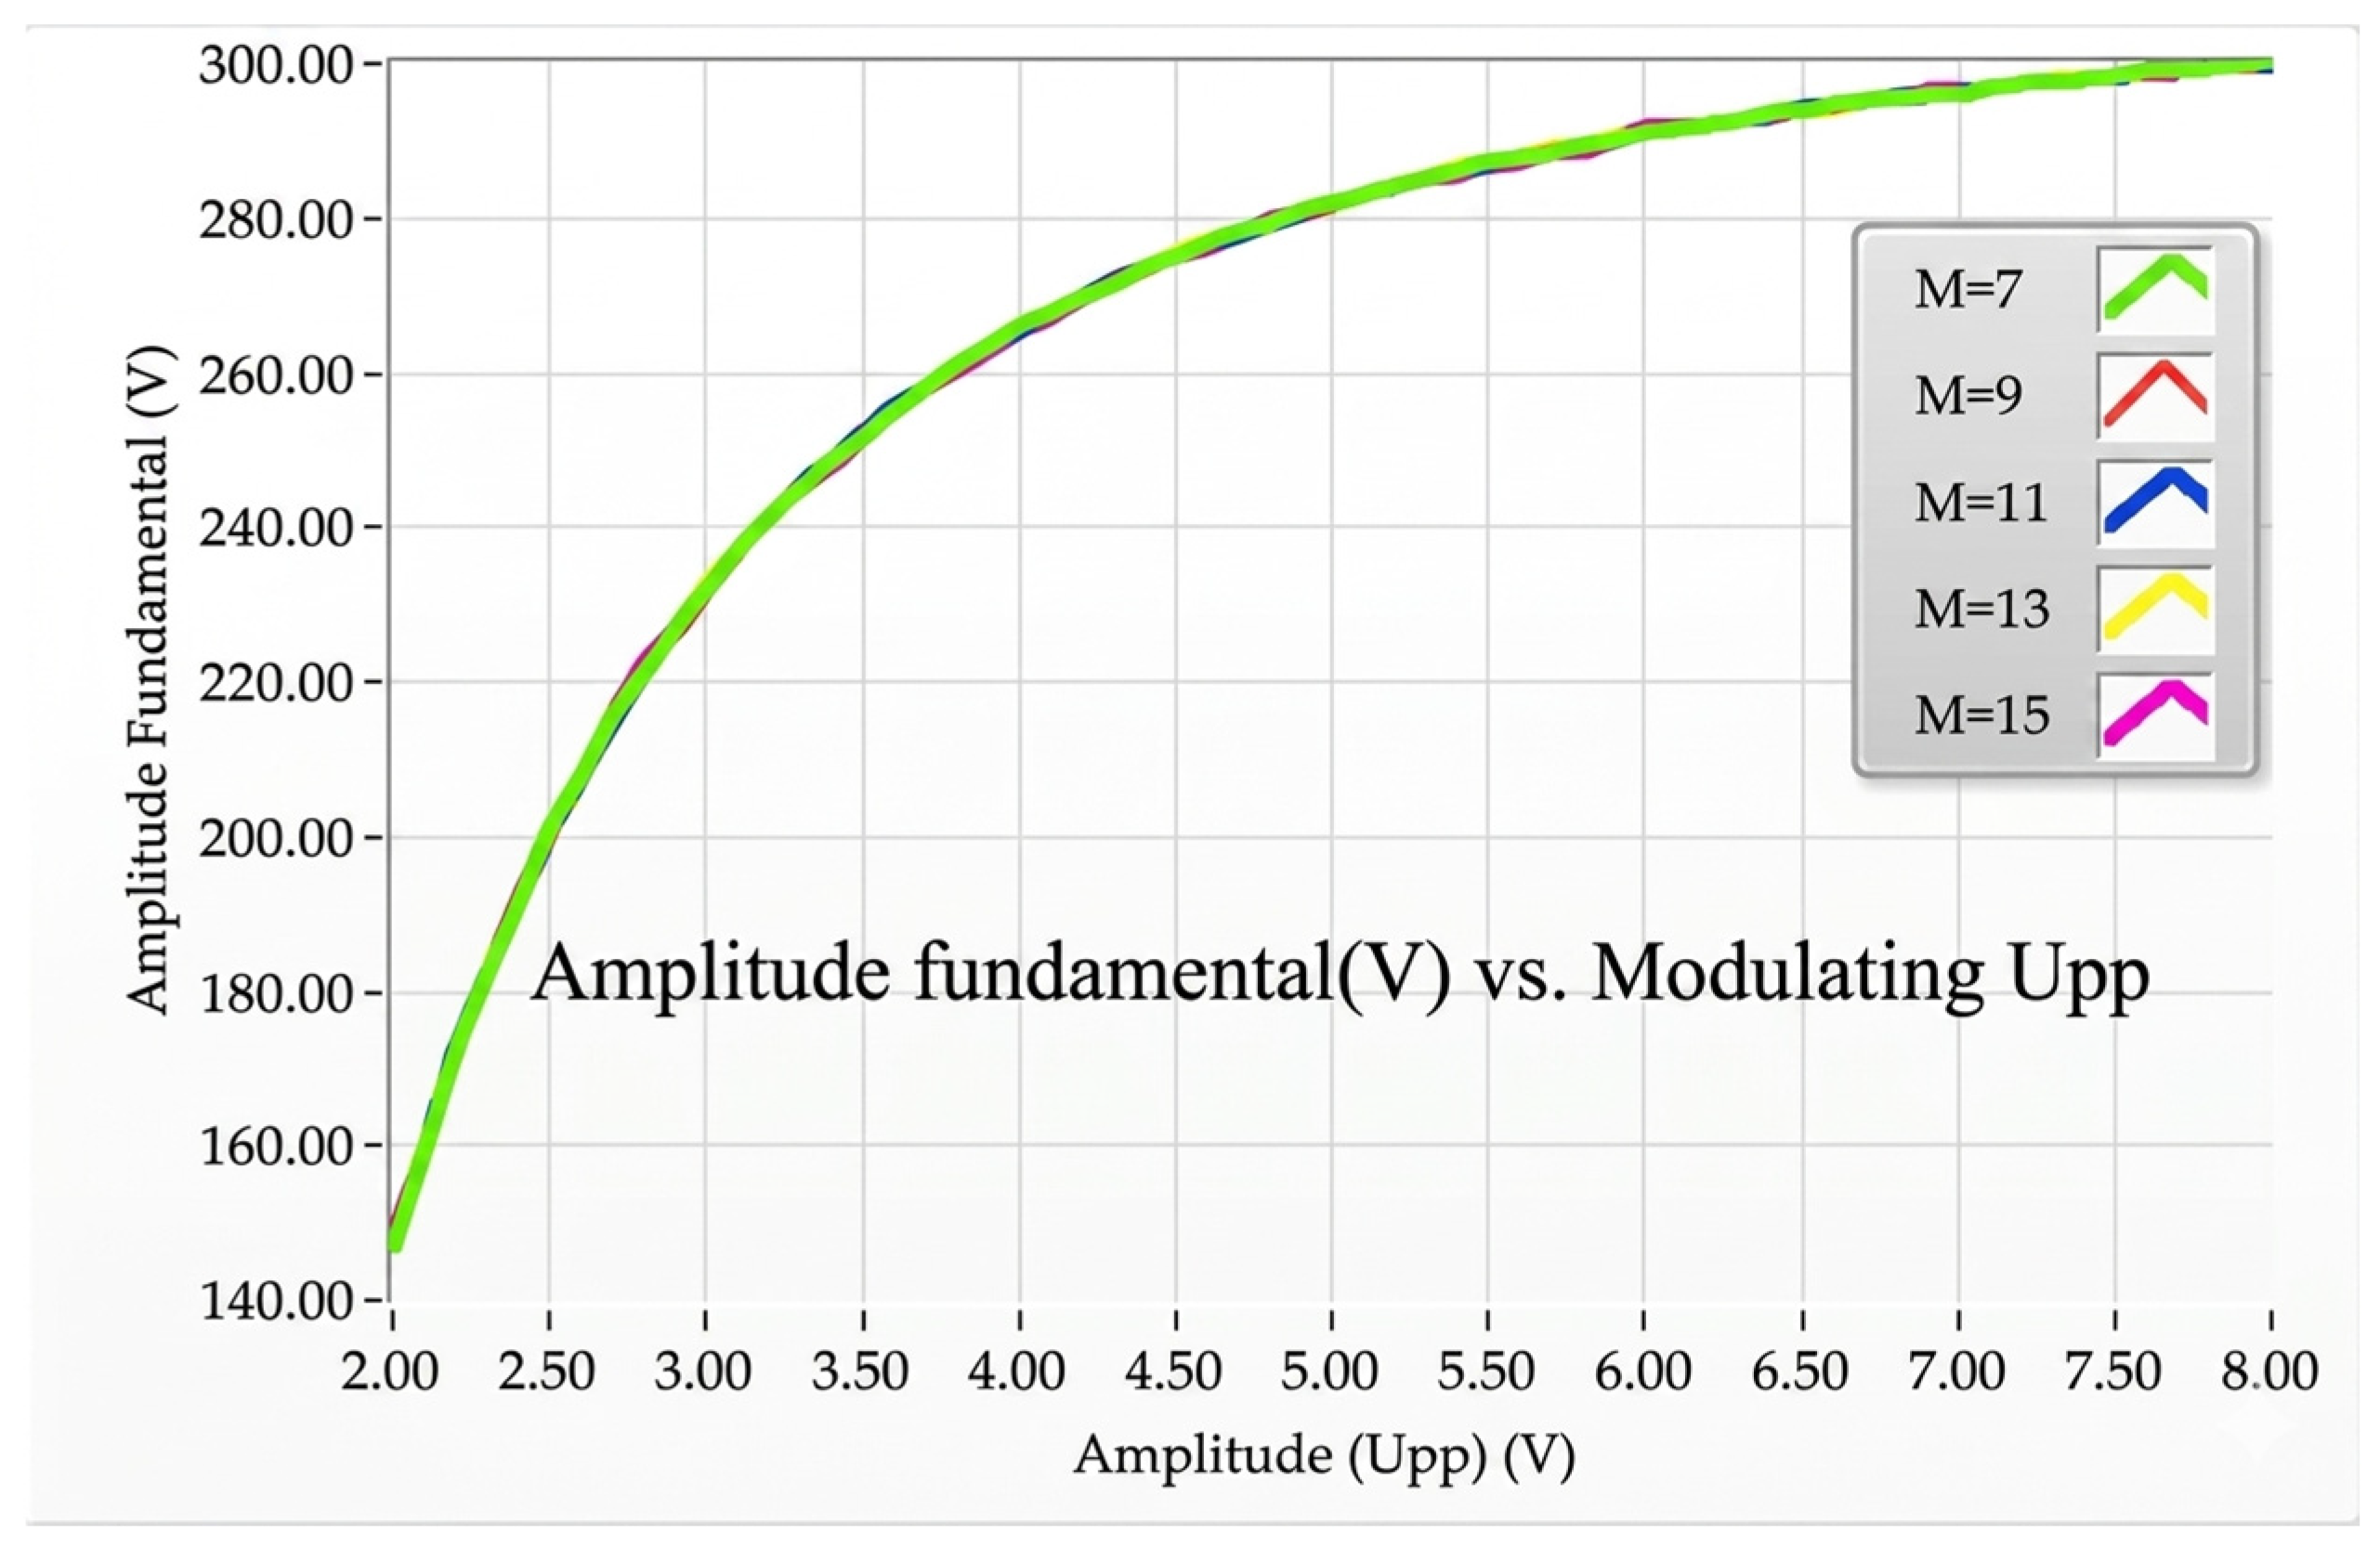
As can be seen in Figure 3a, the THD value for the first 25 harmonics of the fundamental frequency is practically independent of the modulation order and the control variable (U) exhibits two minima. The maximum value of the carrier was maintained at 1 V peak-to-peak. Figure 3b shows further detail of the minimum THD value for different values of M. Figure 4 shows that the RMS value of the output varies with the amplitude of the modulating wave and, as in the previous figure, is practically independent of M. For 7 volts peak-to-peak, a good balance is achieved between the output RMS values and the THD values. Tests were carried out for M = 7 because, for this value, the EN 50160 standard is satisfied, and it is also the value that results in the lowest transistor losses [39].
In summary, the advantages of overmodulation in the PSTM-PWM technique are worth highlighting by optimizing the distribution of switching times, high efficiency and low THD are achieved, whilst improving the utilization of the DC voltage (high fundamental voltage) and reducing low-order harmonics.

4. Experimental Results of the Power Inverter Output

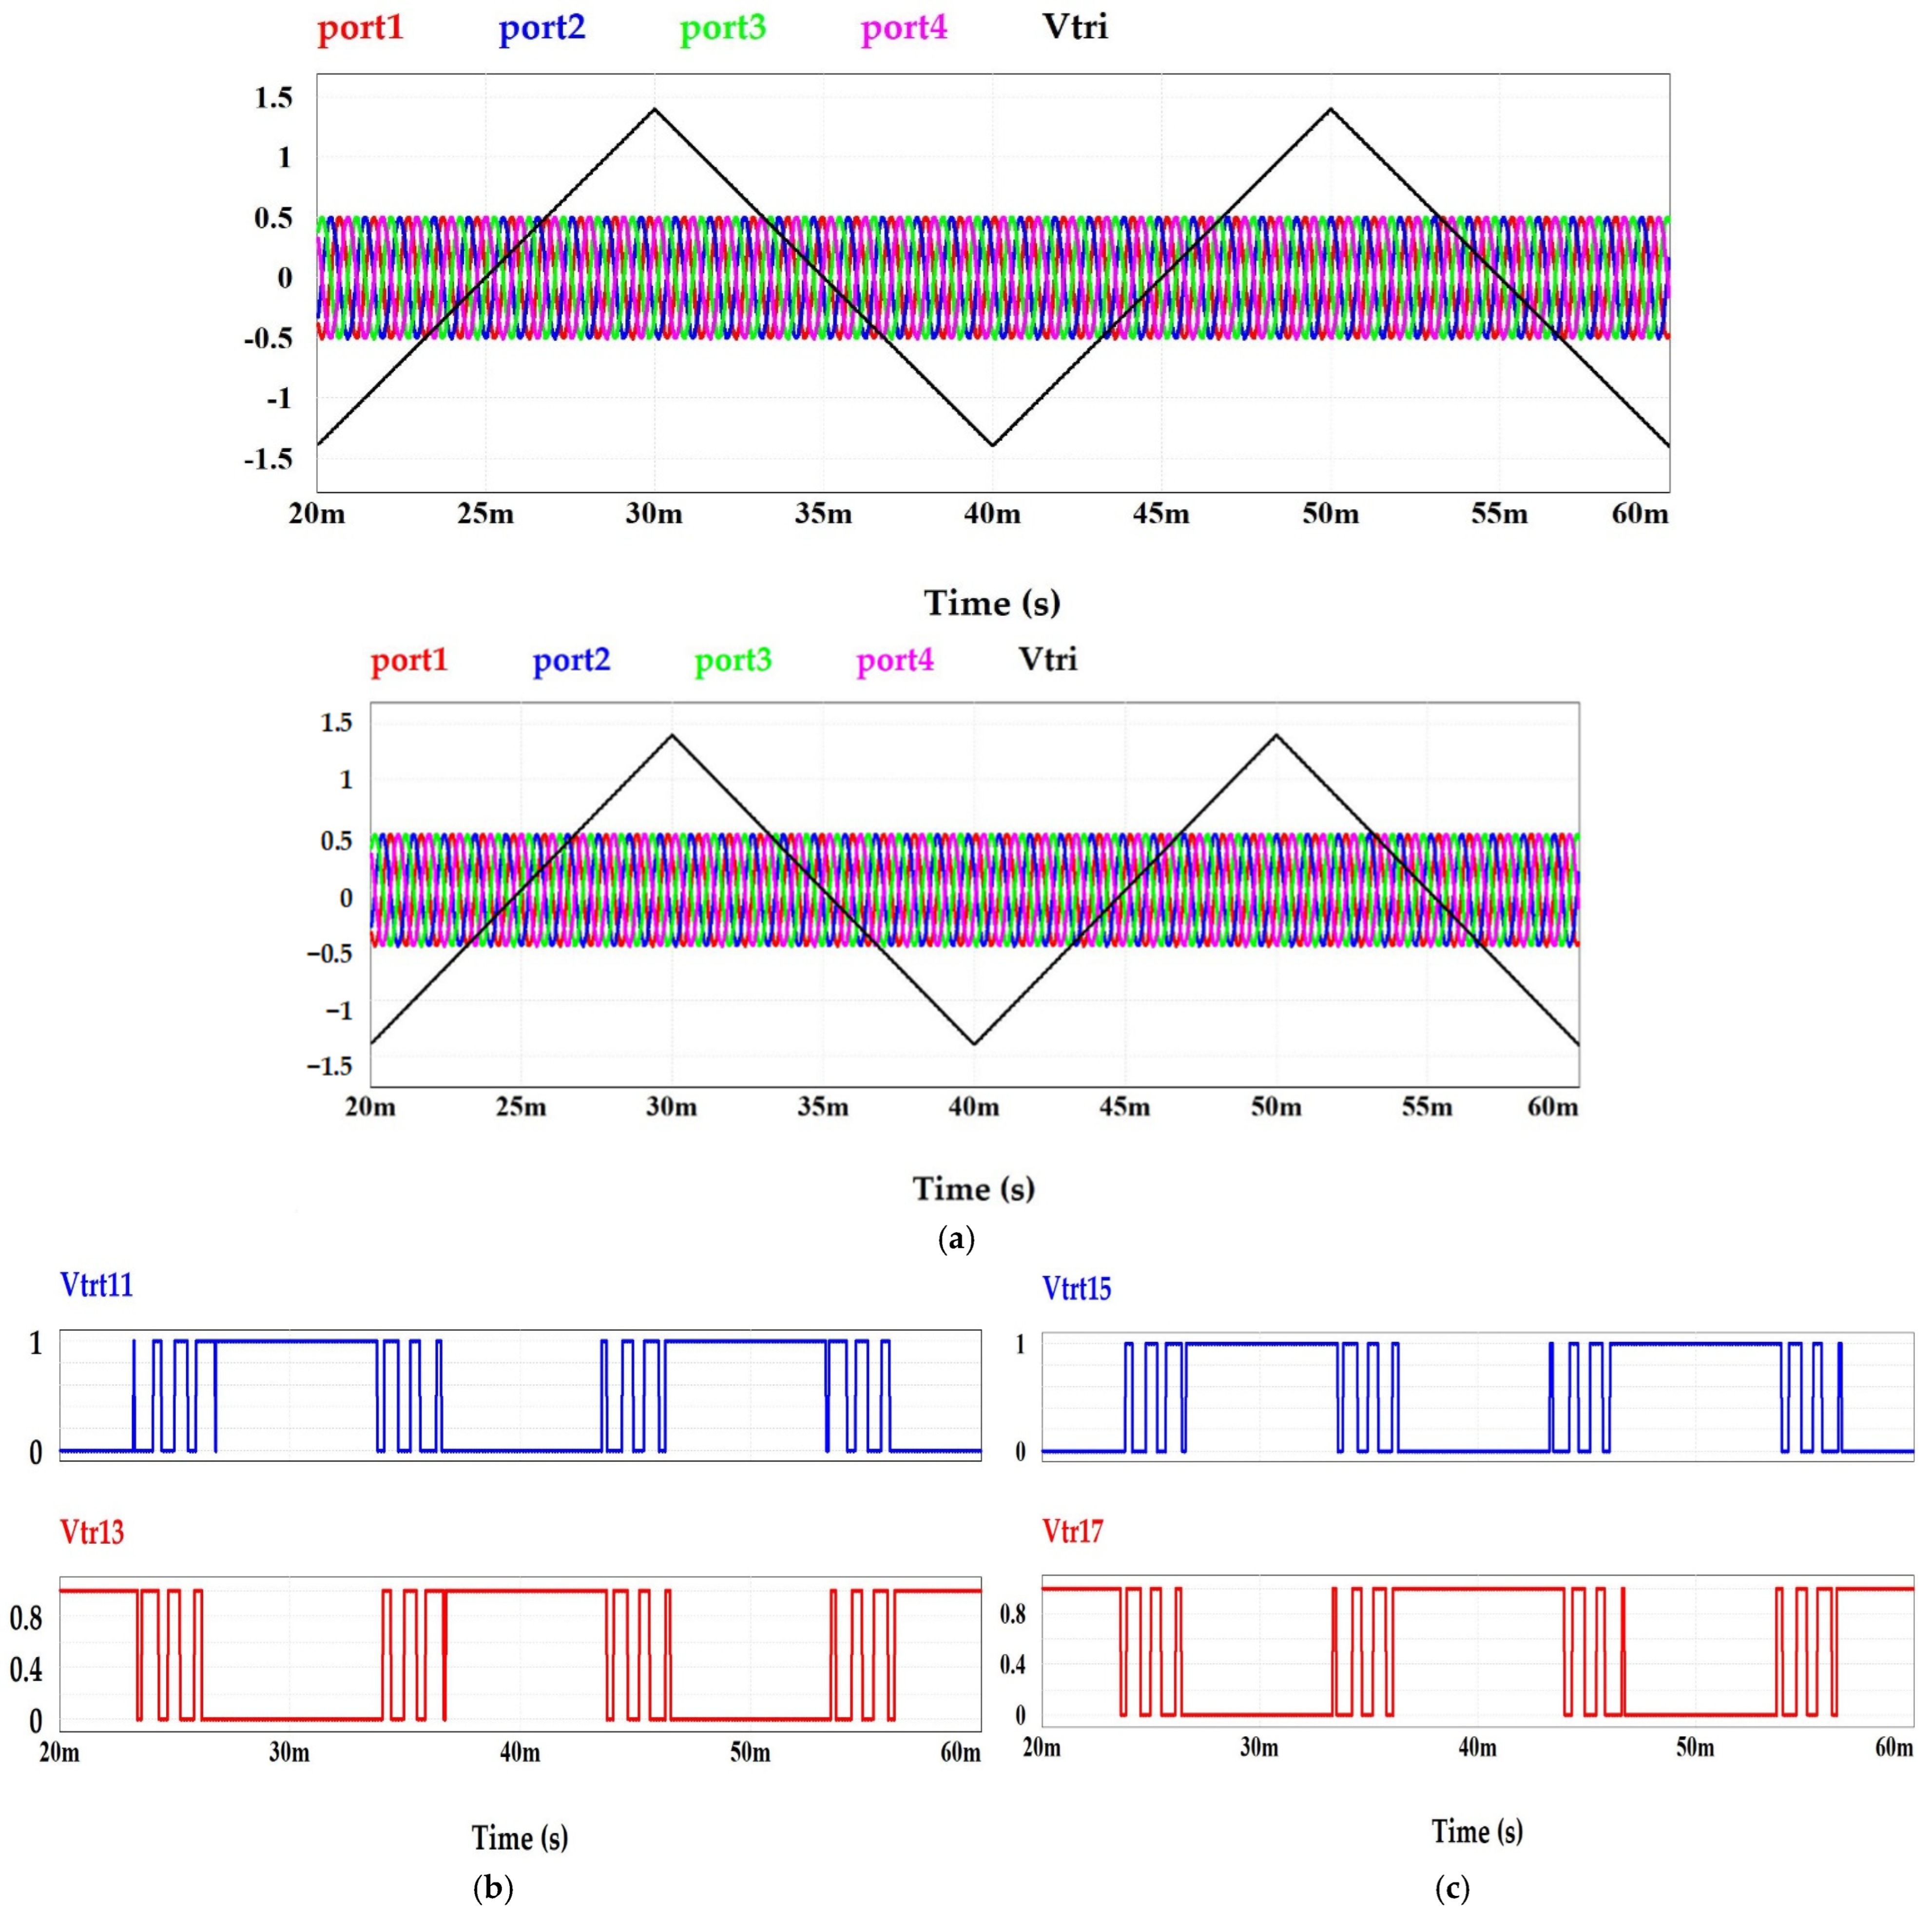
The waveforms used to control the power transistors are generated by the interaction between the modulating signals, which are out of phase by 2π/3 radians, and the carrier signals, which are out of phase by π/2 radians. Each modulator has a phase difference of 2π/3 radians relative to the other two. Furthermore, the sinusoidal carrier signals are also out of phase; however, in this case, the phase difference between them is π/2 radians. This phase difference is essential for achieving precise and efficient modulation and for avoiding odd-order harmonics. To achieve this phase difference, the waveform must be symmetrical about π/2 radians. Figure 5 shows (a) the modulating and carrier signals and (b) and (c) the pulses to be applied to the IGBTs of the H-bridges in the same phase. In this figure, the triangular modulating waveform has a peak-to-peak value of 2.8 volts.
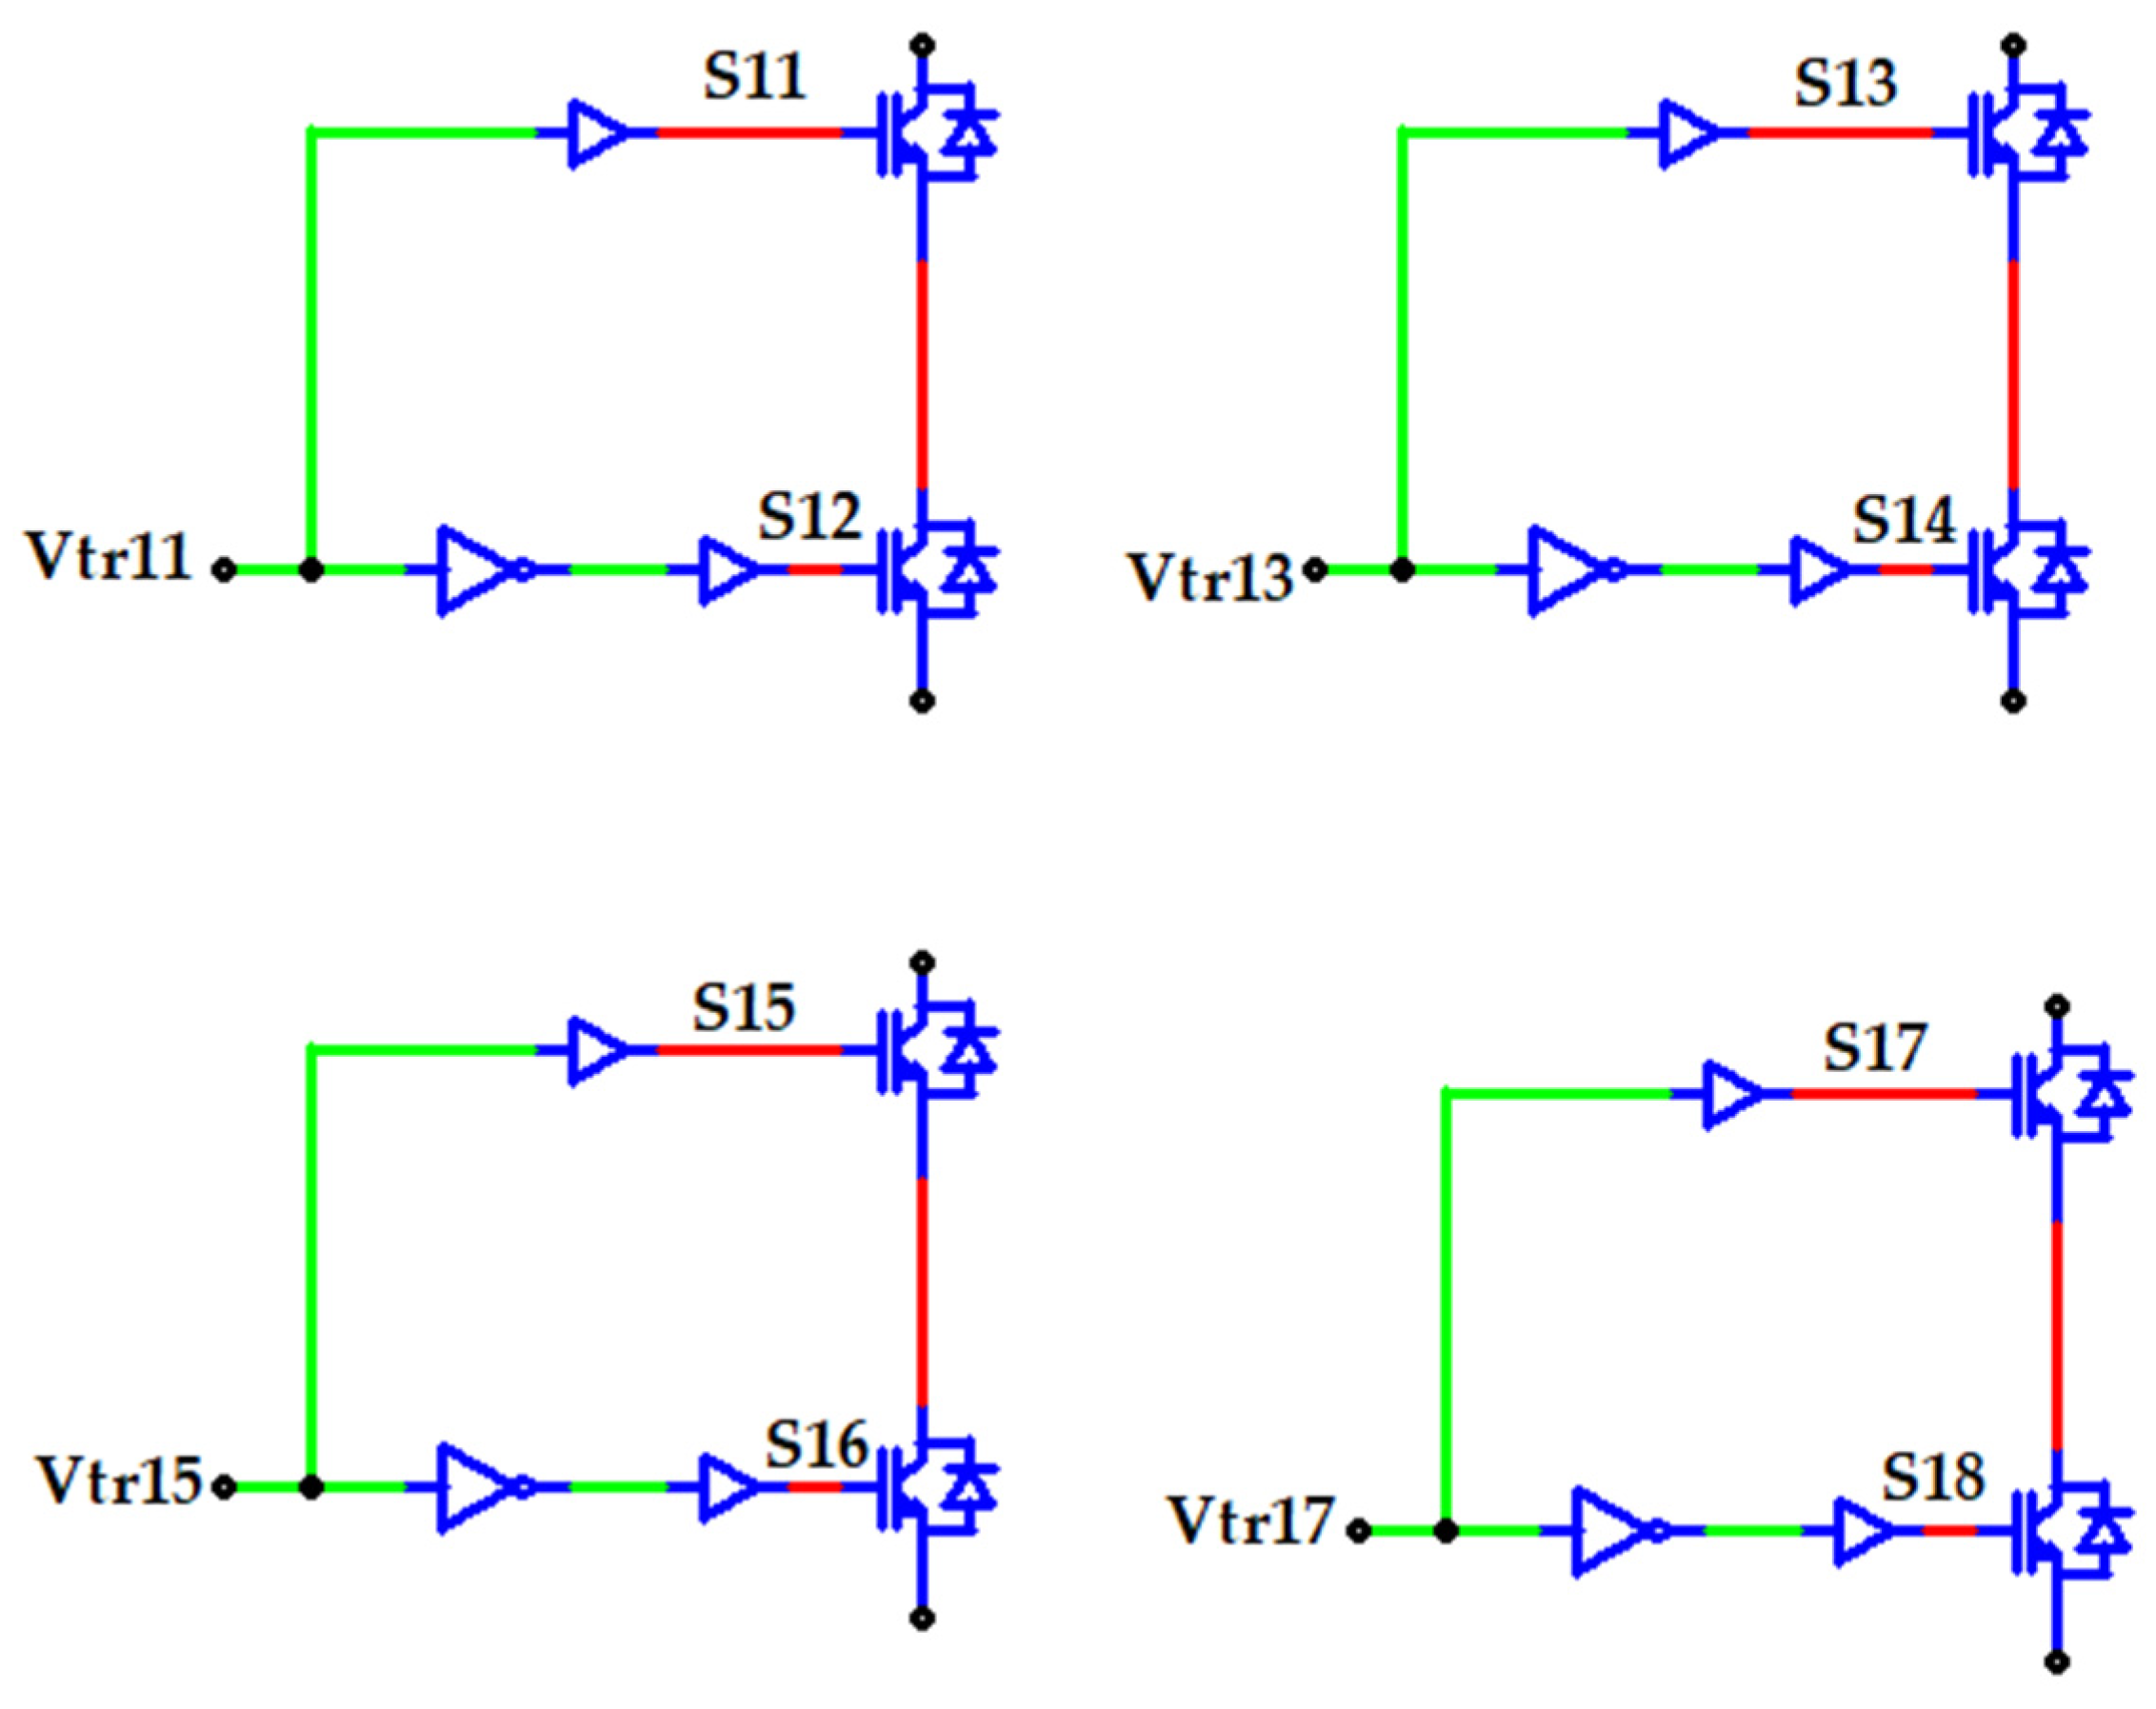
These figures are directly related to Figure 6. Each of these signals and their inverted versions control the corresponding transistor in the H-bridge. The signals used to control the remaining phases of the three-phase system will be generated by shifting the modulating wave by 2π/3 and 4π/3.
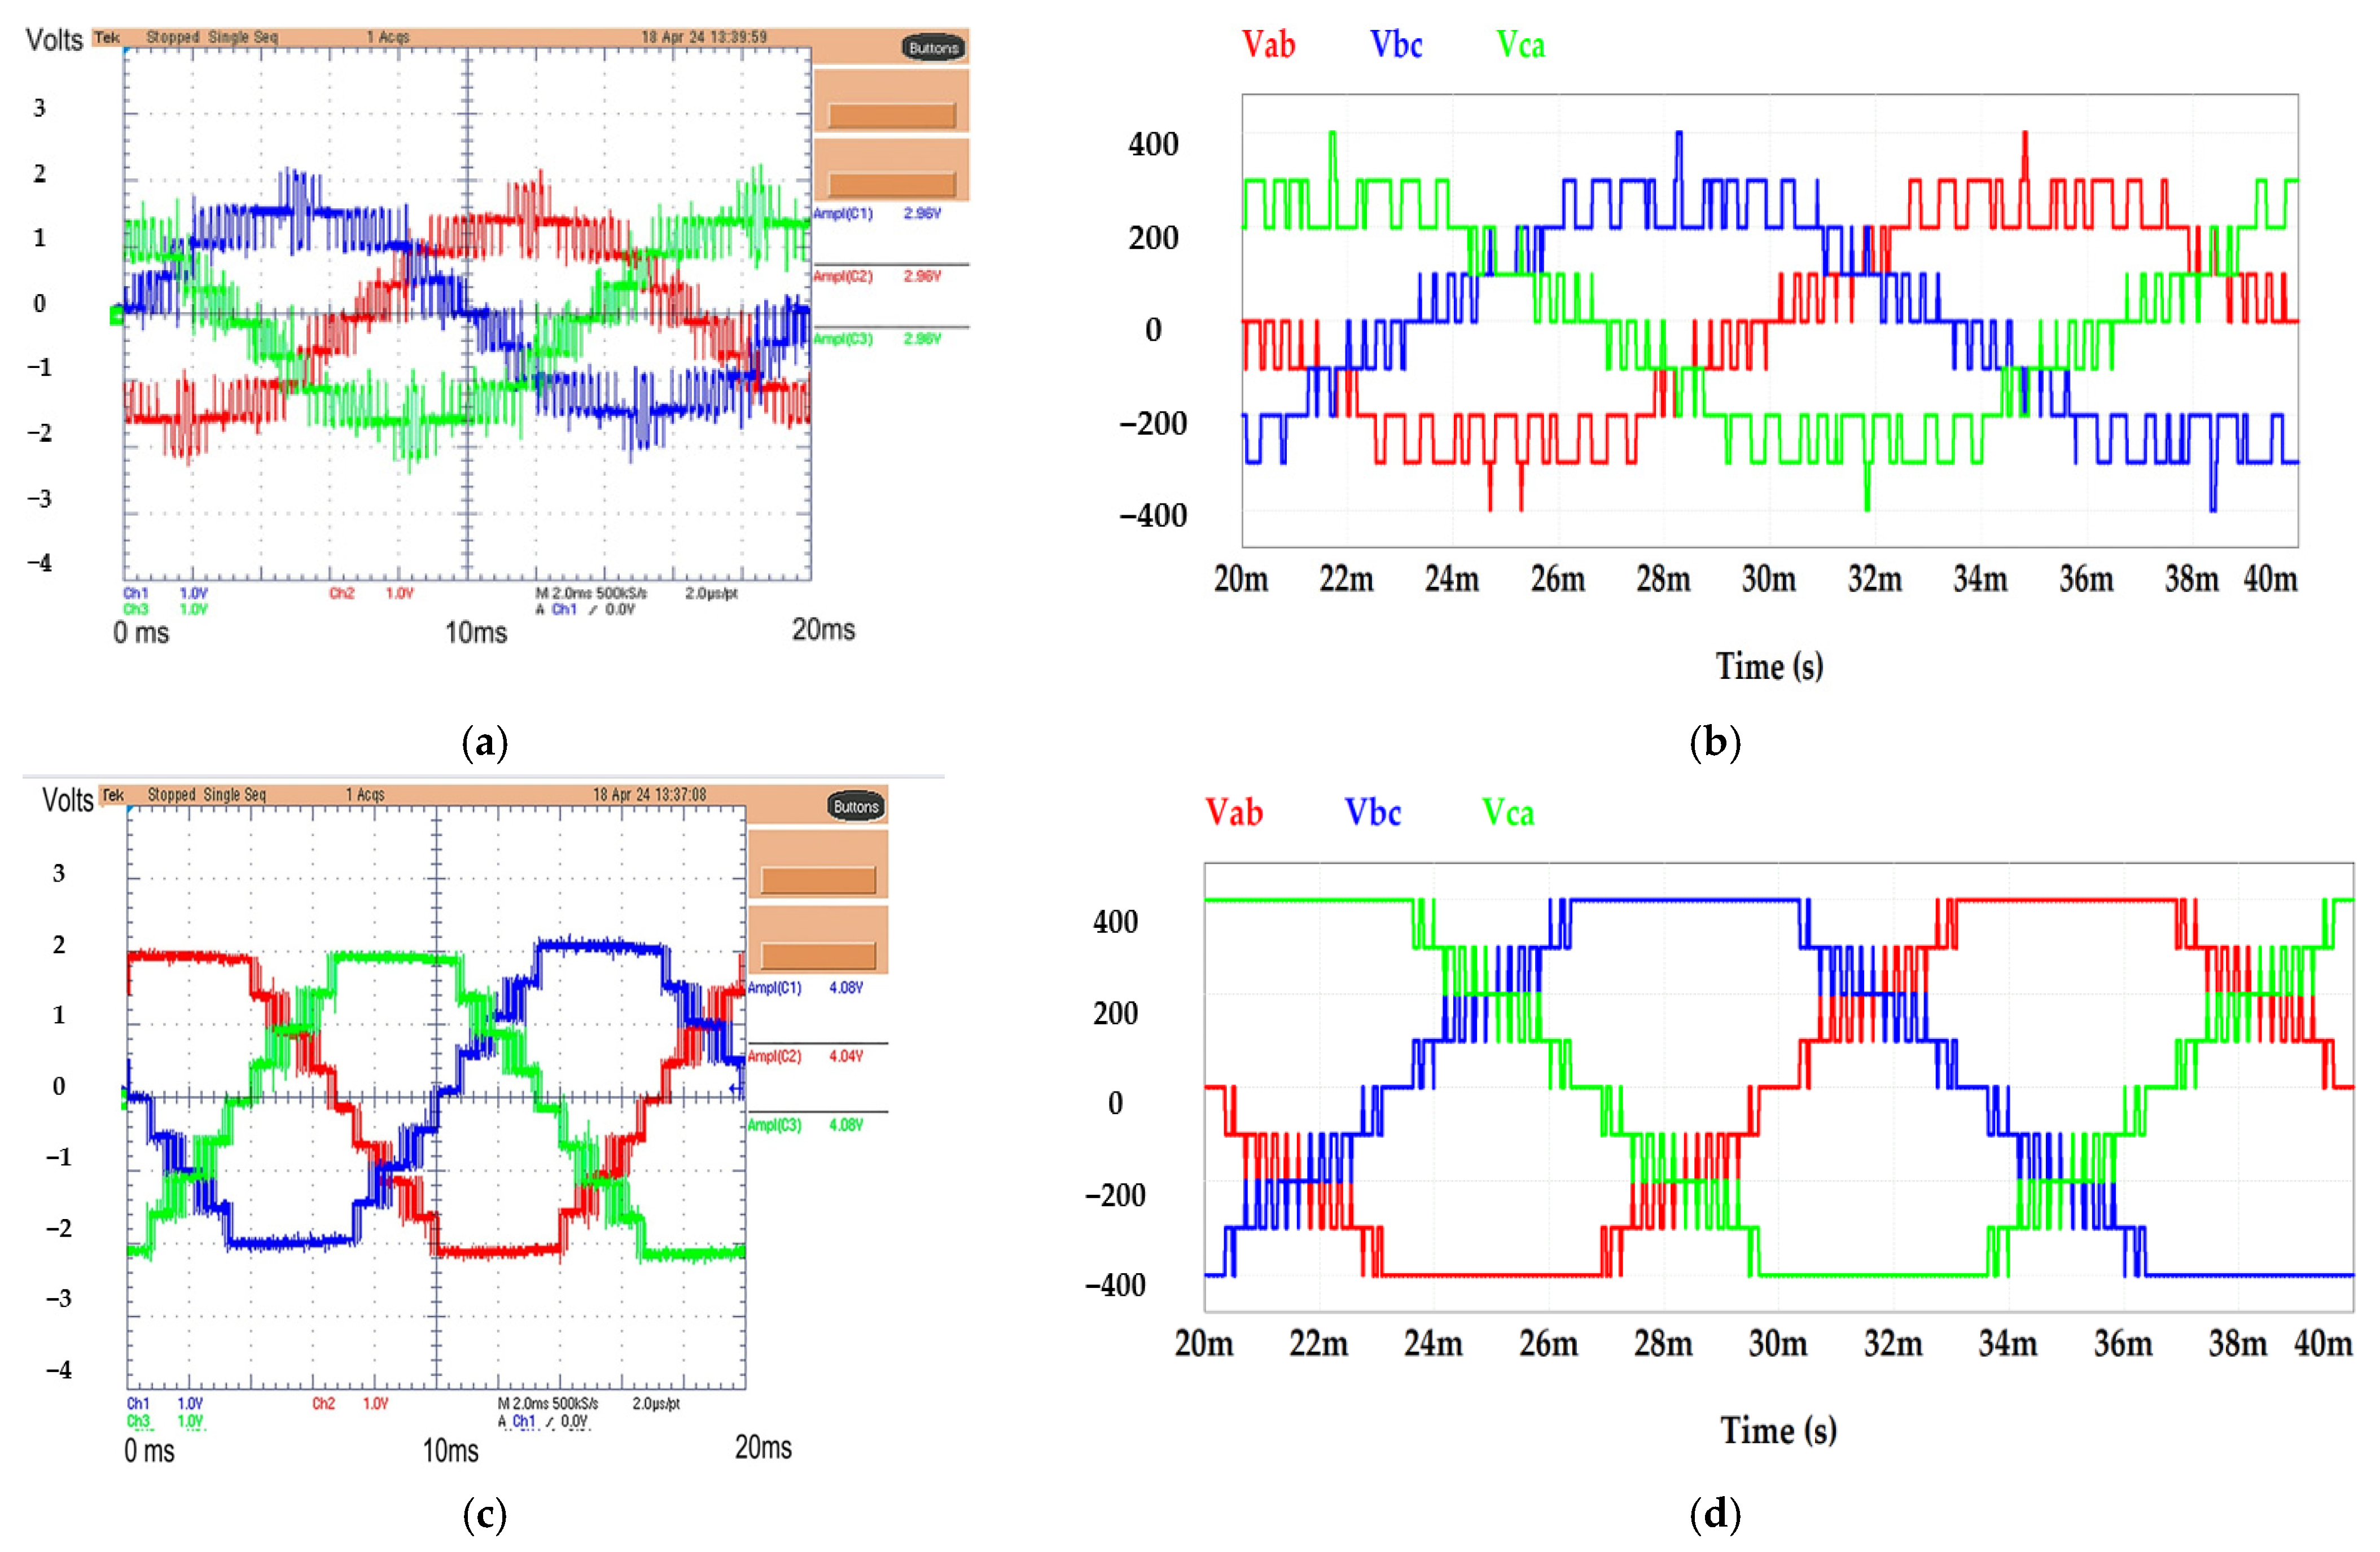
Finally, Figure 7 shows the PSTM-PWM waveforms measured in the laboratory for two different input voltage values: Upp = 2.8 V (Figure 7a) and Upp = 7.0 V (Figure 7c). To measure the output line voltage, a differential probe manufactured by MetrixTM MX9030 with a gain of 200 was used. The simulated values correspond to Figure 7b,d for the same Upp values. Despite all techniques exhibiting a similar DC voltage, the proposed technique is able to generate a significantly higher output voltage than the other classical techniques, as can be seen in Table 1 (M = 7). The results of the current harmonics when different techniques are used to supply a power transformer are also shown in this table. The effective value was generated with a direct voltage of 100 volts in the DC link. When the modulated waveform reaches a peak value of 3.5 V, the RMS magnitude of the fundamental component is approximately 5% higher than that obtained using the most efficient conventional method, namely PS-PWM with harmonic injection. An increase in the fundamental RMS voltage is particularly advantageous because it improves the efficiency of the power conversion process, which in turn reduces losses and improves the operational performance of the multilevel inverter. Furthermore, the proposed modulation approach maintains the harmonic content within acceptable limits without requiring additional filtering stages and whilst achieving lower total harmonic distortion. These characteristics make the technique a more attractive option when transformers are required to feed renewable energy into the power grid.
Although the PS-PWMHI technique comes closest to meeting the standard, the proposed technique outperforms it in terms of efficiency and compliance. It can be seen that, using the PS-PWMHI technique, harmonics 15, 17, 21 and 23 exceed the standard limits.

5. Results of Transformer Heating Experiments

To implement the multilevel inverter topology, the GPT-IGBT module provided by GUASCH S.A.TM was employed to realize an H-bridge configuration based on insulated gate bipolar transistors (IGBTs). The latter makes this module suitable for several applications such as motor drives, power transformer studies, and power injection systems. The unit features a rectifier, a set of electric capacitors, IGBTs with the corresponding optically isolated gate drivers, phase current sensors at the output, and sensors for both DC link voltage and current. The electrical parameters of a stage are a maximum DC link voltage of 750 V and a maximum current output per phase of 32 A.
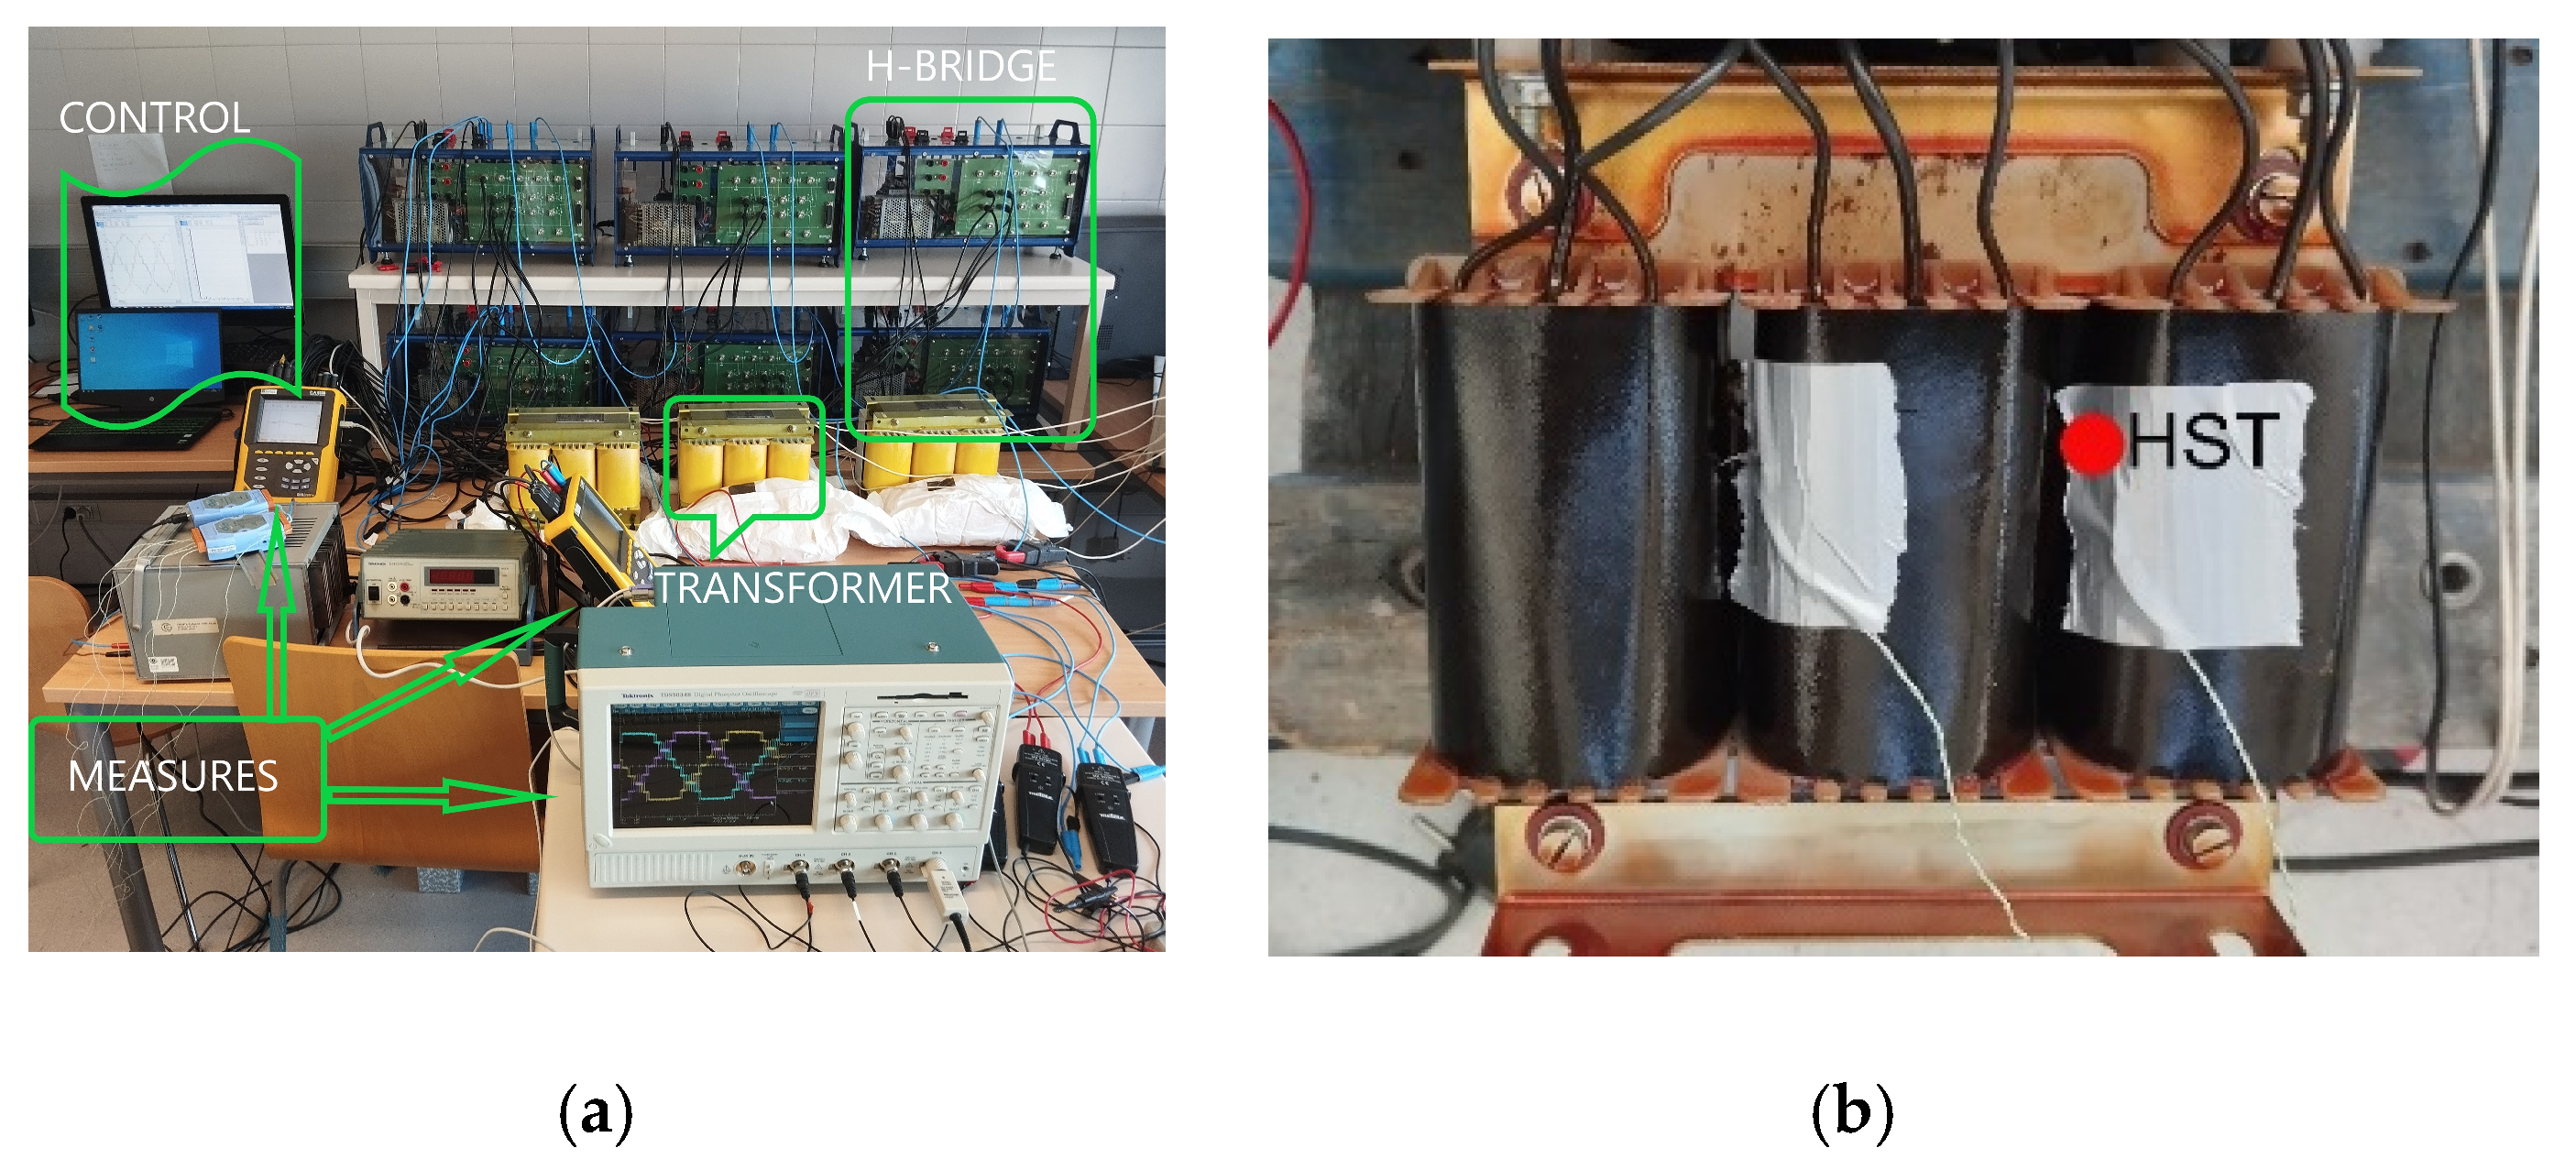
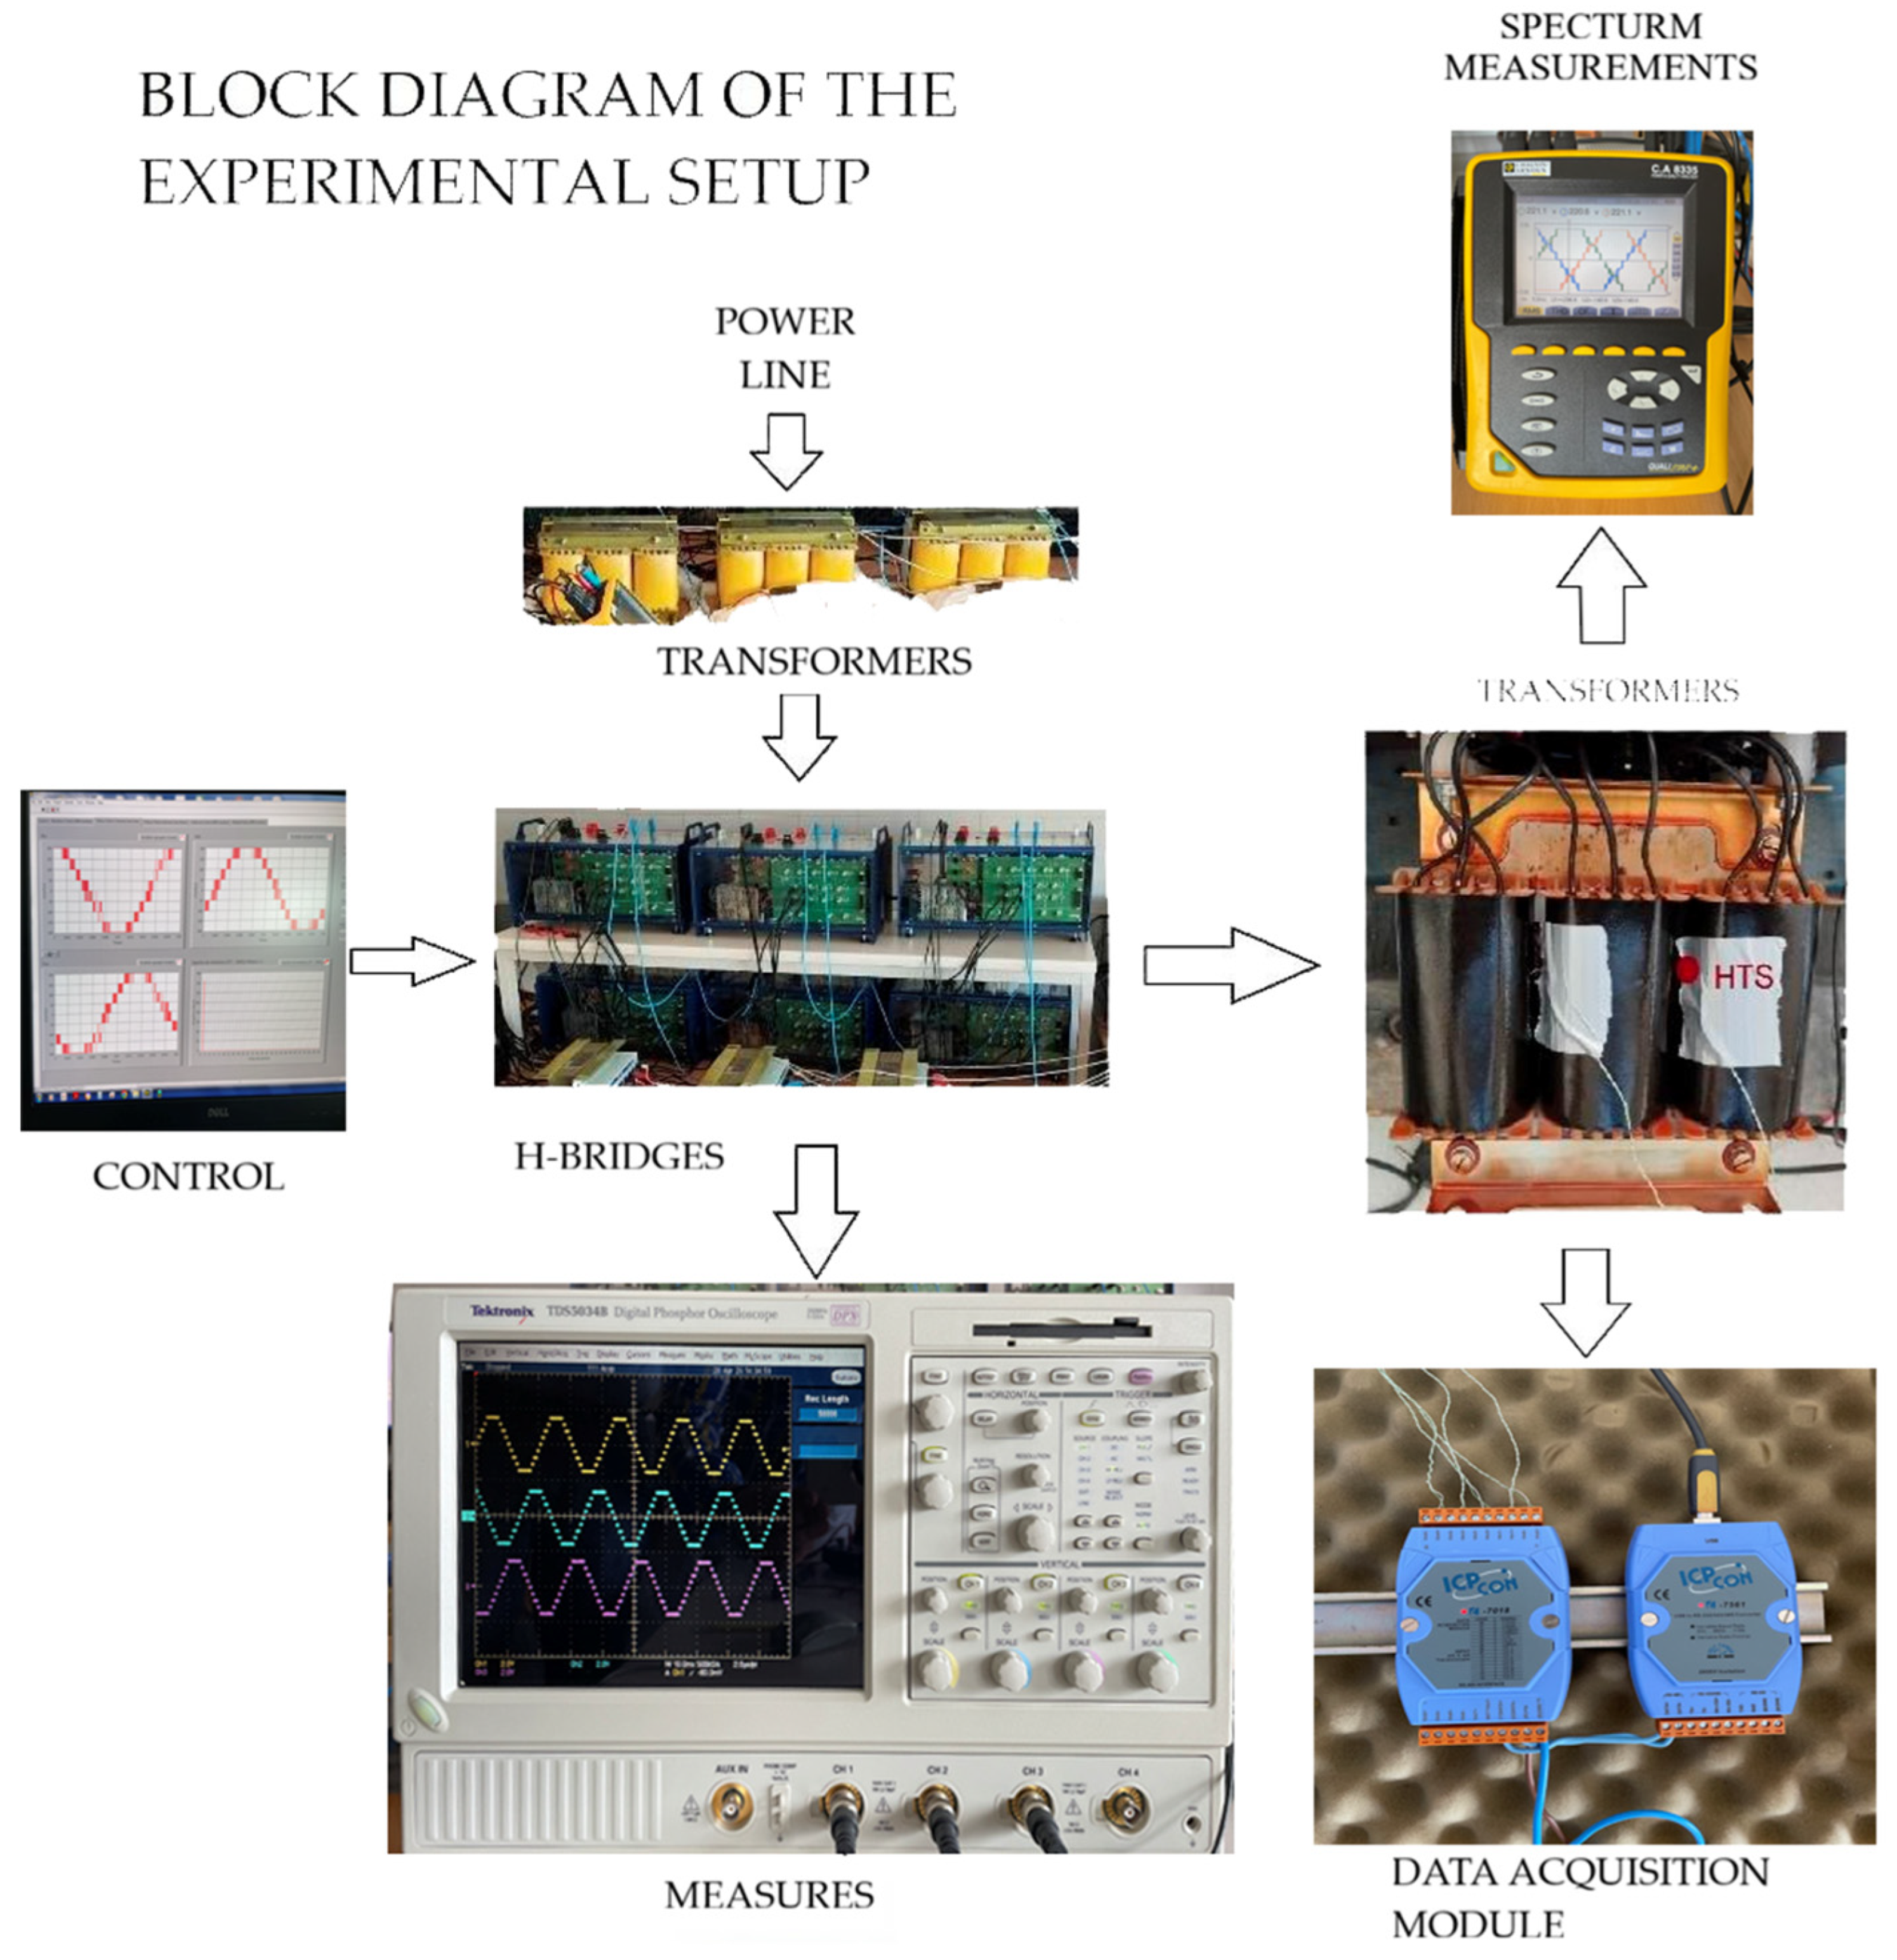
The control signals were produced by an NI-9154 card manufactured by National InstrumentsTM (Austin, TX, USA). A control environment based on LabVIEWTM (2020 version, Austin, TX, USA) was used to control and test different PWM strategies. The harmonic content of the inverter output voltage was evaluated by employing three-phase power testing equipment TektronixTM TDS5034B (Beaverton, OR, USA), while power quality analysis was carried out using the Chauvin Arnoux TM C.A 8336 instrument (Asnières-sur-Seine, France). This instrument is capable of performing calculations for the first 50 terms, although the present study only covers the first 25 terms, as specified in the standard. The DC voltage supplied to the CHB was set to 100 V. The set-up used in laboratory experiments is illustrated in Figure 8 and Figure 9.
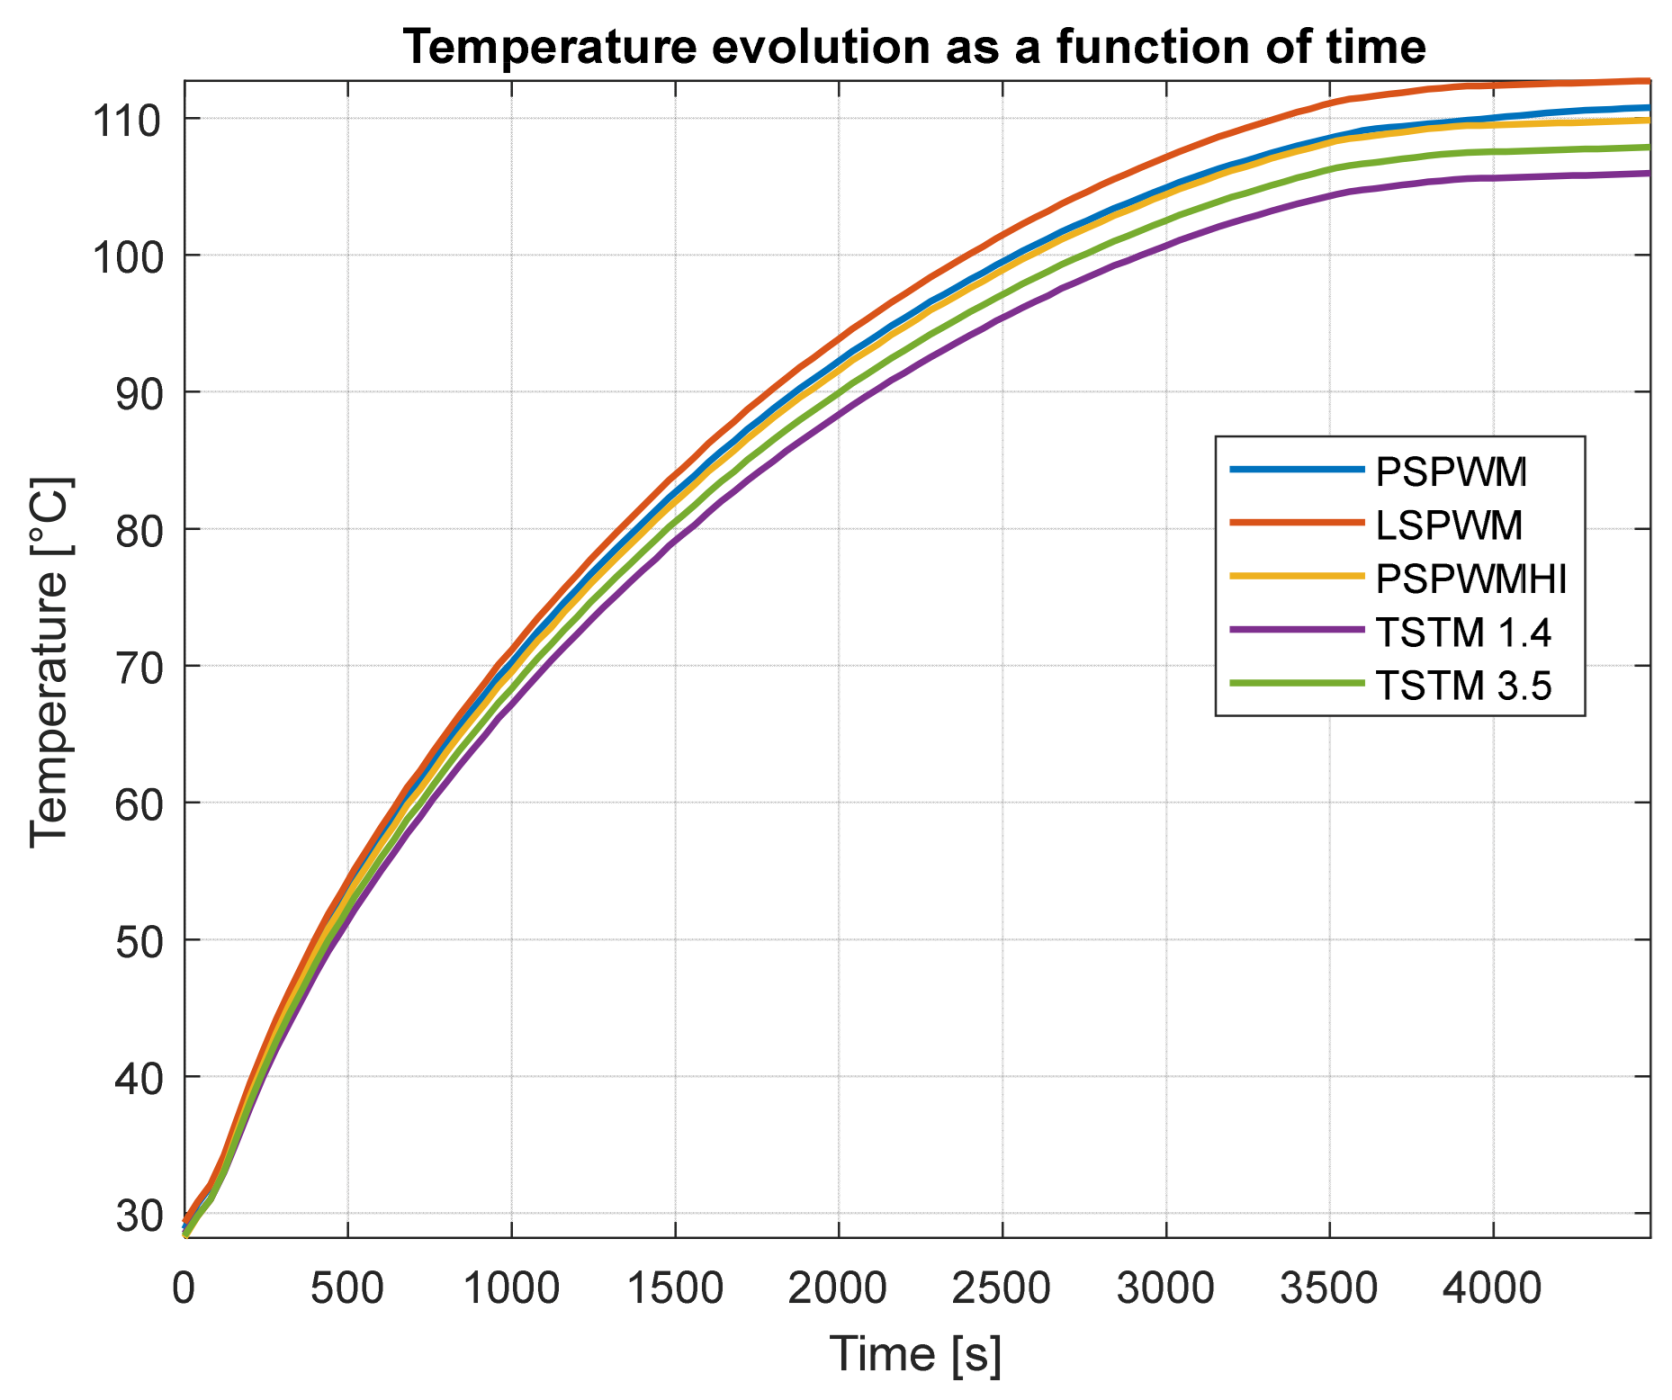
The dry transformer used is a prototype with a 230/60 V, 0.5 kVA and Y-Y 0° configuration. Following the short-circuit and no-load tests, an efficiency of 87% was obtained at the rated operating condition–1.53 A–. The short-circuit resistance is 10.63 Ω, the short-circuit reactance is 7.43 Ω, and the load resistance was set at around 4.8 Ω so that the test current was 1.62 A. First, the transformer was experimentally heated up with the mains signal to set the HST; Figure 8b shows where the HST is located. Subsequently, the transformer was fed using different control techniques. The graph in Figure 10 shows the temperature evolution for each of the PWM techniques for M = 7. To automatically measure the evolution of the temperature over time, three thermocouples were distributed at different points of the transformer. A Labview™ program was developed using a data acquisition module, specifically the 7018 from ICPDAS™, to acquire the temperature values measured by these thermocouples. From the measurements obtained, as a result of applying the proposed PSTM-PWM technique with Upp = 2.8 V, the final temperature increase is the lowest, with a maximum temperature value of 105.9 °C.
It should be emphasized that thermocouple accuracy typically ranges from ±0.5 °C to ±2.0 °C, depending on factors such as sensor type, mounting quality, and calibration of the data acquisition system.
During the experimental process, the test conditions were kept constant in order to guarantee measurement reliability. The sensor was firmly attached to maintain good thermal contact, and the same data acquisition rate was used for all recordings. Maintaining these conditions helped to reduce systematic errors that could arise from variations in sensor positioning or differences in sampling intervals. To assess the repeatability and stability of the measurements under controlled circumstances, 15 successive readings were taken at the same point. Based on these measurements, several statistical indicators were obtained. The average value was adopted as the representative temperature, while the standard deviation quantified the spread of the measurements. When the operating conditions were stable and the sensor was correctly installed, the calculated standard deviation exhibited the typical performance expected for this type of thermocouple, generally falling within a range of approximately ±0.3 °C to ±0.6 °C. This highlights both the intrinsic sensitivity of the sensor and the presence of small thermal variations in the analyzed system.
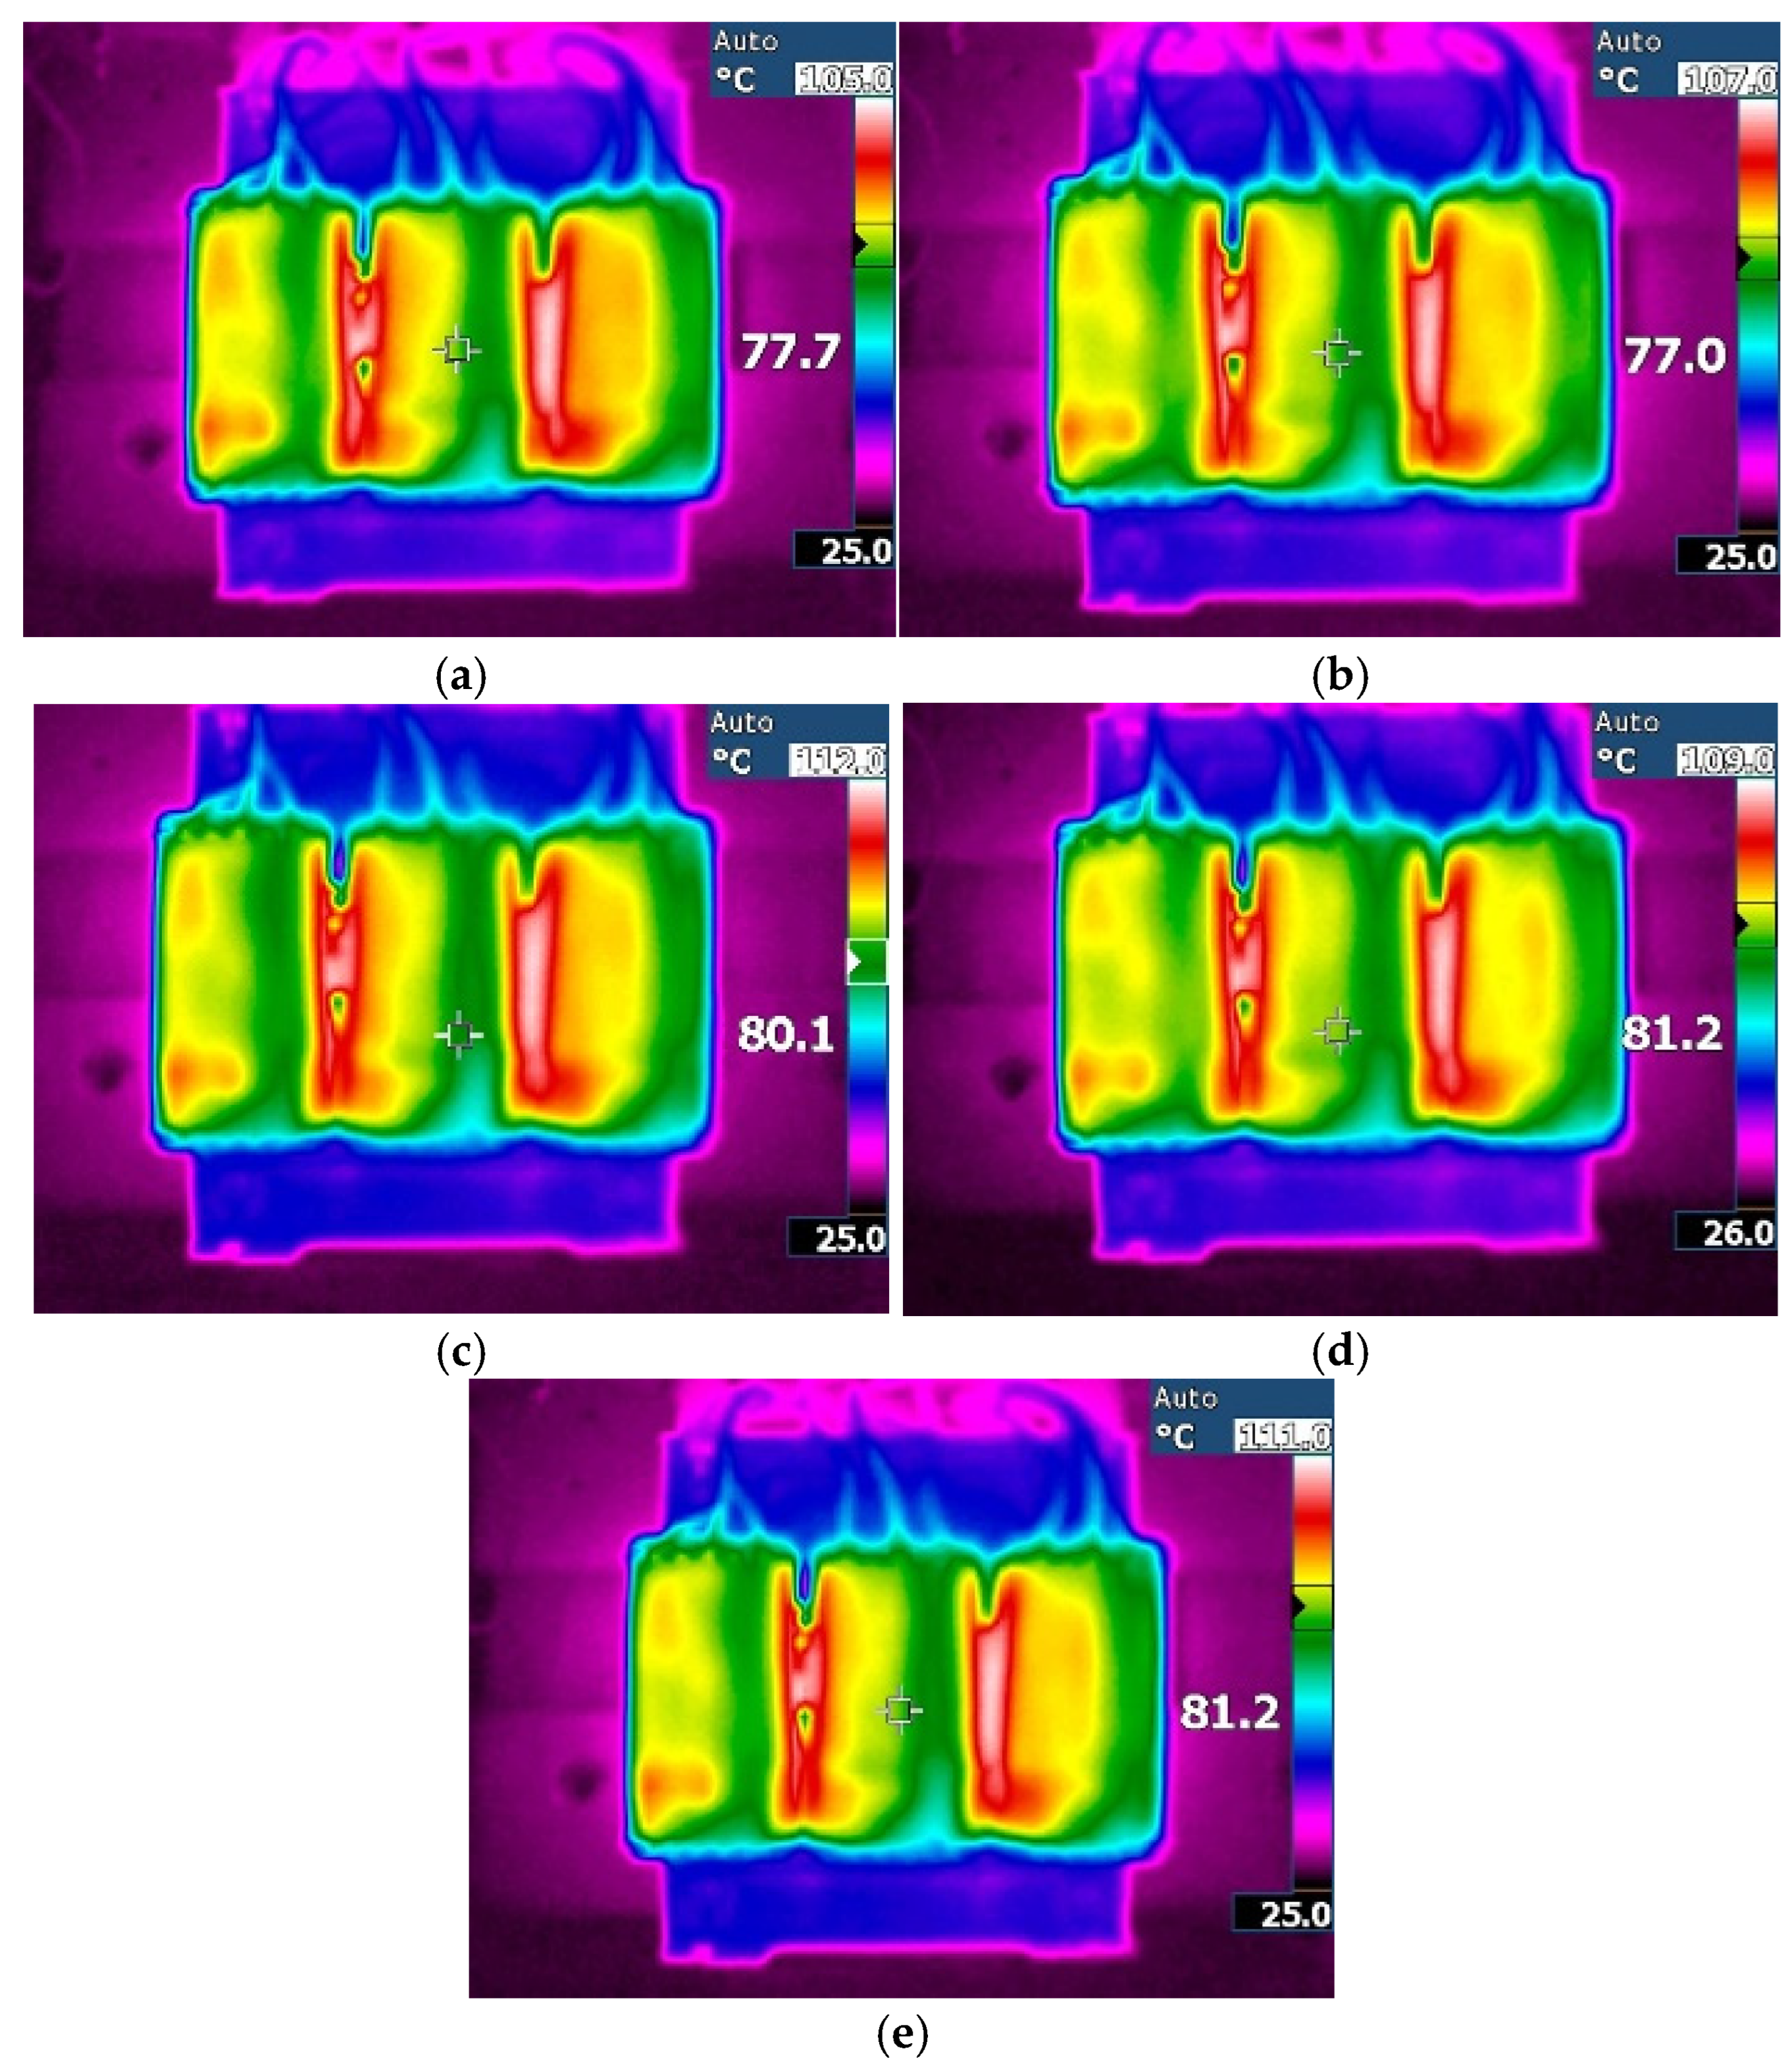
Figure 11a–e show the temperature distributions in the transformer following use of the different techniques; images were obtained with a Fluke Ti9TM thermographic camera (Fluke Corporation 6920 Seaway Blvd Everett, WA, USA). For the PSTM-PWM technique with Upp = 2.8 V, it can be seen that this technique produces the lowest amount of transformer heating, with a final temperature of 105.9 °C. On the right-hand side of each thermographic photograph, the maximum temperature can be seen at the top, and the minimum temperature is shown at the bottom, which corresponds to the ambient temperature.
Table 2 shows the useful life of the transformer according to the different techniques used in the multilevel inverter, using expression (2) for the Relative Life Factor (RVF). There is a difference of seven degrees Celsius between the LS-PWM technique and the PSTM-PWM technique when Upp = 2.8 V. This represents a three-year increase in transformer lifetime when using the latter modulation technique, demonstrating that transformer lifetime can be improved using the proposed modulation technique.
Following expressions (4) and (6), the copper losses for both PLL and PEC are obtained at the applied load regime, shown in Table 3. P1 (active power due to the fundamental) is independent of the modulation technique. It is constant because it corresponds to the nominal root-mean-square (RMS) value of the current. Its value is 36.2 W and will not be included in the overall calculation of losses due to harmonics. The losses PNL were calculated using Equation (5) and the values in Table 1 for voltage and current harmonics. The bottom row of the table shows the ratio of total harmonic losses to the test current.

6. Conclusions

In conclusion, transformer heating and its relationship to service life are key issues in electrical engineering. The adoption of technologies such as multilevel power inverters and the growth of photovoltaic plants are examples of how the industry is responding to the need for cleaner and more efficient energy. One drawback of inverters is the generation of harmonics and their effects on electrical machines, including transformers. To reduce this effect, a PSTM-PWM modulation technique was presented for control of the output voltage in H-bridge multilevel inverters. It features a lower harmonic content than the classical techniques available in the technical literature. To demonstrate its effectiveness, it was implemented in laboratory experiments with a five-level H-bridge inverter. This technique improves the THD compared to the other techniques, as well as improves compliance with the EN50160 standard when the control parameter Upp is equal to 2.8 and 7.0 volts (peak-to-peak) at M = 7. In relation to transformer heating, the HST was experimentally established, as recommended by IEC 60076-12. Using thermocouples, the temperature, following the use of each of the techniques, was measured automatically until a permanent thermal regime was reached. From the experimental results, it was demonstrated that the proposed technique improves the service life of the transformers. The best result obtained using the proposed technique was achieved by setting the control parameter (Upp) to 7 volts, resulting in an improvement of approximately one and a half years in service life compared with the PS-PWMHI, according to the IEC standard used.
Future work will involve applying this methodology to oil-filled transformers and conducting a comparison between the two types of transformers—dry and oil-filled—to assess their impact on remaining service life under temperature increases due to different PWM modulation techniques. In addition, the methodology will be applied to higher-power transformers to perform a dimensional analysis.

Author Contributions

Conceptualization, F.M.P.-H. and J.R.H.-L.; methodology, F.M.P.-H. and A.F.R.-G.; software, A.F.R.-G. and M.J.M.-G.; hardware, F.M.P.-H., J.R.H.-L. and A.F.R.-G.; data curation, A.F.R.-G. and M.J.M.-G.; writing—original draft preparation, F.M.P.-H. and J.R.H.-L.; writing—review and editing, A.F.R.-G. and M.J.M.-G. All authors have read and agreed to the published version of the manuscript.

Funding

This research received no external funding.

Data Availability Statement

The data is contained in the paper.

Acknowledgments

During the preparation of this manuscript/study, the authors used ChatGPT 4 to improve the clarity of English. The authors have reviewed and edited the output and take full responsibility for the content of this publication.

Conflicts of Interest

The authors declare no conflict of interest.

Abbreviations

The following abbreviations are used in this manuscript:
THDTotal Harmonics Distortion
RMSRoots Mean Square
LS-PWMLevel Shift PWM
PS-PWMPhase Shift PWM
PS-PWMHIPhase Shift PWM Harmonics Injection
HSTHottest-Spot Temperature
RVFRelative Life Factor
PSTM-PWMPhase Shift Triangle Modulator PWM
PWMPulse Width Modulation

References

  1. Zhang, X.; Gockenbach, E. Age-dependent maintenance strategies of medium-voltage circuit-breakers and transformers. Electr. Power Syst. Res. 2011, 81, 1709–1714. [Google Scholar] [CrossRef]
  2. Akbari, M.; Rezaei-Zare, A. Thermal Analysis of Power Transformers Under Geomagnetically Induced Current. IEEE Trans. Power Deliv. 2023, 38, 4114–4121. [Google Scholar] [CrossRef]
  3. Almohaimeed, S.A.; Suryanarayanan, S. Steady-State Analysis of the Impact of Temperature Variations on a Distribution Transformer; North American Power Symposium (NAPS): Morgantown, WV, USA, 2017; pp. 1–5. [Google Scholar]
  4. Awadallah, M.A.; Xu, T.; Venkatesh, B.; Singh, B.N. On the effects of solar panels on distribution transformers. IEEE Trans. Power Deliv. 2016, 31, 1176–1185. [Google Scholar] [CrossRef]
  5. Elmoudi, A.; Lehtonen, M.; Nordman, H. Effect of harmonics on transformers loss of life. In Proceedings of the Conference Record of the 2006 IEEE International Symposium on Electrical Insulation, Toronto, ON, Canada, 11–14 June 2006; pp. 408–411. [Google Scholar] [CrossRef]
  6. Taheri, S.; Taheri, H.; Fofana, I.; Hemmatjou, H.; Gholami, A. Effect of power system harmonics on transformer loading capability and hot spot temperature. In Proceedings of the 25th IEEE Canadian Conference on Electrical and Computer Engineering (CCECE), Montreal, QC, Canada, 29 April–2 May 2012; pp. 1–4. [Google Scholar] [CrossRef]
  7. Omer, P.; Kumar, J.; Surjan, B.S. A Review on Reduced Switch Count Multilevel Inverter Topologies. IEEE Access 2020, 8, 22281–22302. [Google Scholar] [CrossRef]
  8. Yu, Y.; Konstantinou, G.; Hredzak, B.; Agelidis, V.G. Power Balance of Cascaded H-Bridge Multilevel Converters for Large-Scale Photovoltaic Integration. IEEE Trans. Power Electron. 2016, 31, 292–303. [Google Scholar] [CrossRef]
  9. Choudhury, S.; Bajaj, M.; Dash, T.; Kamel, S.; Jurado, F. A Survey on Classical and Advanced Topologies, Control Schemes, Applications to Power System and Future Prospects. Energies 2021, 14, 5773. [Google Scholar] [CrossRef]
  10. António-Ferreira, A.; Collados-Rodríguez, C.; Gomis-Bellmunt, O. Modulation techniques applied to medium voltage modular multilevel converters for renewable energy integration: A review. Electr. Power Syst. Res. 2018, 155, 21–39. [Google Scholar] [CrossRef]
  11. Amamra, S.A.; Meghriche, K.; Cherifi, A.; Francois, B. Multilevel Inverter Topology for Renewable Energy Grid Integration. IEEE Trans. Ind. Electron. 2017, 64, 8855–8866. [Google Scholar] [CrossRef]
  12. Mishra, N.; Singh, B.; Cheng, K.W.E. Power Quality Assessment of CPUC Based Solar Photovoltaic System with NLMS for Grid-Tied Applications. IEEE Trans. Power Deliv. 2023, 38, 655–665. [Google Scholar] [CrossRef]
  13. Pires, V.; Martins, J.F.; Foito, D.; Hão, C. A Grid Connected Photovoltaic System with a Multilevel Inverter and a Le-Blanc Transformer. Int. J. Renew. Energy Res. 2012, 2, 84–91. [Google Scholar]
  14. Guo, X.; Wang, X.; Wang, C.; Lu, Z.Z.; Hua, C.; Blaabjerg, F. Improved Modulation Strategy for Singe-Phase Cascaded H-Bridge Multilevel Inverter. IEEE Trans. Power Electron. 2022, 37, 2470–2474. [Google Scholar] [CrossRef]
  15. Sastry, J.; Bakas, P.; Kim, H.; Wang, L.; Marinopoulos, A. Evaluation of cascaded H-bridge inverter for utility-scale photovoltaic systems. Energy 2014, 69, 208–218. [Google Scholar] [CrossRef]
  16. Lopez-Pascual, D.; Valiente-Blanco, I.; Fernandez-Munoz, M. Diez-Jimenez Improving the efficiency of solar photovoltaics by means of geothermal cooling: A year-long test campaign. Renew. Energy 2017, 227, 120553. [Google Scholar] [CrossRef]
  17. Pavan Kumar, Y.V.; Ravikumar, B. A simple modular multilevel inverter topology for the power quality improvement in renewable energy based green building microgrids. Electr. Power Syst. Res. 2016, 140, 147–161. [Google Scholar] [CrossRef]
  18. Lopez-Pascual, D.; Valiente-Blanco, I.; Morrison, A.P.; Diez-Jimenez, E. New Solar Photovoltaics Trends Toward Sustainable Development Goals. In Implementing the UN Sustainable Development Goals Regional Perspectives; Leal Filho, W., Dinis, M.A.P., Moggi, S., Price, E., Hope, A., Eds.; SDGs in the European Region; Springer: Cham, Switzerland, 2023; pp. 1205–1238. [Google Scholar] [CrossRef]
  19. Janic, Z.; Gavrilov, N.; Roketinec, I. Influence of Cooling Management to Transformer Efficiency and Ageing. Energies 2023, 16, 4626. [Google Scholar] [CrossRef]
  20. Theofanous, A.; Ullah, I.; Galea, M.; Giangrande, P.; Madonna, V.; Ji, Y.; Licari, J.; Apap, M. Modelling of Insulation Thermal Ageing: Historical Evolution from Fundamental Chemistry Towards Becoming an Electrical Machine Design Tool. Energies 2025, 18, 6087. [Google Scholar] [CrossRef]
  21. Sumislawska, M.; Gyftakis, K.N.; Kavanagh, D.F.; McCulloch, M.D.; Burnham, K.J.; Howey, D.A. The Impact of Thermal Degradation on Properties of Electrical Machine Winding Insulation Material. IEEE Trans. Ind. Appl. 2016, 52, 2951–2960. [Google Scholar] [CrossRef]
  22. Montsinger, V.M. Loading transformers by temperature. Trans. Am. Inst. Electr. Eng. 1930, 49, 776–790. [Google Scholar] [CrossRef]
  23. Žarković, M.; Stojković, Z. Analysis of artificial intelligence expert systems for power transformer condition monitoring and diagnostics. Electr. Power Syst. Res. 2021, 149, 125–136. [Google Scholar] [CrossRef]
  24. Zhong, X.; Ekanayake, C.; Ma, H.; Saha, T.K. Ageing analysis of solar farm inverter transformers. IEEE Trans. Power Deliv. 2021, 36, 3815–3824. [Google Scholar] [CrossRef]
  25. IEC 60076-12:2008; Power Transformers—Part 12: Loading Guide for Dry-Type Power Transformers. International Electrotechnical Commission: Geneva, Switzerland, 2008.
  26. Etxegarai Madina, A.; Santiago, V.; Eguia Lopez, P.; Perea Olavarria, E. A study of the useful life of dry-type wtsu transformers. In Proceedings of the International Conference on Renewable Energies and Power Quality (ICREPQ), Granada, Spain, 2–4 September 2020; Volume 18. [Google Scholar]
  27. Ilyas, S.; Bagheri, M.; Phung, T. Real-time dry-type transformer aging evaluation. ISEIM 2017, 2, 120. [Google Scholar] [CrossRef]
  28. Eslamian, M.; Vahidi, B.; Eslamian, A. Thermal analysis of cast-resin dry-type transformers. Energy Convers. Manag. 2011, 52, 2479–3488. [Google Scholar] [CrossRef]
  29. Yaghoobi, J.; Alduraibi, A.; Martin, D.; Zare, F.; Eghbal, D.; Memisevic, R. Impact of high-frequency harmonics (0–9 kHz) generated by grid-connected inverters on distribution transformers. Int. J. Electr. Power Energy Syst. 2020, 122, 106177. [Google Scholar] [CrossRef]
  30. Halacsy, A.A. Temperature Rise of Dry-Type Transformers. Trans. Am. Inst. Electr. Eng. Part III Power Appar. Syst. 1958, 77, 456–460. [Google Scholar] [CrossRef]
  31. Satterlee, W.W. Design and operating characteristics of modern dry-type air-cooled transformers. Electr. Eng. 1944, 63, 701–704. [Google Scholar] [CrossRef]
  32. Stewart, H.C.; Whitman, L.C. Hot-spot temperatures in dry-type transformer windings. Electr. Eng. 1944, 63, 763–768. [Google Scholar] [CrossRef]
  33. Whitman, L.C. Coordination of Dry-Type Transformer Models with Transformer Geometry [includes discussion]. Trans. Am. Inst. Electr. Eng. Part III Power Appar. Syst. 1956, 75, 328–332. [Google Scholar] [CrossRef]
  34. Pierce, L.W. Predicting hottest spot temperatures in ventilated dry type transformer windings. IEEE Trans. Power Deliv. 1994, 9, 1160–1172. [Google Scholar] [CrossRef]
  35. Pierce, L.W. Hottest spot temperatures in ventilated dry type transformers. IEEE Trans. Power Deliv. 1994, 9, 257–264. [Google Scholar] [CrossRef]
  36. Transformers Committee of the IEEE Power Engineering Society. IEEE Recommended Practice for Establishing Transformer Capability When Supplying Nonsinusoidal Load Currents; Transformers Committee of the IEEE Power Engineering Society: Piscataway, NJ, USA, 1999. [Google Scholar]
  37. Pejovski, D.; Najdenkoski, K.; Digalovski, M. Impact of different harmonic loads on distribution transformers. Procedia Eng. 2017, 202, 76–87. [Google Scholar] [CrossRef]
  38. Tofoli, F.L.; Sanhueza, S.R.; de Oliveira, A. On the study of losses in cables and transformers in nonsinusoidal conditions. IEEE Trans. Power Deliv. 2006, 21, 971–978. [Google Scholar] [CrossRef]
  39. Ebenezer, M.; Ramachandralal, R.M.; Sarasamma, P. Study and Analysis of the Effect of Harmonics on the Hot Spot Temperature of a Distribution Transformer Using Finite-Volume Method. Electr. Power Compon. Syst. 2015, 43, 2251–2261. [Google Scholar] [CrossRef]
  40. EN 50160:2020; European Committee for Electrotechnical Standardization. Voltage Characteristics of Electricity Supplied by Public Electricity Networks. CENELEC: Brussels, Belgium, 2020.
  41. Angulo, M.; Lezana, P.; Kouro, S.S.; Rodriguez, J.; Wu, B. Level-shifted PWM for Cascaded Multilevel Inverters with Even Power Distribution. In Proceedings of the IEEE Power Electronics Specialists Conference, Orlando, FL, USA, 17–21 June 2007; pp. 2373–2378. [Google Scholar] [CrossRef]
  42. Darus, R.; Konstantinou, G.; Pou, J.; Ceballos, S.; Agelidis, V.G. Comparison of phase-shifted and level-shifted PWM in the modular multilevel converter. In Proceedings of the International Power Electronics Conference (IPEC)-Hiroshima (JP), Hiroshima, Japan, 18–21 May 2014. [Google Scholar] [CrossRef]
  43. Heredia-Larrubia, J.-R.; Perez-Hidalgo, F.M.; Ruiz-Gonzalez, A.; Meco-Gutierrez, M.J. Discontinuous Multilevel Pulse Width Modulation Technique for Grid Voltage Quality Improvement and Inverter Loss Reduction in Photovoltaic Systems. Electronics 2025, 14, 2695. [Google Scholar] [CrossRef]
  44. Ruiz-González, A.; Heredia-Larrubia, J.R.; Pérez-Hidalgo, F.M.; Meco-Gutiérrez, M.J. Discontinuous PWM Strategy with Frequency Modulation for Vibration Reduction in Asynchronous Machines. Machines 2023, 11, 705. [Google Scholar] [CrossRef]
Figure 1. Arrangement of the H-bridges in a multilevel inverter.
Electronics 15 01808 g001
Figure 2. (a) PWM waves. Vmodulating, Vcarrier and Vmodulated: modulating, carrier, modulated (output) waves for one H-bridge, M = 15; (b) PSTM technique: carrier, modulator and control signal for an H-bridge transistor, M = 15.
Electronics 15 01808 g002
Figure 3. (a) THD versus modulating waveform peak voltage for different M values. (b) Detail for minimum THD values.
Electronics 15 01808 g003
Figure 4. Amplitude of fundamental wave versus modulating waveform peak voltage for different M values.
Electronics 15 01808 g004
Figure 5. (a) Carriers and modulator waves for multilevel inverters. (b,c) Generated control signals (M = 7).
Electronics 15 01808 g005
Figure 6. Distribution of control signals on an H-bridge (green lines: logical signals, red lines: power signals.
Electronics 15 01808 g006
Figure 7. PSTM-PWM technique (M = 7) with Upp = 2.8 V: (a) oscillogram; (b) simulation. PSTM-PWM technique (M = 7) with Upp = 7.0 V: (c) oscillogram; (d) simulation.
Electronics 15 01808 g007
Figure 8. (a) Multilevel power inverter. (b) Transformer indicating the position of the HST.
Electronics 15 01808 g008
Figure 9. Block diagram of the experimental setup.
Electronics 15 01808 g009
Figure 10. Temperatures reached by modulation techniques: LS-PWM, PS-PWM, PS-PWMHI, PSTM-PWM Upp = 2.8 V (label: 1.4) and Upp = 7.0 V (label: 3.5).
Electronics 15 01808 g010
Figure 11. Measurements made with the thermographic camera. (a) PSTM-PWM Upp = 2.8 Volts, (b) PSTM-PWM Upp = 7 Volts, (c) PSPWMHI, (d) PS-PWM, (e) LS-PWM. The mark on each figure corresponds to the centre of the chamber, and its temperature is the numerical value shown in the centre-right.
Electronics 15 01808 g011
Table 1. Comparative table of the EN50160 standard with the techniques M = 7 and currents obtained from the experiment (rated voltage: 230 V).
Harm.EN50160
(%)
LS-PWM
V(%)/(mA)
PS-PWM
V(%)/(mA)
PS-PWMHI
V(%)/(mA)
PSTM-PWM Upp = 2.8 V
V(%)/(mA)
PSTM_PWM
Upp = 7.0 V
V(%)/(mA)
0 0.000.00/0.000.000.000.00
1 100/1620100/1620100/1620100/1620100/1620
22.00/0.000/0.000/0.000/0.000.01/0.00
35.03.79/61.390.19/0.310.03/0.550.06/0.960.13/2.70
41.00/00/00/00/00/0
56.03.44/55.710.07/1.200.17/2.760.82/13.271.63/26.38
60.50/00/00/00/00/0
75.04.20/67.970.18/2.850.01/0.164.12/66.794.00/64.83
80.50/00/00/00.01/0.10.01/0.08
91.53.83/62.090.04/0.600.26/4.210.07/1.200.17/2.69
100.50/00/00/00/00/0
113.56.66/107.780.11/1.700.21/3.351.66/26.831.74/28.21
120.50/00/00/00/00/0
133.03.68/59.580.03/0.490.03/0.490.74/11.940.78/12.67
140.50/00/00/00/00/0
150.51.72/27.900.05/0.833.15/50.960.07/1.130.28/4.60
160.50/00/00/00/00/0
172.04.13/66.850.20/3.185.02/81.361.35/21.831.56/25.31
180.50/00/00/00/00/0
191.50.16/2.590.16/2.610.03/0.490.11/1.750.34/5.46
200.50/00/00/00/00/0
210.54.88/79.015.02/81.294.50/72.920.05/0.780.43/0.70
220.50/00/00/00/00/0
231.51.72/27.7911.77/190.72.90/46.991.01/16.321.29/20.90
240.50/00/00/00/00/0
251.54.76/77.140.09/1.460.17/2.760.41/6.680.63/10.16
THD25 (%)8.013.6212.838.114.895.59
Fund. Value RMS (V)
(DC-LINK: 100 V)
250.51243.95281.43221.32295.57
Table 2. Service life of the transformer depending on different techniques.
LS-PWMPS-PWMPS-PWMHIPSTM-PWM
Upp = 2.8 V
PSTM_PWM
Upp = 7.0 V
HST112.7111.3109.8107.8105.9
RVF5.464.653.913.102.49
Useful life (years)14.5415.3516.0916.9017.51
Table 3. Transformer power losses PEC, PNL, Ptotal and PTOTAL/IRMS ratio as a function of the applied technique (W).
LS-PWMPS-PWMPS-PWMHIPSTM-PWM
Upp = 2.8 V
PSTM_PWM
Upp = 7.0 V
PEC (W)3.8659.6693.3691.2631.335
PNL (W)0.7211.4520.3940.0420.057
PTOTAL (W)4.58611.1213.7631.3051.392
PTOTAL/IRMS (W/A)2.8306.9192.3220.8050.859
Disclaimer/Publisher’s Note: The statements, opinions and data contained in all publications are solely those of the individual author(s) and contributor(s) and not of MDPI and/or the editor(s). MDPI and/or the editor(s) disclaim responsibility for any injury to people or property resulting from any ideas, methods, instructions or products referred to in the content.