1. Introduction
In the context of the accelerating global energy transition and the deepening implementation of carbon peaking and carbon neutrality goals, regional integrated energy system (RIES) have emerged as key enablers for achieving clean and low-carbon energy development, owing to their advantages in multi-energy complementarity and cascade utilization [
1,
2,
3]. However, as RIESs continue to evolve and electricity market mechanisms grow increasingly complex, a critical challenge has emerged in coordinating the conflicting interests of various internal stakeholders and ensuring equitable benefit distribution across all parties involved in system scheduling [
4].
Game theory has proven to be an effective tool for coordinating dynamic interactions among multiple stakeholders in the optimal scheduling of RIES [
5,
6]. For instance, Reference [
7] developed an RIES optimization scheduling model based on a leader–follower game to facilitate interactive decision-making between energy operators and users, thereby increasing mutual benefits; Reference [
8] established a two-level IES optimization scheduling model that accounts for building thermal inertia, using electricity purchase and sale pricing mechanisms to guide building users in optimizing their energy consumption strategies, thereby enhancing system flexibility and promoting the integration of renewable energy; Reference [
9] developed a leader–follower game model based on Stackelberg game theory, designating the operator of a multi-microgrid system as the leader and each microgrid user as a follower. This model fully captures the interplay of interests among multiple entities, achieving coordinated optimization of benefits for both the system and the users. However, the aforementioned studies primarily focus on the game–theoretic relationships between operators and users, making it difficult to fully reflect the complex market environment involving multiple investment entities in integrated energy systems. To address this, Reference [
10] developed a “leader-follower” model for coordinated electricity–heat optimization, with energy suppliers as the leader and CCHP operators and load aggregators as followers. By using dynamic electricity and heat prices to guide optimized operations on both the supply and demand sides, this model achieves a synergistic improvement in the interests of all parties; Reference [
11] further proposed a master–slave game model comprising IES operators, electric vehicle clusters, and user aggregators. By coordinating multi-party interactive decision-making and the orderly scheduling of electric vehicles, this model improved the operational efficiency of the integrated energy system. While these studies have significantly advanced the modeling of stakeholder interactions and the optimization of multi-agent scheduling, they remain primarily focused on economic objectives, they inadequately consider carbon emission constraints in RIES operations, overlook the green adjustment capabilities of various entities, and fail to adequately balance both economic and low-carbon dual objectives.
Currently, domestic and international scholars primarily explore the low-carbon operation of RIESs from two dimensions: low-carbon technologies and market-based mechanisms [
12]. From the perspective of low-carbon technologies, hydrogen energy, as a low-carbon, clean secondary green energy source, holds broad application prospects in optimizing RIES operations. Power-to-gas (P2G) technology provides an effective pathway for converting surplus electricity into hydrogen and synthetic natural gas. Reference [
13] utilizes renewable energy to synergistically produce hydrogen via electrolysis, enabling flexible integration of wind and solar power. Reference [
14] refines the P2G process by segmenting it into electricity-to-hydrogen and hydrogen-to-methane stages, further enhancing P2G operational efficiency and wind power integration capacity. Reference [
15] established a synergistic model coupling P2G with carbon capture and storage (CCS), demonstrating that their combined operation promotes wind power integration while reducing carbon emissions. Although the aforementioned literature considers the flexible and low-carbon characteristics of P2G in RIES scheduling, most studies focus solely on optimizing equipment and technology. They have yet to deeply integrate P2G operational characteristics with market-based low-carbon mechanisms such as carbon trading (CET) and green certificate trading (GCT). This hinders the formation of synergistic technological and market drivers under dual economic and low-carbon objectives, leaving the optimization potential of RIES low-carbon economic scheduling to be further explored.
CET and GCT are market-based mechanisms that facilitate efficient resource allocation and effectively reduce system-wide carbon emissions [
16]. These mechanisms have been extensively studied in the context of RIES operational optimization. For instance, Reference [
17] incorporates a carbon trading cost model into IES optimization scheduling, establishing a low-carbon economic scheduling model for combined heat and power systems by comprehensively considering both carbon trading costs and system energy supply costs. Reference [
18] implements a tiered carbon trading price structure and compares it with traditional carbon trading mechanisms, highlighting the advantages of the tiered carbon trading mechanism in carbon emission reduction. Reference [
19] proposed an energy hub model for electricity–heat–carbon integrated systems, incorporating a seasonal carbon trading mechanism and a shared electric–carbon quota method to optimize carbon allowance allocation and stepwise carbon pricing. Reference [
20] analyzed the feasibility of simultaneously integrating CET and GCT into RIESs and established a joint carbon–green certificate trading framework. Reference [
21] developed an IES operational optimization model by accounting for green certificate trading, carbon emissions, and related factors, and analyzed the effects of renewable energy consumption responsibility weight and CET pricing on system performance. References [
22,
23] introduced a joint CET–GCT trading mechanism based on the mutual recognition of carbon allowances and green certificates within an IES, and compared the system’s low-carbon performance and economic benefits before and after integration. The results demonstrate that the coordinated CET–GCT trading mechanism achieves superior emission reduction performance and economic benefits, effectively exploiting the complementary characteristics and synergistic effects of the two mechanisms, thereby further enhancing the economic efficiency and low-carbon performance of the RIES.
In summary, existing research has yet to address the coordinated optimization of multi-agent integrated energy systems with hydrogen, while simultaneously considering the coupling of green certificate and carbon trading. Most studies focus only on operator–user interactions or a single low-carbon market, failing to integrate hydrogen utilization into the carbon–green certificate game framework. Furthermore, they rarely treat EGO equipped with hydrogen facilities as independent game entities, making it difficult to reflect the actual multi-agent interest interactions. Given this, this paper proposes a multi-agent optimization scheduling strategy for hydrogen-based integrated energy systems that accounts for the synergy between CET and GCT. First, a leader–follower game model is constructed with the EMO as the leader and EGO and users as followers, fully considering the interests of all agents to characterize the strategic interactions among different participants in energy scheduling. Second, a multi-stage hydrogen utilization model is introduced to enhance comprehensive hydrogen efficiency, integrating the interactive coordination mechanism between carbon and green certificate trading into the game framework. Subsequently, the constructed game model is solved using an improved Ivy algorithm (IVYA) combined with the CPLEX solver. Finally, the proposed method’s effectiveness is validated through comparative analysis of multiple scenarios designed via computational examples.
4. Game–Theoretic Optimization Model and Solution Algorithm for RIES
4.1. Game–Theoretic Optimization Model
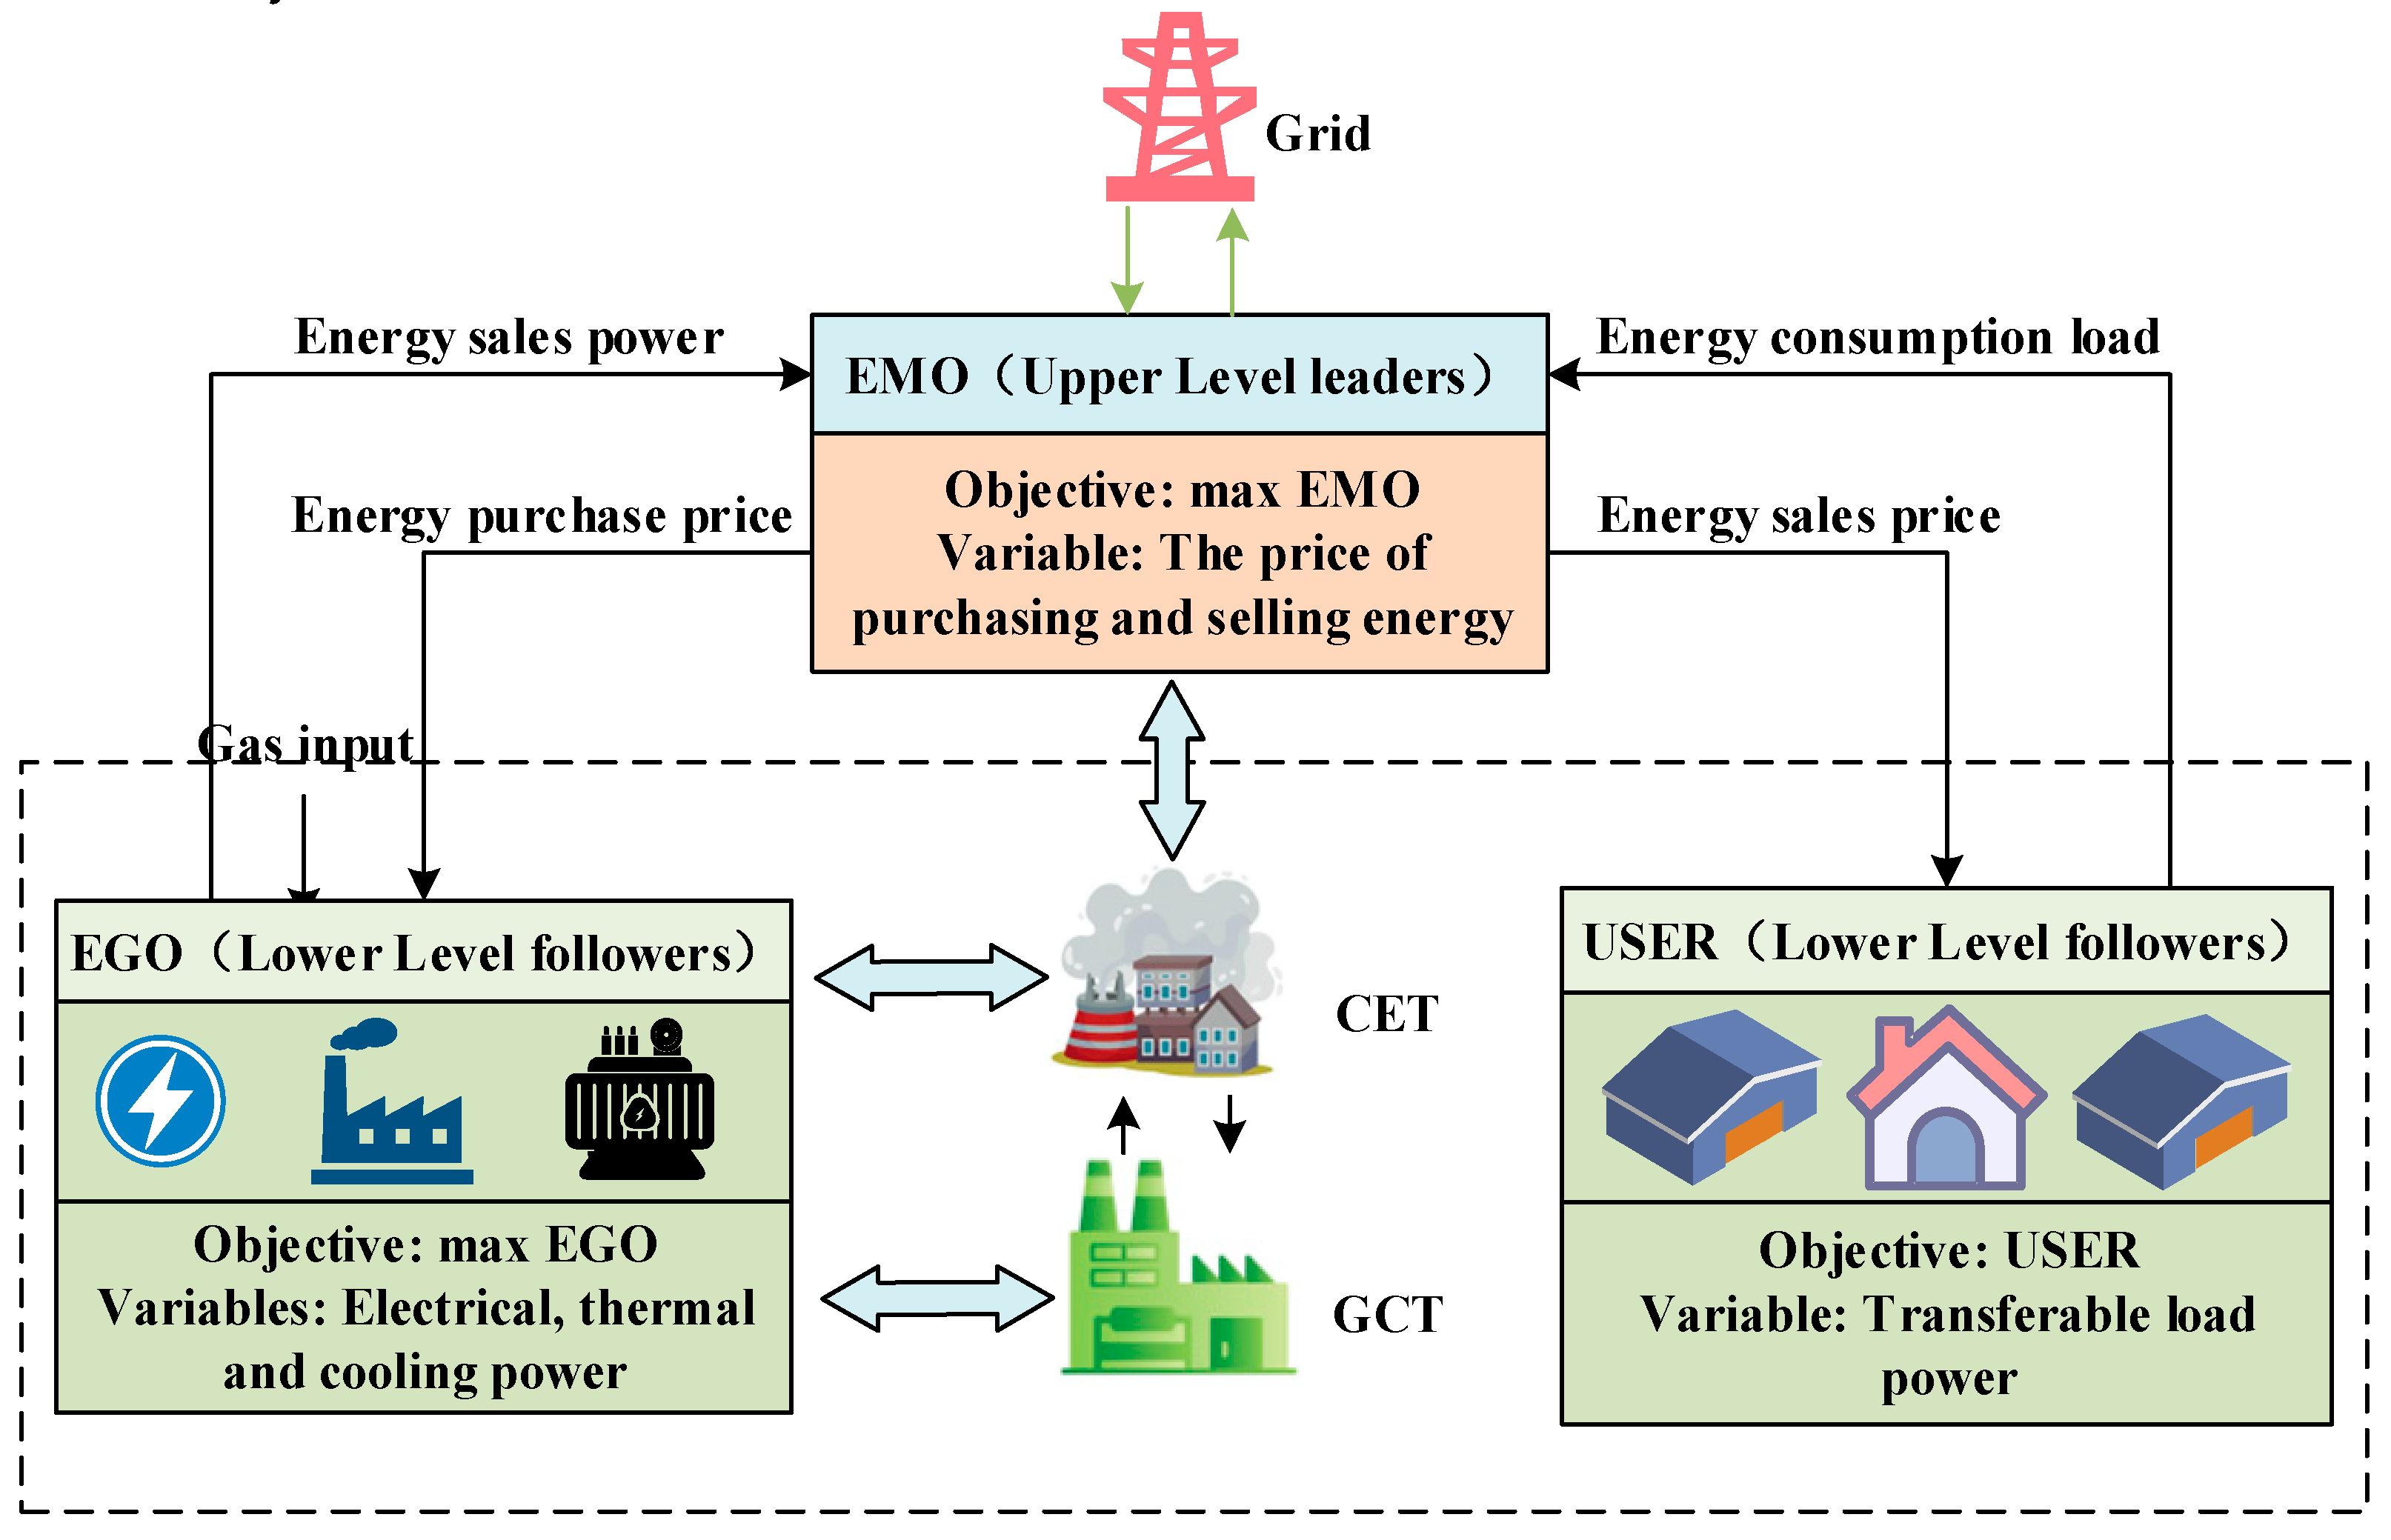
The EGO and USER optimize their strategies in response to the pricing strategy set by the energy supplier. Their optimization outcomes, in turn, influence the supplier’s pricing decisions, ultimately converging to a Stackelberg equilibrium. The resulting leader–multiple-follower Stackelberg game model is formulated as follows:
The model comprises three components:
(1) the set of participants, representing all involved stakeholders;
(2) the set of strategies, corresponding to the optimization strategies adopted by each stakeholder;
(3) the set of utilities, corresponding to the objective functions of each stakeholder.
A Stackelberg equilibrium is achieved when no stakeholder can further improve their utility through unilateral deviation from their current strategy. Under this condition, the equilibrium solution must satisfy the following:
A unique Stackelberg equilibrium exists when the leader–follower game model satisfies the following conditions:
(1) The strategy sets of both the leader and followers are non-empty, compact, and convex;
(2) Given the leader’s strategy, all followers have a unique optimal solution;
(3) Given the followers’ strategies, the leader has a unique optimal solution.
According to the RIES model, each agent’s strategy is constrained by multiple conditions. The leader’s policy set is defined by constraints such as price boundaries, average price constraints, and energy balance, ensuring the existence of feasible solutions. The follower’s policy set is similarly constrained by linear constraints including energy supply and load aggregation. Since these constraints are all convex functions and non-empty, both the leader’s and follower’s policy sets constitute non-empty, compact, convex sets.
Once the leader’s strategy is specified, the subordinate followers solve their respective optimization problems. First, at each time scale, the first-order partial derivatives of the load aggregator’s objective function with respect to
,
and
are calculated, yielding:
Setting the first-order partial derivative of the above equation equal to zero yields:
Then, taking the second-order partial derivatives of the objective function with respect to
,
and
are obtained as follows:
Since the energy consumption preference coefficients are generally positive, the second-order partial derivatives are all less than zero here. Therefore,
,
and
are the maximum points of the user objective function. Combined with the interval constraints on the optimization variables, the optimal solution values are:
Therefore, once the selling price of EMO is specified, a unique optimal solution exists for users. Similarly, the proof for the unique optimal solution of EGO follows analogous reasoning and will not be repeated here.
Substituting the optimization strategies for the follower’s supply side and user side into the leader EMO operator’s objective function yields a Hessian matrix that is negative definite. This indicates the existence of a maximum point. Consequently, when the follower’s strategy set is specified, the leader’s optimal solution is both existent and unique.
4.2. Stackelberg Game-Based Solution Method
In the constructed Stackelberg game model, the upper-level problem is dominated by the EMO, whose decision variables include the time-varying electricity, heating, and cooling purchase and selling price vectors over the entire scheduling horizon. The upper-level problem is solved using the IVYA [
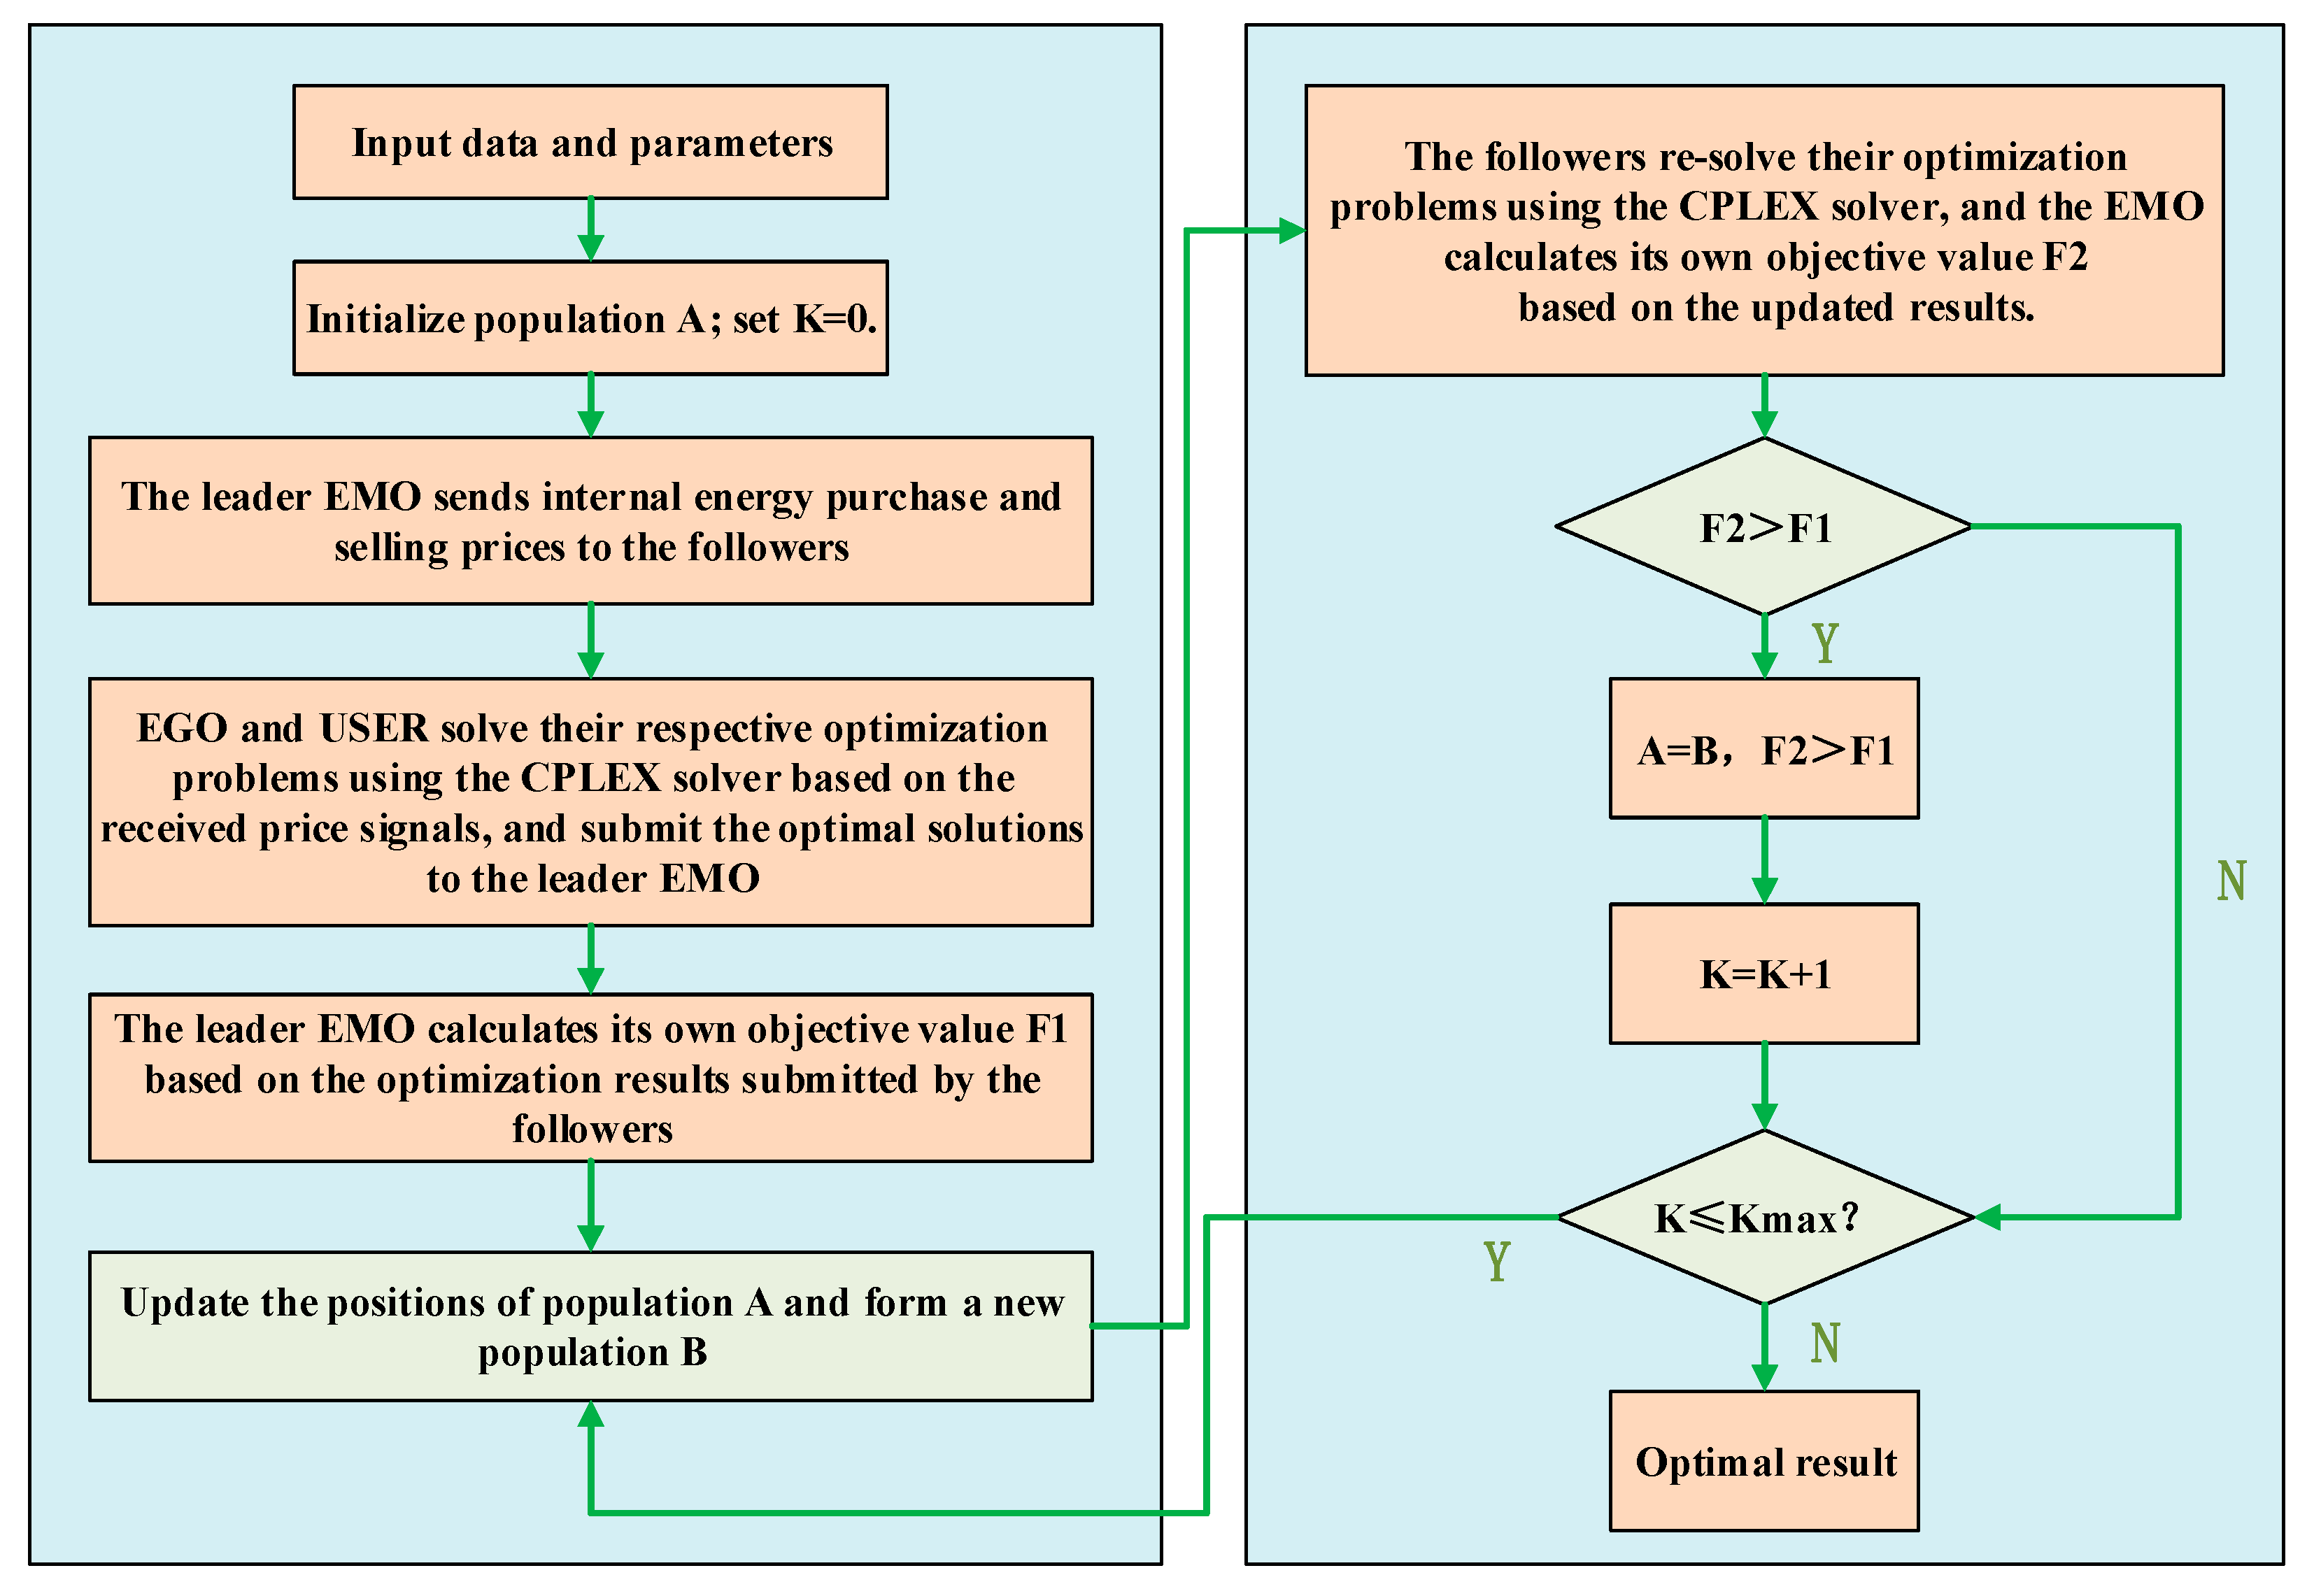
27]. The lower-level problem characterizes the optimal operational responses of the EGO and end users, driven by the energy price signals set by the EMO and following the principle of individual profit maximization. Specifically, during each iteration, IVYA generates candidate price vectors, which are transmitted to the lower-level optimization model. Given these price signals, CPLEX determines the optimal operational responses of the EGO and end users by solving a deterministic dispatch problem. The obtained economic outcomes are then fed back as the fitness values of the corresponding pricing strategies. Through this iterative interaction, IVYA and CPLEX form a closed-loop “price–response–fitness” coordination mechanism.
Compared with traditional gradient-based or KKT reformulation methods, the integration of IVYA with CPLEX provides a more convenient and modular solution framework. KKT-based approaches typically require Lagrangian transformation and the derivation of complementary slackness conditions to convert the bi-level model into a single-level program, which increases modeling complexity and programming burden, particularly when mixed-integer variables or nonlinear constraints are involved. In contrast, the IVYA–CPLEX collaborative mechanism directly maintains the original bi-level structure, where IVYA performs outer-layer nonlinear search and CPLEX efficiently solves the inner-layer deterministic dispatch problem. This decomposition strategy simplifies implementation, enhances computational flexibility, and improves robustness in handling complex multi-agent energy systems.
To improve convergence speed and solution accuracy, several enhancement strategies are incorporated into IVYA.
Chaotic opposition-based learning is adopted during population initialization to increase solution diversity and enhance global coverage of the search space, thereby accelerating early-stage convergence and reducing premature convergence risk. During the population evolution process, Cauchy flight and tangent flight operators are introduced to dynamically balance global exploration and local exploitation. The long-tailed property of Cauchy flight enables occasional large jumps to escape local optima, while tangent flight strengthens local refinement around promising regions. In the later iteration stage, differential evolution strategies are integrated to enhance local search precision and improve convergence stability. These improvements collectively accelerate convergence while maintaining high solution quality, making IVYA suitable for nonlinear pricing strategy optimization in multi-agent integrated energy systems. The parameter settings of the IVYA are as follows: population size of 50 and a maximum of 500 iterations. The detailed game-solving procedure and corresponding flowchart are illustrated in
Figure 3.
5. Simulation Analysis
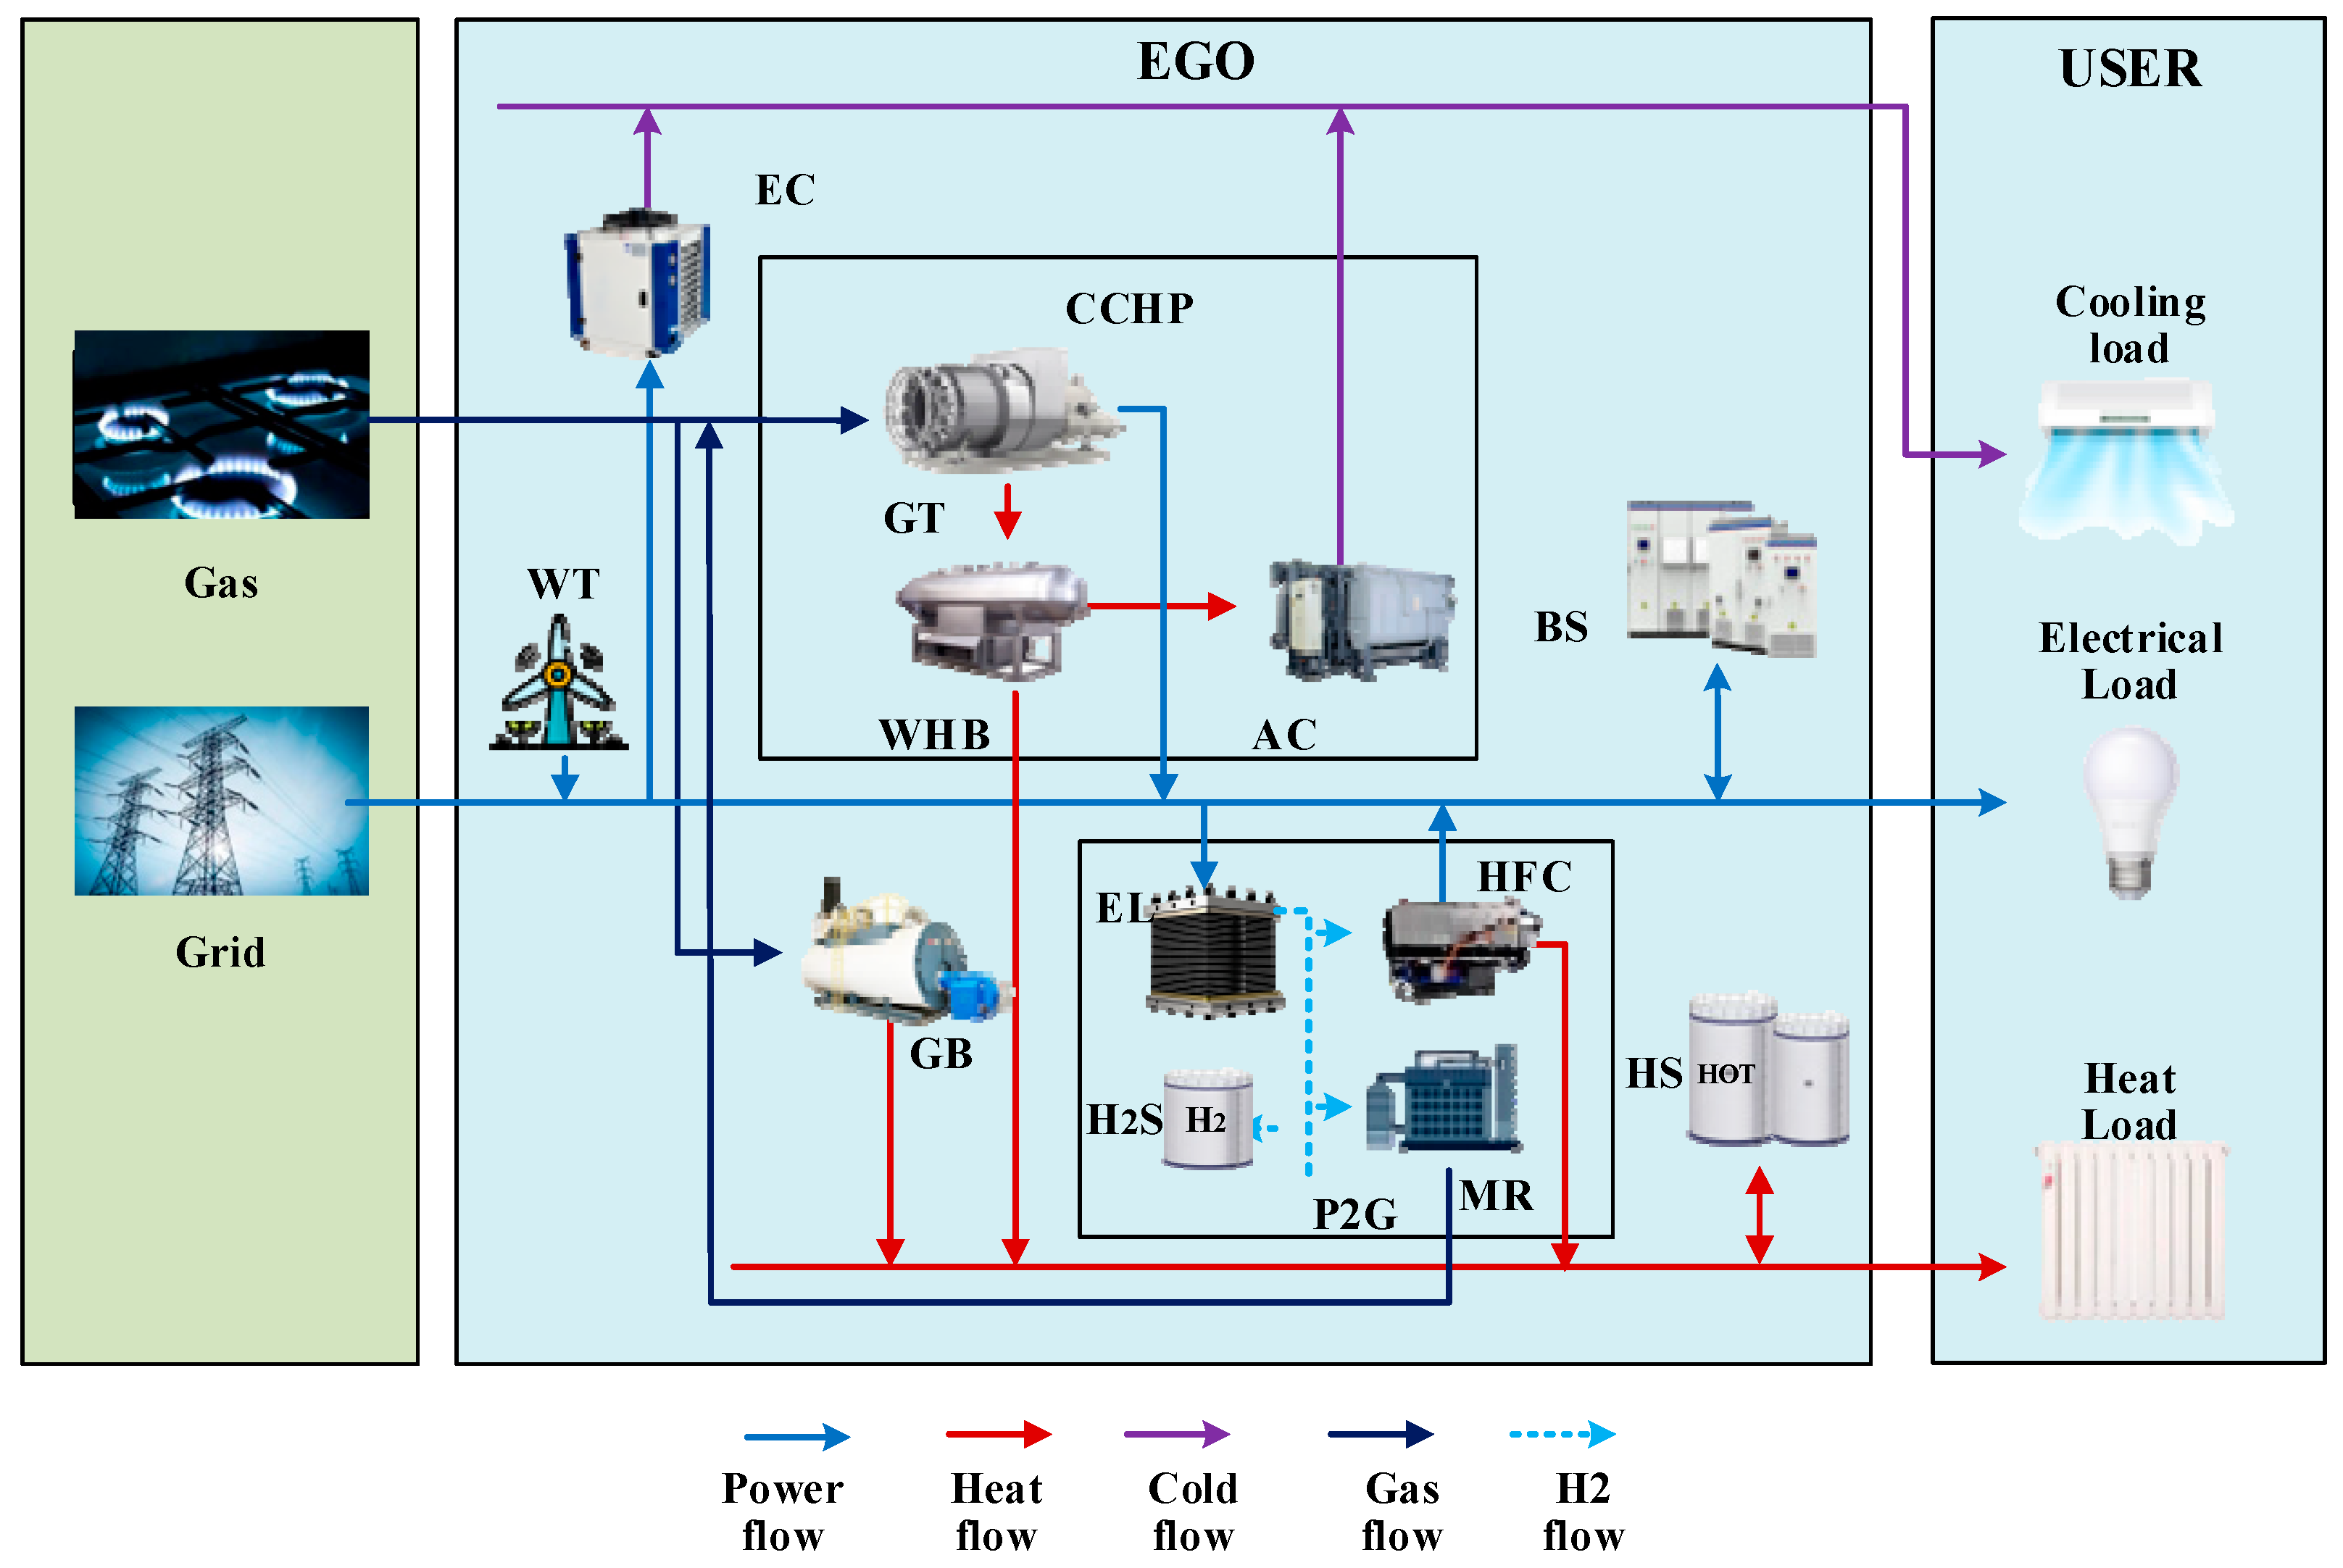
A case study is conducted based on the RIES configuration illustrated in
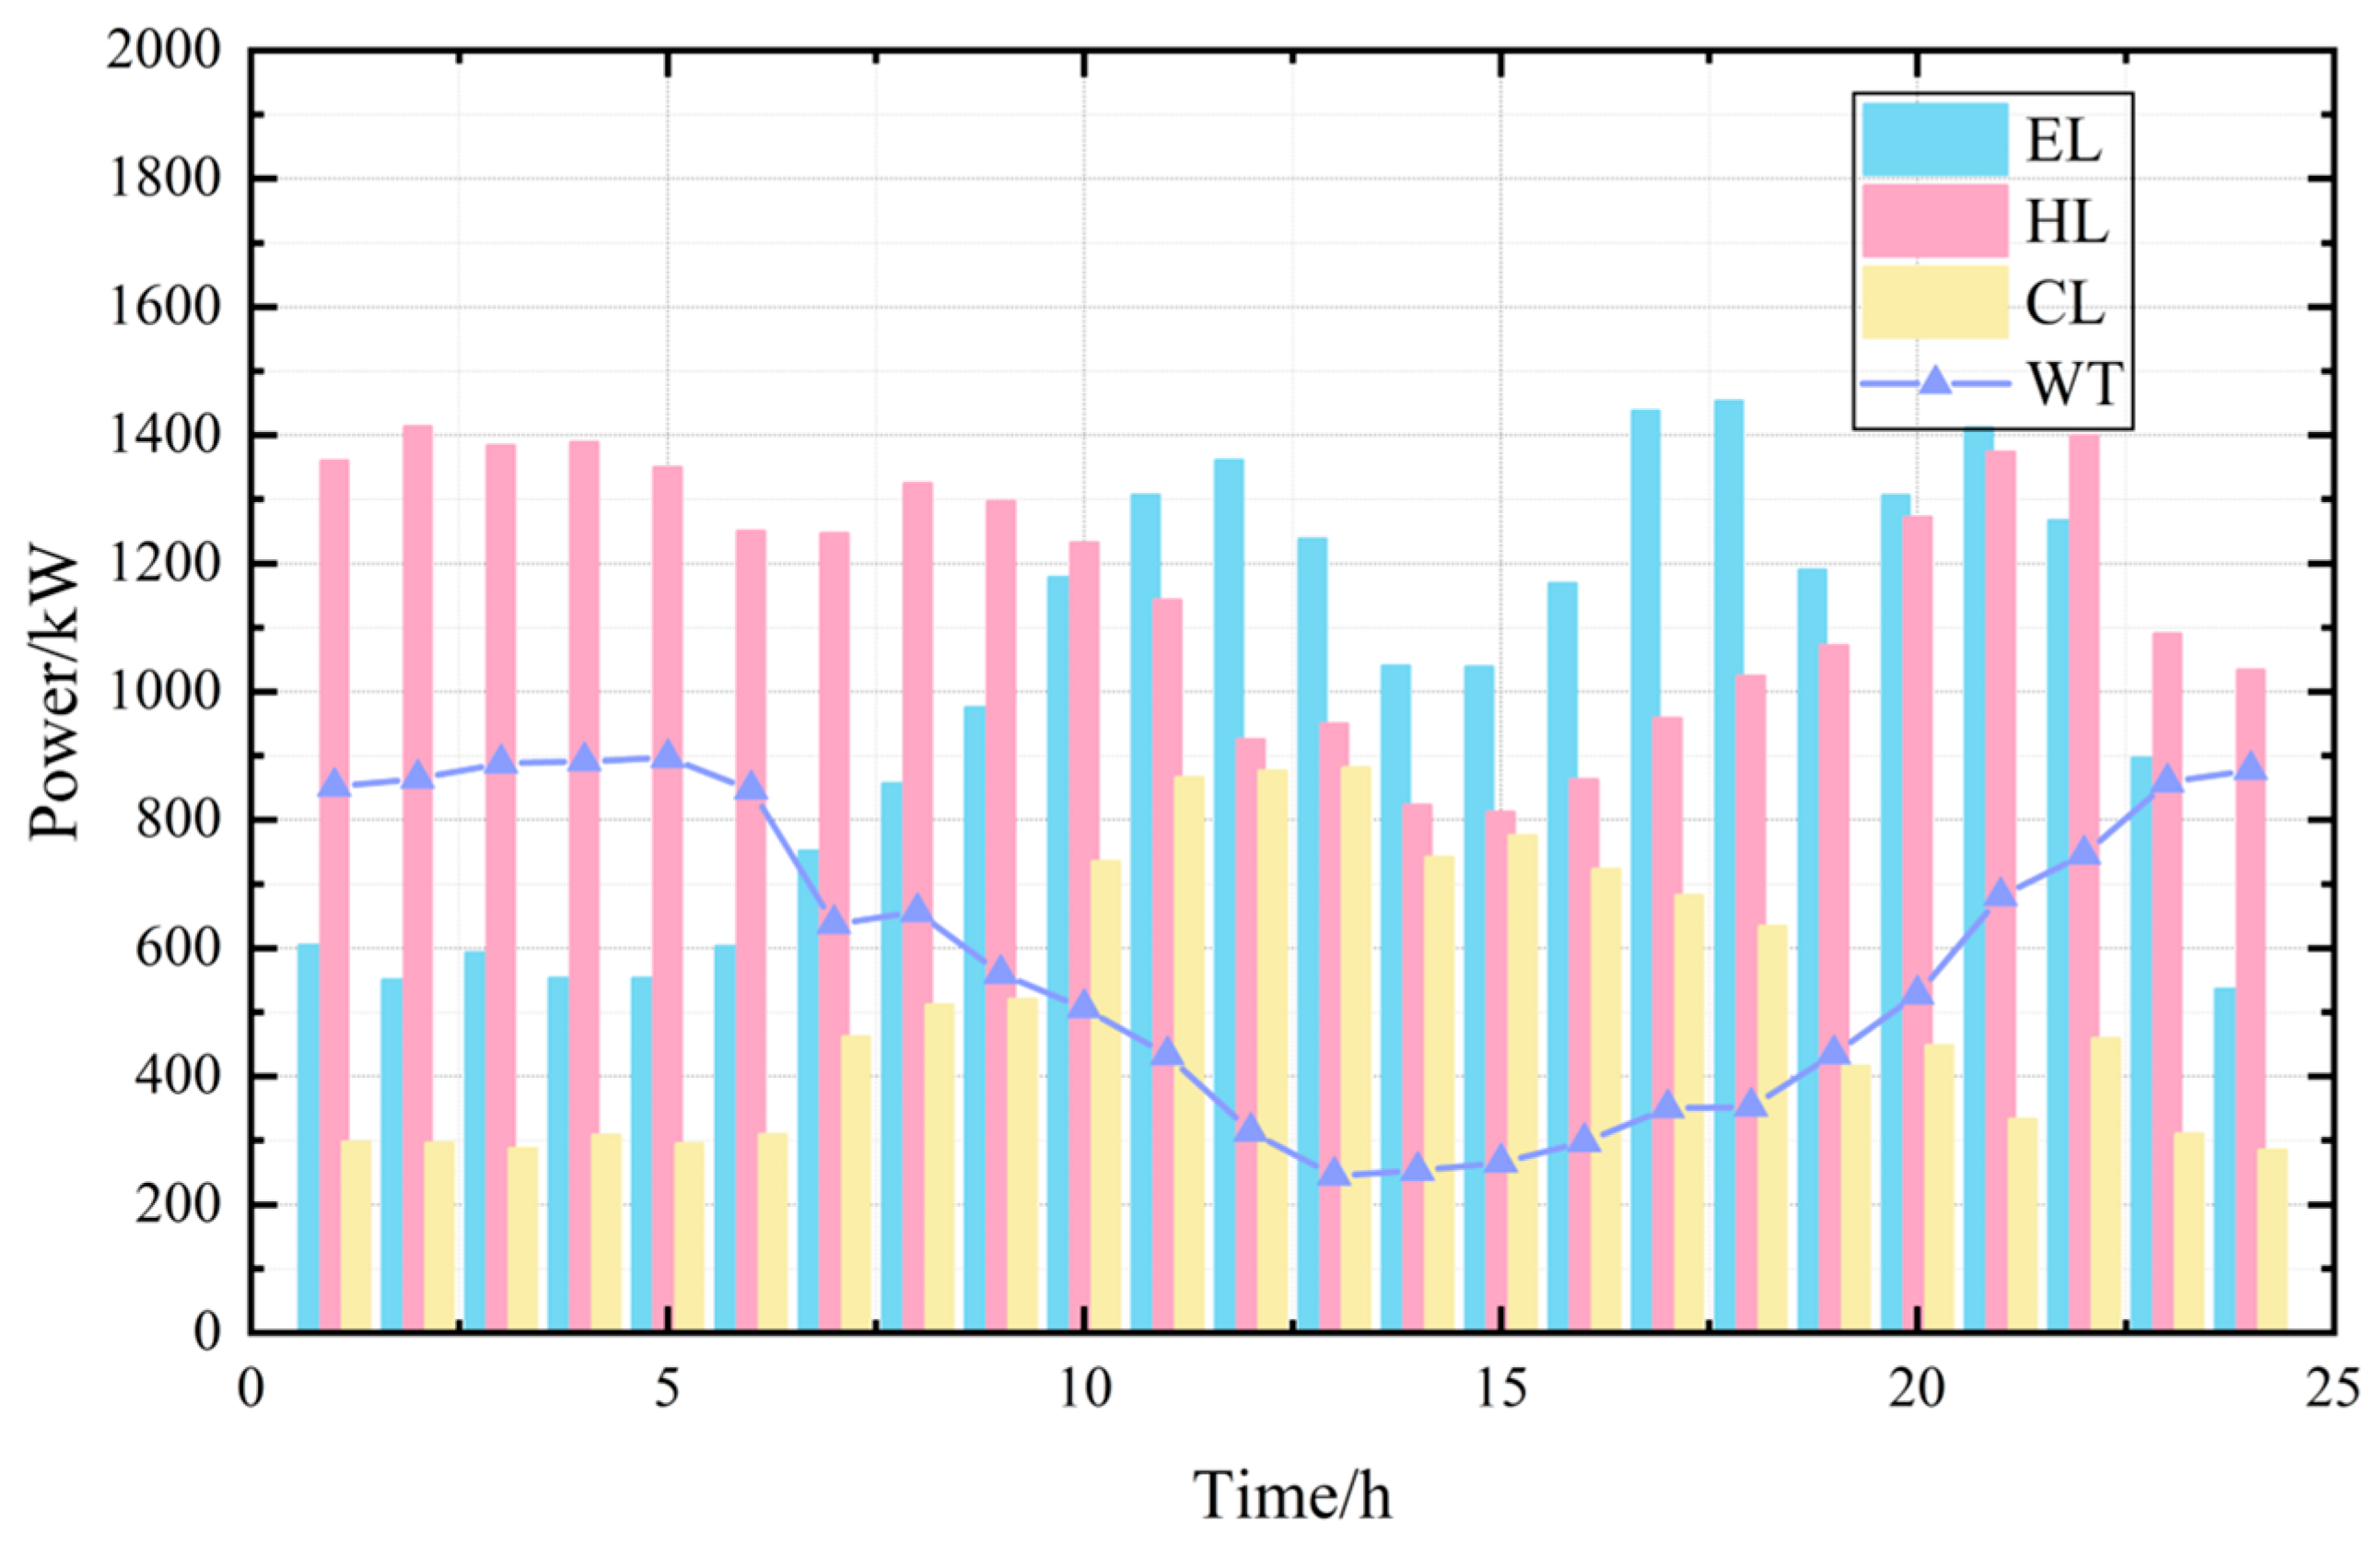
Figure 1. The forecast profiles of wind, along with the predicted electric, thermal, and cooling loads within the system, are presented in
Figure 4. The adjustable portions of the users’ electric, thermal, and cooling loads are assumed to be 20%, 10%, and 10% of the corresponding total loads, respectively. The preference coefficients for electricity, heat, and cooling, namely
,
,
,
are set to 1.4, 0.0009, 1.1, and 0.001, respectively. The carbon trading price is set to 0.25 CNY/kg. The remaining carbon trading parameters follow those reported in [
28]. The green certificate trading price is set to 0.1 CNY/kWh. The models and constraints of each device in EGO refer to Refs. [
29,
30], and the parameters of each device are shown in
Table 1. The economic parameters of RIES are shown in
Table 2. The scheduling horizon is 24 h, with an optimization time interval of 1 h.
5.1. Analysis of Stackelberg Game Equilibrium
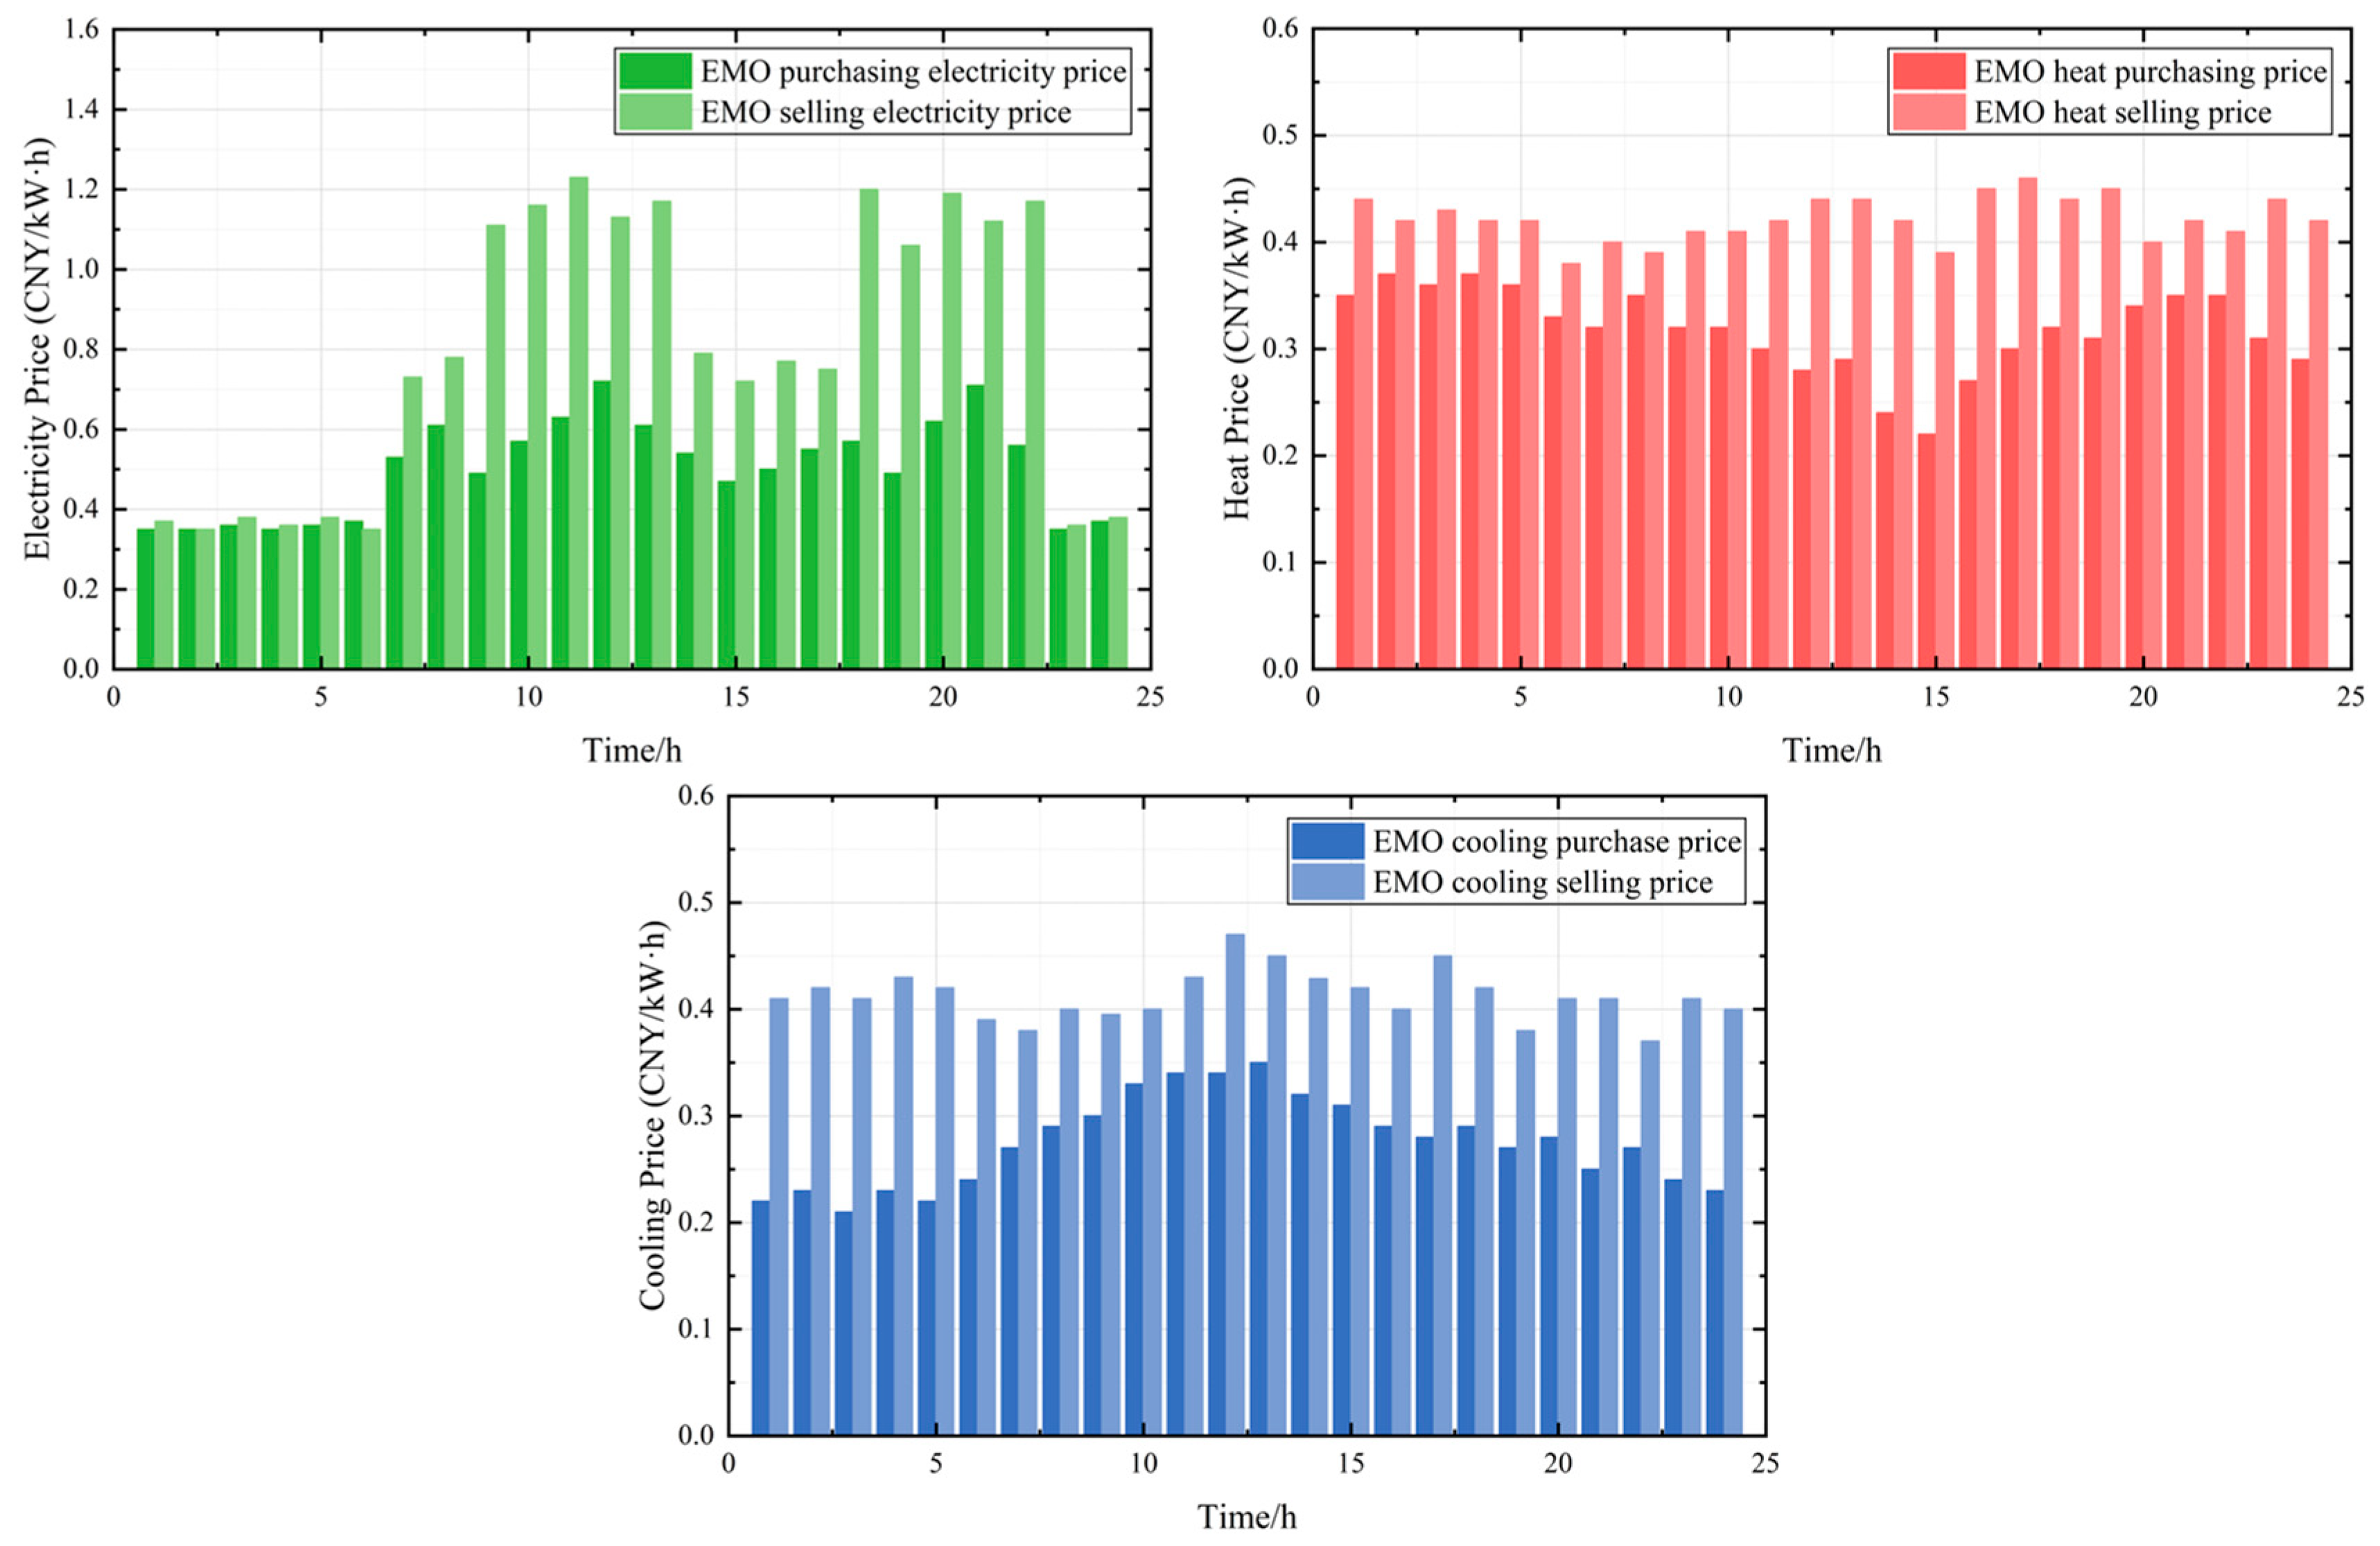
The post-game pricing strategy of the EMO is illustrated in
Figure 5. Taking electricity pricing as an example, the real-time retail electricity pricing strategy of the EMO closely aligns with the time-of-use tariffs imposed by the upstream power grid. By increasing retail prices during high-demand periods, the EMO effectively guides users toward off-peak consumption, thereby mitigating system load pressure and maintaining operational stability. Lower prices are offered during 1:00–6:00 and 22:00–24:00 to encourage the shifting of flexible loads, achieving peak shaving and valley filling. Furthermore, the real-time electricity prices are consistently set no higher than the corresponding time-of-use tariffs, which enhances the competitiveness of the EMO’s retail strategy. The same analytical framework applies to real-time heating and cooling prices and is therefore not discussed further.
5.2. Comparative Analysis of Operational Results
To evaluate the effectiveness of the proposed strategy, four dispatch scenarios are considered for comparative analysis.
Scenario 1: A baseline IES model is established, considering the coupled and complementary optimization of electricity, heating, and cooling demands.
Scenario 2: Based on Scenario 1, a hydrogen energy multi-utilization model is incorporated by introducing high-efficiency clean hydrogen energy on the supply side and integrating IDR to enable source–load interaction.
Scenario 3: Based on Scenario 2, the fixed carbon allowance price in the conventional CET market is replaced with a tiered pricing scheme, thereby considering a ladder-type CET mechanism.
Scenario 4: Based on Scenario 3, the GCT mechanism is further introduced, allowing for joint GCT–CET trading.
As shown in
Table 3, in Scenario 1, the optimization scheduling process did not incorporate the hydrogen multi-use model. Wind power consumption levels remained low, and the optimization objective focused solely on operational profits under traditional carbon trading costs. This constrained the output incentives of CHP and GB units within the EGO, while the EMO incurred higher external power purchases, consequently impacting the profitability of both the EMO and EGO. Because the carbon trading market adopts a fixed pricing mechanism, the marginal carbon cost signal remains relatively weak, and dispatch decisions are therefore dominated by short-term economic benefits rather than emission reduction considerations. As a result, conventional fossil-fuel units are prioritized during operation, limiting renewable energy utilization and leading to relatively higher system carbon emissions. This reflects the inherent trade-off between profit maximization and low-carbon operation under insufficient carbon price incentives.
Compared to Scenario 1, Scenario 2 increased EMO and EGO revenues by 9.86% and 12.04%, respectively. This improvement stems from the introduction of P2G, which enables EL to further absorb wind power for hydrogen production, supplying HFC and hydrogen storage. HFC utilizes surplus wind power for combined heat and power generation, thereby alleviating the energy supply pressure on CHP and GB units while reducing fuel costs. Additionally, the energy conversion process generates no carbon emissions, helping EGO shoulder part of the carbon emission burden. Simultaneously, the introduction of the diversified hydrogen utilization model significantly enhances the system’s wind power absorption capacity, reduces curtailment levels, and improves the system’s wind power absorption rate. Furthermore, EMO can procure sufficient energy from EGO to achieve supply–demand balance, reducing both the cost of purchasing electricity at high prices from the upper grid and penalties for insufficient energy supply, thereby significantly increasing profits. Notably, EGO’s carbon trading costs slightly decreased. This is because the introduction of P2G enables methane reactors to absorb part of the carbon dioxide, and EGO prioritizes HFC for energy supply during scheduling. Consequently, both actual carbon emissions and carbon emission quotas are reduced to some extent, leading to a slight decrease in EGO’s carbon trading costs. Through the integration of hydrogen energy pathways, surplus renewable electricity can be converted into hydrogen and reused in multi-energy conversion processes, effectively enhancing wind power absorption and reducing curtailment. This technological coupling partially decouples economic performance from carbon emissions, allowing the system to simultaneously improve renewable utilization and operational profitability, thereby mitigating the profit–emission trade-off observed in Scenario 1.
Compared to Scenario 2, Scenario 3 increases EGO’s carbon trading revenue and total revenue by 83.07% and 1.24%, respectively, while reducing the system’s total carbon emissions by 1.92%. This occurs because the tiered carbon pricing mechanism strengthens carbon emission cost constraints, imposing higher marginal carbon costs on high-emission units. Consequently, EGO increases the output of certain units during dispatch to achieve optimal carbon trading revenue. Notably, the tiered carbon pricing mechanism further enhances the output revenue of EGO’s conventional units from an economic perspective. Compared to Scenario 2, the system reduces the priority given to wind power consumption during certain periods, leading to a noticeable decline in wind power absorption rates. Nevertheless, with the overall increase in EGO output levels, EMO effectively reduced purchased electricity through optimized energy management strategies. Since purchased electricity constitutes EMO’s primary carbon emission source, its carbon emissions decreased significantly, ultimately driving a further increase in the system’s total revenue. This indicates that the ladder-type CET reshapes dispatch incentives through stronger marginal carbon costs, shifting system operation toward a carbon-cost-sensitive profit optimization mode. Under this mechanism, economic benefits and emission reduction objectives are dynamically balanced, and a temporary trade-off may emerge between maximizing carbon trading revenue and maintaining renewable energy integration.
In Scenario 4, after introducing the green certificate trading mechanism, EGO’s revenue increased by 24.97% compared to Scenario 3. This occurs because EGO incorporates both carbon market costs and green certificate market revenues into its optimization objectives during operational decision-making. When EGO supplies renewable energy generation, it not only gains additional revenue from the green certificate market but can also convert the mandatory quota portion of green certificates into carbon emission allowances under the GCT–CET equivalence principle for participation in carbon market trading. Consequently, the marginal economic return of renewable generation increases significantly, prompting the system to prioritize wind power dispatch. This effectively reduces curtailment levels and improves the system’s wind power absorption rate. Simultaneously, the GCT–CET trading mechanism enhances the low-carbon operation incentives for CHP and GB units, substantially boosting EGO’s overall revenue. Compared to Scenario 3, Scenario 4 increases the system’s total revenue by 4.97% and reduces total carbon emissions by 0.14%. By enabling the joint circulation of carbon allowances and green certificates, the proposed GCT–CET mechanism internalizes the environmental value of renewable generation into economic decision-making. This mechanism significantly strengthens the marginal benefits of renewable energy and aligns economic incentives with low-carbon dispatch, thereby transforming the traditional trade-off between carbon reduction and profitability into a coordinated optimization process.
Overall, the transition from Scenario 1 to Scenario 4 reveals a progressive evolution in the economic–carbon interaction mechanism of the integrated energy system. Scenario 1 reflects a profit-oriented dispatch pattern under weak carbon market signals. Scenario 2 demonstrates that technological coupling mechanisms can enhance renewable energy utilization and partially alleviate the economic–carbon conflict. Scenario 3 further reshapes operational incentives through stronger carbon price signals, leading to a carbon-cost-sensitive dispatch strategy. Finally, Scenario 4 integrates carbon and green certificate markets, effectively internalizing environmental externalities and aligning economic incentives with low-carbon objectives. This progression highlights that while technological integration improves system flexibility, coordinated market mechanisms play a crucial role in transforming the traditional trade-off between economic performance and carbon emissions into a coordinated low-carbon optimization framework.
In addition to the scenario-based mechanism analysis, the indicators in
Table 3 further reveal the interactions between system performance and the proposed optimization strategies. As the scenarios evolve, the wind power consumption rate increases from 83.00% in Scenario 1 to 99.29% in Scenario 4, which significantly reduces the wind curtailment cost from 242.05 CNY to 10.07 CNY, indicating that the integration of hydrogen energy pathways and coordinated market mechanisms effectively enhances renewable energy absorption capability. Meanwhile, improvements in internal energy coordination reduce EMO’s reliance on external electricity purchases, leading to a decline in its carbon emissions from 2331.84 kg to 1950.05 kg. Although EGO carbon emissions fluctuate slightly across scenarios, the total system carbon emissions decrease overall, reflecting the effectiveness of the proposed optimization framework in balancing energy supply and emission control. Furthermore, the total system revenue increases from 40,439.38 CNY in Scenario 1 to 45,085.21 CNY in Scenario 4, demonstrating that the combined effects of technological integration and market-based incentives can simultaneously improve renewable energy utilization, reduce carbon emissions, and enhance economic performance.
5.3. Analysis of Supply–Demand Coordination
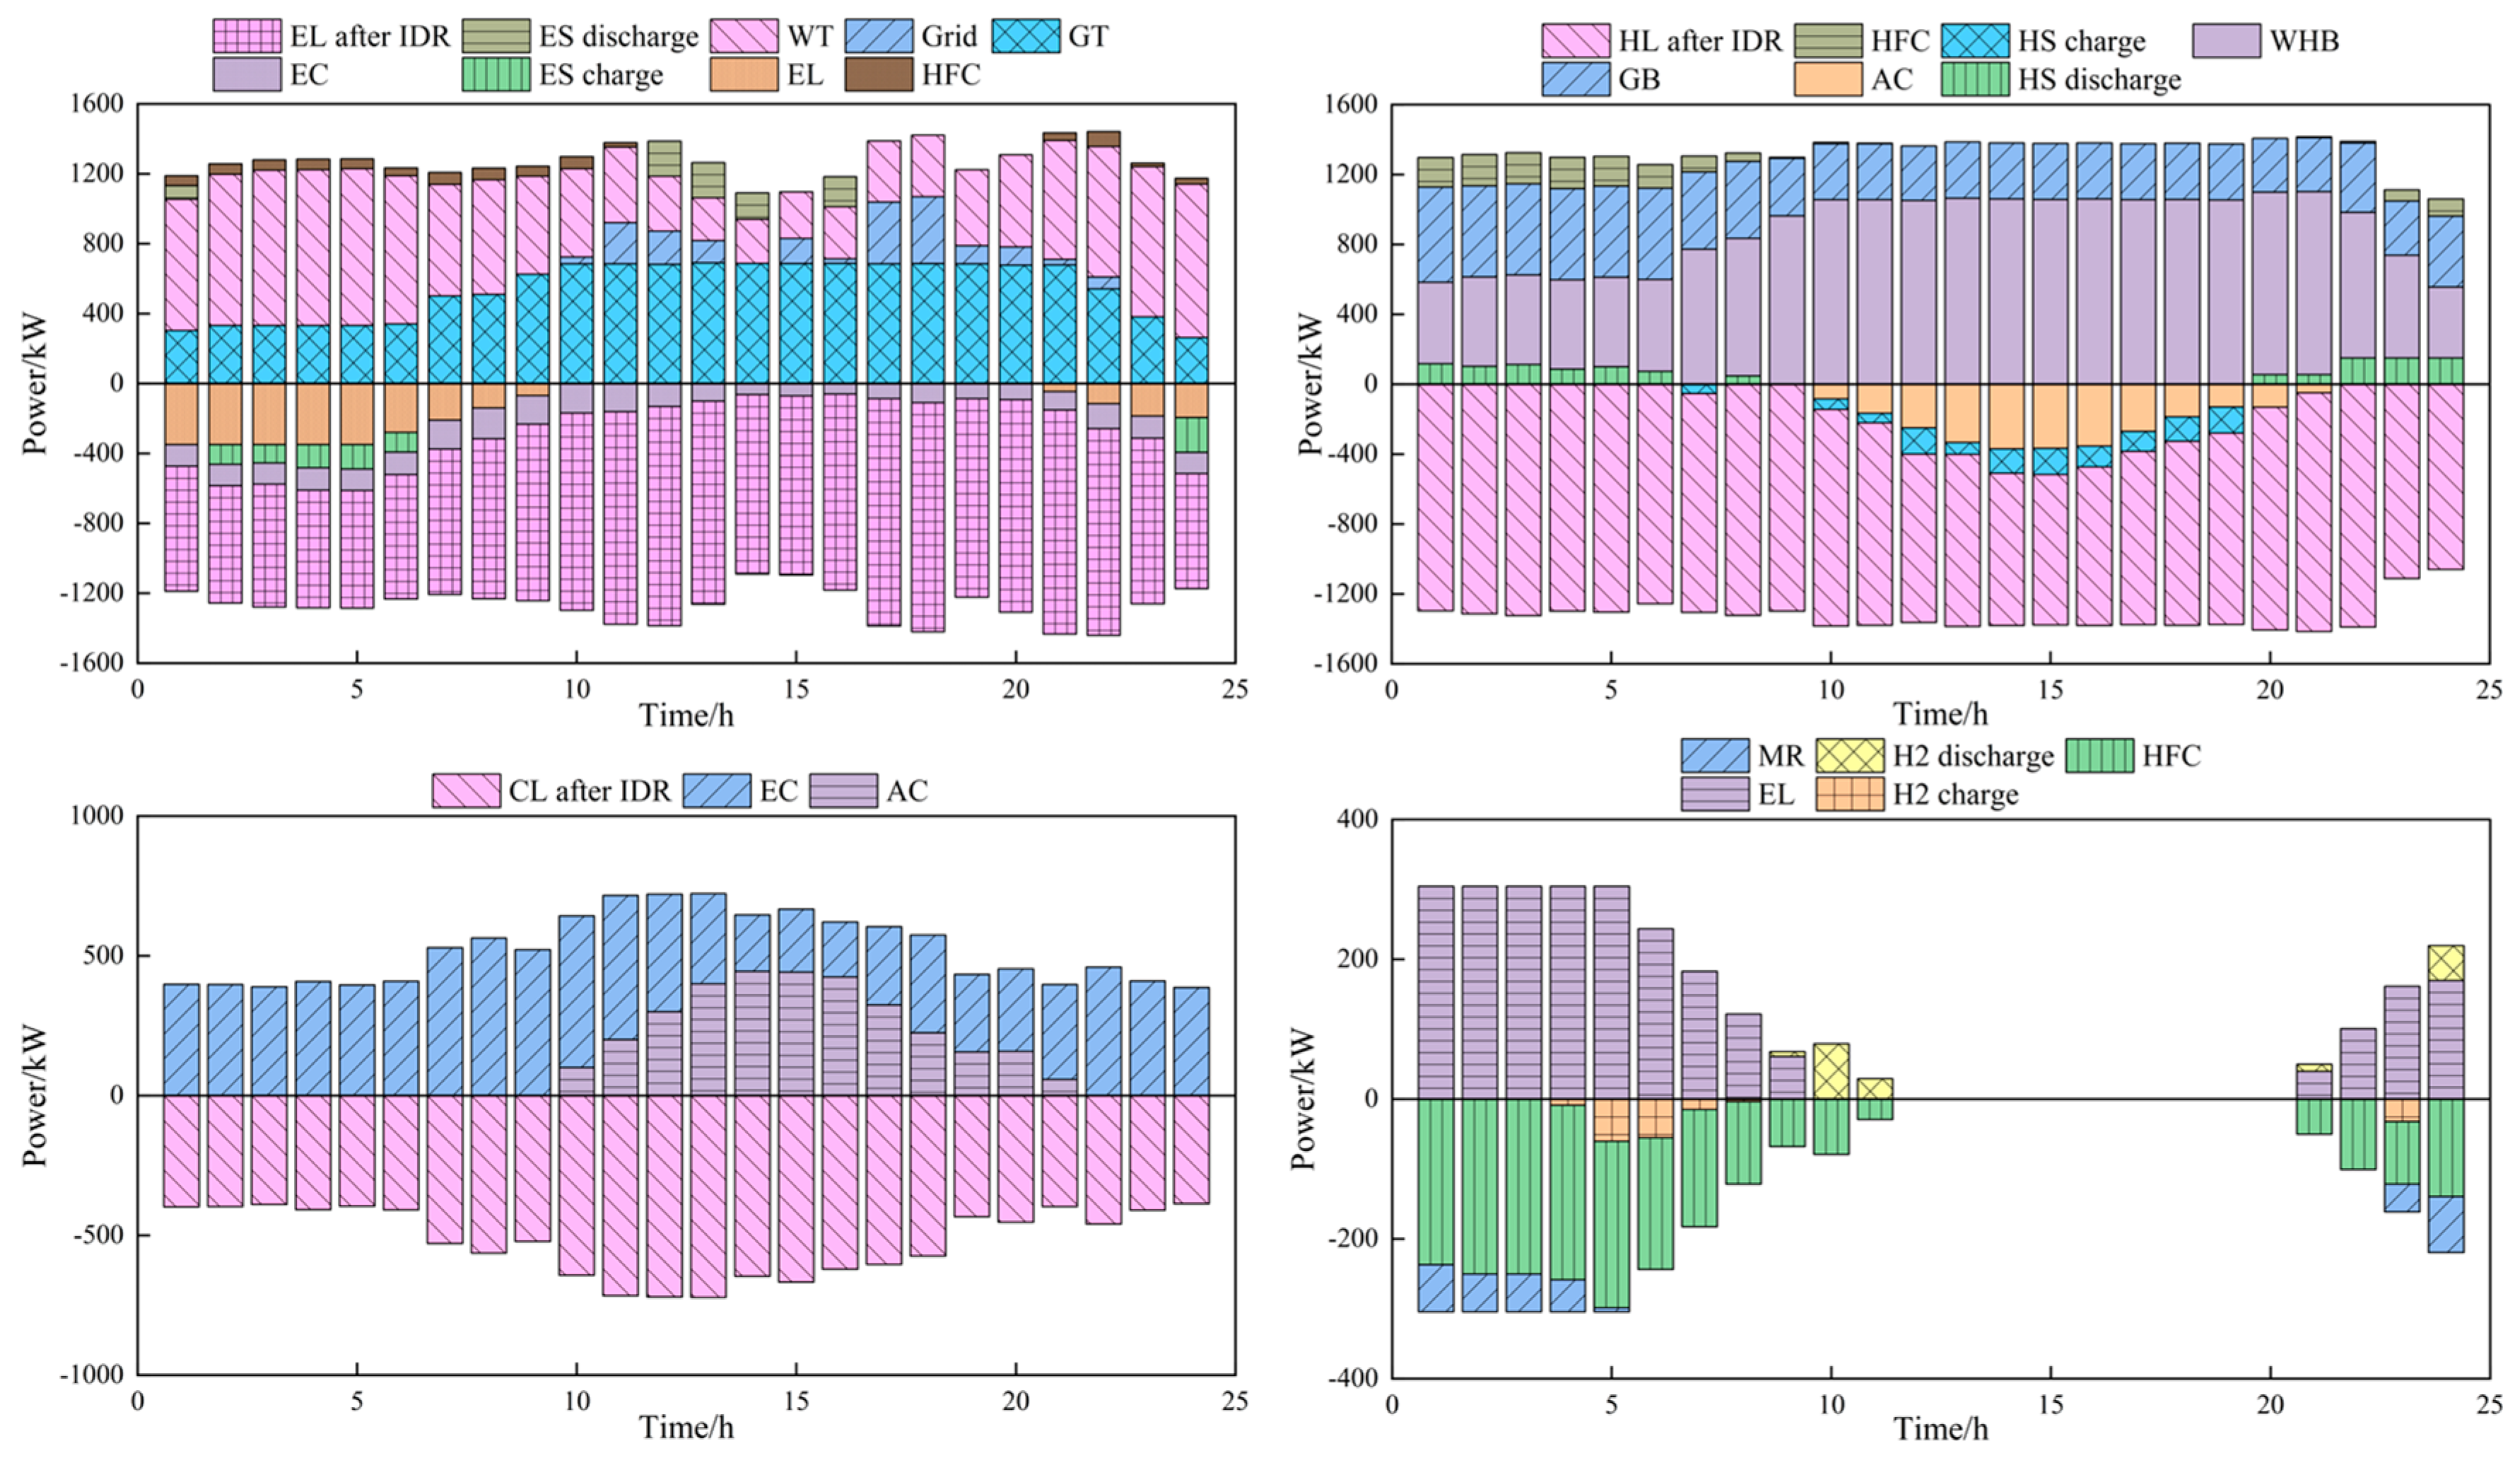
As shown in
Figure 6, during the dispatch cycle, the system’s electricity, heating, cooling, and hydrogen subsystems exhibit distinct time-dependent synergistic operation characteristics, with clear multi-energy complementary relationships.
From the electrical power balance results, during the nighttime period from 23:00 to 6:00 the next day—characterized by low load and high renewable energy output—renewable power generation accounts for a high proportion of the system’s electricity. The electrical load demand is primarily met by wind power generation within the EGO, supplemented by GT power generation and HFC discharge to maintain supply–demand balance. To fully utilize surplus electricity, the EL units within the EGO increase their operational power, converting excess electricity into hydrogen energy supplied to HFC for combined heat and power generation, thereby effectively reducing curtailment costs. Simultaneously, the EGO maximizes its internal electrical energy storage systems to locally store surplus electricity generated at night, further alleviating renewable energy integration pressures. During daytime hours, as electricity demand continues to rise, wind power output is fully absorbed, and GT output increases accordingly. However, constrained by the trade-off between revenue from electricity sales and operational costs, the EGO imposes certain limits on GT output, leading to a corresponding decrease in HFC output. The resulting power deficit is primarily supplemented by electricity purchased from the EMO and discharge from the EGO’s electrical energy storage system.
Thermal power balance analysis indicates that between 0:00 and 6:00, thermal load remains high. EMO prioritizes dispatching HFC and WHB for heating, with GB and thermal energy storage systems within EGO supplementing any shortfall to ensure thermal power equilibrium. Between 10:00 and 20:00, the overall system thermal load is relatively low, while localized electrical demand is high. This drives the gas turbine to operate at high load, generating significant waste heat. During this period, thermal load is primarily handled by WHB and GB. Excess heat is partially converted into cooling capacity via AC to meet cooling demands, while the remainder is stored in the EGO thermal energy storage system. This stored heat is released during subsequent peak thermal load periods to reduce fuel costs.
The cooling load balance relationship indicates that during periods of high cooling demand, EC and AC operate synergistically to meet the system’s cooling requirements. EC primarily relies on electrical power, while AC fully utilizes waste heat from WHB and other sources for refrigeration, achieving efficient thermal-to-cooling energy coupling. When cooling demand is low, the output of all refrigeration equipment is reduced accordingly, with EC primarily responsible for supplying cooling capacity during this period.
Regarding hydrogen subsystem operation, the EL unit converts electrical energy into hydrogen, storing a portion in hydrogen storage tanks, feeding another portion to the HFC for electricity and heat production, and supplying the remainder to the MR. During periods of abundant renewable energy output and low electricity prices, the system experiences low electrical load but high thermal demand. The EL unit operates at high capacity, continuously producing hydrogen. A portion of this hydrogen drives the HFC for combined heat and power generation, while another portion feeds into the MR to absorb carbon dioxide, effectively reducing the EGO’s carbon emissions.
In summary, after introducing the hydrogen utilization model, the system achieves multi-energy complementarity and coordinated optimization of electricity, heat, cooling, and hydrogen based on varying load characteristics and renewable energy output across different time periods. Under this dispatch strategy, coordinated operation of all equipment prioritizes renewable energy consumption. This not only ensures power balance across the system’s multi-energy loads but also significantly enhances clean energy utilization, optimizes the system’s energy structure, promotes coordination between supply and demand sides, and further strengthens the economic efficiency and reliability of system operation.
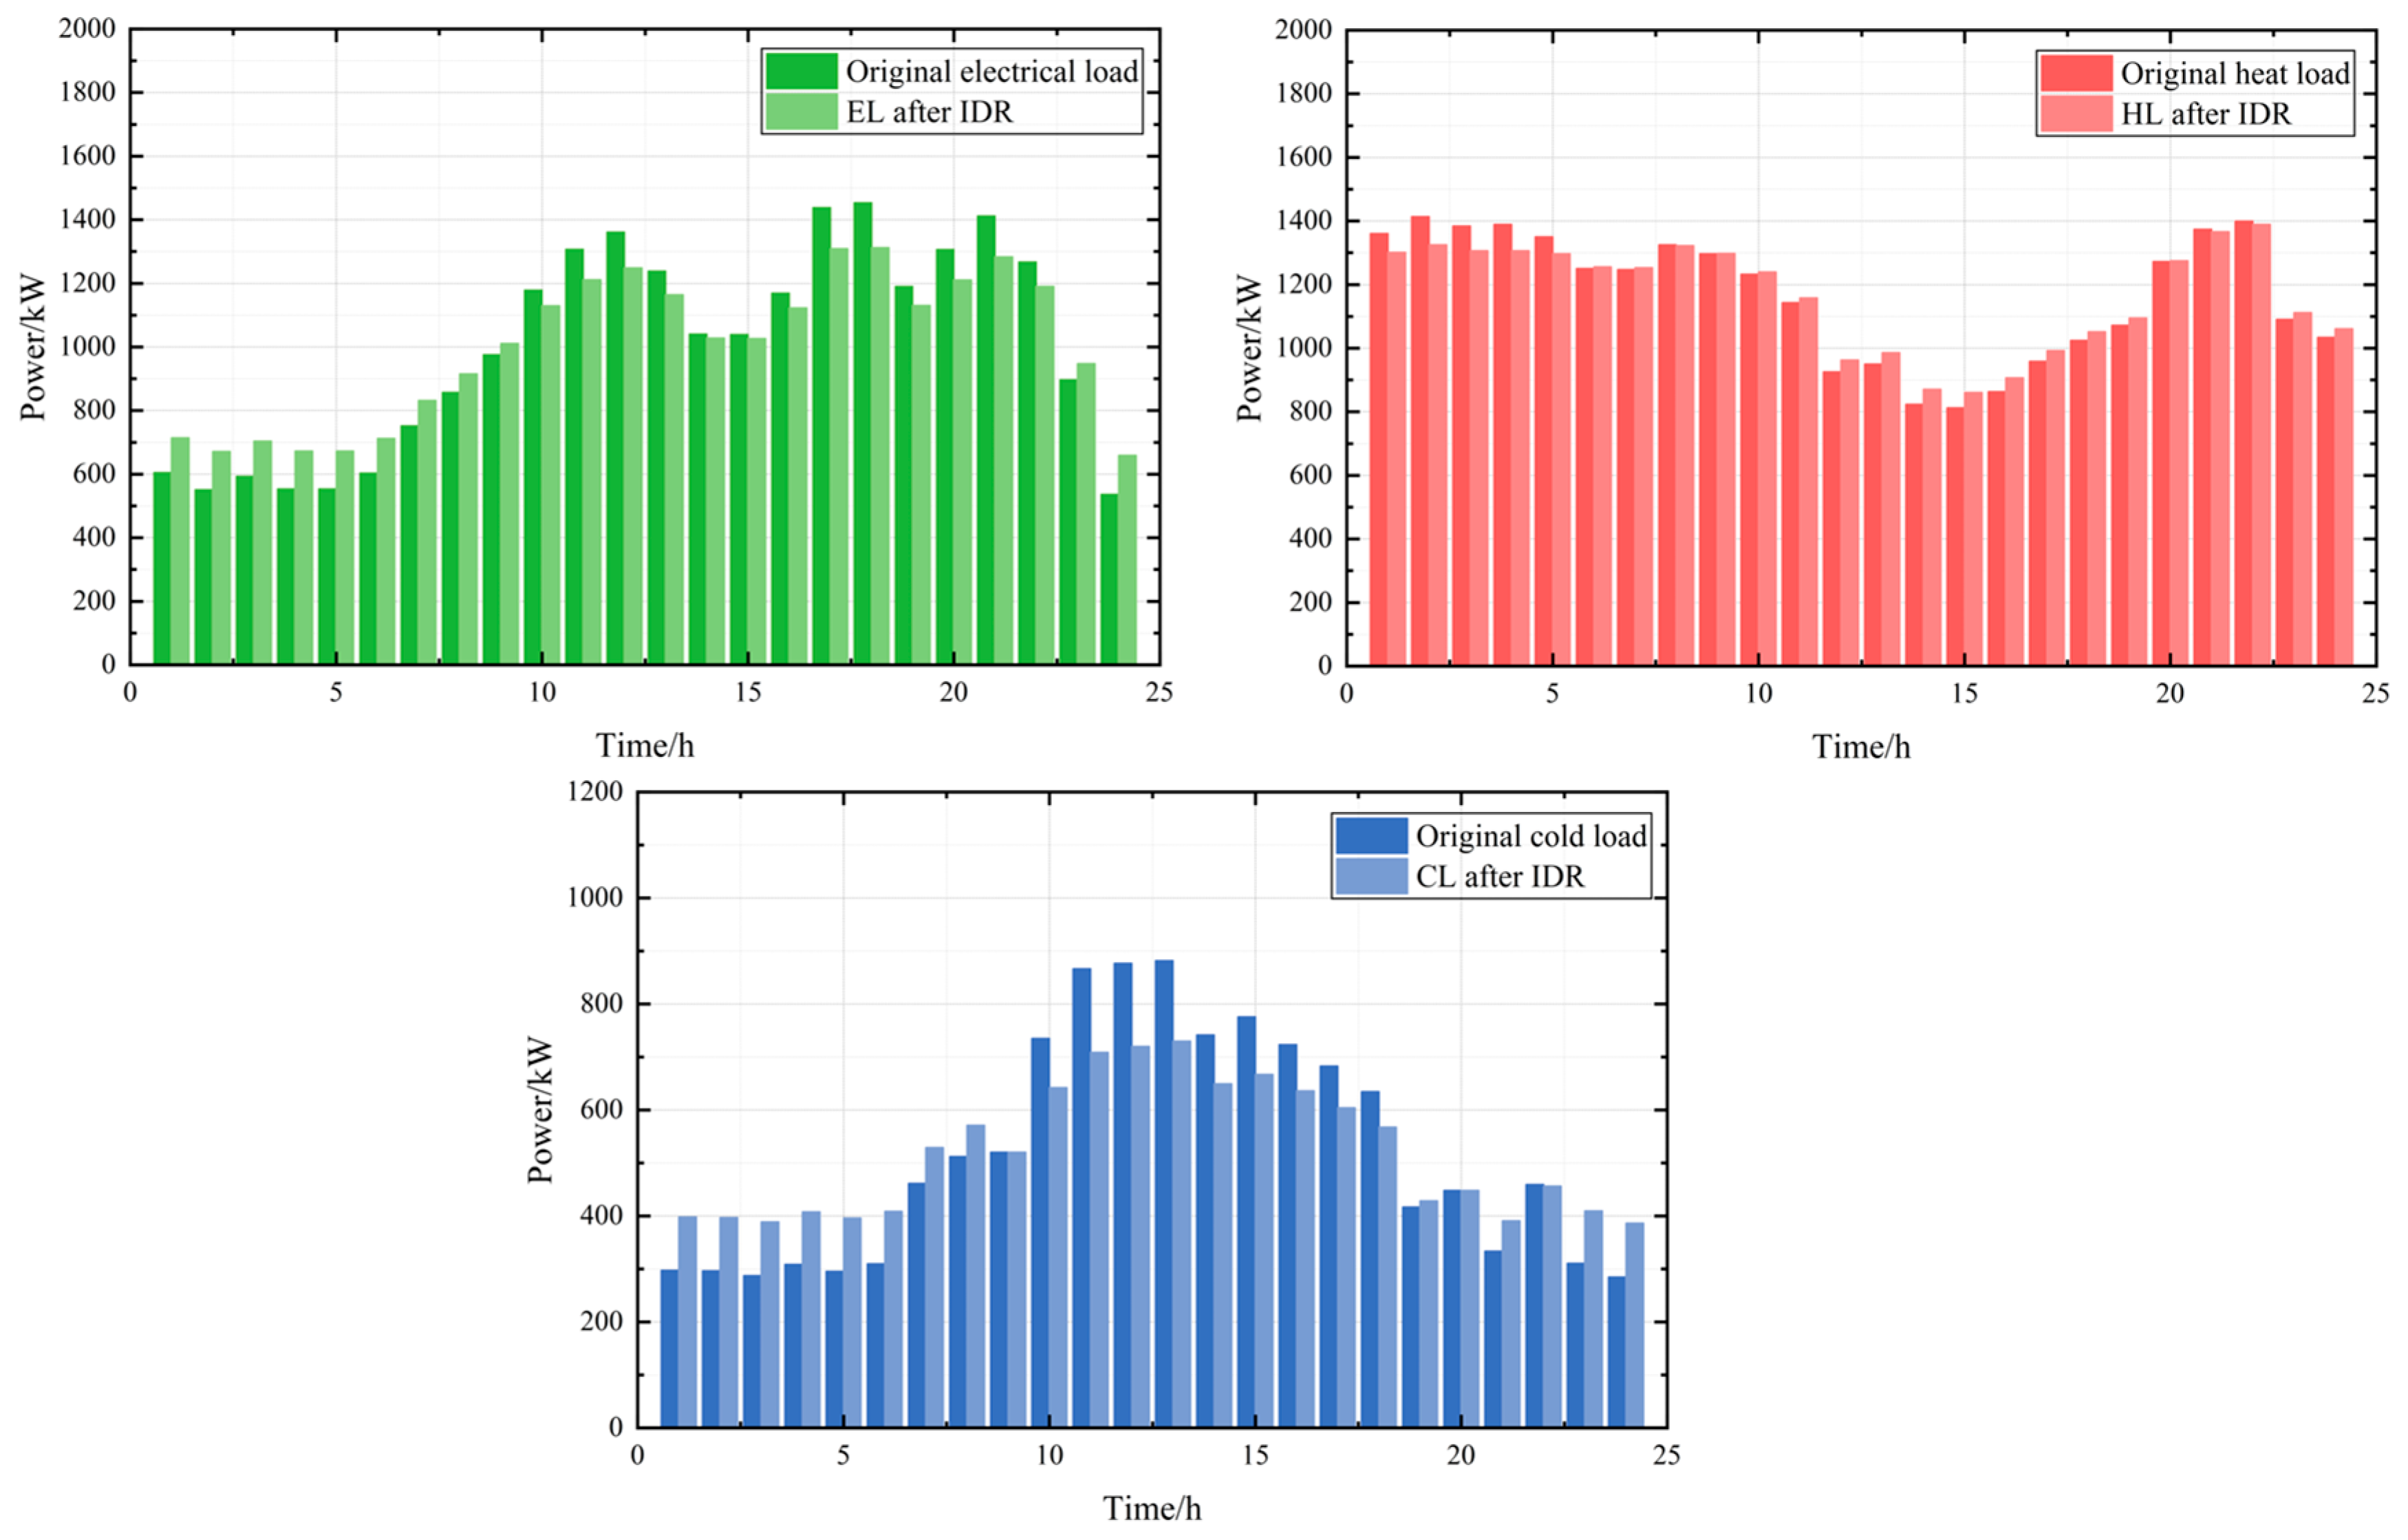
5.4. Analysis of IDR
Figure 7 displays the optimization results for electricity, heating, and cooling loads on the user side. Analysis indicates that all load types exhibit varying degrees of optimization adjustments before and after demand response optimization. Taking electricity load as an example, its optimization is primarily influenced by electricity pricing. Under real-time pricing, users proactively shift peak-period electricity consumption to off-peak hours and make reasonable adjustments during standard-rate periods. This approach reduces users’ energy procurement costs while enhancing EGO’s nighttime wind power absorption capacity. Similarly, optimization results for thermal and cooling loads follow comparable patterns. During periods of high thermal and cooling demand—when EMO sets higher prices—users respond by reducing thermal and cooling loads to varying degrees. This load shifting to periods of lower demand effectively reduces users’ energy procurement costs.
5.5. Sensitivity Analysis
(1) Sensitivity Analysis of Green Certificate Quota Coefficients
As indicated by Equations (4) and (5) in
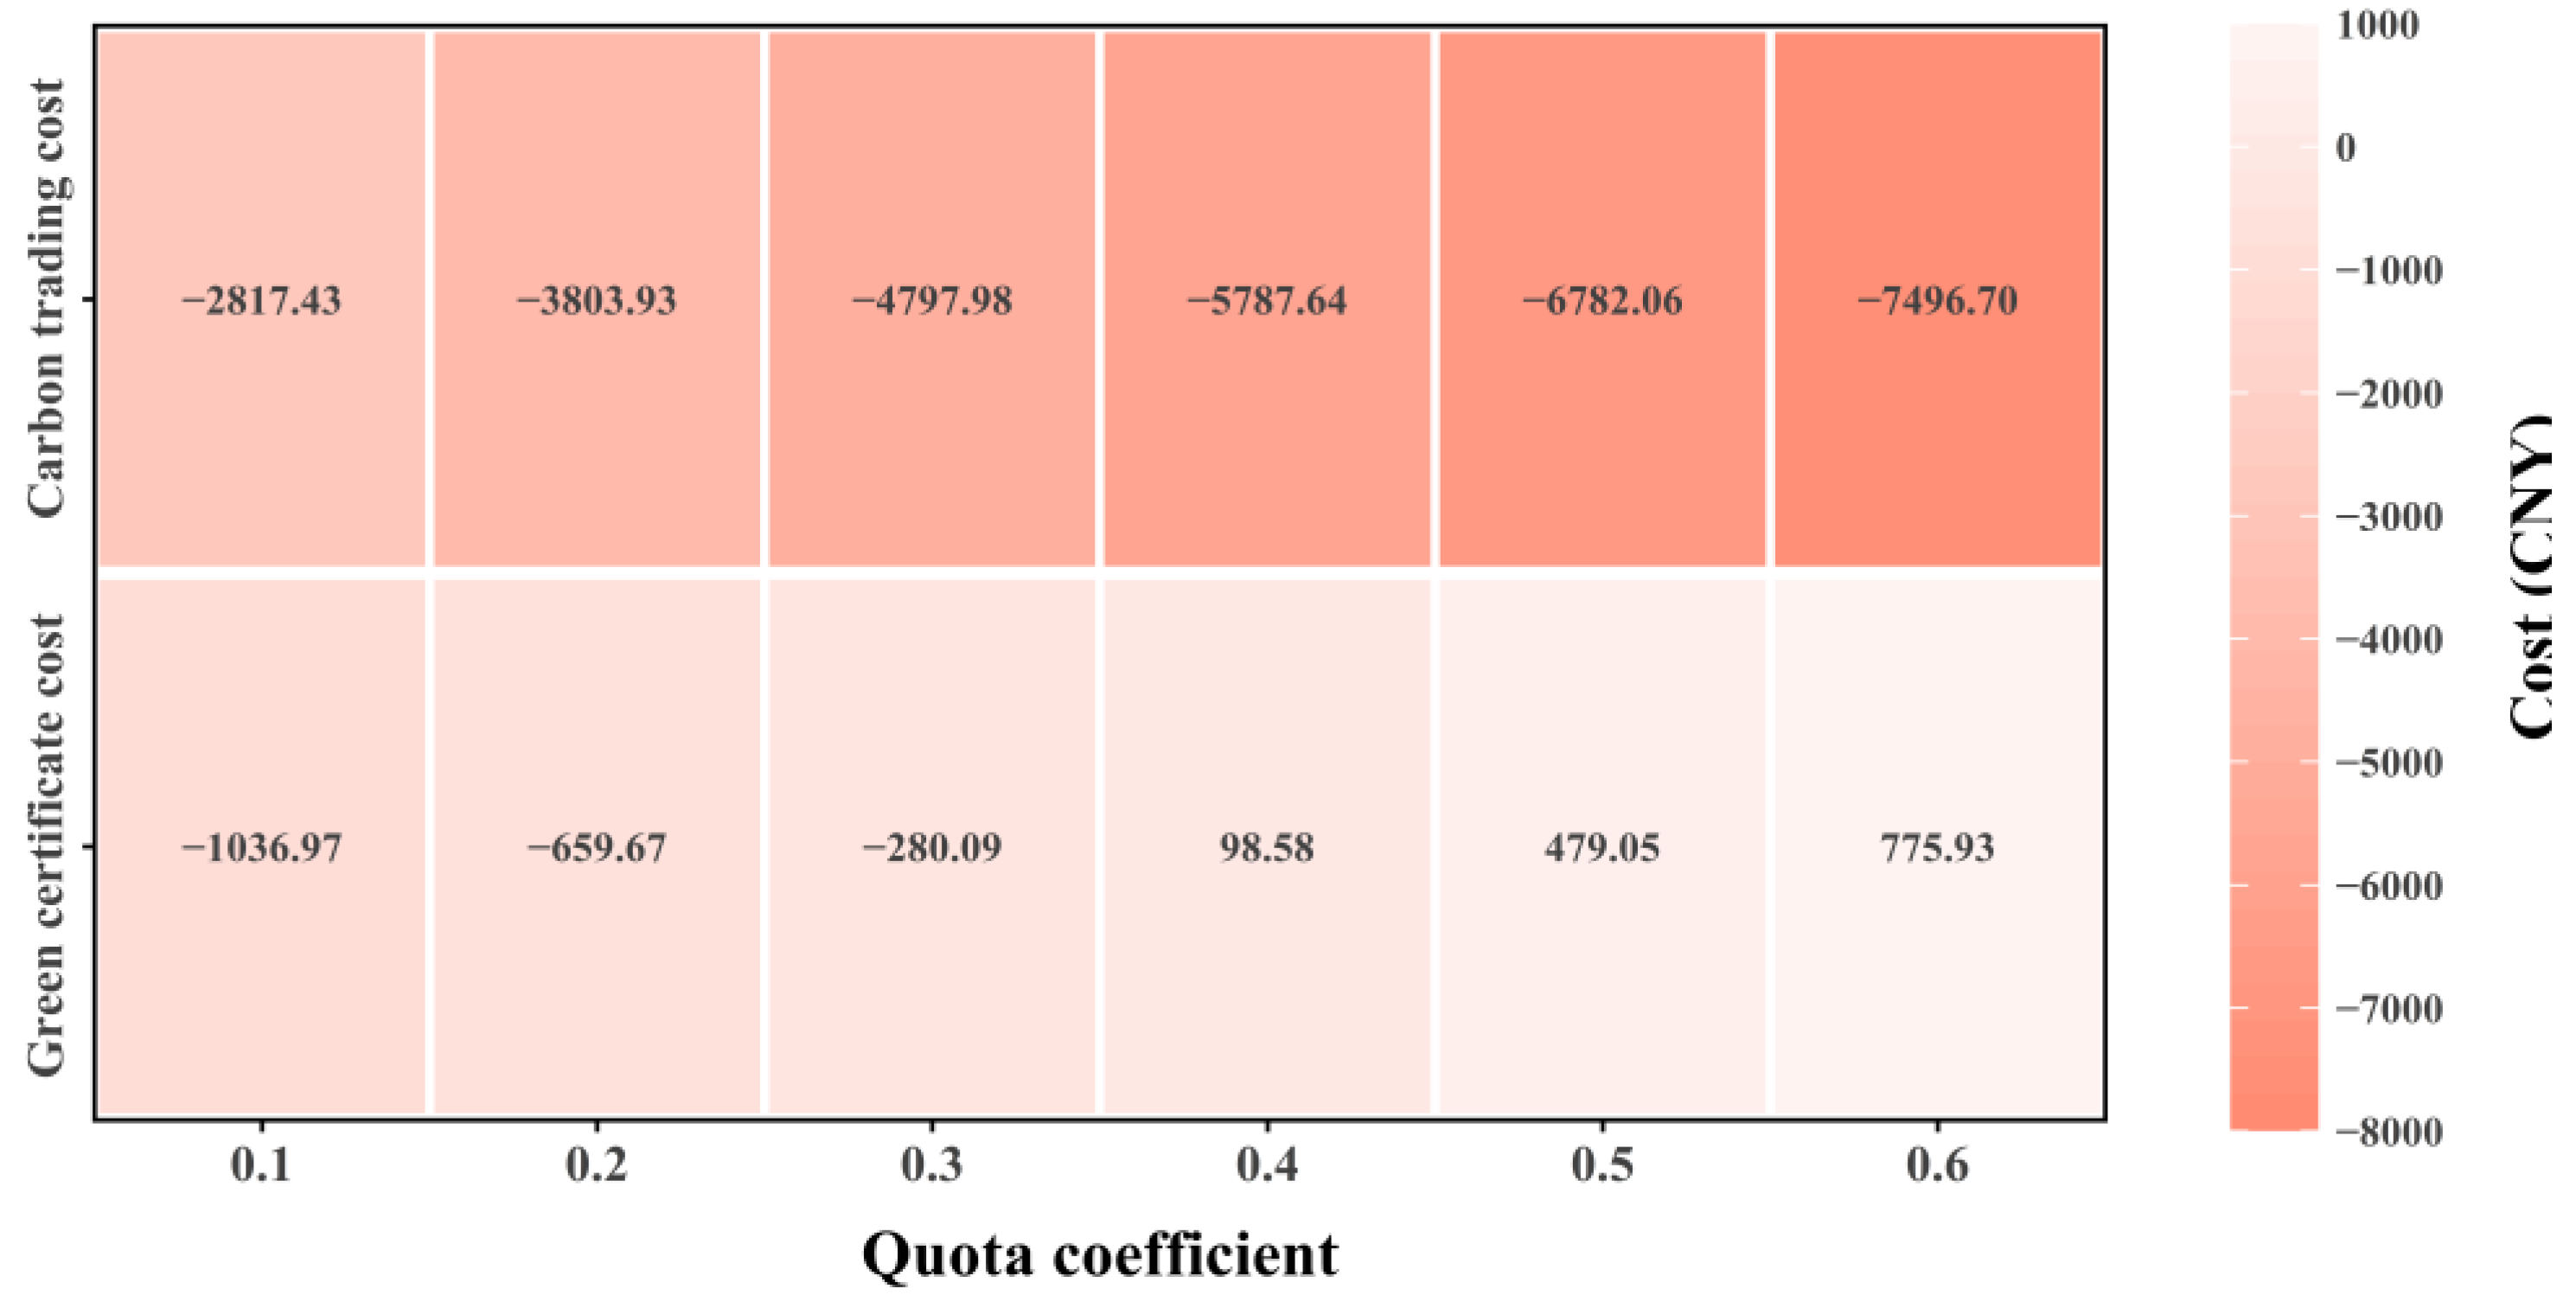
Section 2.3, the GCT cost is closely associated with the green certificate quota coefficient. As a key parameter for evaluating system economic performance, variations in the green certificate quota coefficient directly affect the overall operational behavior of the regional integrated energy system. To further elucidate the differentiated impacts of the green certificate quota coefficient on the GCT–CET mechanism, Scenario 4 is adopted as the baseline framework. A comparative analysis of the EGO’s green certificate trading cost and carbon trading cost under different quota coefficient levels is conducted, and the corresponding results are illustrated in
Figure 8.
As illustrated in
Figure 9, the renewable energy quota coefficient exhibits a clear threshold effect on the cost characteristics of GCT within the range of 0.3–0.4. When the quota coefficient remains below this threshold, the GCT–CET mechanism enables the EGO to obtain positive revenues from green certificate trading. However, once the quota coefficient exceeds the threshold, the green certificate revenue gradually diminishes and eventually turns into a net cost. This behavior arises because a higher green certificate quota coefficient requires the system to hold a larger amount of mandatory green certificates. Under the assumption that the dispatchable wind power remains unchanged, the total number of green certificates available to the system does not increase, thereby reducing the quantity of certificates that can be traded in the market after meeting the quota requirements.
Notably, with the introduction of the GCT–CET interaction mechanism, mandatory green certificate quotas can be equivalently converted into carbon emission reductions and used to offset part of the carbon emission demand. As a result, with increasing quota coefficients, the EGO’s potential revenues in the carbon trading market continue to rise, which partially mitigates the deterioration of system economic performance under high green certificate quota conditions.
(2) Price Sensitivity Analysis of Green Certificate Trading and Carbon Trading
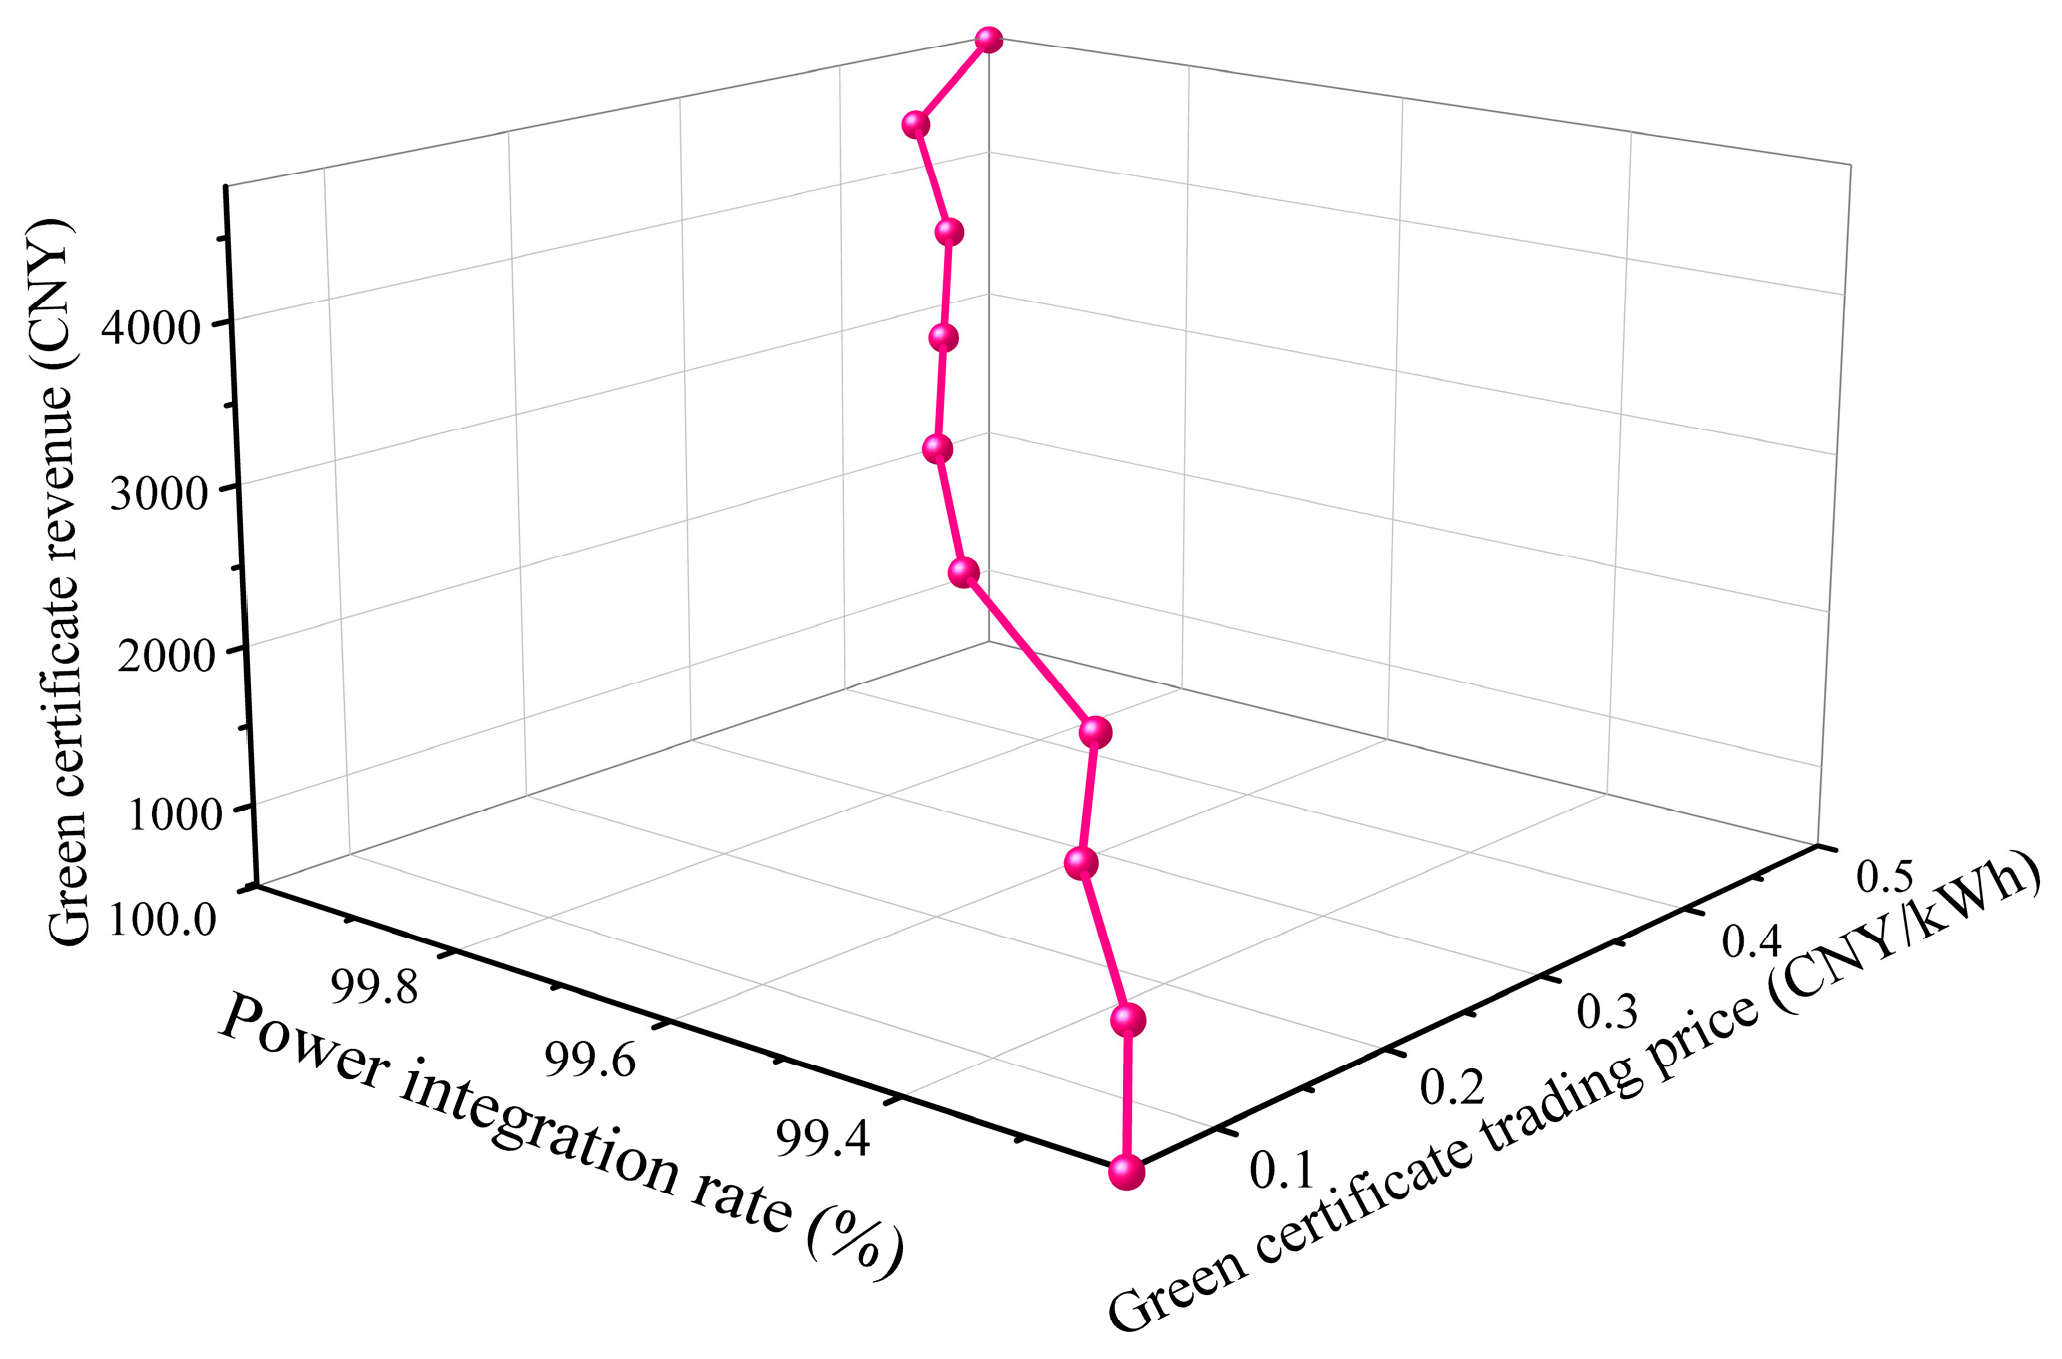
As shown in
Figure 9, the system’s response to the unit price of green certificates exhibits phased sensitivity. In the range where the unit price of green certificates rose from 50 yuan to 200 yuan per certificate, the increase in wind power absorption rate was limited, and the additional revenue generated by the system from wind power was low. Consequently, the incentive effect of price signals on system operation was weak, indicating that the system exhibited low sensitivity to the unit price of green certificates within this price range. As the green certificate price further increases to the 200–350 yuan/certificate range, the wind power absorption rate rises significantly, and green certificate revenue also shows marked growth. This indicates that the system’s response to price changes has strengthened; during this phase, price signals can effectively guide the system toward optimized dispatch, thereby enhancing wind power absorption capacity. As the unit price of green certificates continues to rise to the high-price range of 350–500 yuan per certificate, the wind power absorption rate approaches 100%, and the marginal effect of price on the absorption rate tends to be limited; however, green certificate revenue continues to increase, indicating that the system remains sensitive to economic returns in the high-price range, while its sensitivity to the absorption rate has significantly decreased.
Additionally, the carbon trading base price was designed to fluctuate within a range of ±20% (from 0.2 CNY/kg to 0.3 CNY/kg). The results indicate that the system carbon emissions decreased by 3.77%, EGO revenue increased by 15.66%, while EMO revenue rose by 2.21%. This indicates that raising the carbon price increases the carbon cost of purchased electricity, thereby prompting EMOs to reduce their purchases of electricity and adjust their operational strategies, while simultaneously strengthening the incentive for EGOs to generate low-carbon power, thus improving the system’s low-carbon operation level. In comparison, this parameter has a significant moderating effect on the system’s emission reduction performance and EGO revenue, while its impact on EMO revenue is relatively minor.
5.6. Analysis of Algorithm Optimization
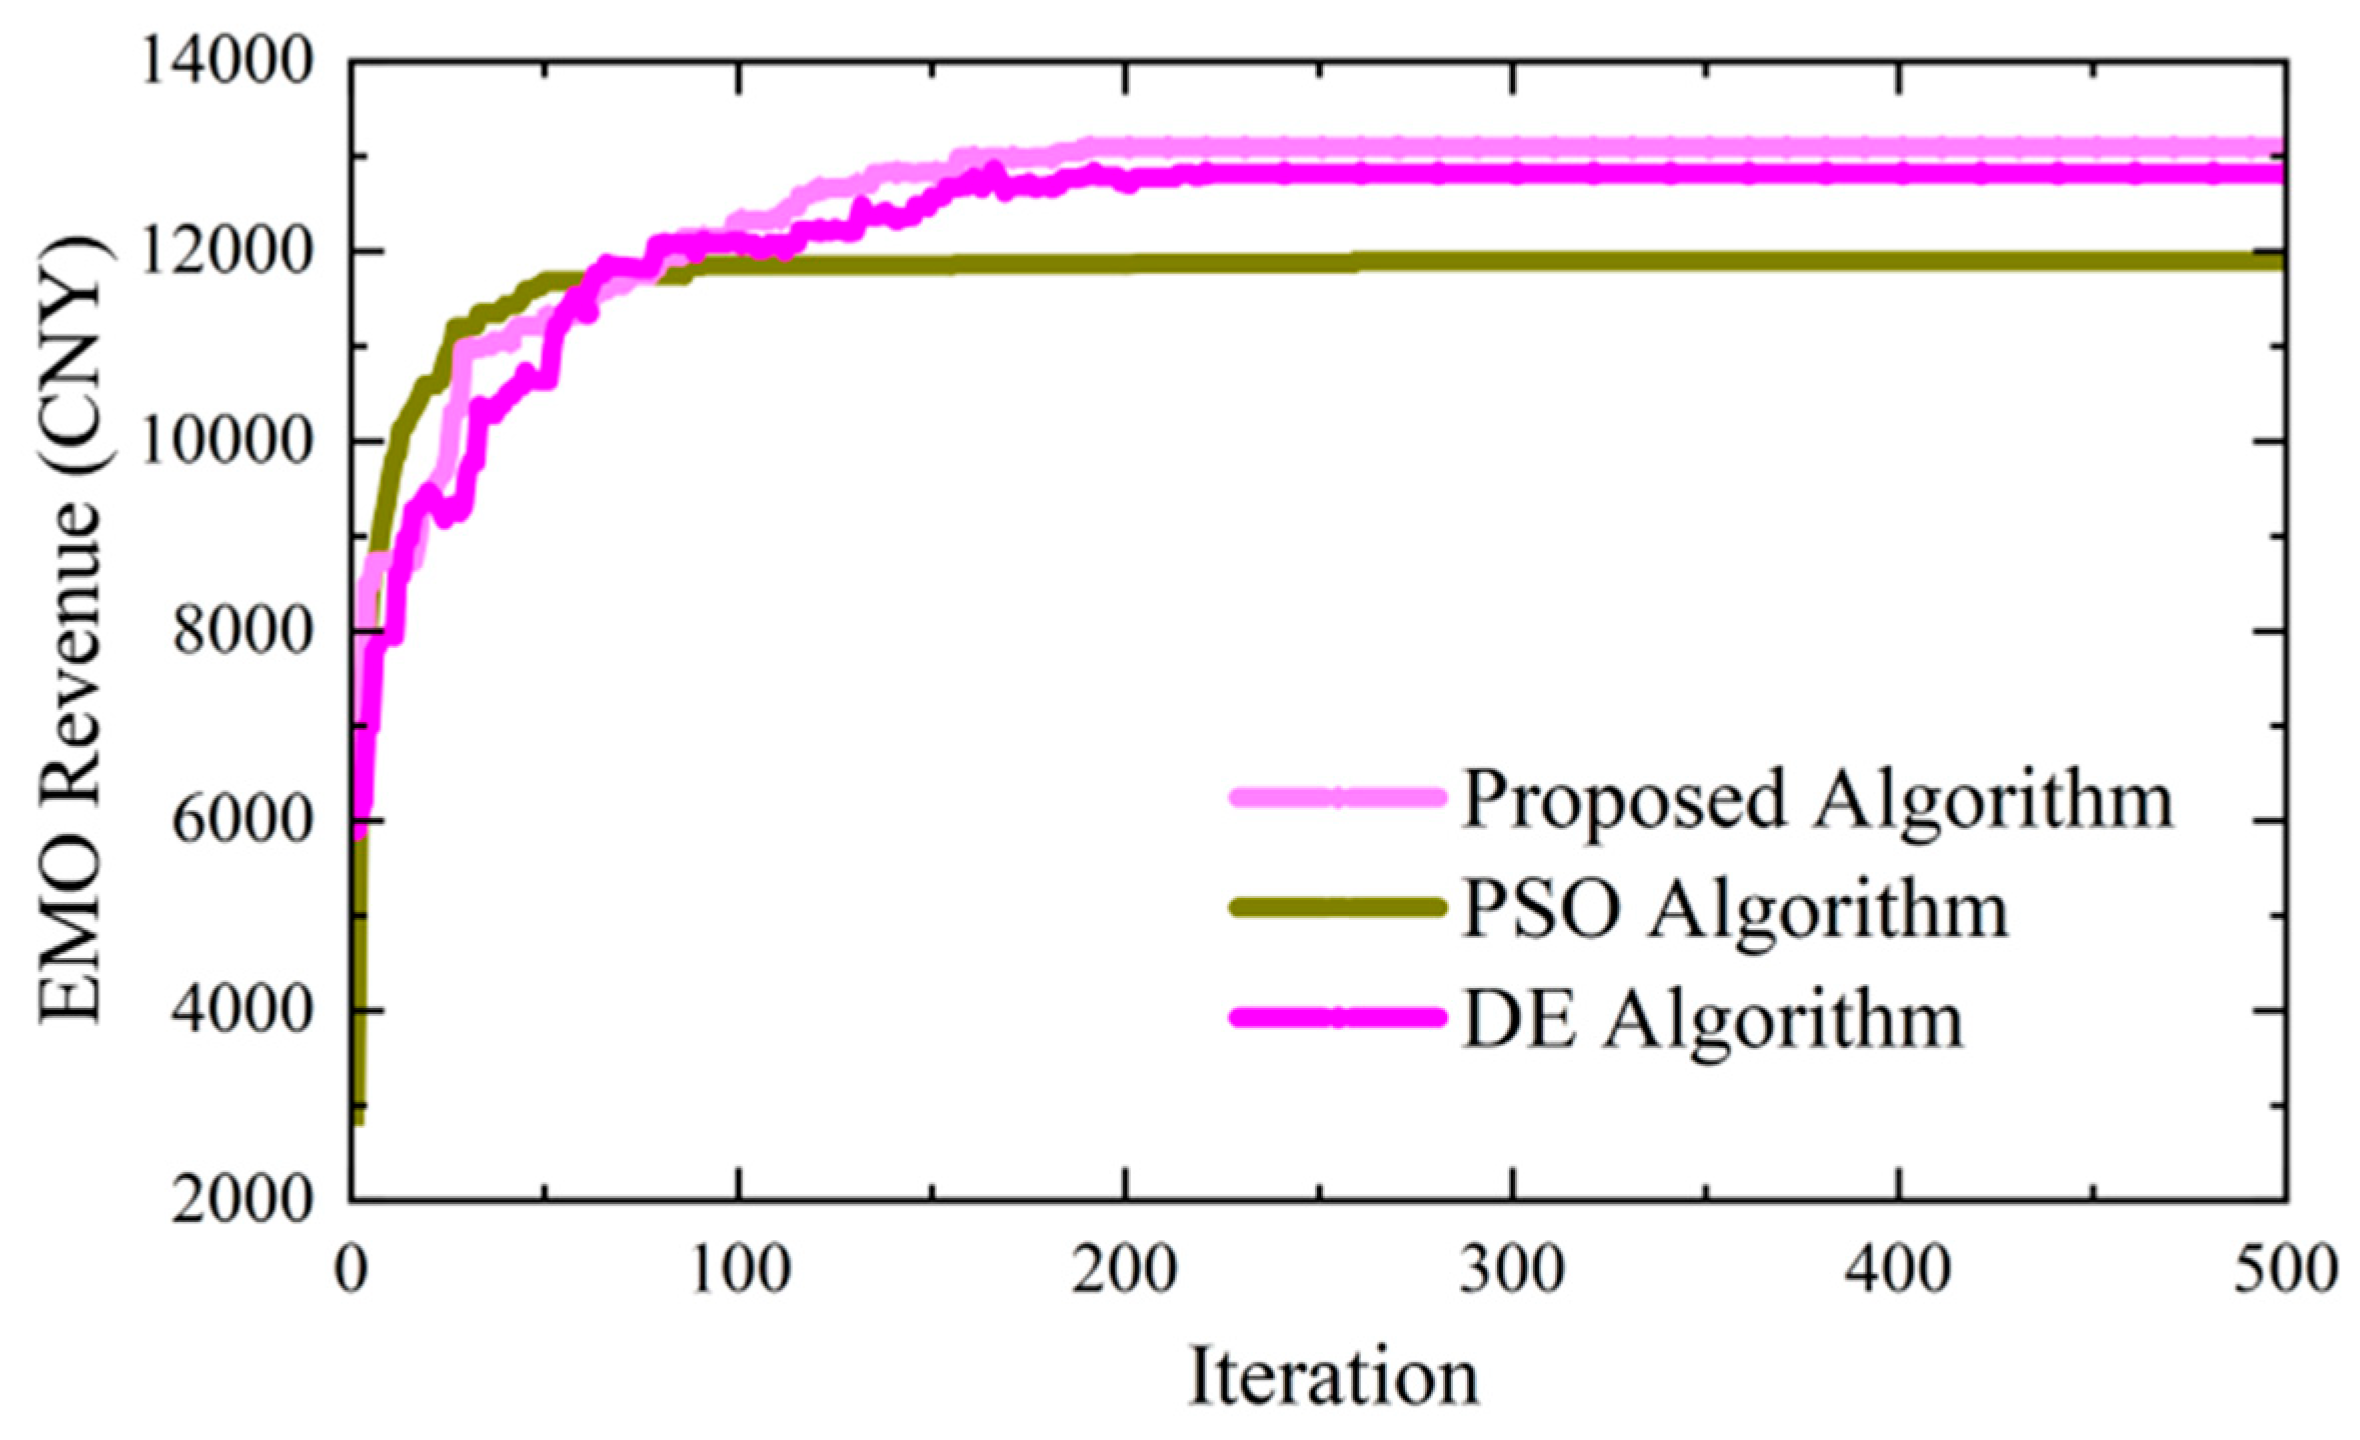
Figure 10 compares the iterative convergence characteristics of the proposed algorithm with those of the PSO and DE algorithms in terms of EMO performance. As shown by the curves, the PSO algorithm converges relatively quickly in the early iterations but is prone to getting stuck in local optima; its performance curve levels off after approximately 260 iterations, and the final performance is relatively limited. The DE algorithm converges more slowly; although it possesses a certain ability to escape local optima, its final performance remains slightly lower. In contrast, the algorithm proposed in this paper balances global exploration with local optimization, rapidly improving performance in the early stages while maintaining stable convergence in the later stages. Its final performance is significantly higher than that of PSO and DE, fully demonstrating the algorithm’s advantages in convergence speed, global optimization capability, and stability.
6. Discussion
This paper constructs a low-carbon economic dispatch model for a hydrogen-based regional integrated energy system that couples carbon trading with green certificate trading mechanisms, and implements multi-agent interactive decision-making based on the Stackelberg game. The results indicate that this framework effectively captures the strategic interactions among energy operators, energy suppliers, and users, making the dispatch process more closely aligned with actual energy market mechanisms. By introducing a multi-stage collaborative utilization mechanism for hydrogen energy, the system’s wind power integration capacity and emission reduction levels are enhanced, demonstrating that multi-energy synergy in electricity, heating, cooling, and hydrogen supply can effectively improve the flexibility and low-carbon performance of integrated energy systems. Meanwhile, the synergistic effect of carbon trading and green certificate trading generates more effective low-carbon incentive signals, indicating that, compared to single-policy mechanisms, the combined trading of carbon credits and green certificates is more conducive to promoting renewable energy integration and low-carbon system operation.
Nevertheless, this study has certain limitations. First, the research is primarily based on simulations of typical scenarios and lacks support from actual engineering data. Second, the model focuses on 24 h short-term dispatch and has not yet fully considered the long-term fluctuations of renewable energy or the uncertainties in system operation. Furthermore, as the system scale expands, the computational cost of the model will increase significantly. Taking a 50-population simulation with 500 iterations—each requiring CPLEX—as an example, the overall computational overhead is substantial, and the model may face significant computational pressure in large-scale scenarios. At the same time, in real-time dispatching, this framework may be constrained by high multi-agent communication demands, frequent information exchange, and significant computational latency, thereby affecting its effectiveness in online applications. In the future, empirical studies using real-world engineering data could be conducted, and techniques such as long-term modeling, robust or stochastic optimization, as well as distributed solving and parallel acceleration methods could be introduced to enhance the model’s applicability and practicality in complex, large-scale scenarios.
7. Conclusions
This paper constructs a low-carbon economic dispatch model for a hydrogen-based regional integrated energy system that couples carbon trading with green certificate trading mechanisms. Based on the Stackelberg game, it characterizes the interactive decision-making process between energy operators and multiple stakeholders, and achieves multi-agent coordinated optimization by solving for the game equilibrium. Comparative simulations across multiple scenarios indicate that:
(1) The integrated energy system optimization model based on the Stackelberg game effectively captures the decision-making logic and strategic interactions among multiple stakeholders, enabling the coordinated and optimized operation of multiple energy flows, including electricity, heat, cooling, and hydrogen. Compared to single-agent or centralized dispatch models, the proposed hierarchical game framework more closely aligns with actual market operating conditions and is more suitable for dispatch decision-making in integrated energy systems under market-oriented conditions.
(2) After introducing a multi-stage hydrogen utilization model, the hydrogen production, storage, and consumption stages achieve coordinated operation, effectively enhancing wind power absorption capacity and energy conversion efficiency while reducing system carbon emissions. This method provides a reference for low-carbon transition in regions with abundant wind power and high-carbon energy supply structures, while balancing economic viability and environmental benefits.
(3) The interaction mechanism between green certificates and carbon trading can strengthen green incentives while constraining carbon emissions, driving the adjustment of regional integrated energy systems toward low-carbon economic operations. Sensitivity analysis indicates that the green certificate quota coefficient is a key parameter affecting the economic performance of the EGO and the incentive effectiveness of the joint mechanism, while green certificate prices and carbon trading prices exert varying degrees of influence on renewable energy integration, emission reduction effects, and the distribution of benefits among participants, respectively. This provides a reference for the design of differentiated low-carbon policies and the optimization of engineering coordination mechanisms.