1. Introduction
The global transition toward sustainable transportation has significantly increased the demand for zero-emission propulsion technologies in railway systems. A substantial portion of the global rail network remains non-electrified, making the decarbonization of these routes a critical challenge for the rail sector [
1]. Conventional diesel-electric locomotives, while operationally flexible, are incompatible with increasingly strict environmental regulations and long-term carbon neutrality targets. Although battery-electric trains have emerged as a promising alternative, their practical deployment in long-distance and high-speed railway applications remains limited due to constraints in energy density and the ability to sustain high power demand during intensive operating phases such as acceleration and high-speed cruising [
2].
To overcome the limitations of single-source zero-emission propulsion systems, hybrid architectures that combine multiple energy sources have attracted considerable attention. In particular, Hybrid Power Systems (HPS) integrating hydrogen fuel cells (FCs) and battery energy storage systems provide a promising solution for heavy-duty rail applications. In such configurations, the FC provides high energy density for long-distance operation, while the battery delivers the high power density required for transient traction demands [
3]. This complementary interaction allows hybrid systems to meet both the range and power requirements of modern railway platforms, including high-speed train (HST) applications [
4].
With the rapid development of hydrogen-based railway technologies in recent years, research efforts have increasingly focused on improving the design and operation of hybrid propulsion systems. Existing studies can generally be categorized into three main research directions: component sizing optimization, energy management strategy development, and lifecycle cost-oriented system analysis.
The first research direction focuses on optimal sizing of hybrid propulsion components. Several studies have employed evolutionary algorithms and multi-objective optimization methods to determine the appropriate capacities of FC and battery systems. For instance, Sarma et al. proposed a design optimization framework based on a Multi-Objective Particle Swarm Optimization (MOPSO) algorithm for a hybrid FC–battery freight locomotive [
5]. Their results demonstrated total cost reductions between 8.76% and 18.05% and system weight reductions between 9.13% and 11.47% compared to a reference configuration. However, the proposed model does not incorporate degradation-related costs associated with FC and battery ageing, nor does it consider the strict mass and volume constraints that are critical for high-speed train platforms. In [
6], a dynamic programming-based sizing approach was proposed for battery–supercapacitor hybrid energy storage systems (HESS), jointly optimizing system size and energy management strategy. The results indicated that battery degradation dominates the system’s lifetime cost, accounting for 75–89% of the total HESS cost. Guan et al. proposed a hierarchical optimization framework for electric racing cars with hybrid energy storage systems, where Bayesian optimization is used for component sizing and IPOPT-based numerical optimization for power allocation, demonstrating significant reductions in lap time and substantial improvements in peak power capability compared to battery-only configurations [
7]. Kolodziejski and Michalska-Pozoga presented integrated energy and power management strategies for hybrid and electric ships, showing that optimal system sizing and predictive control can significantly reduce fuel consumption and emissions while improving overall propulsion efficiency [
8].
In railway applications, optimal sizing of onboard energy storage devices (OESDs) has been investigated to improve energy efficiency and utilize regenerative braking energy. A mixed-integer linear programming (MILP) model was proposed to determine the optimal capacities of supercapacitors, lithium-ion batteries, and flywheels to minimize catenary energy consumption during train operation. Simulation results showed that optimized storage systems can reduce catenary energy consumption by approximately 22–24% compared with cases without onboard storage. Nevertheless, degradation costs and long-term economic impacts were not considered in the optimization formulation [
9]. More recent studies have considered hybrid energy storage systems composed of batteries and supercapacitors. An MILP-based optimization framework was developed to determine the optimal configuration of onboard hybrid energy storage devices while accounting for long-term operational costs and degradation effects. The results demonstrated energy-saving rates of up to 25.59% under different investment ratios between batteries and supercapacitors. However, the study focuses on electrified railway systems and does not consider hydrogen-based hybrid propulsion architectures [
10].
The second major research direction concerns the development of advanced energy management strategies (EMSs) to optimally distribute power between hybrid energy sources during operation. Various control approaches have been proposed in the literature, including optimization-based strategies, model predictive control (MPC), and reinforcement learning techniques. For example, Fu et al. developed an optimization-based EMS for a FC–battery–ultracapacitor hybrid vehicle, achieving an 8.5% reduction in hydrogen consumption compared to a conventional rule-based strategy [
11]. Similarly, Li et al. proposed a model predictive control approach for hydrogen electric multiple unit (HEMU) trains, significantly improving speed prediction accuracy and reducing computational time [
12]. More recently, reinforcement learning methods have been applied to hybrid railway systems. In [
13], authors introduced a deep reinforcement learning-based EMS using a Twin Delayed Deep Deterministic Policy Gradient (TD3) algorithm, while Ghaderi et al. proposed a Q-learning-based strategy for minimizing hydrogen consumption and FC degradation costs [
14]. These studies demonstrate significant improvements in operational efficiency and component lifetime. However, they primarily focus on real-time power management for pre-designed systems and do not address the design-level optimization of system component sizes.
A third research direction involves lifecycle cost analysis and degradation-aware control strategies. For example, Wang et al. proposed a multi-stack FC allocation strategy for hybrid shunting locomotives that minimizes the combined cost of hydrogen consumption and FC degradation over the mission profile [
15]. Their results showed a reduction of 32.39% in lifecycle cost and 8.97% in hydrogen consumption compared to conventional control strategies. Similarly, Olmos et al. conducted a comparative study of artificial intelligence-based EMS methods for hydrogen railway vehicles and demonstrated that advanced learning-based controllers can approach the theoretical optimum obtained through dynamic programming [
16]. Despite these advances, such studies typically treat the propulsion system configuration as fixed and do not integrate lifecycle cost considerations into the initial system sizing process.
Although some studies have addressed component sizing optimization in hybrid vehicles, most existing approaches are developed for road vehicles or lower-power transportation systems. For example, El-Iali et al. performed a multi-objective optimization for the energy storage system of a plug-in FC electric vehicle, balancing lifecycle cost, battery ageing, and CO
2 emissions [
17]. While this work demonstrates the benefits of integrated techno-economic optimization, it focuses on light-duty road vehicle applications and does not consider the multi-megawatt power requirements and strict physical constraints characteristic of high-speed train systems.
Table 1 presents a taxonomy of recent studies on hybrid FC–battery energy systems based on the optimization method, considered energy sources, degradation modelling, application domain, and objective functions. As seen in the table, existing studies employ a wide range of approaches, including dynamic programming, reinforcement learning, model predictive control, and various mathematical optimization techniques. However, many of these studies focus either on operational energy management or component sizing individually. In addition, several works consider only battery degradation or FC degradation, while integrated degradation modelling for both components remains limited. Furthermore, only a small number of studies address railway applications, and even fewer explicitly consider the stringent physical constraints associated with high-speed train platforms.
In contrast, this study proposes a degradation-aware MILP-based optimization framework that simultaneously addresses system sizing and operational power allocation for an FC–battery hybrid propulsion system. The proposed approach incorporates both battery and FC degradation models within a unified techno-economic optimization problem while explicitly considering onboard mass and volume constraints for high-speed railway applications. This integrated formulation enables tractable large-scale optimization and provides a more realistic design framework compared with existing approaches in the literature.
To address these limitations, this study proposes an integrated degradation-aware optimization framework for the design and operation of battery–FC hybrid propulsion systems for high-speed trains. The main contributions of this work are summarized as follows:
Integrated Design–Operation Optimization: The proposed framework simultaneously optimizes component sizing (battery capacity, FC stacks, and hydrogen storage) and operational power dispatch within a single formulation, enabling coordinated design and energy management decisions rather than treating them as sequential problems.
Degradation-Aware MILP Formulation: Battery ageing and FC degradation mechanisms are explicitly embedded into a mixed-integer linear programming (MILP) optimization model, allowing lifecycle cost and durability considerations to directly influence optimal system design while ensuring global optimality.
Constraint-Aware High-Speed Train Sizing: The optimization explicitly incorporates strict onboard volume and mass constraints specific to high-speed rolling stock, ensuring that obtained solutions are physically realizable and compatible with railway installation limitations.
Linearization Enabling Tractable MW-scale Optimization: Nonlinear degradation characteristics are transformed into piecewise linear representations, enabling computationally efficient MILP-based optimization suitable for multi-megawatt railway applications without sacrificing modelling fidelity.
The remainder of this paper is organized as follows.
Section 2 presents the overall system architecture and the mathematical modelling of the hybrid FC–battery train, including traction dynamics, component models, degradation formulations, and the proposed optimization framework.
Section 3 describes the simulation setup and input parameters, followed by detailed techno-economic results and comparative analyses for different battery sizing scenarios. Finally,
Section 4 concludes the paper by summarizing the main findings and discussing potential directions for future research.
2. System Description
This section presents the mathematical modelling of the hybrid train propulsion system, including traction dynamics, energy flow, and the detailed representation of Proton Exchange Membrane Fuel Cell (PEMFC) and battery architectures. Particular attention is devoted to modelling the degradation processes of both energy storage technologies. Abbreviations and parameters used throughout the study are summarized in the reference guide.
2.1. Hybrid Train Architecture
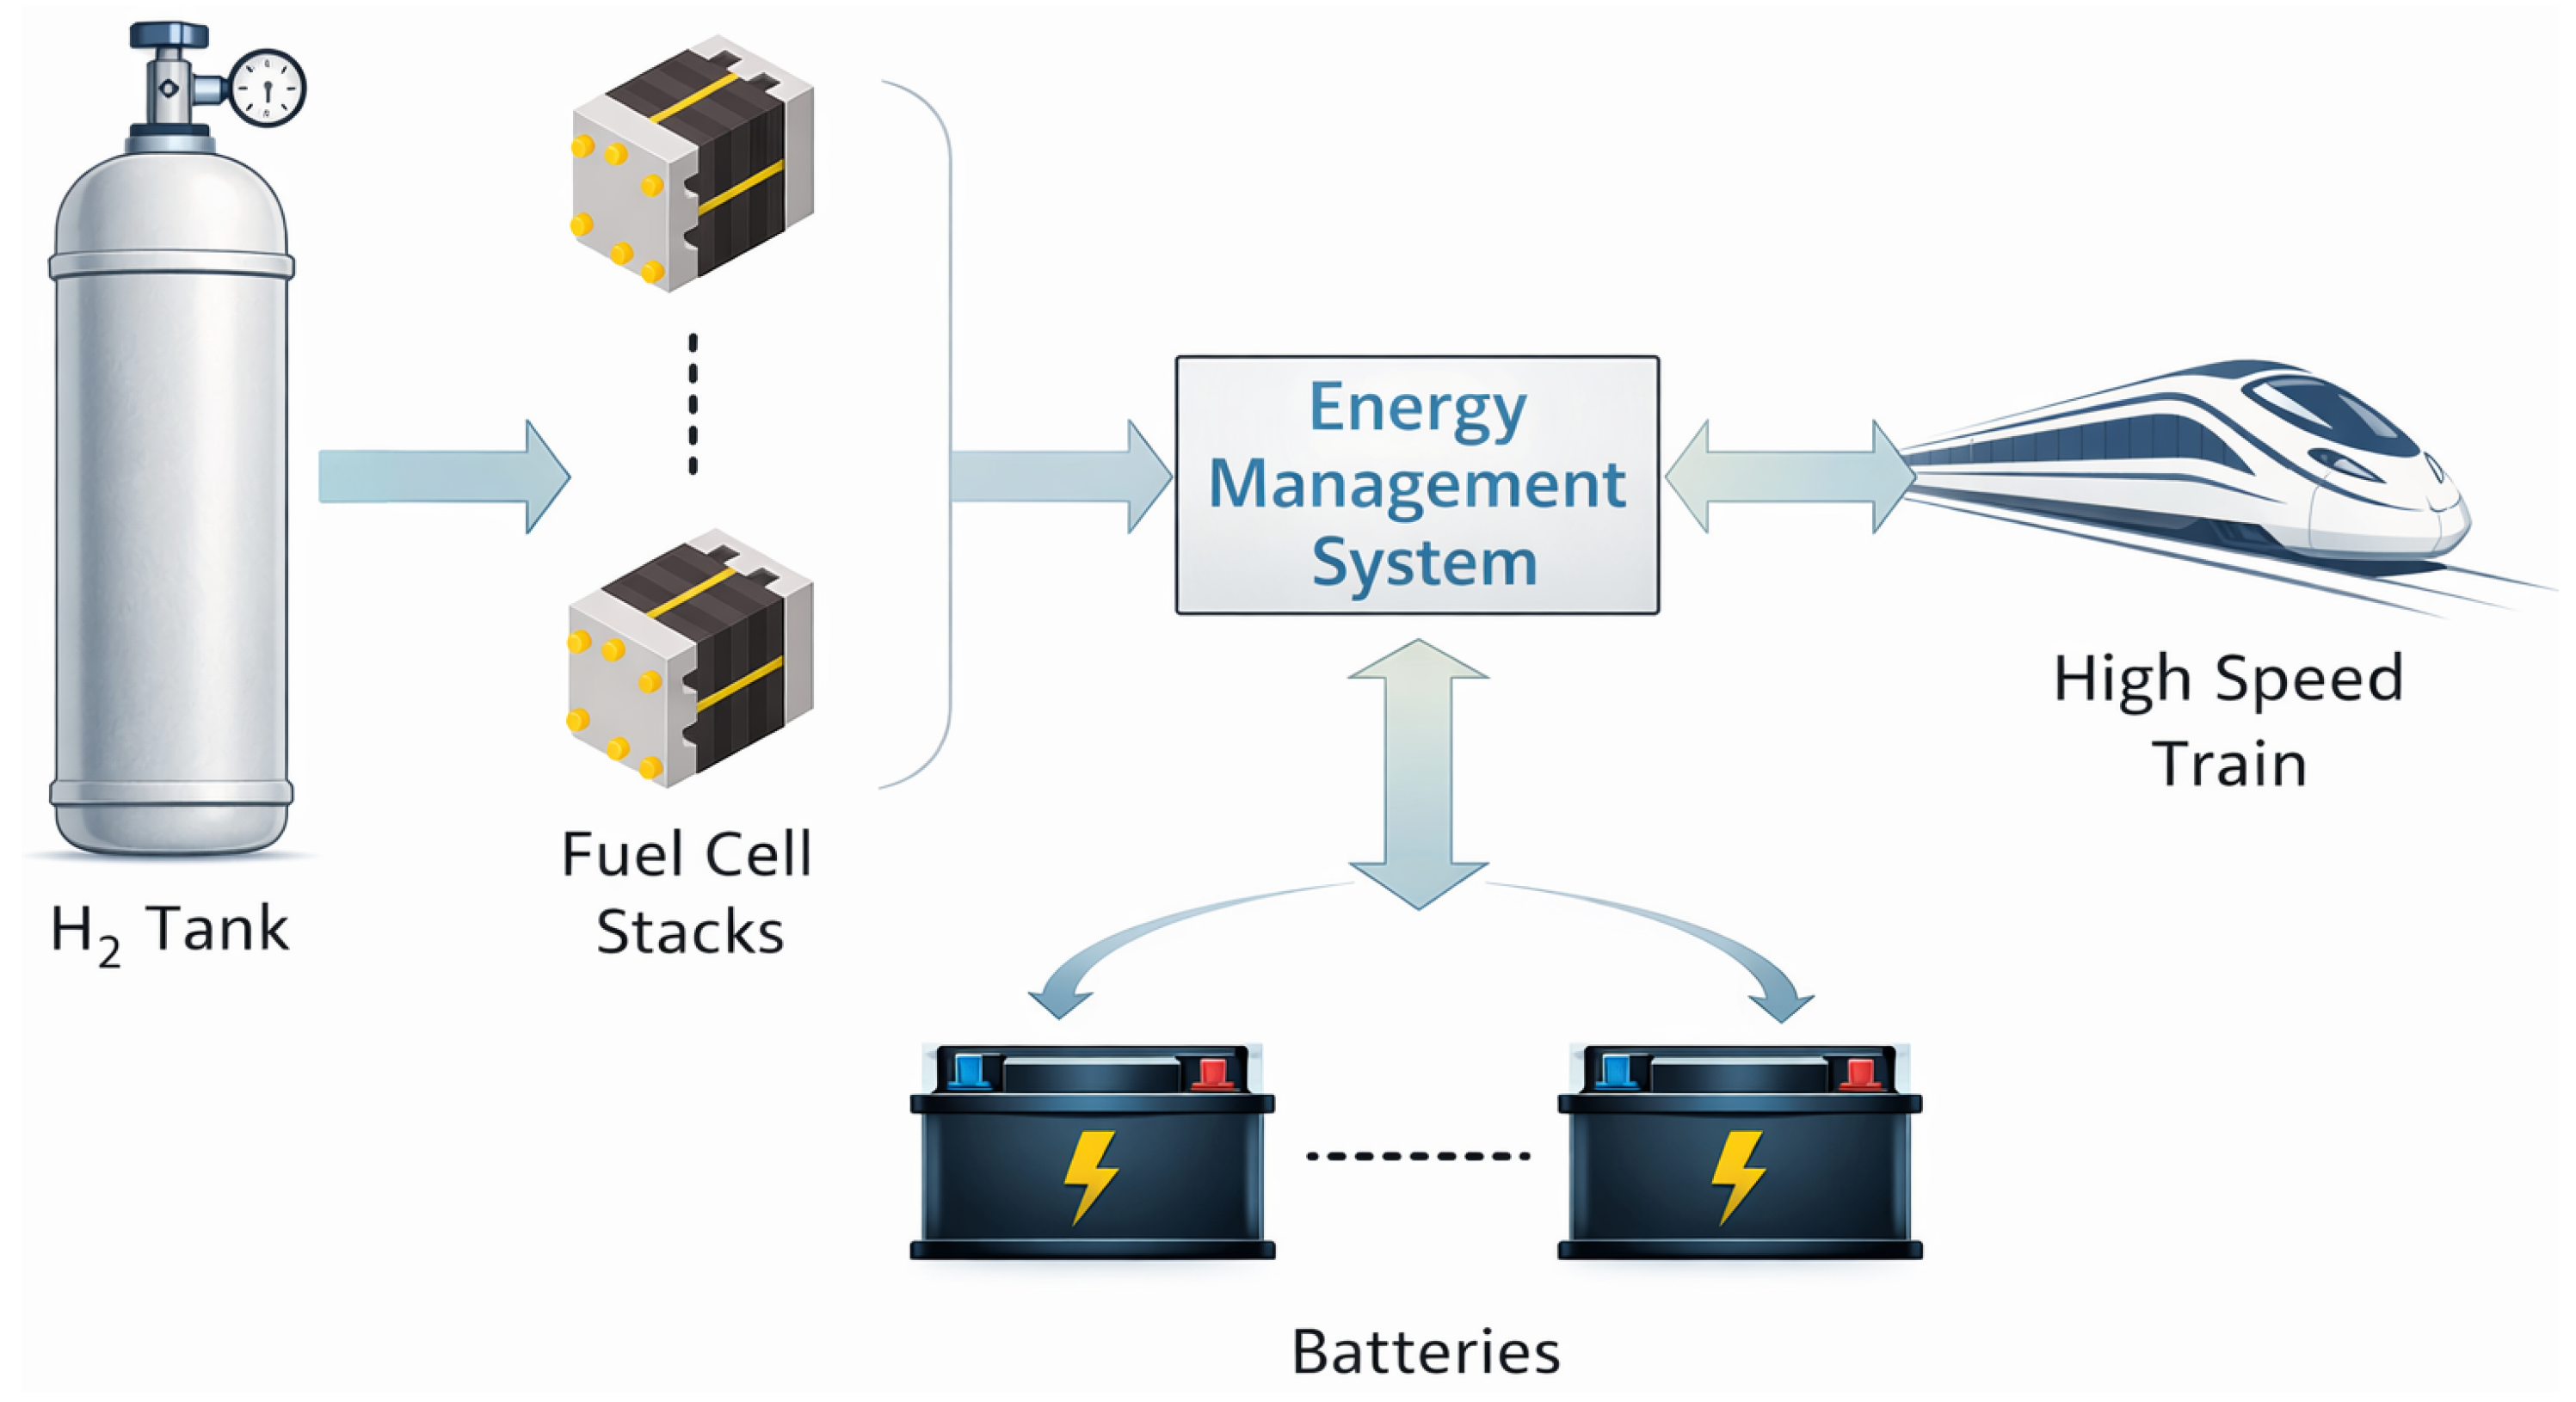
Figure 1 illustrates a hybridized high-speed train configuration integrating a PEMFC as the primary energy source with a supplementary battery energy storage system (BESS). In this architecture, the battery pack serves a dual purpose: capturing kinetic energy through regenerative braking and providing high-rate power augmentation during peak demand phases. A centralized Energy Management Strategy (EMS) dictates the power distribution between the two sources. Notably, the system is designed such that the battery is recharged exclusively via regenerative braking, excluding any power transfer from the FC. This collaborative dispatch reduces the transient stress on the FC, effectively downsizing the required FC capacity.
In this study, the instantaneous power balance of the hybrid FC–battery train is described as:
where
is the traction power demand,
and
are the battery charging and discharging powers,
is the PEMFC output power, and
is the regenerative braking power.
2.2. Train Traction Modelling
The longitudinal dynamics of the high-speed train are modelled using the Davis resistance formulation:
where
m is the train mass, a is longitudinal acceleration,
is traction force,
is rolling resistance,
is mechanical friction resistance,
is gravitational resistance, and
is aerodynamic drag. The traction force is given by
with
being the mechanical power delivered to the wheels and v the instantaneous train speed.
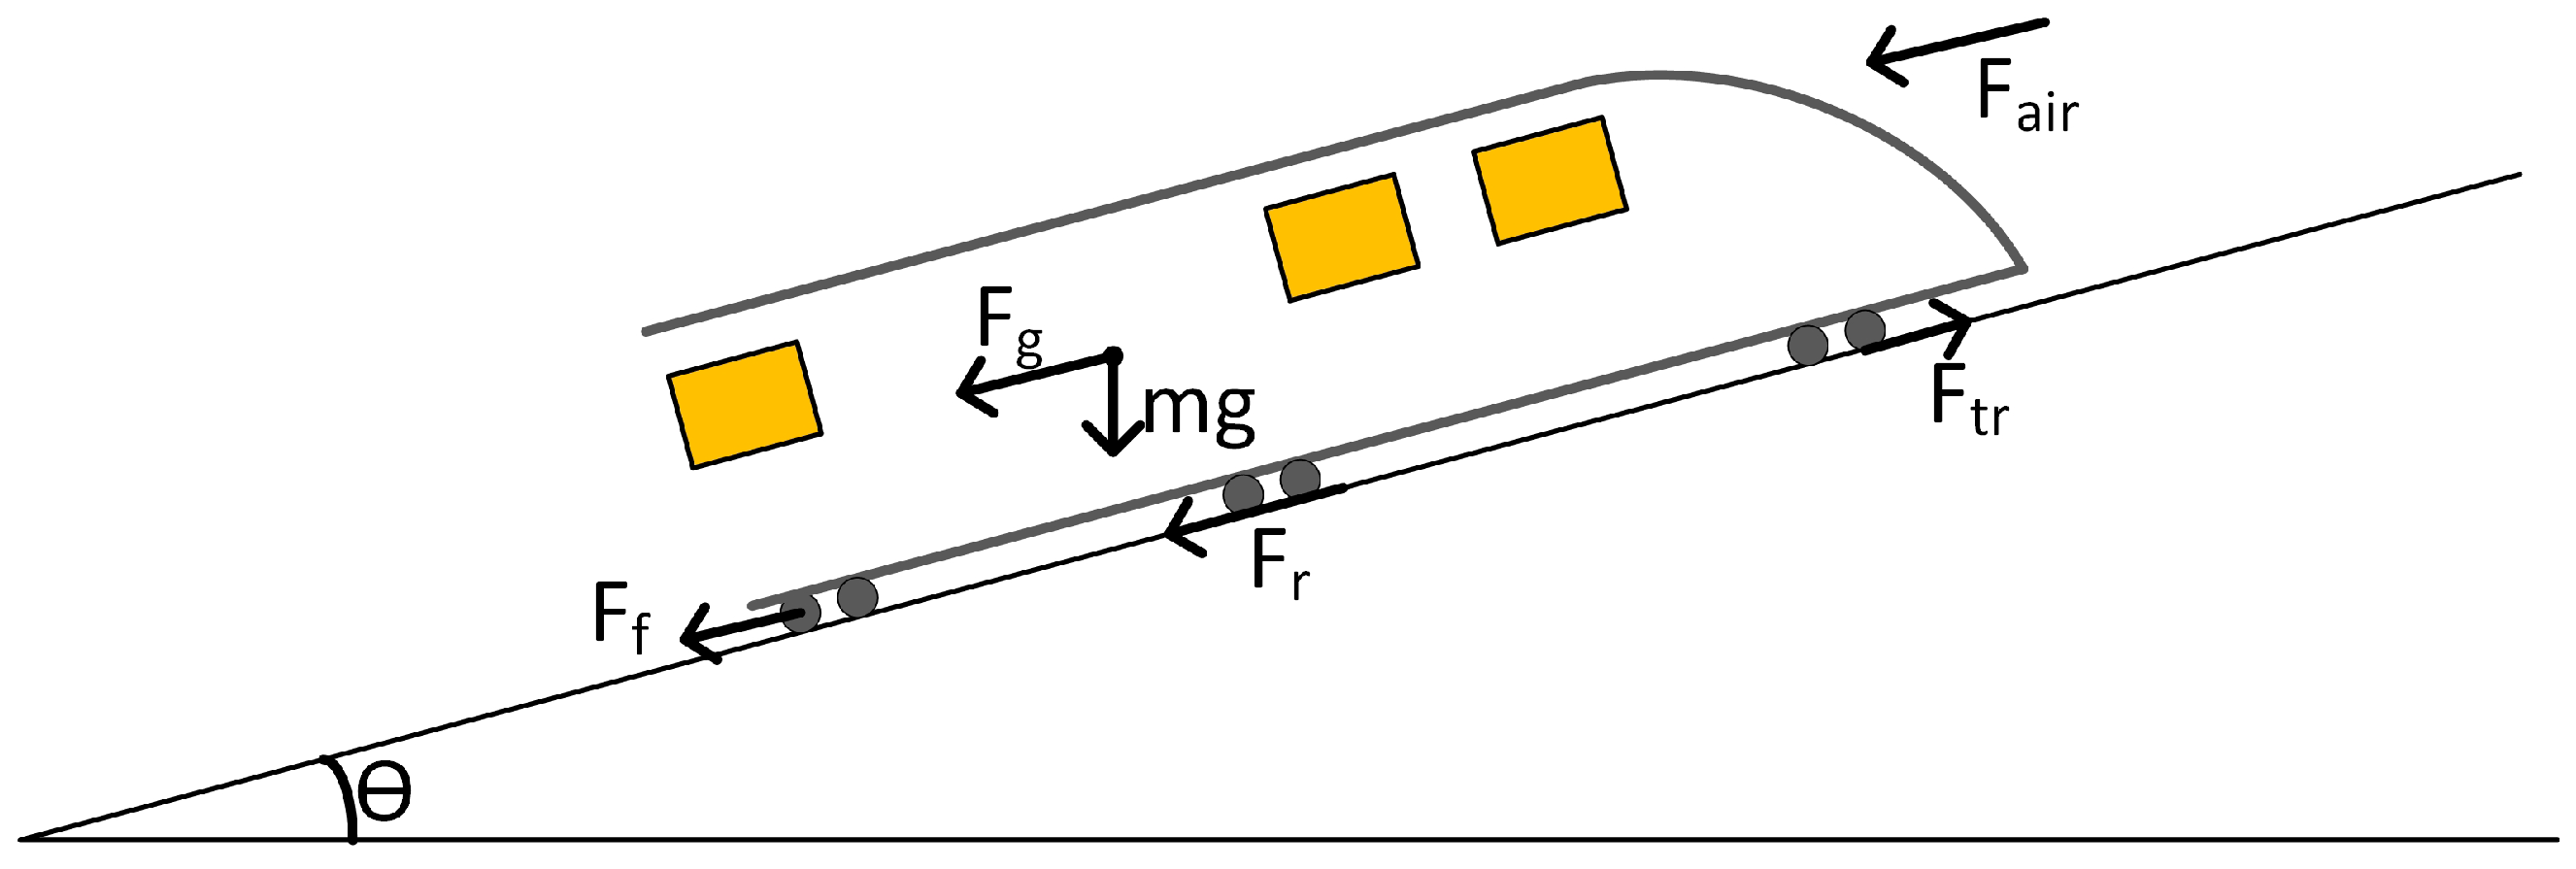
Figure 2 shows Rolling resistance, friction, grade, and aerodynamic forces are calculated using standard formulations accounting for track inclination, wheel-rail interaction, and vehicle geometry.
Equation (
4) explains the rolling resistance due to wheel deformation and track interaction, where
states the rolling resistance coefficient and
accounts for the reduced normal force on the incline.
The friction force is calculated as
in the below formula:
where
is the friction coefficient and mg refers to train’s normal load. Gravitational (grade) resistance is determined by Equation (
6), where
represents the track inclination angle.
The aerodynamic drag resistance is given by Equation (
7), where
is the aerodynamic drag coefficient, A is the frontal area of the train and v is the instantaneous velocity.
Due to aforementioned subjected forces during the journey, it can be seen as a net acceleration force in Equation (
8), which calculated by opposing forces.
2.3. Battery Modelling
Battery charging and discharging constraints ensure electrochemical safety, thermal stability, and power electronic feasibility:
where,
and
denote the maximum allowable charging and discharging power per battery module, respectively, and
is the number of installed modules. The battery state of energy (SoE) is updated at each time step considering efficiency losses:
The initial battery SoE is defined as:
To avoid simultaneous charging and discharging, a binary operational variable u(t) is introduced:
Finally, an upper bound on the battery SoE ensures safe operation:
The battery ageing is originally described by a semi-empirical nonlinear model [
25]:
where
denotes the battery capacity loss, A represents the pre-exponential factor,
is the activation energy (J), B is the compensation factor,
is the charge/discharge rate, R is the universal gas constant (J/mol·K), T is the battery temperature (K), and Ah denotes the Ah-throughput. The Ah-throughput is calculated as
where n is the cycle number and z is the power-law ageing exponent. The degradation parameters were experimentally identified in previous studies through accelerated cycle life tests, and the coefficients were calibrated using the least-squares method. Accordingly, the parameter values adopted in this study are A = 0.0032,
= 15,162, B = 1516, R = 8.314, and z = 0.824.
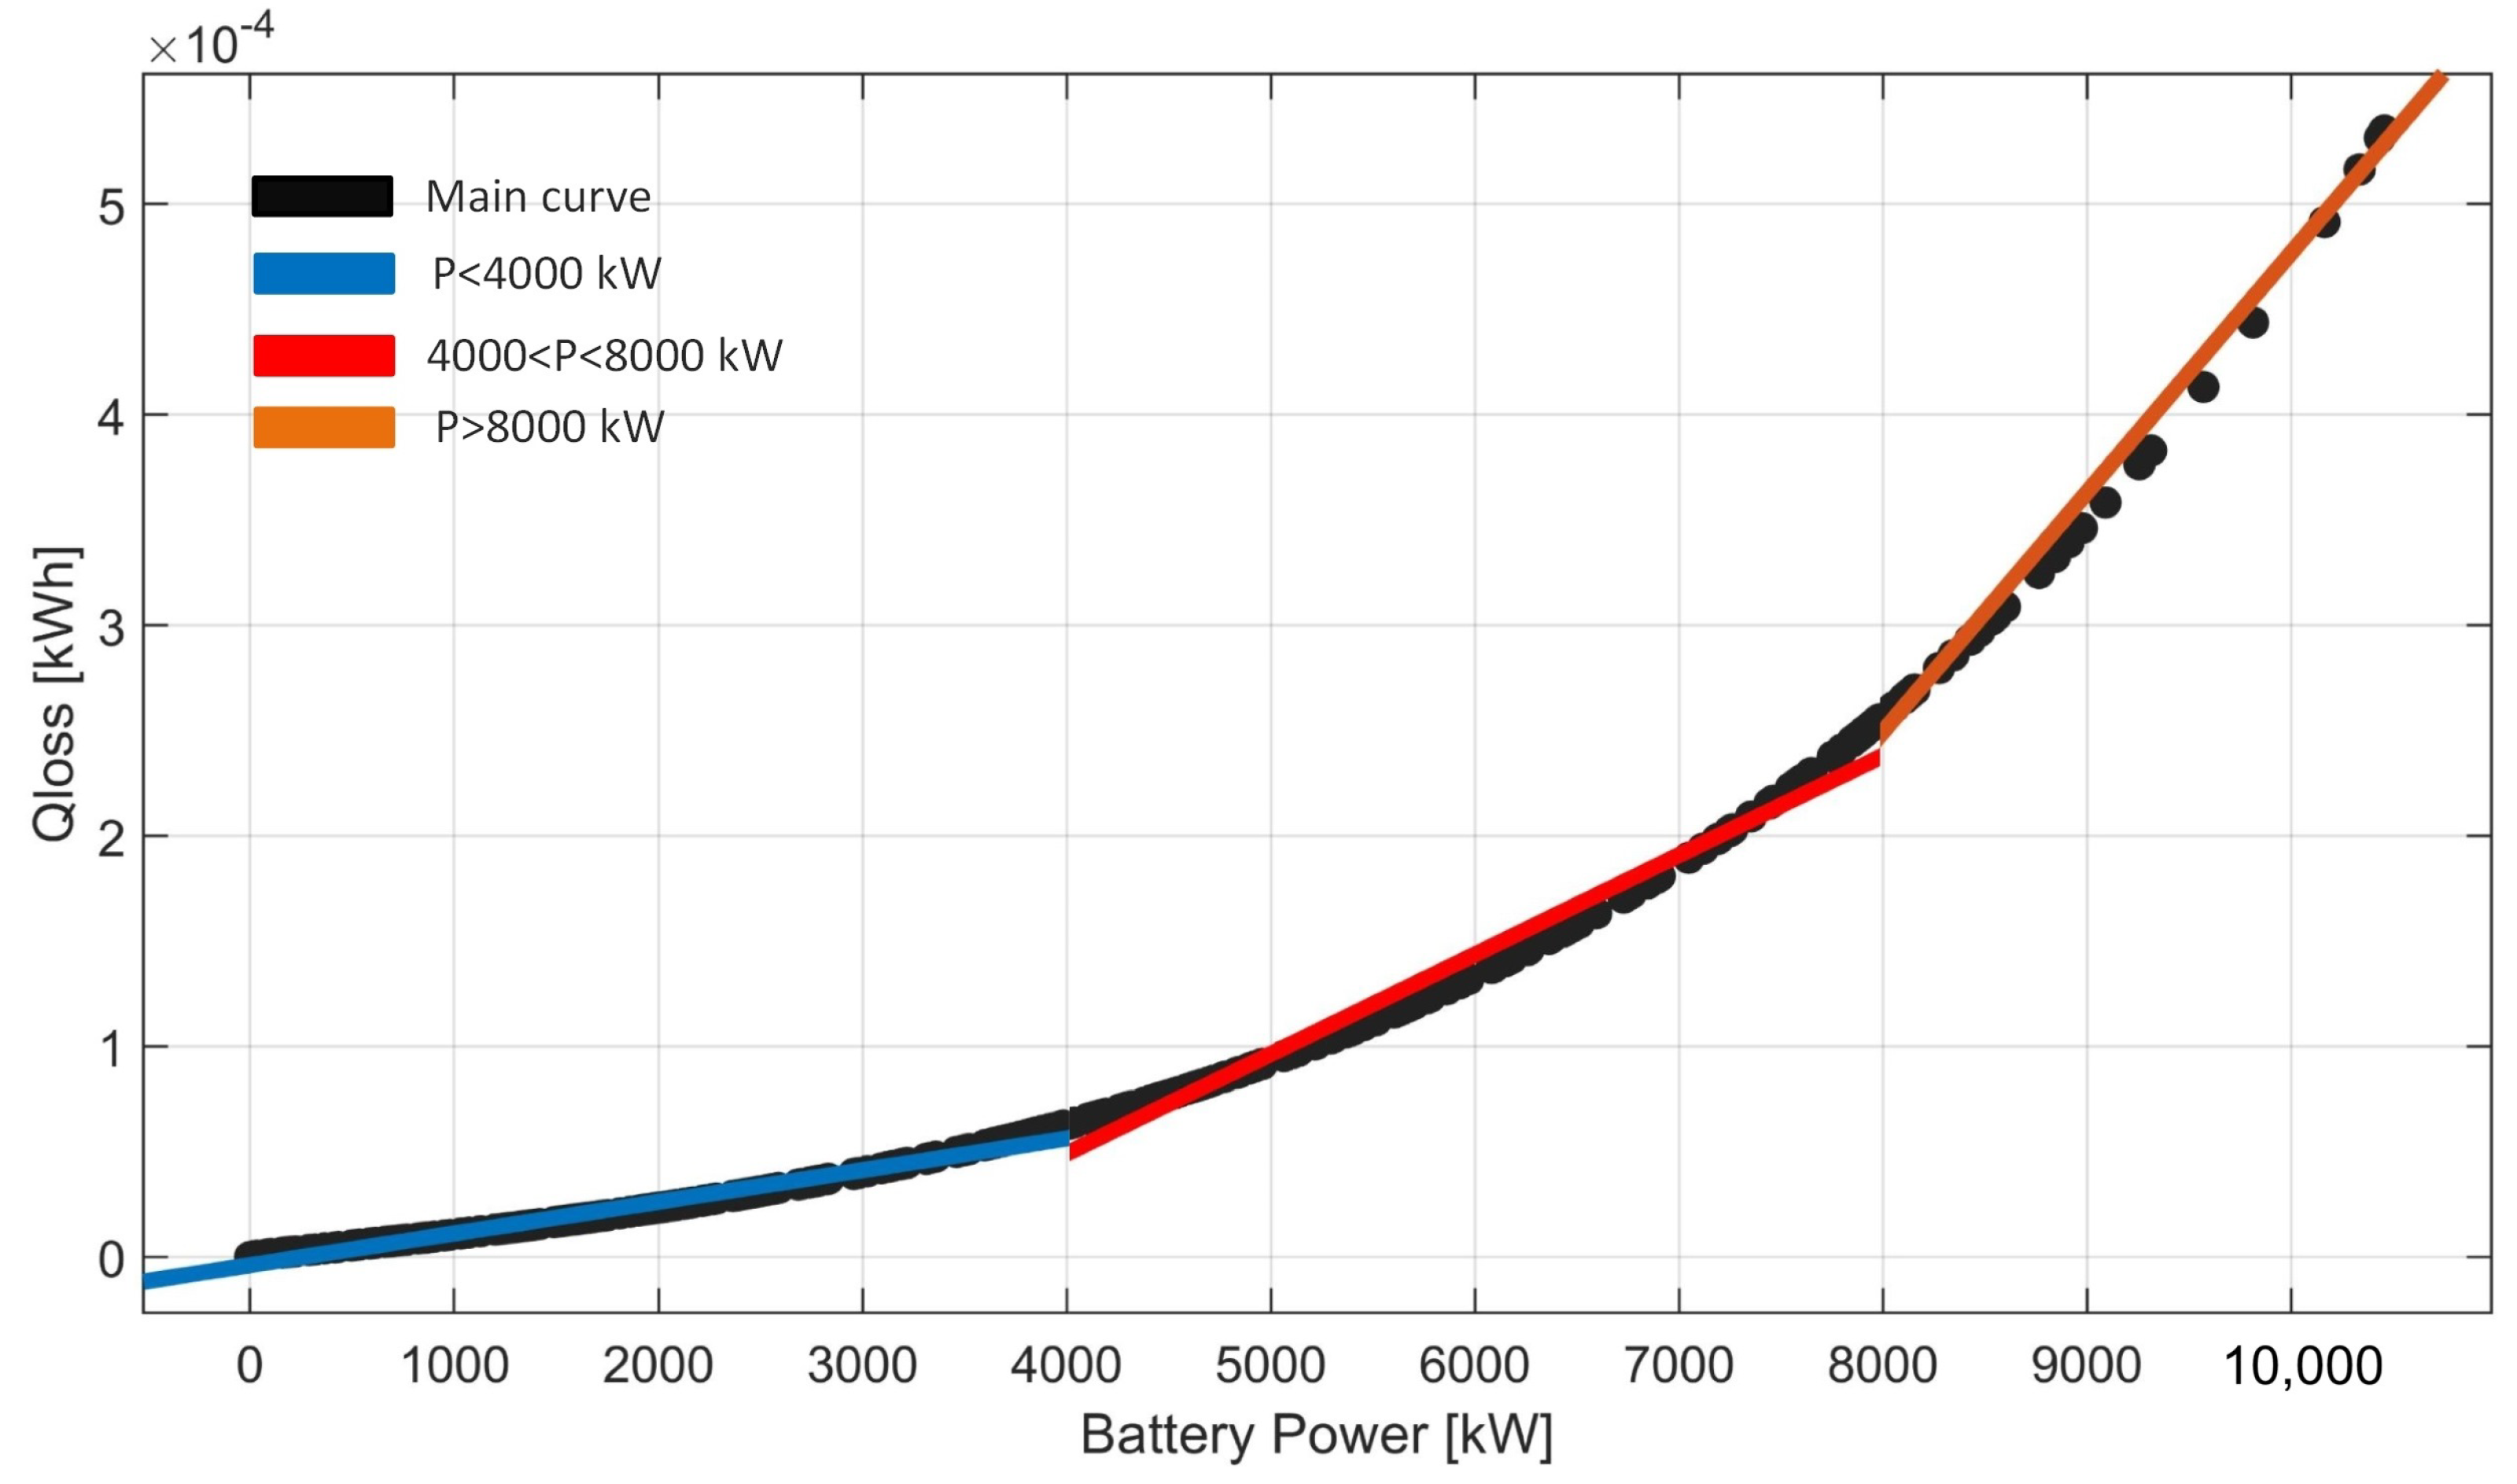
Although this formulation accurately represents battery ageing behaviour, its nonlinear exponential and power-law structure significantly increase the computational complexity of the optimization problem and leads to longer solution times, particularly in large-scale energy management formulations. To enable efficient optimization, the degradation model was linearized through a data-driven approximation procedure. For a given battery capacity configuration, the lifetime degradation process was simulated in MATLAB 2026a by iteratively applying the ageing equation over successive operating cycles. This procedure produced a mission number–capacity loss relationship over the entire battery lifetime. The mission number corresponding to the end-of-life condition, defined as the point where the battery capacity decreases to 80% of its nominal value, was identified. Based on these simulation results, the relationship between battery power and incremental capacity loss was obtained using the MATLAB Curve Fitting Toolbox. The resulting degradation curve was approximated using a piecewise linear representation. Specifically, the capacity loss characteristic was divided into three operating regions to preserve model accuracy while maintaining linearity suitable for optimization. To validate the accuracy of the piecewise linear approximation, a detailed curve fitting analysis was performed for the battery degradation model. The coefficient of determination () was calculated for each segment, yielding values of 0.97726 for the region below 4000 kW, 0.98411 for the 4000–8000 kW range, and 0.99274 for the region above 8000 kW. These high values indicate an excellent agreement between the original nonlinear degradation characteristics and their piecewise linear representation. Furthermore, similar levels of fitting accuracy were observed across different operating scenarios, confirming the robustness and reliability of the adopted linearization approach for system-level optimization.
As illustrated in
Figure 3, the degradation curve corresponding to a configuration with Scenario-3 battery units was linearized as follows:
For 4000 <
≤ 8000 kW:
2.4. Fuel Cell Modelling
Before creating the FC modelling and its power consumption, FC power limitation is an important parameter because a PEMFC stack cannot deliver unlimited power [
19]. The FC output power is constrained by its rated capacity to ensure electrochemical feasibility and safe operation. The upper bound corresponds to the maximum allowable stack power determined by current density and thermal limitations. Enforcing this constraint prevents non-physical optimization outcomes and preserves the validity of the hydrogen consumption and degradation models. It also guarantees that transient peak demands are appropriately managed by the battery subsystem in the hybrid architecture. As given below, the formula ensures that all subsequent modelling is performed within physically realizable limits
where
distinguishes the FC from bidirectional storage devices; thus, FCs cannot absorb power (unlike batteries).
is the maximum rated power of a single FC stack. Subsequently, the FC power consumption equation is given as following and this equation is central to this study’s analysis because it connects FC power dispatch to hydrogen consumption
where
is the hydrogen mass consumed during the time interval
.
is FC electrical output power, and
is the lower heating value (LHV) of hydrogen and refers to the usable chemical energy per unit mass of hydrogen, excluding latent heat of vaporization. The typical value is 33.33 kWh/kg. LHV is used instead of higher heating value (HHV) because PEMFC systems do not recover condensation heat. Due to learning the total hydrogen consumption within one journey from A to B location, the below sum up formula gives the consumption figure:
In PEMFCs, degradation mechanisms are strongly influenced by load cycling, power ramp rates, start-stop cycles, voltage fluctuations and membrane mechanical stress [
26]. FC degradation induced by dynamic load variations is modelled as proportional to the absolute change in power between consecutive sampling instants. This formulation captures the well-documented sensitivity of PEMFCs to load cycling and transient operation. By penalizing rapid power fluctuations, the proposed model below promotes smoother FC operation and highlights the battery’s buffering role in reducing stack degradation under railway duty cycles. To prevent unnecessary degradation, this study assumes that the PEMFC remains operational throughout the operation. Therefore, the degradation caused by start–stop conditions can be disregarded in this study. Frequent and rapid power changes cause mechanical fatigue and catalyst layer stress:
Therefore, larger power swings lead to greater degradation, whereas smoother operation yields lower degradation. is the instantaneous degradation rate due to load change and shows incremental damage caused specifically by dynamic power transitions, which means it does not represent steady-state ageing; rather, it captures cycling-induced stress. is the absolute power variation, which represents the magnitude of the transient load change regardless of direction (increase or decrease). d is the degradation sensitivity coefficient, which reflects the FC stack’s sensitivity to load variations. A higher value indicates a more sensitive stack, and a lower value indicates a more robust stack. Unlike batteries, FCs degrade strongly under dynamic load variation. In railway applications, traction demand is highly transient, with acceleration and braking frequently occurring.
2.5. Hydrogen Tank and Battery Volume Modelling
Due to limited space on high-speed rolling stock, this study ensures sufficient space for a hydrogen tank and a battery stack without compromising passenger capacity, while maintaining the maximum intervals. Therefore, the rolling stock roof and available areas are used for those. In this regard, defining the initial hydrogen mass (or State of Mass, SoM) is mathematically necessary and physically meaningful in a FC–battery hybrid railway system:
This equation defines the total initial hydrogen mass stored on board the train at the beginning of the simulation or duty cycle, as hydrogen is the primary energy source of the hybrid system, where
is the total initial hydrogen mass onboard and represents the total usable hydrogen available at departure.
is the initial hydrogen mass per tank and states the stored hydrogen in a single tank module. In addition to the above equation, this study also monitors the current charge status of the hydrogen tank and the extent to which its value has dropped. The following equation describes the discrete-time evolution of hydrogen mass stored in the onboard tank system:
Since hydrogen is consumed only (no onboard production in the study), the system is strictly monotonic decreasing unless refuelling occurs, where is the current hydrogen mass at time step t and refers to the remaining hydrogen stored onboard. is the hydrogen mass at the previous time step. Because hydrogen storage is dynamic, the current state depends on past consumption history.
Furthermore, A global volumetric constraint is imposed to ensure the physical feasibility of the hybrid energy system within the limited installation space of the railway vehicle. The total occupied volume of battery modules, FC stacks, and hydrogen tanks must not exceed the available train volume. This constraint prevents unrealistic oversizing of energy components and introduces a realistic trade-off between power capability, energy capacity, and vehicle packaging limitations.
where
is the quantity of battery modules,
refers to the unit volume of battery,
states the number of FC stacks,
represents unit volume of FC stack,
indicates number of H2 tanks, and
shows unit volume of H2 tanks.
is the total available installation volume in the train and represents the maximum usable space allocated to energy system components. In addition to spatial limitations, the proposed hybrid configuration is subject to a rigorous mass constraint to ensure compliance with the train’s maximum axle load specifications. Equation (
28) defines the upper bound for the cumulative weight of the power system. This boundary condition is pivotal for the optimization algorithm, as it accounts for the parasitic energy losses associated with increased locomotive mass and ensures the structural and dynamic integrity of the high-speed rail vehicle.
where
,
and
indicate mass per battery module, FC stack and hydrogen tank, respectively.
2.6. Cost Modelling
This study also considers cost modelling for hydrogen consumption, battery and FC degradation, and the initial costs of the FC, battery, and hydrogen tank. The other equipment is not included in the calculation because it is standard rolling stock, such as the train body and common components. The total hydrogen fuel cost is calculated as the product of the unit hydrogen price, the hydrogen mass consumed per trip, and the number of operational trips within the considered horizon. This Formulation (18) directly links FC power dispatch to economic performance, thereby enabling techno-economic optimization of the hybrid railway system. Incorporating hydrogen costs enables a realistic assessment of operational feasibility under varying market conditions.
where
represents total fuel expenditure over the considered operational horizon.
refers to the market price of hydrogen fuel.
comes from Equation (
23) and shows the total hydrogen required to complete one trip.
indicates the number of trips within the considered time horizon. The initial capital cost of the hybrid propulsion system is modelled as the sum of FC, battery, and hydrogen storage investments. The FC cost is expressed as a function of installed power capacity, while battery and hydrogen storage costs are modelled per module. Incorporating the initial investment cost into the optimization framework ensures balanced system sizing and enables lifecycle economic evaluation of the proposed hybrid railway architecture.
With this equation, research tries to investigate modelling of the capital expenditure (CAPEX) of the hybrid propulsion system, where , and specify the cost per unit of FCs, battery and hydrogen tanks.
Battery degradation cost is estimated by normalizing the accumulated capacity loss with respect to the allowable end-of-life threshold of 20%, which corresponds to the industry-standard 80% remaining capacity criterion. This normalization converts physical capacity to an equivalent fraction of battery lifetime consumption. Multiplying this fraction by the battery replacement cost yields the monetized degradation cost (
31). This approach enables integration of battery ageing into the techno-economic optimization framework.
where
is the total accumulated capacity loss over the trip. 20% is widely used as a threshold capacity loss before end-of-life [
24]. In the same regard, the economic impact of FC ageing is quantified by scaling the cumulative degradation index with respect to the predefined end-of-life (EOL) threshold of 10%, which reflects the widely adopted criterion of 90% remaining rated power for stack replacement [
27]. Such a formulation systematically embeds FC durability considerations into the techno-economic optimization framework.
where
represents the total loss in rated power capability. %10 is allowable degradation before end-of-life. Finally, the overall techno-economic performance of the hybrid propulsion system is evaluated through the total cost function, which is defined as the objective function of the optimization problem. The proposed framework aims to determine the optimal system configuration by minimizing the total lifecycle cost, which includes the initial investment cost, FC degradation cost, battery degradation cost, and hydrogen consumption cost. Accordingly, the optimization problem is formulated as
where
represents the total system cost to be minimized within the proposed optimization framework.
3. Tests and Results
The study is conducted on an ongoing high-speed rail project, which is under construction between Bursa and Osmaneli in Türkiye. Therefore, the real gradient, curve, tunnel and station structure information, viaduct and bridge values, speed intervals and restrictions are used in order to reflect real operational behaviour to modify the dimensions of the FC and battery and incorporate energy management and to determine the optimal dimensions of the battery and FC. The aim is to find the integrated optimization design parameters for the train values under the real environment. In this section, the dynamic performance and techno-economic evaluation of the hybrid FC–battery high-speed train are examined under different battery sizing scenarios using the developed energy management algorithm; furthermore, the simulation results are analyzed. The integrated model, combining Davis-based longitudinal dynamics, hybrid power balance, battery and hydrogen state evolution, and degradation-aware optimization, is solved using MILP a CPLEX solver in GAMS software 52.4 [
28].
Table 2 summarizes the main physical and economic parameters employed in the hybrid train model. Battery modules are characterized by their initial and maximum state of energy, individual mass, volume, and replacement cost. FC stacks are defined by their rated power, mass, volume, and cost per kilowatt. Hydrogen storage is represented through individual tank capacity, mass, volume, and cost, along with the unit fuel price. Finally, the total train constraints on installation volume and overall mass ensure realistic system sizing and operational feasibility within the rolling stock.
In
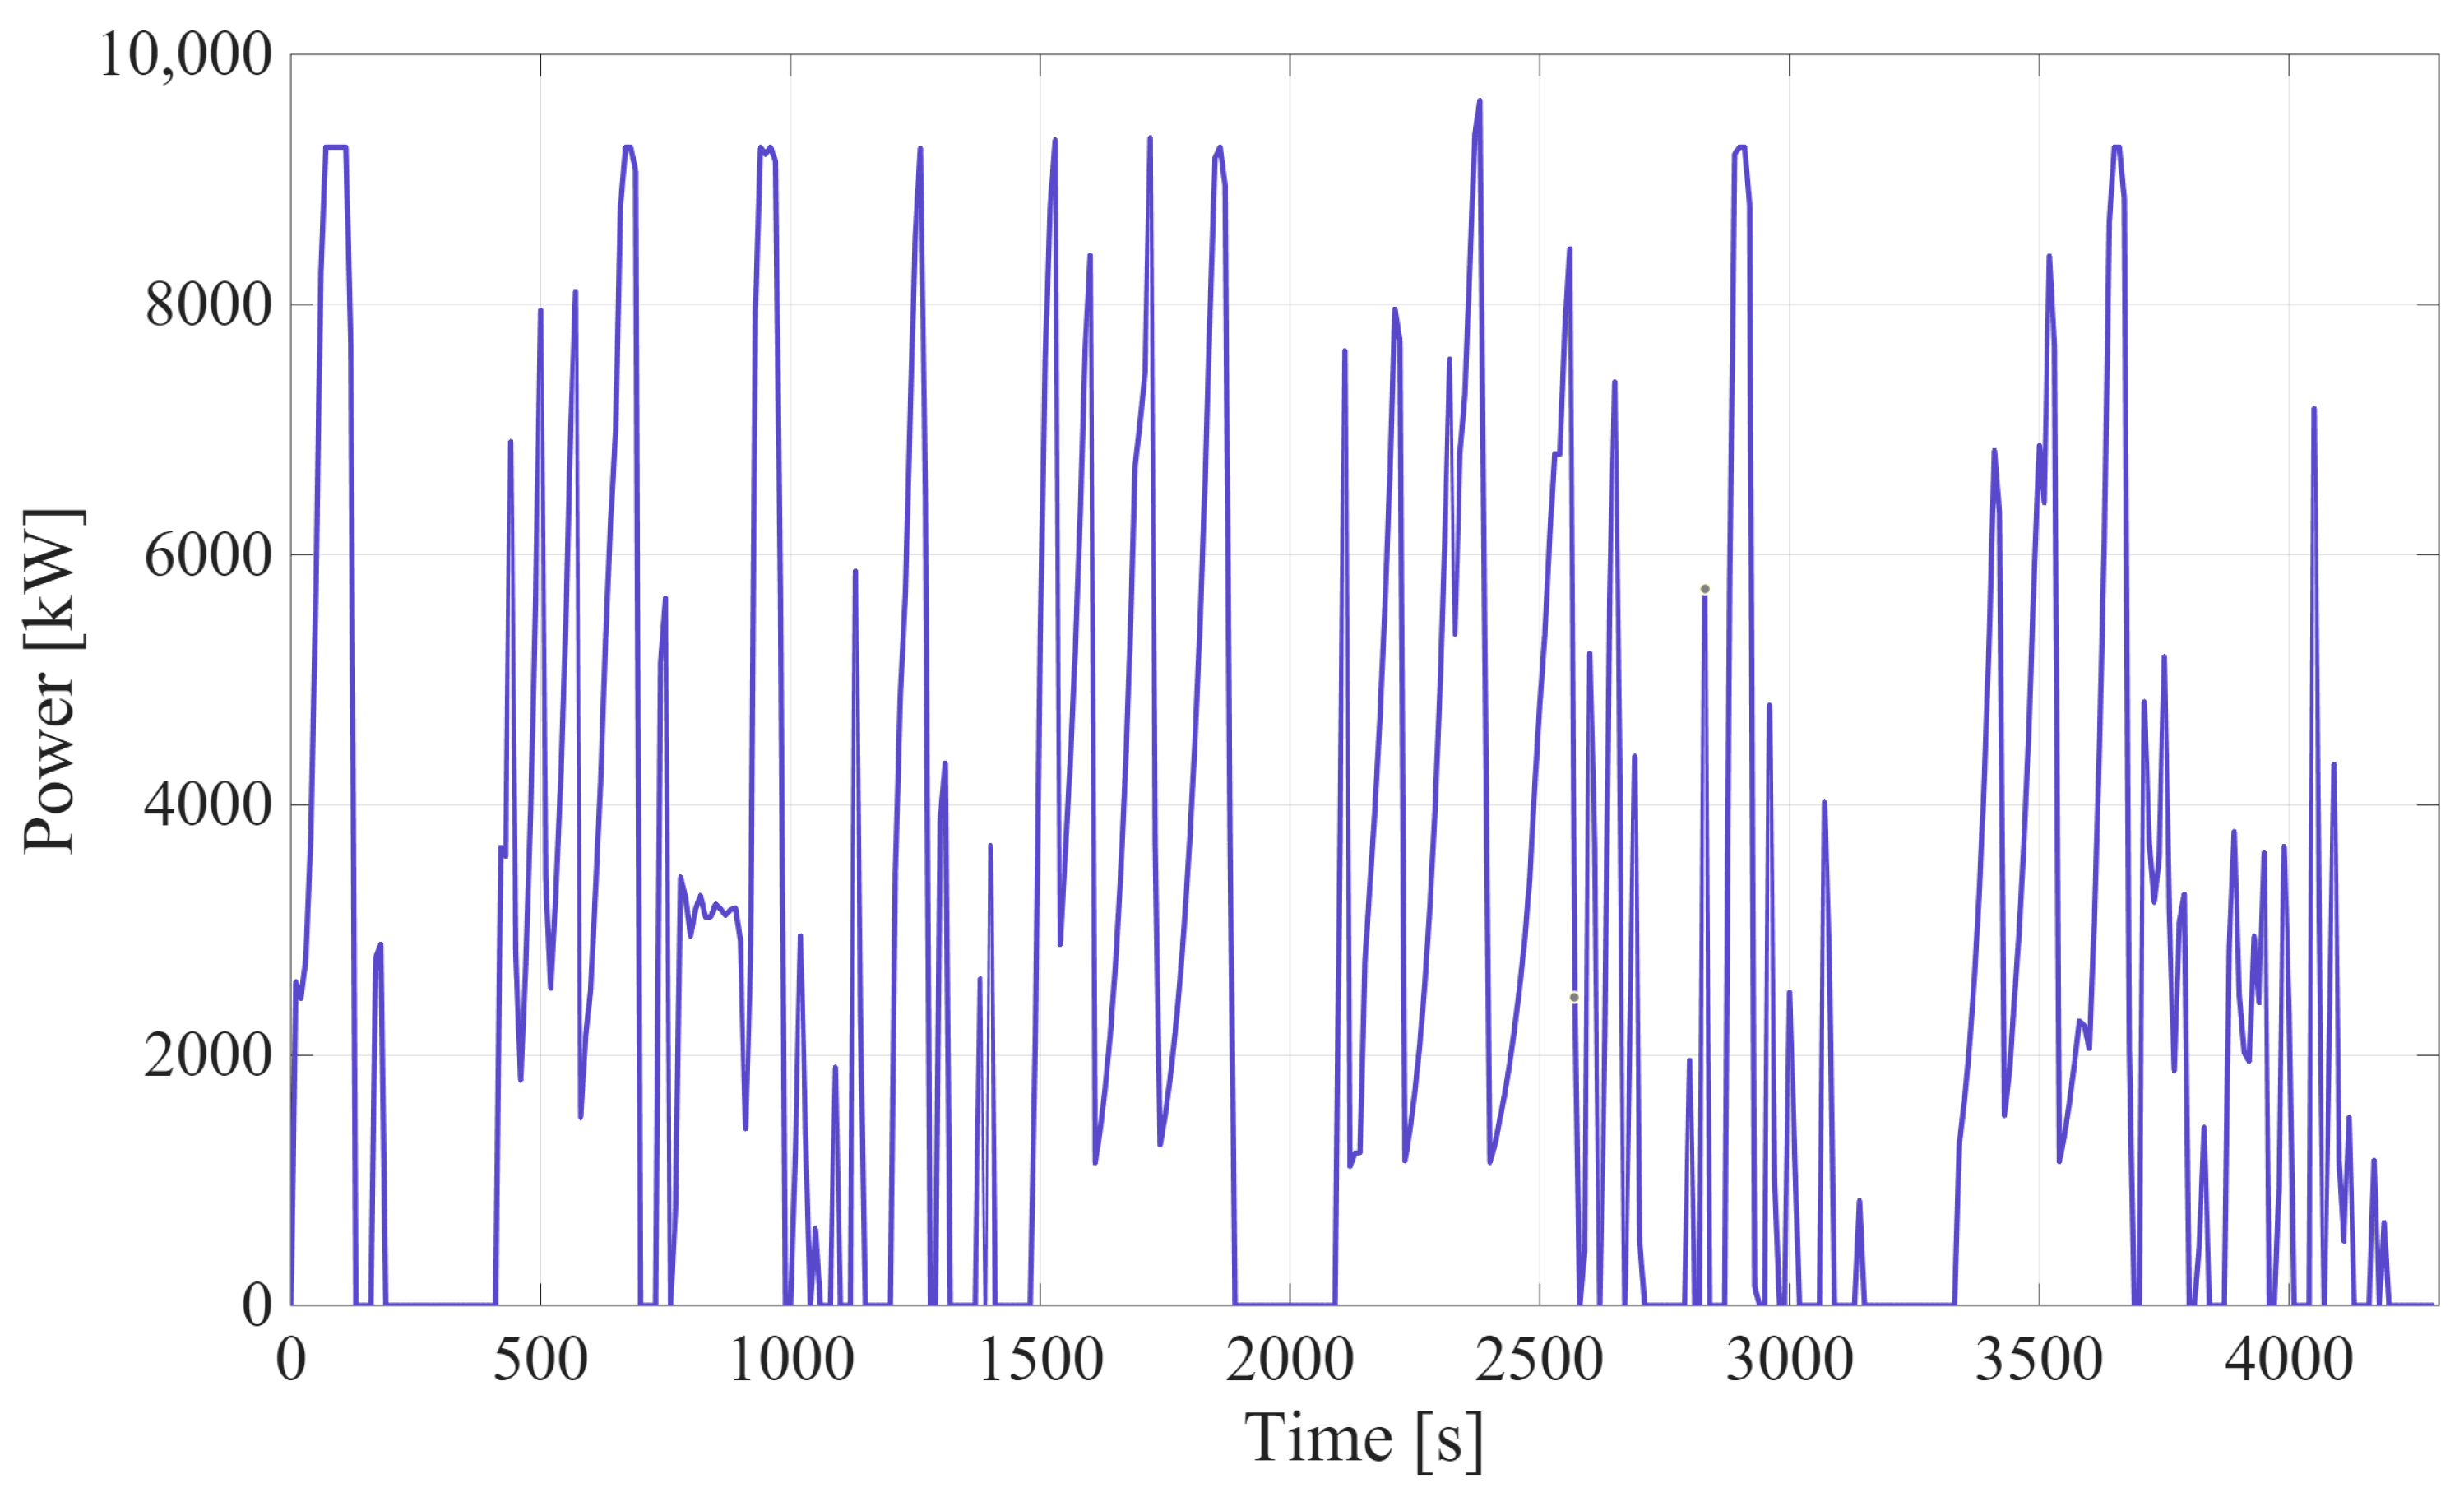
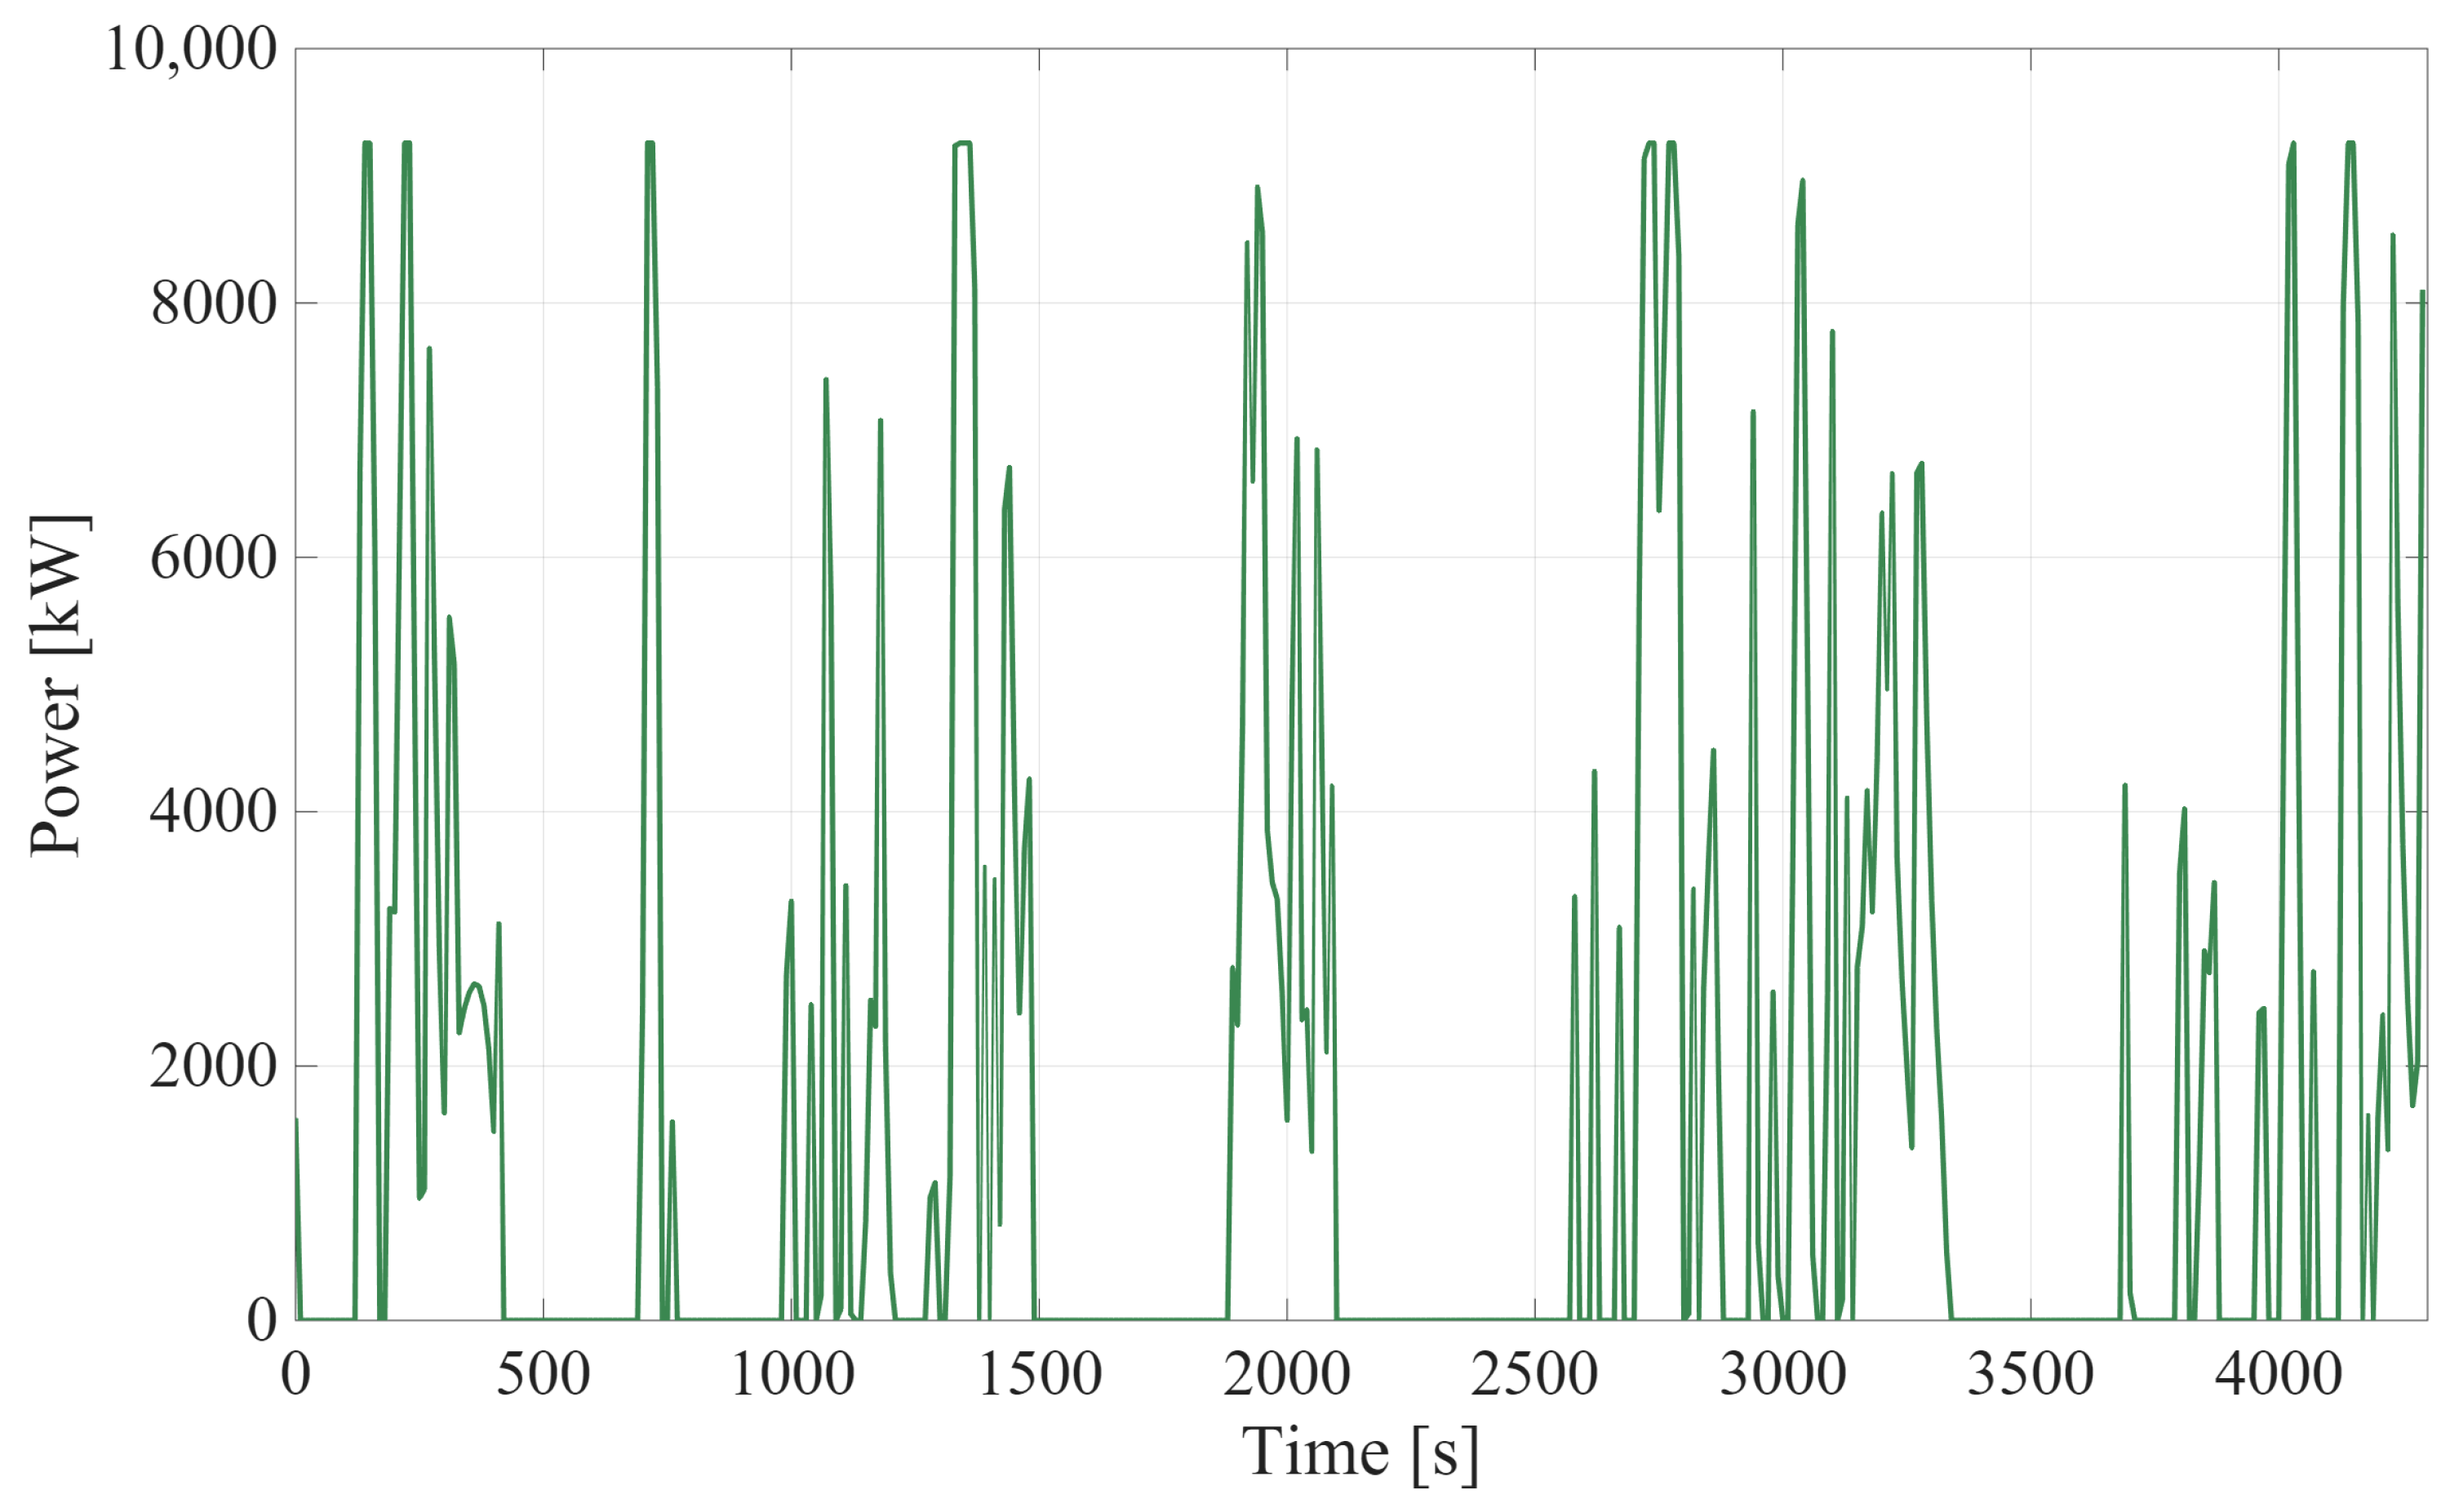
Figure 4, the traction power profile demonstrates highly dynamic behaviour over the simulated trips, with peak values approaching approximately 9–10 MW. These peaks correspond to acceleration phases and uphill operations where the traction force must overcome the combined effects of aerodynamic drag
, rolling resistance, mechanical friction, and gravitational force
. At high speeds over 200 km/h, aerodynamic resistance becomes the dominant component, significantly increasing mechanical power demand due to its quadratic dependence on velocity. Intervals of near-zero traction power indicate cruising at constant speed with balanced resistive forces or coasting periods determined by the optimization strategy. The sharp transitions reflect realistic operational behaviour under gradient variations and scheduled speed changes across station stops.
The regenerative power profile in
Figure 5 exhibits intermittent high-power recovery events, with magnitudes comparable to traction peaks (up to approximately 9 MW). These events occur during braking phases and downhill segments, where the net force becomes negative and kinetic as well as potential energy is converted back into electrical energy.
The presence of substantial regenerative spikes confirms effective utilization of gradient-induced deceleration and speed reductions. The optimized control strategy allows the battery system to absorb these energy pulses within its charging constraints, thereby reducing hydrogen consumption and mitigating FC load fluctuations. The alternating pattern between traction and regenerative peaks highlights the dynamic nature of high-speed railway operation and establishes the foundation for analyzing battery sizing impacts in subsequent scenarios.
In this study, seven different scenarios are defined to systematically evaluate the impact of key design and economic parameters on the hybrid propulsion system. The scenarios differ in terms of battery number, hydrogen unit price, and fuel cell (FC) unit cost. For each scenario, the proposed MILP-based framework determines the optimal number of fuel cell units and hydrogen tanks while simultaneously performing energy management by explicitly considering both battery and FC degradation effects. The overall objective is to minimize the total lifecycle cost by capturing the trade-offs between initial investment, hydrogen consumption, and component ageing costs.
As presented in
Table 3, the results quantitatively demonstrate the sensitivity of the system to these parameters. Increasing the battery number from 200 to 300 (Scenarios 1–3) reduces the required FC number from 31 to 18 and decreases the total cost from
USD to
USD (approximately 49.5% reduction). In parallel, battery degradation cost decreases from
USD to
USD, and FC degradation cost drops from
USD to approximately
USD, highlighting the strong impact of battery sizing on reducing FC stress.
When the FC unit price is varied (Scenarios 3–5), decreasing the cost from 300 USD/kW to 150 USD/kW reduces the total cost from USD to USD, whereas increasing it to 500 USD/kW raises the total cost to USD. Similarly, hydrogen price variations significantly affect operational cost: increasing the hydrogen price from 6 USD/kg to 10 USD/kg (Scenario 6) increases hydrogen consumption cost from approximately 1.64 million USD to 2.74 million USD and raises the total cost to USD. Conversely, reducing the hydrogen price to 2.5 USD/kg (Scenario 7) lowers the hydrogen cost to 0.68 million USD, although the total cost remains at a similar level ( USD) due to the dominance of degradation costs.
Across all scenarios, the hydrogen tank number remains constant at 10, indicating that storage requirements are dictated by operational constraints rather than economic parameters. Overall, the results clearly show that increasing battery capacity significantly reduces FC degradation (from USD to the order of USD) and total system cost, while hydrogen and FC pricing mainly influence the economic distribution of costs rather than the optimal system topology.
The first three scenarios are considered as the base cases, and among them, Scenario 3 provides the most favourable results in terms of overall system performance and cost. Therefore, the dynamic behaviour of the system under this scenario is illustrated in
Figure 6,
Figure 7,
Figure 8,
Figure 9 and
Figure 10. In particular,
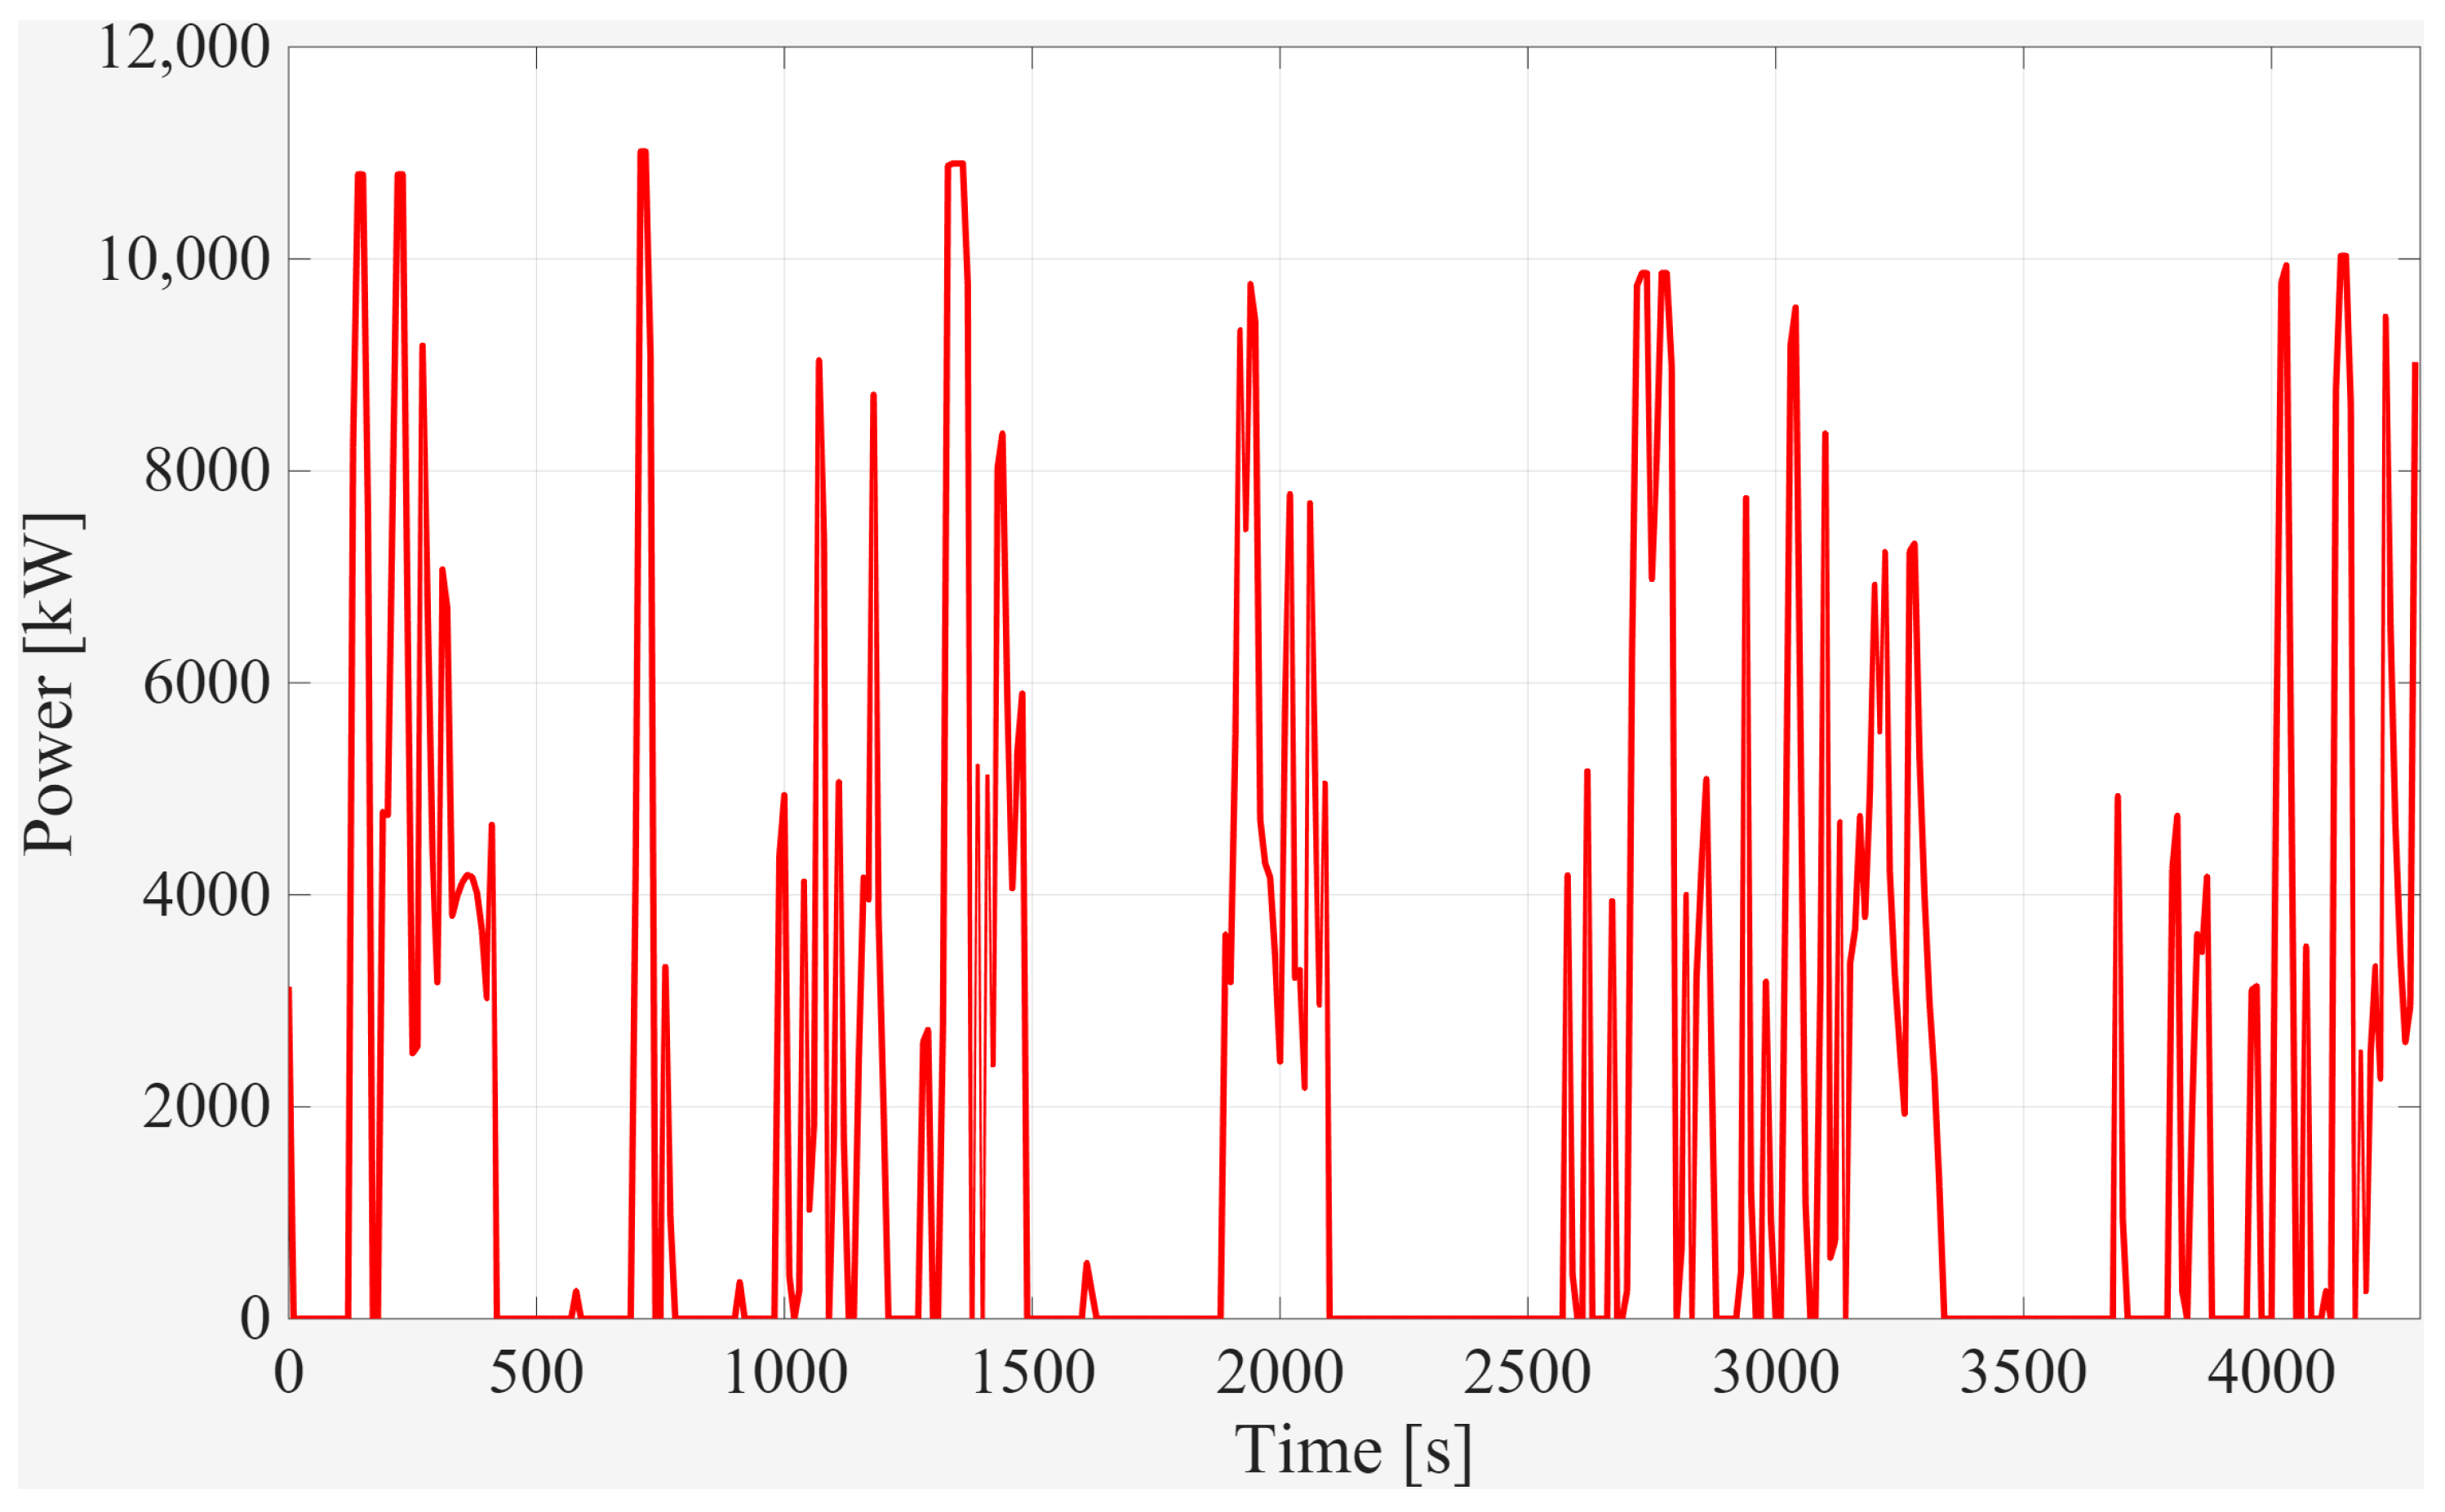
Figure 6 presents the battery charge power profile over the entire trip duration of 4300 s. The results show that the charging power reaches a maximum value of approximately 11,000 kW, indicating that regenerative braking energy constitutes a significant contribution to the energy flow and plays an important role in the overall energy management of the system.
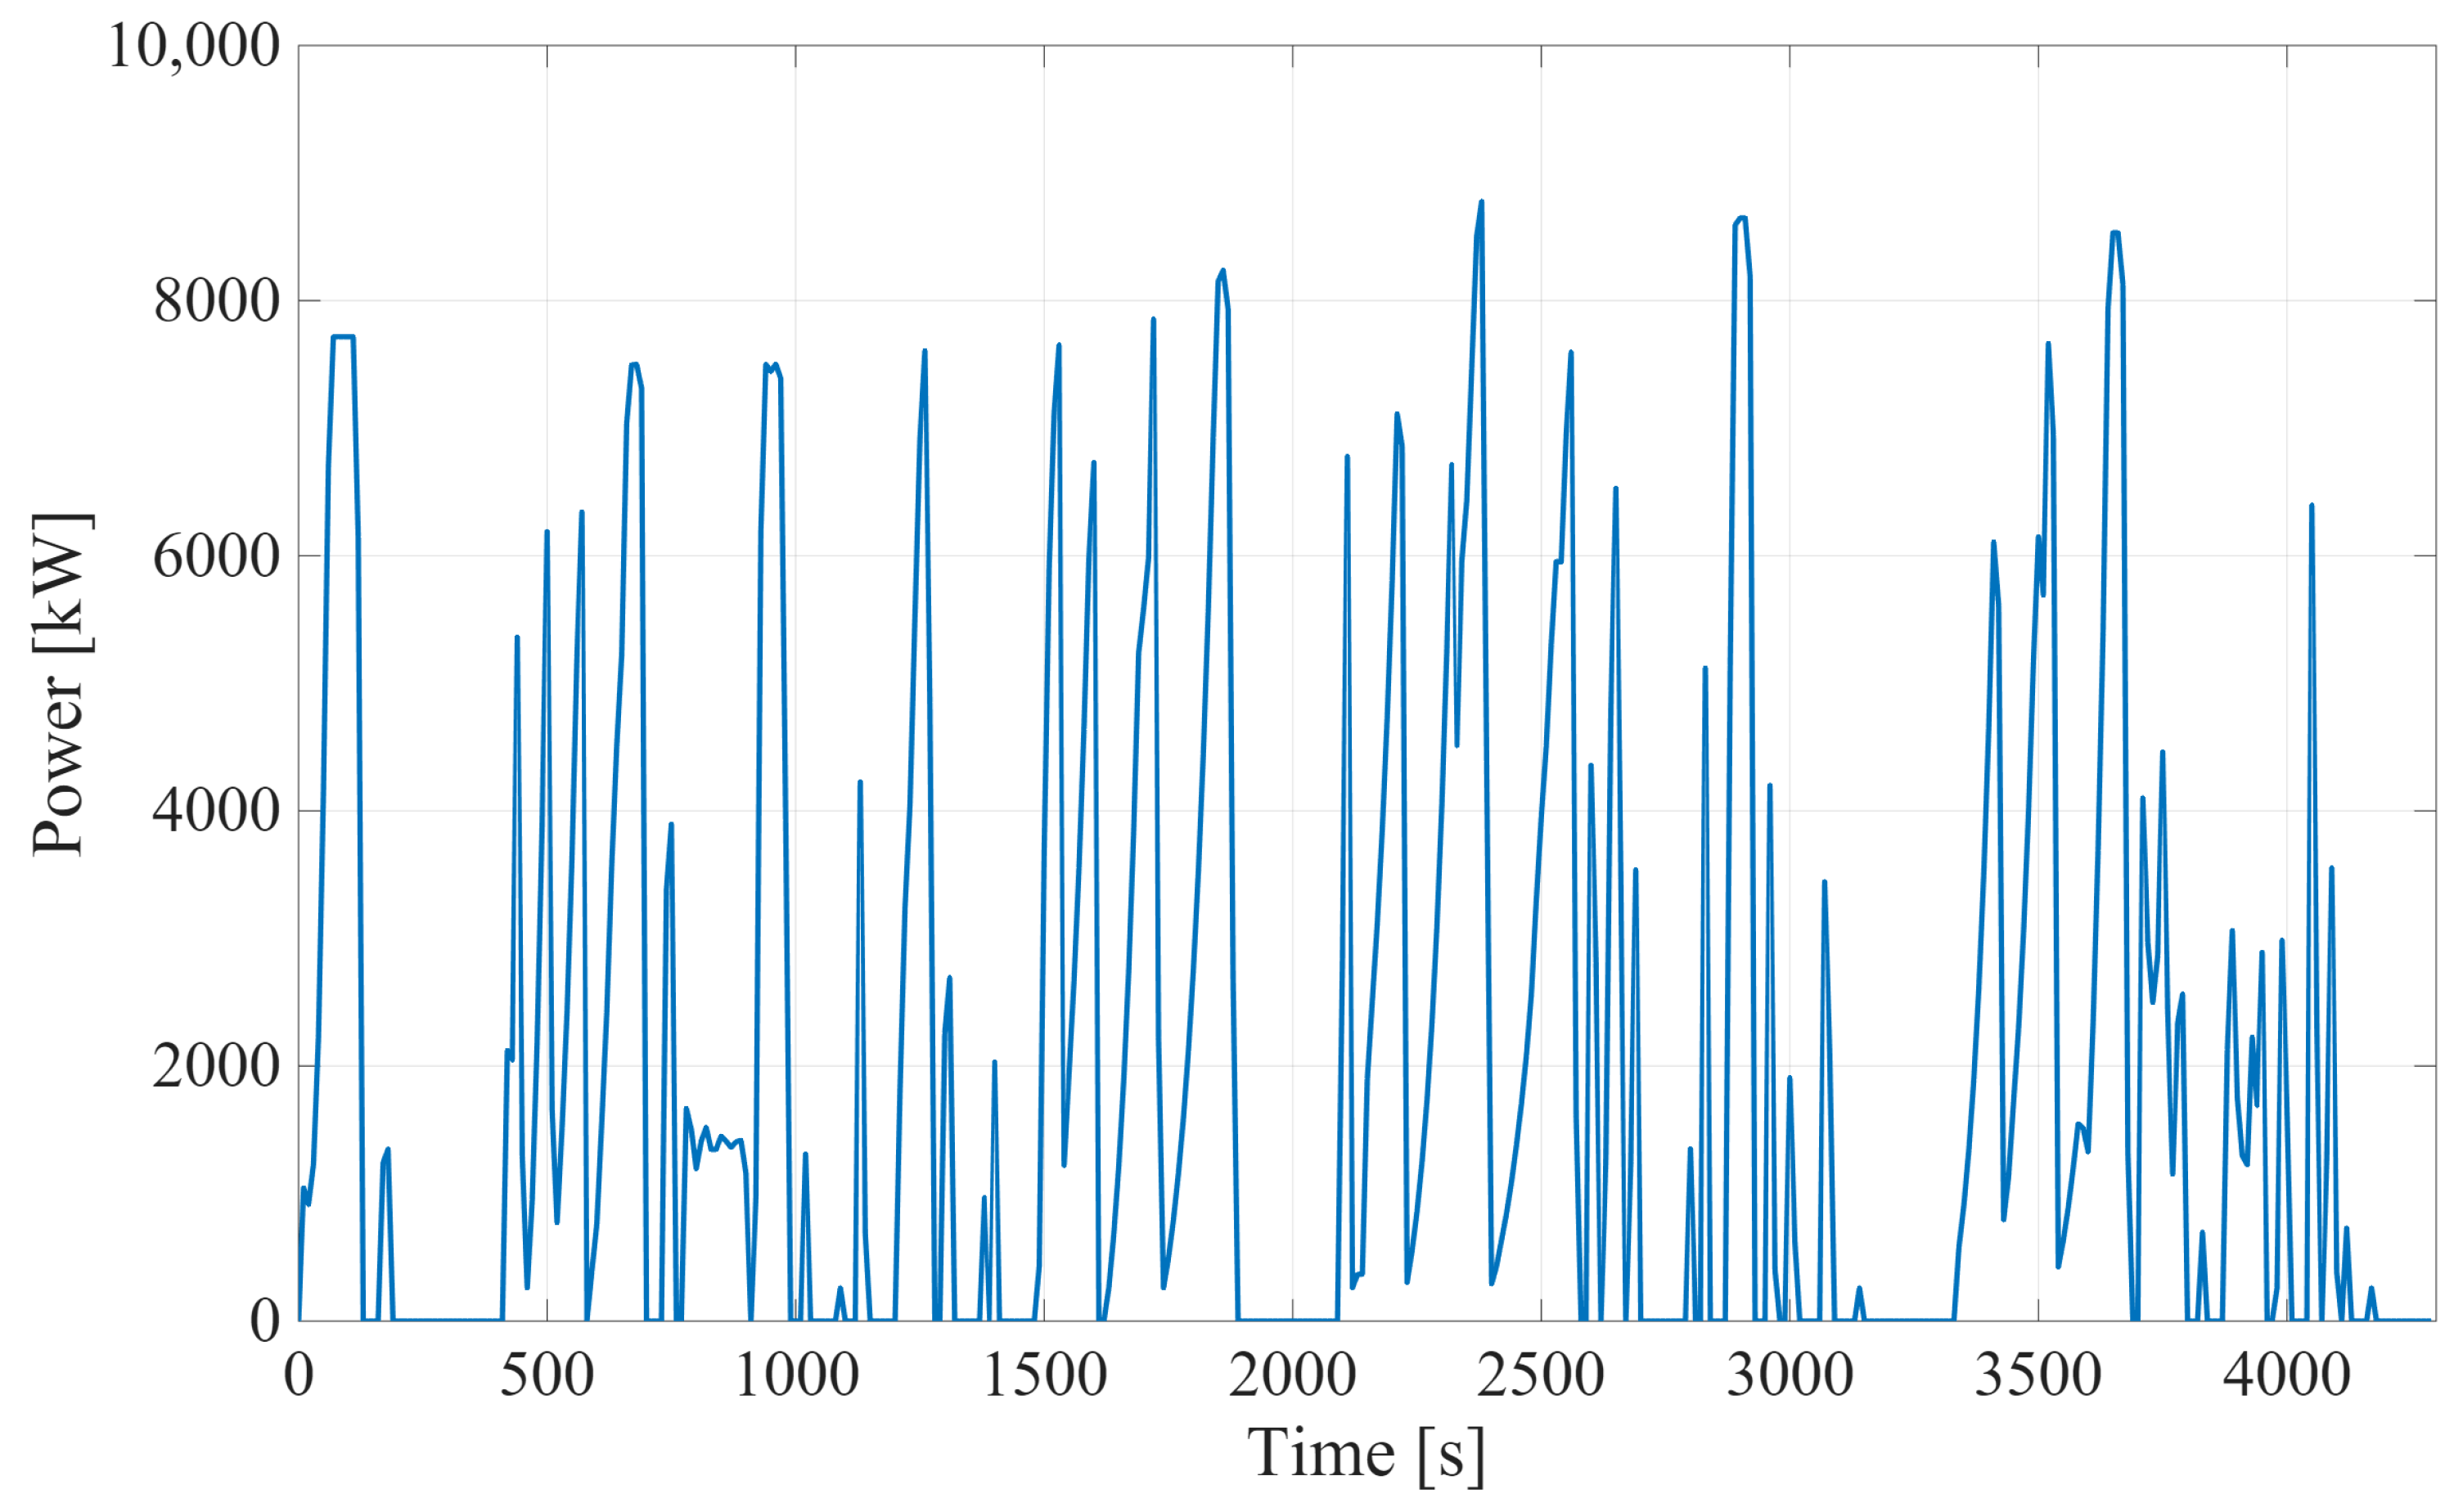
Figure 7 illustrates the battery discharge power profile under Scenario 3. The results indicate that the battery, together with the FC, supplies the required traction power for train operation. Due to degradation concerns associated with rapid load variations in the fuel cell, transient power demands are primarily compensated by the battery. In this context, the battery plays a critical role in smoothing power fluctuations and supporting dynamic operation. The maximum battery discharge power reaches approximately 9000 kW, highlighting its significant contribution during high power demand periods.
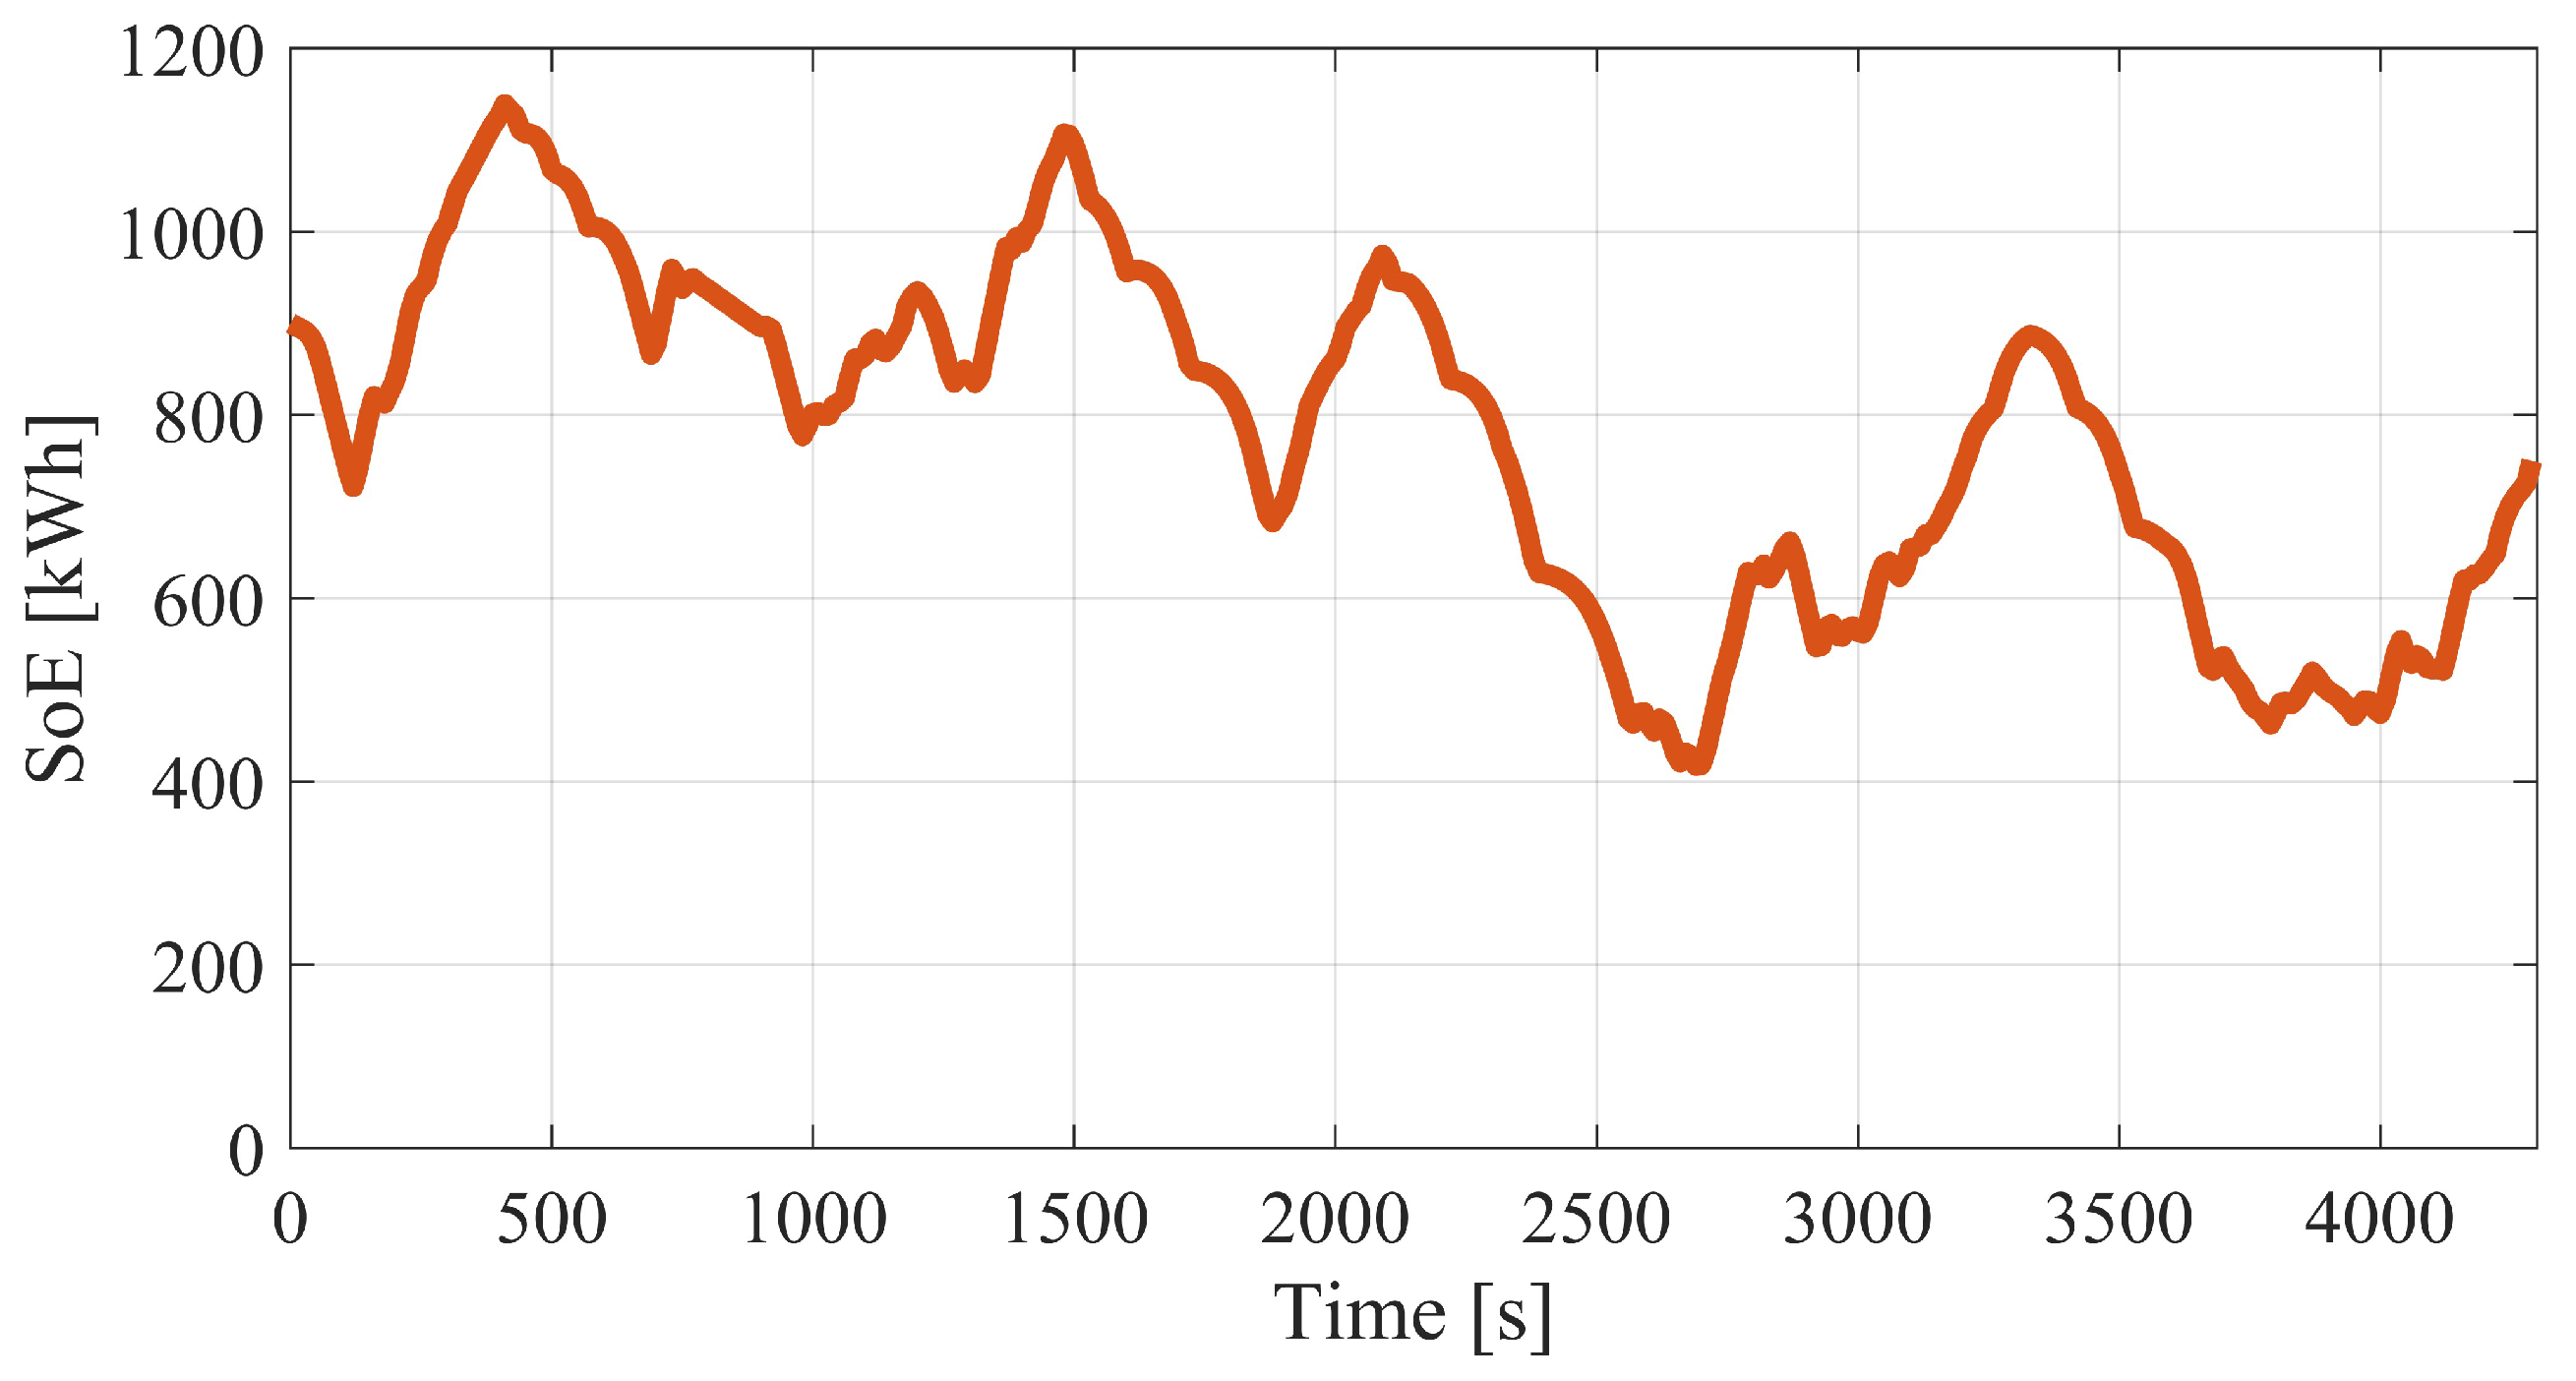
Figure 8 presents the SoE variation in the battery pack under Scenario 3. The battery system consists of 300 units, with an initial SoE corresponding to 30% of the total capacity, i.e., 900 kWh. During the trip, the SoE decreases to a minimum level of approximately 400 kWh, reflecting the battery’s active role in meeting traction power demand. By the end of the 4300 s operation, the SoE recovers to around 800 kWh, which is close to its initial value, indicating a balanced energy management strategy that effectively utilizes regenerative energy while maintaining operational stability.
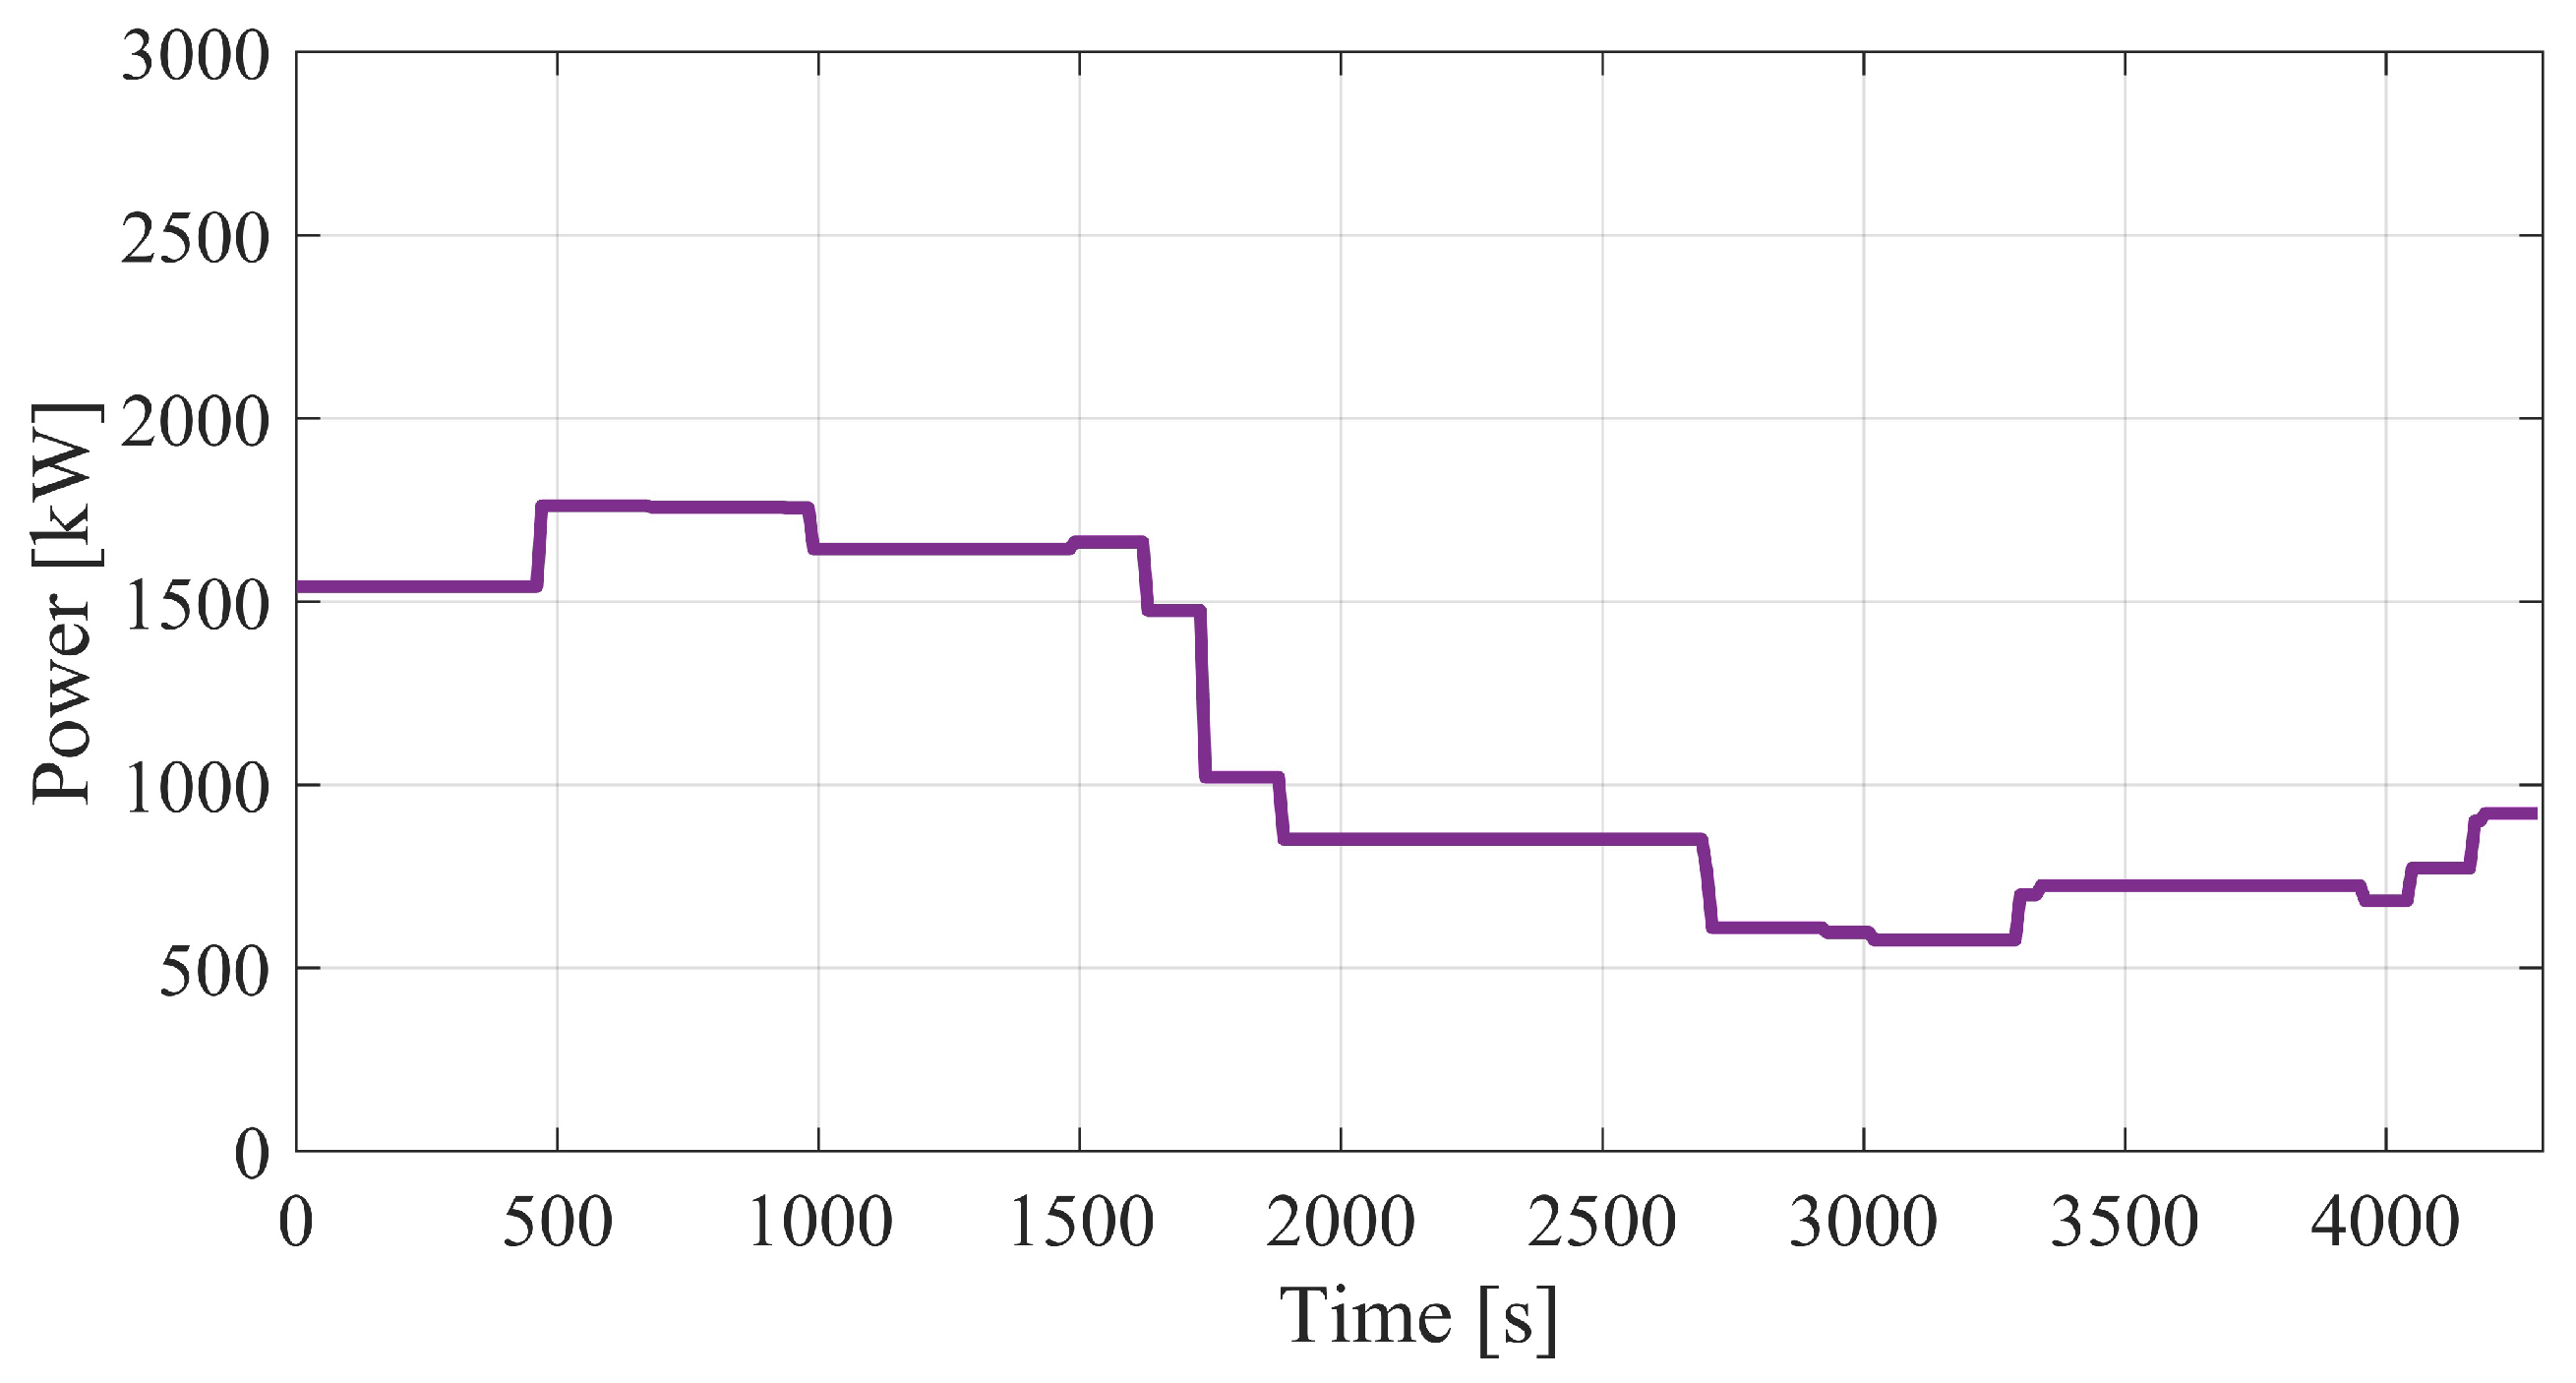
Figure 9 shows the FC power profile, which exhibits a more stable variation compared to the battery power. The results indicate that the FC operates within a relatively narrow power range, with a maximum value of approximately 1762 kW and a minimum of 576 kW. This stable behaviour suggests that the FC is operated in a controlled manner to avoid rapid load changes, thereby reducing degradation effects, while the battery compensates for transient power fluctuations.
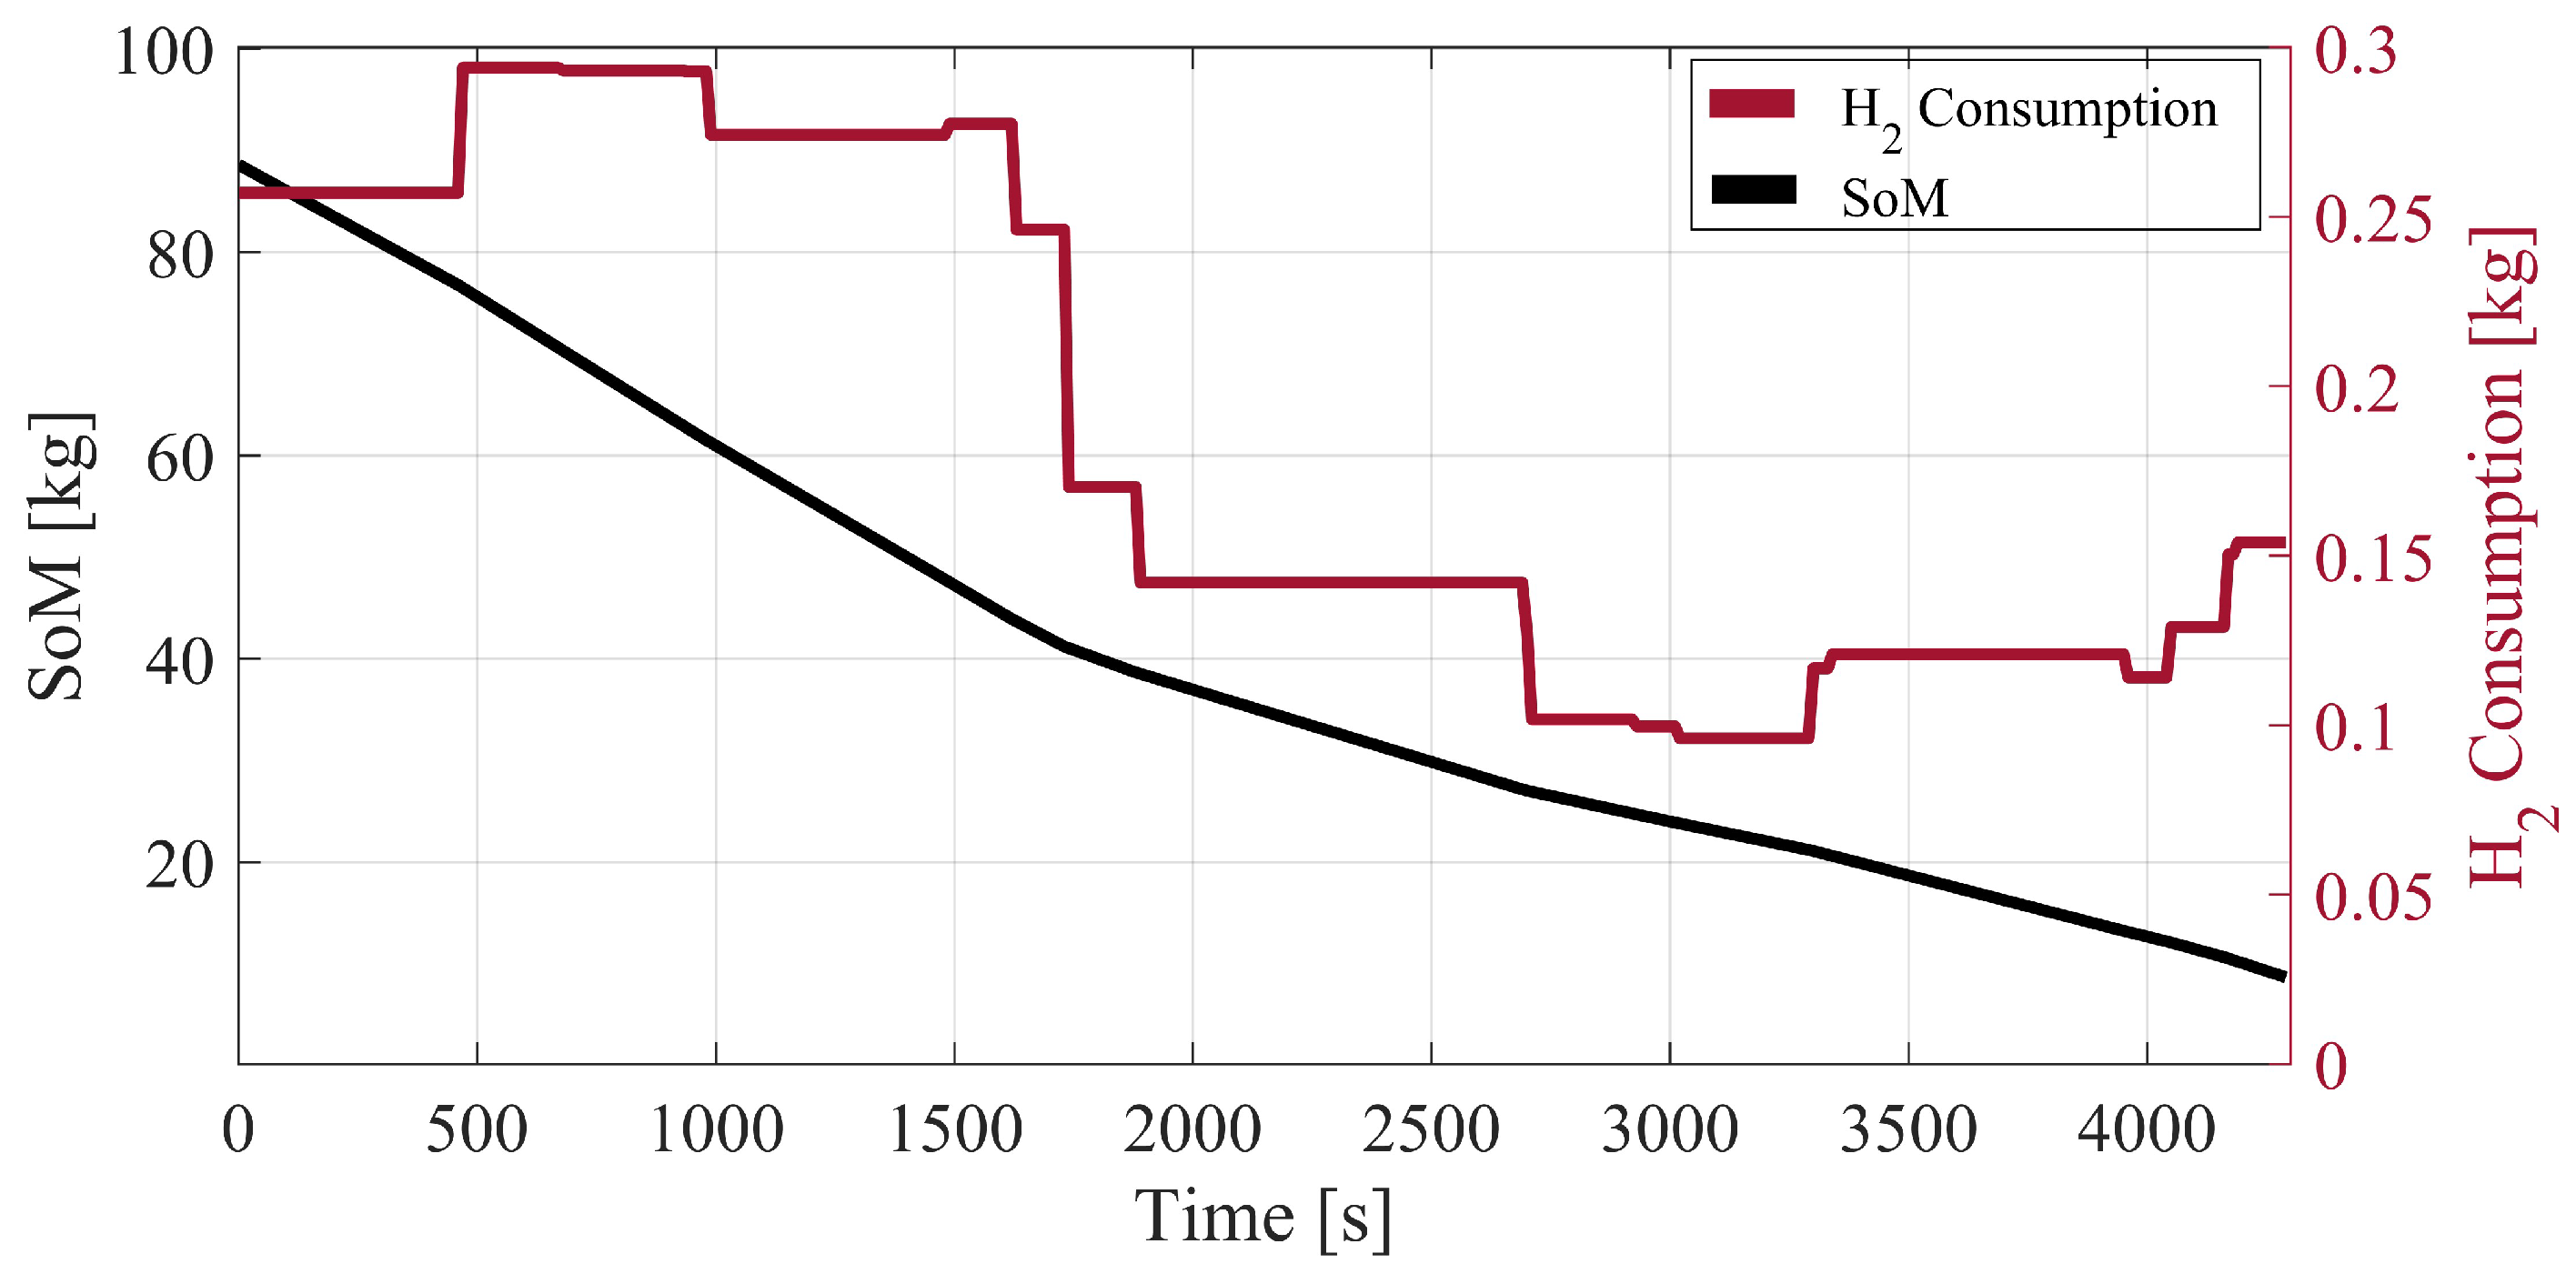
Figure 10 illustrates both the hydrogen tank capacity variation and the instantaneous hydrogen consumption profile. The hydrogen consumption follows a trend parallel to the fuel cell power profile, with a maximum instantaneous consumption of approximately 0.3 kg. The hydrogen storage system consists of 10 tanks, each with a capacity of 8.6 kg. By the end of the trip, the remaining hydrogen level decreases to 8.66 kg, indicating that the storage system is adequately sized to meet the operational demand while maintaining a sufficient reserve.
To evaluate the macroscopic feasibility of the optimized hydrogen–battery system, its lifecycle performance was benchmarked against conventional diesel-electric and grid-electrified high-speed rail standards. Current industrial data indicate that diesel-electric high-speed trains on non-electrified corridors incur operational costs ranging from
to
per km, driven by fuel volatility and high mechanical maintenance [
29]. In contrast, full grid electrification offers the lowest energy cost (approximately
$1.0 per km), but the infrastructure investment for the Bursa–Osmaneli line—including catenary systems and substations—is estimated at
$2.5–4.0 million per km due to complex terrain and tunnels. The proposed optimized hydrogen–battery configuration achieves a competitive operational profile while avoiding the prohibitive upfront infrastructure costs of electrification. By reducing the total lifecycle cost from
USD to
USD through degradation-aware optimization, this study demonstrates that the hybrid system represents a practical and cost-effective bridge for decarbonizing high-speed rail on corridors where full electrification is not economically feasible.
4. Conclusions
The decarbonization of railway transportation requires the development of alternative propulsion technologies capable of replacing conventional diesel traction in non-electrified rail corridors. Hybrid architectures combining hydrogen FCs and battery energy storage systems have emerged as a promising solution for high-power railway applications due to their complementary energy and power characteristics. However, the design of such systems involves complex trade-offs between component sizing, operational strategy, degradation effects, and strict onboard installation constraints.
This study proposed an integrated degradation-aware optimization framework for the design and operation of a battery–FC hybrid propulsion system for high-speed train applications. A mixed-integer linear programming (MILP) formulation was developed to simultaneously determine optimal system sizing and operational power allocation while incorporating hydrogen consumption, battery ageing, and FC degradation within a unified techno-economic objective. Nonlinear degradation characteristics were approximated through piecewise linear representations to maintain computational tractability while preserving sufficient modelling accuracy for large-scale railway applications. In addition, practical engineering constraints such as onboard mass and volume limitations were explicitly included in the optimization model to ensure realistic and physically feasible system configurations.
Simulation studies conducted on a real high-speed railway corridor demonstrated that battery capacity plays a critical role in shaping system performance. Increasing battery capacity significantly improves the system’s ability to absorb regenerative braking energy and smooth transient traction power demands, thereby reducing FC load fluctuations and degradation-related costs. The results indicate that optimal battery sizing can notably improve system performance, reducing the total lifecycle cost from USD to while decreasing the required number of fuel cell units from 31 to 18 and mitigating fuel cell degradation. However, the results also reveal diminishing economic benefits beyond a certain battery capacity level due to increased installation requirements and reduced marginal utilization. Among the analyzed configurations, the intermediate battery sizing scenario provided the most balanced solution, achieving substantial degradation cost reductions while maintaining acceptable mass and volume requirements.
The results confirm that simultaneous design–operation optimization offers significant advantages compared with conventional sequential sizing approaches by capturing the complex interactions between component degradation, operational efficiency, and investment costs within a single decision framework. The proposed methodology, therefore, provides a practical decision-support tool for the planning and design of hydrogen-based railway propulsion systems.
Future research will focus on extending the proposed framework to incorporate route uncertainty, real-time operational adaptation, and network-level optimization for multi-train railway systems.