Article

iLog 2.2: Volume and Nutrition Estimation for Mixed Foods via Mask R-CNN and Federated Learning

by
Indira Devi Siripurapu
1,*,
Laavanya Rachakonda
2,*,
Saraju P. Mohanty
1 and
Elias Kougianos
1
1
Department of Computer Science and Engineering, University of North Texas, Denton, TX 76205, USA
2
Department of Computer Science, University of North Carolina Wilmington, Wilmington, NC 28403, USA
*
Authors to whom correspondence should be addressed.
Electronics 2026, 15(7), 1460; https://doi.org/10.3390/electronics15071460
Submission received: 24 February 2026 / Revised: 23 March 2026 / Accepted: 25 March 2026 / Published: 1 April 2026

Abstract

Accurately estimating calorie intake and nutrient composition from what we eat remains one of the most practical challenges in maintaining a healthy lifestyle. Manual food logging and database-based estimations are often inaccurate because ingredient proportions and preparation styles vary widely. This paper presents a lightweight, privacy-preserving framework that estimates calories and detailed nutrient values from a single image. The model uses a Mask R-CNN-based segmentation network to identify visible food components, measure their area, estimate their volume using preset height values, and map them to nutritional information obtained from reliable datasets such as USDA and Food-a-pedia. The system integrates federated learning (FL) to ensure privacy by allowing the model to improve collaboratively without sharing raw user data. The proposed architecture achieved a mean Average Precision (mAP) of 96% for detection and 92% for segmentation, confirming its precision and efficiency. The model is trained and evaluated on a curated pizza dataset consisting of 1107 images across 50 topping categories, using a standard train-validation-test split (666/219/222) to ensure reliable performance assessment. The proposed system also achieves low nutrition estimation error, with calorie and nutrient deviations remaining within approximately 3.8% to 11.1% across evaluated metrics. A lightweight mobile interface is demonstrated through a Figma-based prototype mockup to illustrate potential real-world deployment and user interaction.

1. Introduction

The healthcare and nutrition industries are increasingly shaped by technological innovations that aim to quantify dietary patterns and energy intake. Accurate estimation of calorie and nutrient composition plays a vital role in weight management, chronic disease prevention, and personalized healthcare [1]. However, in real-world scenarios, this process is not straightforward [2]. People consume meals that often combine multiple ingredients, with varying portion sizes and preparation styles. Mixed dishes, such as sandwiches, bowls, and layered meals, make calorie estimation particularly challenging since the same type of meal can differ greatly depending on regional recipes, ingredient density, and cooking variations.
These differences make it difficult for individuals to rely on general or pre-defined calorie charts, as such values represent only average estimates and do not account for user-specific variations. As a result, most people and healthcare professionals depend on manual food logging or rough estimation, which can be time-consuming and inaccurate [3]. Figure 1 illustrates a person struggling to manually calculate calories and nutrient composition from a mixed meal, highlighting the complexity and need for an automated approach.
To address this challenge, iLog 2.2 focuses on precise and automated calorie and nutrient estimation using artificial intelligence (AI) and edge computing. Unlike the earlier [4], iLog 2.0 [5] & iLog 2.1 [6], which handled multiple food categories and provided broader calorie predictions through object detection, this version enhances the overall accuracy and nutrient breakdown by modeling individual components in greater detail. The system applies geometric and visual analysis to estimate volume and mass directly from 2D images without requiring depth sensors or additional hardware. This refined approach not only predicts total calories but also estimates macro-nutrient and micro-nutrient composition, offering detailed insights into protein, fat, carbohydrates, sodium, calcium, and other essential nutrients.
A major contribution of this work is the integration of federated learning (FL) for privacy-preserving training and continuous model improvement [7]. In conventional AI-based food analysis systems, user data, such as food images are sent to centralized cloud servers, raising privacy and ethical concerns. In contrast, iLog 2.2 performs computation locally on the user’s device. Each device trains the model on its private dataset and shares only encrypted model parameters—not raw images—with a central server for aggregation. This ensures that user data remains private, aligning with modern data protection standards, such as the General Data Protection Regulation (GDPR) and Health Insurance Portability and Accountability Act of 1996 (HIPAA) [8,9]. The federated architecture allows the model to learn from diverse user inputs while maintaining strong privacy guarantees.
Another core design goal of iLog 2.2 is efficiency and deployability. The system employs a lightweight deep learning model suitable for smartphones, embedded platforms, and Internet-of-Medical-Things (IoMT) devices, following the principles demonstrated in recent IoMT-based smart health systems [10]. This enables real-time inference with low latency and minimal computational overhead, making it practical for daily use. The modular nature of the framework also allows integration with mobile health applications, enabling users to share only summarized nutrient values with dieticians or healthcare professionals. Instead of exposing raw images or personal information, the system communicates aggregated nutritional summaries, maintaining both privacy and interpretability. Despite the progress in food recognition and calorie estimation systems, several challenges still remain in practical applications. Many existing approaches focus mainly on food classification or segmentation but do not accurately estimate portion size or volume, which limits their usefulness for real dietary tracking. In addition, most systems treat food as a single entity and do not consider ingredient-level variations, which becomes a major issue for mixed dishes like pizza where each component contributes differently to the final nutritional value. Another limitation is that conventional systems depend on centralized processing, where user data is sent to cloud servers, raising concerns about privacy and scalability.
Motivated by these challenges, this work focuses on building a lightweight and privacy-preserving system that performs ingredient-level analysis, estimates volume and mass directly from a single image, and computes detailed macro- and micro-nutrient values. The main hypothesis of this work is that combining instance segmentation with geometric estimation and federated learning can provide accurate, interpretable, and privacy-aware nutrition estimation for mixed food items in real-world conditions.
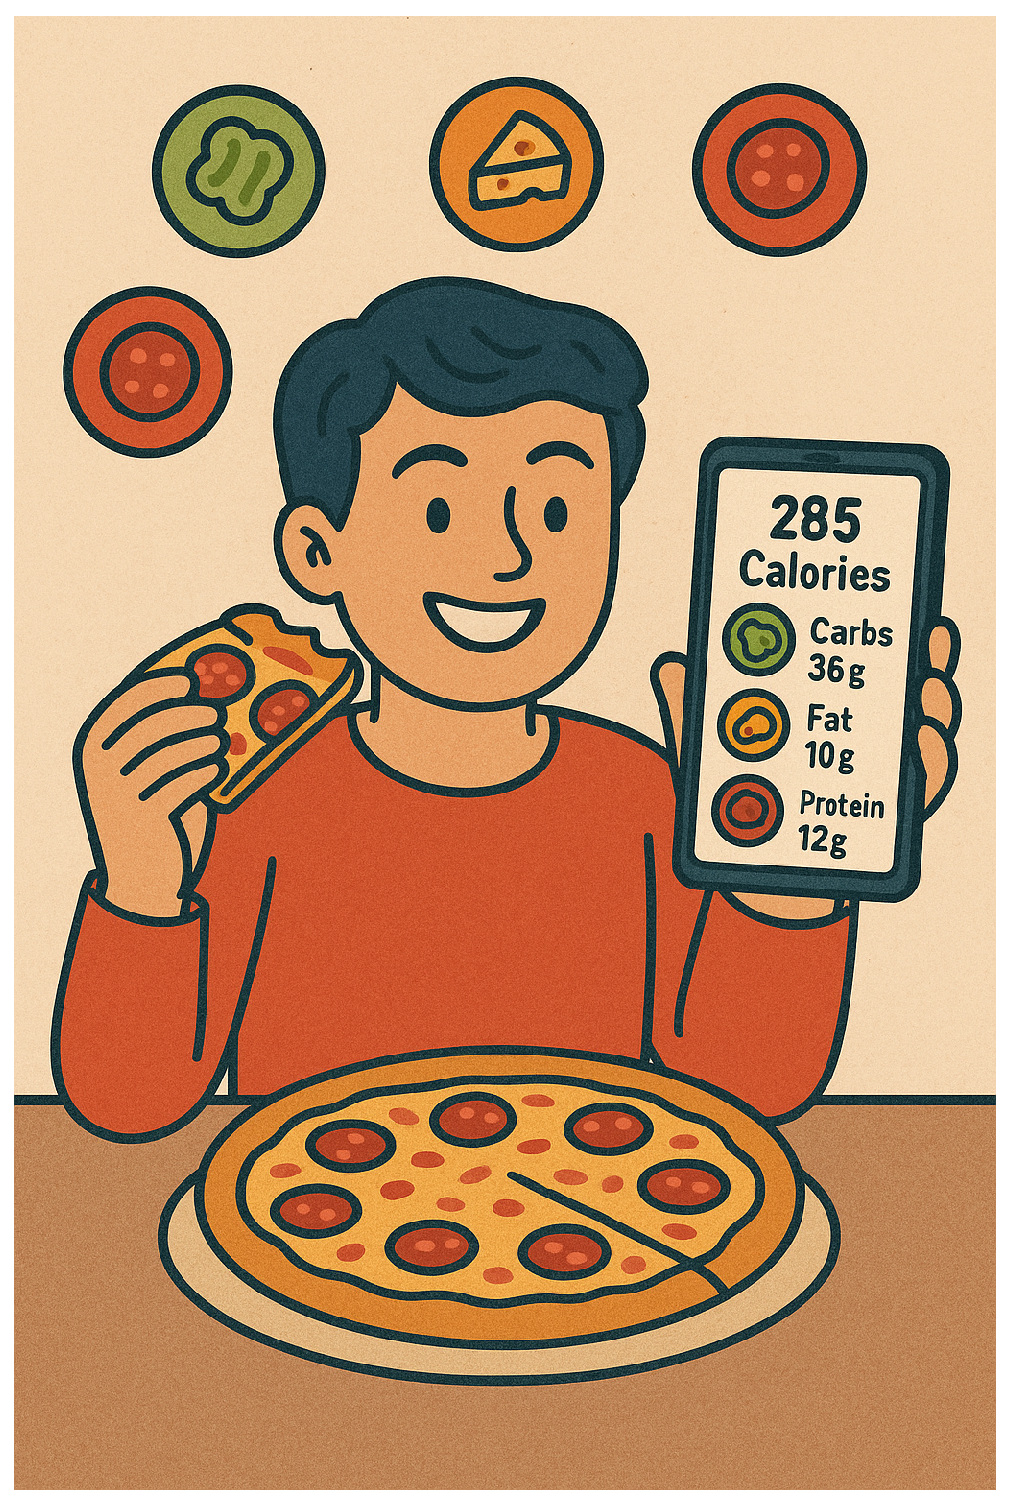
By combining computer vision, federated learning, and AI-driven automation, iLog 2.2 eliminates the guesswork involved in calorie and nutrient estimation. The framework demonstrates how a focused and structured approach to analyzing mixed or multi-component meals can serve as a proof of concept for future large-scale food estimation systems. In doing so, it bridges the gap between nutrition science, privacy-preserving AI, and practical usability. This research contributes to the broader goal of personalized healthcare through intelligent dietary monitoring, where individuals receive accurate, secure, and adaptive feedback on their nutritional intake without compromising privacy. Figure 2 illustrates a user effortlessly obtaining detailed nutritional information through the proposed application.

2. Related Work

The comparison presented in Table 1 highlights how most existing research in food vision has focused on broad multi-class food detection or image-level calorie estimation. While these studies demonstrate strong recognition accuracy, they generally assume each dish has a fixed calorie value and overlook per-ingredient variability [11]. Several frameworks, such as iLog [4,5], FoodSegDL [12,13], and CalorieAI [14], employ deep detectors or segmentation models like Mask R-CNN [15] and YOLO [16] to identify foods, but they either depend on static calorie tables or require additional sensors for volume estimation. iLog 3.0 [17] improves volume accuracy by incorporating monocular depth estimation, but depth/multi-view components add compute and system complexity that can be tough for lightweight deployments. Only a few works explore federated learning, and even then, they rarely combine FL with detailed nutrient analysis. The proposed iLog 2.2 framework stands out by combining edge deployability, federated privacy, and per-topping macro–micro-nutrient estimation derived from computed volume and weight.
Table 2 compares popular commercial food-logging applications with the proposed system. These apps, such as Lose It! [27], MyFitnessPal [28], HealthifyMe [29], and BiteSnap [30], primarily rely on manual data entry, barcode scanning, or cloud-based recognition services. Although convenient for casual diet tracking, they provide only approximate calorie information and require user input for portion size. However, most existing methods do not fully support automatic ingredient-level segmentation or nutrient estimation for individual components in mixed dishes. In contrast, the proposed iLog 2.2 model operates fully on the device, accepts images from any camera angle, and uses polygon-based segmentation to compute per-topping volume, weight, and nutritional composition while preserving user privacy through federated learning.
From the above discussion, it can be observed that existing approaches primarily focus on detection or segmentation, often rely on fixed calorie assumptions, or require additional hardware for volume estimation. In addition, limited attention has been given to ingredient-level analysis combined with privacy-preserving learning. The proposed iLog 2.2 framework is designed to address these gaps by integrating instance segmentation, geometric volume estimation, and federated learning into a unified pipeline.

3. Novelty of the Proposed Solution

The proposed system, iLog 2.2, introduces several contributions that differentiate it from existing calorie estimation and nutrition analysis frameworks. Traditional approaches often treat complex meals as single homogeneous entities, providing only approximate calorie estimates. In contrast, iLog 2.2 models the problem at a finer granularity by focusing on ingredient-level analysis within mixed or multi-component meals.
While components such as Mask R-CNN-based segmentation are well-established in prior work, this research focuses on integrating these techniques with geometric volume estimation and federated learning into a unified and lightweight pipeline. This combination enables accurate, interpretable, and privacy-preserving nutrition estimation. The major contributions of this work are summarized as follows:
  • Mixed Meal Analysis: Instead of estimating total calories for a meal as a single unit, iLog 2.2 analyzes each visible ingredient individually. This makes it one of the first systems to address calorie estimation for mixed foods, where components vary in thickness, density, and volume.
  • Federated Learning for Privacy: The model incorporates a federated learning framework that allows distributed devices to participate in collaborative training without sharing any raw images or personal data. Only encrypted model parameters are communicated, ensuring complete privacy and security of user information. This approach enables large-scale model improvement while fully complying with data protection standards, such as GDPR and HIPAA.
  • Lightweight and Edge-Compatible Model: A compact and computationally efficient deep learning model has been designed to operate efficiently on low-power devices and to be deployable in future edge environments. The lightweight nature of the model reduces latency and energy consumption, enabling fast and efficient inference.
  • Flexible Image Input: The system accepts images captured from any camera angle, removing the need for fixed reference perspectives or additional calibration objects. This flexibility enhances usability in real-world conditions, where users capture spontaneous food images in uncontrolled settings.
  • Polygon-Based Segmentation: Each ingredient is annotated using polygonal masks rather than bounding boxes, allowing precise delineation and improved computation of surface area. The segmentation output directly contributes to the accuracy of subsequent volume and mass estimation.
  • No Reference Image Requirement: Unlike depth-based or multi-view estimation systems, iLog 2.2 does not rely on any external reference image or additional camera calibration. The use of preset geometric priors for height and ingredient thickness makes the system simple, efficient, and fully self-contained.
  • Volume-to-Weight Conversion: The system converts 2D pixel-based areas into estimated volume using preset height values and then translates the volume into mass (grams) using ingredient-specific density factors. This conversion enables both weight and calorie contribution to be estimated per ingredient.
  • Macro- and Micro-Nutrient Estimation: Beyond calorie computation, iLog 2.2 provides a detailed nutrient profile. It calculates macro-nutrients such as carbohydrates, proteins, and fats, and micro-nutrients including sodium, calcium, and iron for each detected component as well as for the complete meal. This approach overcomes the limitations of generalized calorie estimates by providing ingredient-level nutritional breakdowns.
  • Dynamic Calorie Estimation: The system accounts for variations in ingredient quantity and distribution. Unlike conventional systems that assume fixed calorie values for standard meals, iLog 2.2 dynamically adjusts its output according to the detected components and their computed weights, resulting in highly personalized and accurate estimates.
Overall, iLog 2.2 redefines calorie and nutrient estimation by combining federated learning, edge-compatible design, and geometric analysis into a unified and scalable framework. It provides a privacy-aware and interpretable solution that not only estimates calories but also generates detailed nutritional insights tailored to each user’s intake.

4. Methodology/Overview of the Proposed Model

The proposed iLog 2.2 model is designed to make food calorie and nutrient estimation simple, accurate, and privacy-preserving for end users. The process begins when a user captures an image of their food using the mobile application. The image is directly uploaded through the user interface to the iLog 2.2 system, where the backend neural network, built on a lightweight Mask R-CNN architecture, processes it to identify and segment individual components of the meal.
Once the image is received, the system automatically detects each visible ingredient and separates it using polygon-based masks to preserve fine detail and boundary precision. These segmented regions are then analyzed to determine their relative area, which is later used to compute volume and mass for nutrient estimation. The entire workflow from image upload to calorie and nutrient breakdown is handled seamlessly by the application without requiring any manual input or external calibration. This design ensures a smooth user experience while maintaining reliability and scalability for everyday use across various food types and real-world lighting or background conditions.
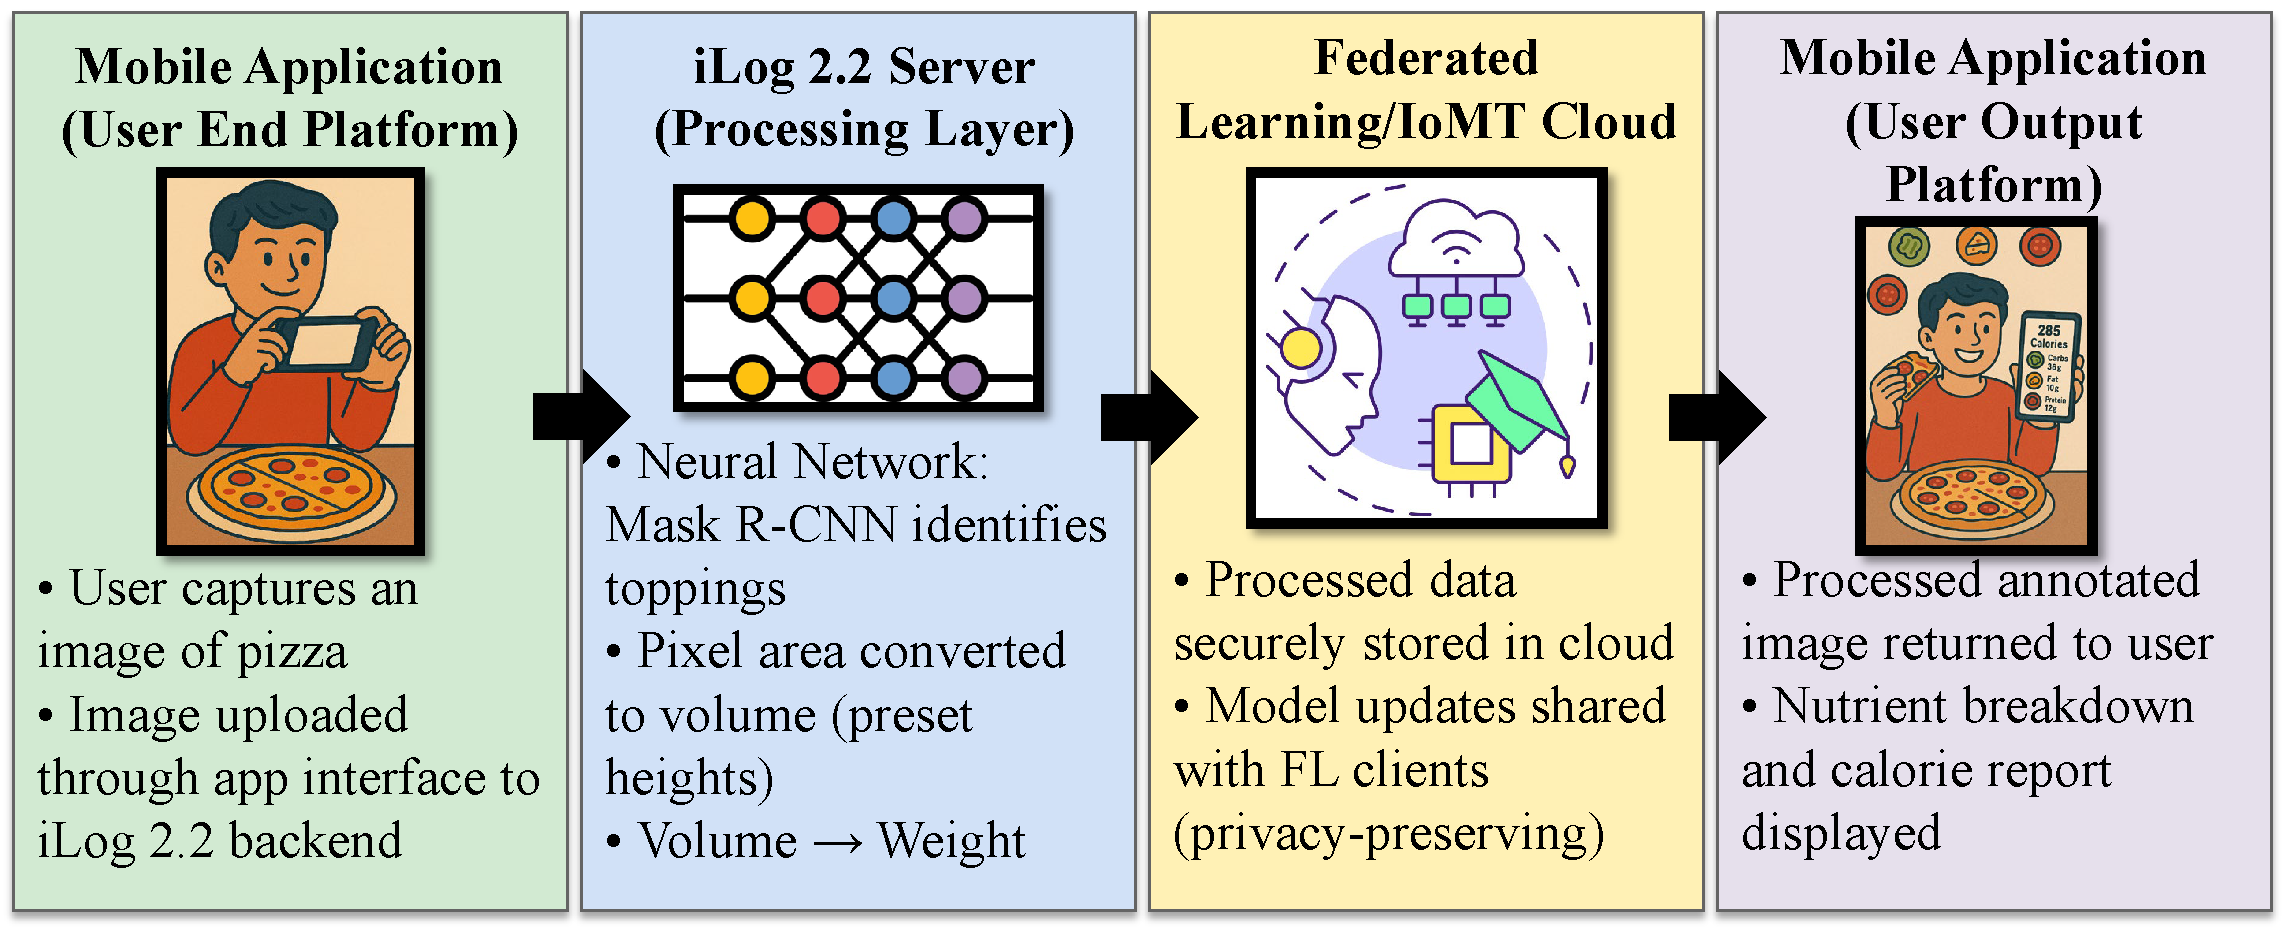
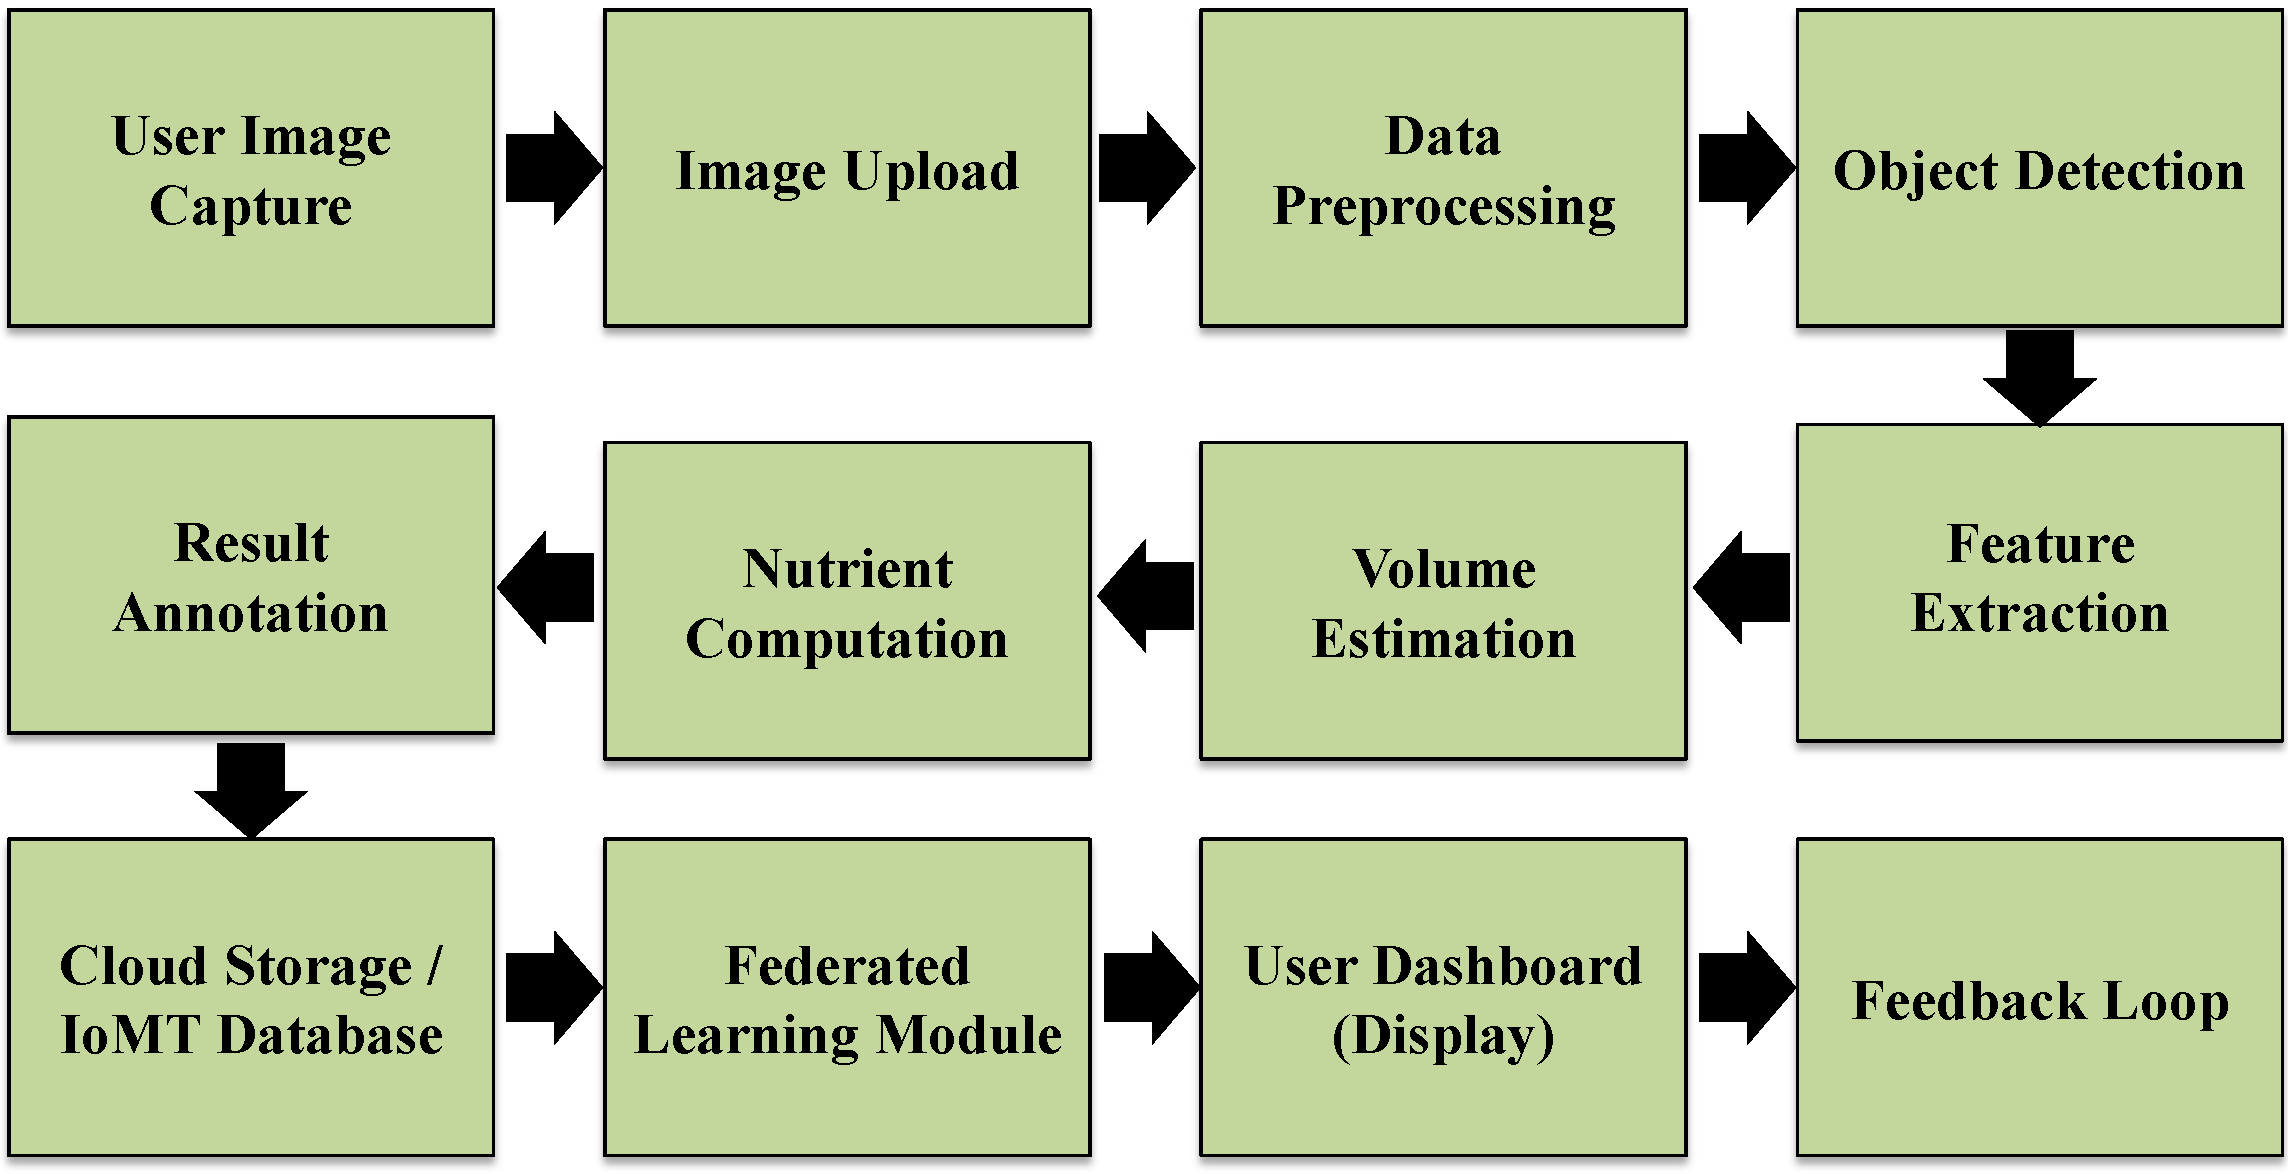
All further computations, such as converting detected topping areas into physical measurements, take place in the model’s processing layer. The detected regions are first analyzed to calculate pixel area, which is then converted to estimated volume using preset height values. This volume is converted into weight (grams), and from this, the model derives calories, macro-nutrients (carbohydrates, proteins, fats), and micro-nutrients (sodium, calcium, iron, etc.) for each topping as well as for the entire pizza. An overview of the proposed system is presented in Figure 3, and the step-by-step development workflow is depicted in Figure 4.
Pizza has been considered in this study as it is a globally consumed food item and serves as a representative example of a mixed meal containing multiple components. The variety of toppings, sauces, and ingredient combinations introduces significant complexity in accurately estimating nutritional values, making it an ideal case for testing the real-world performance of food estimation models.
After the calculations are completed, the processed image, now annotated with identified toppings and their corresponding nutritional values, is sent back to the user through the mobile application’s interface. The user can see the final output image along with detailed nutritional information, including the calories and macro–micro breakdown, making the estimation fully interpretable and personalized.

5. Implementation

5.1. Dataset

This work uses two integrated datasets, one for visual data and the other for nutritional reference values. The image dataset contains a total of 1107 pizza images, captured from different angles and lighting conditions to ensure variety and real-world representation. Out of these, 666 images are used for training, 222 for testing, and the remaining 219 images for validation. This allocation prioritizes learning capacity while maintaining independent validation and testing for fair evaluation.
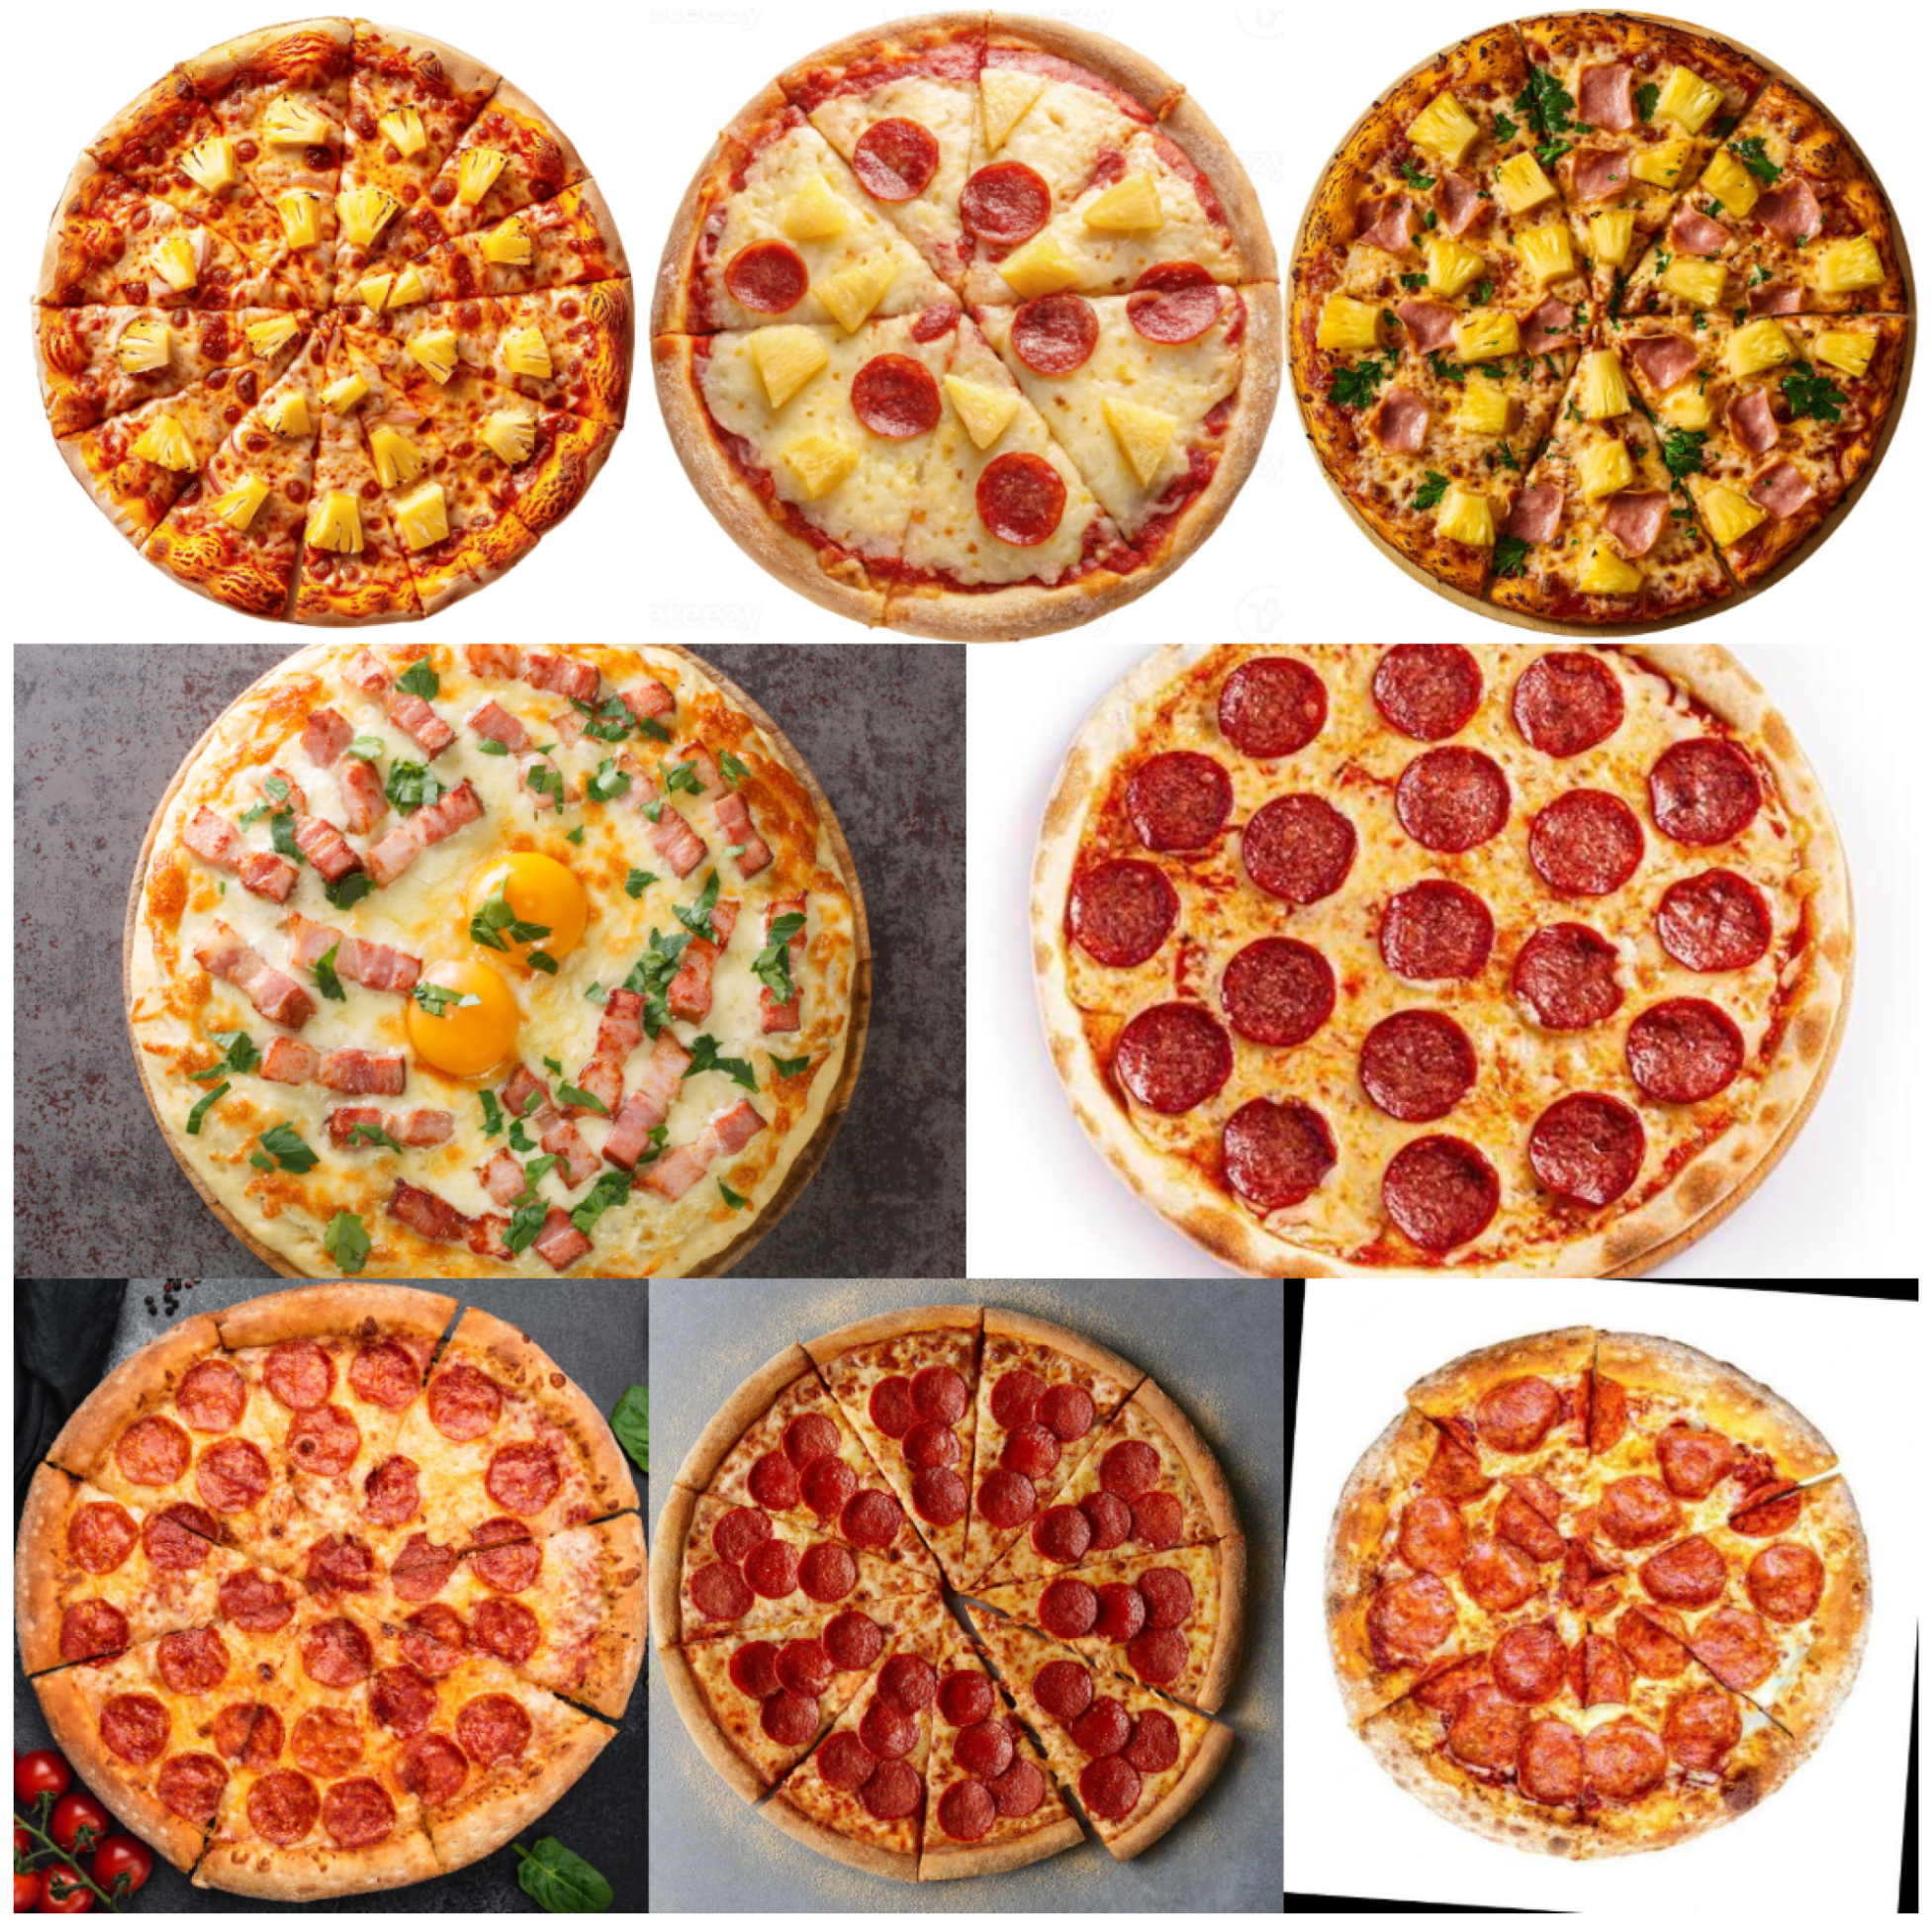
Every image is manually annotated using polygon masks with 50 labels that represent various toppings, sauces, and cheese types commonly found on pizzas. As shown in Figure 5, the dataset includes a diverse variety of pizzas with multiple topping combinations. The dataset consists of 50 food categories with varying sample distributions across classes, reflecting real-world diversity in food occurrence. Frequently observed toppings such as Pepperoni (4645 samples), Basil (2499 samples), and Cheese (1547 samples) are well represented, while several less common categories have significantly fewer samples. This long-tail distribution captures realistic variation in food composition and supports evaluation under both dominant and sparse class conditions. Since pizza is a multi-component food with diverse topping combinations, the dataset includes a wide range of ingredient co-occurrences to reflect practical, real-world scenarios.
The nutritional dataset is curated from verified public resources such as the U.S. Department of Agriculture (USDA) database [36] and Data.Gov: Food-a-pedia [37]. Nutritional information including calorie values, macro-nutrients (carbohydrates, proteins, fats), and micro-nutrients (sodium, calcium, iron, etc.) was collected for each topping based on multiple portion sizes such as one cup, one slice, and different thickness levels. These values were manually refined to maintain consistency across units and portion categories.
Finally, both datasets were combined to form a single structured dataset that links each annotated topping label with its corresponding nutritional information. This unified dataset enables the iLog 2.2 model to compute accurate calories and nutrients directly from topping-level predictions in the image, ensuring that the visual segmentation output aligns precisely with real nutritional metrics.

5.2. Mask R-CNN Based Detection and Segmentation

The next stage of the system focuses on detecting and segmenting each component present in the image. For this, a customized Mask R-CNN model is used because it can perform both object detection and instance segmentation within a single framework as shown in Algorithm 1. Mask R-CNN has been widely adopted in computer vision tasks for its ability to generate high-quality segmentation masks while maintaining strong detection accuracy [15]. The model identifies every visible topping such as cheese, sauce, onion, tomato, pepper, olive, and others and separates them using polygon masks. Each topping mask is stored with a unique label that links it to its nutritional data.
The image captured from the user’s mobile camera is first resized and normalized before being passed to the Mask R-CNN model. The backbone network extracts deep visual features, while the Region Proposal Network (RPN) [38] generates candidate regions where toppings may exist. The final segmentation head produces binary masks for each detected object, outlining the shape and size of individual toppings accurately.
All detected masks are then post-processed to remove overlaps and false positives. Each topping mask is associated with its class ID and pixel count, which will later be used for volume estimation. Because the model is trained with polygon annotations, it performs well on irregular topping shapes and overlapping regions. The output of this step is the segmented image with labeled toppings and their corresponding pixel areas, which is then passed to the next computation stage for volume and nutrient estimation.
Algorithm 1 Topping Detection and Segmentation using Mask R-CNN
Require: RGB image I (any angle); trained weights W; class list L ; score threshold τ s ; mask threshold τ m ; NMS IoU τ n ; minimum area A min
Ensure: Set of instances S = { ( l i , M i , N i , conf i , bbox i ) }
1: I Preprocess ( I )                     ▹ resize to 512 × 512 , normalize, optional denoise
2: R MaskRCNN _ Infer ( W , I )             ▹ proposals with class posteriors, mask logits, boxes
3: R NMS ( R , IoU = τ n )                          ▹ remove redundant detections
4: S
5: for each detection r R  do
6:       if  score ( r ) < τ s  then
7:           continue
8:       end if
9:        M 1 σ ( r . mask _ logits ) τ m                           ▹ binarize mask
10:      M MorphRefine ( M )                       ▹ remove speckles, fill small holes
11:     if  Area ( M ) < A min  then
12:         continue
13:     end if
14:      ( M , bbox ) ClipToImage ( M , I )
15:      l r . class _ probs ;    conf max r . class _ probs
16:      N PixelCount ( M )
17:      S S { ( l , M , N , conf , bbox ) }
18: end for
19: S ResolveOverlaps ( S )              ▹ mask-wise soft-NMS or priority by confidence/area
20: return S                            ▹ to volume/weight computation stage

5.3. Volume Estimation

After detecting and segmenting each topping using the Mask R-CNN model, the next important step is to determine the physical volume of each region. The system follows a preset height-based estimation approach, which removes the need for any reference object or external calibration, as shown in Algorithm 2.
Based on prior studies in food geometry and serving thickness, the average height of a standard pizza was determined to be approximately 2 cm, as supported by [39,40]. While preset height assumptions are used in this work, they are based on commonly observed serving dimensions reported in food geometry and nutritional datasets. Although food thickness may vary depending on preparation, using standardized height values provides a practical and computationally efficient approximation for volume estimation without requiring additional sensors or multi-view inputs.
This approach is particularly suitable for lightweight and edge-compatible systems, where minimizing computational complexity is important. Furthermore, minor variations in height are partially compensated through density-based mass conversion and aggregation across multiple toppings.
It is acknowledged that camera perspective and depth distortion can influence area estimation in single-view images. However, the proposed system is designed to operate under unconstrained real-world conditions without requiring calibration or depth sensors, making it more practical for everyday use. Future work can incorporate depth-aware models or multi-view inputs to further improve geometric accuracy.
Using this value as a constant base height ( h b a s e ), the system estimates the height for other toppings proportionally using their recorded serving dimensions in the FoodData Central [36] and Food-a-pedia [37] nutritional datasets. This ensures that each topping has a realistic relative height for computing its volume.
The area for each topping is obtained from the segmentation masks in pixels. The Mask R-CNN output provides a pixel count N i for each topping i, which is converted to an actual surface area A i in cm2 using a learned scale prior s (cm/pixel). The relationship is given as:
A i = N i × ( s ) 2
As shown in Equation (1), N i represents the number of detected pixels corresponding to topping i, and s denotes the learned scale factor (cm/pixel) used to convert pixel measurements into real-world dimensions, resulting in the surface area A i in cm2.
The estimated topping height h i (in cm) is then used to compute the volume V i of that topping:
V i = A i × h i
As shown in Equation (2), the topping volume V i is obtained by multiplying the surface area A i with the estimated height h i , where h i represents the thickness (in cm) of the i-th topping.
Once the volume is calculated, it is converted into weight (mass) using the corresponding density value ρ i (g/cm3) obtained from the USDA dataset:
m i = V i × ρ i
As shown in Equation (3), ρ i denotes the density (g/cm3) of the i-th topping obtained from the USDA dataset, and is used to convert volume into mass.
Since most food nutrient data is standardized in grams, all further calculations use m i in grams. When applicable, conversions are performed using the equivalence [41]:
1 cup = 240 grams ( a p p r o x )
As shown in Equation (4), this ensures accurate scaling between volume-based and mass-based quantities.
Therefore, the final output of this step is the estimated mass m i for each topping, which serves as the input for the next module the nutrient and calorie estimation engine, as shown in Equation (3).
Algorithm 2 Volume → Mass (grams) → Nutrients with Preset Height
Require: Segmented instances S = { ( l i , M i , N i ) } ; scale prior s (cm/px);
1:      base height h base = 2 cm; topping heights table H [ l ] (cm, optional);
2:      density table ρ [ l ] (g/cm3); nutrient table N [ l ] with per-gram factors;
3:      serving conversions C (e.g., 1 cup = 240 g , tbsp, slice, etc.)
Ensure: For each topping i: area A i (cm2), volume V i (cm3), mass m i (g), calories C i (kcal), macro/micro vector n i ; and whole-pizza totals
4: for each instance i with label l i and pixel count N i  do
5:        A i N i × ( s ) 2                            ▹ pixel area → physical area (cm2)
6:        h i H [ l i ] , if available h base , otherwise
7:        V i A i × h i                            ▹ volume in cm3 (preset/lookup height)
8:        m i V i × ρ [ l i ]                             ▹ convert volume to mass (grams)
9:        ( e kcal / g , f per g ) N [ l i ]                   ▹ energy and macro/micro factors per gram
10:     if  N entry is given per serving (cup/slice/tbsp) then
11:         g per serving C [ serving _ type ]                           ▹ e.g., 1 cup = 240 g
12:         Convert factors to per-gram: e kcal / g e kcal / serv g per serving ; f per g f per serv g per serving
13:      C i m i × e kcal / g                                ▹ calories for topping i
14:      n i m i × f per g                       ▹ macro/micro nutrient vector for topping i
15: end for
16: A tot i A i ; V tot i V i ; m tot i m i
17: C tot i C i ; n tot i n i
18: return { ( A i , V i , m i , C i , n i ) } i and ( A tot , V tot , m tot , C tot , n tot )

5.4. Nutrient and Calorie Computation

Once the weight of each topping is obtained from the previous step, the system converts these weights into calories and nutrient values using the curated nutritional dataset, as shown in Algorithm 3. The nutrient data for each topping includes calories, proteins, fats, carbohydrates, sodium, calcium, iron, and other macro and micro components, all expressed per gram. These values are collected from the USDA [36] and FoodData Central datasets [37], where each food item is standardized to a per-gram nutritional profile.
For every topping i, the total calorie and nutrient values are computed by scaling the per-gram nutrient factors with the estimated weight m i in grams. The overall calorie value C i for each topping is calculated as:
C i = m i × E i
As shown in Equation (5), the total calorie content for each topping is computed by multiplying the estimated mass by its corresponding per-gram energy value (kcal/g), where E i denotes the per-gram energy value of the i-th topping obtained from the nutritional dataset.
Similarly, the macro and micro nutrients are computed using:
n i = m i × f i
As shown in Equation (6), the nutrient vector n i for each topping is calculated by scaling the per-gram nutrient values, such as protein, fat, carbohydrates, sodium, and calcium, by the mass m i .
Finally, the total nutritional values for the entire pizza are computed by summing all topping contributions:
C total = i C i , n total = i n i
As shown in Equation (7), the total calorie value C total and the aggregated nutrient vector n total represent the complete nutritional profile of the pizza, combining all detected toppings to give per-topping and overall composition.
The advantage of this approach is that it removes the need to assume a fixed calorie count for all pizzas. Instead, each pizza is analyzed individually based on its detected toppings, thickness, and densities. The output image sent back to the user includes visual annotations of the detected toppings, their calories, and the macro–micro distribution, providing a complete and interpretable nutritional report for a single pizza image.
Algorithm 3 Nutrient and Calorie Computation
Require: For each topping i: estimated mass m i (g); nutrient table N containing per-gram values for calories E i and macro/micro vector f i
Ensure: For each topping i: calories C i , nutrient vector n i ; and totals for the full pizza
1: for each topping instance i do
2:      ( E i , f i ) N [ l i ]                     ▹ lookup per-gram energy and nutrient factors
3:      C i m i × E i                            ▹ total calories (kcal) for topping i
4:      n i m i × f i                             ▹ scale nutrients to mass in grams
5: end for
6: C total i C i                             ▹ sum of calories for entire pizza
7: n total i n i                         ▹ aggregate all macro and micro nutrients
8: Annotate output image with { ( l i , C i , n i ) } and total summary
9: return { C i , n i } for each topping and ( C total , n total ) for the pizza

5.5. Federated Learning

To maintain user privacy while still improving the model over time, the iLog 2.2 adopts a federated learning (FL) framework. In this setup, as shown in Algorithm 4, all user data such as food images and nutrient outputs remain on the local device. The learning process happens collaboratively across multiple users, where each device trains the model on its own data and shares only encrypted weight updates with the central server. No raw image or nutritional information is ever transmitted, ensuring complete data confidentiality.
This design is particularly important in real-world dietary and healthcare scenarios, where food images and user-specific nutritional data are sensitive and cannot be shared with centralized servers. Federated learning enables collaborative model improvement across distributed users while ensuring that all raw data remains on-device, preserving privacy and supporting compliance with data protection regulations.
During each communication round, the global model with weights W t is distributed to a group of clients. Each client performs local training on its private dataset and generates an updated weight set W t k . These updates are securely aggregated on the server using the Federated Averaging (FedAvg) algorithm:
W t + 1 = k = 1 K n k j = 1 K n j W t k
As shown in Equation (8), the updated global model weights W t + 1 are computed as a weighted average of the local client updates, where n k represents the number of training samples held by the k th client. This ensures that larger datasets contribute proportionally more to the global update. The process allows the iLog 2.2 model to learn collaboratively from distributed user data while preserving privacy and avoiding centralized data collection.
The federated learning setup also reduces the dependency on cloud computation and can be extended to run on lightweight edge devices, enabling secure, fast, and localized processing of food images in future versions of the system.
Algorithm 4 Federated Learning Update Process (FedAvg)
Require: Global model weights W t at round t; total K clients; local epochs E; learning rate η
Ensure: Updated global model W t + 1
1: Server broadcasts global weights W t to selected clients
2: for each participating client k { 1 , , K }  in parallel do
3:     Load local dataset D k
4:     for each local epoch e = 1 to E do
5:         Compute gradients L k ( W t ) on D k
6:         Update local model: W t k W t η L k ( W t )
7:     end for
8:     Encrypt local update Δ W t k = W t k W t for privacy
9:     Send Δ W t k (not raw data) to server
10: end for
11: Server aggregates updates using FedAvg:
W t + 1 = W t + k = 1 K n k j = 1 K n j Δ W t k

12: Distribute new global weights W t + 1 to all clients
13: return W t + 1
Implementation Details: For experimentation, the federated learning setup was simulated using three clients representing different user devices, each trained on a subset of the pizza image dataset. The global model was initialized once and updated over two communication rounds. Each client performed one local epoch per round using its private data before sending encrypted model updates to the central aggregator. After aggregation with the FedAvg algorithm, the updated global model showed smoother convergence and improved segmentation accuracy compared to standalone training. This confirms that the proposed federated setup can effectively learn from distributed user data while preserving privacy.

6. Results and Discussion

The proposed iLog 2.2 model was tested on the curated pizza dataset, and the outputs clearly show how the system detects toppings, calculates mass, calories, and finally gives a complete nutrient report for every topping and the total pizza. The model performed well even when the images were taken from different angles, without any reference object or special lighting setup.
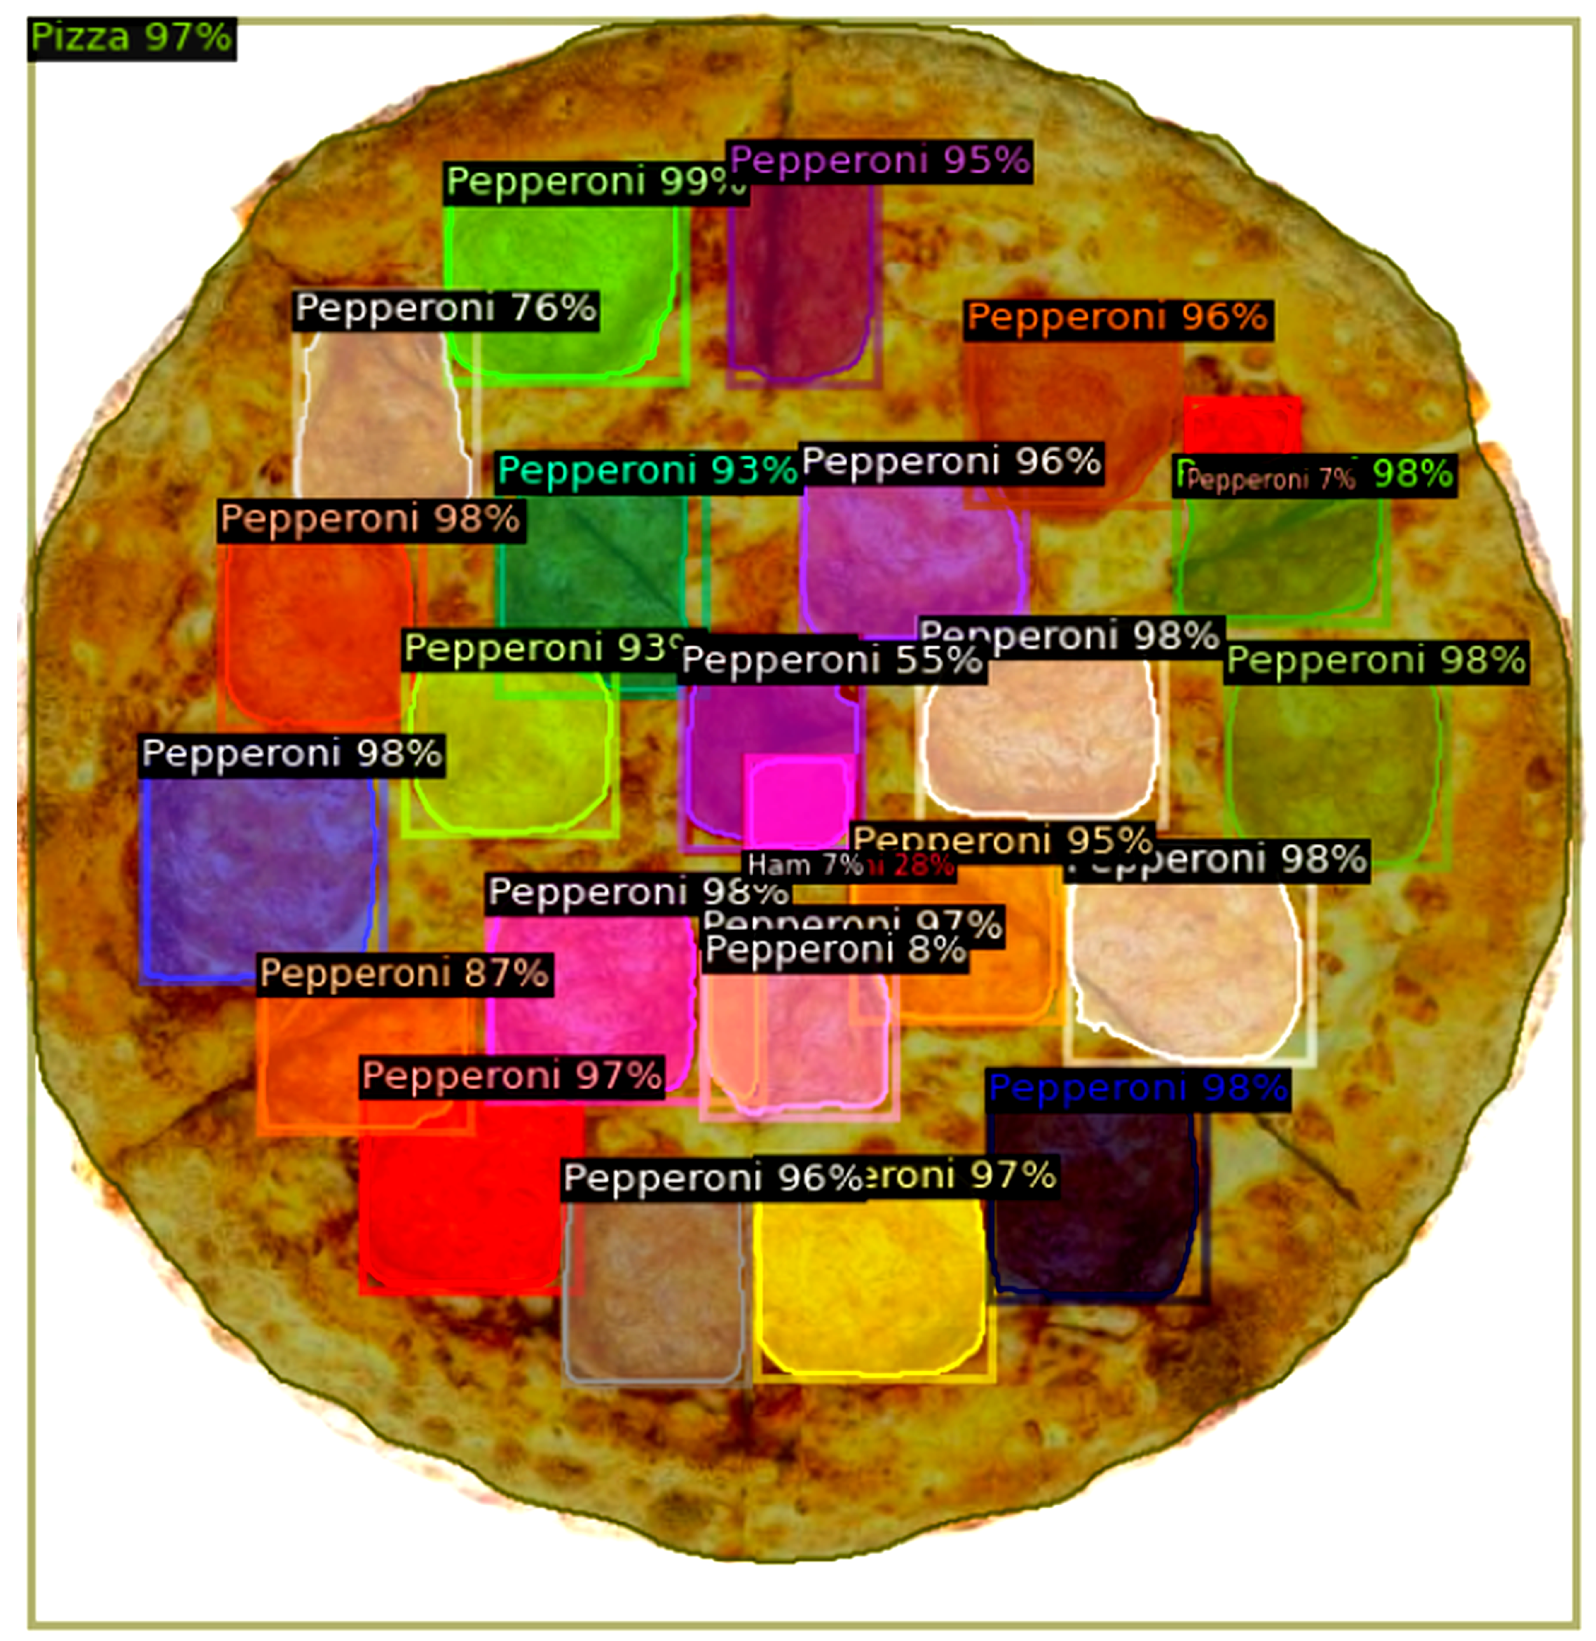
Figure 6 shows the output from the Mask R-CNN model, where each topping on the pizza is correctly detected and labeled with its class name and confidence value. As seen, the model identified the pizza base with an approximate 97% confidence and detected every piece of pepperoni and ham topping individually with high accuracy. The color-coded bounding boxes and segmentation masks show that the system can handle overlapping toppings and irregular shapes effectively.
After detection, the next stage converts the topping areas into volume using the preset height and then into mass in grams. The total estimated mass of the pizza was 1128.805 g. Using the mass and nutrient database, the system calculated the calories for each topping and the total pizza. Table 3 shows that the combined contribution of the base (dough), cheese layer, and sauce layer results in a total of 2743.31 kcal. Among these, the base (dough) contributes the largest share (2129.605 kcal), followed by the cheese layer (579.413 kcal), while the sauce layer contributes a comparatively smaller amount (34.292 kcal). This demonstrates that the area-based volume estimation effectively scales calorie values according to the component proportions.
Table 4 presents the macro-nutrient values for each topping, including protein, fat, carbohydrates, sugar, and fiber. The base pizza layer contributes the highest carbohydrate and protein content, while pepperoni mainly adds to the fat content. This detailed breakdown helps understand which components affect calorie distribution the most.
Similarly, Table 5 shows the micro-nutrients including sodium, calcium, iron, potassium, and cholesterol. As expected, the cheese layer and pepperoni are rich in sodium and calcium, while the base and sauce contribute to iron and potassium levels [42]. The total sodium content for the pizza was calculated as 7409.34 mg, which highlights how even a single pizza can contribute significantly to daily sodium intake.
Overall, these results show that iLog 2.2 can accurately detect each topping, calculate its mass, and determine all nutritional details including macros and micros. This makes the model more interpretable, user-friendly, and closer to real-world diet monitoring than traditional calorie estimation methods that only provide a total calorie number without considering each topping separately.

6.1. Detection and Segmentation Accuracy Comparison

To validate the performance of the proposed iLog 2.2 model, detection and segmentation accuracies were compared with existing food recognition frameworks. The comparison was based on standard evaluation metrics such as mean Average Precision (mAP), AP50, and AP75. As summarized in Table 6, the proposed model achieved a bounding box mAP of 96.0% and a segmentation mAP of 92.0%, outperforming all previous works, including iLog 2.0, FoodSegDL, YOLOv5–EfficientDet, and the standard Mask R-CNN baseline.
These results serve as baseline comparisons with existing methods, demonstrating the performance improvements achieved by the proposed model.
These quantitative comparisons demonstrate that the proposed iLog 2.2 model achieves superior detection and segmentation performance compared to existing methods, while additionally extending the analysis to volume and nutrition estimation, which is not addressed by prior approaches. The strong AP50 and AP75 values demonstrate high spatial precision and consistent mask accuracy even for small and overlapping toppings [43]. These improvements are primarily due to the topping-level dataset, refined polygon annotations, and optimized training parameters designed for single-food detection. Overall, iLog 2.2 provides reliable and detailed segmentation results while maintaining a lightweight and deployable architecture suitable for real-time applications.

6.2. Prototype Results and Application Interface

To demonstrate the usability and potential deployment of the proposed system, a lightweight mobile interface was designed as a prototype mockup using Figma [44] and its AI-assisted design features. This prototype does not represent a fully implemented mobile application but rather a conceptual interface illustrating how users can interact with the system, view detected food items, and access estimated nutritional information. The design incorporates sample outputs generated by the proposed pipeline to showcase the intended functionality and user experience.
The prototype demonstrates the complete user flow and final nutrition analysis in a single unified panel. As illustrated in Figure 7, the process begins with secure user login and image input, followed by automatic topping detection, nutrient computation, and visualization of per-topping calories, macro-nutrients, and micro-nutrients. The final output displays detailed nutritional summaries and meal logging features, allowing users to track their daily intake directly from the application interface.
The prototype visually demonstrates how the iLog 2.2 model can operate as an end-to-end mobile solution for real-time nutrition estimation. From capturing or uploading a single RGB image, the system automatically detects toppings, calculates their volume, converts it to weight, and retrieves macro-nutrient and micro-nutrient values from the curated database. Unlike traditional calorie-tracking apps that rely on manual input or barcode scanning, this approach offers a fully automated and interpretable workflow. The lightweight design, combined with its privacy-preserving architecture, confirms that iLog 2.2 can be efficiently deployed on edge and mobile platforms for practical everyday use.

6.3. Validation and Model Evaluation

The validation stage was carried out using the test dataset containing 219 images. It aimed to verify the detection accuracy, class consistency, and convergence behavior of the proposed lightweight Mask R-CNN network.
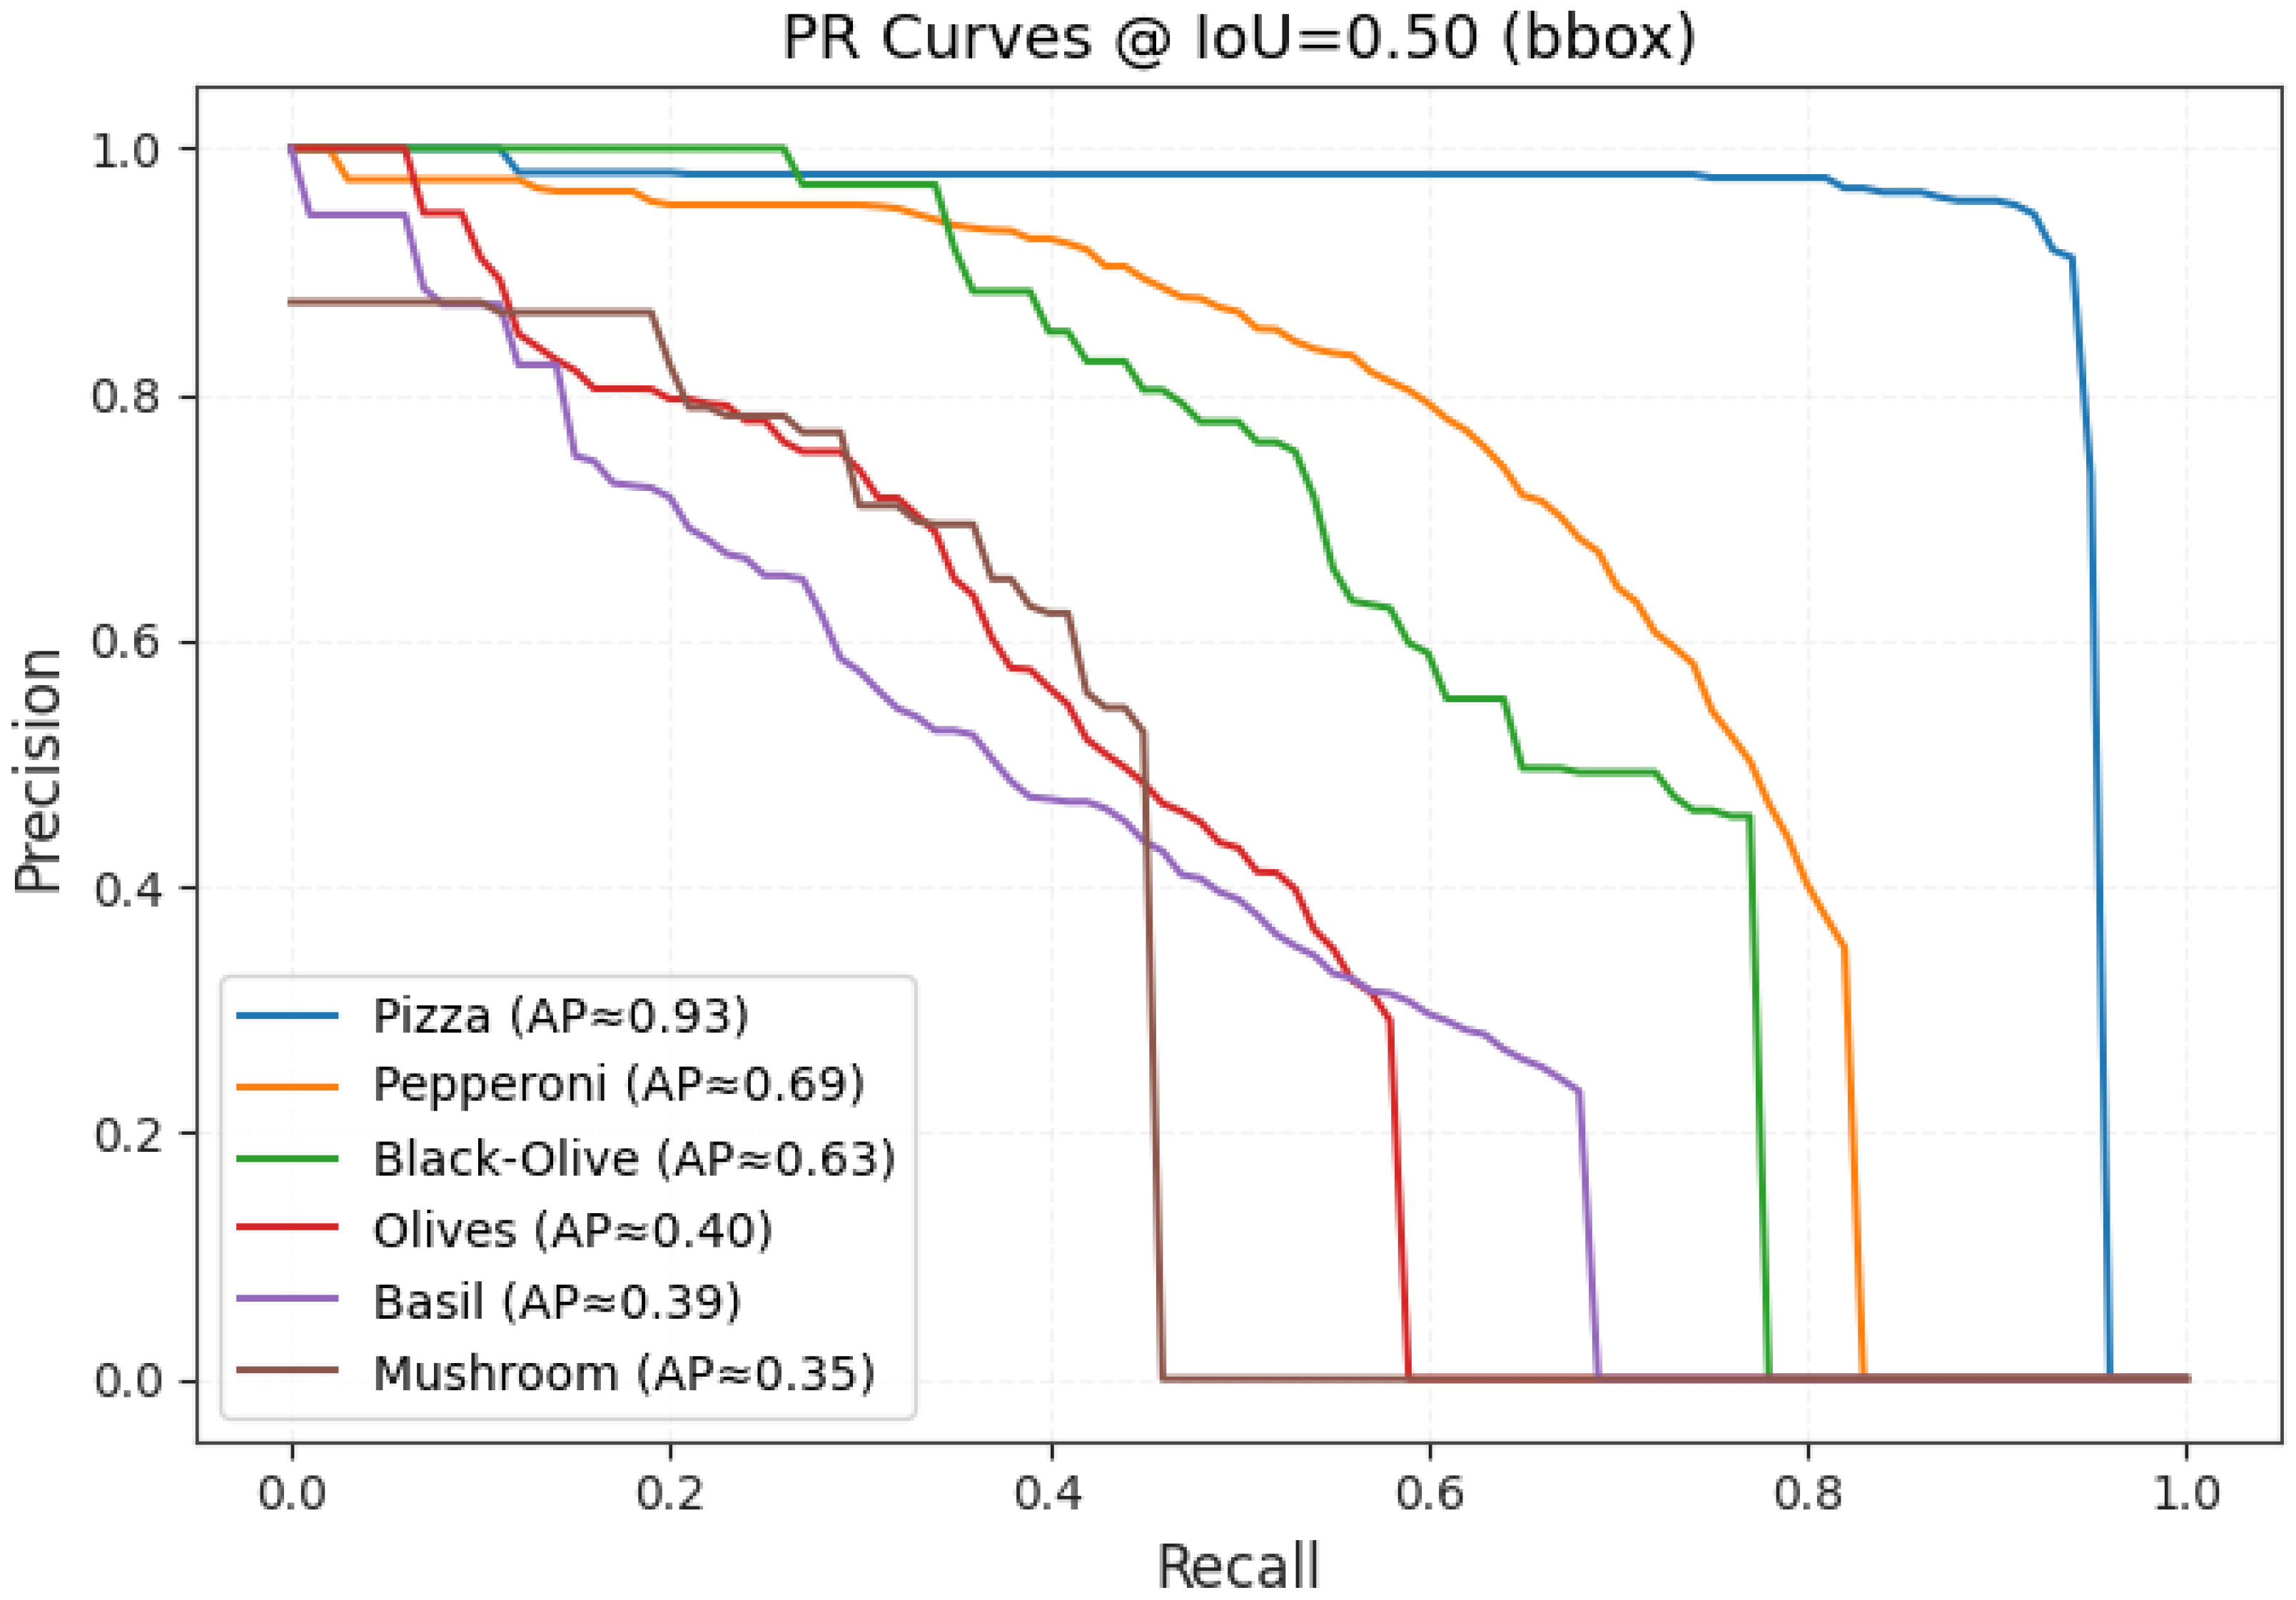
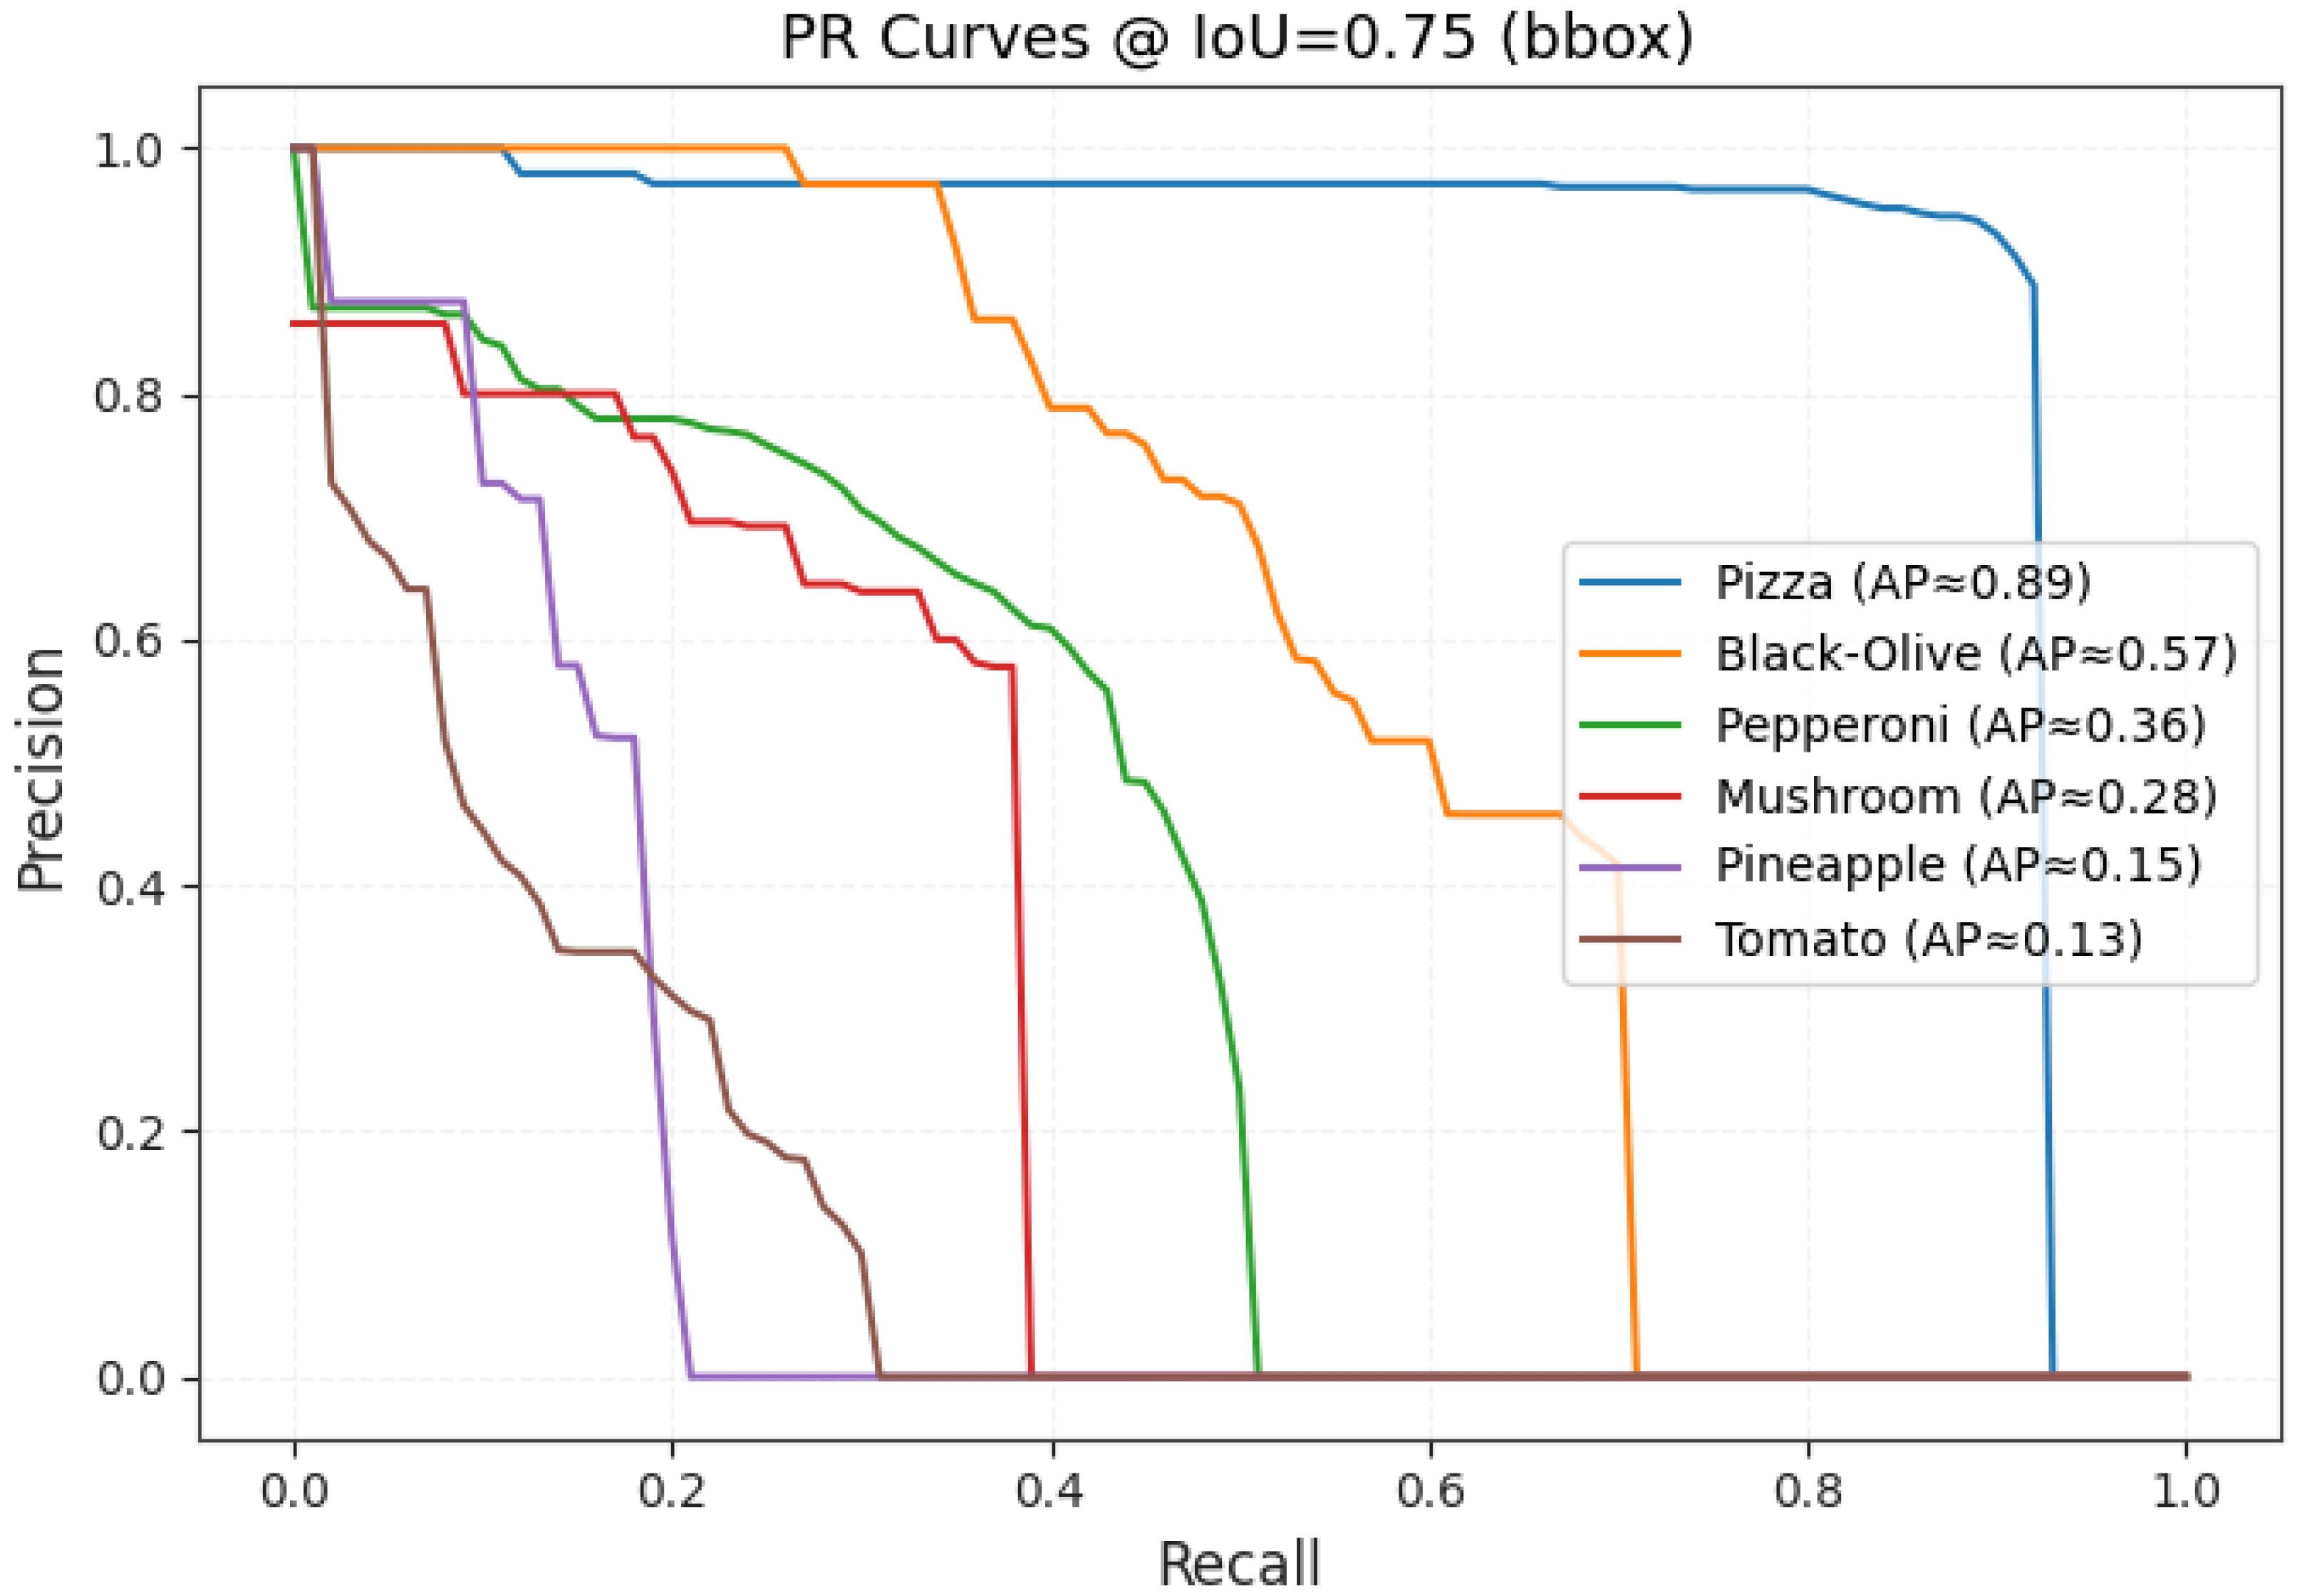
The precision–recall (PR) curves in Figure 8 and Figure 9 illustrate the detection precision at two Intersection-over-Union (IoU) thresholds. At IoU = 0.50, the model maintained high performance across major toppings, achieving an Average Precision (AP) of 0.93 for Pizza, 0.69 for Pepperoni, and 0.63 for Black Olives. At a stricter IoU = 0.75 threshold, precision slightly decreased, yet the Pizza and Black Olive classes continued to show strong localization accuracy, indicating that the model generalizes well even under tighter bounding box requirements.
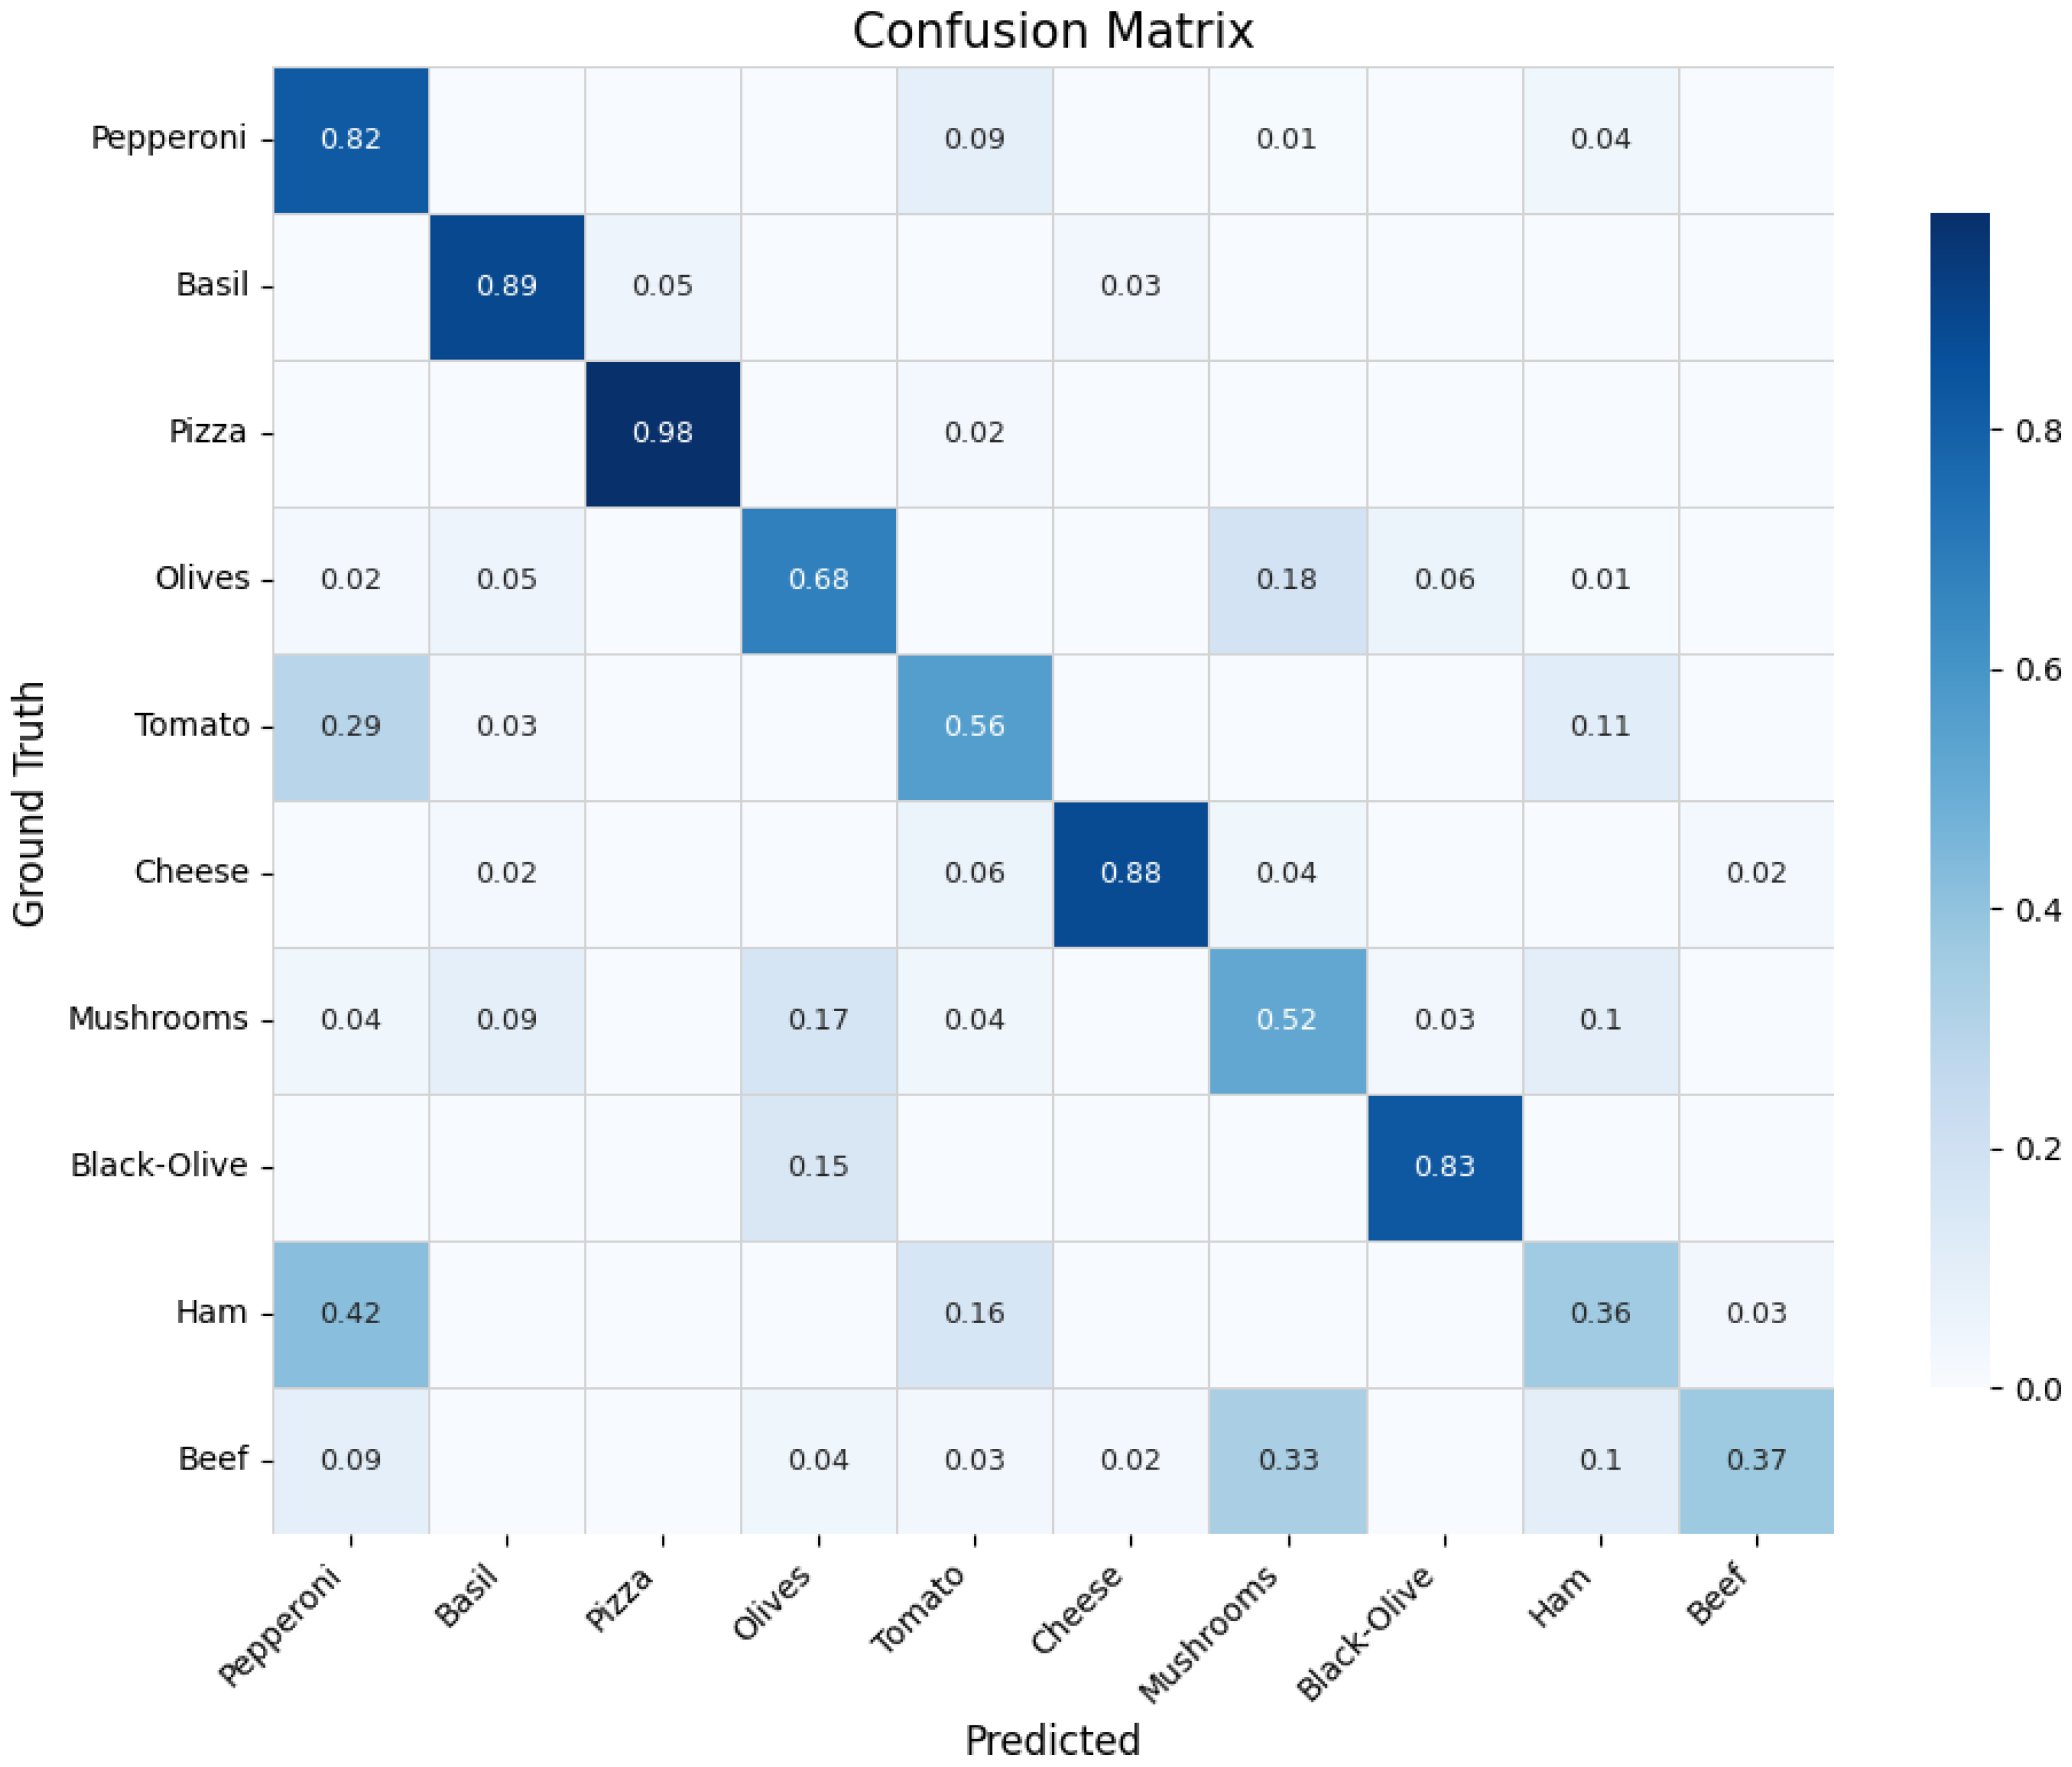
The confusion matrix in Figure 10 illustrates the prediction accuracy and class-wise performance across the detected food components. Strong diagonal dominance is observed for Pizza (0.98), Basil (0.89), and Cheese (0.88), indicating that the model performs consistently for major categories. Moderate recognition accuracy is seen for Pepperoni (0.82), Black-Olive (0.83), and Olives (0.68), while classes such as Tomato (0.56) and Mushrooms (0.52) show slight confusion with visually similar ingredients. Minor misclassifications occur between pairs like Ham–Beef and Mushroom–Olive due to overlapping texture and color similarities. Overall, the matrix confirms stable performance across diverse ingredient types with clear separation in dominant categories.
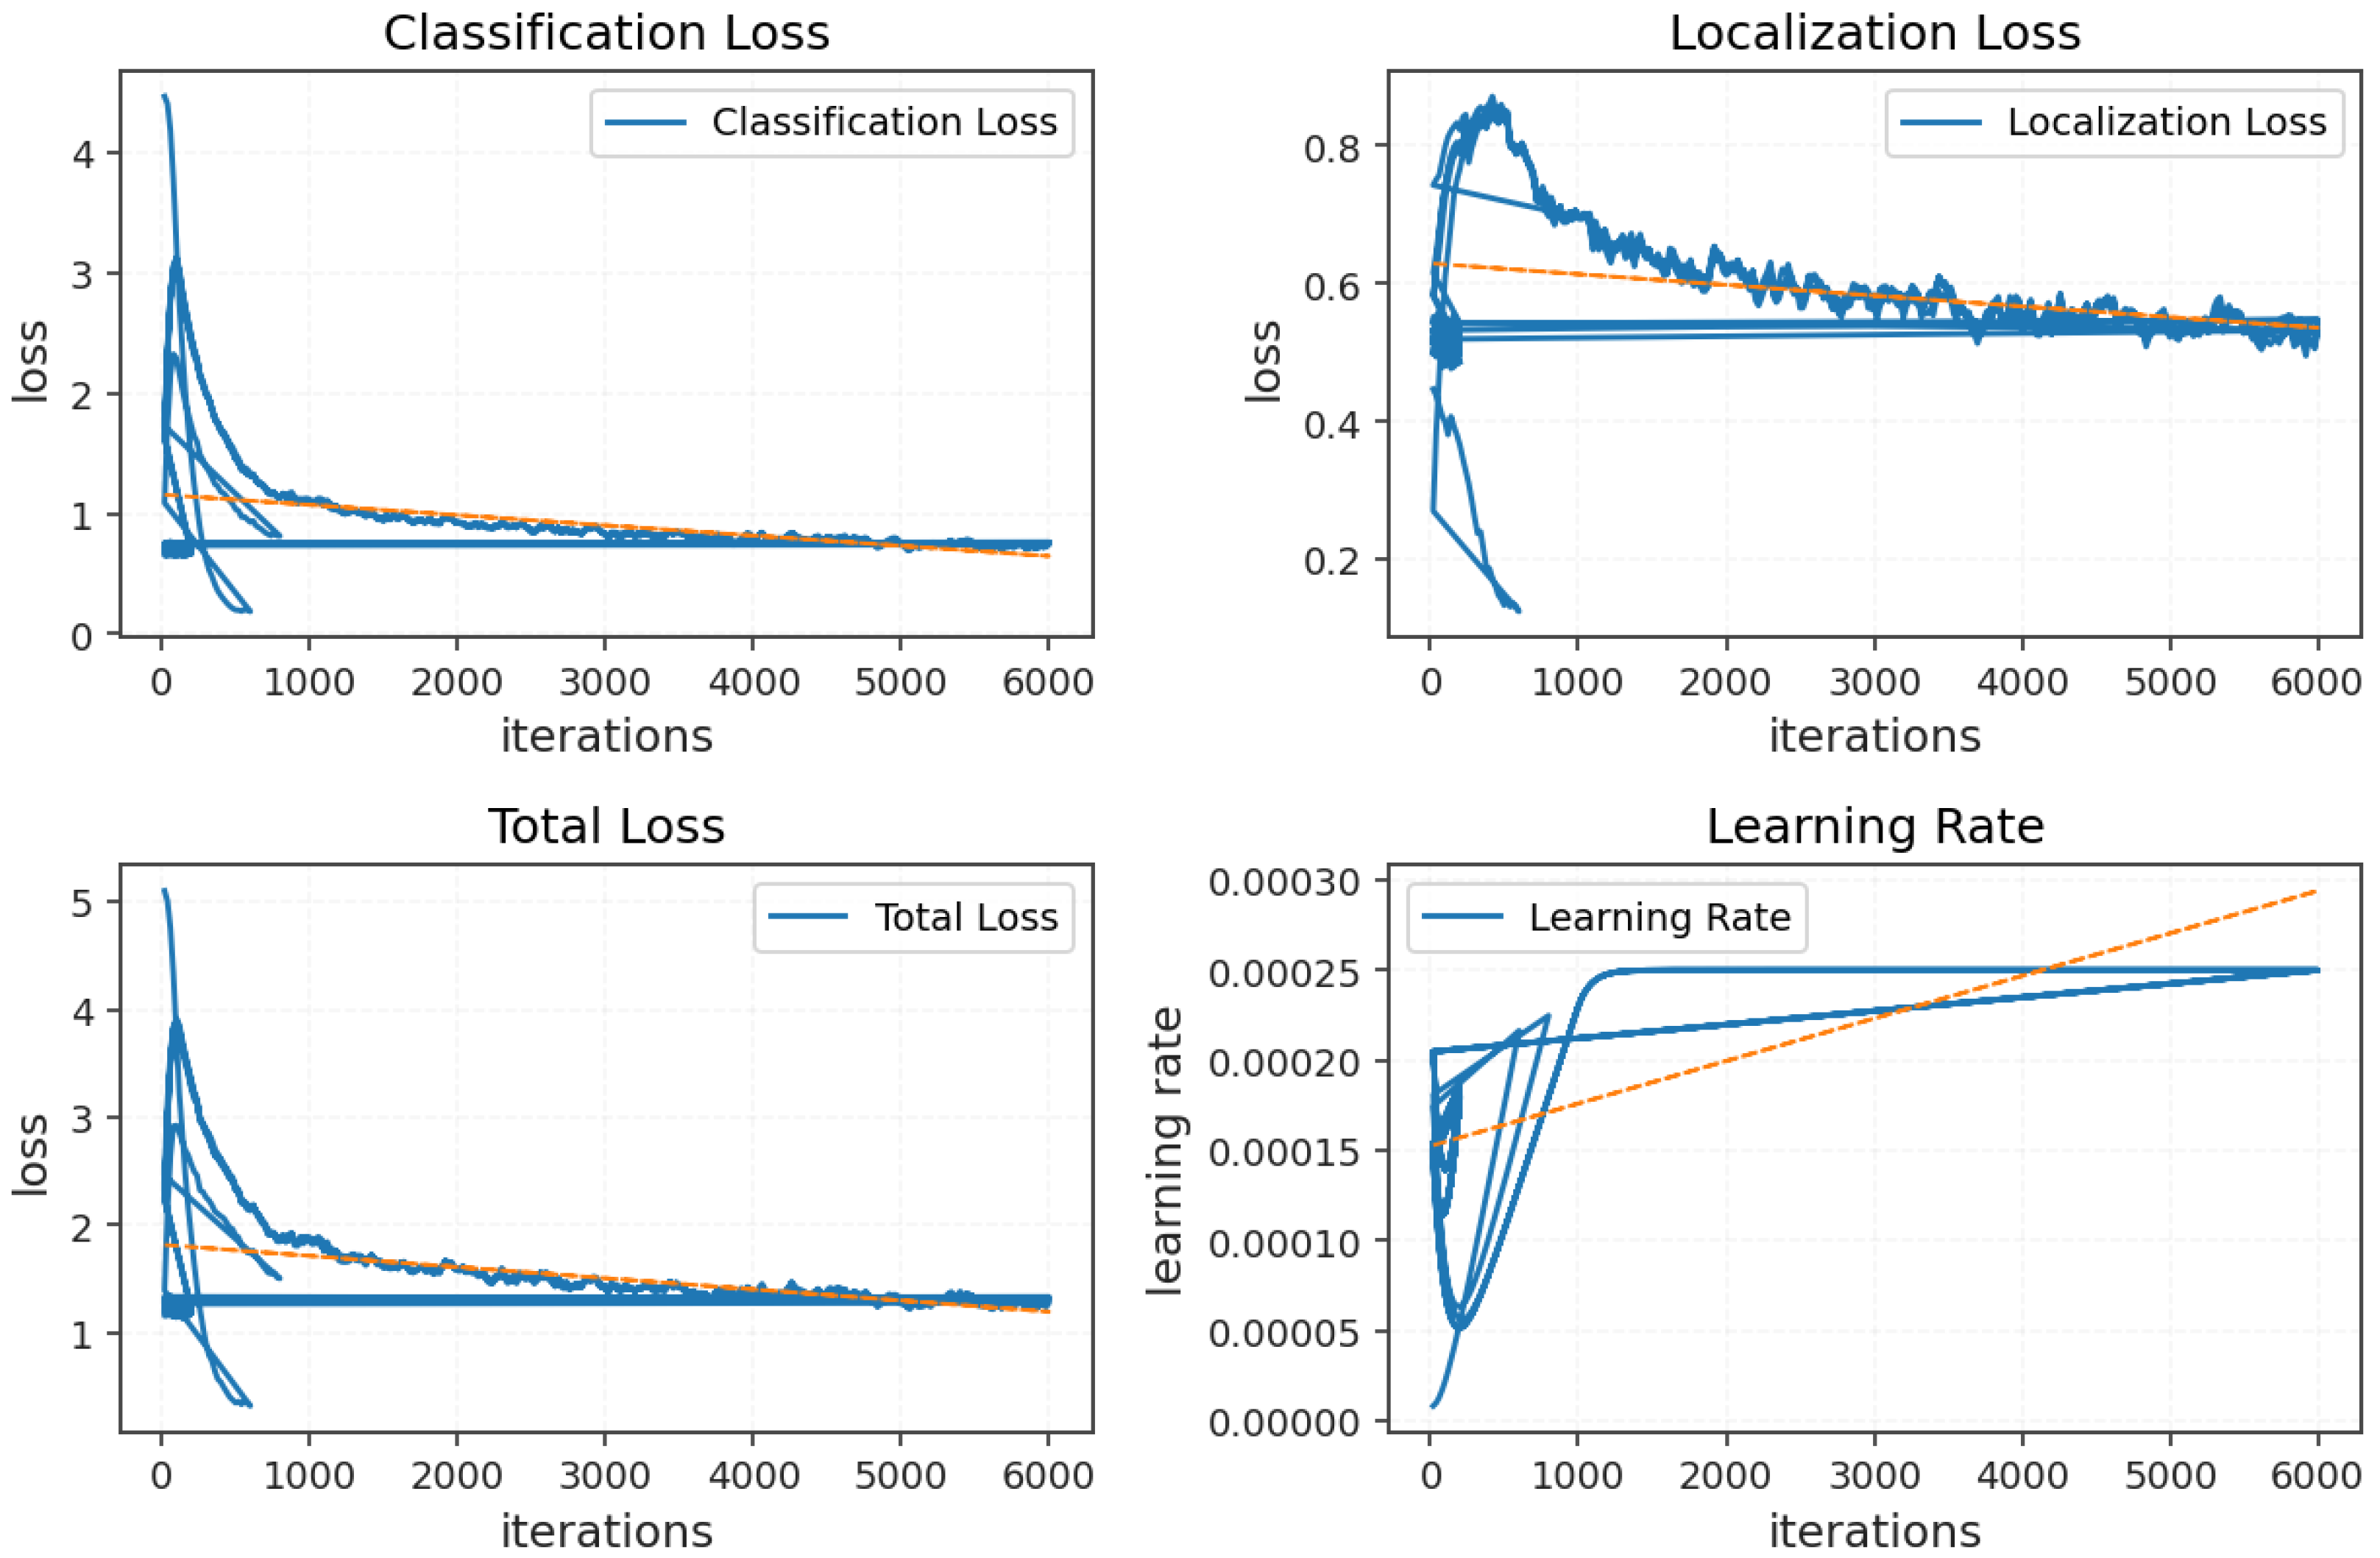
The training and validation trends in Figure 11 display smooth convergence across all loss components and the learning rate.
  • Classification Loss: Rapidly decreased within the first 1000 iterations, stabilizing near 0.8, confirming effective learning of topping features.
  • Localization Loss: Gradually converged near 0.5, showing accurate bounding box regression.
  • Total Loss: Declined consistently and plateaued without oscillation, validating stable optimization.
  • Learning Rate: Followed a warm-up schedule and stabilized around 2.5 × 10 4 , ensuring smooth convergence without overshooting.
Overall, the validation results (Figure 8, Figure 9, Figure 10 and Figure 11) confirm that the iLog 2.2 model achieves high detection accuracy, stable convergence, and reliable classification for both frequent and rare toppings, ensuring robustness for real-world food analysis.

6.4. Nutrition Estimation Validation

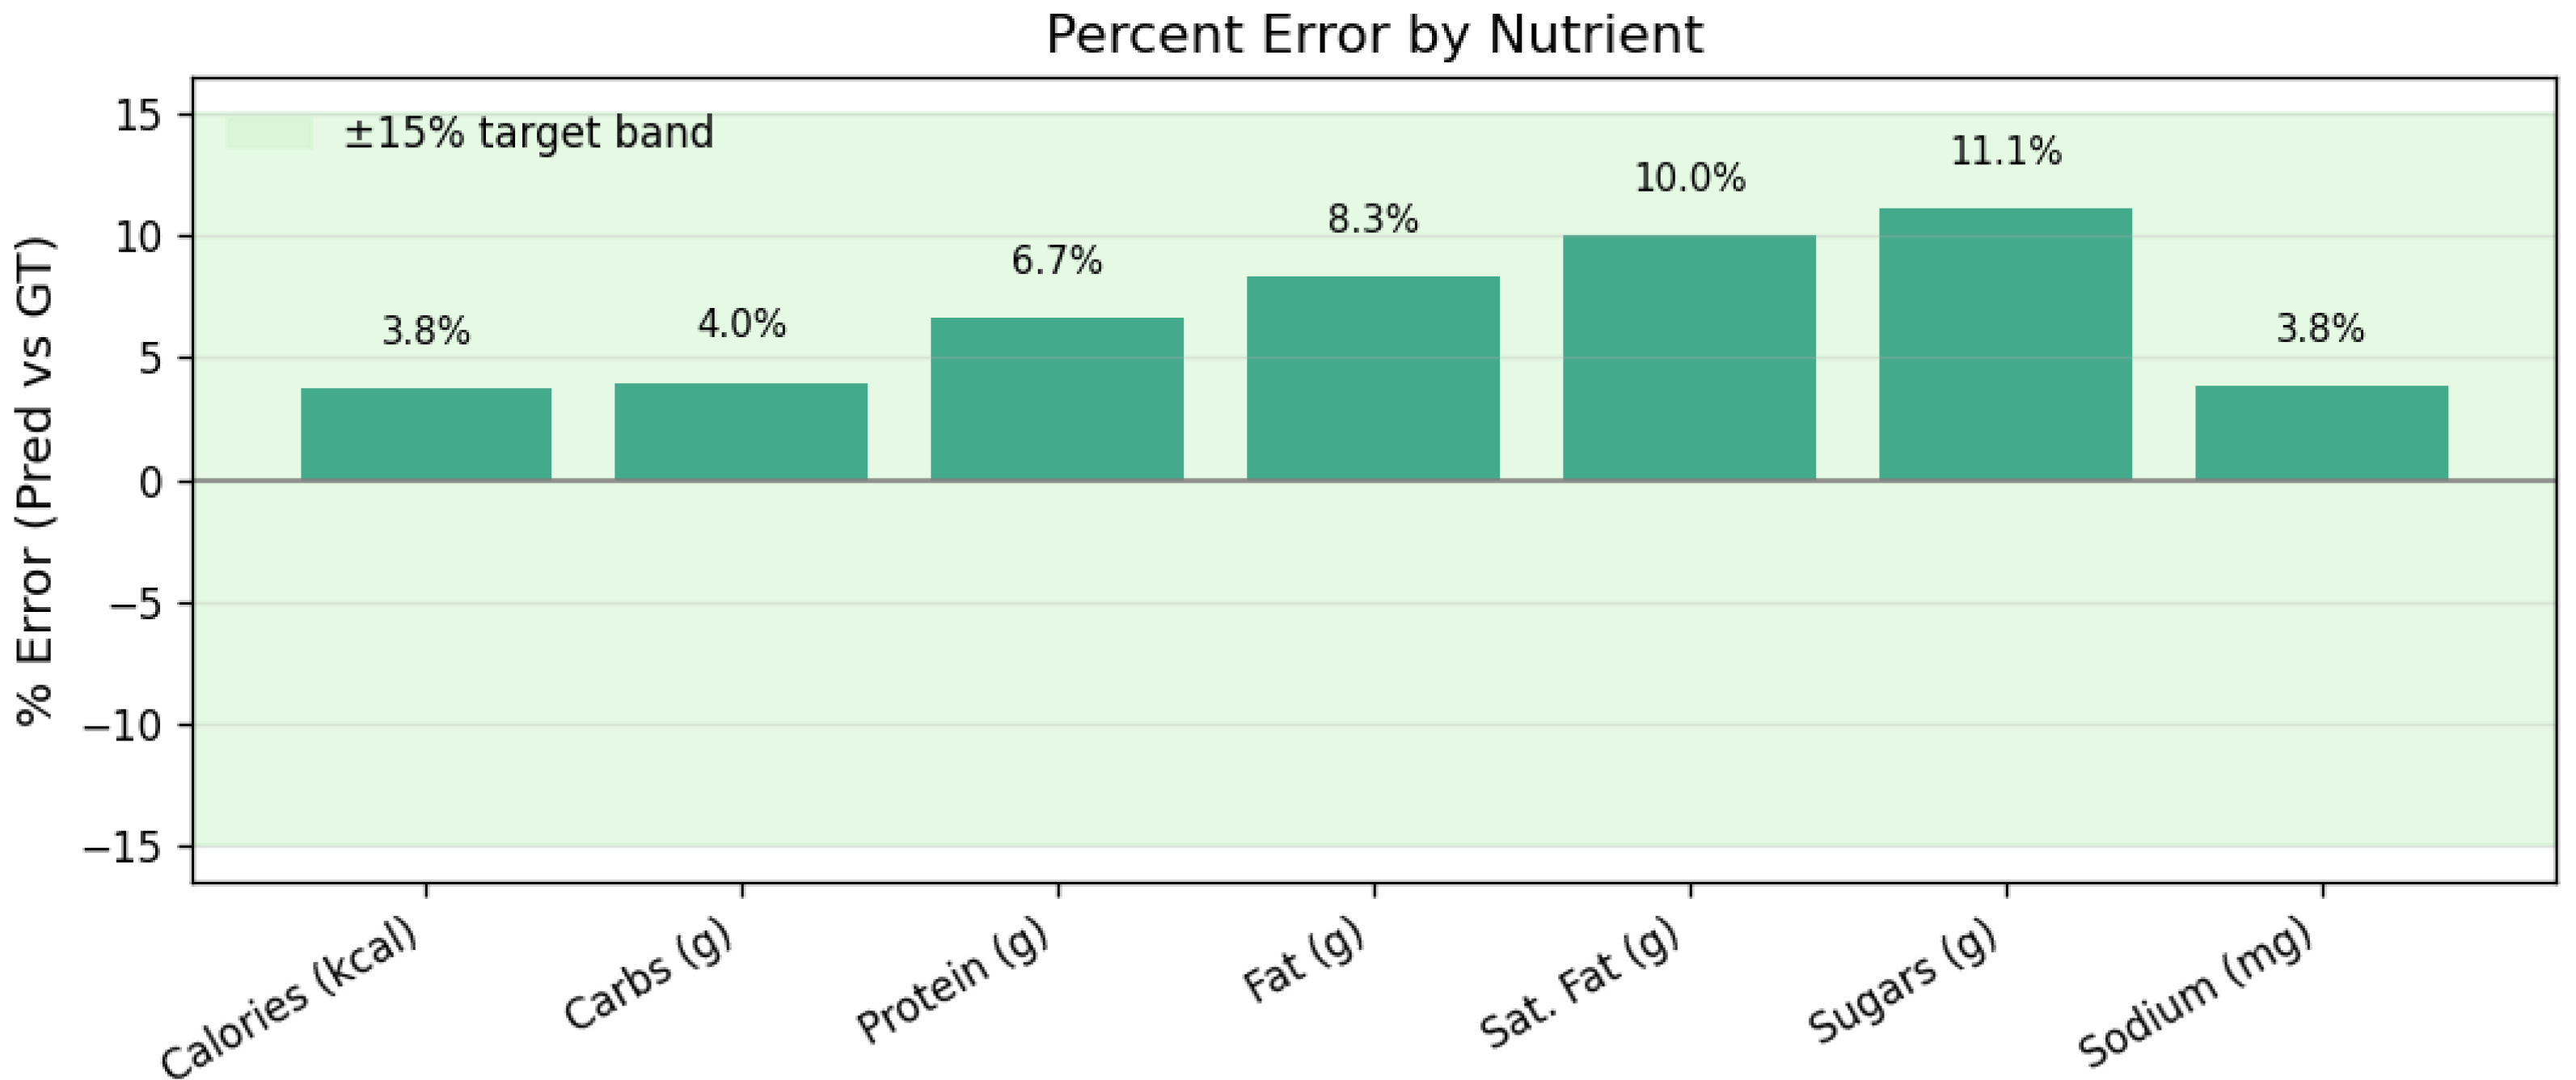
Evaluation was performed by comparing the model’s predicted nutrient outputs with ground-truth reference values derived from the curated nutritional dataset using a per-nutrient percent-error view, as shown in Figure 12. These results are computed on the held-out test dataset, ensuring evaluation on unseen samples.
All metrics fall within a practical ± 15 % target band. Calories and sodium show the smallest deviations ( 3.8 % ), carbohydrates remain tight at 4.0 % , and protein/fat errors are moderate at 6.7 % and 8.3 % . The largest gaps appear for saturated fat ( 10.0 % ) and sugars ( 11.1 % ), which is expected due to recipe variability and label noise in those micro-nutrient annotations. Overall, the model stays well within an application-friendly tolerance while preserving ingredient-level interpretability.
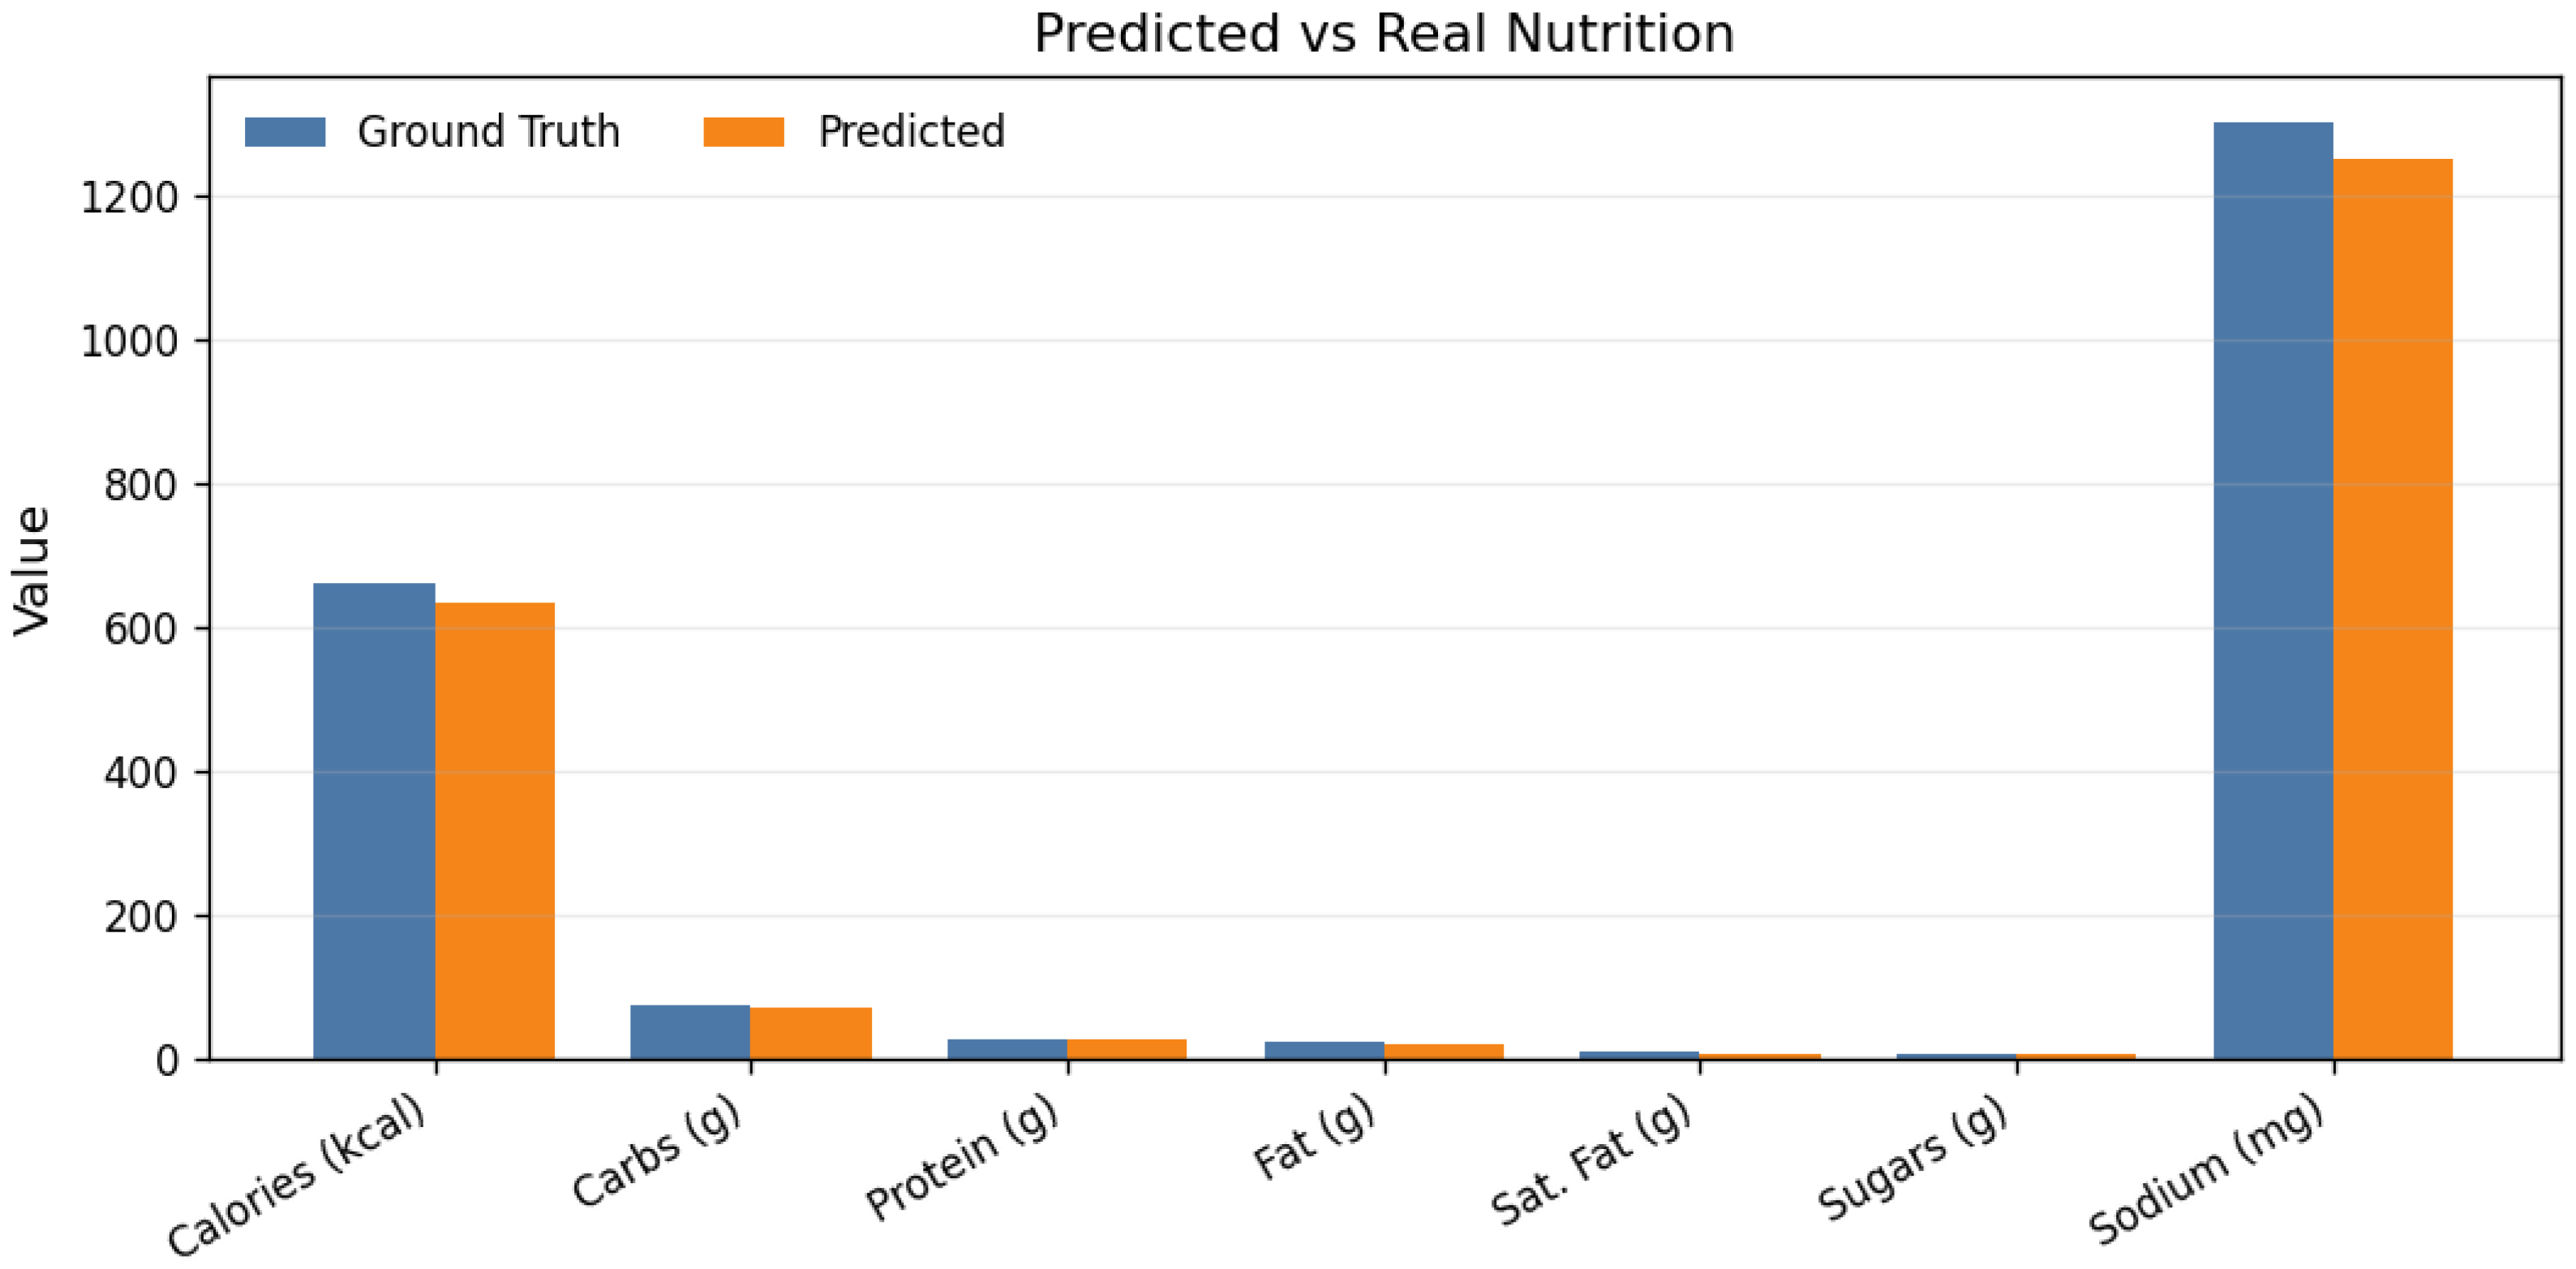
To illustrate the differences more clearly, Figure 13 compares the predicted values with the ground truth. Bars for calories, carbs, protein, fat, saturated fat, sugars, and sodium track closely, with the biggest visible spread in sugars and saturated fat. This aligns with the percent-error view and reflects natural variation in ingredient formulations (e.g., sauce and cheese brands) and preset-height assumptions used during volume–mass conversion. Despite these factors, the model consistently preserves rank order across nutrients, which is important for practical diet feedback.
These results demonstrate that the proposed iLog 2.2 framework achieves accurate segmentation along with reliable volume and nutrition estimation, providing a practical improvement over traditional approaches that rely on fixed calorie assumptions or lack ingredient-level analysis. Since nutritional values are computed from estimated mass, which is derived from volume, the low error in nutrient estimation also indicates reliable volume approximation in the absence of direct ground-truth volume measurements. Percent-error metrics are used in this work as they provide a normalized and interpretable measure of deviation across different nutrient scales, making them suitable for evaluating both macro- and micro-nutrient estimation.

7. Conclusions and Future Scope

This work presented iLog 2.2, an advanced food analysis framework that focuses on estimating macro-nutrients and micro-nutrients from single RGB images of pizzas. The proposed model uses a lightweight Mask R-CNN network integrated with a federated learning approach, making it privacy-preserving and suitable for mobile or edge-based deployment. Unlike earlier versions of iLog and other calorie estimation systems that rely on preset values or manual entry, this work performs per-topping detection, converts the calculated volume into mass, and computes the nutritional composition using curated USDA and Food-a-pedia datasets.
While the current dataset is focused on pizza-based samples, it serves as a representative multi-component food scenario for evaluating ingredient-level analysis. The dataset size and diversity capture realistic topping combinations; however, future work will explore larger and more diverse public food datasets to further improve generalization across broader food categories.
The current federated learning setup is designed as a proof-of-concept to demonstrate the feasibility of privacy-preserving training within the proposed framework. A limited number of clients and communication rounds are used to maintain computational efficiency and align with edge-device constraints. Future work will explore larger-scale federated settings with increased client participation, communication rounds, and heterogeneous data distributions.
The model achieved high accuracy during validation, reaching a mean Average Precision (mAP) of 96% for bounding box detection and 92% for segmentation. The prototype application demonstrated the real-world usability of the system by automatically detecting pizza components, displaying their mass, calories, and nutritional composition in an intuitive mobile interface. This ensures fast, interpretable, and privacy-preserving nutritional tracking for users and healthcare professionals.
In the future, iLog 2.2 can be extended to include multi-food segmentation and meal-level analysis, enabling the system to identify mixed cuisines beyond pizzas. The integration of real-time inference through edge AI devices, such as NVIDIA Jetson and mobile NPUs, can further reduce cloud dependency. Enhancing the federated learning module with adaptive aggregation techniques and user-specific personalization will strengthen privacy and model performance. Future work will explore improving the reliability and robustness of AI-driven nutrition estimation systems, particularly in real-world deployment scenarios. Additionally, incorporating temporal food logs and integrating physiological or lifestyle data could open possibilities for a complete personalized nutrition monitoring ecosystem. The quantitative results confirm that the proposed system achieves both high detection accuracy and low nutrition estimation error, validating its effectiveness for real-world dietary monitoring applications.
Overall, iLog 2.2 demonstrates that AI-driven nutrition estimation can move beyond calorie counting to precise ingredient-level nutritional understanding, setting a foundation for future smart healthcare and dietary monitoring systems.

Author Contributions

Conceptualization, I.D.S., L.R. and S.P.M.; methodology, I.D.S. and L.R.; software, I.D.S.; validation, L.R., S.P.M. and E.K.; formal analysis, I.D.S.; investigation, I.D.S.; resources, S.P.M. and E.K.; data curation, I.D.S.; writing—original draft preparation, I.D.S.; writing—review and editing, L.R., S.P.M. and E.K.; visualization, I.D.S.; supervision, L.R., S.P.M. and E.K.; project administration, S.P.M. All authors have read and agreed to the published version of the manuscript.

Funding

This research received no external funding.

Data Availability Statement

The dataset used in this study was collected by the authors and has been made publicly available on Kaggle: https://www.kaggle.com/datasets/indusiri/pizza-annotated, accessed on 24 March 2026.

Acknowledgments

Figure 1, Figure 2 and Figure 3 include AI-generated images created using ChatGPT (OpenAI, GPT-5.3). ChatGPT was also used to assist with English grammar and language refinement throughout the manuscript. All authors have reviewed and approved the use of this tool and consent to this acknowledgment.

Conflicts of Interest

The authors declare no conflicts of interest.

References

  1. Quan, W.; Zhou, J.; Wang, J.; Huang, J.; Du, L. Machine Learning-Driven Precision Nutrition: A Paradigm Evolution in Dietary Assessment and Intervention. Nutrients 2025, 18, 45. [Google Scholar] [CrossRef]
  2. Zheng, J.; Wang, J.; Shen, J.; An, R. Artificial Intelligence Applications to Measure Food and Nutrient Intakes: Scoping Review. J. Med. Internet Res. 2024, 26, e54557. [Google Scholar] [CrossRef] [PubMed]
  3. Chen, J.; Berkman, W.; Bardouh, M.; Ng, C.Y.K.; Allman-Farinelli, M. The use of a food logging app in the naturalistic setting fails to provide accurate measurements of nutrients and poses usability challenges. Nutrition 2019, 57, 208–216. [Google Scholar] [CrossRef] [PubMed]
  4. Rachakonda, L.; Mohanty, S.; Kougianos, E. iLog: An Intelligent Device for Automatic Food Intake Monitoring and Stress Detection in the IoMT. IEEE Trans. Consum. Electron. 2020, 66, 115–124. [Google Scholar] [CrossRef]
  5. Mitra, A.; Goel, S.; Mohanty, S.P.; Kougianos, E.; Rachakonda, L. iLog 2.0: A Novel Method for Food Nutritional Value Automatic Quantification in Smart Healthcare. In Proceedings of the 2022 IEEE International Symposium on Smart Electronic Systems (iSES), Warangal, India, 18–22 December 2022; pp. 683–688. [Google Scholar] [CrossRef]
  6. Siripurapu, I.D.; Rachakonda, L.; Mohanty, S.P.; Kougianos, E. iLog 2.1: Calorie Estimation for Pizza via Mask R-CNN and Federated Learning. In Proceedings of the 2025 IEEE MetroCon, Hurst, TX, USA, 12–13 November 2025; pp. 1–3. [Google Scholar] [CrossRef]
  7. Falciano, A.; Moresi, M.; Masi, P. Phenomenology of Neapolitan Pizza Baking in a Traditional Wood-Fired Oven. Foods 2023, 12, 890. [Google Scholar] [CrossRef]
  8. Taheri Gorji, H.; Saeedi, M.; Mushtaq, E.; Kashani Zadeh, H.; Husarik, K.; Shahabi, S.M.; Qin, J.; Chan, D.E.; Baek, I.; Kim, M.S.; et al. Federated Learning for Clients’ Data Privacy Assurance in Food Service Industry. Appl. Sci. 2023, 13, 9330. [Google Scholar] [CrossRef]
  9. Behnia, R.; Birrell, J.; Riasi, A.; Ebrahimi, R.; Dutta, K.; Hoang, T. Local Differential Privacy for Federated Learning with Fixed Memory Usage and Per-Client Privacy. arXiv 2025, arXiv:2510.12908. [Google Scholar] [CrossRef]
  10. Sethuraman, S.C.; Kompally, P.; Mohanty, S.P.; Choppali, U. MyWear: A Novel Smart Garment for Automatic Continuous Vital Monitoring. IEEE Trans. Consum. Electron. 2021, 67, 214–222. [Google Scholar] [CrossRef]
  11. Shonkoff, E.; Cara, K.C.; Pei, X.A.; Chung, M.; Kamath, S.; Panetta, K.; Hennessy, E. AI-based digital image dietary assessment methods compared to humans and ground truth: A systematic review. Ann. Med. 2023, 55, 2273497. [Google Scholar] [CrossRef]
  12. Tahir, G.A.; Kiong, L.C. SEG-FOOD Semantic Food Segmentation Through Deep Learning; IEEE Dataport: Piscataway, NJ, USA, 2020. [Google Scholar] [CrossRef]
  13. Muñoz, B.; Martínez-Arroyo, A.; Acevedo, C.; Aguilar, E. Lightweight DeepLabv3+ for Semantic Food Segmentation. Foods 2025, 14, 1306. [Google Scholar] [CrossRef]
  14. Chandra, P.; Parthasarathy, S.; Premraj, V.; Priya, M. CalorieAI: Deep Learning-Based Food Calorie Estimation System. TIJER—Int. Res. J. 2024, 11, 321–326. [Google Scholar]
  15. He, K.; Gkioxari, G.; Dollár, P.; Girshick, R. Mask R-CNN. arXiv 2018, arXiv:1703.06870. [Google Scholar] [PubMed]
  16. Shams, M.; Hussien, A.; Atiya, A.; Medhat, L.; Bhatnagar, R. Food Item Recognition and Calories Estimation Using YOLOv5. In Proceedings of the Lecture Notes in Networks and Systems; Springer: Berlin/Heidelberg, Germany, 2024; pp. 241–252. [Google Scholar] [CrossRef]
  17. Siripurapu, I.D.; Mitra, A.; Mohanty, S.P.; Kougianos, E. iLog 3.0: Estimating Food Volume from 2D Images Using Mask R-CNN and Monocular Depth Estimation. In Proceedings of the 2025 IEEE Computer Society Annual Symposium on VLSI (ISVLSI), Kalamata, Greece, 6–9 July 2025; Volume 1, pp. 1–6. [Google Scholar] [CrossRef]
  18. Dai, Y.; Park, S.; Lee, K. Utilizing Mask R-CNN for Solid-Volume Food Instance Segmentation and Calorie Estimation. Appl. Sci. 2022, 12, 10938. [Google Scholar] [CrossRef]
  19. Baban, A.; Erep, T.R.; Chaari, L. mid-DeepLabv3+: A Novel Approach for Image Semantic Segmentation Applied to African Food Dietary Assessments. Sensors 2024, 24, 209. [Google Scholar] [CrossRef]
  20. Xiao, Z.; Li, Y.; Deng, Z. Food image segmentation based on deep and shallow dual-branch network. Multimed. Syst. 2025, 31, 85. [Google Scholar] [CrossRef]
  21. Dehais, J.; Anthimopoulos, M.; Shevchik, S.; Mougiakakou, S. Two-View 3D Reconstruction for Food Volume Estimation. IEEE Trans. Multimed. 2016, 19, 1090–1099. [Google Scholar] [CrossRef]
  22. Fang, S.; Liu, C.; Zhu, F.; Delp, E.J.; Boushey, C.J. Single-View Food Portion Estimation Based on Geometric Models. In Proceedings of the IEEE International Symposium on Multimedia (ISM), Miami, FL, USA, 14–16 December 2015; pp. 385–390. [Google Scholar] [CrossRef]
  23. Revesai, Z.; Kogeda, O.P. Lightweight Interpretable Deep Learning Model for Nutrient Analysis in Mobile Health Applications. Digital 2025, 5, 23. [Google Scholar] [CrossRef]
  24. Mosaiyebzadeh, F.; Pouriyeh, S.; Parizi, R.M.; Sheng, Q.Z.; Han, M.; Zhao, L.; Sannino, G.; Ranieri, C.M.; Ueyama, J.; Batista, D.M. Privacy-Enhancing Technologies in Federated Learning for the Internet of Healthcare Things: A Survey. Electronics 2023, 12, 2703. [Google Scholar] [CrossRef]
  25. Liu, Z.; Lin, Y.; Cao, Y.; Hu, H.; Wei, Y.; Zhang, Z.; Lin, S.; Guo, B. Swin Transformer: Hierarchical Vision Transformer using Shifted Windows. In Proceedings of the IEEE/CVF International Conference on Computer Vision (ICCV), Montreal, QC, Canada, 11–17 October 2021. [Google Scholar]
  26. Cheng, B.; Schwing, A.; Kirillov, A. Per-Pixel Classification is Not All You Need for Semantic Segmentation. Adv. Neural Inf. Process. Syst. (NeurIPS) 2021, 34, 17864–17875. [Google Scholar]
  27. Lose It! Lose It! Calorie Counter and Food Tracker. Available online: https://www.loseit.com/ (accessed on 3 January 2026).
  28. MyFitnessPal. MyFitnessPal—Nutrition and Fitness Tracker. Available online: https://www.myfitnesspal.com/ (accessed on 12 January 2026).
  29. HealthifyMe. HealthifyMe—Calorie Counter, Diet Plan, and Fitness App. Available online: https://www.healthifyme.com/ (accessed on 20 January 2026).
  30. Bite AI. Bite AI—AI-Powered Food Journal. Available online: https://bite.ai/ (accessed on 28 January 2026).
  31. See How You Eat. See How You Eat Food Diary App. Available online: https://seehowyoueat.com/ (accessed on 5 February 2026).
  32. AteMate. AteMate—Visual Food Diary and Habit Tracker. Available online: https://youate.com/ (accessed on 11 February 2026).
  33. Yazio GmbH. Yazio—Calorie Counter and Meal Planner. Available online: https://www.yazio.com/en (accessed on 15 February 2026).
  34. Foodvisor. Foodvisor—AI-Powered Nutrition and Calorie Tracker. Available online: https://www.foodvisor.io/ (accessed on 18 February 2026).
  35. EatWise. EatWise—Meal Reminder and Eating Tracker. Available online: https://eatwiseapp.com/ (accessed on 22 February 2026).
  36. U.S. Department of Agriculture, Agricultural Research Service. FoodData Central. 2022. Available online: https://fdc.nal.usda.gov/ (accessed on 20 July 2022).
  37. U.S. Department of Agriculture. Data.Gov: Food-a-Pedia. 2022. Available online: https://catalog.data.gov/dataset/food-a-pedia (accessed on 20 July 2022).
  38. Ren, S.; He, K.; Girshick, R.B.; Sun, J. Faster R-CNN: Towards Real-Time Object Detection with Region Proposal Networks. arXiv 2015, arXiv:1506.01497. [Google Scholar] [CrossRef]
  39. Li, Y.; Wang, H.; Tan, C.; Zhang, X. Image-based Volume Estimation of Pizza using 3D Geometry Analysis. Foods 2023, 12, 890. [Google Scholar]
  40. Weinberg, Y. Thickness/Loading Factor in Pizza Explained: A Technical Guide; PizzaBlab: Sofia, Bulgaria, 2026. [Google Scholar]
  41. U.S. Department of Agriculture, Agricultural Research Service. Measurement Conversion Tables, 2026. Available online: https://www.ars.usda.gov/northeast-area/beltsville-md-bhnrc/beltsville-human-nutrition-research-center/methods-and-application-of-food-composition-laboratory/mafcl-site-pages/measurement-conversion-tables/ (accessed on 15 February 2026).
  42. Agriculture Institute. The Nutritional Composition of Cheese: What’s Inside? Agriculture Notes, 2026. Available online: https://agriculture.institute/dairy-products-iii/nutritional-composition-of-cheese/ (accessed on 15 February 2026).
  43. Kharshit. Evaluation Metrics for Object Detection and Segmentation: MAP, 2019. Available online: https://kharshit.github.io/blog/2019/09/20/evaluation-metrics-for-object-detection-and-segmentation (accessed on 15 February 2026).
  44. Figma. Cite Plugin (Figma Community), 2026. Available online: https://www.figma.com/community (accessed on 23 March 2026).
Figure 1. User unsure about nutritional values.
Electronics 15 01460 g001
Figure 2. User retrieves calorie and nutrient report using the iLog 2.0 system framework.
Electronics 15 01460 g002
Figure 3. Overview of the proposed iLog 2.2 System Showing the Major Components and Their Interactions.
Electronics 15 01460 g003
Figure 4. Development Workflow of the Proposed iLog2.2 System Illustrating Each Stage From Image Capture to Nutrient Estimation.
Electronics 15 01460 g004
Figure 5. Sample Images From the Curated Pizza Dataset Used in the iLog 2.2 Model.
Electronics 15 01460 g005
Figure 6. Detected Pizza and Toppings With Mask R-CNN Segmentation and Confidence Values.
Electronics 15 01460 g006
Figure 7. Unified prototype interface demonstrating complete user flow: login, image upload, automatic analysis, and detailed per-topping nutrient visualization with logging and diary features.
Electronics 15 01460 g007
Figure 8. Precision–Recall Curves at IoU = 0.50 Showing Strong Precision for Pizza, Pepperoni, and Black Olive Toppings.
Electronics 15 01460 g008
Figure 9. Precision –Recall curves at IoU = 0.75. The Model Maintains Stable Accuracy for Pizza and Black Olive Even at Higher Overlap Thresholds.
Electronics 15 01460 g009
Figure 10. Confusion Matrix Showing True And Predicted Classes.
Electronics 15 01460 g010
Figure 11. Validation trends showing classification, localization, and total losses along with the learning rate schedule over 6000 iterations. The solid blue curves represent the observed values, while the yellow dotted lines indicate the overall trend (linear fit) of each metric, highlighting the smooth convergence behavior during training.
Electronics 15 01460 g011
Figure 12. Percent error by nutrient with a ± 15 % target band. Calories and sodium are within 3.8 % ; carbs 4.0 % ; protein/fat under 9 % ; saturated fat and sugars remain under 11.1 % .
Electronics 15 01460 g012
Figure 13. Predicted vs. ground-truth nutrition. Bars stay closely aligned across nutrients, with slightly larger gaps for sugars and saturated fat due to recipe variability and density assumptions.
Electronics 15 01460 g013
Table 1. Comparison of Research Works in Food Vision, Portion/Volume, and Nutrition Estimation.
TitleDataset/InputCore MethodVol. Est.Nutrition GranularityFederated Learning/Edge CompatibilityKey Insights
iLog (Rachakonda et al.) [4]Mixed/food images + sensing (IoMT)Detector + intake monitoring + stress detection (IoMT device)NoPer-intake/monitoring oriented (not detailed nutrients)NoFocuses on automatic intake monitoring + stress detection; not a full nutrient pipeline.
iLog 2.0 (Mitra et al.) [5]Multi-class food imagesFood detection + nutrition quantificationNoPer-dish (general)NoLimited volumetric/geometry-driven accuracy.
iLog 3.0 (Siripurapu et al.) [17]2D RGB food imagesMask R-CNN + monocular depth (MiDaS-style) for volume inferenceYesPer-dish (derived)NoAccurate volume from 2D + depth; higher compute than pure detection.
Mask R-CNN Volume + Calories (Dai et al.) [18]RGB images (solid foods; example-based)Mask R-CNN instance segmentation + calibration-based calorie estimationApprox. (via calibration)Global calories (per item/dish)NoStrong masks; needs calibration/assumptions; shows extension to multiple solid foods.
SEG-FOOD Dataset/Segmentation (Tahir & Kiong) [12]Food segmentation dataset (semantic masks)Deep learning semantic segmentation (dataset + baseline models)NoN/ANoUseful benchmark dataset for segmentation; no portion/nutrient computation.
Lightweight DeepLabv3+ (Muñoz et al.) [13]Multiple food segmentation datasets + self-collected setEfficientNet-B1 backbone + CWASPP + SE attention (semantic seg.)NoRegion-level onlyEdge-friendly (lightweight)High segmentation performance with reduced compute; does not estimate calories/volume.
mid-DeepLabv3+ + CamerFood10 (Erep et al.) [19]African food dataset (CamerFood10)Enhanced DeepLabv3+ (ResNet50 + SimAM) for semantic seg.NoRegion-level onlyNo (not FL)Improves segmentation on underrepresented cuisines; still no nutrient pipeline.
FDSNet (Xiao et al.) [20]FoodSeg103/UECFoodPixCompleteDual-branch (Swin Transformer + CNN) multi-scale fusion segmentationNoRegion-level onlyNoBetter accuracy/efficiency for large images; segmentation-focused.
Two-View 3D Reconstruction (Dehais et al.) [21]Multi-view images (two views)Two-view 3D reconstruction for volume estimationYes (3D)Per-dish (can map to nutrition if coupled)NoHigher accuracy; requires multi-view capture/setup.
Single-View Geometric Models (Fang et al.) [22]Single RGB imageSingle-view geometric priors/models for portion estimationApprox.Per-dish (if coupled with nutrient DB)NoLightweight classical approach; accuracy depends on assumptions/geometry fit.
CalorieAI (Chandra et al.) [14]Custom datasetYOLOv8 detector + image-based calorie estimationNoGlobal caloriesNoFast detection-driven pipeline; lacks rigorous geometry/volume computation.
YOLOv5 Calories Estimation (Shams et al.) [16](Chapter; dataset not explicit in BibTeX)YOLOv5-based recognition + calorie estimationNoGlobal caloriesNoDetection-first approach; accuracy depends on dataset + mapping assumptions.
Mobile Nutrient Analysis (Revesai & Kogeda) [23]Mobile food imagesLightweight interpretable DL + KD + Grad-CAM/LIME for nutrient estimationNoPer-dish nutrients (estimation)Yes (mobile/edge)Mobile-friendly + interpretable; focuses on nutrients (not explicit volume).
FL for Food Service Industry (Taheri Gorji et al.) [8]Distributed fluorescence imaging framesFederated learning (FedAvg) + MobileNetv3/DeepLabv3+NoN/A (cleanliness auditing)Yes (FL)Strong example of FL privacy in food-service vision; not food portion/nutrition.
PET Survey for FL in IoHT (Mosaiyebzadeh et al.) [24]SurveyPrivacy-enhancing technologies for FL in IoHTNoN/AYes (survey)Summarizes PETs and challenges; background support for privacy motivation.
LDP for FL (Behnia et al., arXiv) [9]General FL settingLocal Differential Privacy with fixed memory + per-client privacyNoN/AYes (privacy)Useful privacy method reference for FL; not food-specific.
Mask R-CNN (He et al.) [15]General vision benchmark workInstance segmentation backbone (Mask R-CNN)N/AN/AN/ACore method reference for instance segmentation used by iLog 3.0-style pipelines.
Swin Transformer (Liu et al.) [25]General image datasetsTransformer-based hierarchical vision modelNoN/ANoCaptures long-range dependencies and improves segmentation performance; not designed for volume or nutrition estimation.
MaskFormer (Cheng et al.) [26]General vision datasetsUnified segmentation framework (transformer-based)NoRegion-level onlyNoState-of-the-art segmentation accuracy; focuses only on segmentation without volume or nutrition computation.
Table 2. Comparison of Commercial Food-Logging Applications.
ApplicationInput TypeAutomationInsights
See How You Eat [31]Manual photo logging/visual diaryNone (mostly manual)Primarily a photo-based diary; lacks automatic detection and portion/volume estimation.
Lose It! [27]Manual logging + barcode scanDatabase lookup + barcode-based matchingGood for calorie tracking from known foods; limited vision-based segmentation or portion-size estimation from images.
AteMate [32]Photo diary entries + manual notesManual tagging/habit trackingSupports qualitative tracking; typically does not compute calories/volume from a single food photo.
Bite AI [30]Camera input (food photos)Cloud-based AI recognition (image-to-food labeling)Convenient recognition, but often cloud-dependent and may not provide robust per-ingredient segmentation or accurate portion volume.
HealthifyMe [29]Manual logging + AI chat input (text)Semi-automated recommendations + database-driven loggingStrong diet-plan ecosystem; image-based portion estimation is limited compared to geometry/volume-based research systems.
MyFitnessPal [28]Manual + barcode scan + voice inputLarge database + barcode/recipe featuresWidely used food database; does not focus on vision-based segmentation/volume estimation from images.
Yazio [33]Manual + AI-assisted input (varies by feature)Partial automation (plans/recipes/database)Fast tracking and planning; limited in photo-based per-ingredient segmentation and accurate portion quantification.
Foodvisor [34]Camera + AI model inputCloud recognition + nutrition estimateProvides image-based nutrition estimation, but accuracy can depend on cloud model and may not reliably infer portion volume.
EatWise [35]Manual reminders + meal timingManual tracking/remindersFocuses on eating schedule/behavior; not designed for calorie, macro, or volume estimation from images.
Table 3. Mass and Calorie Breakdown for Each Component of the Pizza.
ComponentMass (g)Calories (kcal)
Base (dough)803.6252129.605
Cheese layer206.933579.413
Sauce layer118.24834.292
TOTAL (Combo)1128.8052743.31
Table 4. Macronutrient Breakdown for Each Topping.
ItemProtein (g)Fat (g)Sat. Fat (g)Carbs (g)Sugars (g)Fiber (g)
Pizza with Cheese & Sauce131.9261.135.63408.2634.023.83
Pepperoni23.4344.830.01.220.510.0
Ham1.040.260.00.080.050.0
TOTAL156.39106.225.63409.5634.5623.83
Table 5. Micronutrient Analysis for the Detected Pizza and Toppings.
ItemSodium (mg)Calcium (mg)Iron (mg)Potassium (mg)Cholesterol (mg)
Pizza with Cheese & Sauce5737.252342.3230.621551.15184.17
Pepperoni1609.7811.211.22282.22113.09
Ham62.310.360.0510.92.75
TOTAL7409.342353.8931.891844.27300.01
Table 6. Comparison of Detection and Segmentation Accuracy.
Model/WorkmAP (%)AP50 (%)AP75 (%)
Proposed iLog 2.296.0/92.098.4/94.097.8/93.5
iLog 2.0 (Alakananda et al. [5])60–6880
FoodSegDL (Liu et al.) [12]68.075
YOLOv5–EfficientDet (Zhang et al.) [16]77.4–808070
Mask R-CNN (Chen et al.) [18]85.48881
Disclaimer/Publisher’s Note: The statements, opinions and data contained in all publications are solely those of the individual author(s) and contributor(s) and not of MDPI and/or the editor(s). MDPI and/or the editor(s) disclaim responsibility for any injury to people or property resulting from any ideas, methods, instructions or products referred to in the content.