1. Introduction
In recent years, humanoid robots have shown broad application prospects in tasks such as disaster relief [
1], complex terrain exploration [
2], and social services due to their high compatibility with the human environment [
3,
4]. As legged robots, bipedal robots can adapt to environments designed for humans, but their motion control is essentially a high-dimensional, nonlinear problem [
5]. Especially in tasks with random disturbances or external disturbances, learning stable gait still presents significant challenges.
Reinforcement learning (RL) has emerged as a powerful approach for addressing such complex control problems [
6,
7]. Unlike methods reliant on precise modeling or manually designed controllers, RL can autonomously optimize control strategies through environmental interaction without requiring extensive labeled data [
8,
9]. Among the various RL paradigms, the actor-critic framework has proven particularly effective in robotics. It combines the strengths of policy-based and value-based learning, where an actor network generates actions and a critic network evaluates their quality, enabling stable and efficient policy optimization. This is exemplified by algorithms like Proximal Policy Optimization (PPO) [
10], which is widely adopted in robot control. This study uses the Isaac Lab Direct Workflow (NVIDIA, Santa Clara, CA, USA, version 1.4.1) and SKRL-PPO framework to control a H1 bipedal humanoid robot (Unitree Robotics, Shenzhen, China). Although the employed dense reward function avoids the issue of sparse rewards, the overall performance remains critically dependent on the careful design of the reward function, a well-known challenge [
11] in RL. Prior studies have theoretically analyzed reward and value function design in unstable balance tasks, such as second-order unstable balance problems, demonstrating appropriately structured rewards can improve stability and convergence in RL [
11]. This dependency motivates the core contribution of our work: a statistical methodology for analyzing and shaping the reward function to navigate this complex design space effectively.
The efficacy of reward function design and adjustment has been demonstrated across various domains. In relatively simpler systems, such as Unmanned Aerial Vehicle (UAV) autonomous obstacle avoidance [
12,
13] and wheeled robotic soccer [
14], reward shaping based on prior knowledge has been proven to significantly enhance policy performance and learning efficiency. For tasks with more complex dynamics, such as robot manipulation, studies have shown that decomposing complex tasks through modular reward combinations [
15] is an effective approach. In high-dimensional control problems, reward design is particularly critical, as exemplified in the domain of quadruped robot locomotion. Relevant studies in this area have explored deep learning-based reward mechanisms, including a PPO framework that utilizes a hybrid reward function to explicitly prioritize Center of Gravity (CoG) stability, which has been shown to substantially improve gait generation and motion consistency [
16].
To alleviate the burden of manual tuning, automated reward learning methods have emerged in recent years. These include hyperparameter optimization techniques that dynamically adjust reward weights, as well as methods based on inverse reinforcement learning (IRL) and imitation learning. For instance, Kim et al. [
17] proposed an automatic reward scaling method for quadruped robots that dynamically adjust the weights of main reward items during training, thereby improving gait stability and training efficiency.
Despite these advances, automated approaches often face limitations in demonstration quality, task generalization, and interpretability. For bipedal humanoid robots with highly unstable dynamics and extremely low fault tolerance, the locomotion learning task is particularly sensitive to the reward function. A poorly designed reward component can easily lead to learning failure, while black-box automated reward generation struggles to incorporate precise physical constraints to ensure policy safety and rationality. Therefore, systematic and interpretable manual reward design remains irreplaceable in this field.
Motivated by these challenges, this study focuses on the sensitive and non-trivial problem of reward function design for bipedal locomotion in RL. The main contributions are as follows:
- (1)
We propose a novel, data-driven framework that systemizes reward shaping through a three-tiered process of performance diagnosis, correlation-based hypothesis generation, and targeted parameter validation. This framework is built upon the official Isaac Lab reward framework for locomotion and incorporates additional reward components to better enforce heading and velocity alignment. The weights of these rewards are systematically optimized using our statistical analysis methodology.
- (2)
We demonstrate the successful application of this methodology by developing an efficient and stable gait control policy for the H1 humanoid robot, alongside providing a modular and fully reproducible training project.
- (3)
Through rigorous application, we uncover intrinsic trade-offs between reward components and distill generalizable design principles, offering valuable theoretical and practical guidance for future humanoid robot research.
The remainder of this paper is organized as follows:
Section 2 describes the related works;
Section 3 presents the methodology in detail;
Section 4 presents the experiments and results;
Section 5 discusses the results with insightful findings; and
Section 6 concludes this work with future work.
2. Related Works
Reward shaping has become a critical component of RL for tasks such as legged locomotion, where the complexity of the task can make it difficult for agents to learn effective behaviors without guidance. Ibrahim et al. provide a comprehensive categorization of reward shaping methods [
11], which include hand-crafted shaping, potential-based shaping, inverse reinforcement learning (IRL), and human-in-the-loop (HITL) approaches. Each of these methods has strengths and limitations, particularly in the context of high-dimensional, continuous control tasks like bipedal locomotion.
Hand-crafted Shaping is widely used in robotics, where reward functions are manually designed based on expert knowledge. In our experiments, the H1-Baseline is constructed using the official Isaac Lab locomotion reward framework with traditional, manually tuned reward weights. These rewards often focus on task-specific goals such as speed tracking, stability, and energy efficiency. While highly interpretable, hand-crafted shaping can suffer from limitations in scalability and generalization, especially in complex environments where the robot’s actions are less predictable. Additionally, the manual tuning of reward weights through trial and error can be time-consuming and inefficient.
Potential-based Shaping methods involve modifying the reward function by introducing a potential function that guides the agent’s exploration, especially in environments with sparse rewards. This approach can significantly improve exploration efficiency and reduce the difficulty of finding optimal solutions [
18]. However, designing effective potential functions for complex tasks like bipedal locomotion remains challenging, and the computational overhead required to compute the potentials can limit its applicability in real-time settings.
Inverse Reinforcement Learning (IRL) allows reward functions to be learned from expert demonstrations. This technique has been successful in cases where expert behavior is available, but its reliance on high-quality demonstrations and the complexity of integrating it into real-time control tasks make it less suitable for autonomous robots. Furthermore, IRL methods struggle to handle environments with highly unstable dynamics, such as bipedal locomotion.
Human-in-the-loop (HITL) methods integrate human feedback to refine the reward function, which can significantly accelerate learning by incorporating human intuition. Techniques such as PEBBLE, SURF, and RUNE have shown promise in adjusting reward functions based on human preferences. However, HITL approaches are often limited by the quality of human input and may not be scalable to large, complex systems where human intervention is impractical.
While automated and preference-based approaches can reduce manual effort and adapt to complex objectives, they often introduce additional computational complexity, require high-quality demonstrations, or compromise interpretability—challenges that are particularly critical in the context of unstable bipedal locomotion.
Hand-crafted reward shaping remains widely used for legged locomotion due to its flexibility in incorporating physical constraints and domain knowledge. However, its effectiveness can be limited by ad hoc tuning and a lack of systematic methods to diagnose and resolve conflicts between reward components. This paper addresses these limitations by introducing a diagnostic-driven, statistically guided reward shaping framework.
From a theoretical perspective, reinforcement learning updates policy parameters in the direction that maximizes expected cumulative rewards. Consequently, the design of the reward function directly shapes the policy gradient and influences learning dynamics. Adjusting the weights of individual reward components modifies the reward landscape, effectively emphasizing signals that are most informative for task success while mitigating the impact of noisy or conflicting terms. Statistical analysis of reward-performance correlations allows identification of sensitive or conflicting components, guiding systematic adjustments to the reward structure. This approach provides a principled, data-informed mechanism for reward shaping, offering interpretable guidance to policy optimization without requiring explicit modeling of the robot’s dynamics.
Unlike methods that pre-structure behavior through biological priors, such as Central Pattern Generator (CPG)-based approaches that rely on predefined periodic gait patterns, our approach does not impose fixed locomotion templates. Instead, it uses a multi-tiered reward structure, guided by statistical analysis to identify conflicts, formulate hypotheses, and validate adjustments through targeted experiments.
Alternative strategies for handling dynamic uncertainties include explicit dynamics modeling and robust control. For example, Shao et al. [
19] combine deep Lagrangian neural networks with adaptive sliding mode control and disturbance observers, explicitly learning system dynamics with embedded physical priors and designing structured controllers to compensate for modeling errors and external disturbances. While providing interpretability and theoretical stability guarantees, such approaches typically require substantial modeling effort and domain expertise.
Our framework occupies a complementary point in this design space. Relative to CPG-based methods, it allows flexible policy learning guided by reward diagnostics rather than enforcing pre-defined patterns. Relative to model-based robust control, it can be applied within standard RL pipelines without explicit dynamics identification, and can support learning across diverse terrains and tasks, though it relies primarily on empirical validation.
By situating our method in this context, we highlight the rationale for a hand-crafted foundation and the contributions of our diagnostic framework in providing interpretable, data-informed guidance for reward tuning. In the following sections, we detail the specific reward components, diagnostic metrics, and iterative shaping procedure applied to the H1 humanoid robot, illustrating how this approach can support stable and consistent bipedal locomotion learning.
3. Methodology
3.1. Reinforcement Learning Framework: Algorithm and Workflow
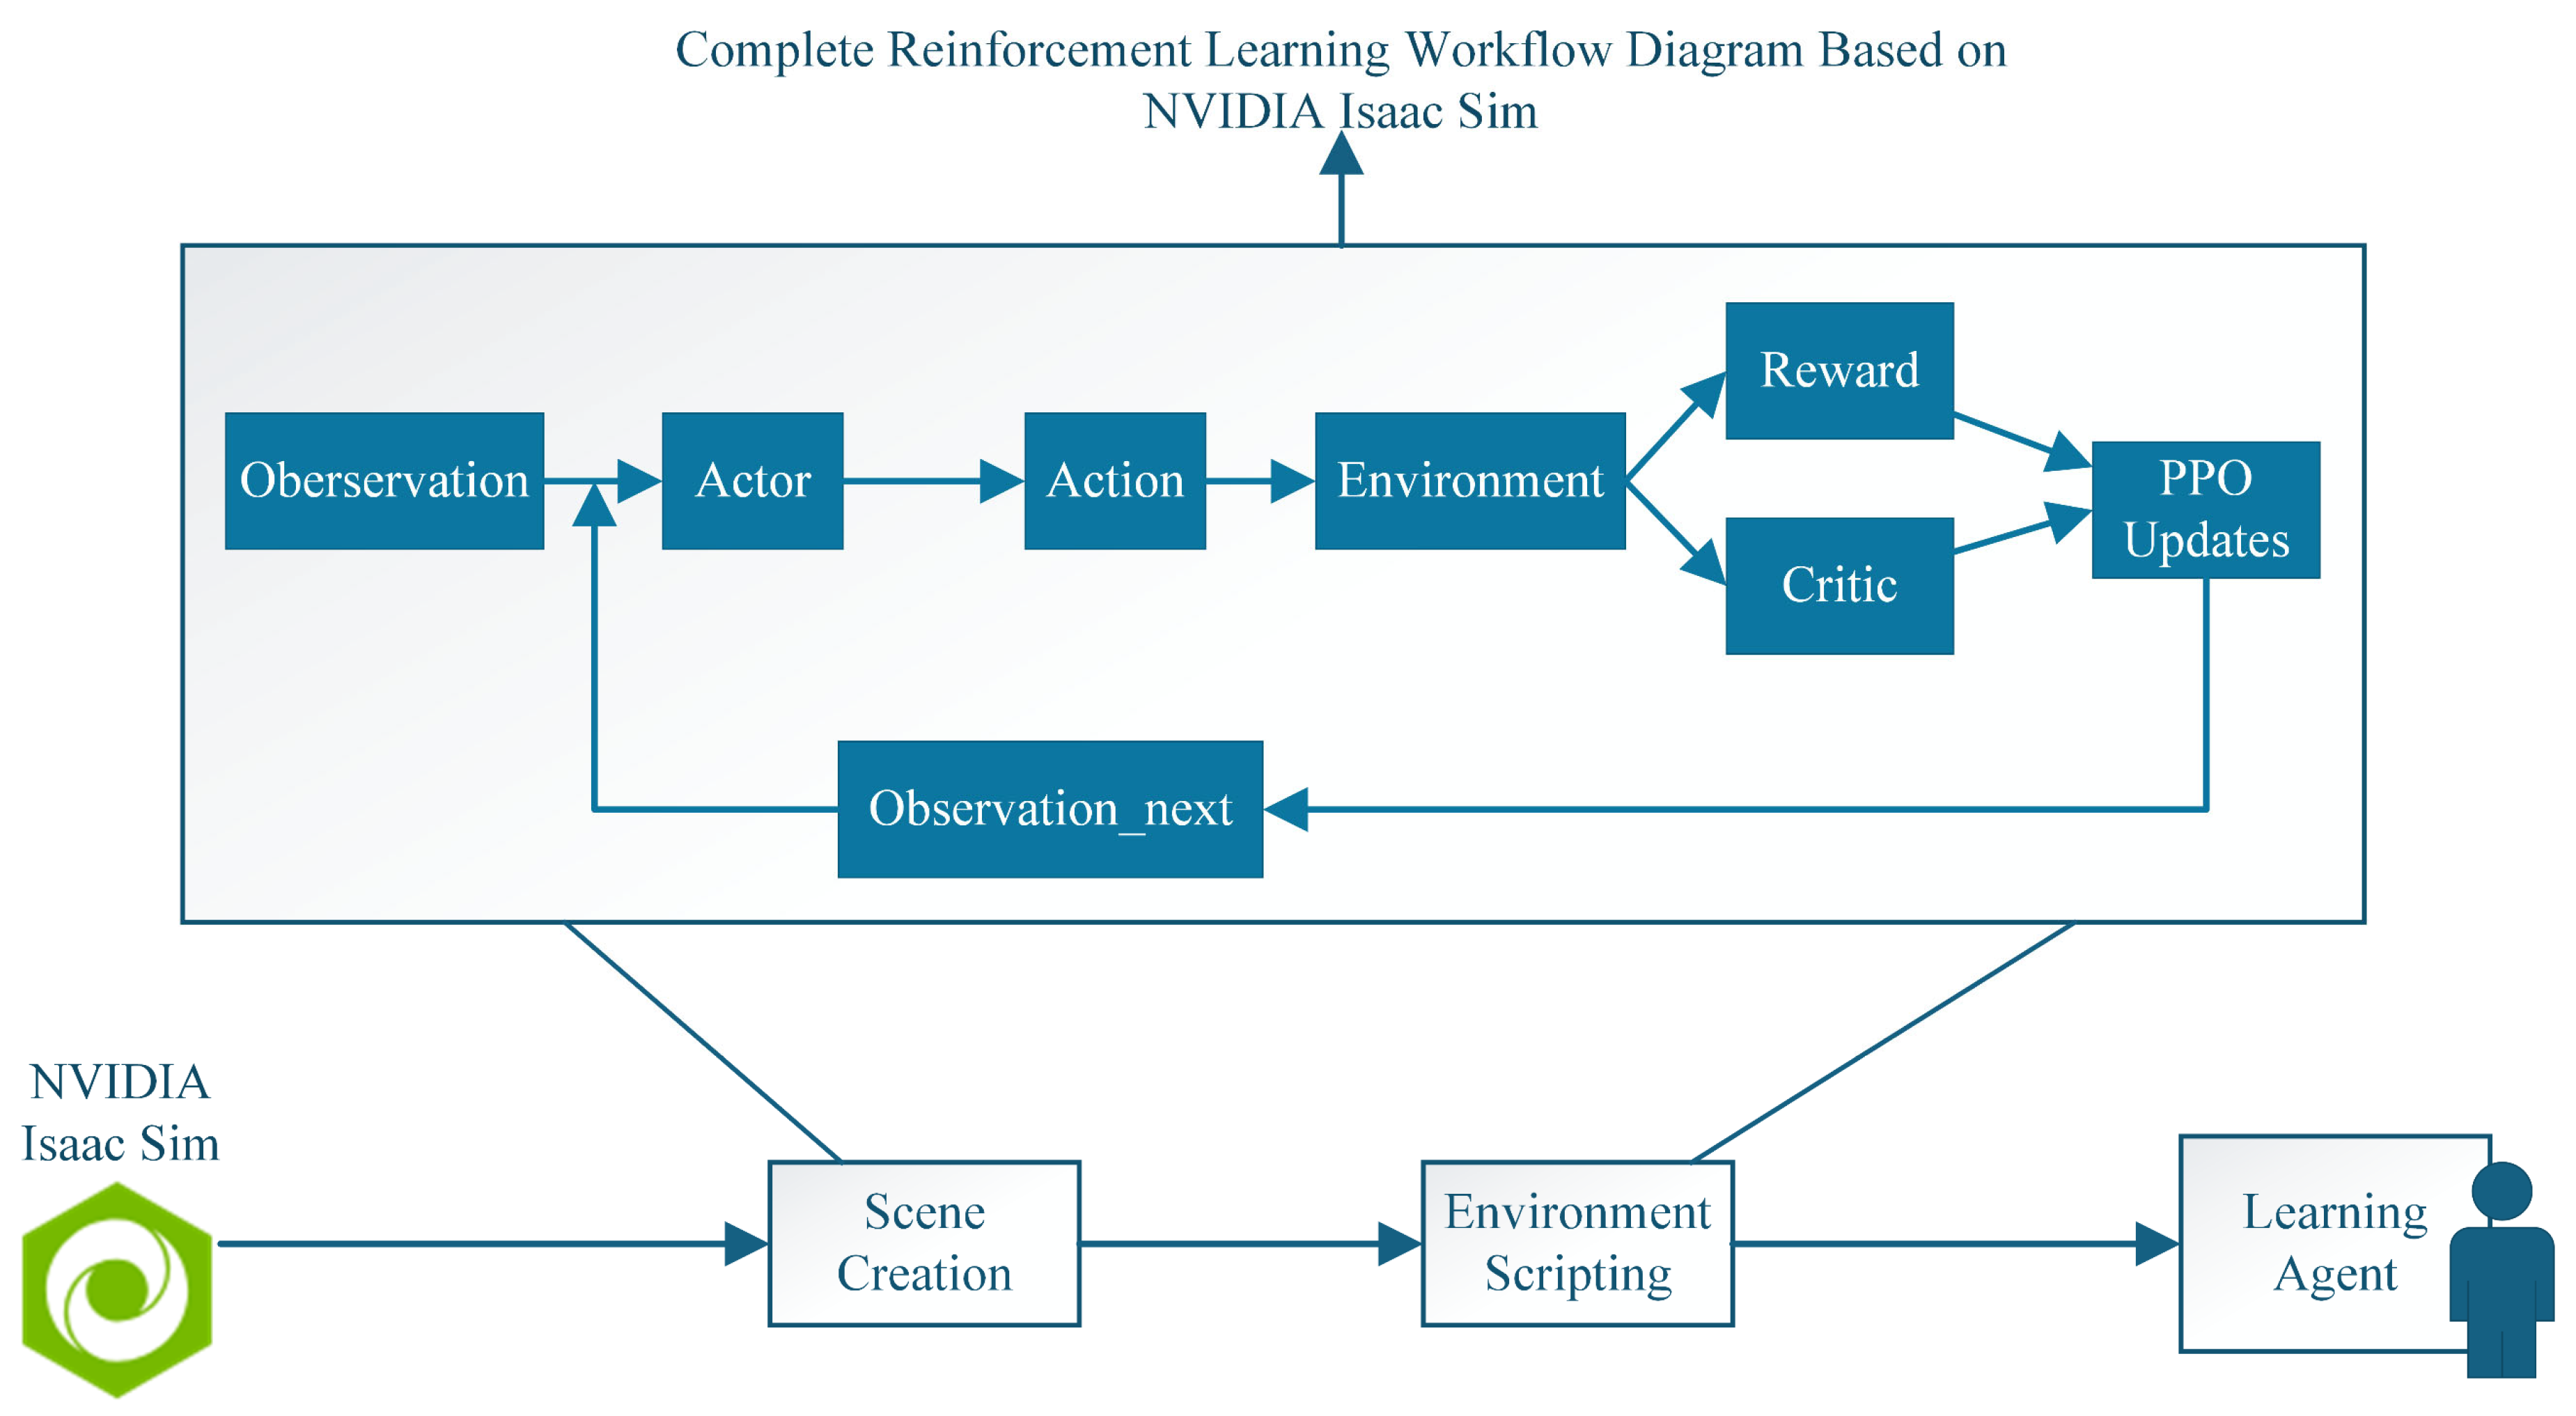
RL enables an agent to learn policies through interaction with an environment, where it receives rewards based on its actions and adjusts its behavior to maximize cumulative long-term rewards. The locomotion policy for the H1 humanoid robot was trained using Proximal Policy Optimization (PPO) within the Direct Workflow framework. At each time step, the agent receives a proprioceptive observation vector, which includes joint states and foot contact signals. The actor network processes this input and generates joint commands, which are executed by the robot. The environment then returns the subsequent state and a composite reward signal that includes both dense rewards and sparse fall penalties.
The critic network estimates the state-value function, which is used to compute the advantages and update the policy via PPO’s clipped objective. The objective function is defined as:
where
denotes the probability ratio between the updated and previous policies,
represents the estimated advantage function, and
is the clipping parameter that constrains policy updates to ensure stability. This cycle iterates to progressively refine the locomotion behavior. The overall workflow is summarized in
Figure 1.
3.2. Robot Model and Simulation Setup
This study utilizes the NVIDIA Isaac Sim simulation environment (NVIDIA, Santa Clara, CA, USA, version 4.2), leveraging the Isaac Lab direct workflow for experimental setup. The platform offers a high-fidelity physics engine and a flexible robot control interface, capable of supporting RL tasks involving multi-agent scenarios, complex terrains, and high-dimensional action spaces.
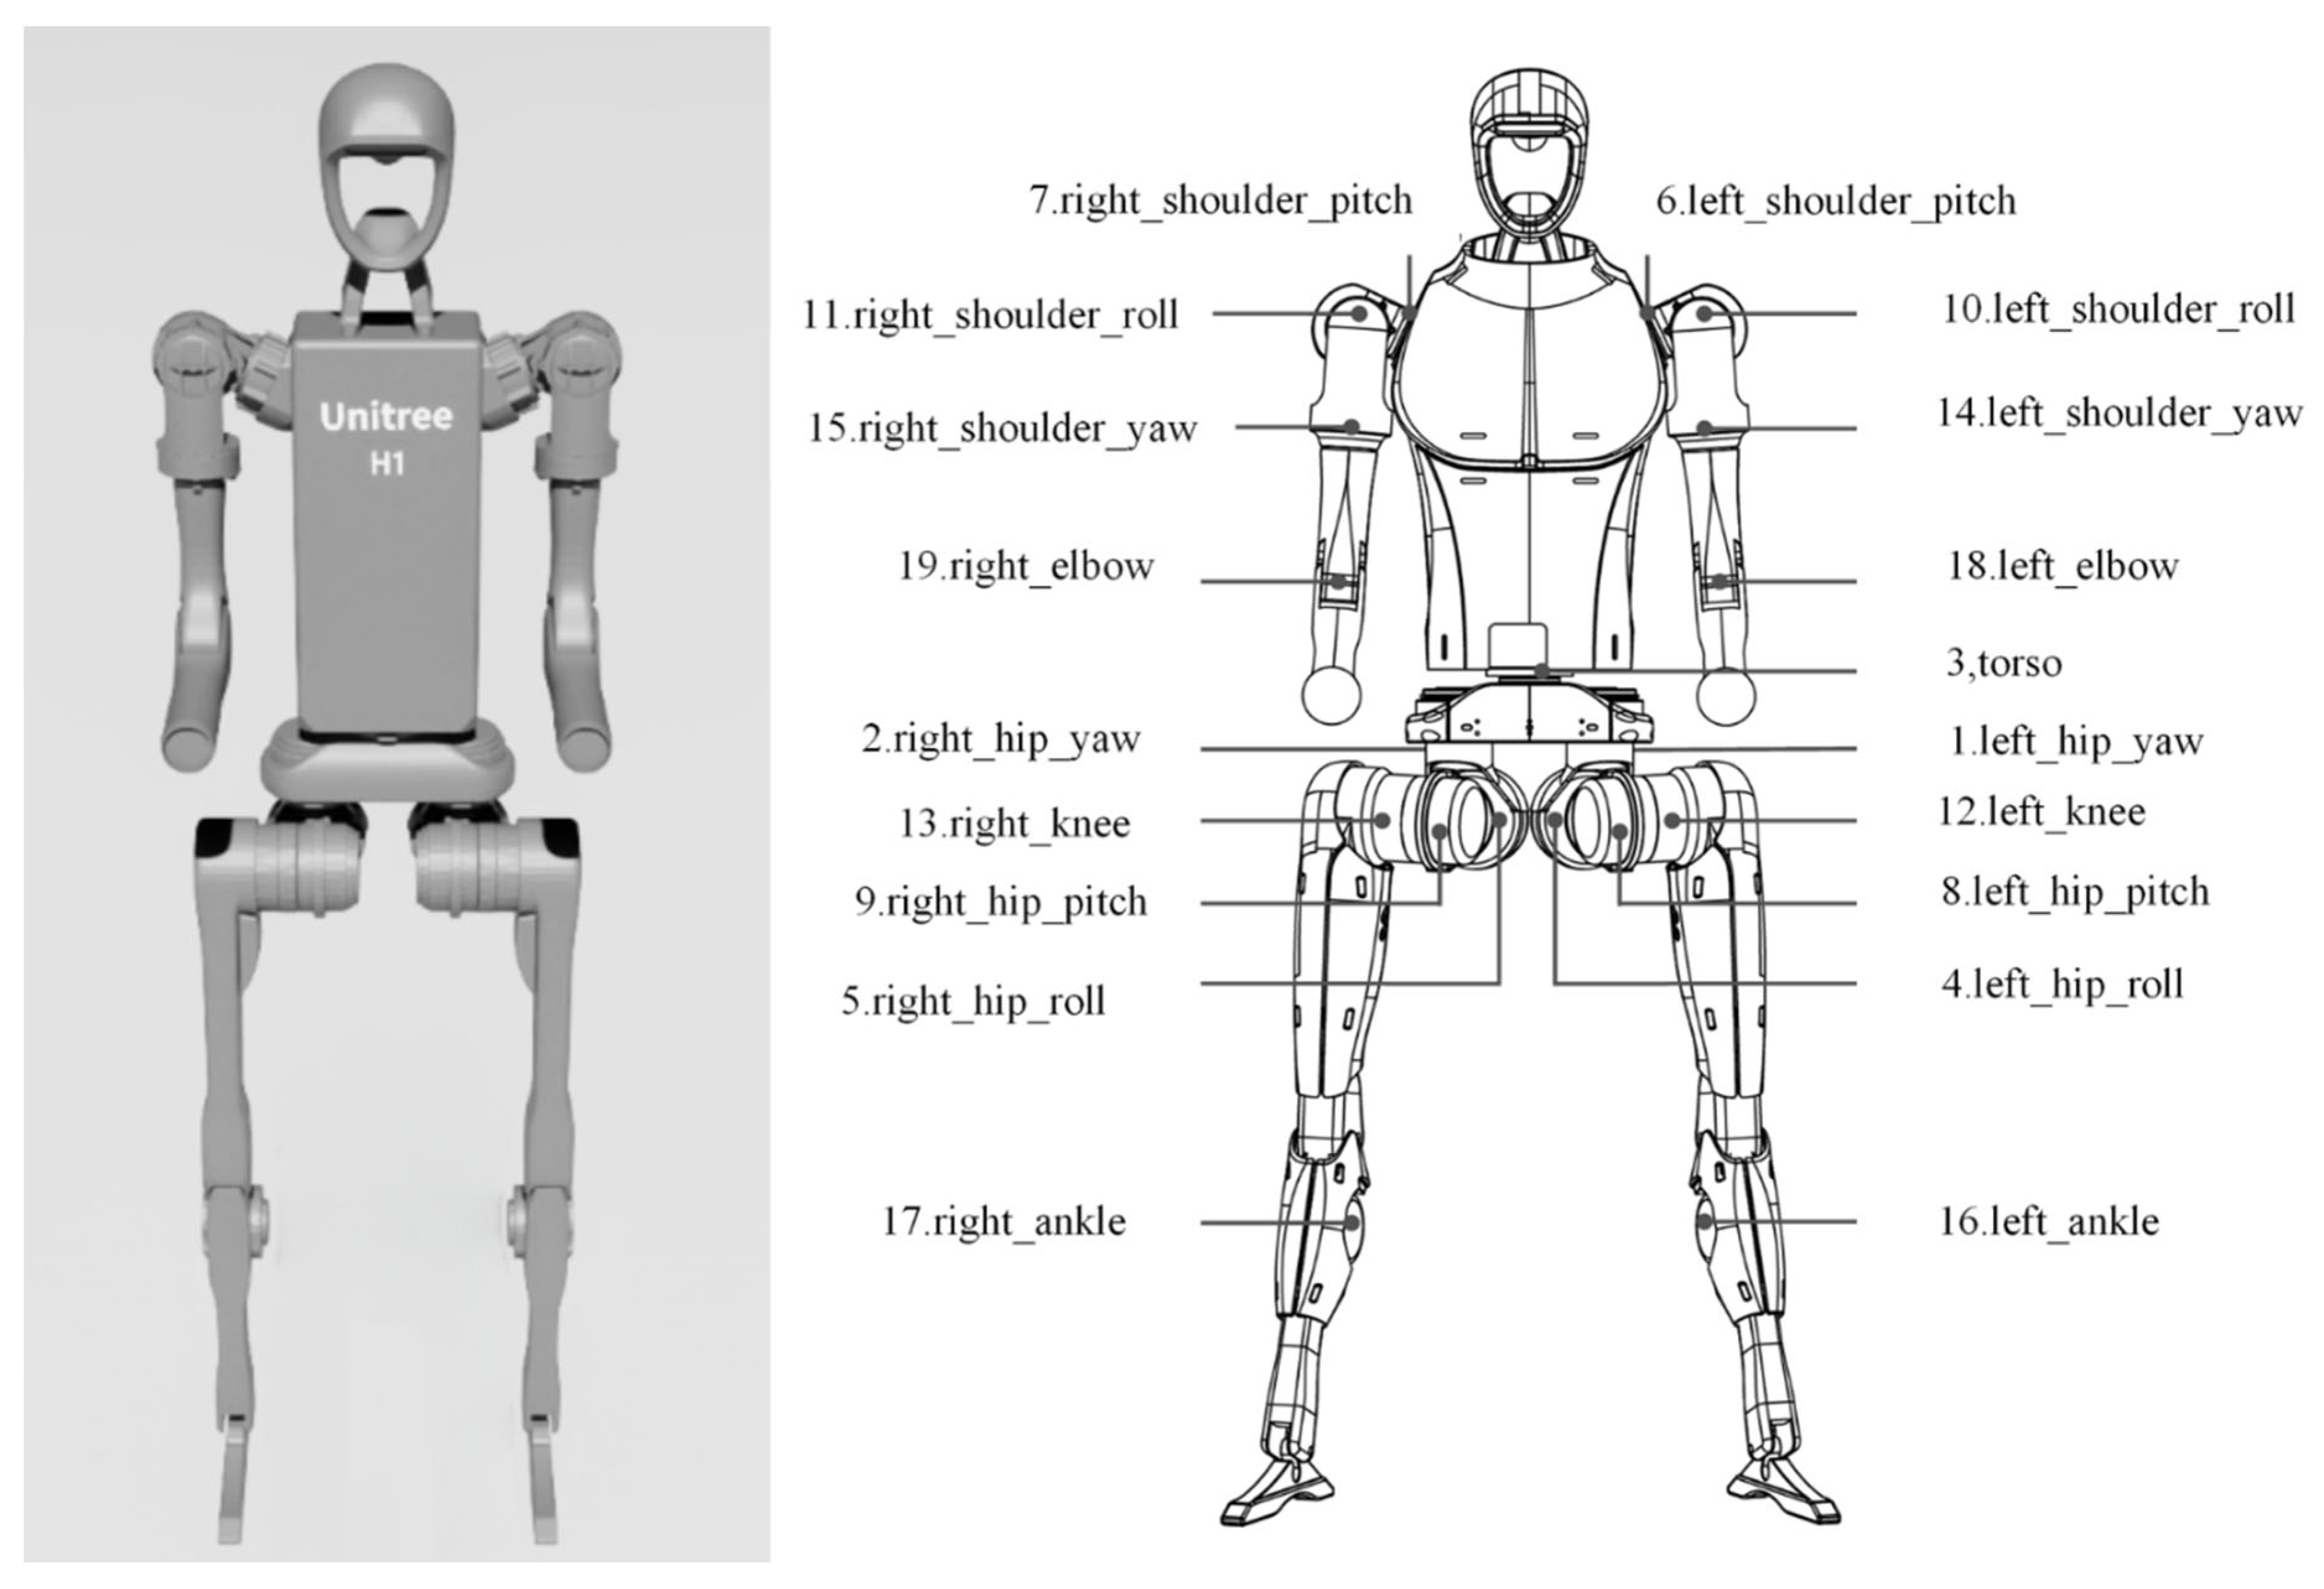
As illustrated in
Figure 2, the H1 bipedal humanoid robot used in this study incorporates 19 actuated motor joints to achieve flexible motion control. Mass and inertia parameters for both the joints and torso were configured according to real H1 specifications. The robot is equipped with an IMU, as well as joint position and velocity sensors for state observation.
This task serves as a controlled testbed for systematically analyzing the effects of reward shaping on bipedal locomotion performance. The environment generates random linear velocity and angular velocity at a fixed time interval, and the robot outputs joint actions through strategies to minimize velocity error and maintain gait balance and stability.
3.3. Action and Observation Spaces
The control policy operates in a continuous 19-dimensional action space corresponding to the actuated joints of the H1 humanoid robot. At each control step
, the policy outputs
where each element
represents a normalized control signal for joint
.
The normalized action is transformed into a target joint position according to
where
denotes the nominal standing configuration and
is a predefined scaling factor. This formulation enables smooth posture modulation while preserving sufficient joint actuation range.
At each time step, the policy receives a 73-dimensional observation vector
which integrates base linear and angular velocities, projected gravity, commanded velocities, joint position offsets, joint velocities, previous actions, and root orientation quaternion. Sensor noise is injected into selected state components during training to improve robustness. The physics simulation runs at 200 Hz, while the policy is executed at 50 Hz through a decimation scheme.
3.4. MIMO Policy Representation and Joint-Level Control Mapping
The control policy is parameterized by a neural network
, implemented as a three-layer multilayer perceptron with 128 hidden units per layer and ELU activation functions. Within the Gaussian PPO framework, the policy defines a stochastic mapping from state to action:
where
and
.
The normalized actions are transformed into target joint positions as defined in Equation (3), and low-level actuation is achieved through a proportional–derivative (PD) controller:
where
is the torque applied to joint
,
and
denote the current joint position and velocity, and
,
are fixed control gains. The desired joint velocity is set to zero in this implementation. This establishes a multi-input multi-output (MIMO) control structure in which each action dimension governs one actuated joint.
The total reward at each step is defined as a weighted sum of individual components:
and the learning objective is to maximize the expected discounted return:
Adjusting the reward weights modifies the contribution of each component to the cumulative return and consequently reshapes the optimization landscape explored by the policy. Importantly, this statistically guided reward adjustment does not alter the MIMO control topology, action dimensionality, or network architecture; instead, it influences joint-level torques indirectly through policy optimization.
3.5. Statistical Reward Diagnosis and Shaping Framework
From a system-level perspective, bipedal locomotion control constitutes a high-dimensional MIMO problem. Multiple joint actions simultaneously influence several coupled performance objectives, including locomotion efficiency, postural stability, and fall avoidance. These objectives are inherently interdependent: improvements in one metric may degrade another. Therefore, reward design cannot be treated as independent tuning of isolated performance indicators.
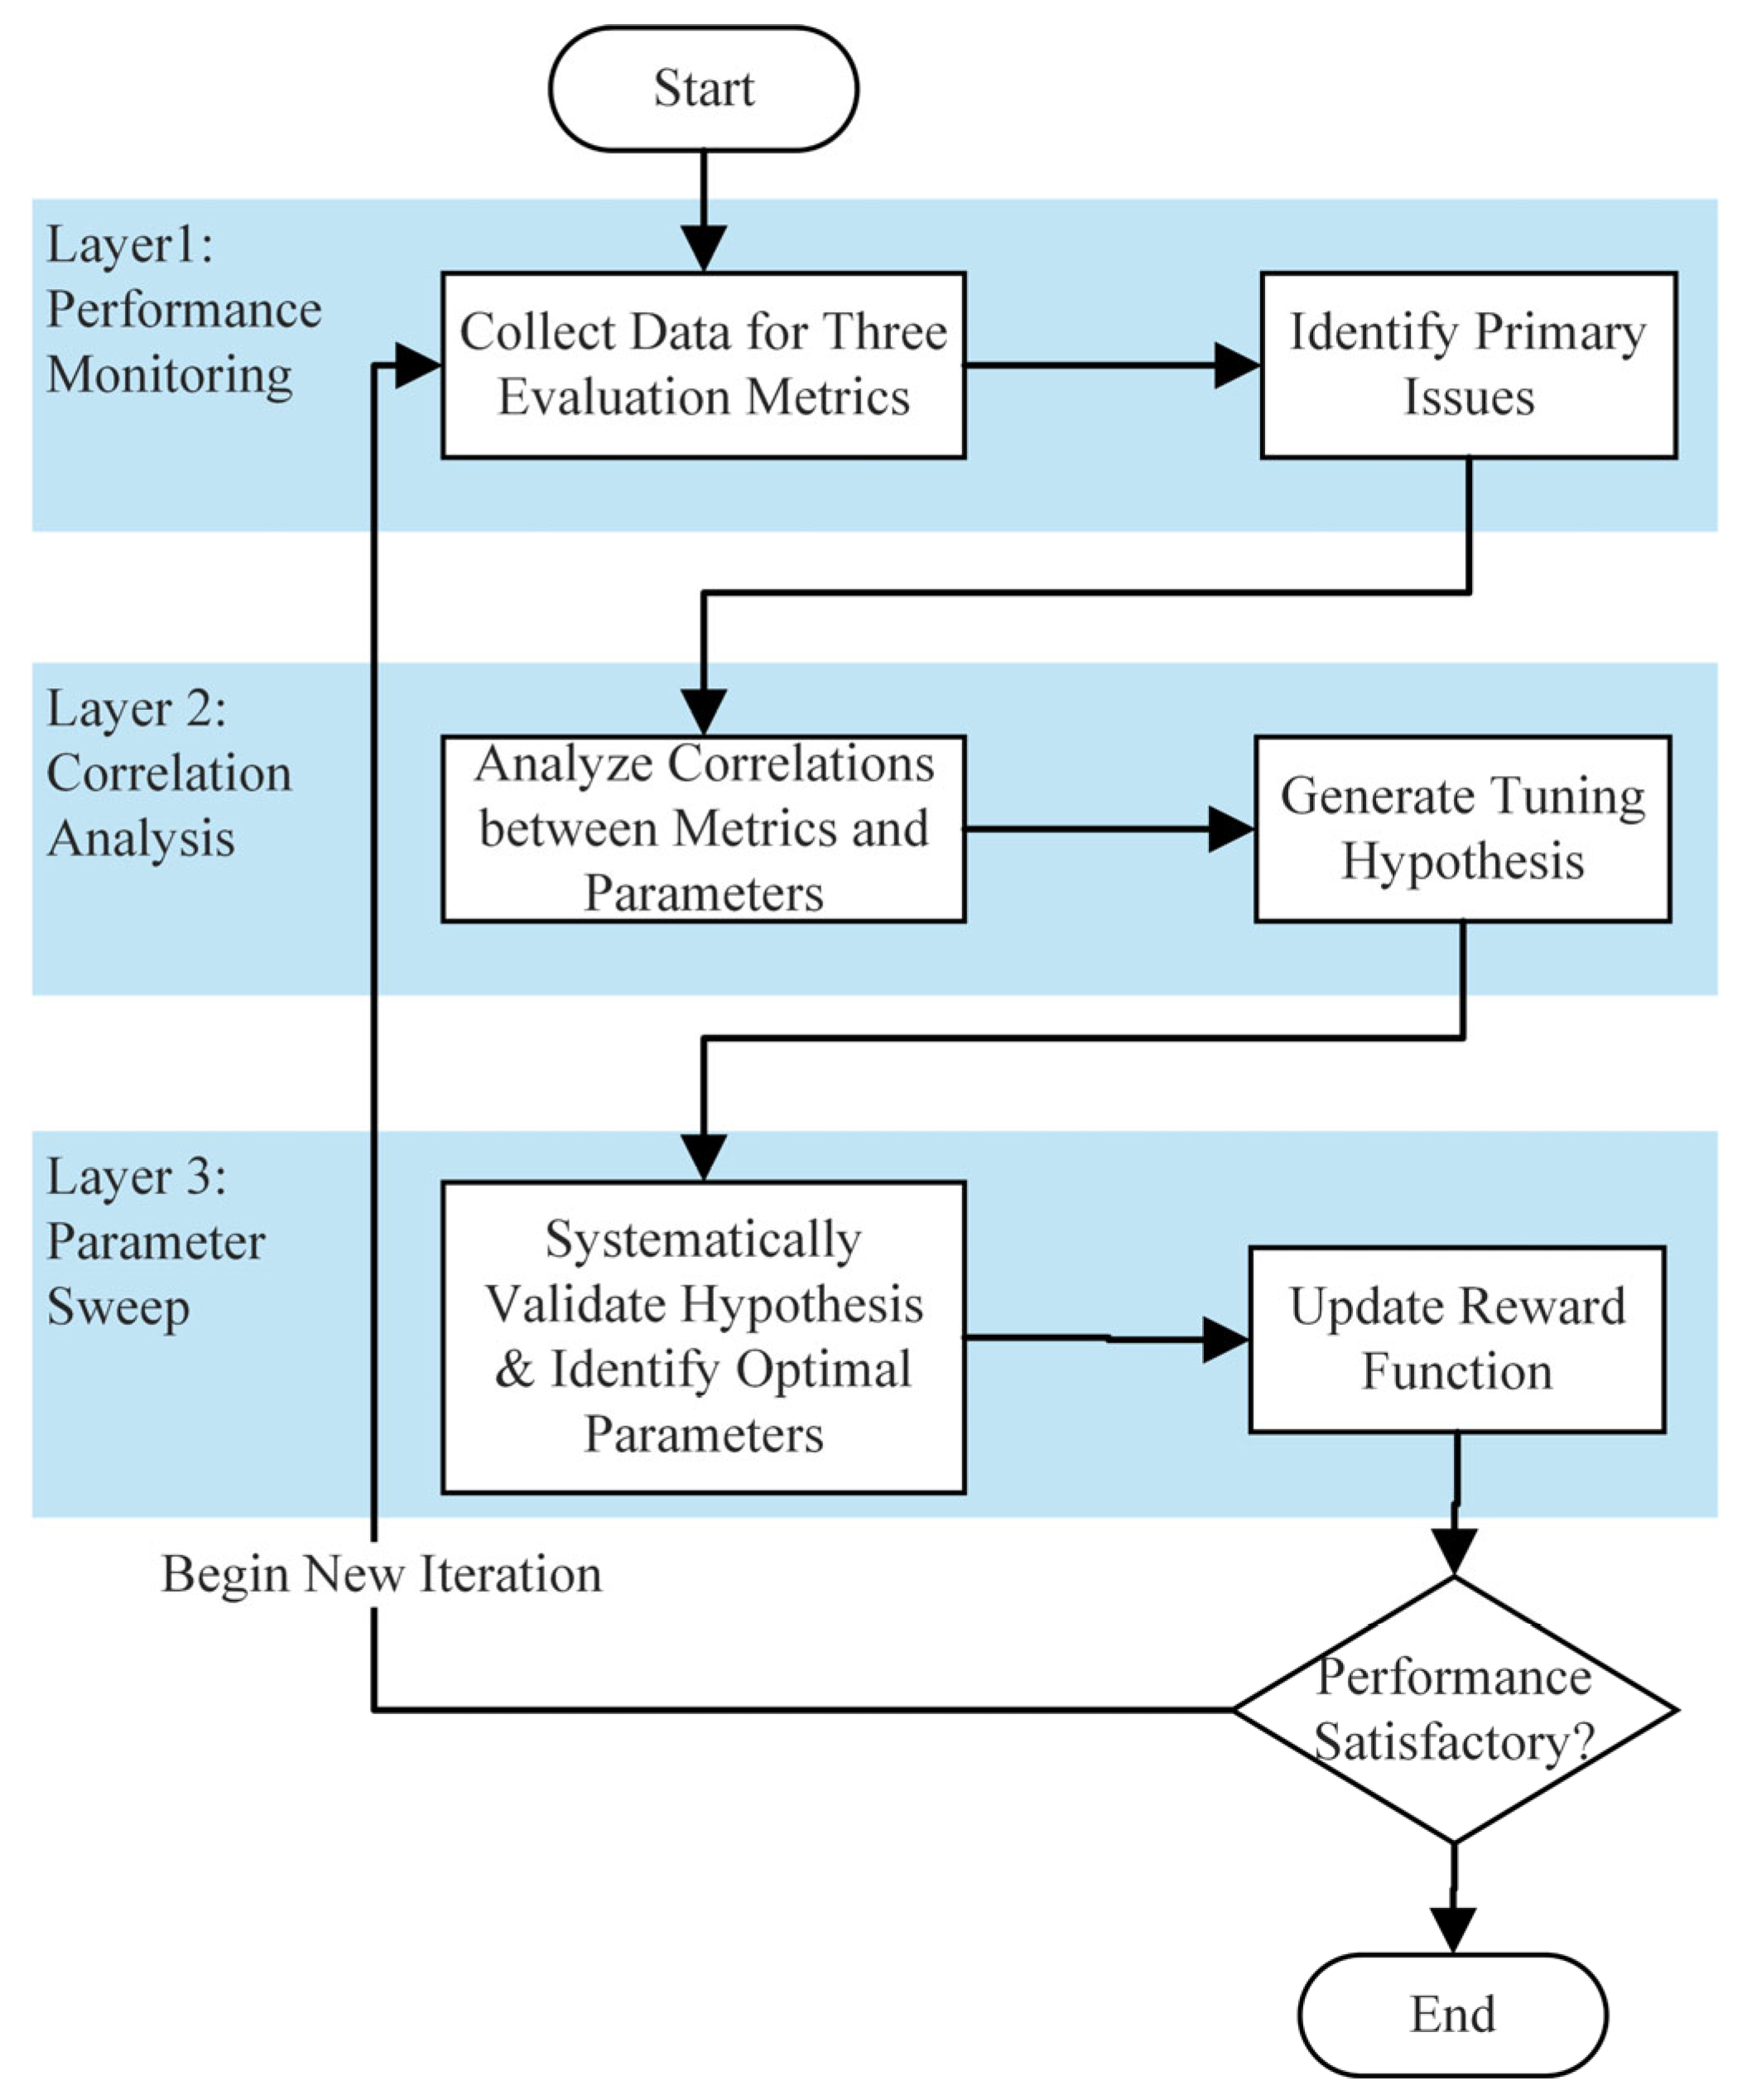
To address this challenge, this section introduces a statistics-driven reward diagnosis and shaping framework, designed to systematically analyze and optimize reward functions in RL.
Figure 3 outlines a three-tiered methodology, grounded in diagnostic monitoring, correlation analysis and relationship quantification, and targeted parameter optimization. This approach ensures that the reward function is continuously refined to achieve better performance by combining quantitative performance metrics with qualitative behavioral diagnostics.
3.5.1. Tier 1: Performance Monitoring and Diagnostic Evaluation
The first tier serves as the foundation of the entire methodology, aiming to monitor strategy performance in real-time and conduct diagnostic evaluations during training. Three core evaluation metrics were defined to monitor and diagnose the training process:
- (a)
Forward Distance: To accurately quantify the robot’s ability to follow dynamically updated velocity commands, we propose Command-Aligned Distance (referred to in our results simply as Forward Distance). This metric accumulates the robot’s displacement along the commanded direction at each control step, considering only positive contributions (i.e., motion that follows the command):
where
is the robot’s root linear velocity vector at time step
,
is the unit vector of the commanded velocity direction at time
(computed from the target heading and the robot’s current state),
is the control time step. This dynamic version captures motion aligned with the time-varying target heading, regardless of trajectory shape.
- (b)
Fall rate: The ratio of episodes in which the robot fell down (terminated abnormally) to the total number of episodes.
where
is the number of episodes with falls, and
is the total number of episodes.
- (c)
Posture Score: The stability of the bipedal robot is quantified by a Posture Score. It combines two key parameters: the Mean Tilt Angle (tilt_mean), which represents the average tilt of the robot’s torso, and the Maximum Tilt Angle (tilt_max), which captures the peak tilt during walking. Both angles are normalized to a scale of 0 to 100, where 0 represents high instability and 100 represents perfect stability. The Mean Score is given a weight of 0.8, reflecting its greater importance in overall stability, while the Max Score is weighted at 0.2. The final Posture Score is a weighted combination of these two scores, providing a comprehensive measure of the robot’s posture stability. Higher Posture Scores indicate better stability, with scores closer to 100 representing optimal stability during movement. In addition to this quantitative metric, a qualitative Posture Label can also be assigned manually to categorize stability on a three-level scale (1: Normal; 2: Slight Anomaly; 3: Severe Anomaly), which is used in subsequent analyses.
After each full training iteration, the current policy was executed, and data for these metrics were recorded and analyzed. This analysis served to identify critical performance issues and behavioral patterns of the policy, such as high fall rates or a dissociation between forward distance and posture quality. These diagnostic outcomes defined the targets for systematic optimization in the subsequent tiers.
3.5.2. Tier 2: Statistics-Driven Reward Analysis
To systematically analyze the influence of reward design on bipedal locomotion performance, a statistics-driven analysis was conducted using correlation and multivariable linear regression. This tier aims to extract interpretable insights from experimental data and guide principled reward refinement beyond empirical trial-and-error tuning.
First, Pearson correlation analysis was applied to identify relationships between reward weights (independent variables) and performance metrics (dependent variables). The correlation results were visualized using heatmaps to highlight statistically significant associations. This analysis serves as a diagnostic step to reveal potential dependencies and generate testable hypotheses, rather than to infer causal relationships.
Building upon the correlation analysis, multivariable linear regression was employed to quantify the sensitivity of locomotion performance to variations in reward weights. The regression model is formulated as:
where
denotes the performance metric of the
i-th experiment (e.g., fall rate, r path efficiency),
represents the weight of the
k-th reward component used in that experiment, and
is the corresponding regression coefficient. The error term
captures unmodeled variability.
The regression coefficients were estimated using a least-squares approach. Importantly, the regression model is employed as a statistical diagnostic tool to quantify sensitivity and trade-offs among reward components, rather than as a predictive model for policy learning. Similar regression-based analyses have been successfully applied in gait and locomotion studies [
20] to extract meaningful relationships from complex motion systems.
3.5.3. Tier 3: Parameter Sweep for Hypothesis Validation and Optimization
To operationalize Tier 2 statistical insights, normalized regression coefficients were used to proportionally adjust reward weights, with a global scaling factor controlling update magnitude. This procedure transforms sensitivity analysis into a structured, semi-automated refinement mechanism while preserving manual oversight for stability and physical feasibility. Accordingly, the framework functions as statistical assistance rather than full automation, as human supervision remains necessary for hypothesis generation, feasibility validation, and convergence assessment.
Targeted parameter sweeps were used to validate Tier 2 hypotheses. Focusing on one or two key parameters at a time due to computational limits, we varied their weights systematically. Outcomes were tabulated and analyzed for trends, which sufficed to confirm or reject the hypotheses (e.g., the effect of the torso upright reward on fall rate). The optimal parameter set was used to update the reward function, concluding an iteration. The process iterated from Tier 1 until performance was satisfactory.
3.6. Reward Function as the Outcome of Statistics-Driven Shaping
The final reward function presented in this section is not claimed to be novel in terms of individual reward components. Most reward terms, such as velocity tracking, posture regularization, and energy penalties, are commonly used in legged locomotion literature.
The contribution of this work lies instead in how these reward components are systematically diagnosed, shaped, and validated through the proposed statistics-driven framework. Specifically, the reward formulation described below represents the outcome of iterative performance diagnosis, correlation-based analysis, and controlled parameter interventions, rather than an ad hoc or purely heuristic design. Importantly, each reward component is linked to a physical or system property of the robot: for instance, joint position and torque limits reflect mechanical constraints, posture deviations encode balance and stability, and foot contact terms enforce feasible gait patterns. The purpose of presenting the full reward structure is to ensure transparency, reproducibility, and to provide concrete evidence of how the proposed shaping methodology translates into a functional locomotion policy. The RL framework operates in discrete time with a fixed control period. All reward terms are evaluated at each control step and scaled by the time step
to ensure time-consistent magnitudes that remain independent of the simulation frequency. The total reward at each time step is then computed as:
where
denotes the
i-th reward component,
its corresponding weight, and
is the number of reward components. This formulation ensures that each individual reward contributes proportionally to the overall total reward at each control step.
3.6.1. Dense Reward Components and Their Roles
Based on the statistics-driven diagnosis and shaping procedure described earlier, the final reward function consists of 15 dense reward components, grouped into four categories: task-oriented, gait pattern, posture and stability, and energy and smoothness.
These components were not introduced simultaneously, but progressively activated, reweighted, or refined through correlation analysis and targeted parameter sweeps.
Table 1 summarizes the reward components and their functional roles. Representative reward terms are detailed below to illustrate their formulation, intended behavioral effects, and direct relation to the system’s mechanical and dynamic properties.
Here are a few core reward functions to explain, including formulas and explanations.
- (a)
Linear Velocity Tracking Reward (Exponential Form)
The reward for tracking the target forward velocity is modeled as an exponential of the tracking error:
where
and
are the commanded and actual base velocities in the XY plane, respectively. This formulation provides a dense and smooth reward signal that peaks when the velocity error is minimized.
- (b)
Heading Alignment Reward (Exponential Form)
To encourage the robot to align its body with the direction of travel, a heading alignment reward is used:
where
is the minimal angle difference between the desired velocity direction and the robot’s current heading. Normalizing the angle difference to
ensures a consistent reward scale.
- (c)
Feet Slide Penalty
A penalty is applied to discourage feet from sliding on the ground when they are supposed to be stationary:
where
is the binary contact state of foot
, and
is its linear velocity in the XY plane. This penalty is summed over all feet to promote stable foot-ground contact.
- (d)
Joint Deviation Penalty (L1 Norm)
To maintain a natural and efficient posture, L1-norm penalties are applied to discourage joints from deviating from their default positions. Separate penalties are defined for the hip, arm, and torso joint groups:
where
denotes a specific joint group,
is the current position, and
is its default position. This allows us to define three separate reward terms, joint_deviation_hip, joint_deviation_torso, and joint_deviation_arms, each with its own weight
.
3.6.2. Sparse Termination Penalty as a Safety Constraint
The sparse termination penalty serves as a safety-oriented constraint, discouraging catastrophic failures rather than shaping fine-grained locomotion behaviors.
The sparse reward framework consists solely of a termination penalty, activated upon robot fall or premature episode end to provide strong negative feedback for catastrophic failures. A fall is detected when the norm of the projected gravity vector in the horizontal plane exceeds a threshold of 0.7, corresponding to a torso inclination greater than approximately 44 degrees. Upon termination, the sparse reward is calculated as:
where
is a binary flag indicating termination,
is the penalty weight, and
is the simulation time step.
3.7. Training Procedure and Evaluation Protocol
3.7.1. Training Procedure
The experimental setup employs the following hyperparameters, detailed in
Table 2, to configure the PPO algorithm for robotic locomotion training in NVIDIA Isaac Sim. To promote robustness, we apply random forces and torques to the robot’s base during training. These perturbations serve as a proxy for environmental disturbances and ensure the policy learns to recover from unexpected dynamics.
The exploration–exploitation trade-off in our framework is explicitly managed at multiple levels. At the algorithmic level, PPO employs a stochastic Gaussian policy with entropy regularization (entropy coefficient = 0.01), encouraging action diversity and preventing premature convergence during early training stages.
Policy updates are further constrained through the clipped surrogate objective (ratio clip ε = 0.2) and a KL-adaptive learning rate scheduler (target KL = 0.01), which limit excessively large policy shifts and stabilize exploitation dynamics.
At the training level, large-scale parallel simulation with 4096 environments significantly increases state-space coverage, while domain randomization via random external forces and state perturbations improves robustness and encourages broader exploration.
Importantly, the proposed statistical reward shaping framework does not replace exploration mechanisms but provides structured directional guidance, ensuring that exploratory behaviors remain aligned with physically meaningful locomotion objectives rather than degenerating into unstructured trial-and-error.
3.7.2. Evaluation Protocol
The final policy was evaluated using a standardized protocol to ensure objective and reproducible assessment. Upon training completion, the model was loaded from the final checkpoint with frozen parameters and tested in an independent environment under fixed conditions: flat terrain with fixed random seeds (42, 123), 50 Hz control frequency (decimation = 4, physics step = 1/200 s), 2000 evaluation timesteps, and inference mode without policy updates.
To ensure the reported performance is reliable and not an artifact of specific initialization or transient conditions, our evaluation protocol incorporates the following measures:
During the evaluation phase, we continue to apply randomized external forces to the robot. This tests the policy’s ability to maintain performance under realistic environmental variations and disturbances.
Each policy is evaluated over 10 episodes per random seed, using two independent seeds, for a total of 20 episodes per experimental condition. Performance metrics are recorded as mean ± standard deviation. The performance metrics include forward distance, fall rate, and human-assessed posture score, which provide objective and interpretable measures of task completion, stability, and gait quality. These metrics are directly linked to the reward components and their system-centric weights: stability- and posture-related rewards (e.g., joint limits, torso orientation, foot slip) influence fall rate and posture score, while task-oriented rewards (e.g., velocity and heading alignment) primarily determine forward distance. By analyzing these metrics across multiple trials, we perform correlation analysis and multivariate linear regression to assess the contribution of each reward component to overall locomotion performance. This feedback informs the iterative adjustment of reward weights, ensuring that the final policy achieves stable, energy-efficient, and natural bipedal walking while respecting mechanical constraints and task objectives.
4. Results
4.1. Overall Performance and the Iterative Optimization Trajectory
4.1.1. Iterative Performance Evolution
This section presents the performance of the policy obtained with the optimized reward combination, highlighting its convergence behavior and final locomotion performance. The effectiveness of the proposed three-tiered methodology was evaluated by tracking the performance evolution across three defined stages: the initial baseline (derived from the official H1 configuration), an intermediate policy after the first reward adjustment, and the final optimized policy.
Quantitative evaluation, as summarized in
Table 3, demonstrates a clear iterative improvement. The initial baseline policy, although stable in avoiding falls, exhibited overly conservative locomotion, resulting in moderate forward distance (7.244 m) and a low posture score (31). After the first iteration of reward adjustments, the forward distance increased substantially to 15.620 m, indicating that the agent began to explore more dynamic locomotion strategies. However, this increase in activity came at the cost of posture stability, as reflected in the posture score (46.3) and non-zero fall rate (0.1). The final optimized policy successfully balanced locomotion efficiency and stability, achieving the highest forward distance (17.951 m), an optimal posture score (65.8), and a zero-fall rate, confirming the effectiveness of the complete reward optimization process.
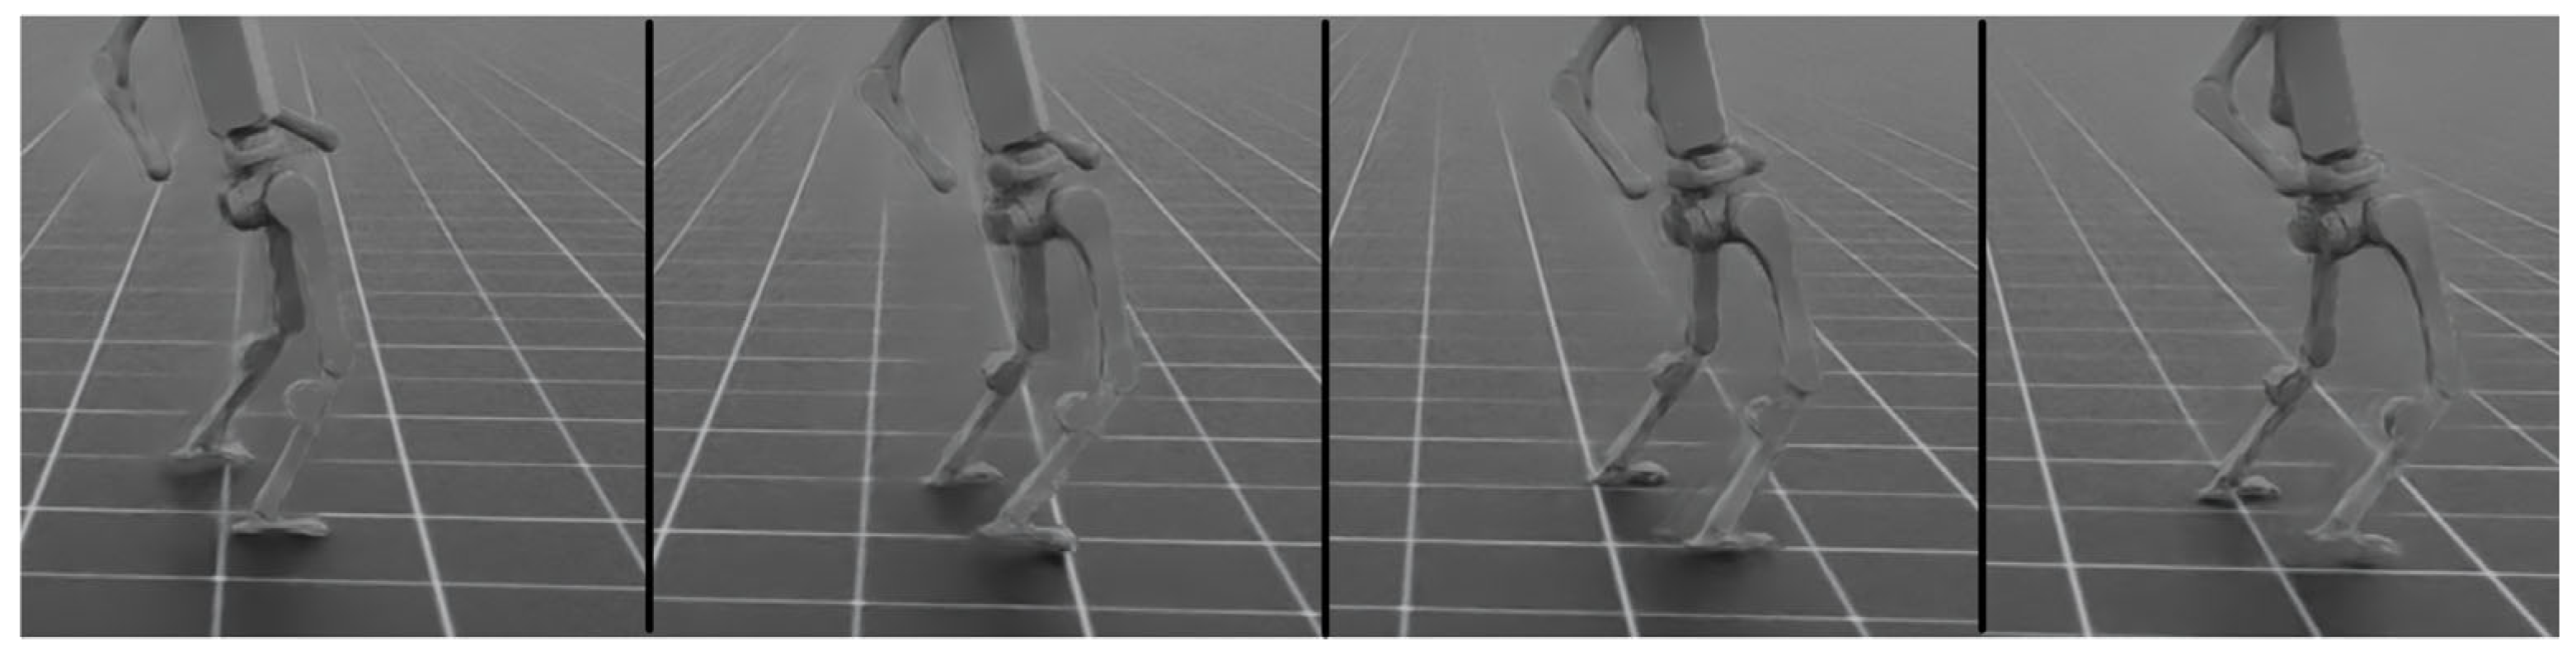
Figure 4 depicts a complete gait cycle of the optimized policy, showing two alternating leg swings and demonstrating its capacity for stable, periodic locomotion. The locomotion performance during evaluation on flat and slightly sloped terrains is further illustrated in
Video S1 in the Supplementary Materials.
4.1.2. Multi-Seed Task-Level Performance Evaluation
To evaluate the task-level performance, we conducted experiments across five independent random seeds (0, 1, 42, 123, 999). Each seed was tested across 10 episodes to assess the performance stability and robustness of the method under different initial conditions. The performance metrics were calculated for both the baseline method and the optimized method. Key performance indicators such as Forward Distance, Fall Rate, Active Efficiency, Mean Path Length, and Episode Lengths were used to evaluate the performance. A statistical summary (Mean and Standard Deviation) across all seeds is provided in
Table 4 to illustrate the consistency of the improvements.
4.1.3. Learning Dynamics and Training Stability
To assess learning dynamics, we quantified convergence speed by measuring the number of training steps required for the reward to reach a stable regime. Convergence was determined based on reward stabilization criteria applied consistently across all runs. The results, averaged over five independent random seeds, are summarized in
Table 5.
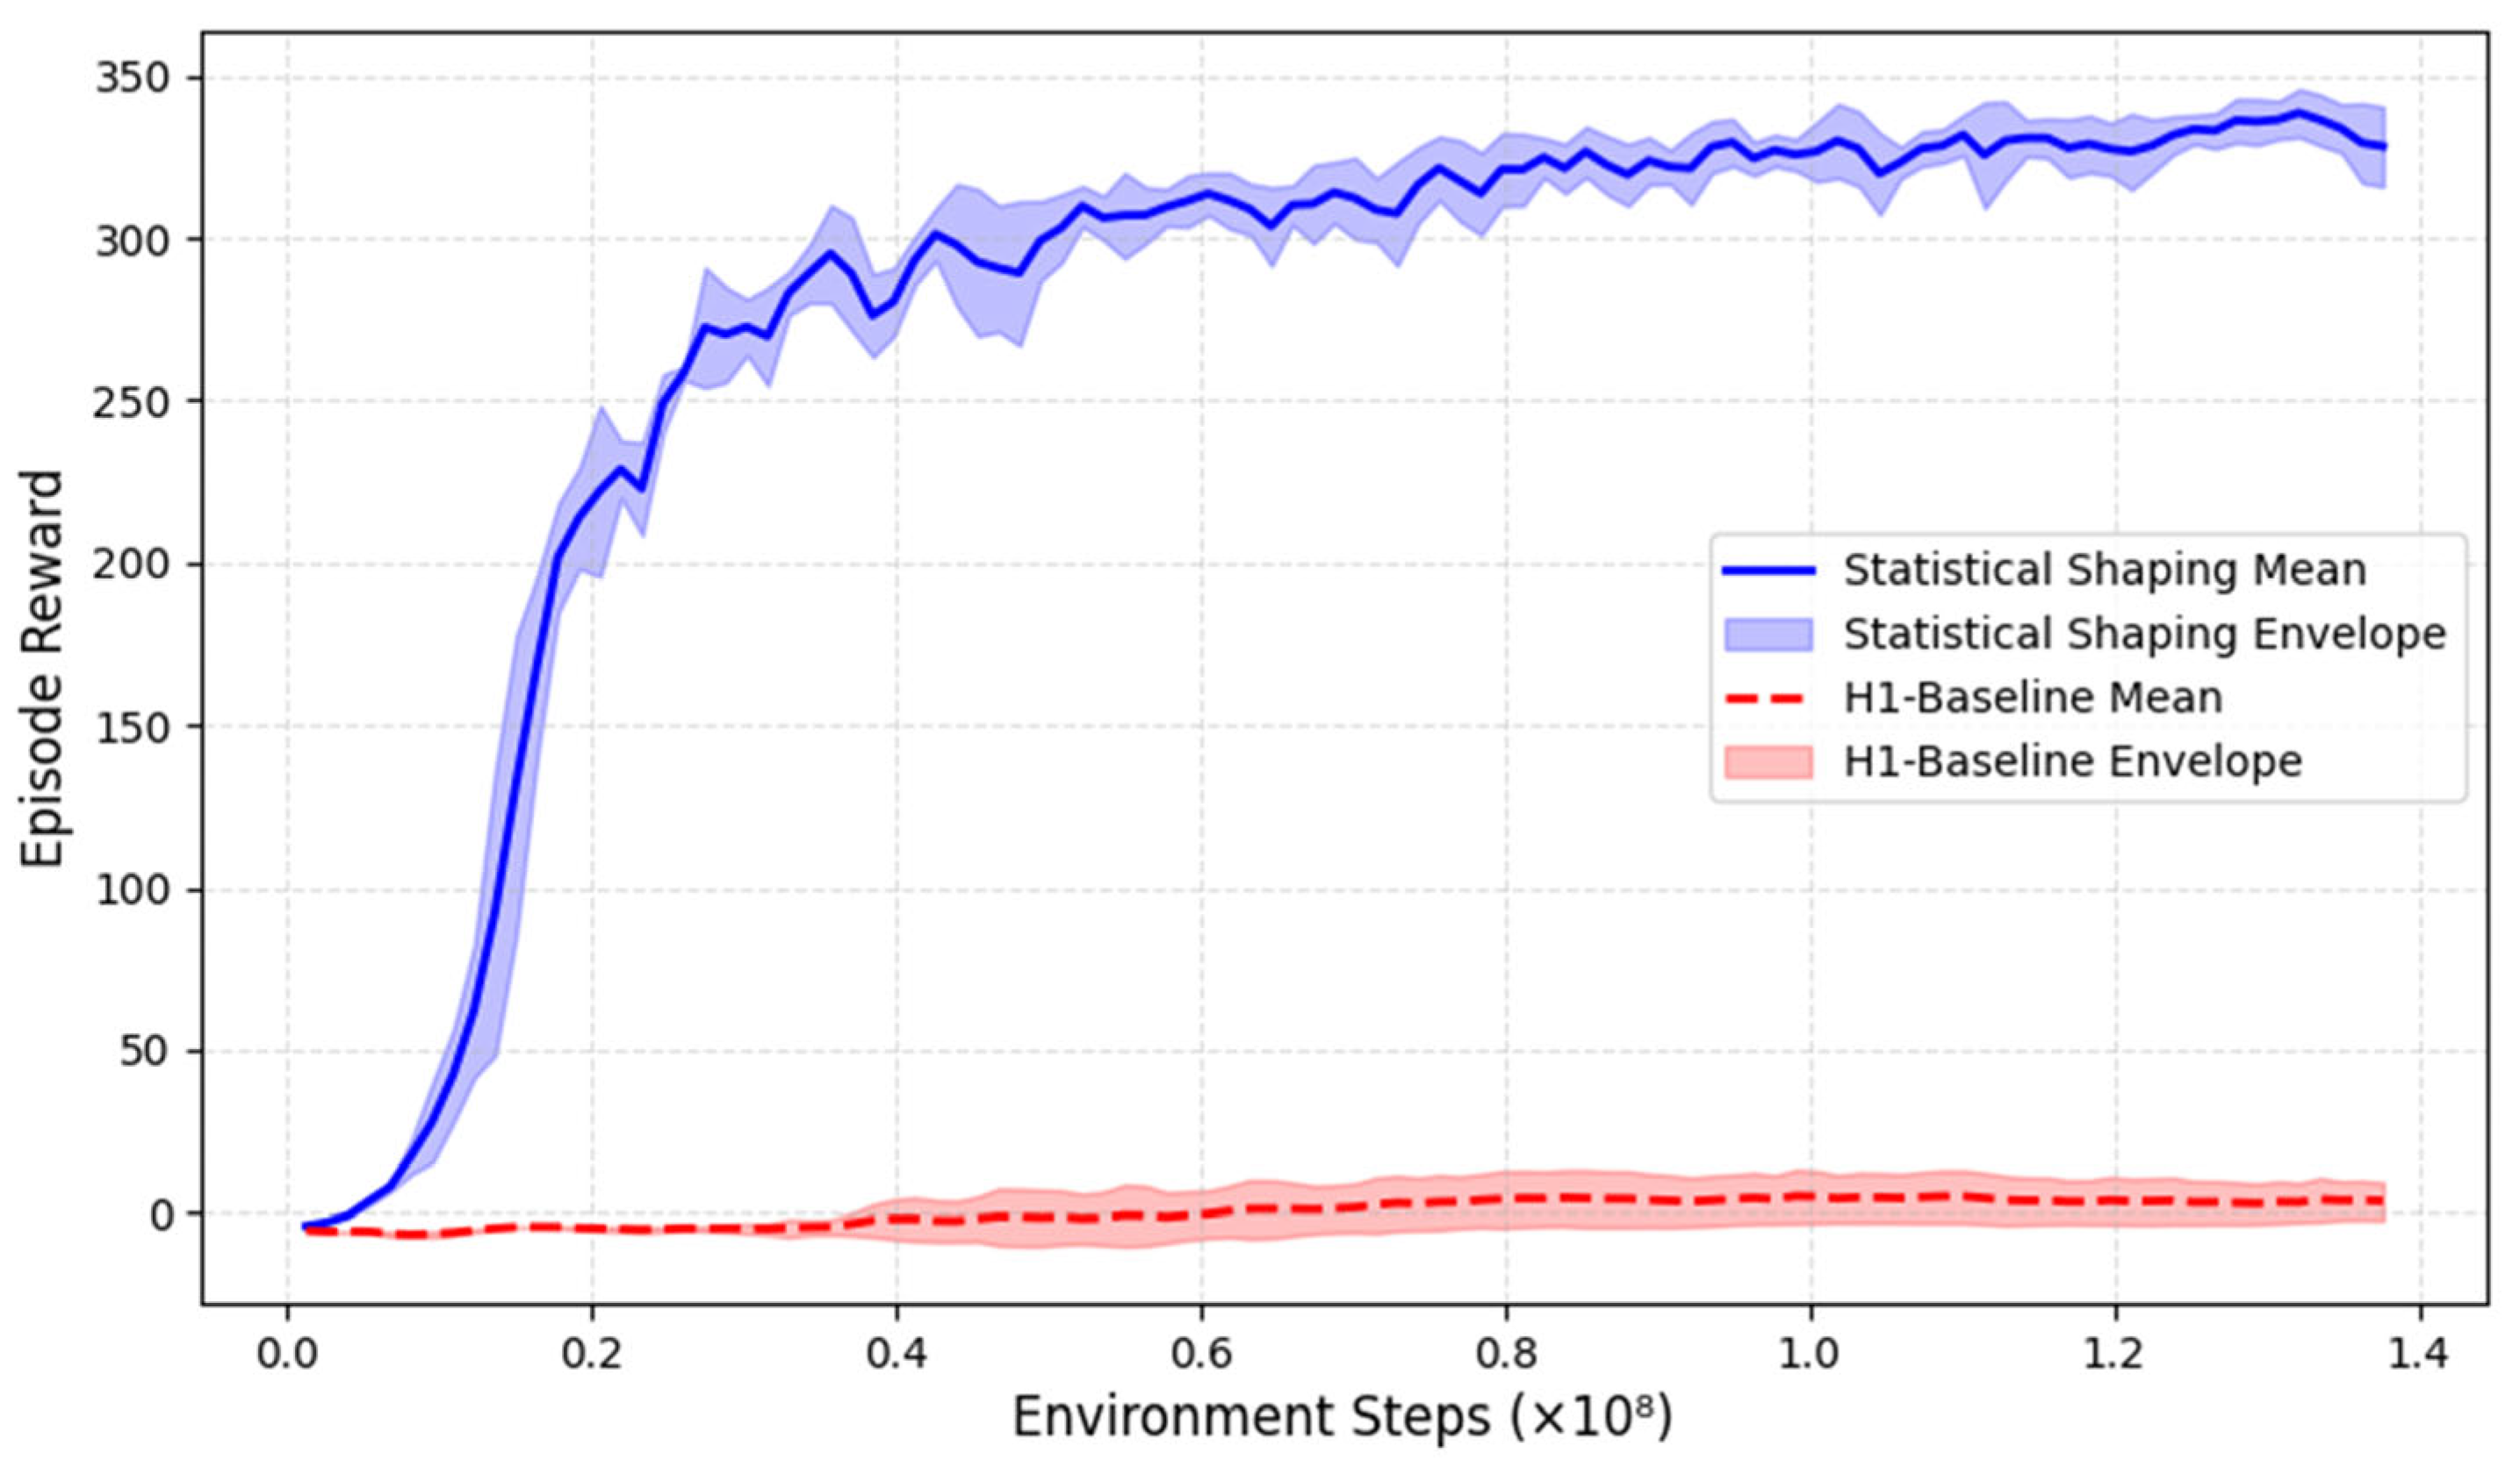
The optimized policy converged in 16,598.4 ± 1647.0 steps, compared to 18,950.4 ± 7828.4 steps for the baseline, corresponding to a 14% reduction in convergence time. Notably, the baseline exhibits substantially higher variance, indicating unstable and inconsistent learning across seeds.
To further assess converged performance, we defined it for each seed as the mean reward over the final 10 training checkpoints and conducted statistical comparisons across five seeds. The baseline achieved 3.43 ± 6.9, whereas the optimized policy reached 334.1 ± 6.2. A Welch two-sample t-test confirms that this difference is statistically significant (), with a very large effect size.
Figure 5 illustrates the training dynamics. Although the baseline curve appears visually flat due to its small absolute scale, the large standard deviation relative to its mean (3.43 ± 6.9) reflects pronounced instability. In contrast, the optimized method exhibits both higher reward magnitude and lower inter-seed variability, resulting in a smoother and more consistent convergence trajectory.
Since both methods employ the same PPO algorithm, the observed improvements can be attributed to differences in reward design. The proposed Statistical Shaping approach provides more structured guidance during exploration, leading to faster convergence and enhanced stability. These results collectively validate the effectiveness of the proposed Statistical Shaping reward design in improving learning efficiency and robustness.
4.1.4. Robustness and Generalization Tests
To further assess robustness and generalization, the optimized policy was evaluated under additional conditions. First, the policy was applied to mildly rough terrain with slopes ranging from 1.2° to 2.9°, which were not encountered during training. The robot maintained stable locomotion throughout these trials, demonstrating partial generalization to previously unseen environments. Second, the impact of random external disturbances on flat terrain was examined. While all main experiments included such perturbations to evaluate realistic robustness, it was observed that the removal of these disturbances approximately doubled the forward progression per episode. These findings indicate that the optimized policy not only performs effectively under standard conditions but also exhibits measurable robustness and adaptability to moderate environmental variations.
4.2. Revealing Trade-Offs: Correlation and Regression Analysis
4.2.1. Correlation Analysis
The correlation analysis revealed several noteworthy relationships between reward weights and locomotion performance indicators.
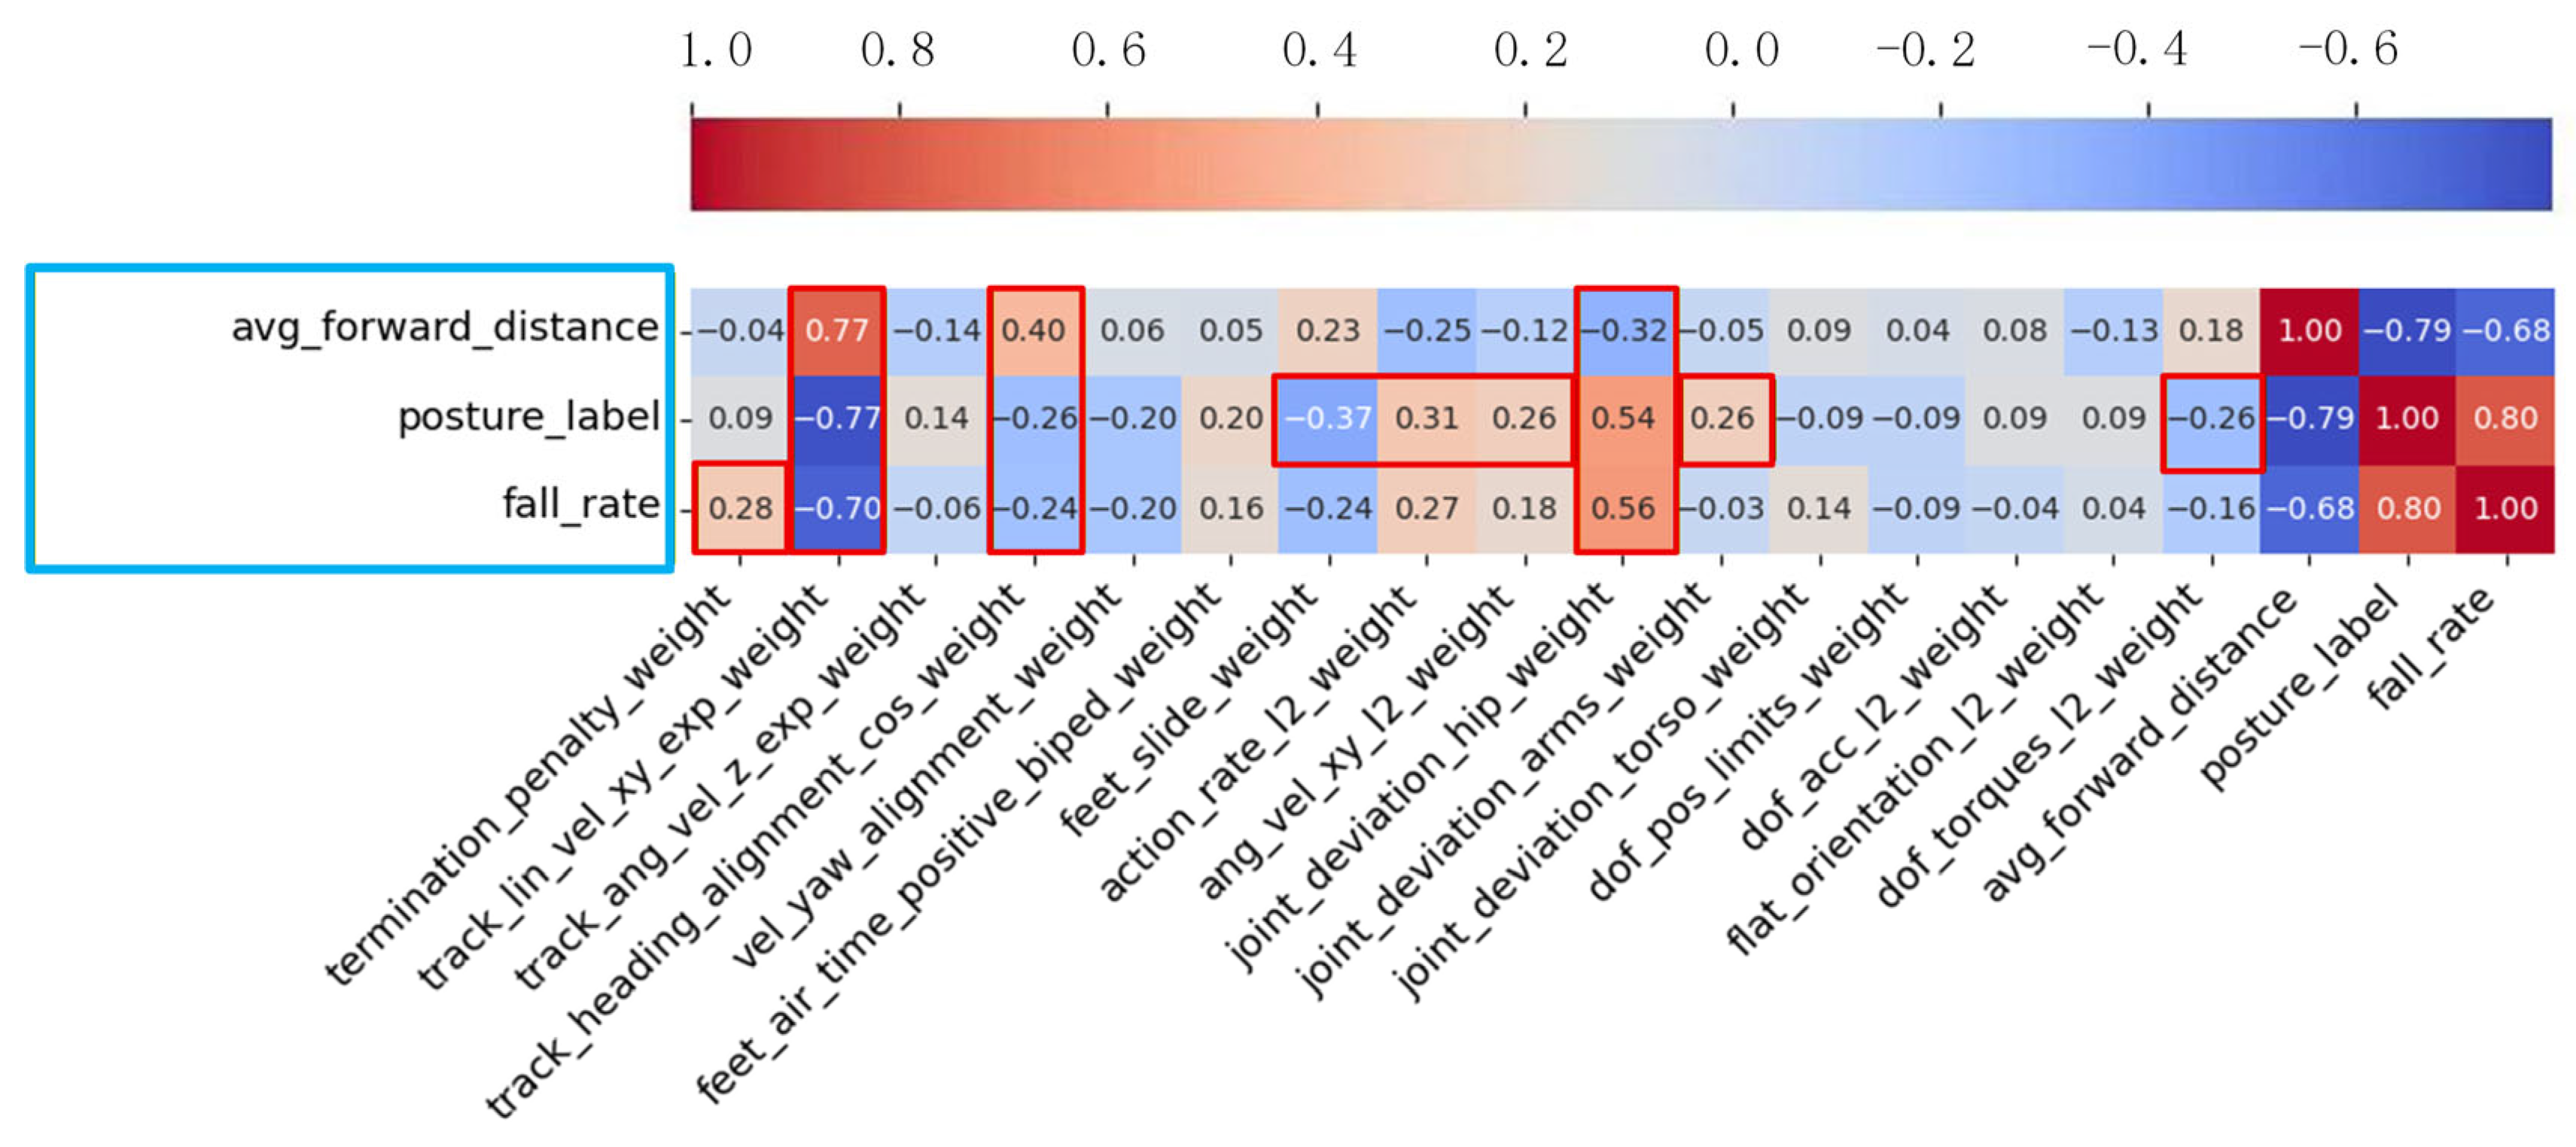
Figure 6 presents the overall heatmap between reward weights and locomotion performance metrics.
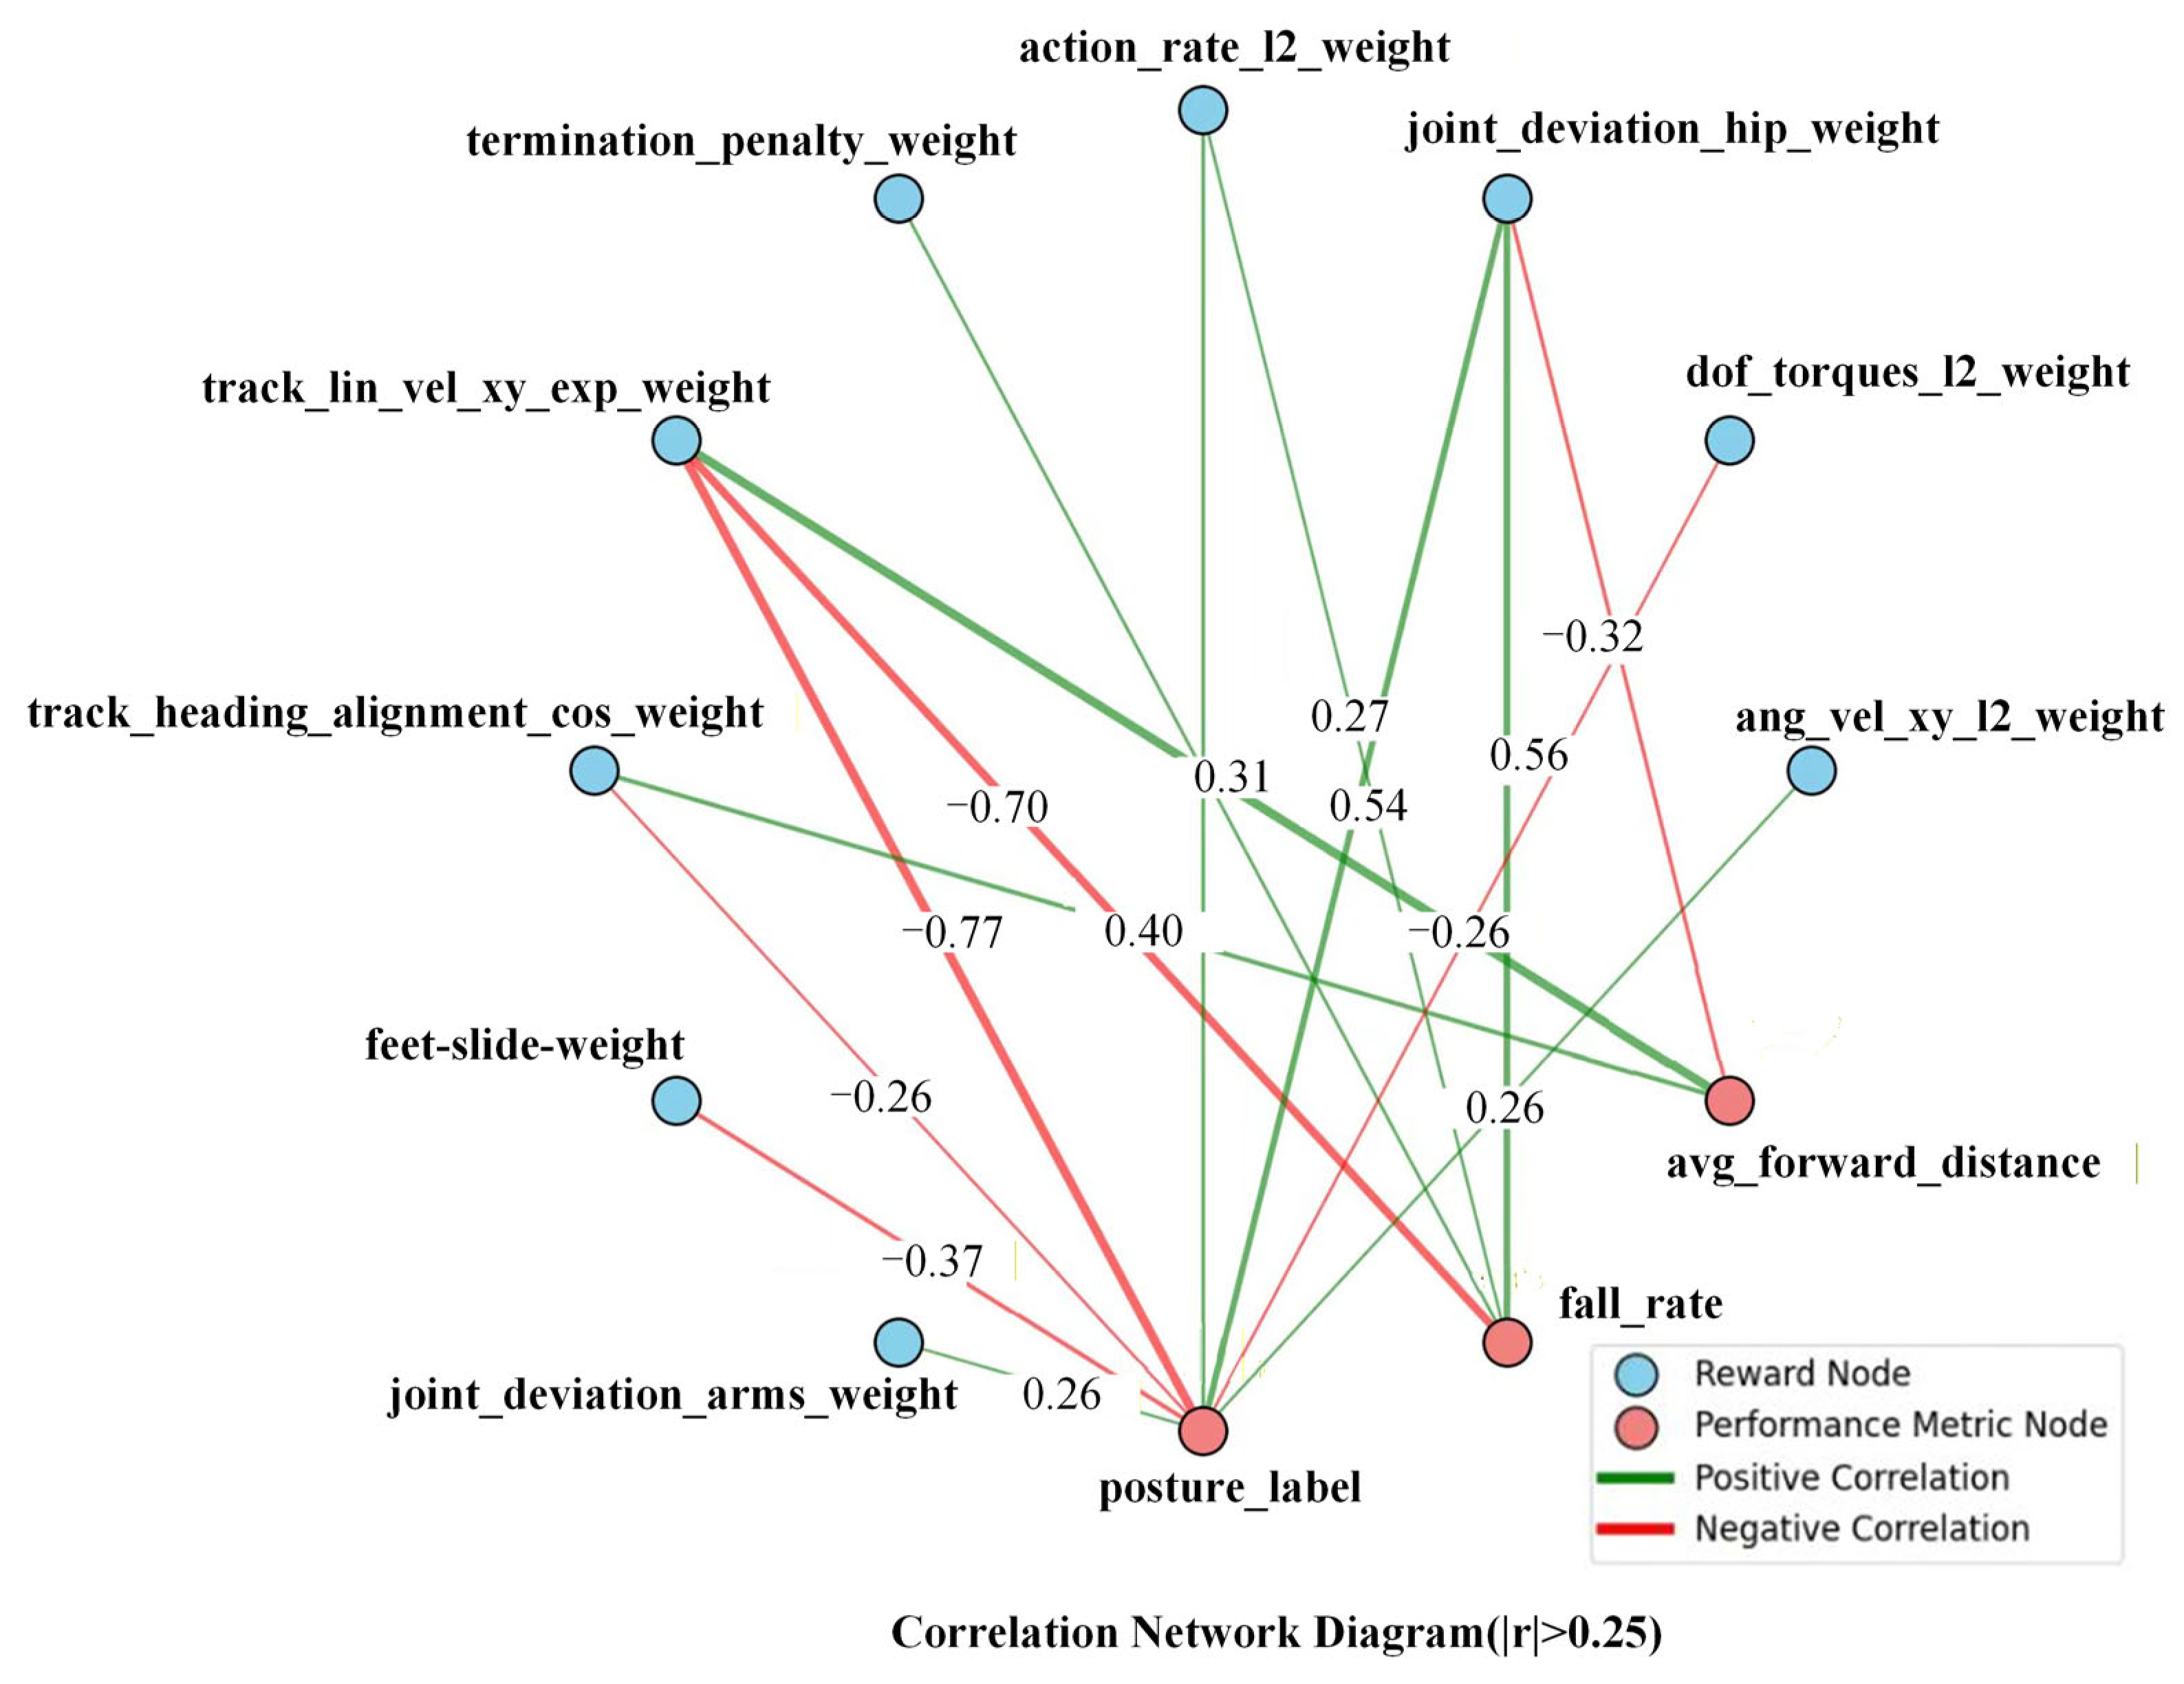
The correlation analysis confirms that bipedal locomotion reward design is characterized by a critical trade-off between maximizing forward speed and maintaining postural stability. This central conflict is most apparent in the linear velocity tracking weight, which is the strongest positive predictor of forward distance (r = 0.765) but also the strongest negative predictor of both posture (r = −0.767) and fall rate (r = −0.701).
First, regarding movement incentives, heading alignment provides a secondary boost to distance (r = 0.396) with minimal stability cost. Second, for regularization, action smoothness and angular velocity constraints universally benefit stability, while an overemphasis on foot sliding penalties can disrupt natural gait (r = −0.369 with posture). Finally, joint constraints present a complex dilemma: hip deviation penalties, for instance, improve posture (r = 0.540) at the direct expense of locomotion efficiency (r = −0.324) and may even increase falls (r = 0.555).
These relationships, visualized in
Figure 7, lead to a clear conclusion: no single reward term optimizes all objectives. The optimal policy must therefore emerge from a balanced combination that navigates these trade-offs, leveraging terms that provide complementary benefits to achieve efficient and stable locomotion.
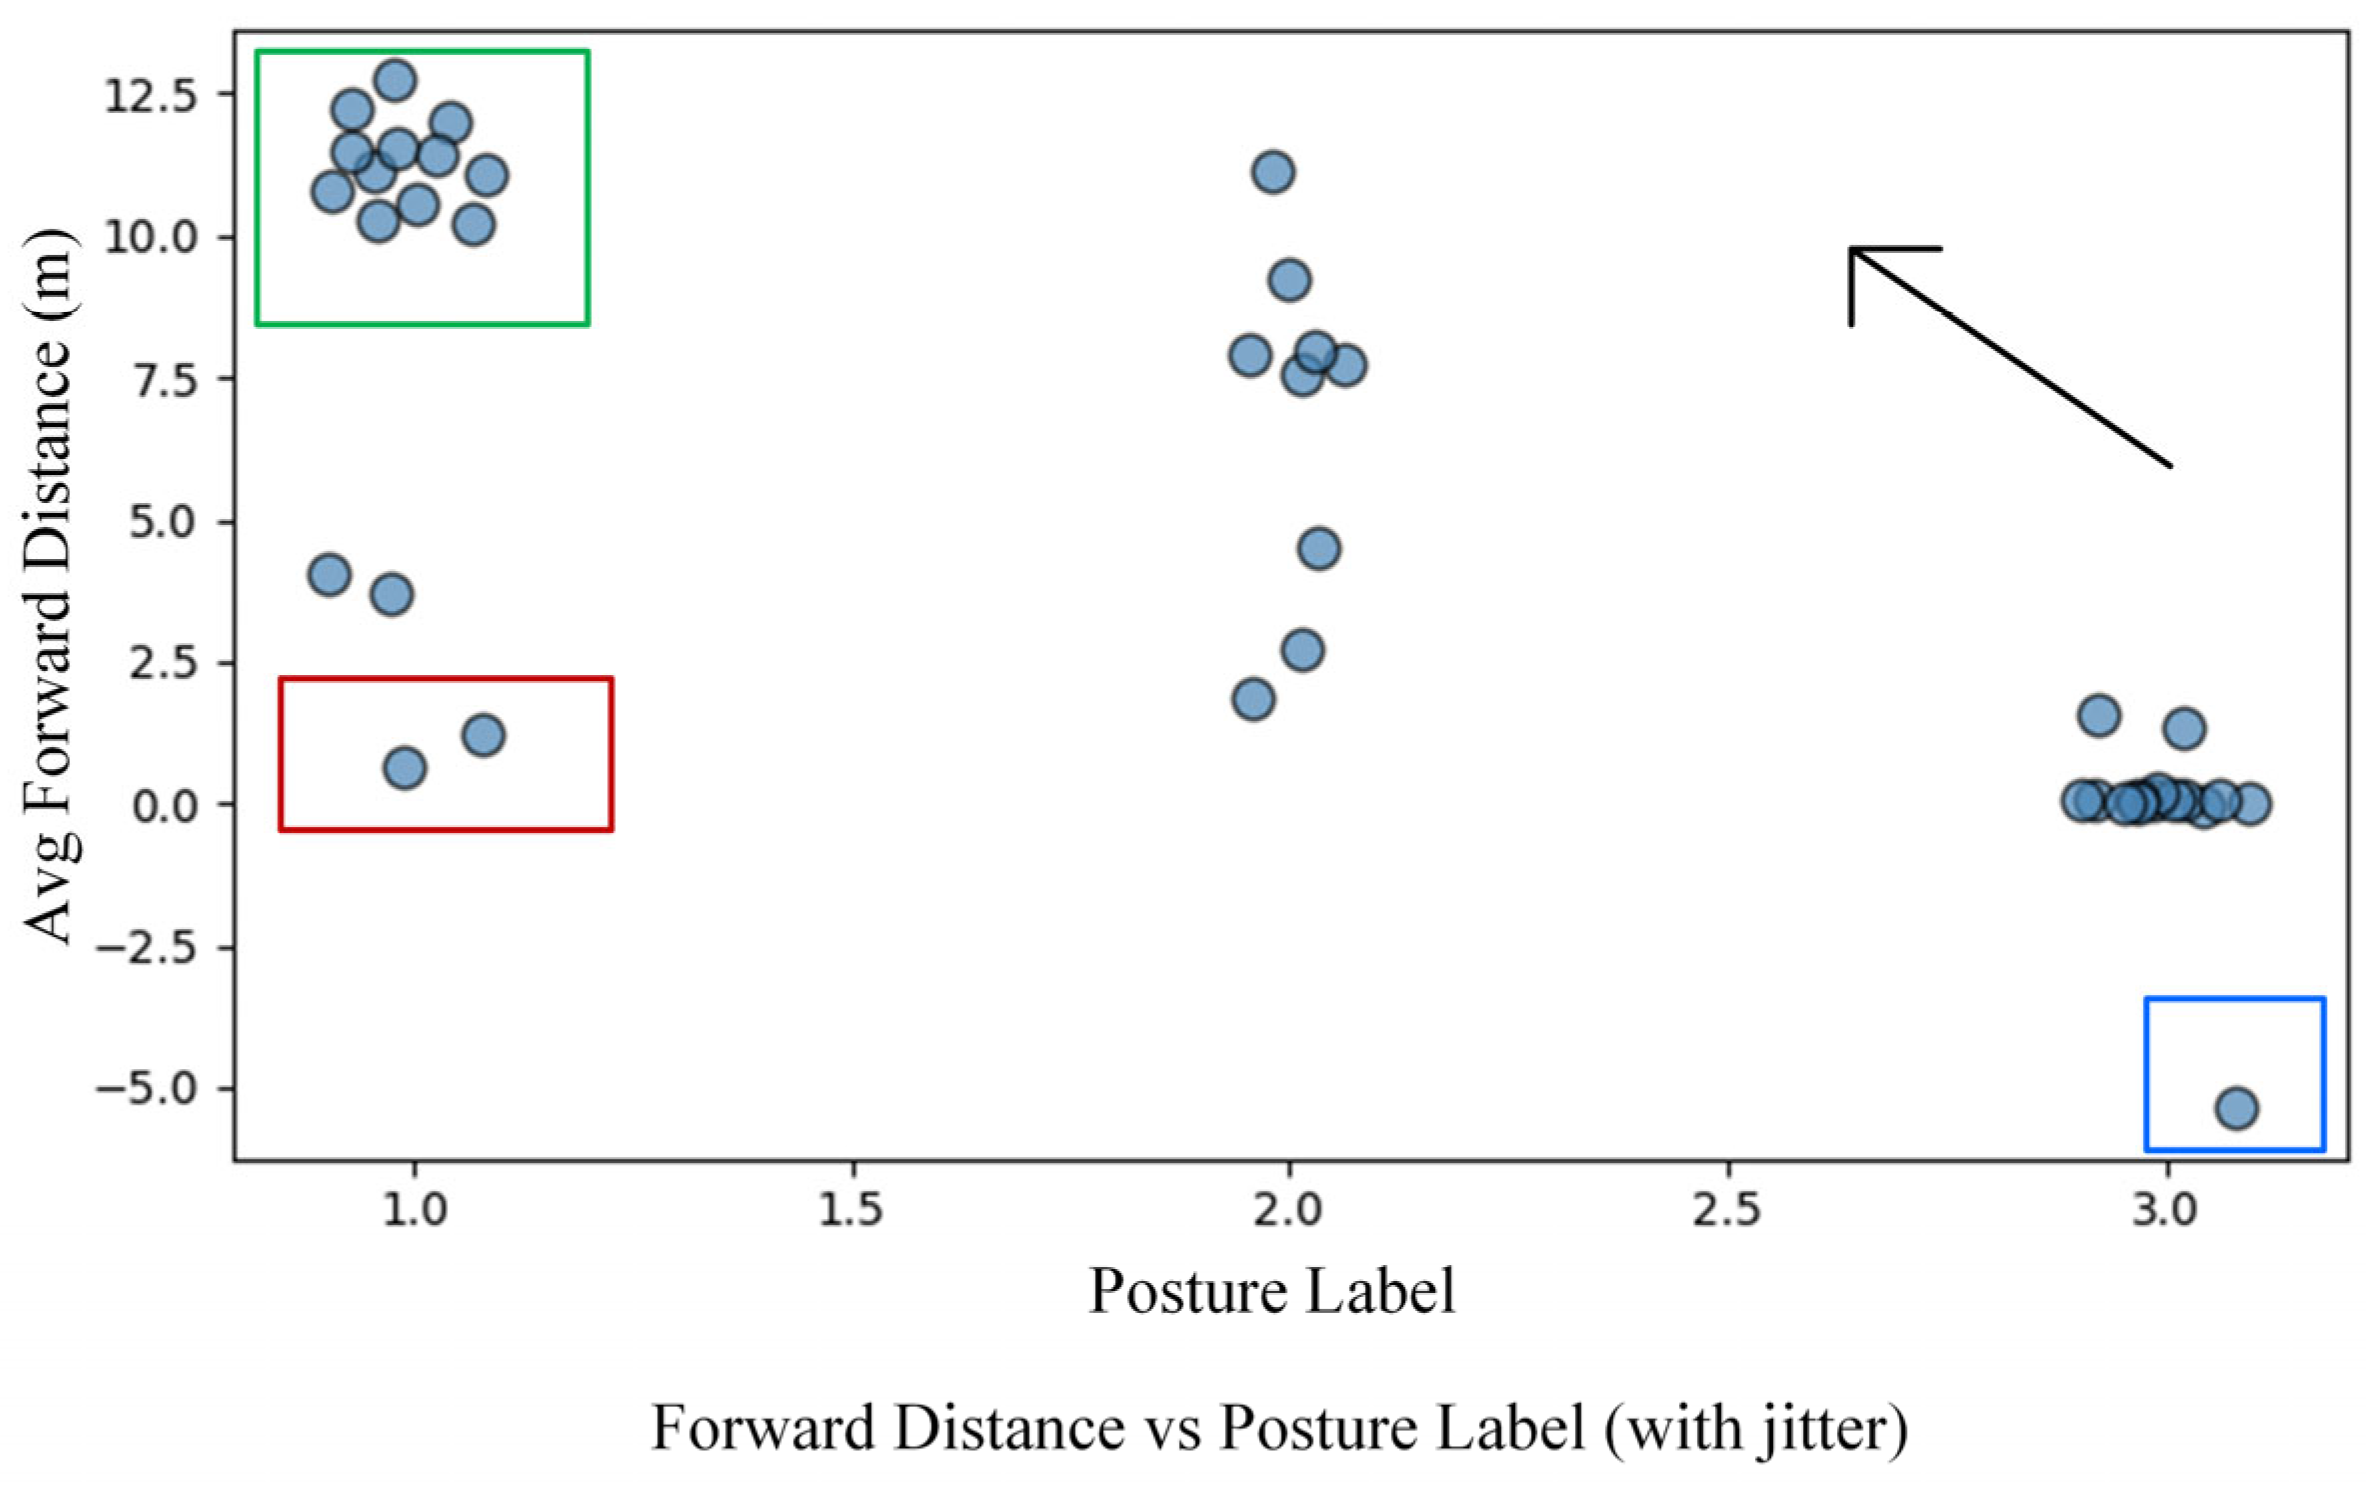
Figure 8 illustrates the critical relationship between locomotion efficiency and postural stability. It demonstrates that while optimal posture (score of 1) is a necessary condition for high performance, it is not sufficient. This is exemplified by the policies within the red box, which maintain excellent posture yet achieve only short forward distances. Conversely, the policies in the green box confirm that the dual objective of high stability and high efficiency is attainable. The scatter plot thus encapsulates the core challenge of reward design: to precisely steer the policy into this coveted high-performance, high-stability region.
The experiment within the blue box (Round PB40_09) represents a special case that will be analyzed in
Section 4.3, attributed to the combined effects of random seed initialization and policy instability.
4.2.2. Linear Regression Analysis
- (a)
Simple Linear Regression Analysis
In this study, we performed linear regression analyses to evaluate the relationship between various reward terms and key performance metrics for bipedal robots. The results of these analyses are summarized below:
Forward Distance: The model shows a moderate fit with an R2 value of 0.635, suggesting that approximately 63.5% of the variation in active distance can be explained by the selected reward terms. Notable predictors include the linear velocity (track_lin_vel_xy_exp_weight) and yaw alignment (vel_yaw_alignment_weight), both showing positive effects, while action rate (action_rate_l2_weight) had a negative influence.
Posture Score: With an R2 value of 0.463, the model indicates a lower explanatory power for posture. The most significant negative influences were the feet air time (feet_air_time_positive_biped_weight) and angular velocity (track_ang_vel_z_exp_weight), while yaw alignment (vel_yaw_alignment_weight) showed a positive contribution to maintaining better posture.
Fall Rate: The model fit for fall rate was moderate with an R2 value of 0.579. The linear velocity and yaw alignment showed negative impacts, suggesting that better control of velocity and alignment can reduce fall rate. However, the action rate was found to have a small positive effect, indicating that faster actions may increase the likelihood of falling.
As summarized in
Table 6, several reward terms exhibit consistent directional effects across different performance metrics, while others introduce explicit trade-offs between locomotion efficiency and stability.
- (b)
Multiple Linear Regression Analysis
To further investigate the collective influence of reward design on overall locomotion performance, we conducted a multivariate linear regression analysis using standardized performance metrics, including average forward distance, posture score, and fall rate. Prior to regression, all performance indicators were normalized to ensure comparability across different scales and to prevent any single metric from dominating the analysis.
To reduce stochastic variance introduced by random seeds, experimental results were grouped by reward configuration, and averaged values were used for regression. The resulting model achieved a high coefficient of determination (R2 = 0.988), indicating that a large proportion of performance variance across different reward configurations can be explained by a linear combination of reward weights.
Across linear, Ridge, and Lasso regressions, several reward terms consistently exhibited strong positive contributions to the standardized performance score. In particular, the feet air-time reward and linear velocity tracking reward emerged as the most influential factors, highlighting the importance of gait rhythm and forward motion regulation in achieving balanced locomotion performance. Additionally, heading alignment and angular velocity tracking rewards showed stable positive effects, suggesting their role in coordinating directional consistency and motion smoothness.
Conversely, joint deviation penalties, action rate regularization, and angular velocity penalties consistently demonstrated negative contributions, indicating an inherent trade-off between motion flexibility, responsiveness, and stability constraints. These findings suggest that overly restrictive regularization may suppress dynamic behaviors necessary for efficient locomotion.
Several reward terms, such as yaw alignment and torso joint deviation penalties, exhibited relatively small or inconsistent coefficients across models, implying limited linear influence at the configuration level under the tested settings.
Overall, this multivariate analysis supports the hypothesis that performance improvements arise from a structured combination of complementary reward components rather than reliance on any single dominant term.
To identify key predictive variables and mitigate multicollinearity, this study employs a comparative analysis of LASSO regression, ridge regression, and conventional linear regression. As shown in
Table 7, for the feature vel_yaw_alignment_weight, the three methods yield notably divergent coefficient estimates: LASSO regression shrinks its coefficient to zero (0.000000), ridge regression yields a moderately positive estimate (0.476037), while conventional linear regression indicates a weak negative association (−0.153070).
This discrepancy highlights the distinct properties of regularization methods: The L1 penalty of LASSO enables exact feature selection, tending to shrink coefficients of less contributive features to zero, thereby constructing a sparser and more interpretable model. In contrast, the L2 penalty of ridge regression uniformly shrinks all coefficients without driving them to zero, making it more suitable for obtaining stable estimates in the presence of multicollinearity
The exclusion of vel_yaw_alignment_weight in the LASSO model suggests its marginal explanatory power for the target variable after controlling for other features. However, its positive coefficient in ridge regression implies that this feature may be correlated with other predictors, resulting in differences between its individual effect and its conditional effect. This finding provides a basis for subsequent feature engineering and model simplification.
4.3. Validating Hypotheses: Outcomes of Targeted Parameter Sweeps
To move beyond correlation and establish causality for the hypotheses derived from the statistical analyses in
Section 4.2, we conducted targeted parameter sweeps and a qualitative analysis of emergent gaits. This validation, conducted from multiple perspectives, robustly confirms the complex trade-offs inherent in reward design, particularly the dual role of velocity tracking and the critical, often detrimental, impact of excessive joint constraints. The results are listed in
Table 8.
- (a)
Validating the Speed-Stability Trade-off:
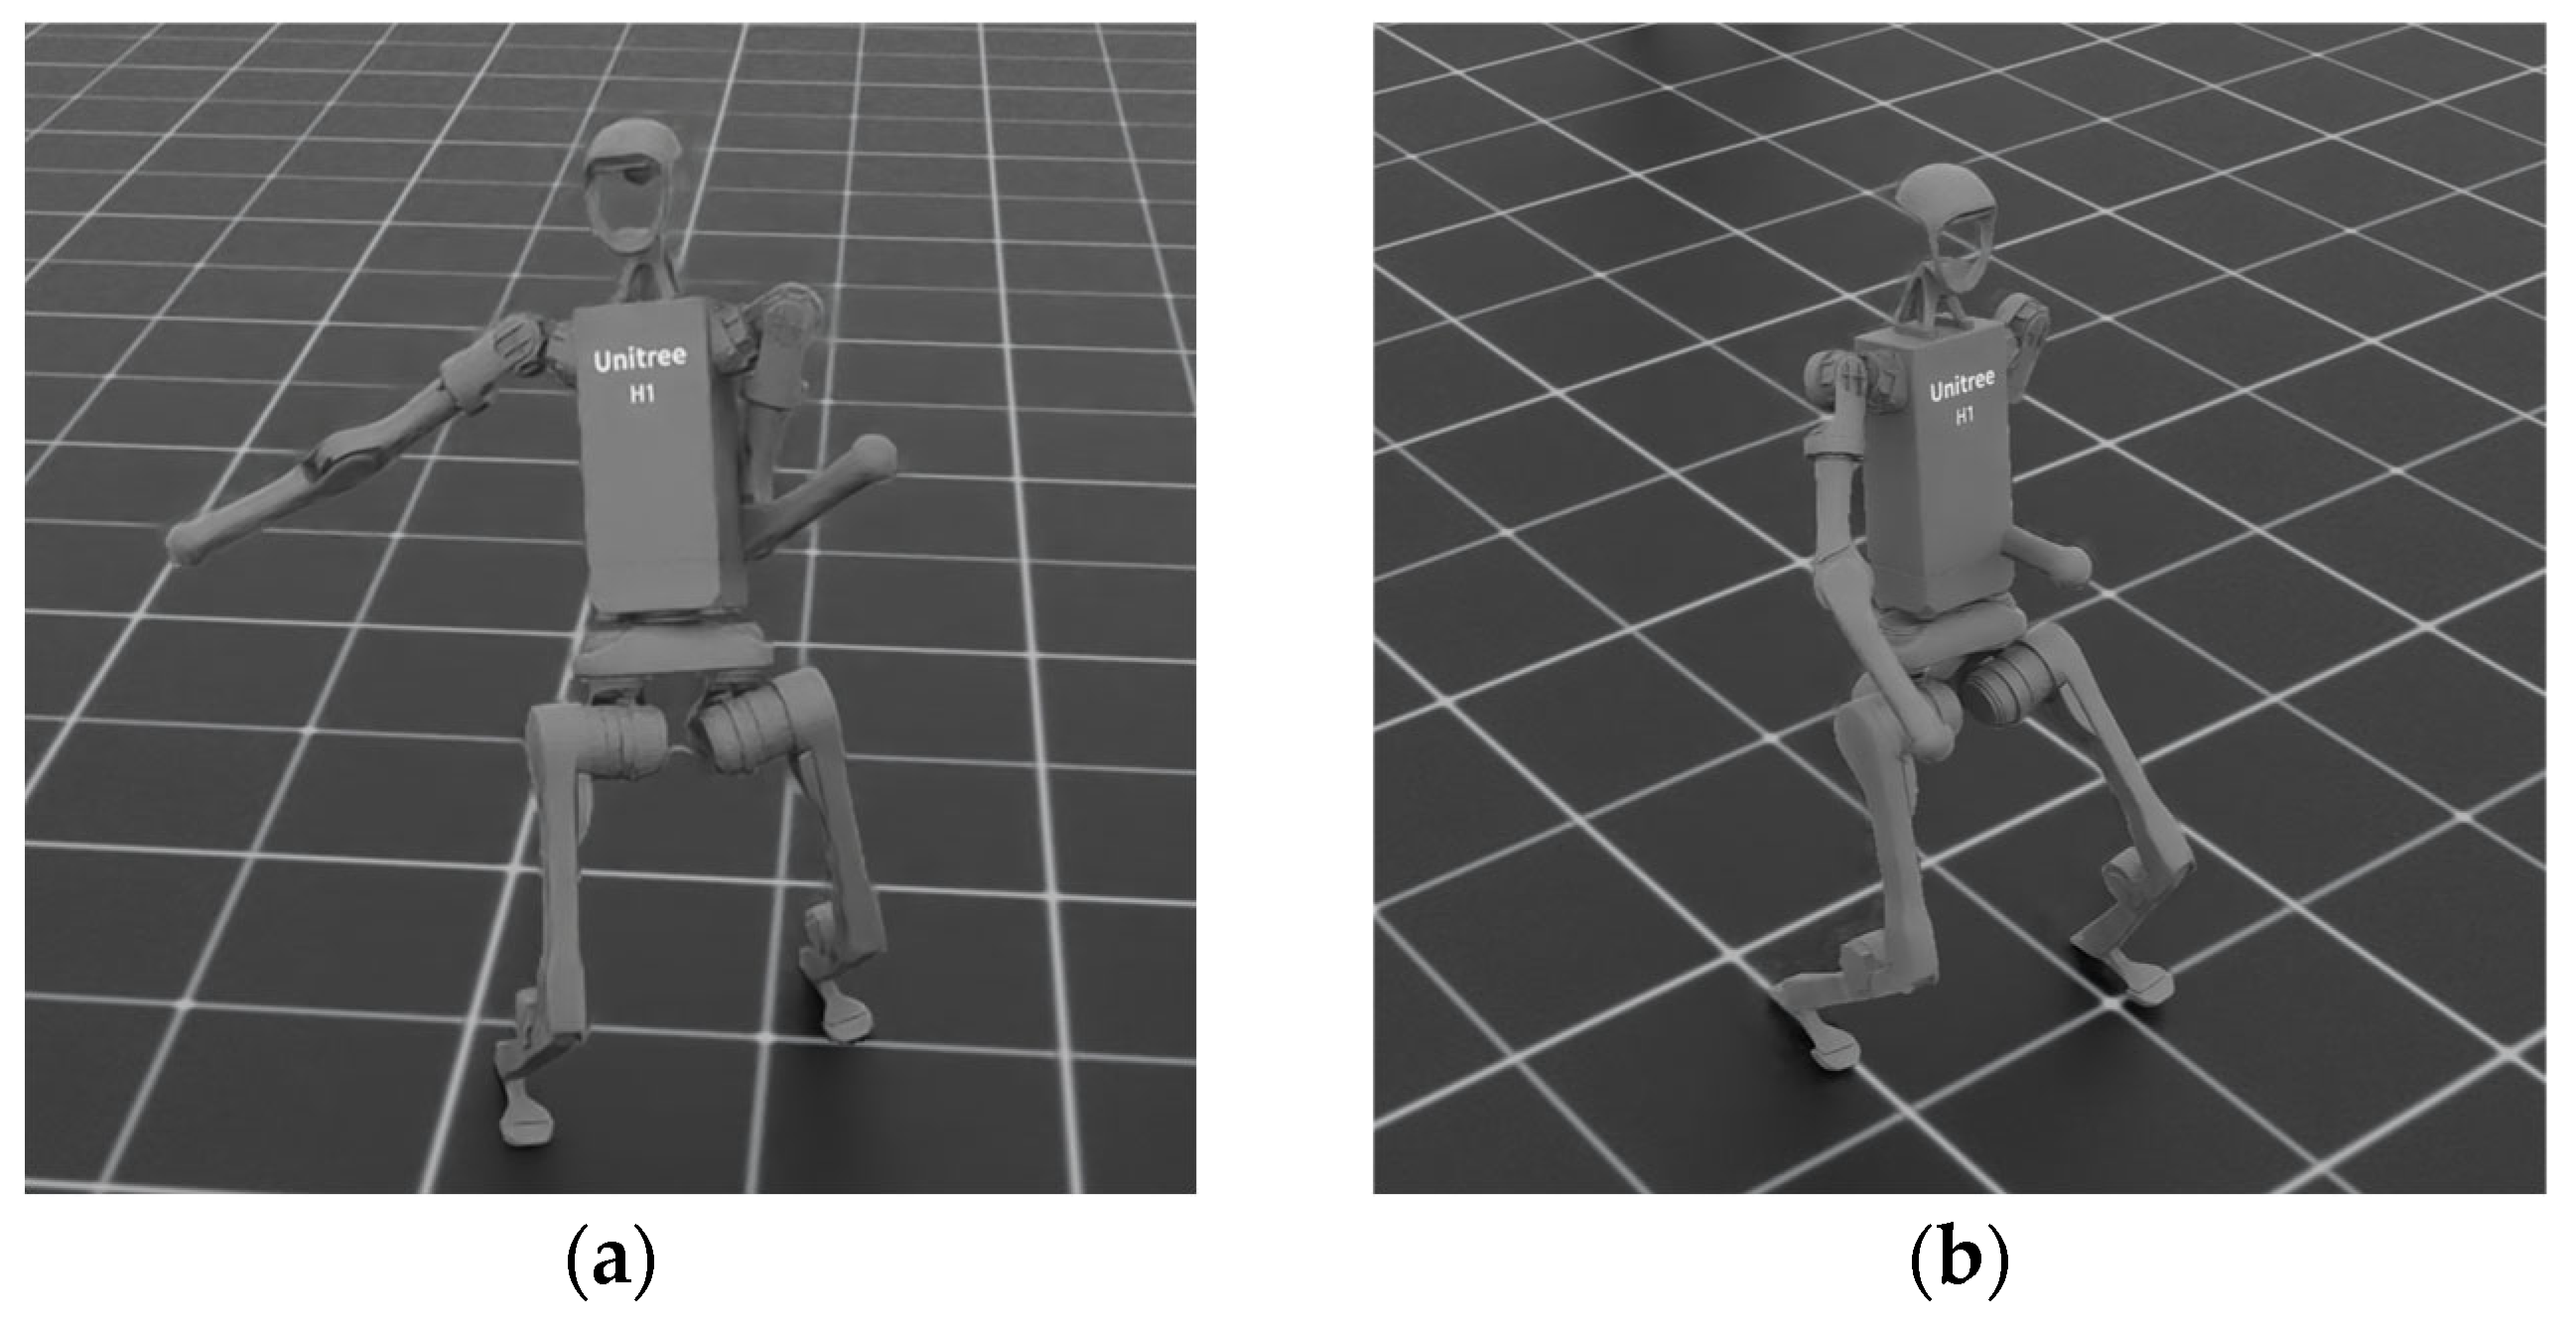
Our sweeps confirmed that high linear velocity tracking weights (e.g., PB40_11, PB40_26) are the primary driver for large forward distances (>17 m). However, this often comes at the cost of postural stability. PB40_26, for instance, achieves 17.52 m with a posture score of only 44.8, indicating clear instability during motion. In contrast, PB40_11 maintains a more moderate posture score (60.8) while reaching 18.57 m.
The comparison in
Figure 9 directly illustrates this trade-off: while policy (a) sacrifices posture for distance, policy (b) demonstrates that both long forward distance and high postural stability can be achieved through balanced reward design.
- (b)
Exposing the Cost of Over-Constraining Joints:
The analysis robustly validated the mixed influence of joint deviation penalties identified in
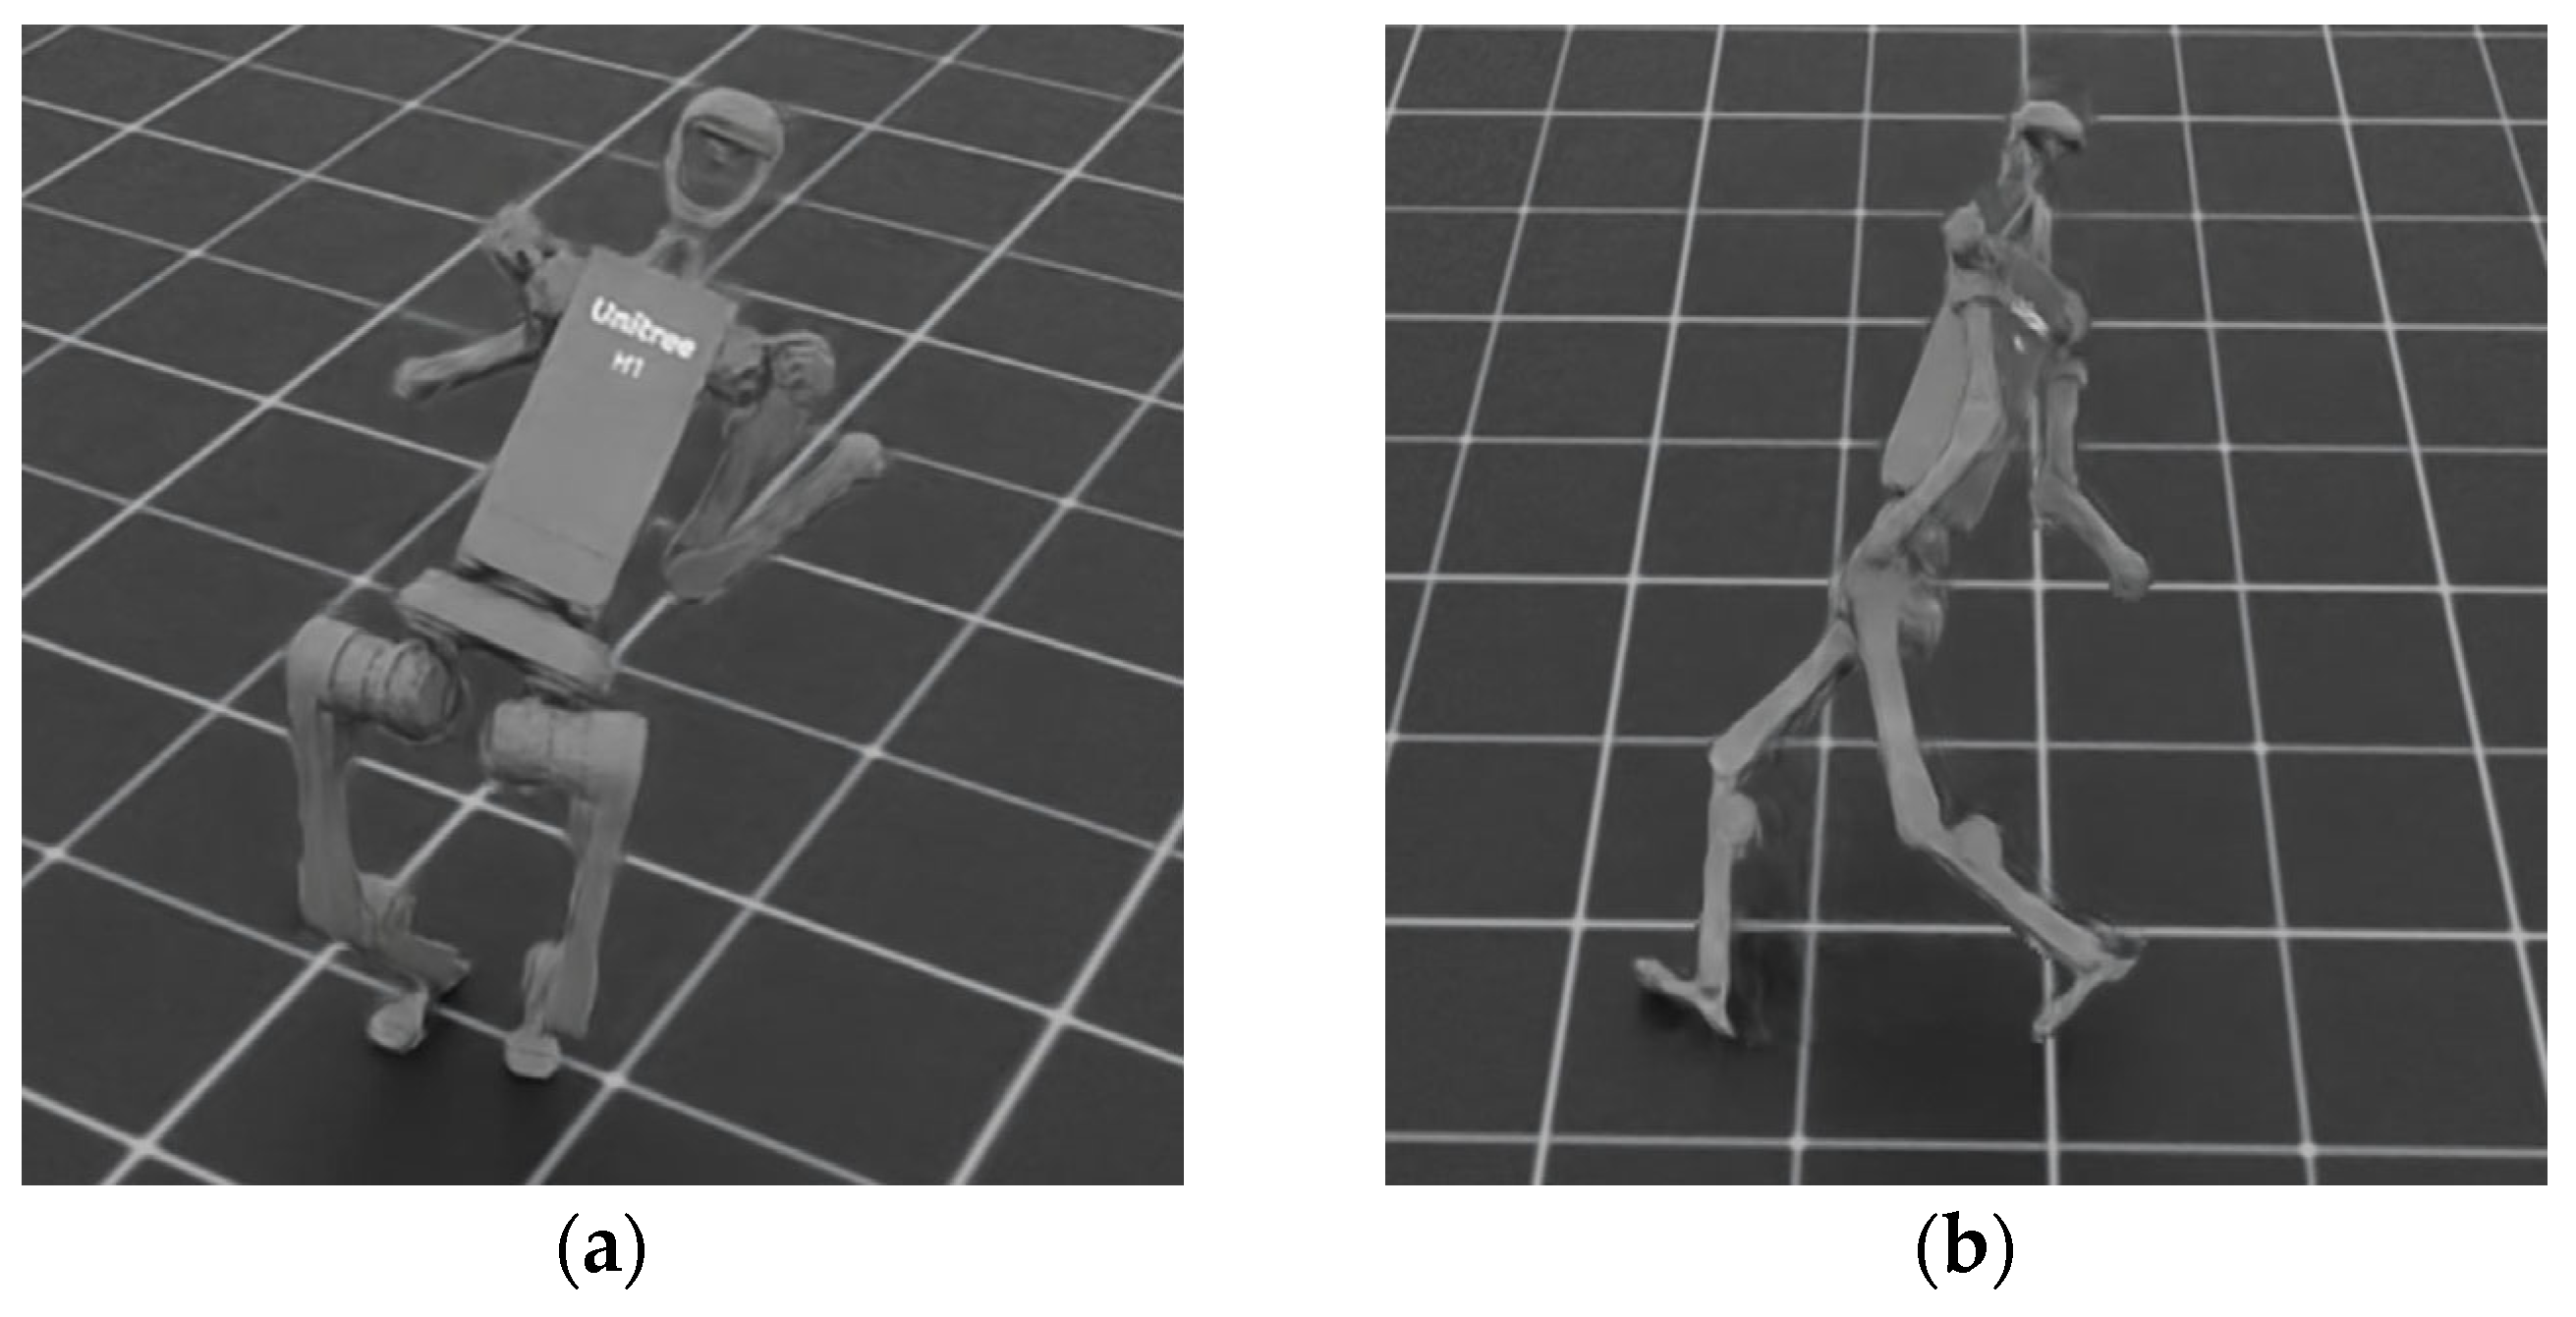
Section 3.2. While moderately constraining hip joints showed a positive correlation with posture, our sweeps demonstrated that overly restrictive penalties (e.g., PB40_18, PB40_15) were unequivocally detrimental. These configurations resulted in markedly shorter forward distances (≈5–6 m) and often increased fall rates. The detrimental effect of over-constraining joints is directly demonstrated in
Figure 10: policy (b) exhibits a paralyzed, non-functional gait from excessive penalties, while policy (a) fails immediately from insufficient constraints, showing that both extremes prevent effective locomotion.
- (c)
Highlighting Instability and Sensitivity to Stochasticity:
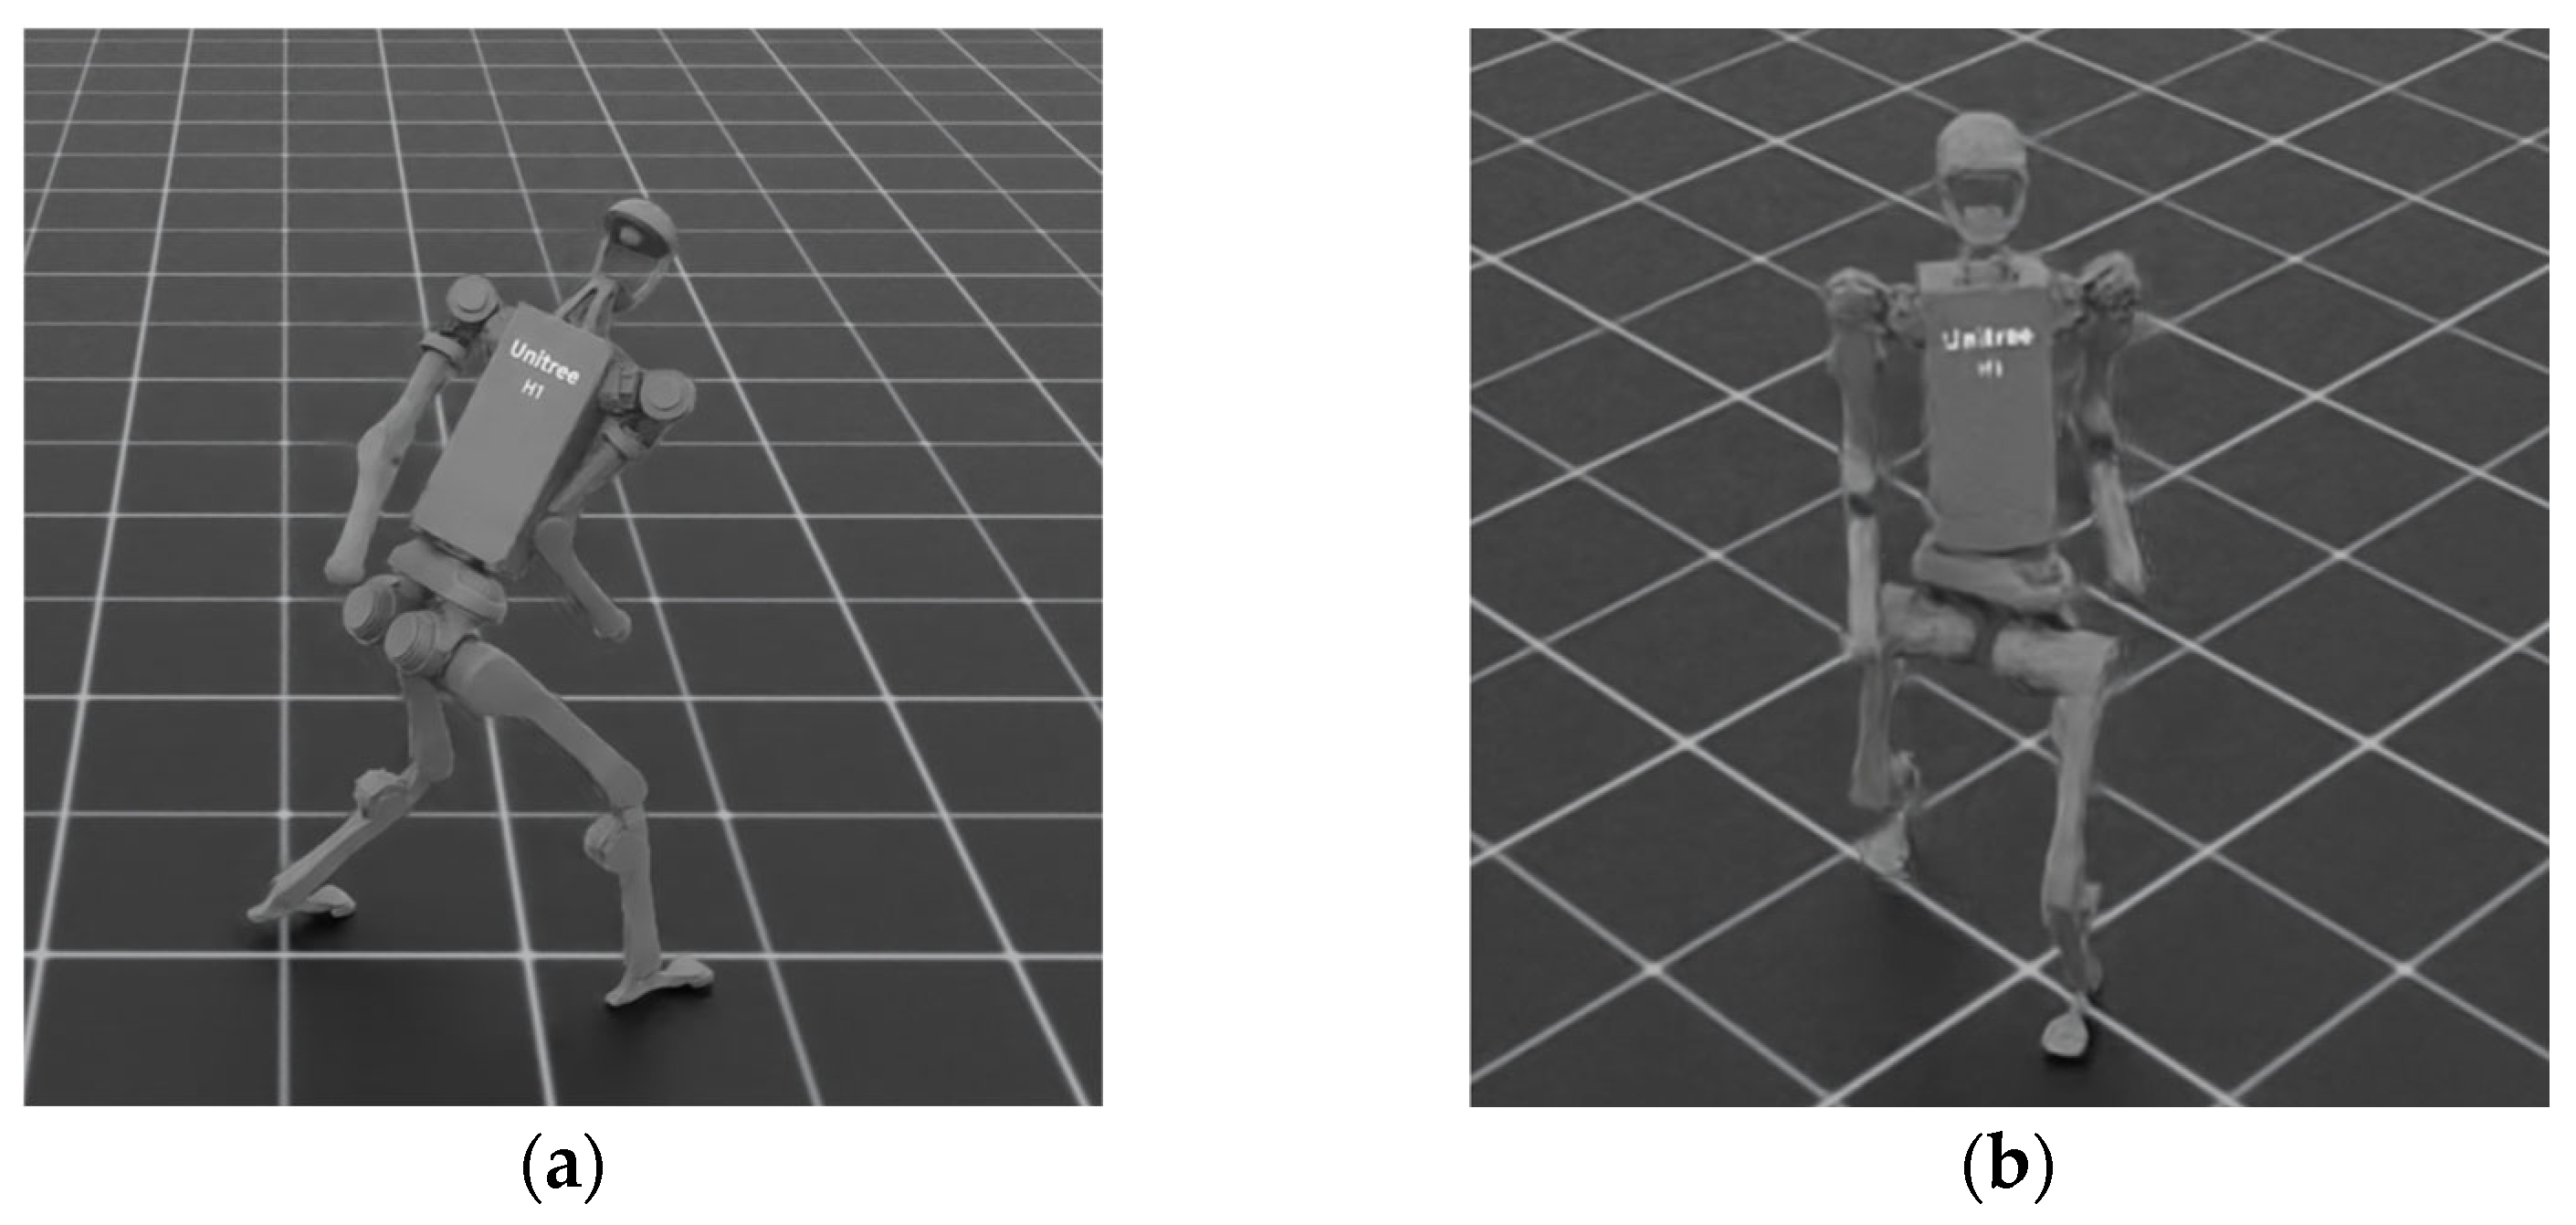
Our results confirm the critical sensitivity of policy learning to random initial conditions. Identical reward configurations (e.g., PB40_09/PB40_27) produced divergent outcomes: while policy (a) in
Figure 11 degenerated into backward locomotion via a pathological single-legged gait, policy (b) achieved stable forward movement. This demonstrates how the reward landscape contains local minima where initialization determines convergence to failure or success, underscoring that robust configurations must withstand such stochasticity.
Collectively, the results confirm that while velocity incentives are needed for forward movement, they must be balanced to preserve stability, and while joint and torque constraints support natural and safe motion, excessive restrictions can severely limit performance. These trade-offs were clearly identified through parameter sweeps and comparative analysis, directly informing the development of our final high-performing and robust policy.
5. Discussion
This study demonstrates that effective bipedal locomotion can be systematically engineered through a structured, data-driven methodology for reward shaping. The experimental results support four principal conclusions:
- (a)
Efficacy of a structured iterative methodology: A three-tiered framework, combining correlation analysis and regression models, effectively navigates the reward design space. It quantifies the impact of individual reward terms and enables systematic, data-driven refinement from baseline to final policy performance.
- (b)
Revealed trade-offs between reward terms: Correlation analysis identified the dual nature of key terms. For instance, velocity tracking rewards enhance forward progress but can compromise stability, while joint constraint penalties have the opposite effect. Multivariate regression elucidated the combined effects and interactions of multiple terms, highlighting the necessity of balancing competing objectives.
- (c)
Quantitative guidance for reward design: Regression analysis, supported by correlation coefficients, provided clear prioritization of influential reward terms. Features such as foot air-time and linear velocity tracking were significant positive contributors, whereas joint deviation penalties and action rate restrictions correlated negatively with overall performance, offering a structured alternative to heuristic design.
- (d)
Stochasticity and the need for robustness: Significant performance variability across random seeds underscored the inherent stochasticity of the optimization process. The analysis identified which reward terms promoted stable performance across runs, reinforcing the need for robustness checks and iterative refinement to ensure reliable policy convergence.
Beyond performance gains, the framework operates at the level of statistical assistance rather than full automation. While Tier 1–2 (correlation and regression analysis) are fully automated, Tier 3 retains human supervision for hypothesis generation, feasibility checks, and convergence judgment, ensuring stability and interpretability.
Compared to conventional heuristic reward tuning, often requiring 20–40 empirical trials due to the high-dimensional parameter space, the proposed structured filtering substantially reduces exploratory adjustments. In this study, only 3–5 targeted sweeps per iteration were required across 2–3 refinement cycles (approximately 8–12 evaluations in total), corresponding to an estimated 60–70% reduction in manual trial-and-error.
Future integration of Bayesian optimization or automated hyperparameter search could further replace manual parameter scanning in Tier 3, enabling a gradual transition toward fully automated reward refinement.
Although all experiments were conducted in the NVIDIA Isaac Lab simulation environment, the proposed statistical reward shaping framework has potential real-world applicability. Basic sensor noise is included for base velocities and joint positions/velocities, but real-world sensors may exhibit more complex behaviors, such as delays, drifts, and correlated noise. The framework can help highlight reward terms potentially sensitive to noise or perturbations; preliminary correlation and regression analyses across multiple training seeds can indicate which rewards contribute inconsistently to overall performance. For example, foot slip penalties, important for locomotion stability, may show larger variation under small perturbations, while torso tilt and linear velocity tracking rewards may also require careful tuning or filtering for real-world deployment. Future work will include preliminary evaluation on the physical H1 robot, tests with simulated sensor noise to assess robustness, and extension to more complex environments (e.g., slopes and uneven terrain) along with semi-automated or AI-assisted diagnostic tools to facilitate sim-to-real transfer.
6. Conclusions
This study presents and validates a systematic, three-tiered methodology for reward shaping in bipedal locomotion. By structuring the design process into a reproducible cycle of performance monitoring, correlation analysis, and hypothesis-driven parameter sweeps, the approach moves beyond heuristic tuning. Applied to the H1 humanoid in Isaac Lab, the methodology successfully generated a stable and efficient gait while systematically validating and quantifying fundamental, known trade-offs within our framework, such as that between directional control and stability.
Current limitations include the need for manual intervention in the iterative cycle. Future work will focus on automating this process, including AI-assisted diagnostics, semi-automatic weight tuning, and, ultimately, sim-to-real transfer on the physical H1 robot, which will provide the definitive validation of the framework’s generalizability and utility.