1. Introduction
Cardiovascular diseases (CVDs) remain a leading cause of mortality and morbidity worldwide and are responsible for a significant share of healthcare costs and patient suffering [
1]. Obtaining a timely, accurate diagnosis is essential for improving treatment outcomes; early intervention can prevent severe complications and improve patient prognosis [
2]. Traditional methods typically rely on key factors such as advanced medical equipment, specialized expertise, and sufficient time for accurate assessment [
3]. This dependence on these factors led to interest in developing non-invasive, accessible diagnostic tools [
4].
One promising method currently being explored is the analysis of heart sounds, which provides valuable insights into cardiac function through a simple, non-invasive approach [
5]. Heart sounds—commonly known as phonocardiograms (PCGs)—capture rich information about the heart’s mechanical behavior and can therefore offer essential cues for detecting pathological conditions [
6]. Nonetheless, differentiating between various heart sound patterns is challenging due to substantial acoustic variability across cardiac pathologies [
7]. Although manual interpretation of heart sounds is possible, it is highly labor-intensive and strongly dependent on the observer; this subjectivity and the potential for human error result in variability and inaccuracies, highlighting the necessity of automated techniques that deliver reliable, accurate assessments [
8].
This study combines recurrence plots (RPs), which capture time-dependent characteristics of heart sounds, with Neighborhood Component Analysis (NCA) for dimensionality reduction and machine learning (ML) models for effective classification, enabling early and accurate detection of heart conditions.
The principal contributions of this study are summarized as follows:
We propose a compact recurrence plot (RP)-based handcrafted feature representation that captures nonlinear cardiac dynamics without relying on deep learning architectures, making it suitable for resource-constrained and point-of-care clinical environments.
We demonstrate that competitive binary and multiclass heart sound classification performance can be achieved using a significantly reduced feature set (4 features for binary classification and 8 features for multiclass classification), representing a substantial reduction in dimensionality compared to existing handcrafted approaches.
A supervised feature weighting strategy based on Neighborhood Component Analysis (NCA) is employed to identify and retain the most informative recurrence-based features, improving both computational efficiency and model interpretability.
The proposed approach is extensively evaluated on the Yaseen 2018 dataset [
9], achieving an accuracy of 99.75% for binary classification and 98.89% for five-class classification, which is comparable to state-of-the-art methods that use substantially larger feature sets or deep learning models.
We systematically analyze the effect of segment duration on classification performance and show that 2 s segments consistently outperform 1 s segments across all evaluated classifiers, providing practical guidance for heart sound analysis.
The remainder of this paper is organized as follows:
Section 2 reviews significant related work in heart sound classification, covering traditional diagnostic methods, deep learning approaches, and feature-based techniques.
Section 3 provides a detailed description of the proposed methodology, including dataset preparation, feature extraction using recurrence plots, the definitions of recurrence quantification analysis (RQA) features, NCA-based feature selection for dimensionality reduction, and the classification models employed.
Section 4 presents comprehensive experimental results for both multiclass and binary classification tasks, utilizing 1 s and 2 s segments. This section includes performance metrics, confusion matrices, feature importance analysis, and a comparative analysis with related works.
Section 5 discusses the findings, demonstrating that the proposed approach maintains competitive accuracy while providing physically interpretable RQA features—such as determinism, laminarity, and trapping time—which offer insights into cardiac dynamics and help clinicians understand the model’s predictions, unlike black-box deep learning methods.
2. Literature Review
Heart Valve Diseases (HVDs) are a significant concern in the area of cardiac health, where early diagnosis is essential for treatment. Using heart sound analysis for HVD diagnosis has traditionally relied on techniques like auscultation, Echocardiography (ECG), and PCG to assess cardiac function and diagnose conditions (e.g., valve defects, arrhythmias, and stenosis). While these approaches are practical, they also require expertise and equipment that limit their use as HVD screening tools. However, advancements in digital signal processing and ML have enabled automated analysis of PCG signals, enhancing accuracy and accessibility [
1].
For HVD detection, researchers have proven that ML-based approaches support early, automated diagnosis. Support Vector Machines (SVMs) and Random Forests are frequently employed because they can handle the complex decision boundaries and high-dimensional data prevalent in heart sound analysis [
10]. However, these methods often rely on time-domain or frequency-domain features that may not capture the temporal patterns needed for accurate classification.
A key component in developing robust ML solutions for HVD detection is effective feature extraction, which can be broadly categorized into Deep Learning (DL) and handcrafted methods. DL approaches (i.e., Convolutional Neural Networks (CNNs) and Convolutional Vision Transformers (CVTs)) learn features directly from raw data and achieve high classification accuracy. For instance, studies using CNNs combined with Discrete Wavelet Transform (DWT) and Continuous Wavelet Transform (CWT) report accuracies above 98% in binary classification tasks [
11,
12,
13], while hybrid models have achieved accuracies close to 100% [
14]. However, these methods also involve substantial computational resources and large datasets to prevent overfitting, and their interpretation can pose considerable challenges.
A particular study [
15] proposed a diagnostic framework for coronary artery disease that combines ECG, PCG, and an associated coupling signal. Using data from 199 participants, the authors constructed recurrence plots (RPs) for each signal modality. These RPs were converted into image representations and supplied as inputs to a multi-branch 2D CNN. The resulting system achieved an accuracy of 95.96%, outperforming each single-modality input (80.41% for ECG, 86.41% for PCG, and 91.44% for the coupling signal).
Using extraction methods such as statistical, time-domain, frequency-domain, and nonlinear techniques can provide lightweight, interpretable solutions. For example, the Deep Layer Kernel Sparse Representation Network (DLKSRN) technique and similar models have exhibited classification accuracies between 82.5% and 97% [
16,
17,
18]. While feature-based approaches may not match deep learning in accuracy, they do provide valuable insights into the data and require substantially fewer computational resources.
3. Methodology
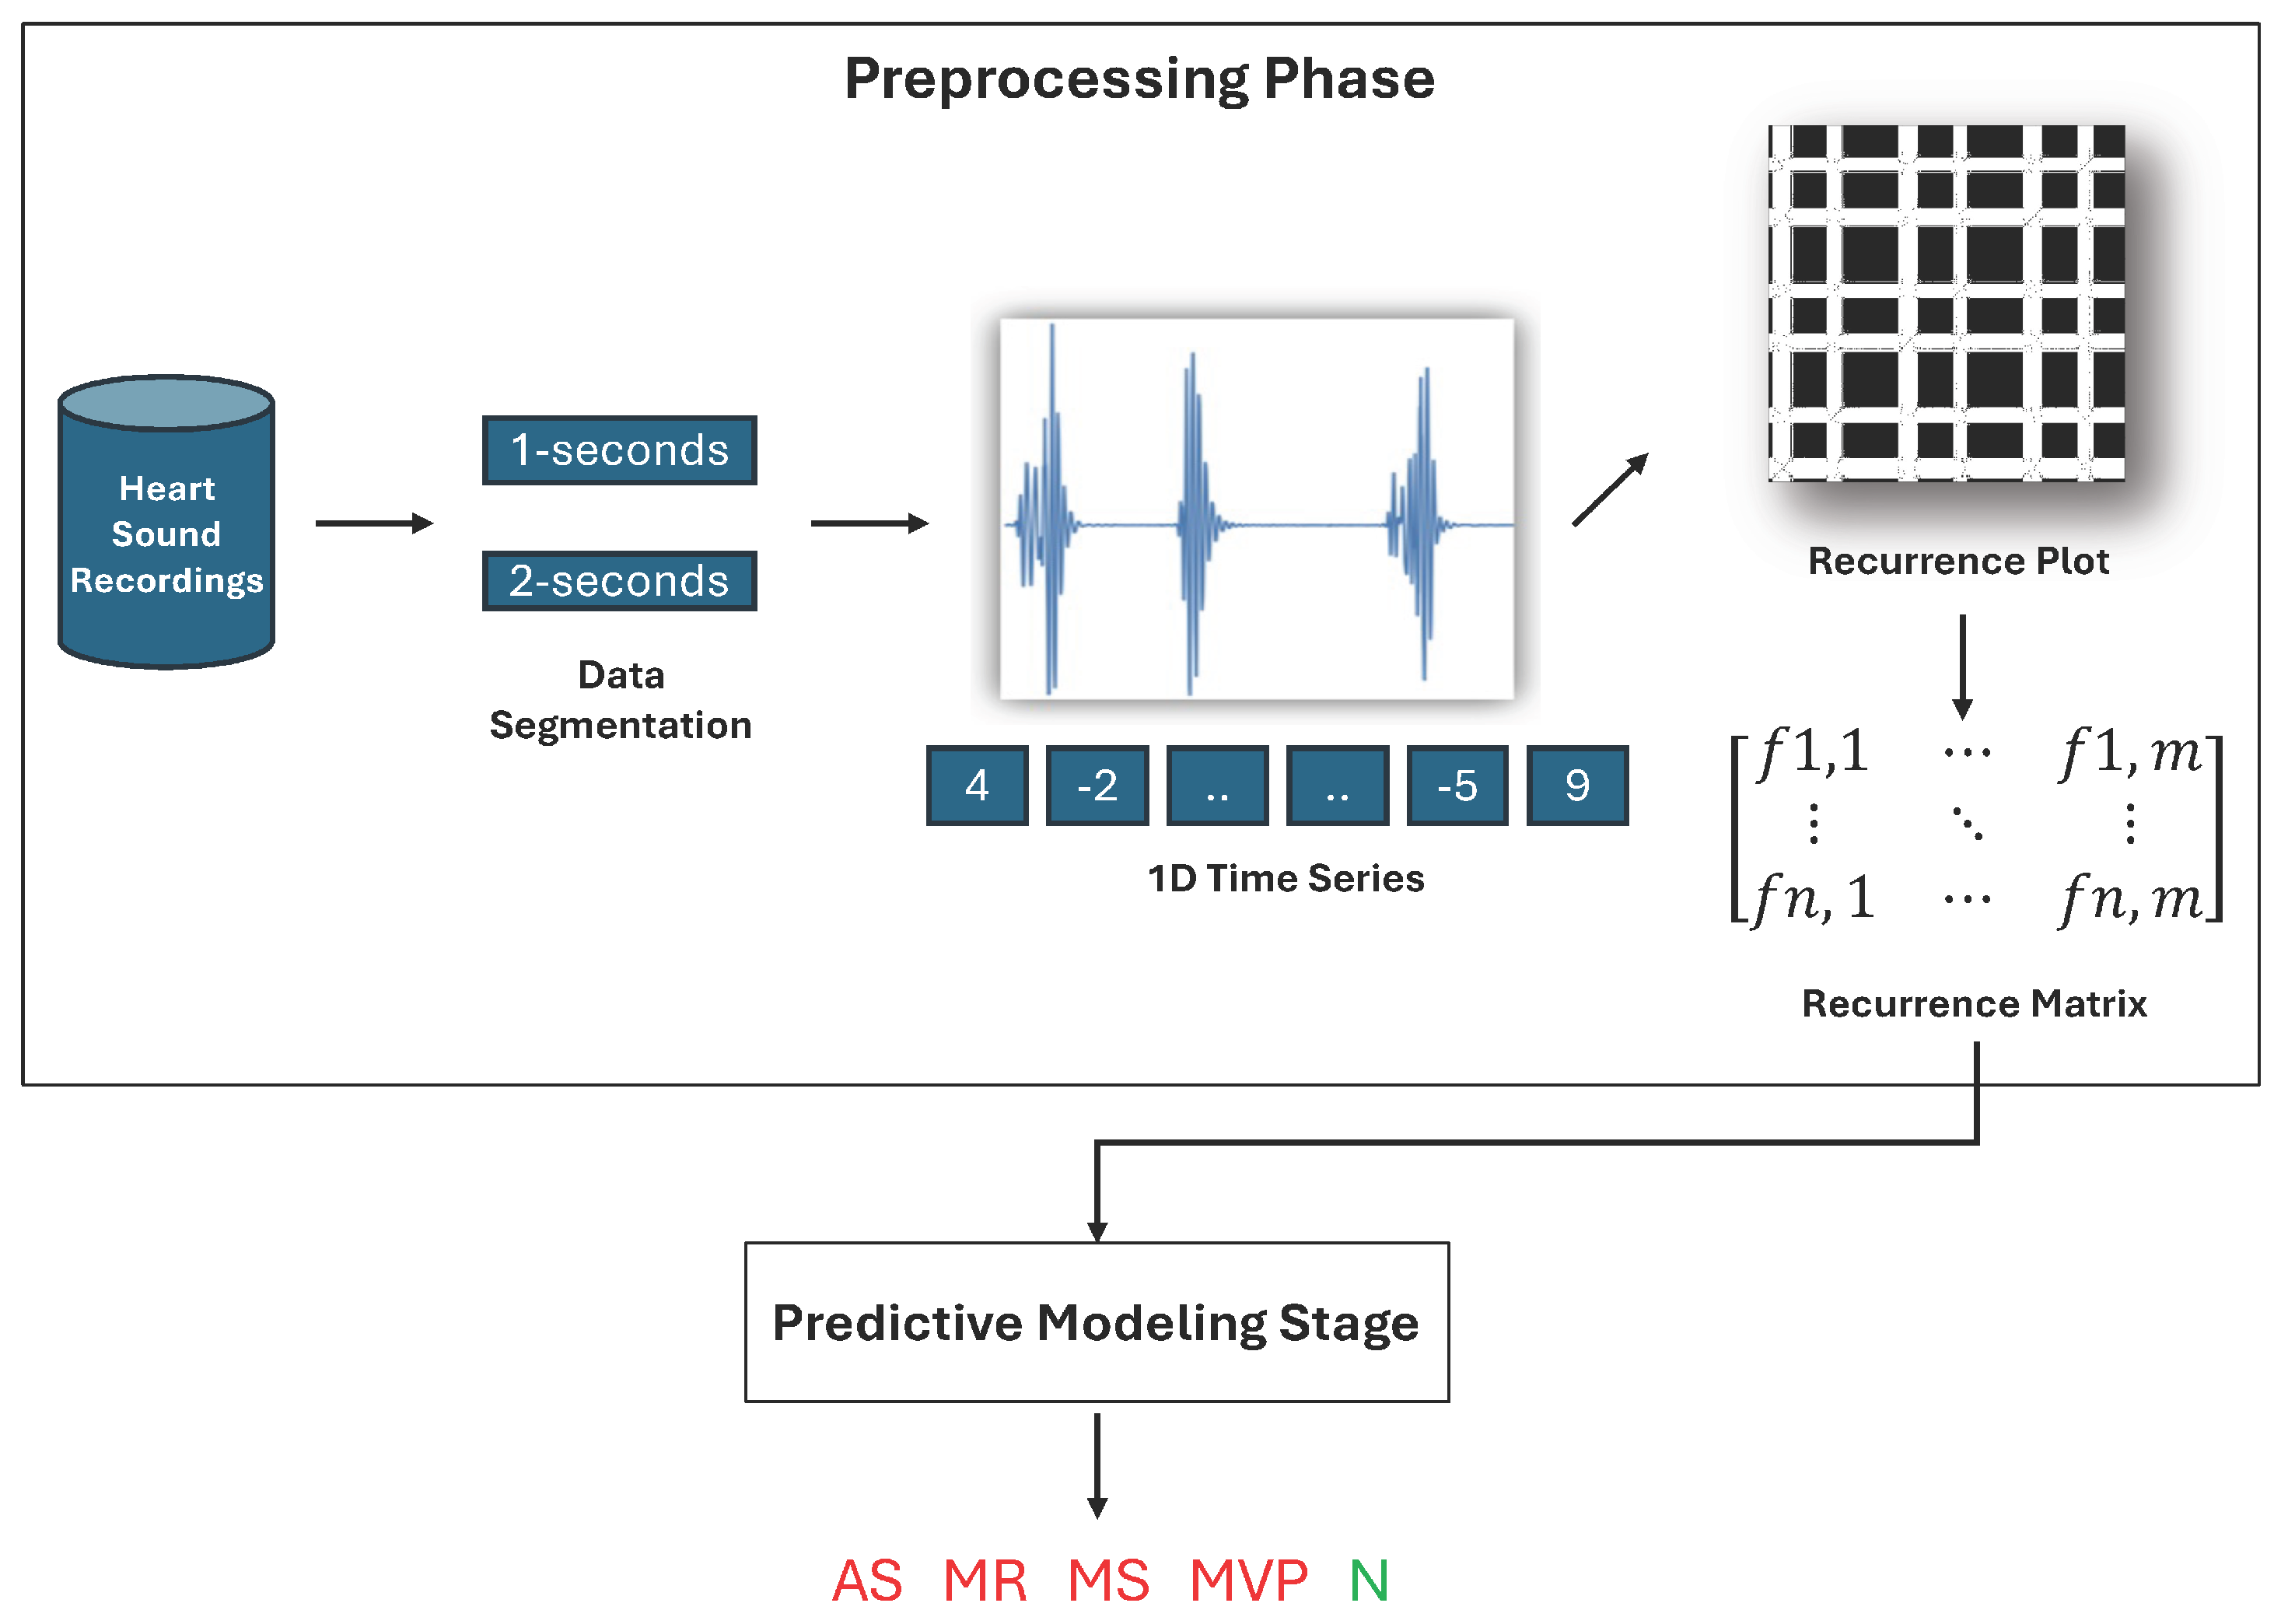
As illustrated in
Figure 1, the methodology begins by acquiring reference heart sound signals for processing using the RP technique. This transforms heart sound signals into visual representations, emphasizing the repetitive and dynamic structures as Recurrence Matrices (RMs). These matrices capture the essential information that may indicate specific cardiac conditions.
From each RM, 13 unique features that encapsulate the critical characteristics of the heart sounds are extracted and compiled into a structured dataset, with each row corresponding to a heart sound signal and each column representing a specific feature. In the predictive modeling stage, we employ classification models to classify heart sound signals using this dataset.
In multiclass classification, the models categorize signals into one of five classes: normal (N), aortic stenosis (AS), mitral regurgitation (MR), mitral stenosis (MS), or mitral valve prolapse (MVP). In addition, a binary classification is performed to distinguish between normal and abnormal signals.
This process enables effective differentiation between normal and pathological heart sounds by leveraging recurrence patterns extracted from the heart sound signals.
3.1. Dataset
This study utilized the Yassen2018 dataset proposed by [
9], comprising 1000 preprocessed phonocardiogram (PCG) recordings distributed evenly across five categories: aortic stenosis (AS), mitral stenosis (MS), mitral regurgitation (MR), mitral valve prolapse (MVP), and normal (N), with 200 recordings assigned to each class. The source material for this dataset originated from a variety of repositories, including medical textbooks and clinical archives, resulting in recordings with heterogeneous initial sampling frequencies. As mentioned in the dataset’s source, after thorough cross-checks to ensure data quality, recordings with extreme noise or artifacts are excluded. The remaining heart sound signals are resampled at 8000 Hz, converted to mono-channel format, and standardized to contain three cardiac cycles.
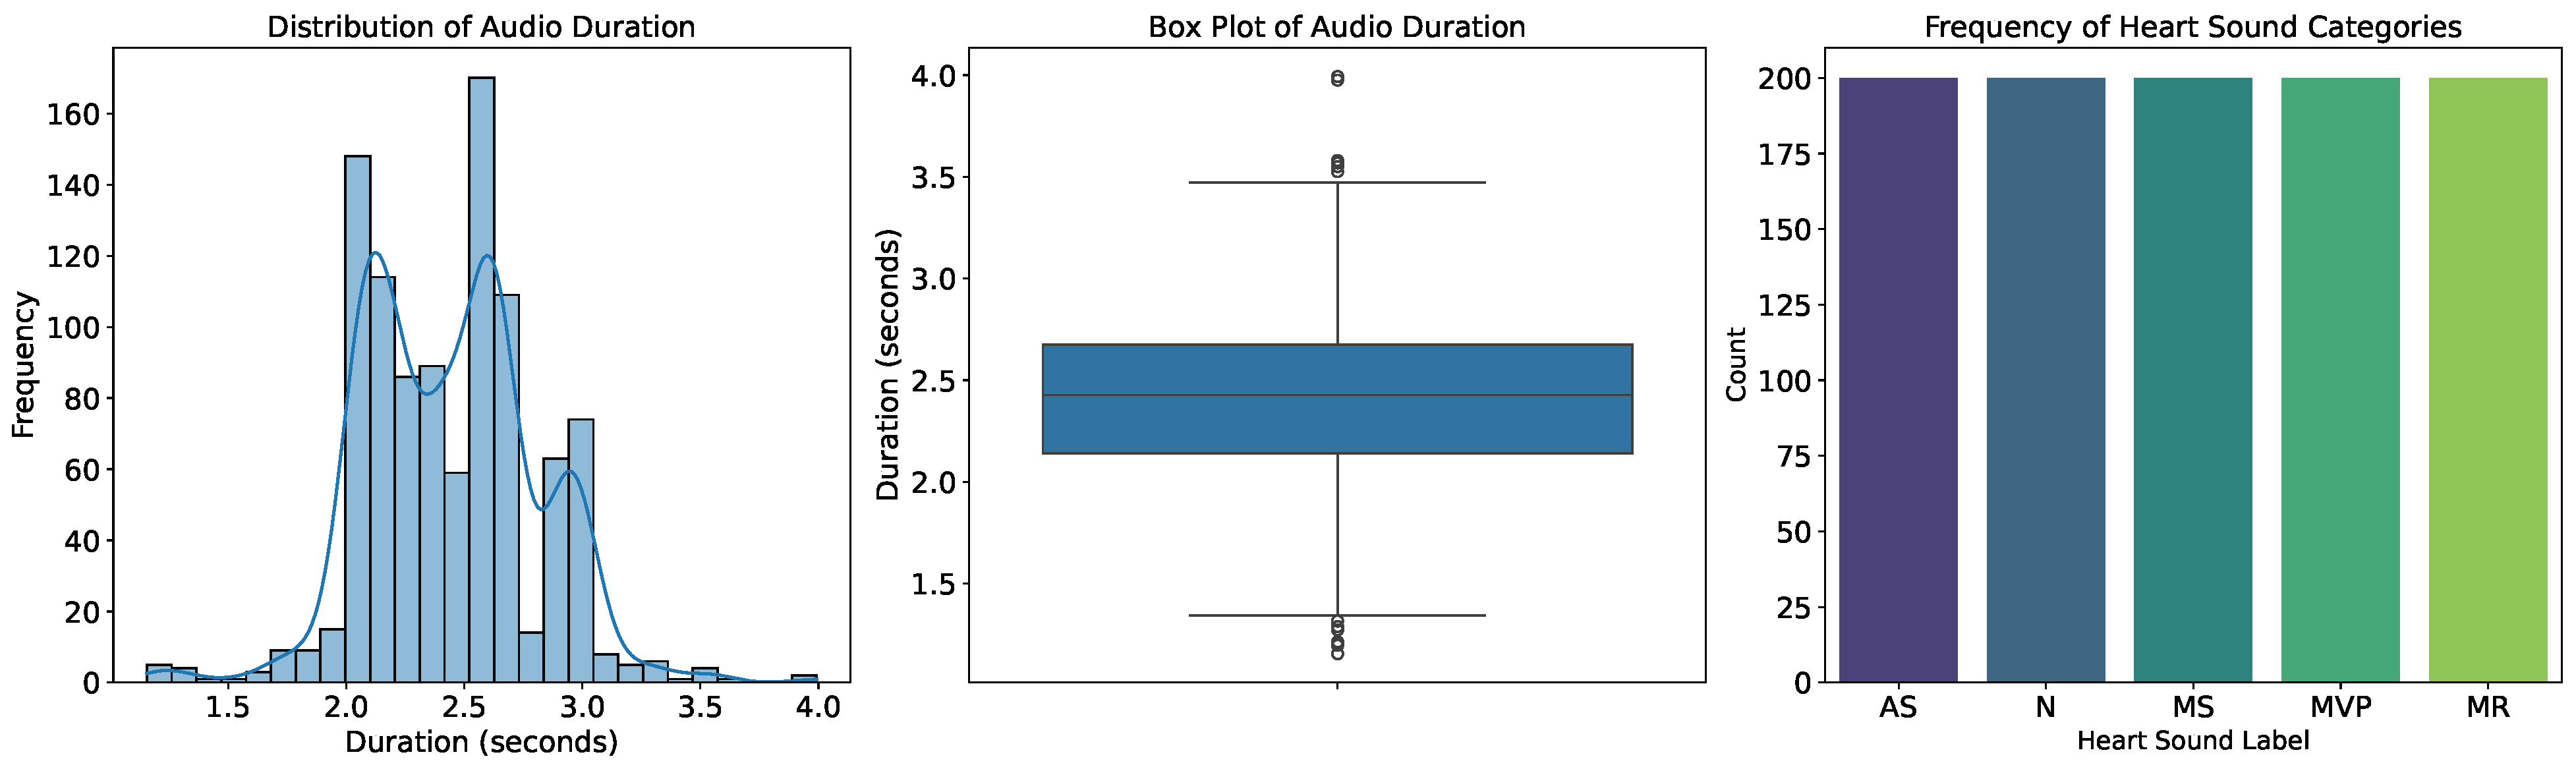
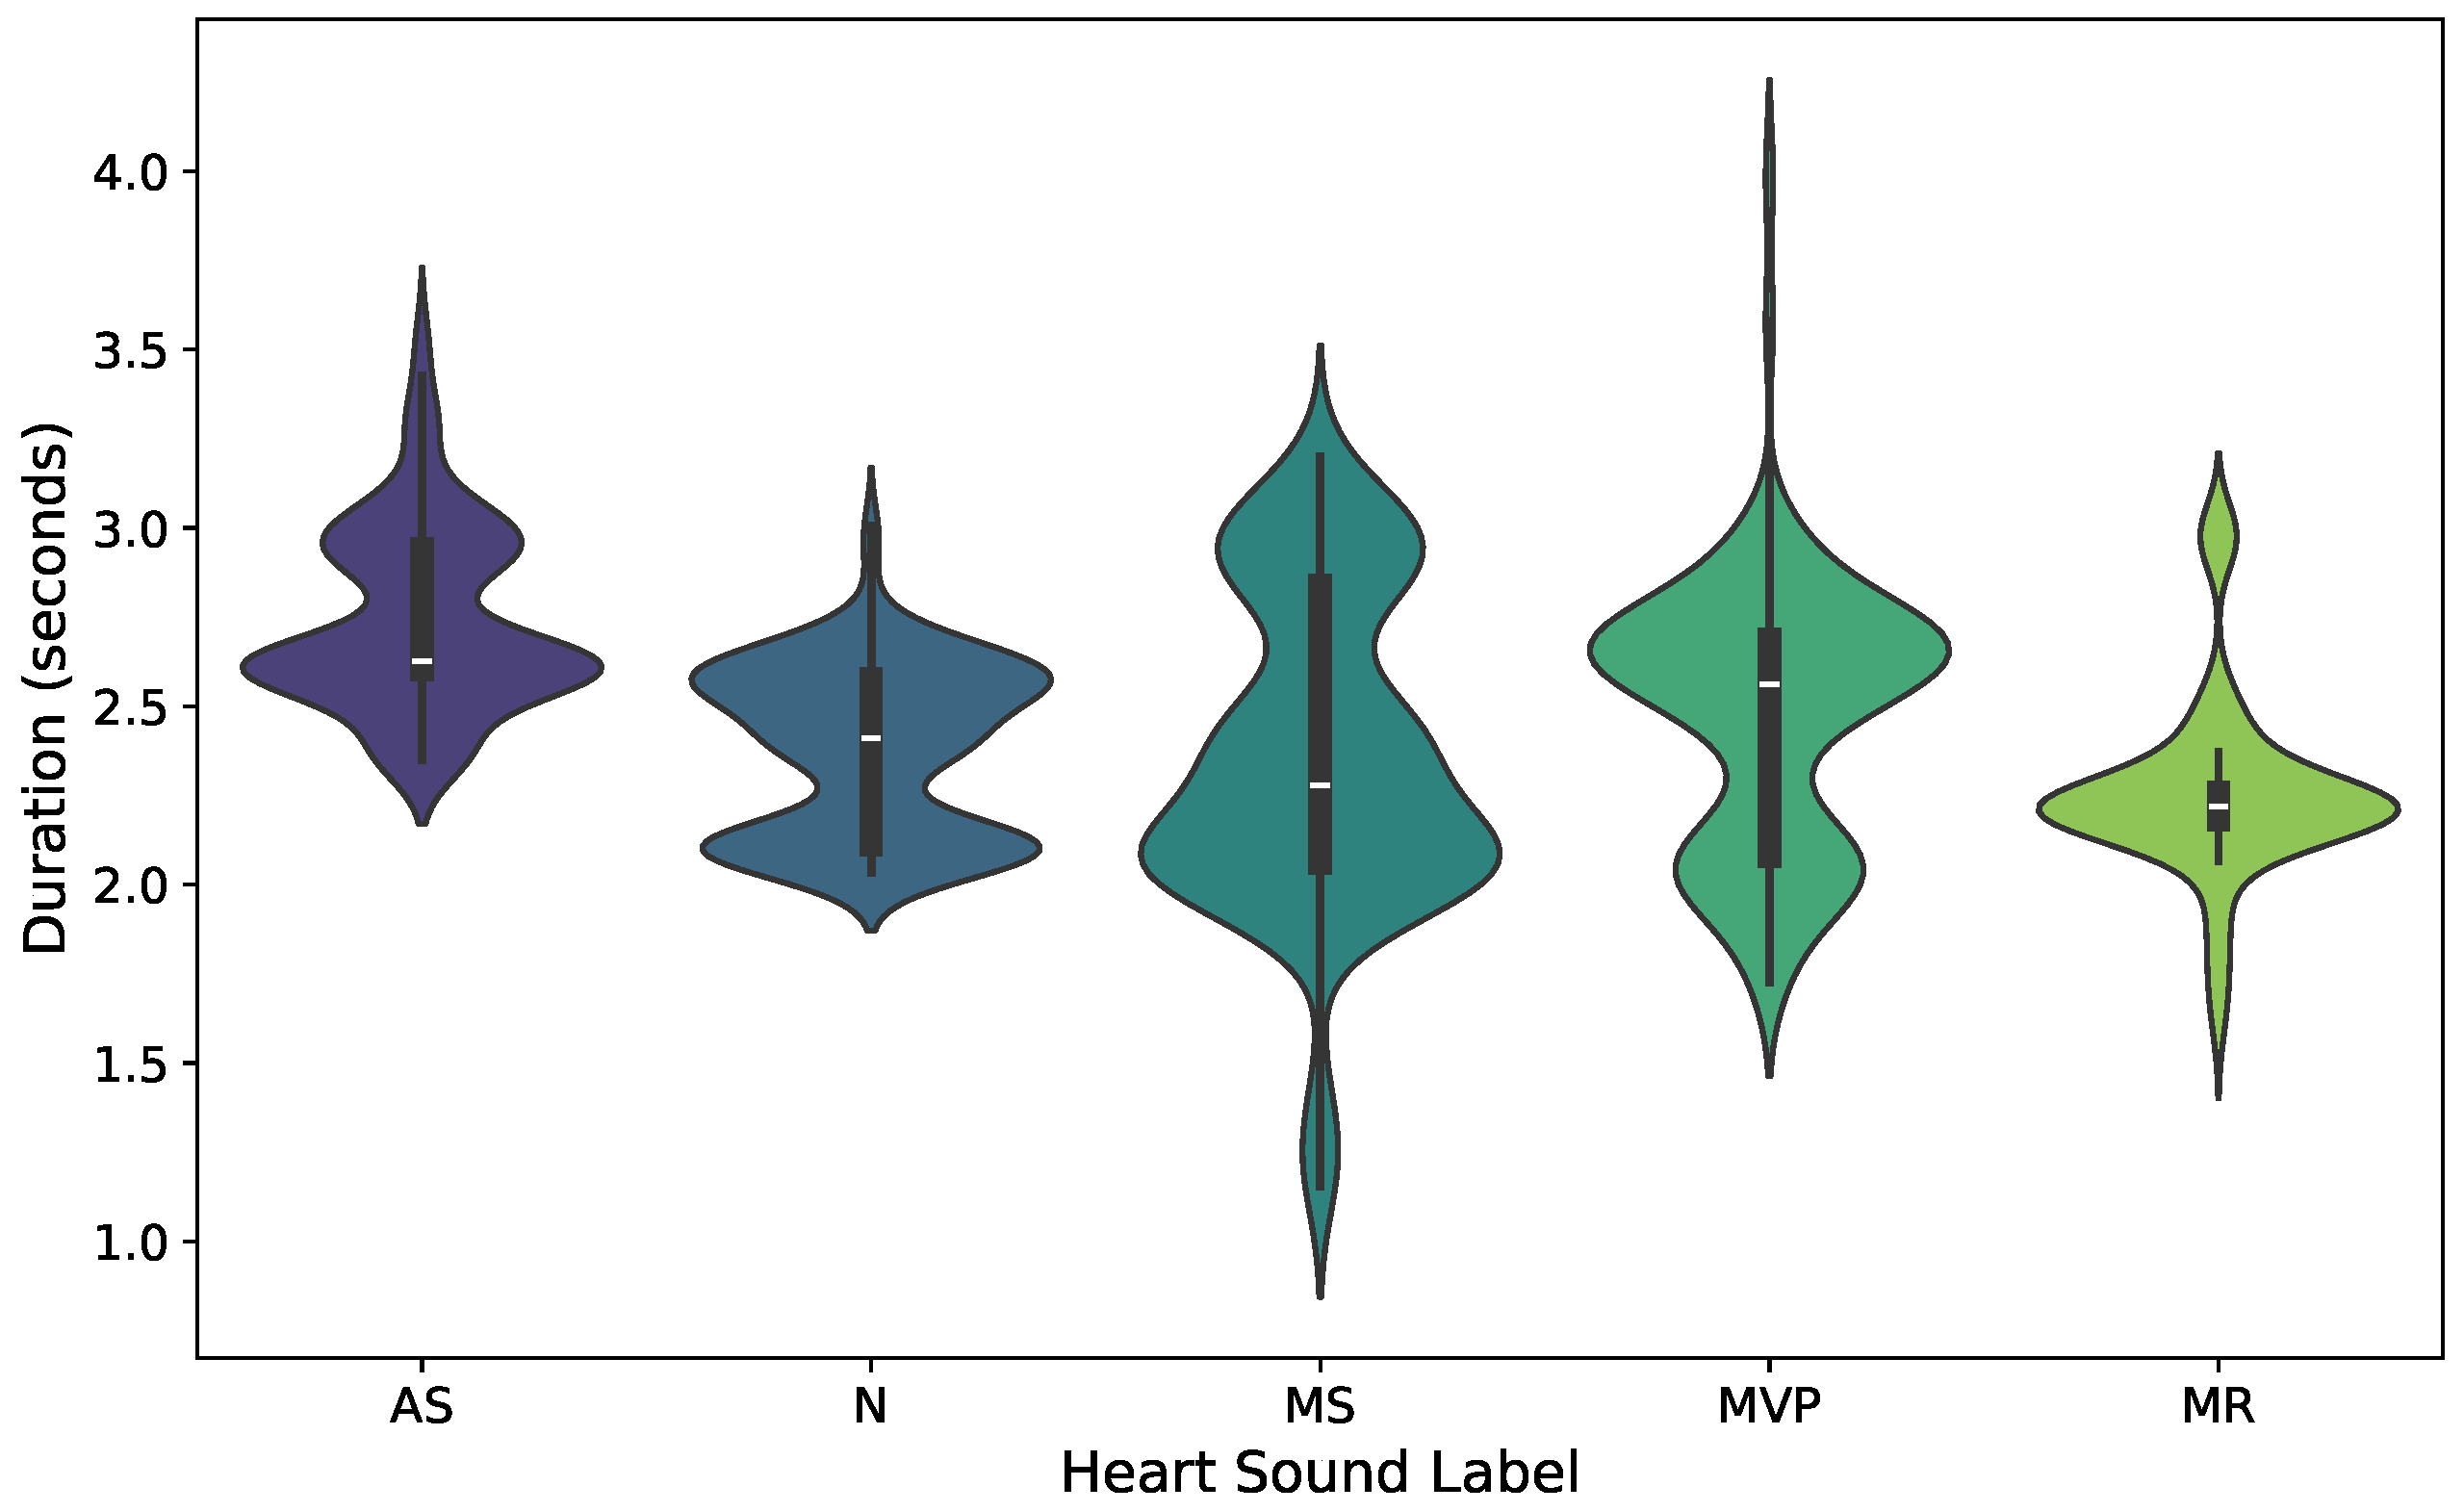
Figure 2 presents a comprehensive overview of the dataset’s primary characteristics. The dataset comprises 1000 audio recordings, predominantly in .wav format, organized into subfolders corresponding to specific heart sound classes. The target label is perfectly balanced, encompassing five distinct categories of cardiac auscultation sounds (AS, N, MS, MVP, MR), with each class represented by exactly 200 samples. The audio files generally have a consistent duration, averaging at 2.44 s and a slight standard deviation of 0.36 s. Durations range from a minimum of 1.16 s to a maximum of 3.99 s. We observed a slight right skew in the distribution, indicating a few longer audio files. Our visualizations, particularly the violin plots (
Figure 3), showed that while audio durations are quite similar across categories, there are subtle differences in the distribution of duration when grouped by heart sound label. As a result, we decided to unify those differences by creating two modes for the dataset: 1 s and 2 s segments. This class-balancing and duration restriction is particularly advantageous for training machine learning models, as it substantially reduces the potential issues associated with class imbalance.
For the 1 s segments, 200 samples per class were selected, which was feasible because every recording in the dataset was at least 1 s long. In contrast, for the 2 s segments, some classes lacked sufficient recordings to yield complete 2 s samples. To maintain class balance, the number of 2 s segment samples was therefore constrained to the smallest available count among all classes, as shown in
Table 1.
In binary classification, the dataset distribution differs from that in the multiclass setup. For each segment length (1 s and 2 s), 50 samples were assigned to each abnormal class (AS, MR, MS, MVP) to preserve balance across the abnormal categories. The normal class contained 200 samples for both segment durations to ensure adequate representation of normal heart sounds for distinguishing them from abnormal conditions. This balanced design, shown in
Table 2, maintains a realistic ratio of normal to abnormal cases while preventing class imbalance.
3.1.1. Recurrence Plot (RP)
Recurrence plots (RPs), first proposed by Eckmann et al. [
19], are employed to analyze time-series data by indicating when a dynamical system revisits similar states. As a graphical tool, RPs facilitate the observation and interpretation of complex system behavior, including nonlinear and potentially chaotic dynamics [
20]. Visualizing recurrence points can uncover patterns, cycles, and characteristic structures in the data, thereby simplifying the detection of repeated events and possible anomalies [
21].
Constructing an RP involves embedding a time series into a multi-dimensional phase space. This embedding reconstructs the system’s states at successive time instants; pairs of states that lie within a predefined threshold distance are classified as “recurring” and are indicated accordingly in the plot [
19].
RPs have demonstrated substantial utility across domains such as physiological signal analysis, climate research, and financial time series, enabling the identification of hidden periodicities, nonlinear behaviors, and related features. Through the visualization of recurrence, RPs provide crucial insights into a system’s structure and stability, thereby supporting a more comprehensive understanding of its evolution and dynamical properties [
20,
22,
23].
3.1.2. Applied Example Using Recurrence Plot
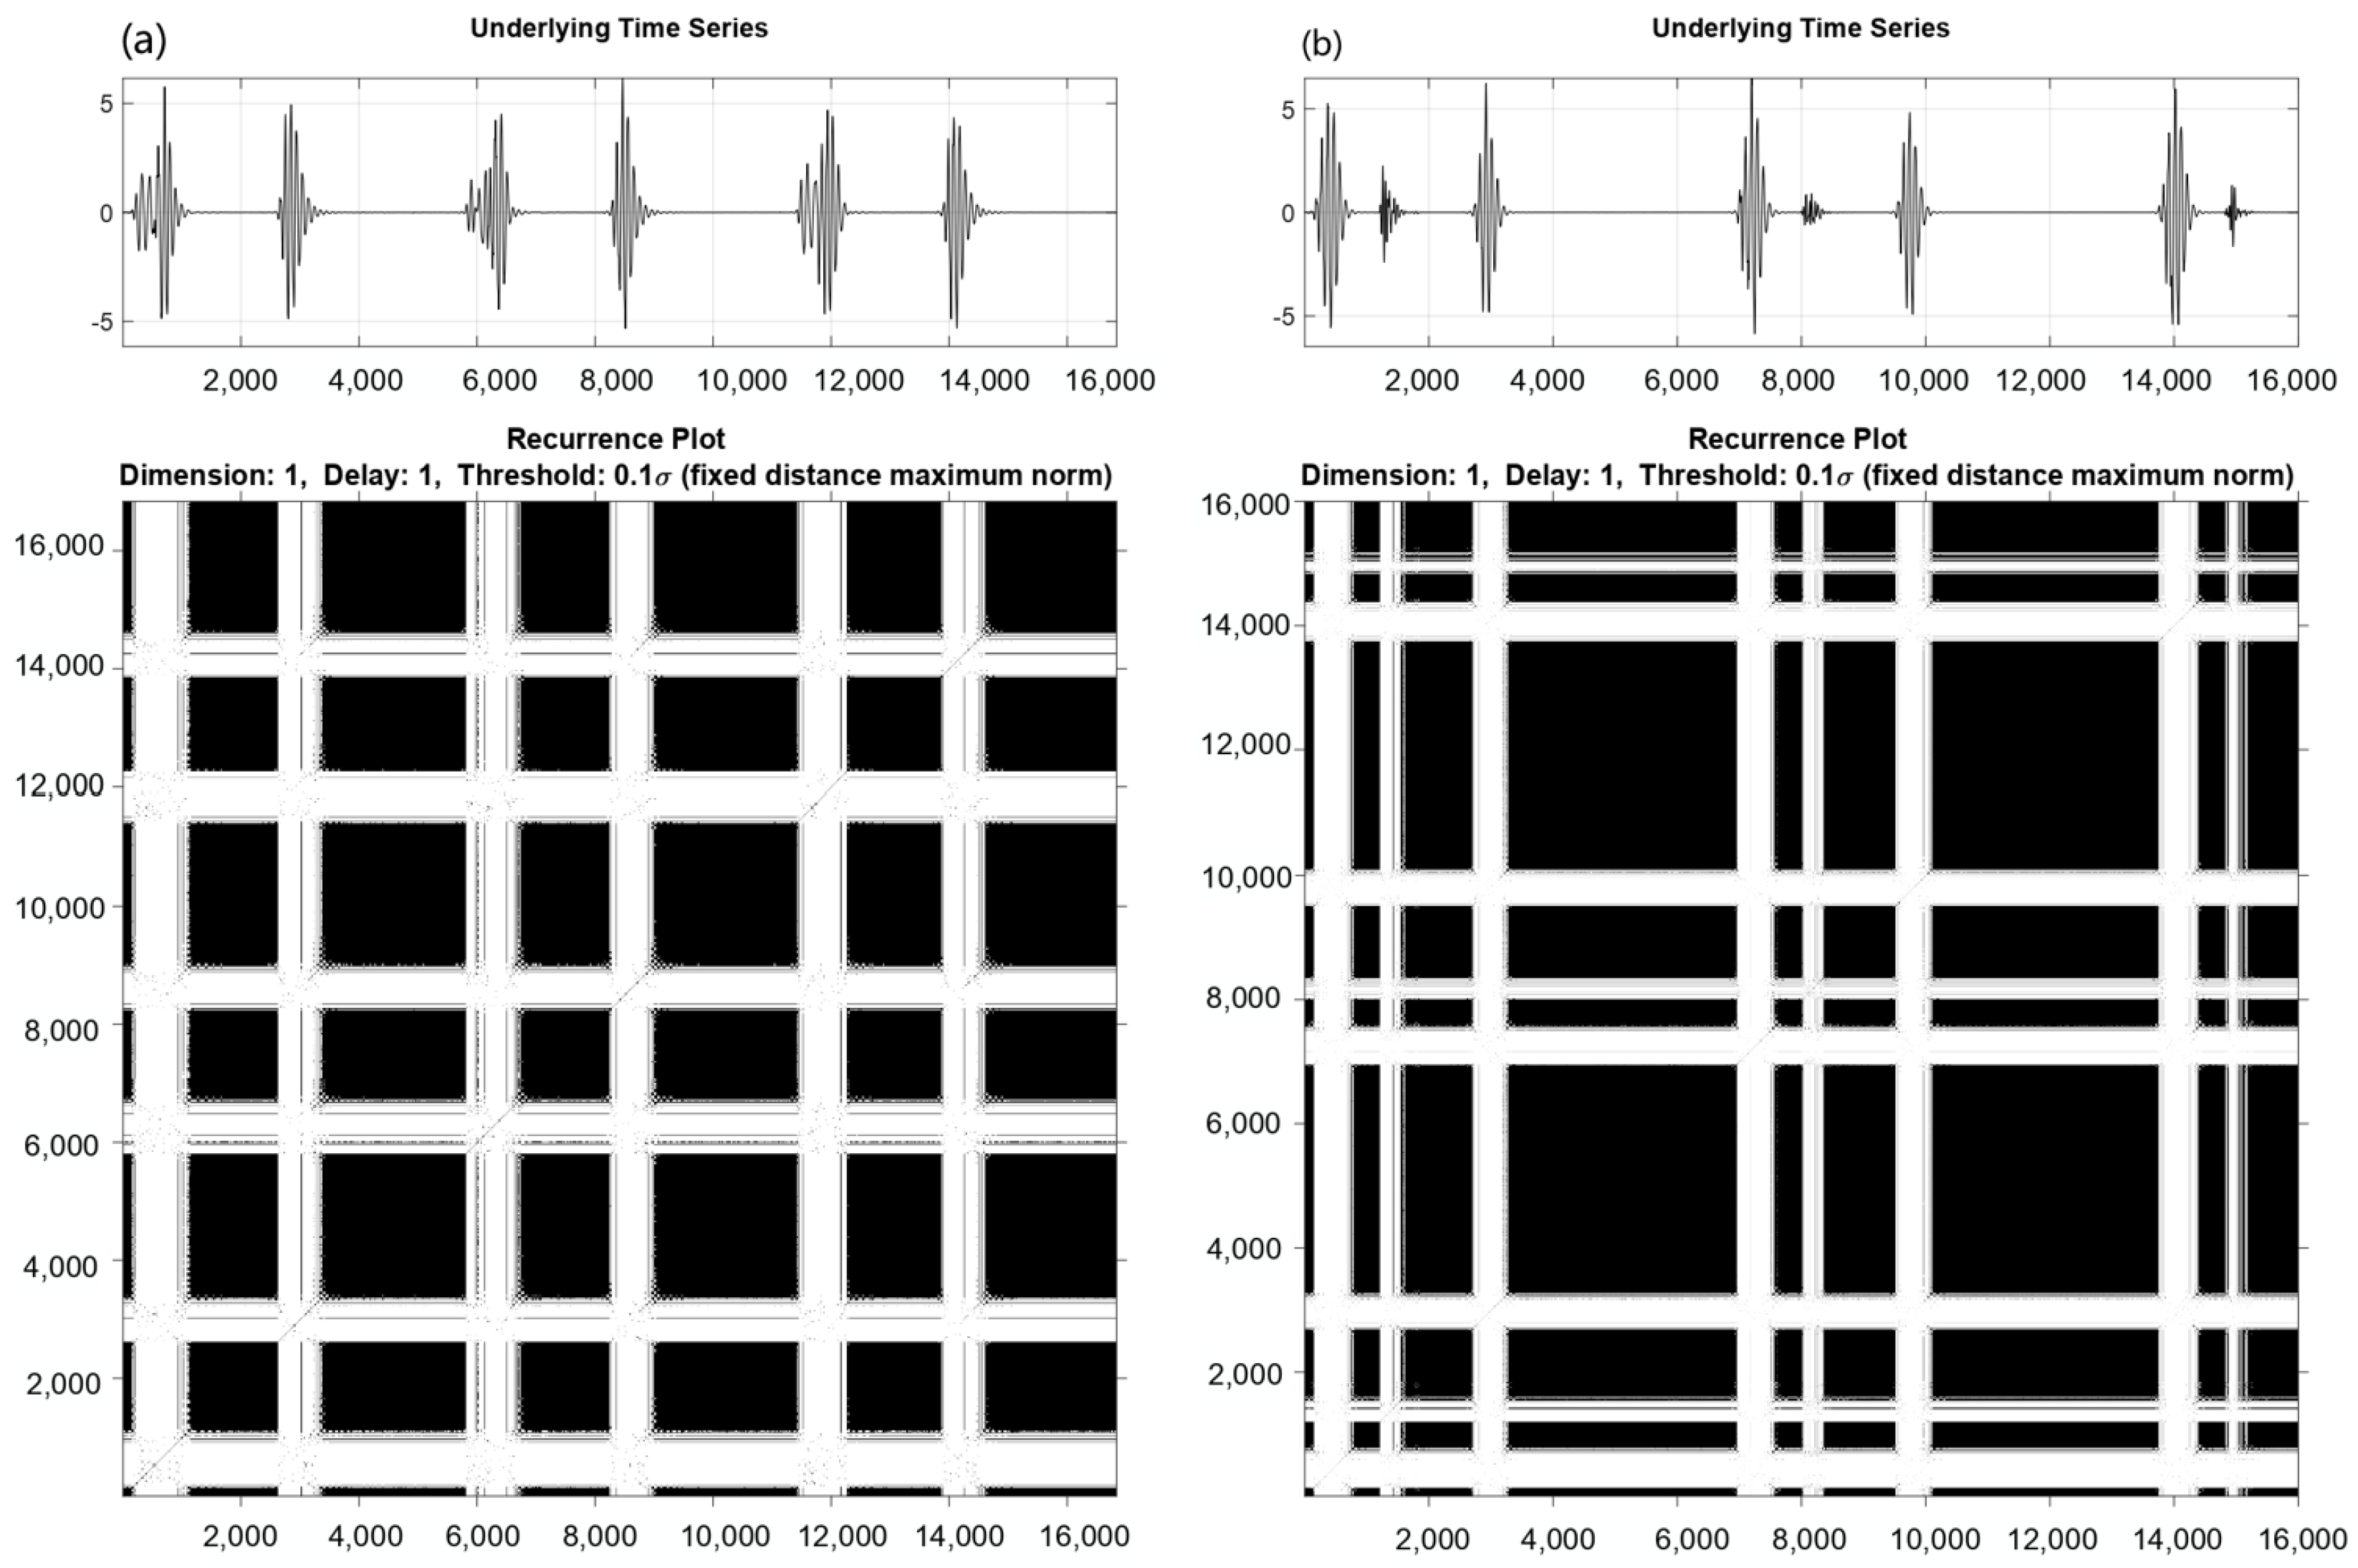
Figure 4 provides a visual comparison of time series and recurrence plots for two heart signals: (a) a normal heart signal and (b) a Mitral Valve Prolapse (MVP) heart signal. The recurrence plot for (a) the normal heart signal shows a highly structured, grid-like pattern. This plot is characterized by diagonal lines indicating the signal returns to similar states at regular intervals. These lines represent the stable, periodic rhythm typical of a healthy heart. Each heartbeat is consistent in timing and structure, represented by evenly spaced blocks in the grid that reflect the heartbeat cycle. The sparse areas are intervals where the heart is in a different state, such as the silent period between “lub-dub” sounds. The regular spacing of the sparse regions reinforces the steady, predictable rhythm of a healthy heartbeat, with no signs of irregularity.
In contrast, the recurrence plot (b) for the MVP heart signal shows a fragmented, less structured pattern. The recurrence plot shows irregularities, illustrating how unpredictable and inconsistent the nature of MVP-related heartbeats can be. Unlike the clear, periodic patterns in the normal heart signal, the MVP signal lacks evenly spaced blocks or consistent intervals. This plot suggests that the heart does not return to similar states with the same regularity, highlighting the variability and complexity in timing and structure. Visual distinctions like this demonstrate the effectiveness of recurrence plots in capturing and highlighting the unique rhythm characteristics of heart conditions, as well as in offering insights for diagnosis and classification.
3.1.3. Key Equations in Recurrence Plot
This equation represents the embedding of a 1D time series into an m-dimensional phase space vector , where is the time delay. This process reconstructs the system’s dynamics, thereby preserving its temporal structure.
- 2.
Distance calculation
This function computes the Euclidean distance between two points,
and
, within the reconstructed phase space defined in Equation (
1). The result quantifies the similarity between the system’s states at two different times.
- 3.
Recurrence plot
Here, is the Heaviside function, and is a predefined threshold. If the distance is less than , then (a recurrence); otherwise, . This function constructs a binary matrix that indicates when the system returns to a previous state.
These recurrence plots are then subjected to recurrence quantification analysis (RQA) to extract a comprehensive set of 13 statistically and physiologically meaningful features.
3.1.4. Feature Extraction
From each recurrence matrix, 13 statistical features (as described in
Table 3) are extracted to characterize the heart sound recordings. These features are derived using recurrence quantification analysis (RQA) and include the following:
These features, when combined, capture both the temporal and structural dynamics of heart sound signals and serve as input to the predictive modeling phase.
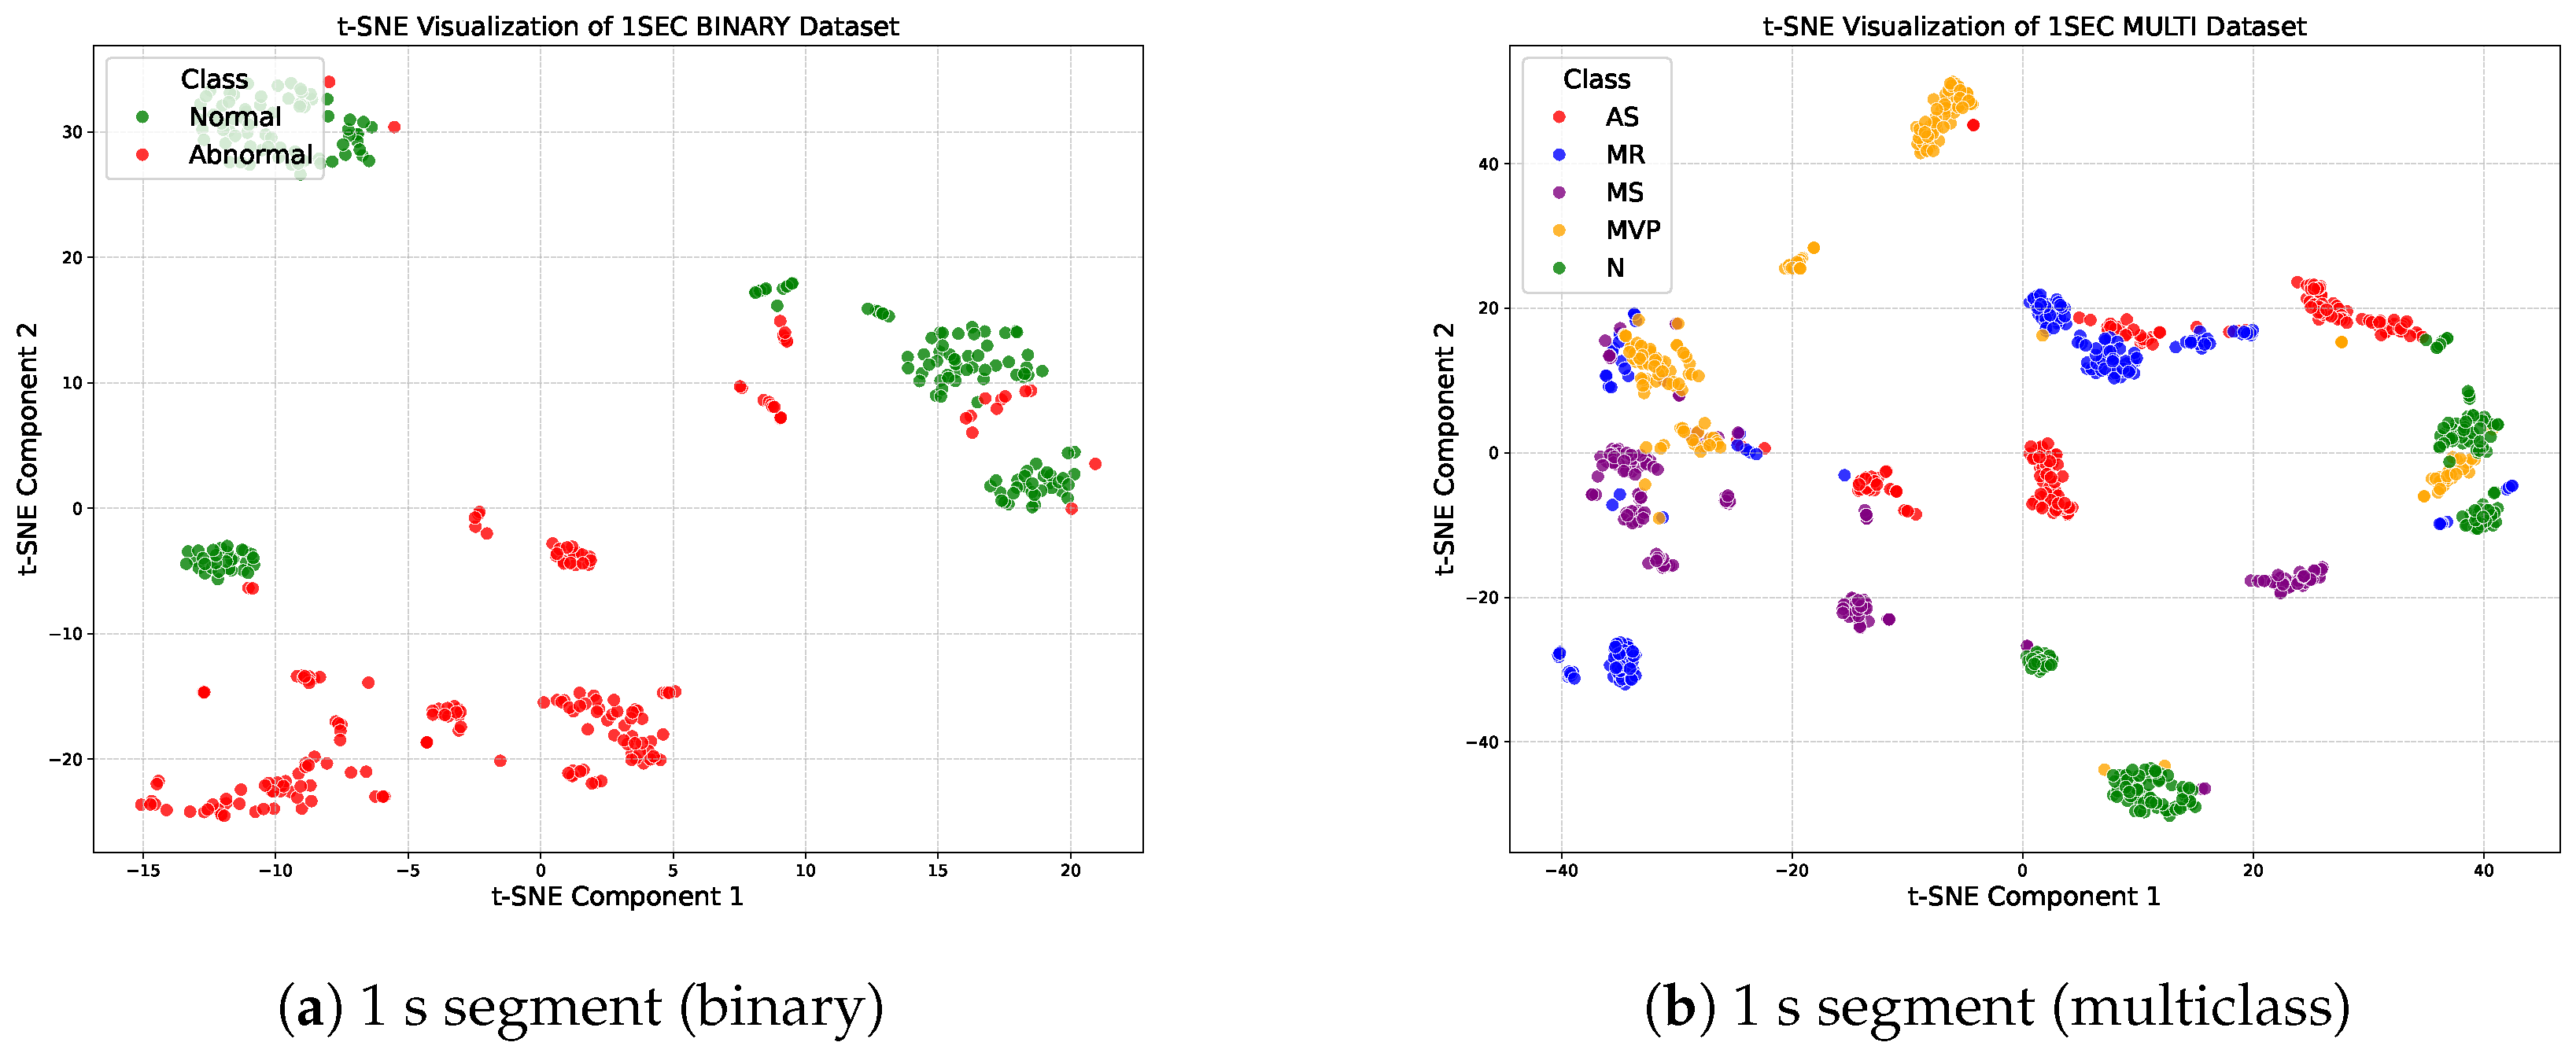
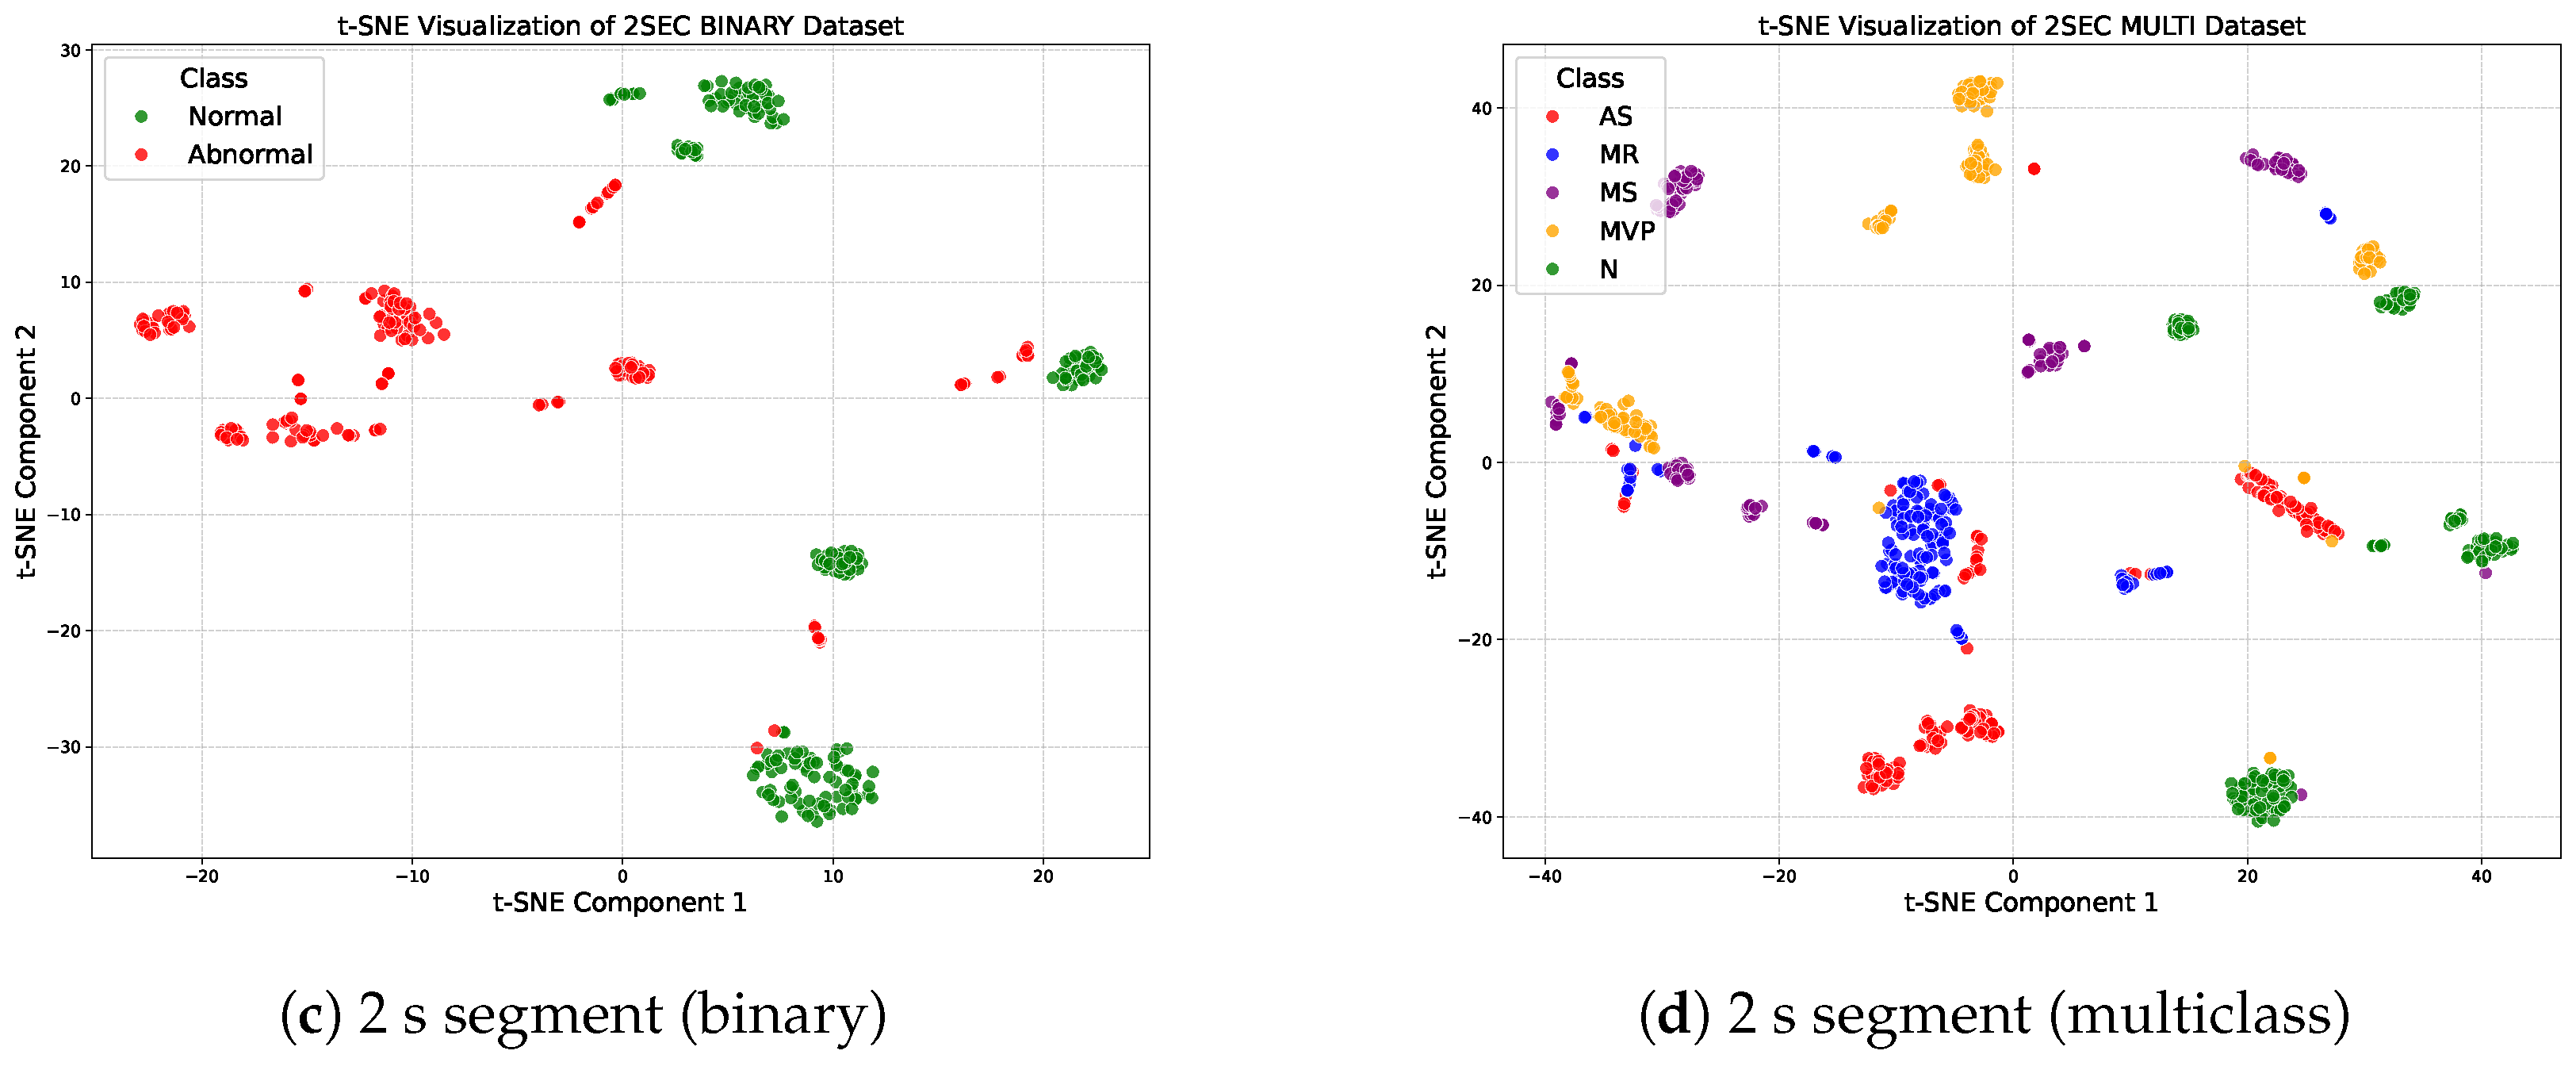
To assess how well the 13 extracted recurrence plot features discriminate between classes, we employed t-SNE for visualization.
Figure 5 shows the resulting feature-space projections for segment lengths of 1 s and 2 s for both binary and multiclass classification problems. These visualizations illustrate how samples corresponding to different cardiac conditions are arranged in the reduced two-dimensional space according to their recurrence plot feature values. The binary settings (
Figure 5a,b) highlight the spatial distribution of normal versus abnormal samples. The emergence of clear clustering structures suggests that the recurrence plot features effectively encode discriminative information about different cardiac conditions, supporting their use in machine learning classification. In the multiclass settings (
Figure 5b,c), the five cardiac categories form recognizable clusters with varying levels of separation. The observed cluster organization also provides insight into feature quality and the relative challenge of distinguishing among cardiac pathologies using recurrence-plot-based analysis.
3.2. Predictive Modeling Phase
In this phase, the extracted features are used for classification. The predictive modeling stage aims to classify each heart sound segment into one of five classes for multiclass classification (normal (N), aortic stenosis (AS), mitral regurgitation (MR), mitral stenosis (MS), and mitral valve prolapse (MVP)), and into two classes for binary classification (normal or abnormal).
3.2.1. Classification Models
Different machine learning classifiers (e.g., Random Forest, Support Vector Machine (SVM), Decision Tree, and K-Nearest Neighbors (KNNs)) are employed to predict the class of each segment.
Random Forest (RF): An ensemble method that mitigates overfitting by averaging predictions from multiple decision trees, making it robust to complex feature interactions in the RP-based dataset. We chose it for its high accuracy and resilience in handling high-dimensional data with intricate patterns.
Support Vector Machine (SVM): SVM seeks the optimal hyperplane that maximizes the margin between classes, making it well suited to high-dimensional, complex datasets such as the RP-based feature set. Its adaptability with different kernels makes it effective for capturing nonlinear boundaries, which aligns well with our classification needs.
Decision Tree (DT): DT classifiers split data based on feature values, producing an interpretable model that highlights feature importance. As a straightforward, rule-based approach, it serves as a baseline model, allowing us to assess how effectively simple decisions can classify heart sound classes.
K-Nearest Neighbors (KNNs): KNN classifies data points based on the majority class among the K-Nearest Neighbors in the feature space. Its performance depends on the choice of k and the data’s distribution, which were optimized using cross-validation. Note that this particular algorithm supported the evaluation of the clustering tendencies of heart sound classes in the RP-based feature space.
3.2.2. K-Fold Cross-Validation Strategy
For robust model evaluation, a 5-fold cross-validation strategy was used: the dataset was partitioned into 5 equal subsets, with each subset serving once as a validation set and the remaining 4 for training. This process was repeated 5 times, with each fold capturing a different subset of the data. This strategy reduced the risk of model overfitting and was used to assess the models’ generalizability.
For each classifier, the average performance metrics across the five folds were computed to assess model effectiveness in multiclass and binary classification tasks. This approach ensured robust results that reflected the model’s performance across varied data splits.
4. Experimental Results
This section reports the performance of several machine learning algorithms for classifying heart sounds into multiple categories (AS, MR, MS, MVP, and N) and for binary classification (normal vs. abnormal). The models were evaluated on two datasets, and the evaluation metrics included mean accuracy, precision, recall, F1 score, and confusion matrices computed across all folds. These results provide a comprehensive assessment of each model’s classification performance.
4.1. Multiclass Classification Results
Table 4 illustrates how the use of 2 s segments significantly improves the performance of the model compared to the use of 1 s segments. This indicates that longer time windows mean better contextual information for classification. KNN, for example, consistently achieves the highest accuracy (95.9% to 98.44%), followed by Random Forest (94.5% to 97.66%); SVM and Decision Tree, on the other hand, improved with longer windows but remained less effective. These results highlight the superior performance of KNN and the robustness of Random Forest. Further investigation into optimal segment lengths may reveal additional performance gains beyond 2 s.
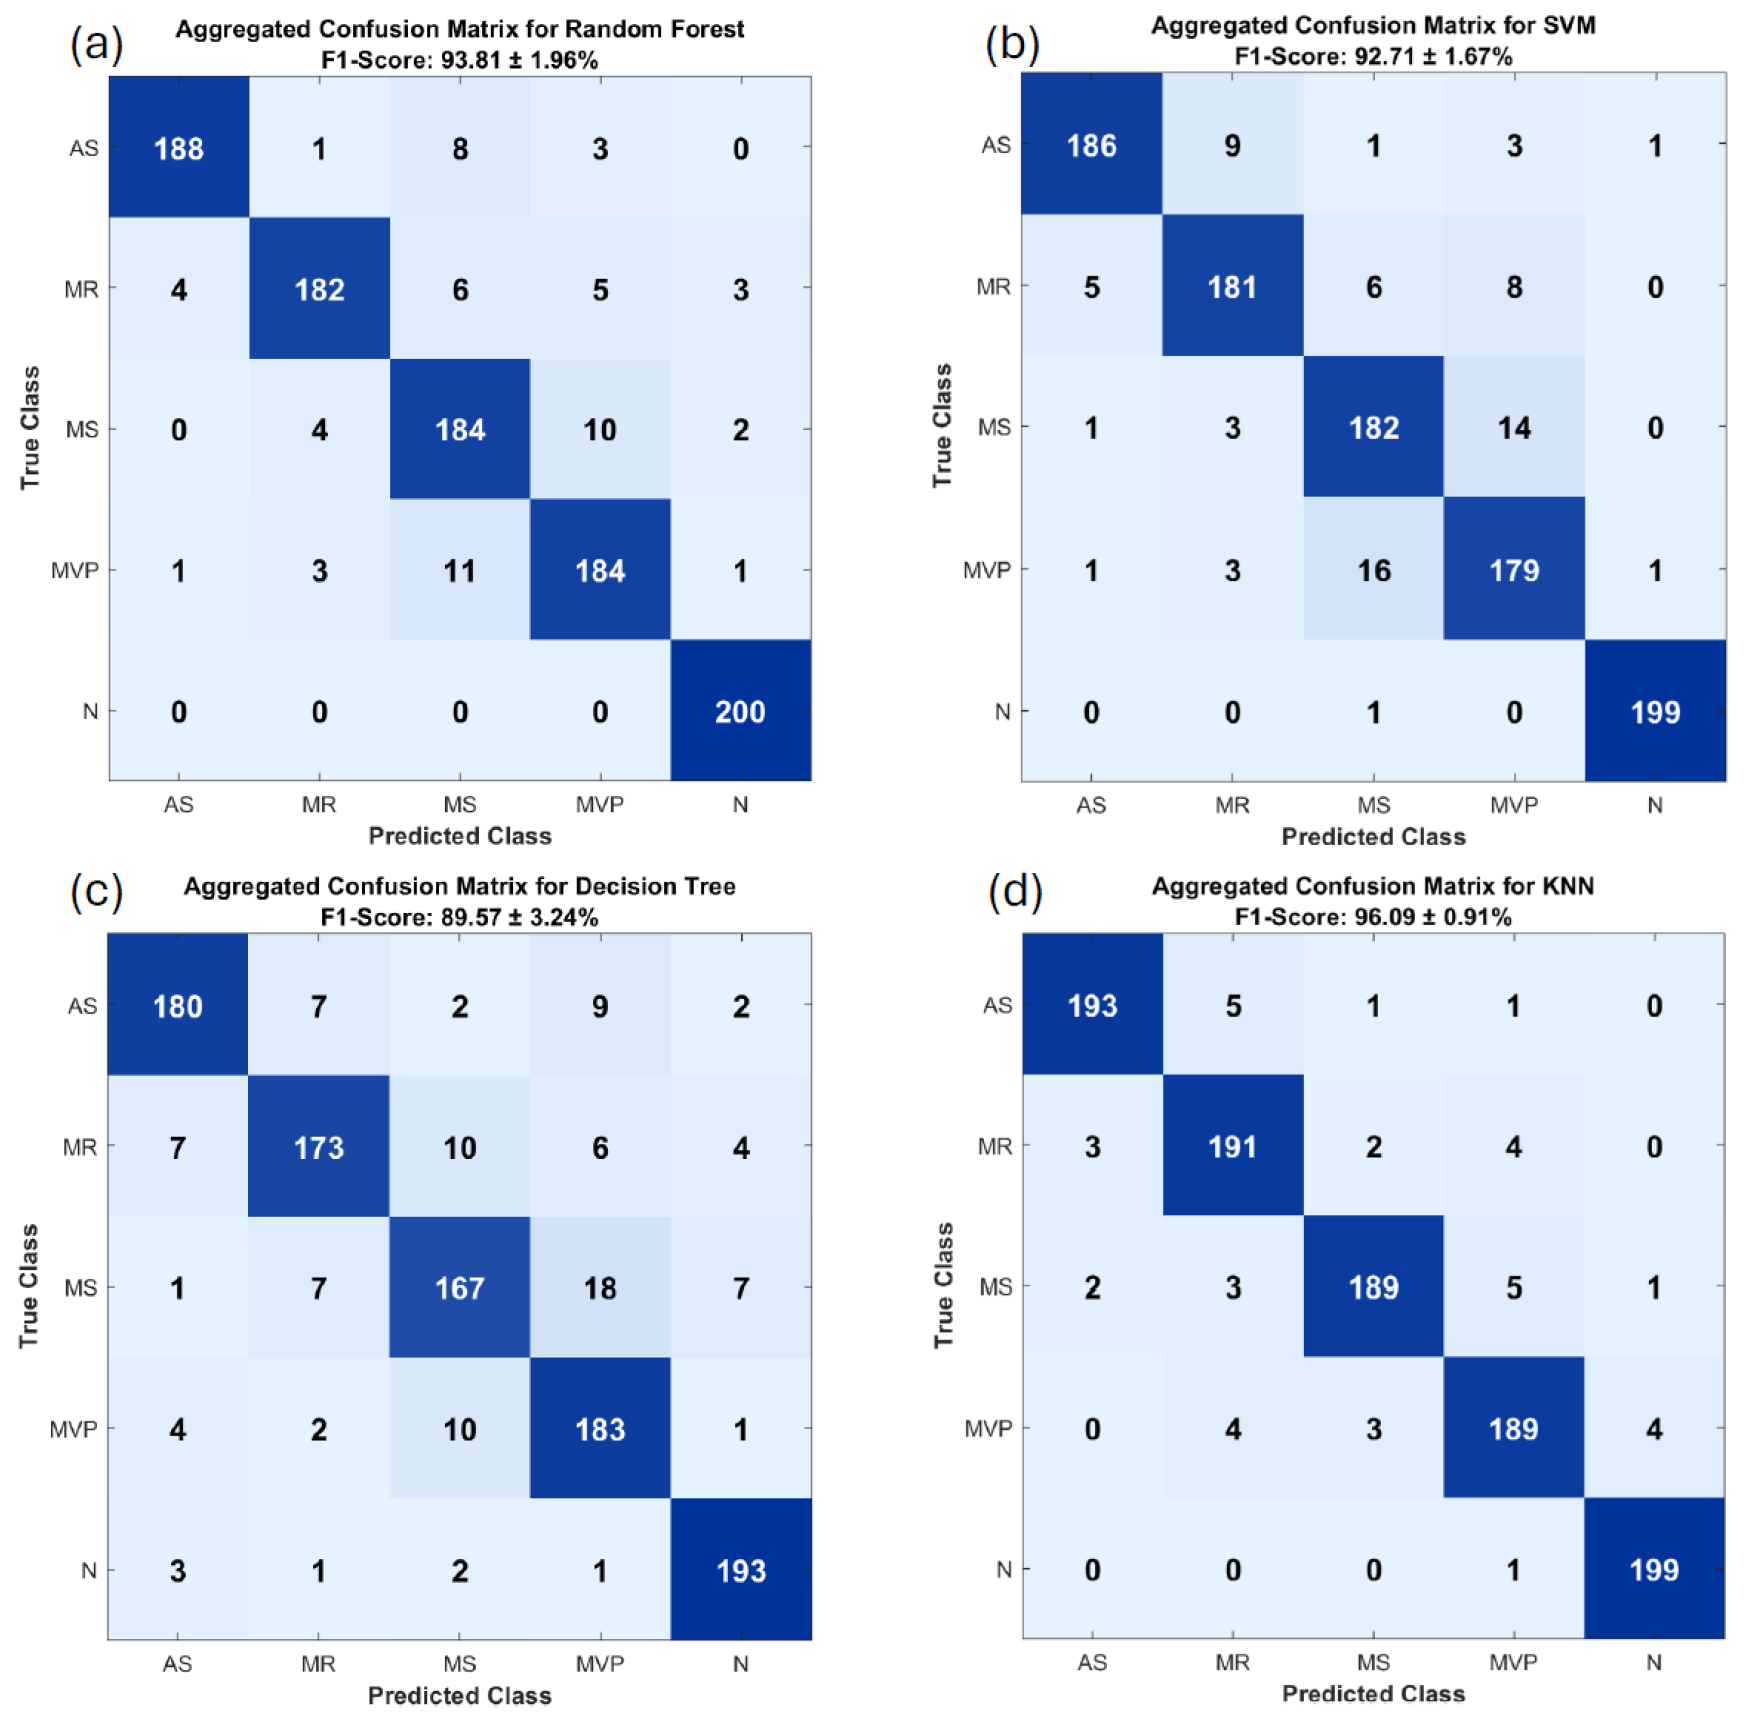
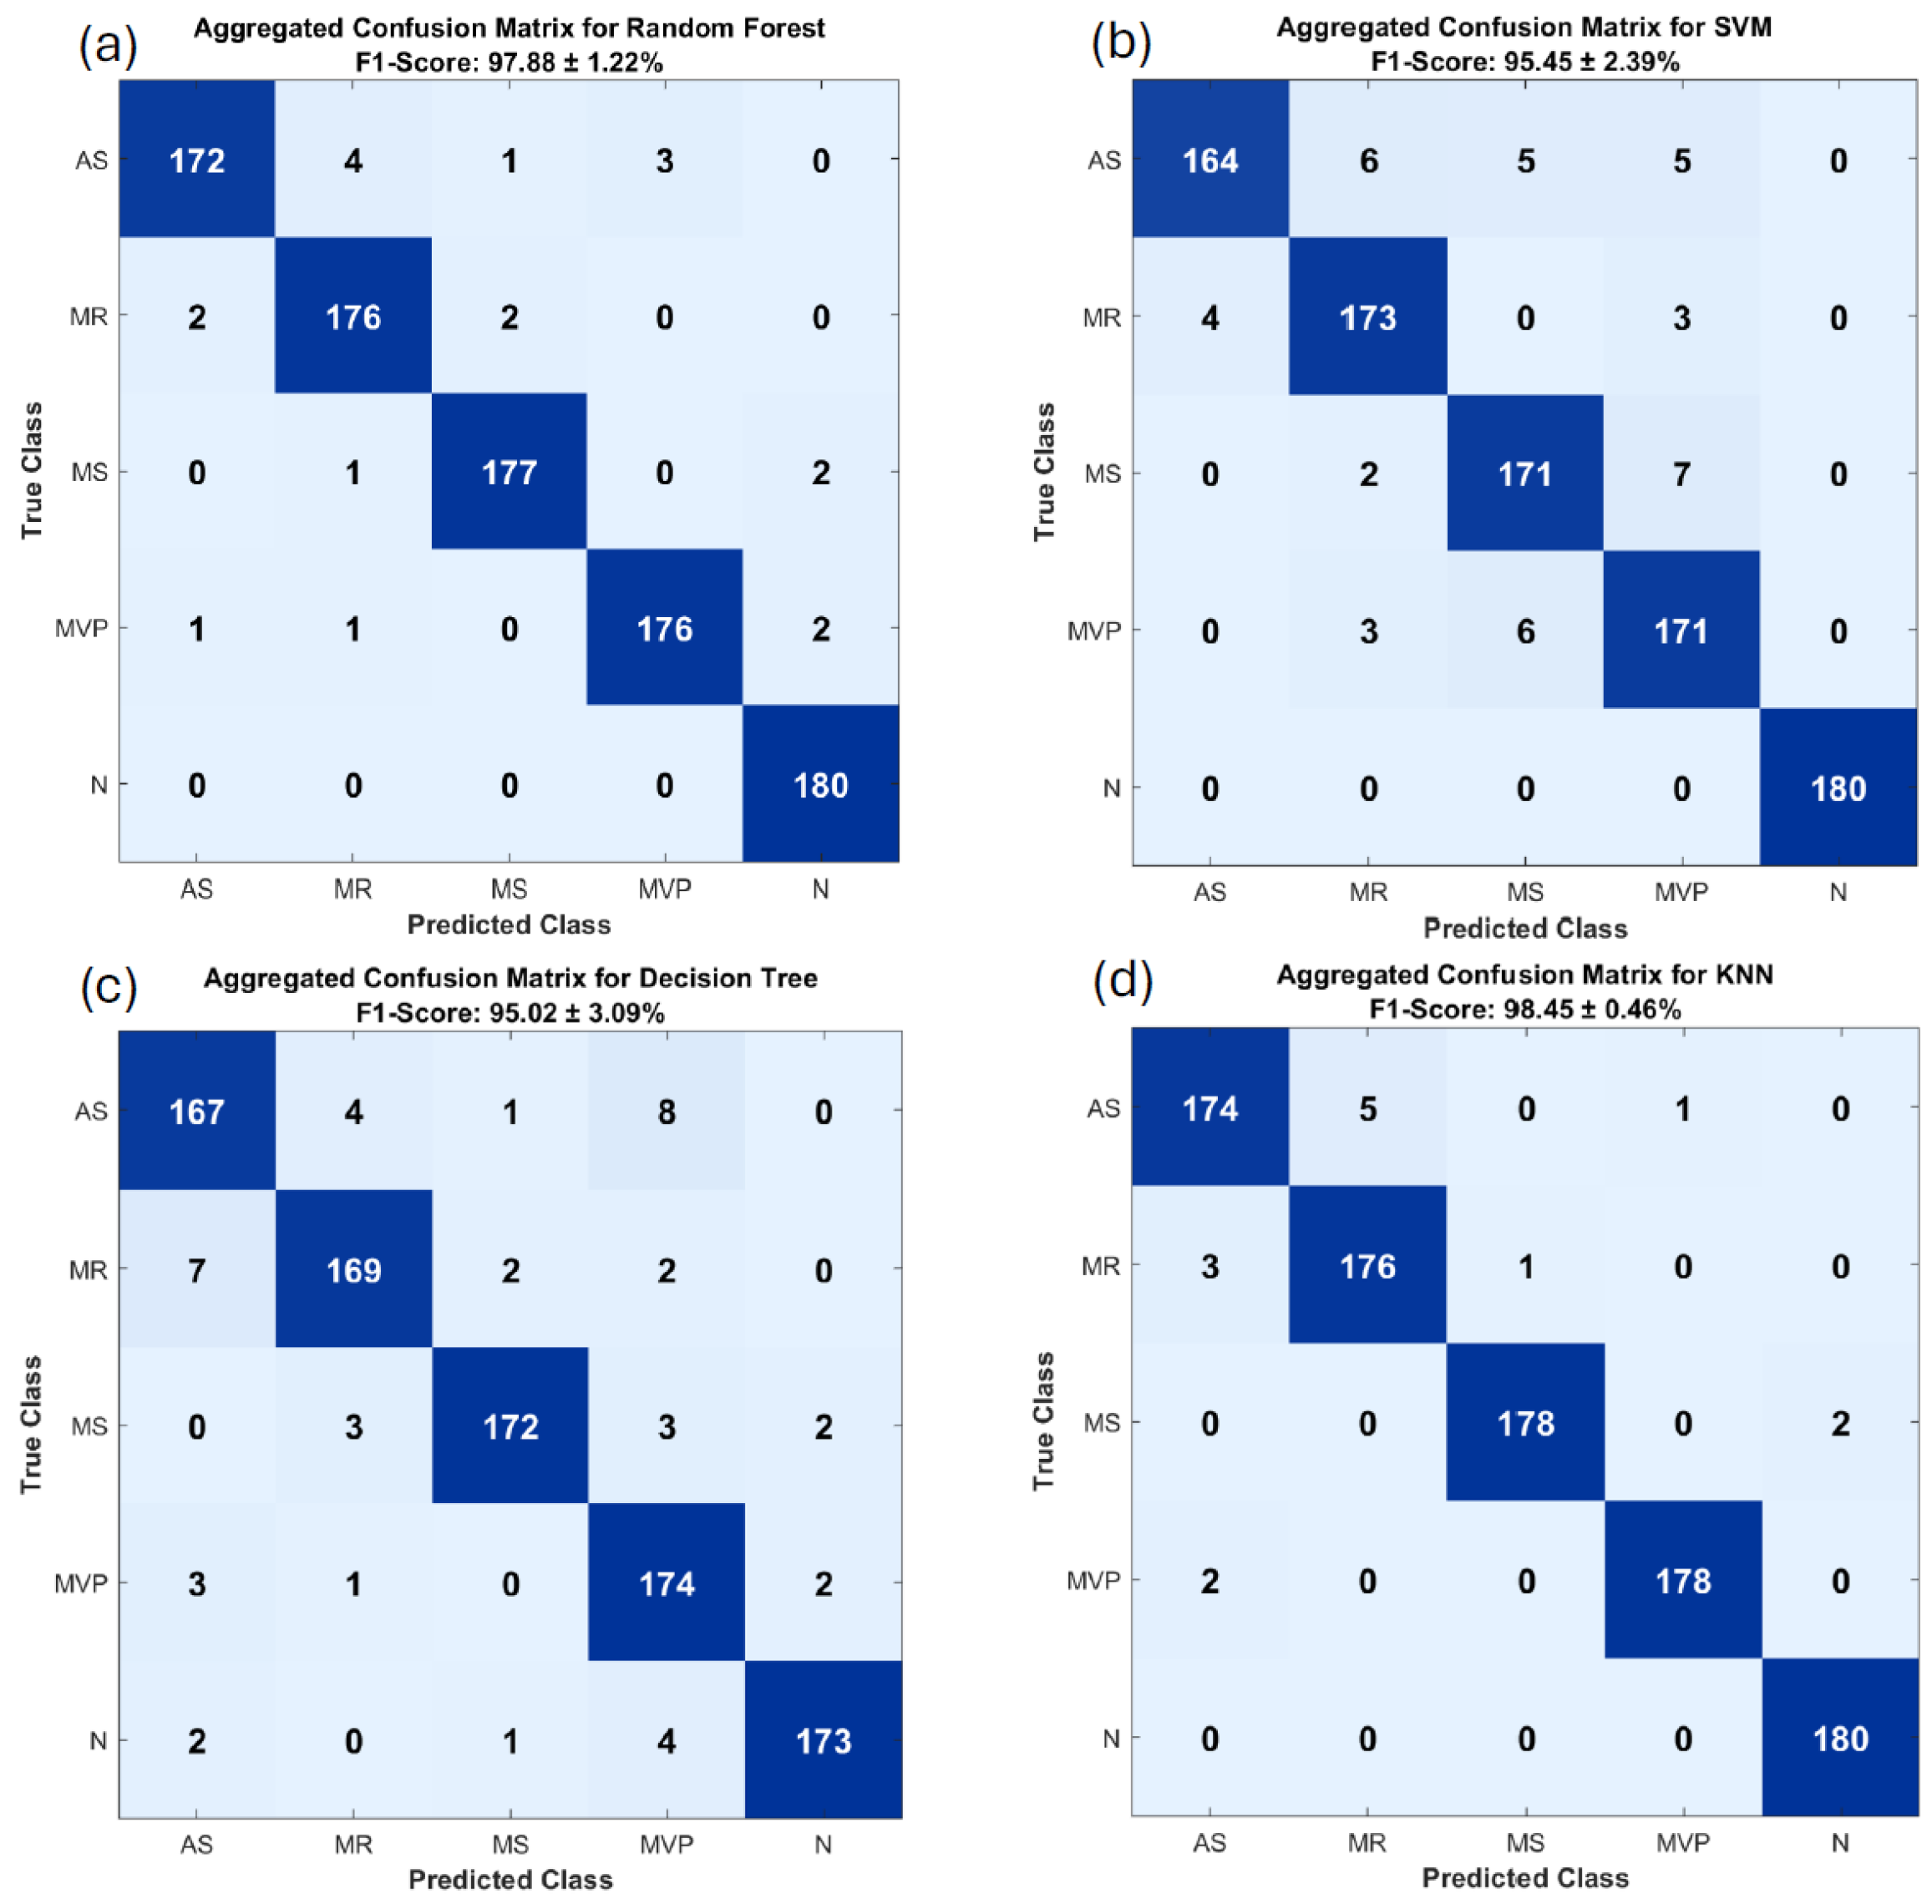
The confusion matrices shown in
Figure 6 and
Figure 7 show the multiclassification performance of various models for 1 and 2 s segments. A significant improvement is observed in the 2 s segment matrices, with fewer misclassifications across all models. Note that KNN and RF achieved the highest accuracy, while SVM and Decision Tree exhibited slightly higher misclassification rates. These results reinforce that longer segment durations provide more discriminative features and improve model reliability. Furthermore, Class 5 is consistently identified by all models, suggesting that it has clearly distinguishable characteristics.
4.2. Binary Classification Results
For the binary classification task, the same algorithms were used to distinguish between normal and abnormal heart sounds.
Table 5 presents the accuracy, precision, recall, and F1 score for each algorithm on both 1 s and 2 s segments.
Table 5 show the high binary classification accuracy achieved for all models. RM and KNN achieved the best performance of the approaches investigated. Using 2 s segments slightly improved accuracy, with SVM and KNN achieving 99.5%. The Decision Tree approach did not perform well but benefited from extended segments. These results confirm that binary classification is highly effective, with minimal misclassification and enhanced performance over extended durations.
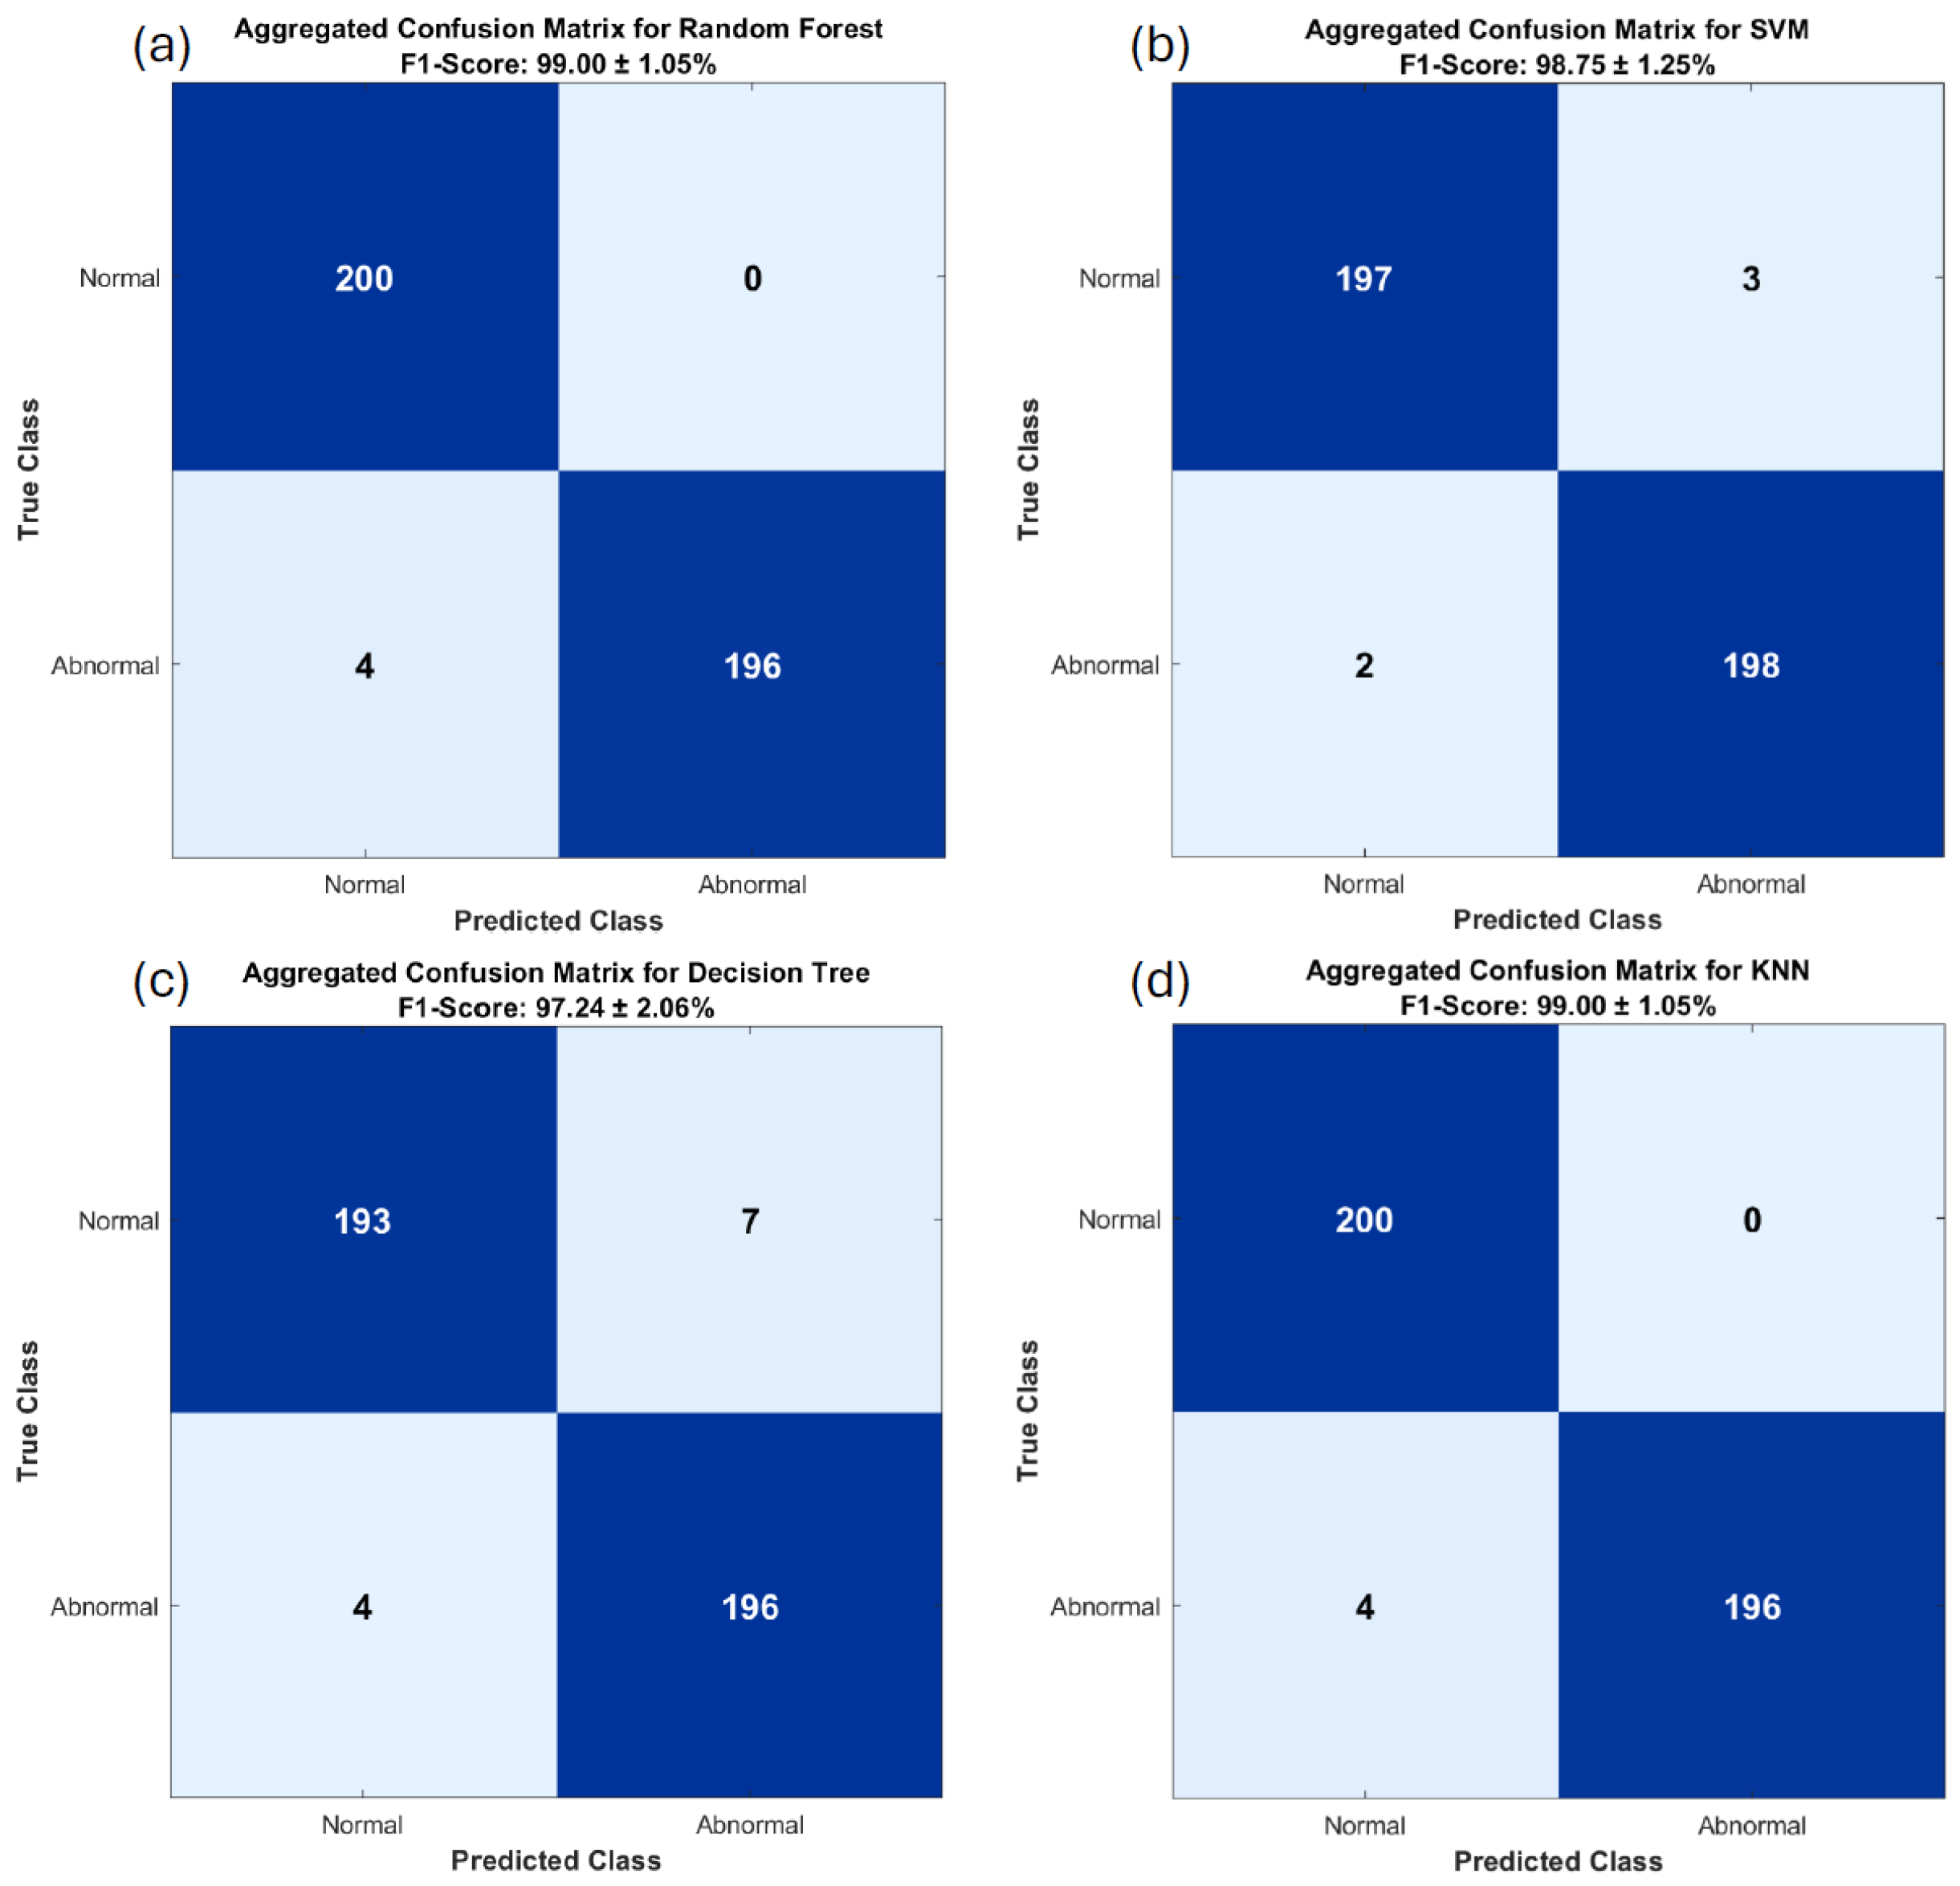
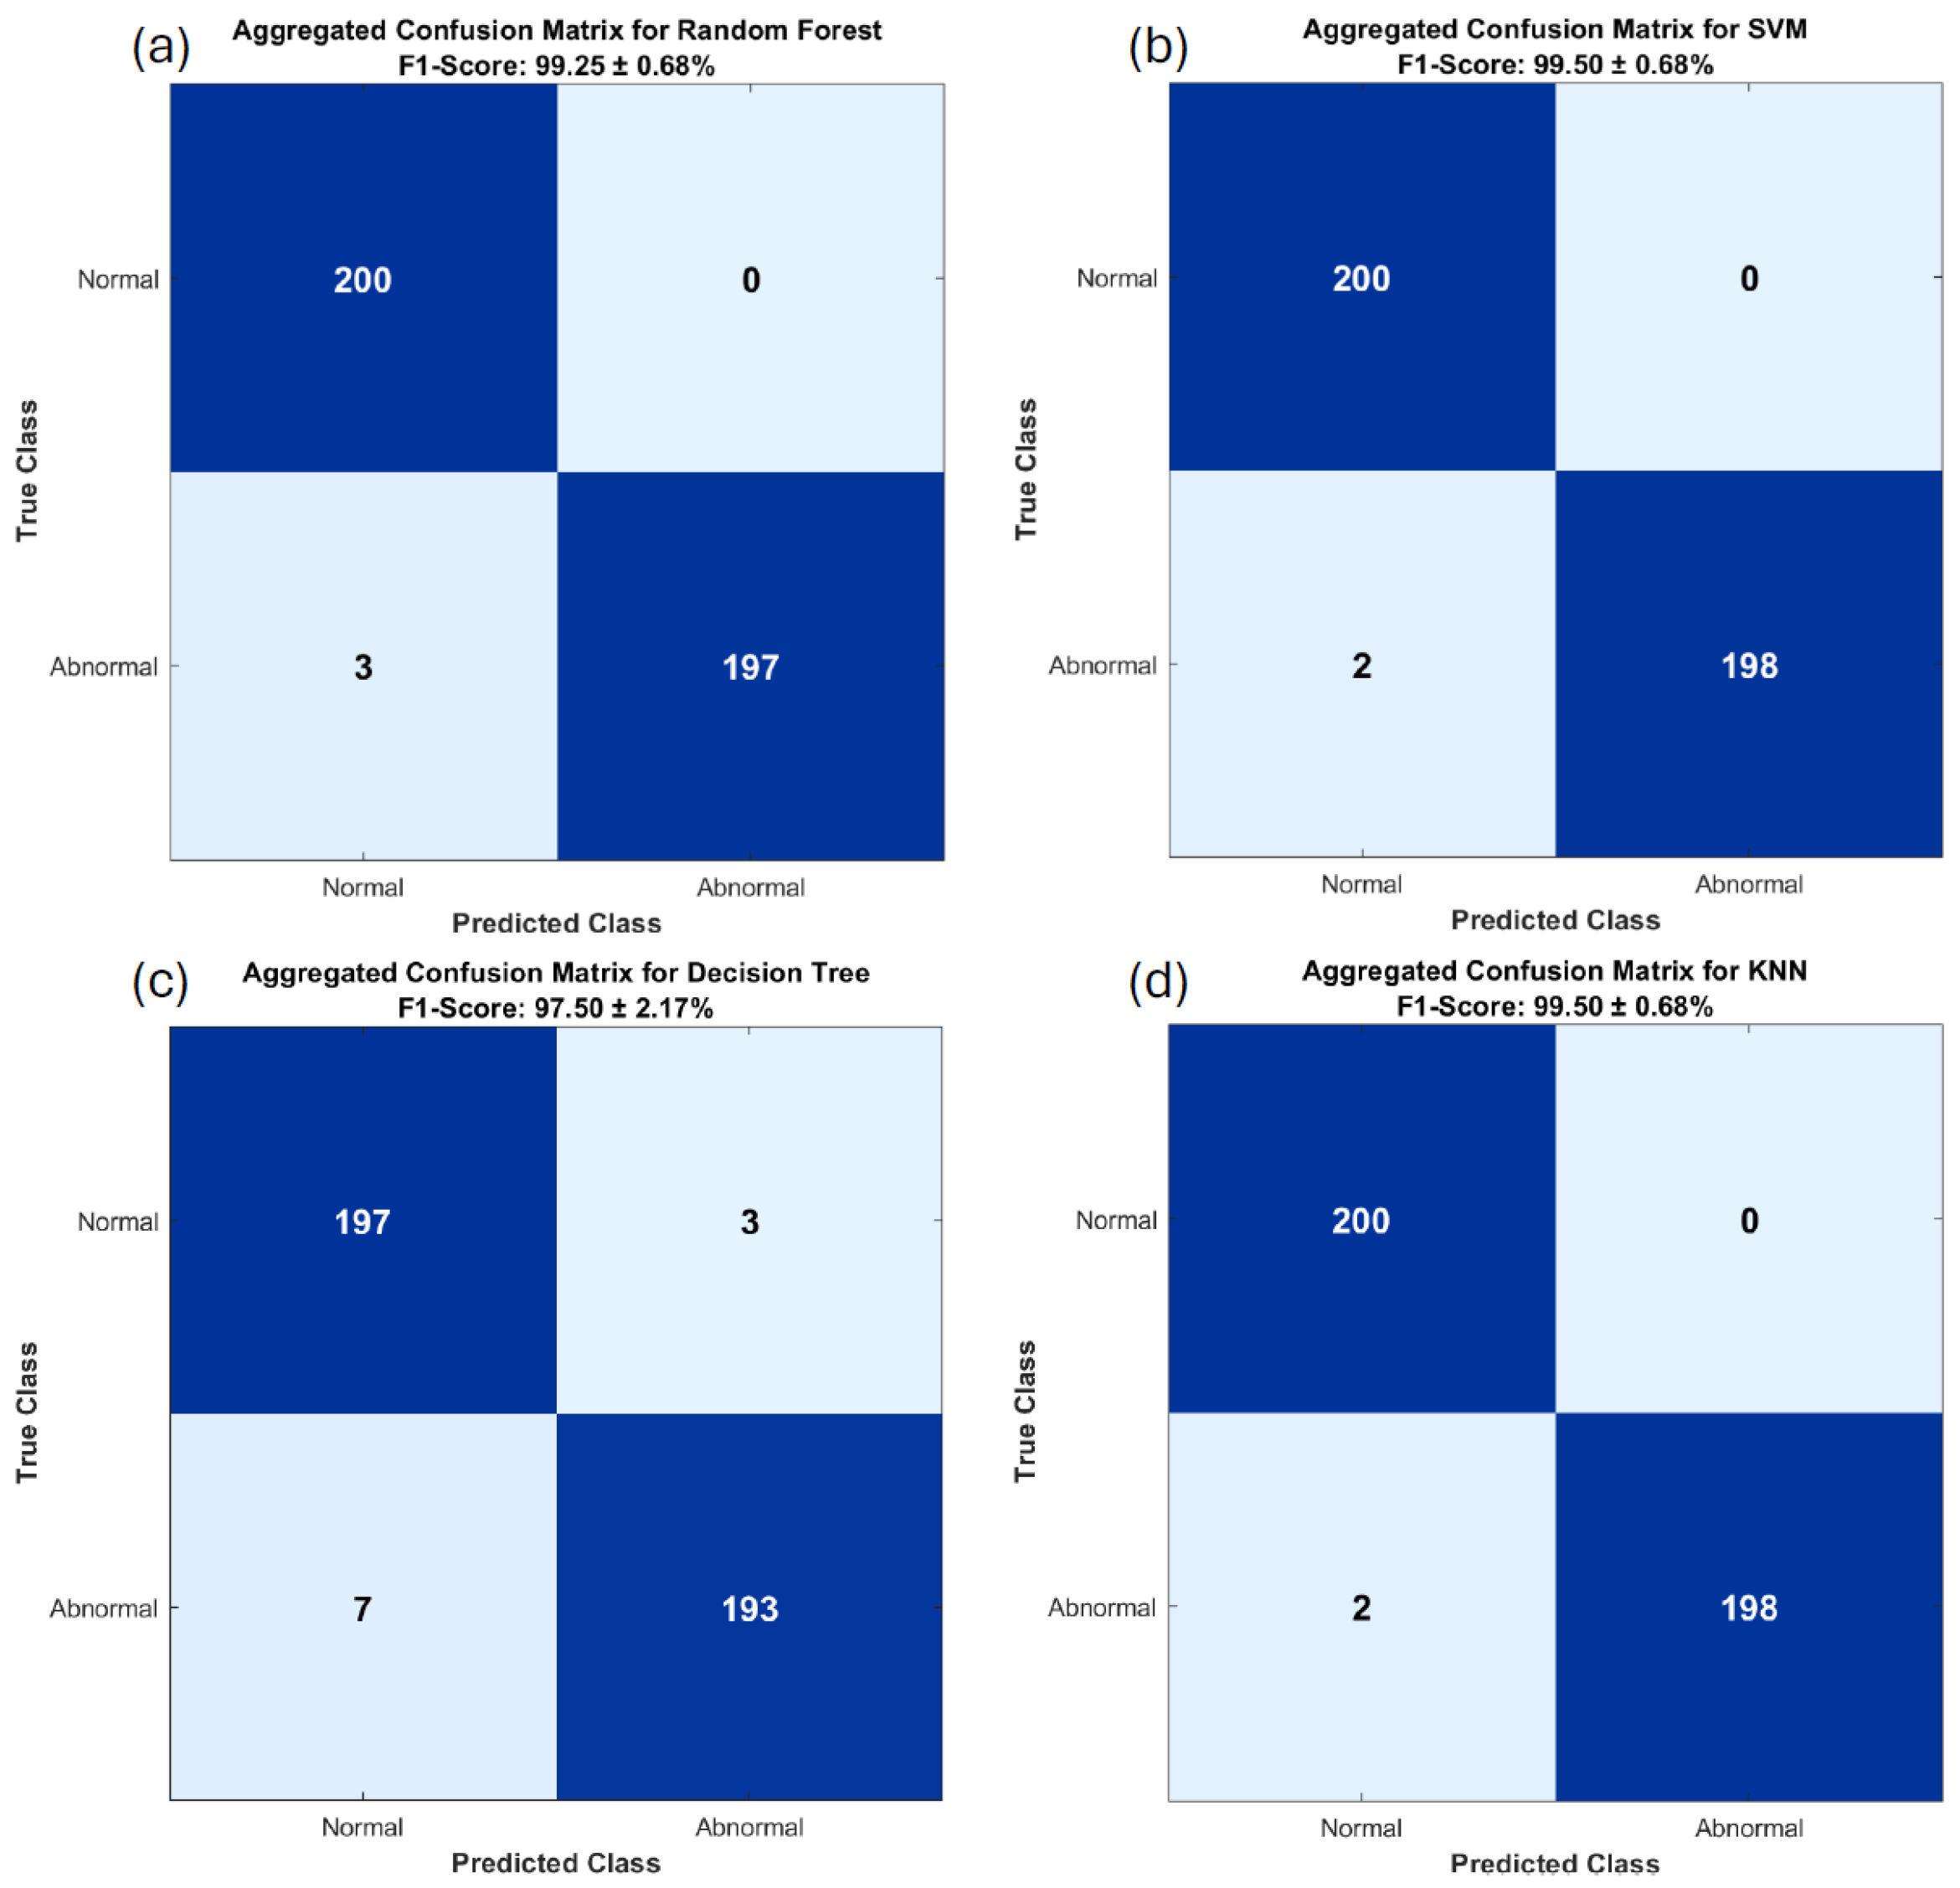
Figure 8 and
Figure 9 show the binary classification performance of Random Forest, SVM, Decision Tree, and KNN using 1 s and 2 s segments. All models perform well, with improved accuracy in the 2 s case. Random Forest and KNN consistently achieve the highest accuracy with minimal errors. SVM improves notably, achieving zero misclassifications for Class 1 and only 2 for Class 2 in 2 s segments. The Decision Tree shows the highest error rate in the 1 s case but benefits from longer segments. Overall, increased segment duration enhances classification reliability.
4.3. Feature Importance Analysis
Feature importance scores for the 13 RQA-derived features evaluated using Neighborhood Component Analysis (NCA), which was assessed using the Neighborhood Component Analysis (NCA) feature weighting method implemented in
MATLAB R2024b (e.g.,
fscnca) [
24]. NCA learns a non-negative weight for each feature by optimizing a nearest-neighbor classification objective with regularization. Features with larger learned weights contribute more strongly to class separability under the NCA objective.
4.3.1. Binary Classification
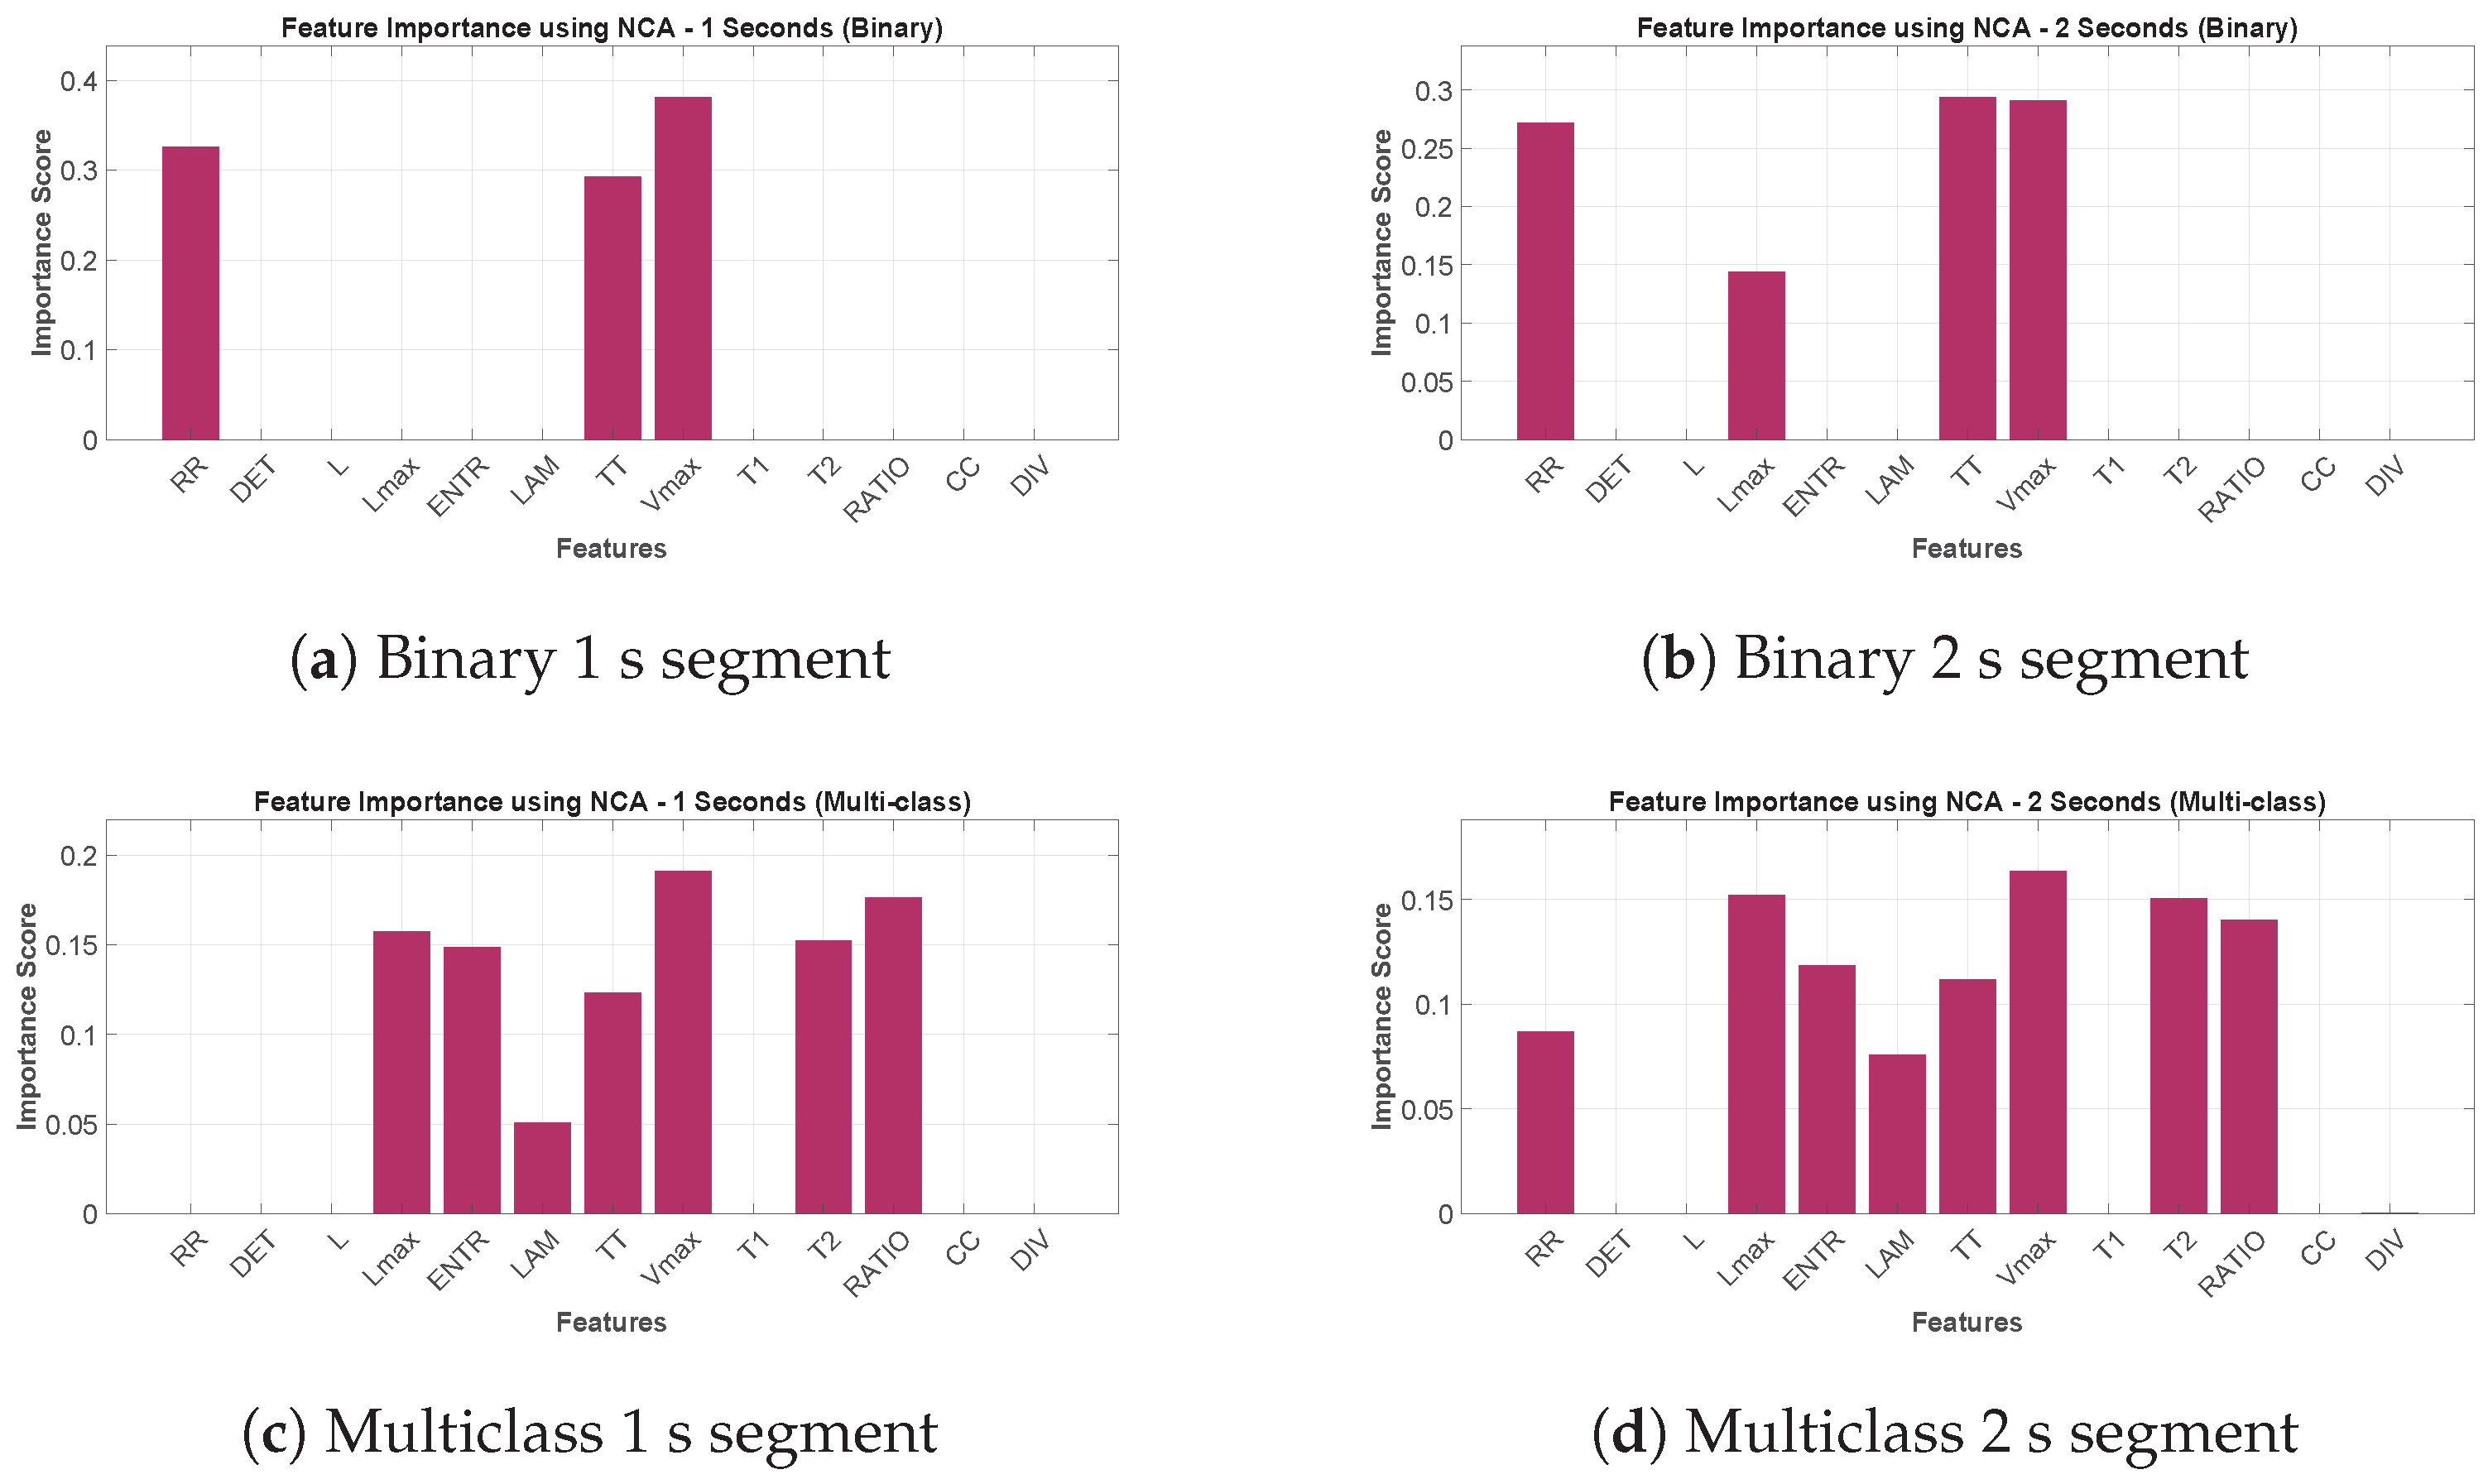
Figure 10a,b present the NCA feature weights for the binary task using 1 s and 2 s segments, respectively. For the 1 s segment, the dominant feature is
, with RR and TT also receiving non-zero and relatively high weights, whereas most other features are assigned near-zero importance. For the 2 s segment, TT and
receive the largest weights (with very similar magnitudes), followed by RR and then
. This indicates that a small subset of features essentially drives the binary decision, and that extending the segment length introduces additional discriminative contribution from
.
4.3.2. Multiclass Classification
Figure 10c,d show the NCA feature weights for the multiclass task. In the 1 s case,
is again the most influential feature, followed by RATIO, with
,
, and ENTR also contributing meaningfully. In the 2 s case,
remains the highest-weighted feature, while
and
form the next most important group, followed by RATIO, ENTR, and TT. Compared with the binary setting, the multiclass setting distributes importance across more features, which is expected given the increased complexity of separating multiple classes.
Overall, the MATLAB NCA results consistently rank among the most informative features across all configurations. The binary task is explained by a smaller subset of features (primarily , TT, and RR), while the multiclass task relies on a broader combination that includes , , ENTR, and RATIO, particularly for the 2 s segment.
4.4. Classification Performance After NCA
After applying NCA for weighing the importance of 13 RQA features, we repeated the classification experiments using the reduced feature sets.
Table 6 summarizes the best-performing configurations for each task. Despite the reduced dimensionality, the classifiers achieve performance on par with, and in some cases marginally superior to, the baseline results obtained with the complete feature set (13 RQA-derived features).
In the binary classification setting, the SVM attains an accuracy of with 2 s segments. This indicates that the binary decision boundary can be effectively captured by a compact subset of NCA-selected features, suggesting that many of the original features are redundant and offer little additional benefit to classification performance.
For multiclass classification, KNN reaches an accuracy of using 2 s segments. The consistency of this accuracy, as evidenced by the low variance across folds, underscores the robustness of the reduced NCA-derived feature space. This outcome suggests that multiclass discrimination is better supported by a carefully selected, weighted subset of features than by a high-dimensional feature representation.
5. Discussion
Our findings indicate that the proposed pipeline delivers performance on par with state-of-the-art deep learning methods while providing clear benefits in computational efficiency and feature compactness, comparable to other ML-based solutions. By converting phonocardiogram signals into recurrence plots (RPs), computing recurrence quantification analysis (RQA) descriptors, and then applying Neighborhood Component Analysis (NCA) to preserve the most discriminative features, the framework achieves high accuracy and F1 scores in a low-dimensional feature space. As reported in
Table 7, the proposed approach attains 98.89% accuracy for multiclass classification using 8 key RQA features and 99.75% accuracy for binary classification using only 4 RQA features, with both feature subsets derived through NCA-based selection.
The superior results obtained with 2 s segments can be attributed to the fact that this window typically spans 2–3 cardiac cycles at normal heart rates (60–100 bpm) [
25], thereby capturing inter-cycle variability, which is crucial for identifying pathological dynamics. This choice of segment length led to accuracy gains of 2.34–5.40% in multiclass classification and 0.25–1.05% in binary classification compared with 1 s segments.
Table 7.
Comparison of related works and the proposed method in heart sound classification performance.
Table 7.
Comparison of related works and the proposed method in heart sound classification performance.
| Ref. | Feature Type | # Features | Methodology | Task | Acc. (%) | F1 (%) |
|---|
| [26] | NN | Learned | Transformer | Multiclass | 98.74 | 98.76 |
| [27] | Handcrafted | 27 | ML | Multiclass | 99.26 | 99.30 |
| (Statistical) | Binary | 99.89 | 99.90 |
| [28] | CNN | Learned | CNN–LSTM | Multiclass | 98.90 | 99.02 |
| Proposed | Handcrafted | 8 | ML | Multiclass | 98.89 | 98.89 |
| (RP) | 4 | Binary | 99.75 | 99.75 |
In the binary classification setting, all classifiers achieved strong performance, indicating that the separation between normal and abnormal signals is well represented in the recurrence-based feature space once an adequate temporal context is available. Using 2 s segments, SVM and KNN reached 99.5% accuracy, while Random Forest also retained high performance. Decision Tree benefited from longer segments as well, although it remained the weakest classifier, reflecting its lower robustness relative to ensemble and margin-based methods.
Analysis of the confusion matrices further supports these observations: misclassification rates were lower with 2 s segments, especially for Random Forest and KNN, confirming robust behavior in both binary and multiclass scenarios. In particular, Class 5 was almost always correctly identified, suggesting thathe models more easily capture its characteristic patterns. Collectively, these results indicate that longer segment durations yield more stable and informative representations, which, in turn, enhance classification performance for both multiclass and binary tasks.
Comparison with Existing Methods
Existing approaches reported in [
9] make different trade-offs among classification performance, feature dimensionality, and computational complexity. Deep learning-based models generally achieve strong results through automatically learned high-dimensional representations, whereas handcrafted feature-based methods rely on manually designed descriptors and larger feature sets.
The proposed recurrence plot (RP)-based approach captures nonlinear cardiac dynamics through phase-space representations and achieves competitive performance using a substantially smaller feature set. Specifically, the proposed method uses only 8 handcrafted features for multiclass classification and 4 features for binary classification, corresponding to a reduction of approximately 70–85% in feature dimensionality compared to [
27].
Despite this substantial reduction, the proposed method achieves accuracies of
for multiclass classification and
for binary classification, with F1 scores of
and
, respectively. While the multiclass accuracy reported in [
27] is marginally higher, the results demonstrate that comparable classification performance can be maintained without relying on large handcrafted feature sets or computationally intensive deep learning architectures [
26,
28].
The effectiveness of recurrence plot (RP)-derived features can be attributed to their direct connection with underlying cardiac pathophysiology. Normal heart sounds exhibit strong periodicity and stable valve dynamics, which give rise to recurrence plots dominated by well-defined diagonal line structures and high determinism [
20]. These characteristics signify orderly and repeatable cardiac cycles and lead to clearer separation between classes in low-dimensional embeddings (such as t-SNE), as shown in
Figure 5, which is intended for qualitative visualization rather than quantitative evaluation. In contrast, valvular heart disease alters cardiac dynamics in lesion-specific ways, as captured by recurrence quantification metrics. Aortic stenosis generates turbulent flow, increasing entropy and decreasing determinism. Mitral regurgitation results in sustained retrograde flow, reflected as heightened laminarity. Mitral stenosis induces diastolic inflow obstruction, manifested as increased trapping time, whereas mitral valve prolapse causes abrupt valve movements that shorten diagonal line segments due to irregular transient events [
20,
22]. Collectively, these findings offer physiological justification for the discriminative power of recurrence-based features across cardiac pathologies and underpin their use as interpretable representations for heart sound analysis.
Overall, the comparison shows that the proposed method strikes a favorable balance between classification performance and computational efficiency. By achieving near-state-of-the-art accuracy with a compact feature representation, this approach offers a practical, deployable alternative to existing solutions, especially for low-power clinical screening applications.
6. Conclusions
This study shows that combining descriptors derived from recurrence plots with machine learning classifiers is effective for non-invasive heart sound classification. By converting phonocardiogram signals into recurrence plots, key nonlinear temporal dynamics are captured and then summarized through a compact set of recurrence quantification analysis (RQA) features. Applying Neighborhood Component Analysis (NCA) further reduces the feature space, enhancing computational efficiency while retaining the most discriminative information.
Experiments on the Yaseen 2018 dataset show that extending the segment length from 1 to 2 s consistently improves classification performance. Among the tested classifiers, Support Vector Machines (SVMs) and K-Nearest Neighbors (KNNs) deliver the most stable performance for binary and multiclass classification, respectively, even when using a relatively small set of handcrafted features.
Collectively, the results suggest that strong heart sound classification performance is attainable with a low-dimensional, interpretable feature set, without relying on computationally intensive deep learning architectures. However, the findings are currently constrained to a single public dataset, and additional validation on other datasets and recording environments is necessary before broad clinical deployment can be justified. Despite these limitations, the proposed framework provides a practical and efficient foundation for future work in machine learning-based heart sound analysis.
Author Contributions
Methodology, A.M.A., T.N.A., R.A.A. and H.S.M.; Software, A.M.A. and T.N.A.; Validation, A.M.A., T.N.A., R.A.A. and H.S.M.; Formal analysis, A.M.A. and T.N.A.; Investigation, T.N.A.; Resources, A.M.A.; Data curation, A.M.A. and T.N.A.; Writing—original draft, A.M.A.; Writing—review & editing, T.N.A., R.A.A. and H.S.M.; Visualization, A.M.A., T.N.A., R.A.A. and H.S.M.; Supervision, T.N.A.; Project administration, T.N.A. All authors have read and agreed to the published version of the manuscript.
Funding
This research received no external funding.
Data Availability Statement
The data used in this study were obtained from the dataset reported by [
9]. The original data were collected from multiple publicly available sources, including educational CDs (e.g., Auscultation Skills and Heart Sound Made Easy) and medical websites. The dataset was preprocessed by removing highly noisy recordings, resampling to 8 kHz, converting to mono channel, and segmenting into three-period heart sound signals, as described in the referenced publication. The dataset and source code are publicly available at
https://github.com/yaseen21khan/Classification-of-Heart-Sound-Signal-Using-Multiple-Features-/blob/master/README.md, accessed on 26 January 2026. No new data were created in this study.
Conflicts of Interest
The authors declare no conflicts of interest.
References
- World Health Organization. Cardiovascular Diseases (CVDs) Fact Sheet. 2023. Available online: https://www.who.int/news-room/fact-sheets/detail/cardiovascular-diseases-(cvds) (accessed on 19 October 2025).
- Benjamin, E.J.; Muntner, P.; Alonso, A.; Bittencourt, M.S.; Callaway, C.W.; Carson, A.P.; Chamberlain, A.M.; Chang, A.R.; Cheng, S.; Das, S.R.; et al. Heart disease and stroke statistics—2019 update: A report from the American Heart Association. Circulation 2019, 139, e56–e528. [Google Scholar] [CrossRef] [Scilit] [PubMed]
- Gaziano, T.A. Reducing the growing burden of cardiovascular disease in the developing world. Health Aff. 2007, 26, 13–24. [Google Scholar] [CrossRef] [Scilit] [PubMed]
- Wu, Z.; Guo, C. Deep learning and electrocardiography: Systematic review of current techniques in cardiovascular disease diagnosis and management. BioMedical Eng. Online 2025, 24, 23. [Google Scholar] [CrossRef] [Scilit]
- Springer, D.B.; Tarassenko, L.; Clifford, G.D. Logistic regression-HSMM-based heart sound segmentation. IEEE Trans. Biomed. Eng. 2015, 63, 822–832. [Google Scholar] [CrossRef] [Scilit] [PubMed]
- Aziz, S.; Khan, M.U.; Alhaisoni, M.; Akram, T.; Altaf, M. Phonocardiogram signal processing for automatic diagnosis of congenital heart disorders through fusion of temporal and cepstral features. Sensors 2020, 20, 3790. [Google Scholar] [CrossRef] [Scilit] [PubMed]
- Schmidt, S.E.; Holst-Hansen, C.; Graff, C.; Toft, E.; Struijk, J.J. Segmentation of heart sound recordings by a duration-dependent hidden Markov model. Physiol. Meas. 2010, 31, 513. [Google Scholar] [CrossRef] [Scilit]
- Potes, C.; Parvaneh, S.; Rahman, A.; Conroy, B. Ensemble of feature-based and deep learning-based classifiers for detection of abnormal heart sounds. In Proceedings of the 2016 Computing in Cardiology Conference (CinC), Vancouver, BC, Canada, 11–14 September 2016; IEEE: New York, NY, USA, 2016; pp. 621–624. [Google Scholar]
- Yaseen; Son, G.Y.; Kwon, S. Classification of heart sound signal using multiple features. Appl. Sci. 2018, 8, 2344. [Google Scholar] [CrossRef] [Scilit]
- Centers for Disease Control and Prevention (CDC)/National Center for Health Statistics (NCHS). Multiple Cause of Death Data on CDC WONDER. 2025. Available online: https://wonder.cdc.gov/mcd.html (accessed on 19 October 2025).
- Abbas, Q.; Hussain, A.; Baig, A.R. Automatic detection and classification of cardiovascular disorders using phonocardiogram and convolutional vision transformers. Diagnostics 2022, 12, 3109. [Google Scholar] [CrossRef] [Scilit]
- Jain, P.K.; Choudhary, R.R.; Singh, M.R. A lightweight 1-d convolution neural network model for multi-class classification of heart sounds. In Proceedings of the 2022 International Conference on Emerging Techniques in Computational Intelligence (ICETCI), Hyderabad, India, 25–27 August 2022; IEEE: New York, NY, USA, 2022; pp. 40–44. [Google Scholar]
- Tovar-Corona, B.; Flores-Alonso, S.I.; Luna-García, R. Convolutional neural network for improvement of heart valve disease detection. Comput. Sist. 2022, 26, 1143–1150. [Google Scholar] [CrossRef] [Scilit]
- Hasan, A.; Bahri, Z. Comparative study on heart anomalies early detection using phonocardiography (PCG) signals. Int. J. Comput. Digit. Syst. 2023, 14, 1023–1040. [Google Scholar] [CrossRef] [Scilit]
- Sun, C.; Liu, X.; Liu, C.; Wang, X.; Liu, Y.; Zhao, S.; Zhang, M. Enhanced cad detection using novel multi-modal learning: Integration of ecg, pcg, and coupling signals. Bioengineering 2024, 11, 1093. [Google Scholar] [CrossRef] [Scilit]
- Al-Issa, Y.; Alqudah, A.M. A lightweight hybrid deep learning system for cardiac valvular disease classification. Sci. Rep. 2022, 12, 14297. [Google Scholar] [CrossRef] [Scilit]
- Tariq, Z.; Shah, S.K.; Lee, Y. Feature-based fusion using CNN for lung and heart sound classification. Sensors 2022, 22, 1521. [Google Scholar] [CrossRef] [Scilit]
- Ghosh, S.K.; Ponnalagu, R.; Tripathy, R.; Acharya, U.R. Deep Layer Kernel Sparse Representation Network for the Detection of Heart Valve Ailments from the Time-Frequency Representation of PCG Recordings. BioMed Res. Int. 2020, 2020, 8843963. [Google Scholar] [CrossRef] [Scilit]
- Eckmann, J.P.; Kamphorst, S.O.; Ruelle, D. Recurrence plots of dynamical systems. In Turbulence, Strange Attractors and Chaos; World Scientific: Singapore, 1995; pp. 441–445. [Google Scholar]
- Marwan, N.; Romano, M.C.; Thiel, M.; Kurths, J. Recurrence plots for the analysis of complex systems. Phys. Rep. 2007, 438, 237–329. [Google Scholar] [CrossRef] [Scilit]
- Marwan, N.; Kurths, J. Nonlinear analysis of bivariate data with cross recurrence plots. Phys. Lett. A 2002, 302, 299–307. [Google Scholar] [CrossRef] [Scilit]
- Webber, C.L., Jr.; Zbilut, J.P. Recurrence quantification analysis of nonlinear dynamical systems. Tutor. Contemp. Nonlinear Methods Behav. Sci. 2005, 94, 26–94. [Google Scholar]
- Coco, M.I.; Dale, R. Cross-recurrence quantification analysis of categorical and continuous time series: An R package. Front. Psychol. 2014, 5, 510. [Google Scholar] [CrossRef] [Scilit] [PubMed]
- The MathWorks, Inc. Neighborhood Component Analysis (NCA) Feature Selection. 2025. Available online: https://www.mathworks.com/help/stats/neighborhood-component-analysis.html (accessed on 19 January 2026).
- Mayuga, K.A.; Fedorowski, A.; Ricci, F.; Gopinathannair, R.; Dukes, J.W.; Gibbons, C.; Hanna, P.; Sorajja, D.; Chung, M.; Benditt, D.; et al. Sinus tachycardia: A multidisciplinary expert focused review. Circ. Arrhythmia Electrophysiol. 2022, 15, e007960. [Google Scholar] [CrossRef] [Scilit] [PubMed]
- Yang, D.; Lin, Y.; Wei, J.; Lin, X.; Zhao, X.; Yao, Y.; Tao, T.; Liang, B.; Lu, S.G. Assisting heart valve diseases diagnosis via transformer-based classification of heart sound signals. Electronics 2023, 12, 2221. [Google Scholar] [CrossRef] [Scilit]
- Swaminathan, S.; Krishnamurthy, S.M.; Gudada, C.; Mallappa, S.K.; Ail, N. Heart sound analysis with machine learning using audio features for detecting heart diseases. Int. J. Comput. Inf. Syst. Ind. Manag. Appl. 2024, 16, 17. [Google Scholar]
- Choudhary, R.R.; Rani, M.; Kaur, R.; Bhadu, M. Heart Signal Analysis Using Multistage Classification Denoising Model. J. Electr. Comput. Eng. 2024, 2024, 1502285. [Google Scholar] [CrossRef] [Scilit]
Figure 1.
Overview of the proposed methodology pipeline.
Figure 1.
Overview of the proposed methodology pipeline.
Figure 2.
Audio duration distribution and heart sound category frequencies.
Figure 2.
Audio duration distribution and heart sound category frequencies.
Figure 3.
Distribution of audio duration by category.
Figure 3.
Distribution of audio duration by category.
Figure 4.
(a) Normal heart signal. (b) MVP heart signal.
Figure 4.
(a) Normal heart signal. (b) MVP heart signal.
Figure 5.
t-SNE visualization of feature distributions.
Figure 5.
t-SNE visualization of feature distributions.
Figure 6.
Multiclass confusion matrices for the 1 segment classification task: (a) Random Forest; (b) Support Vector Machine (SVM); (c) Decision Tree; and (d) k-Nearest Neighbors (KNN). Each matrix shows the aggregated classification performance across all classes, where rows represent true labels and columns represent predicted labels.
Figure 6.
Multiclass confusion matrices for the 1 segment classification task: (a) Random Forest; (b) Support Vector Machine (SVM); (c) Decision Tree; and (d) k-Nearest Neighbors (KNN). Each matrix shows the aggregated classification performance across all classes, where rows represent true labels and columns represent predicted labels.
Figure 7.
Multiclass confusion matrices 2 s segment classification task: (a) Random Forest; (b) Support Vector Machine (SVM); (c) Decision Tree; and (d) k-Nearest Neighbors (KNN). Each matrix shows the aggregated classification performance across all classes, where rows represent true labels and columns represent predicted labels.
Figure 7.
Multiclass confusion matrices 2 s segment classification task: (a) Random Forest; (b) Support Vector Machine (SVM); (c) Decision Tree; and (d) k-Nearest Neighbors (KNN). Each matrix shows the aggregated classification performance across all classes, where rows represent true labels and columns represent predicted labels.
Figure 8.
Binary-class confusion matrices for the 1 s segment classification task: (a) Random Forest classifier; and (b) Support Vector Machine (SVM); (c) Decision Tree classifier; (d) k-Nearest Neighbors (KNN). Each confusion matrix illustrates the aggregated classification performance, where rows correspond to the true class labels and columns correspond to the predicted class labels.
Figure 8.
Binary-class confusion matrices for the 1 s segment classification task: (a) Random Forest classifier; and (b) Support Vector Machine (SVM); (c) Decision Tree classifier; (d) k-Nearest Neighbors (KNN). Each confusion matrix illustrates the aggregated classification performance, where rows correspond to the true class labels and columns correspond to the predicted class labels.
Figure 9.
Binary-class confusion matrices 2 s segment classification task: (a) Random Forest; and (b) Support Vector Machine (SVM); (c) Decision Tree classifier; (d) k-Nearest Neighbors (KNN). Each matrix shows the aggregated classification performance, where rows represent true labels and columns represent predicted labels.
Figure 9.
Binary-class confusion matrices 2 s segment classification task: (a) Random Forest; and (b) Support Vector Machine (SVM); (c) Decision Tree classifier; (d) k-Nearest Neighbors (KNN). Each matrix shows the aggregated classification performance, where rows represent true labels and columns represent predicted labels.
Figure 10.
NCA Feature Importance Analysis.
Figure 10.
NCA Feature Importance Analysis.
Table 1.
Multiclass Yaseen 2018 dataset.
Table 1.
Multiclass Yaseen 2018 dataset.
| Category | Samples (1 s) | Samples (2 s) |
|---|
| AS | 200 | 180 |
| MR | 200 | 180 |
| MS | 200 | 180 |
| MVP | 200 | 180 |
| N | 200 | 180 |
Table 2.
Binary classes Yaseen 2018 dataset.
Table 2.
Binary classes Yaseen 2018 dataset.
| Category | Samples (1 s) | Samples (2 s) |
|---|
| AS | 50 | 50 |
| MR | 50 | 50 |
| MS | 50 | 50 |
| MVP | 50 | 50 |
| N | 200 | 200 |
Table 3.
Summary of recurrence quantification analysis (RQA) measures used for heart sound feature extraction.
Table 3.
Summary of recurrence quantification analysis (RQA) measures used for heart sound feature extraction.
| Measure | Description | Equation |
|---|
| Recurrence Rate (RR) | Measures the density of recurrence points in the matrix; reflects the overall frequency of recurring heart sound patterns. | |
| Determinism (DET) | Proportion of recurrence points forming diagonal lines; it quantifies predictability or repetitive behavior in cardiac cycles. | |
| Average Diagonal Line Length (L) | The longest diagonal line indicates stability or regularity of repeated cardiac phases. | |
| Longest Diagonal Line (Lmax) | The length of the longest diagonal line indicates the stability or regularity of heart sound phases over time. | |
| Entropy of Diagonal Lines (ENTR) | Shannon entropy of diagonal line lengths reflects the complexity and irregularity of deterministic cardiac behavior. | |
| Laminarity (LAM) | Ratio of recurrence points forming vertical lines; measures the presence of laminar or unchanging states (e.g., prolonged murmurs). | |
| Trapping Time (TT) | The average length of vertical lines represents the average time the system spends in a single state, which is useful for identifying stagnant
cardiac activity. | |
| Longest Vertical Line (Vmax) | Length of the longest vertical line; detects sustained non-changing states that may signify cardiac anomalies. | , v set of vertical line lengths |
| Recurrence Time of First Type (T1) | Average time intervals between recurrent states; evaluates the consistency of recurring
heart phases. | |
| Recurrence Time of Second Type (T2) | Variation in time intervals between recurrences characterizes the irregularity of temporal
cardiac patterns. | |
| Ratio (RATIO) | The ratio of determinism to recurrence rate (DET/RR) balances predictability with recurrence frequency and is useful for class contrast. | |
| Clustering Coefficient (CC) | Measures the degree of local interconnectedness of recurrence points; indicative of topological complexity in signal dynamics. | |
| Divergence (DIV) | Inverse of Lmax (1/Lmax); indicates sensitivity to initial conditions and signal divergence, often elevated in arrhythmic events. | |
Table 4.
Multiclass classification performance comparison for 1 s and 2 s heart sound segments.
Table 4.
Multiclass classification performance comparison for 1 s and 2 s heart sound segments.
| Model | 1 s Segments | 2 s Segments |
|---|
| Prec. | Rec. | F1 | Acc. | Prec. | Rec. | F1 | Acc. |
|---|
| Random Forest | 94.16 ± 1.80 | 93.80 ± 1.96 | 93.81 ± 1.96 | 93.80 ± 1.96 | 97.95 ± 1.19 | 97.89 ± 1.20 | 97.88 ± 1.22 | 97.89 ± 1.20 |
| SVM | 92.88 ± 1.60 | 92.70 ± 1.68 | 92.71 ± 1.67 | 92.70 ± 1.68 | 95.58 ± 2.35 | 95.44 ± 2.40 | 95.45 ± 2.39 | 95.44 ± 2.40 |
| Decision Tree | 89.92 ± 3.20 | 89.60 ± 3.21 | 89.57 ± 3.24 | 89.60 ± 3.21 | 95.24 ± 2.91 | 95.00 ± 3.12 | 95.02 ± 3.09 | 95.00 ± 3.12 |
| KNN | 96.20 ± 0.92 | 96.10 ± 0.89 | 96.09 ± 0.91 | 96.10 ± 0.89 | 98.47 ± 0.47 | 98.44 ± 0.46 | 98.45 ± 0.46 | 98.44 ± 0.46 |
Table 5.
Binary classification performance comparison for 1 s and 2 s segments.
Table 5.
Binary classification performance comparison for 1 s and 2 s segments.
| Model | 1 s Segments | 2 s Segments |
|---|
| Prec. | Rec. | F1 | Acc. | Prec. | Rec. | F1 | Acc. |
|---|
| Random Forest | 99.04 ± 1.00 | 99.00 ± 1.05 | 99.00 ± 1.05 | 99.00 ± 1.05 | 99.27 ± 0.67 | 99.25 ± 0.68 | 99.25 ± 0.68 | 99.25 ± 0.68 |
| SVM | 98.78 ± 1.22 | 98.75 ± 1.25 | 98.75 ± 1.25 | 98.45 ± 0.46 | 99.51 ± 0.67 | 99.50 ± 0.68 | 99.50 ± 0.68 | 99.50 ± 0.68 |
| Decision Tree | 97.42 ± 1.77 | 97.25 ± 2.05 | 97.24 ± 2.06 | 97.25 ± 2.05 | 97.57 ± 2.07 | 97.50 ± 2.17 | 97.50 ± 2.17 | 97.50 ± 2.17 |
| KNN | 99.04 ± 1.00 | 99.00 ± 1.05 | 99.00 ± 1.05 | 99.00 ± 1.05 | 99.51 ± 0.67 | 99.50 ± 0.68 | 99.50 ± 0.68 | 99.50 ± 0.68 |
Table 6.
Best classification performance after NCA’s reduced features.
Table 6.
Best classification performance after NCA’s reduced features.
| Classification | Model | Prec. | Rec. | F1 | Acc. |
|---|
| Binary (2 s) | SVM | 99.76 ± 0.55 | 99.75 ± 0.56 | 99.75 ± 0.56 | 99.75 ± 0.56 |
| Multiclass (2 s) | KNN | 98.91 ± 0.78 | 98.89 ± 0.79 | 98.89 ± 0.79 | 98.89 ± 0.79 |
| Disclaimer/Publisher’s Note: The statements, opinions and data contained in all publications are solely those of the individual author(s) and contributor(s) and not of MDPI and/or the editor(s). MDPI and/or the editor(s) disclaim responsibility for any injury to people or property resulting from any ideas, methods, instructions or products referred to in the content. |



 and
and