Figure 1.
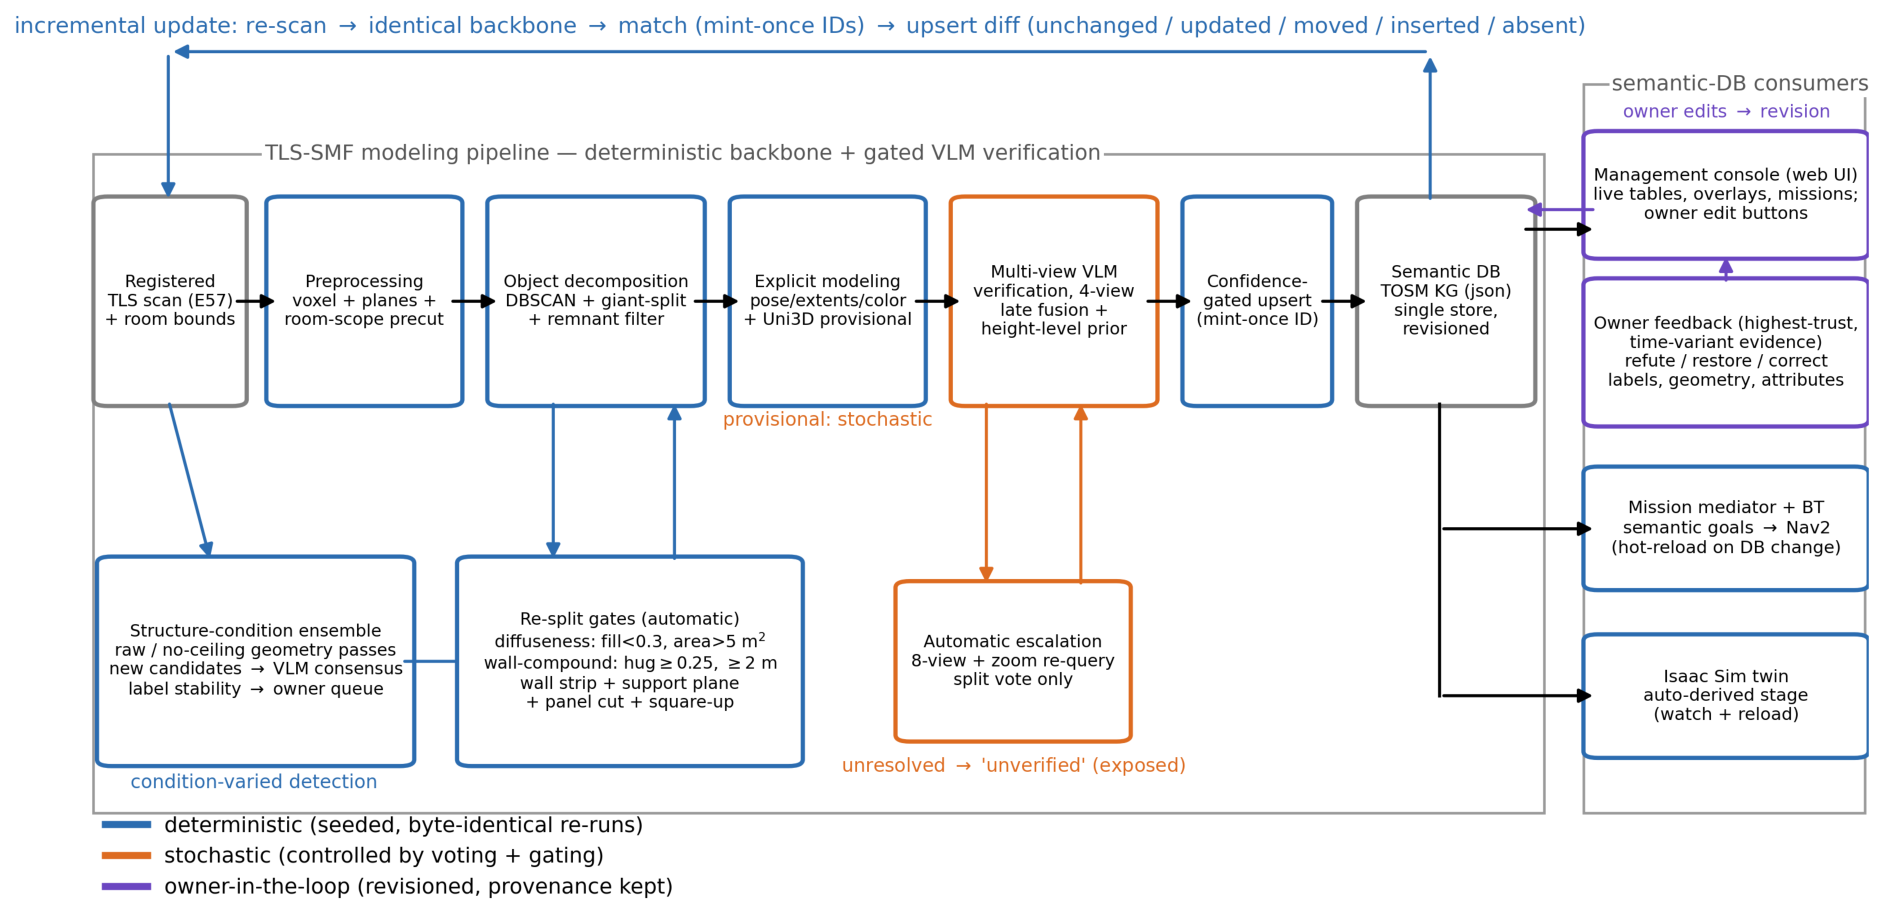
Framework architecture. Blue stages form the deterministic geometric backbone (including the automatic re-split gates and the structure-condition ensemble); orange stages are probabilistic semantic inference under voting, escalation, and gating control; purple is the owner-in-the-loop revision path. The knowledge graph is the single semantic store from which the console, the mission mediator, and the simulation twin are derived. Four loops: escalation (within verification), re-splitting (within decomposition), incremental update (across scans), and owner feedback (across revisions).
Figure 1.
Framework architecture. Blue stages form the deterministic geometric backbone (including the automatic re-split gates and the structure-condition ensemble); orange stages are probabilistic semantic inference under voting, escalation, and gating control; purple is the owner-in-the-loop revision path. The knowledge graph is the single semantic store from which the console, the mission mediator, and the simulation twin are derived. Four loops: escalation (within verification), re-splitting (within decomposition), incremental update (across scans), and owner feedback (across revisions).
Figure 2.
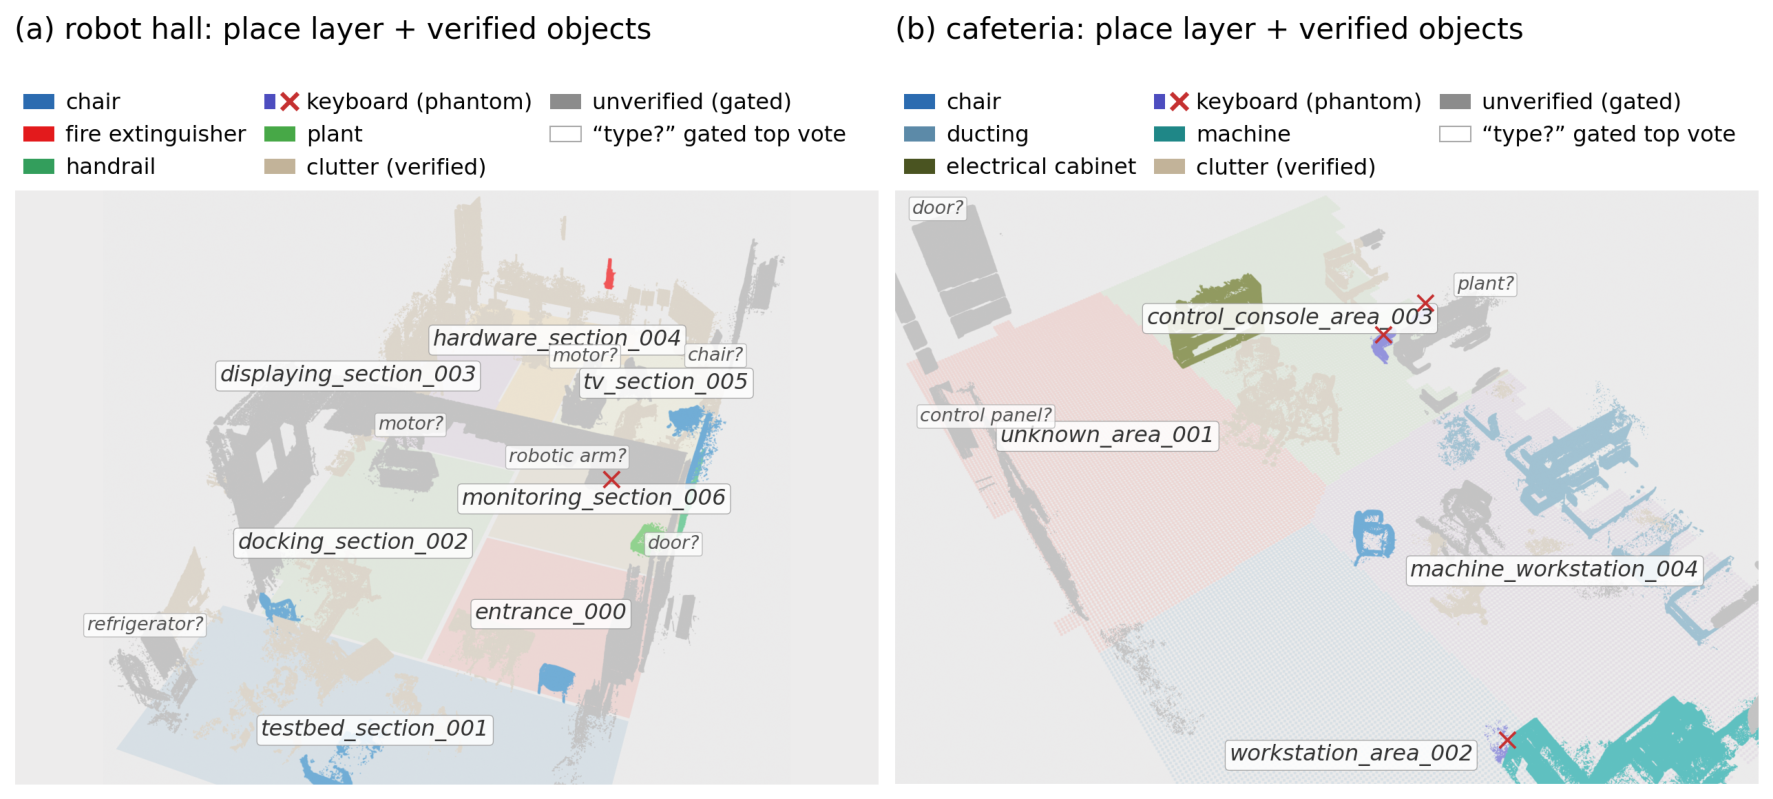
The generated semantic map, visualized at the verification stage (before owner feedback), so the confidence gate and the errors that pass it are both visible. (
a) Robot hall: SLIC place-layer regions (pastel floor, named by the LLM ring-code scheme of
Section 4.9) with the room-scoped object clusters rendered as their full-resolution segmented points, colored by verified class; gray clusters are
unverified and demoted at query time. In (
a) the phantom keyboard is a few-point cluster hidden beneath the label of the monitoring section, so only its cross marker is visible at this scale. Gray italic callouts name the gate’s withheld top votes—the hall’s mobile manipulators surface as
motor?, and both cafeteria doors are correctly suspected but held below the resolve threshold—while the hall’s machines and wall TV sit unnamed inside the gray and clutter mass, the absorption class of
Section 5.3. (
b) The cafeteria stress scene under the same representation, its place layer derived by the identical SLIC recipe after synthesizing the occupancy grid from the scan’s floor points (no SLAM run exists for this scene). Red crosses mark verified-keyboard clusters that are owner-refuted phantoms—no keyboard exists in either scene—and the olive “electrical cabinet” in (
b) is in fact a planter partition, an owner-graded wrong label shown as the verifier produced it. Place naming is verifier-bounded accordingly: the cafeteria phantoms pull two region names toward workstation/console semantics, the same label-propagation mechanism as the
staircase_landing case of
Section 5.3.
Figure 2.
The generated semantic map, visualized at the verification stage (before owner feedback), so the confidence gate and the errors that pass it are both visible. (
a) Robot hall: SLIC place-layer regions (pastel floor, named by the LLM ring-code scheme of
Section 4.9) with the room-scoped object clusters rendered as their full-resolution segmented points, colored by verified class; gray clusters are
unverified and demoted at query time. In (
a) the phantom keyboard is a few-point cluster hidden beneath the label of the monitoring section, so only its cross marker is visible at this scale. Gray italic callouts name the gate’s withheld top votes—the hall’s mobile manipulators surface as
motor?, and both cafeteria doors are correctly suspected but held below the resolve threshold—while the hall’s machines and wall TV sit unnamed inside the gray and clutter mass, the absorption class of
Section 5.3. (
b) The cafeteria stress scene under the same representation, its place layer derived by the identical SLIC recipe after synthesizing the occupancy grid from the scan’s floor points (no SLAM run exists for this scene). Red crosses mark verified-keyboard clusters that are owner-refuted phantoms—no keyboard exists in either scene—and the olive “electrical cabinet” in (
b) is in fact a planter partition, an owner-graded wrong label shown as the verifier produced it. Place naming is verifier-bounded accordingly: the cafeteria phantoms pull two region names toward workstation/console semantics, the same label-propagation mechanism as the
staircase_landing case of
Section 5.3.

Figure 3.
Geometric backbone of TLS-SMF, illustrated on the test-room scene. (a) Registered multi-station TLS scan after preprocessing. (b) The same cloud after seeded-RANSAC removal of structural planes (floor, walls, ceiling). (c) Deterministic decomposition of the residual cloud into object instances; colors denote cluster identity, and identical inputs reproduce identical clusters with stable ordering. (d) Two of the resulting TOSM knowledge-graph records with their symbolic, explicit, and implicit attributes; machine_004 carries an owner-verified type correction (machine → Mobile Robot). (e) Structure-remnant filter, shown as a front elevation of the showroom scene: the vertical soffit bands at the three-level ceiling transitions (red) survive horizontal-plane removal and would otherwise surface as phantom objects; the filter removes them while leaving every retained cluster byte-identical.
Figure 3.
Geometric backbone of TLS-SMF, illustrated on the test-room scene. (a) Registered multi-station TLS scan after preprocessing. (b) The same cloud after seeded-RANSAC removal of structural planes (floor, walls, ceiling). (c) Deterministic decomposition of the residual cloud into object instances; colors denote cluster identity, and identical inputs reproduce identical clusters with stable ordering. (d) Two of the resulting TOSM knowledge-graph records with their symbolic, explicit, and implicit attributes; machine_004 carries an owner-verified type correction (machine → Mobile Robot). (e) Structure-remnant filter, shown as a front elevation of the showroom scene: the vertical soffit bands at the three-level ceiling transitions (red) survive horizontal-plane removal and would otherwise surface as phantom objects; the filter removes them while leaving every retained cluster byte-identical.
Figure 4.
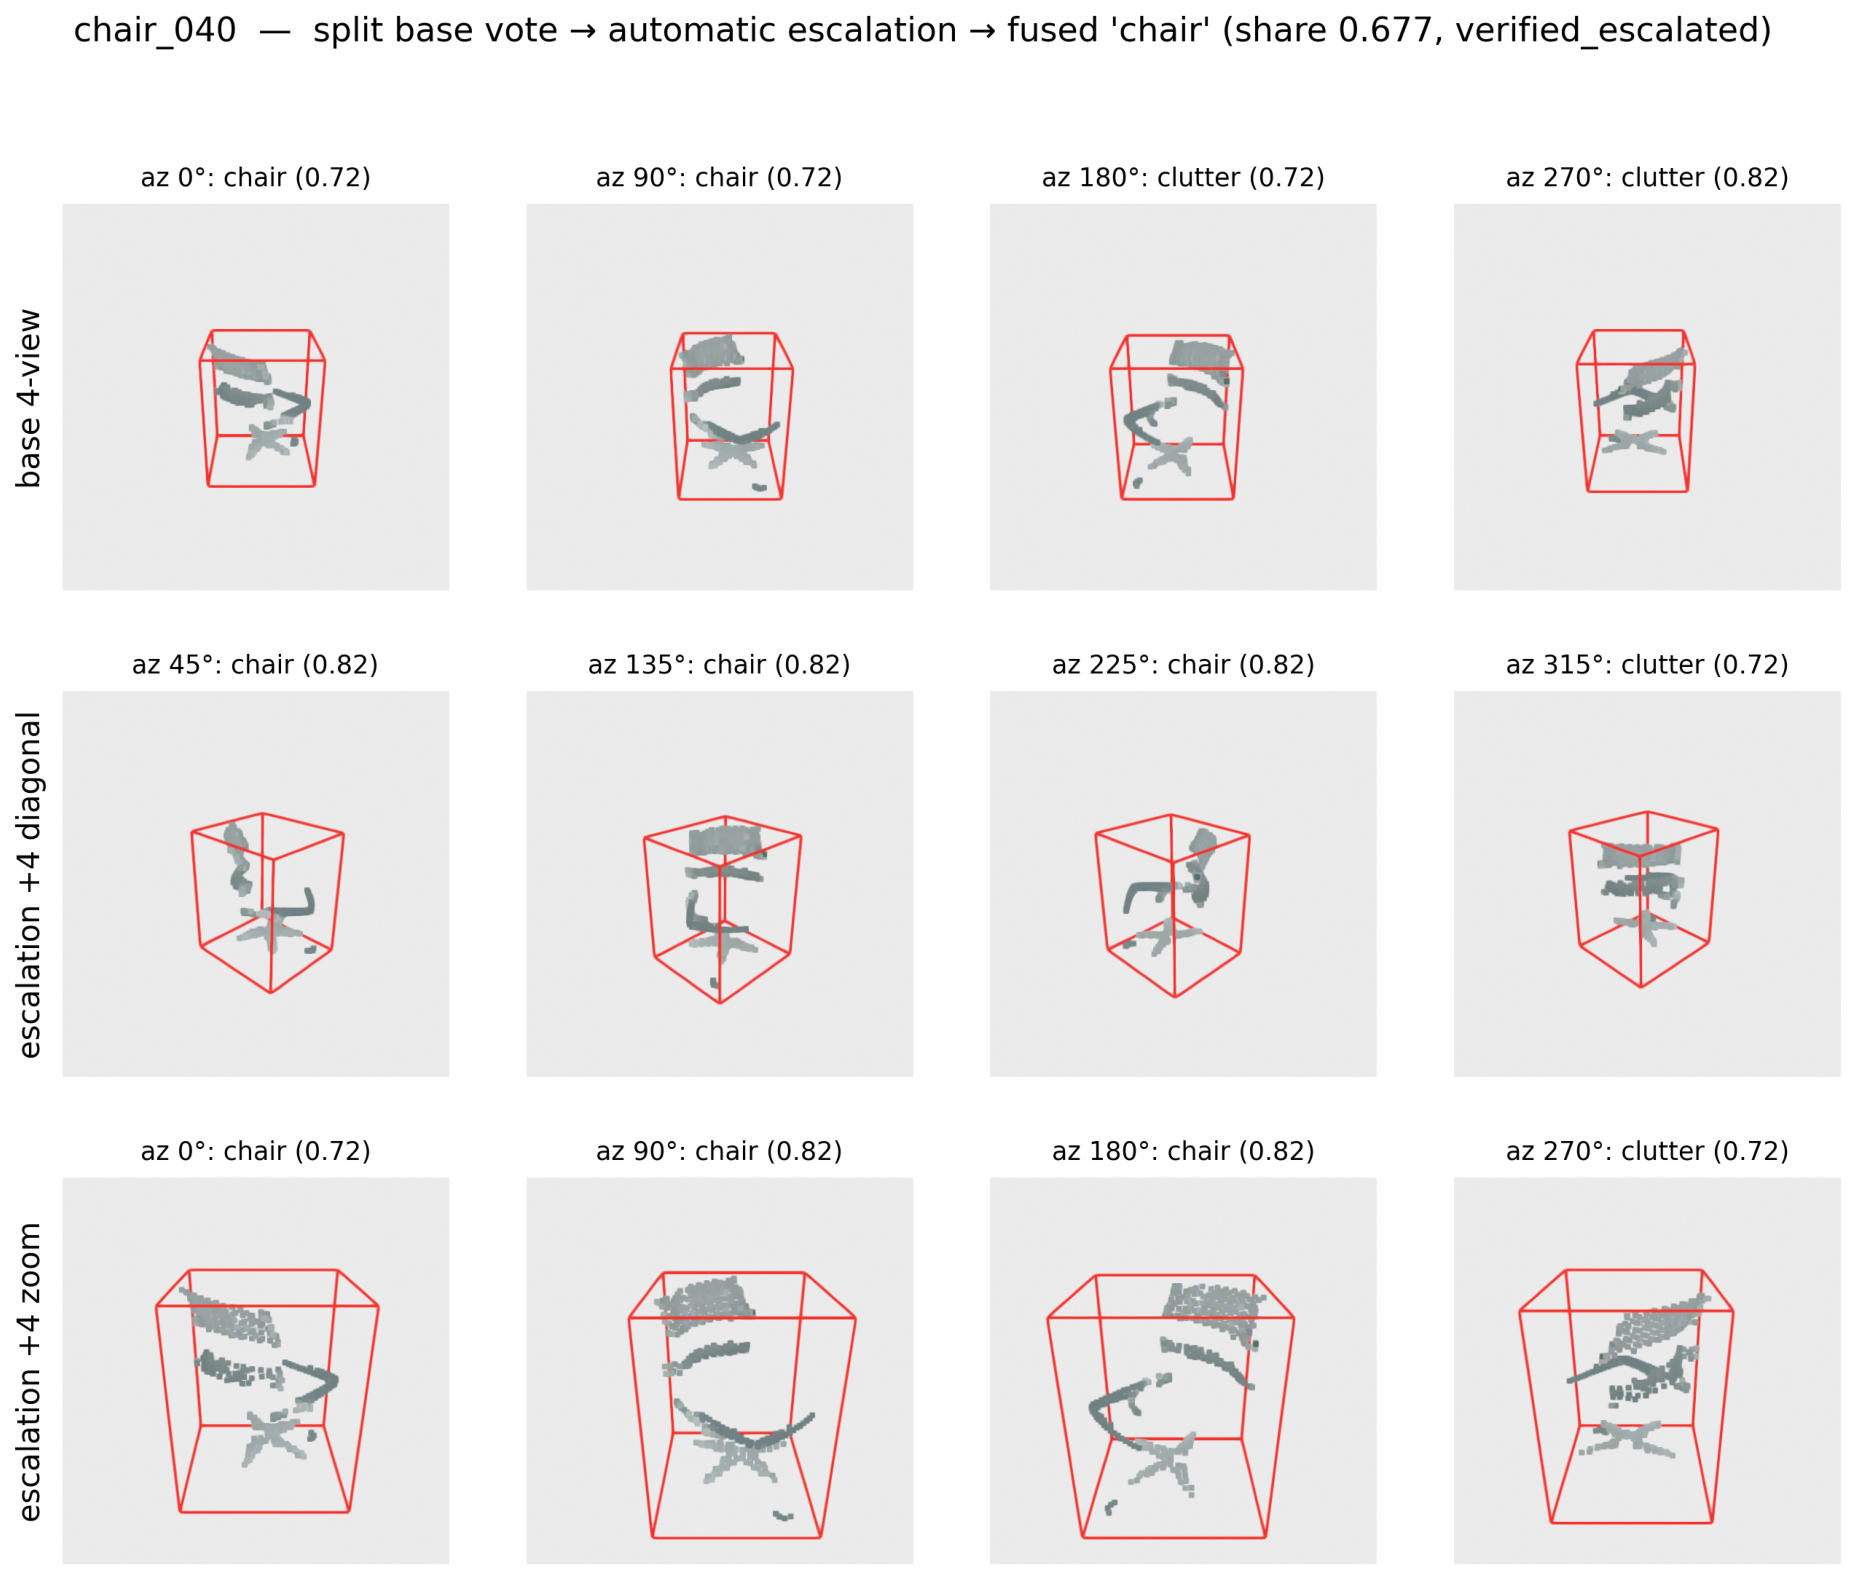
Multi-view verification and automatic escalation, with per-view votes, fused share, and the three terminal statuses.
Figure 4.
Multi-view verification and automatic escalation, with per-view votes, fused share, and the three terminal statuses.
Figure 5.
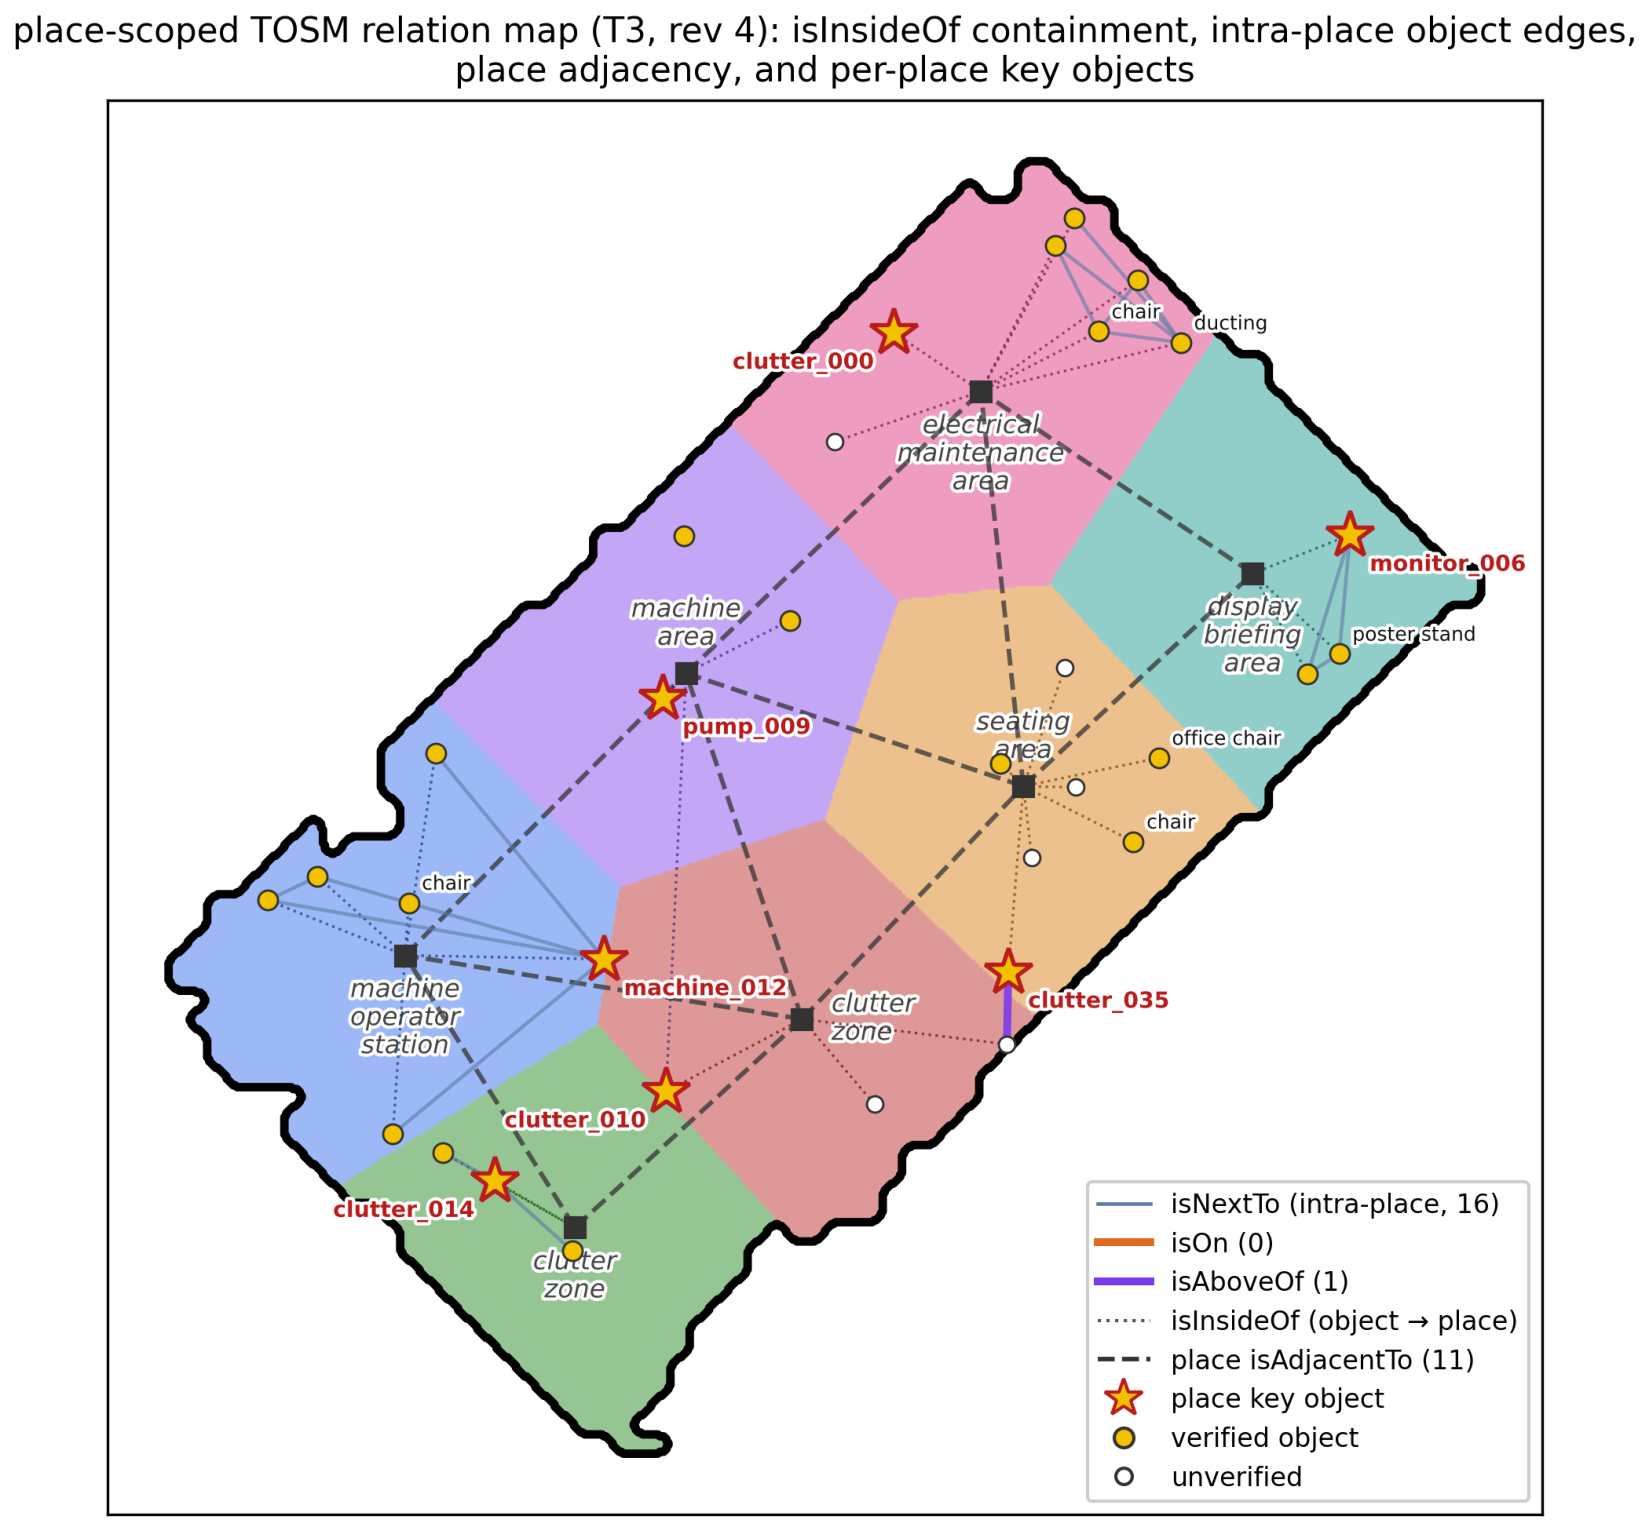
Place-scoped TOSM relation map (T3) over the pastel-washed place layer of
Section 4.9: dotted object→place
isInsideOf containment, intra-place
isNextTo edges, vertical
isOn/
isAboveOf relations, dashed place
isAdjacentTo edges between region centroids, and per-place key objects (named stars). The map reflects the graph’s current revision, including owner feedback (
Section 5.4).
Figure 5.
Place-scoped TOSM relation map (T3) over the pastel-washed place layer of
Section 4.9: dotted object→place
isInsideOf containment, intra-place
isNextTo edges, vertical
isOn/
isAboveOf relations, dashed place
isAdjacentTo edges between region centroids, and per-place key objects (named stars). The map reflects the graph’s current revision, including owner feedback (
Section 5.4).
Figure 6.
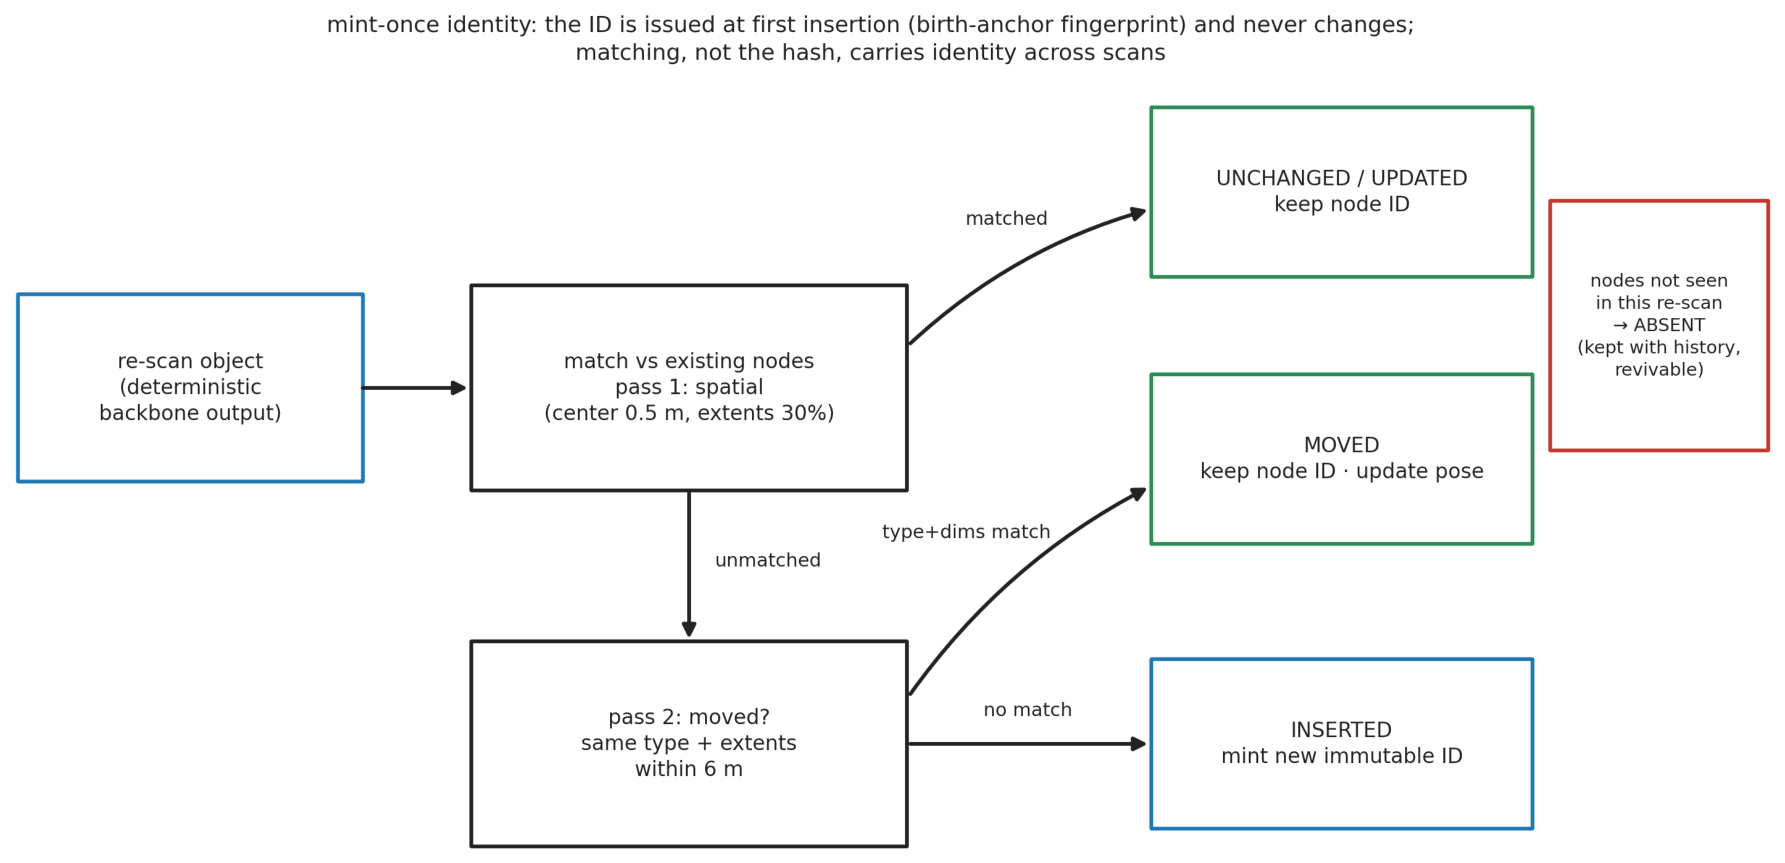
Identity matching and confidence-gated upsert: mint-once IDs, two-pass matching, and the five node outcomes across a re-scan.
Figure 6.
Identity matching and confidence-gated upsert: mint-once IDs, two-pass matching, and the five node outcomes across a re-scan.
Figure 7.
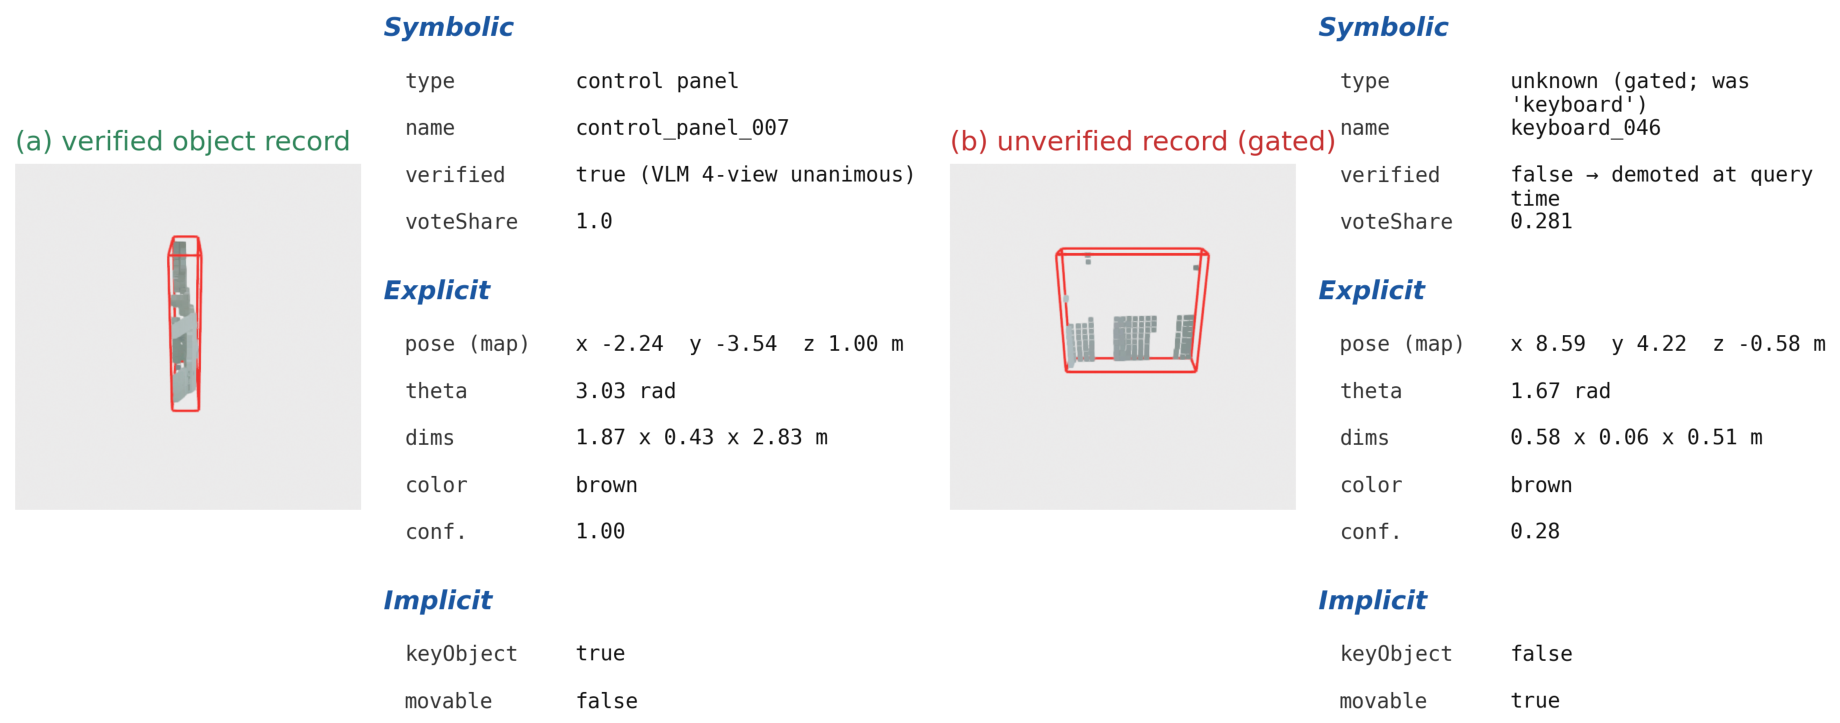
TOSM semantic-object records (symbolic/explicit/implicit layers). (a) A verified record asserts its type. (b) An unverified record is structurally gated at query time: the type is demoted to unknown, and the failed classifier guess is quarantined in failedCandidateType.
Figure 7.
TOSM semantic-object records (symbolic/explicit/implicit layers). (a) A verified record asserts its type. (b) An unverified record is structurally gated at query time: the type is demoted to unknown, and the failed classifier guess is quarantined in failedCandidateType.
Figure 8.
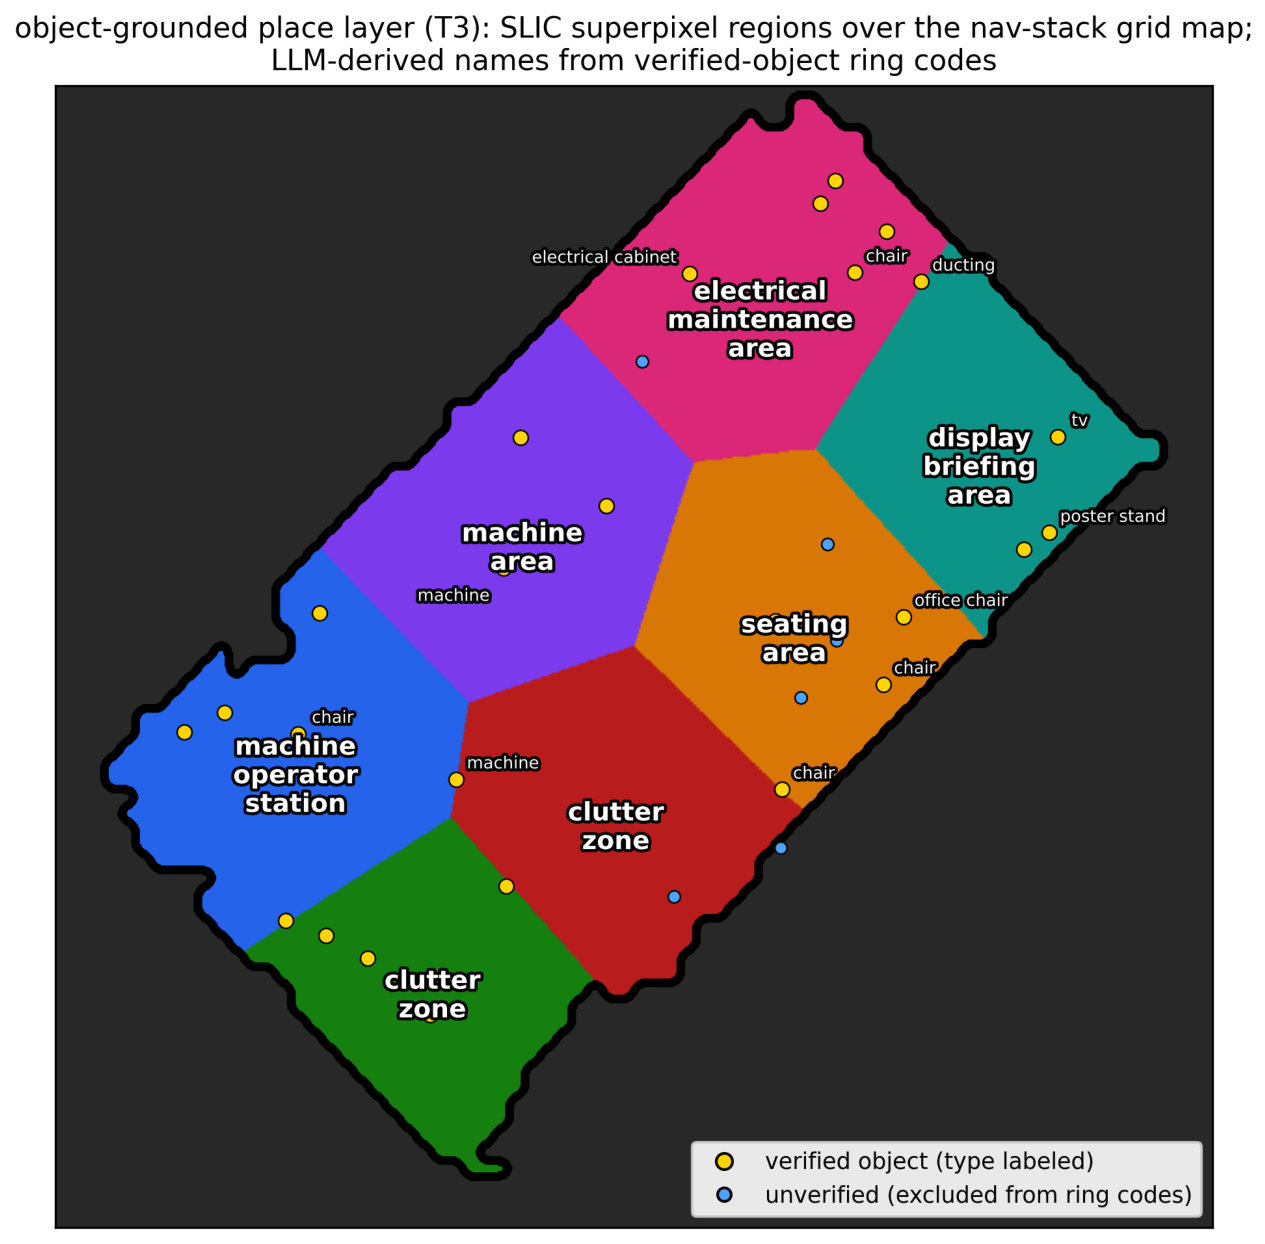
Object-grounded place layer at T3. SLIC superpixel regions [
42] tile the room interior delimited by the nav-stack grid map’s outer boundary and carry LLM-derived names computed from verified-object ring codes; unverified objects (blue markers) do not contribute, so the confidence gate propagates into place semantics. Shown at the graph’s owner-corrected revision (
Section 5.4).
Figure 8.
Object-grounded place layer at T3. SLIC superpixel regions [
42] tile the room interior delimited by the nav-stack grid map’s outer boundary and carry LLM-derived names computed from verified-object ring codes; unverified objects (blue markers) do not contribute, so the confidence gate propagates into place semantics. Shown at the graph’s owner-corrected revision (
Section 5.4).
Figure 9.
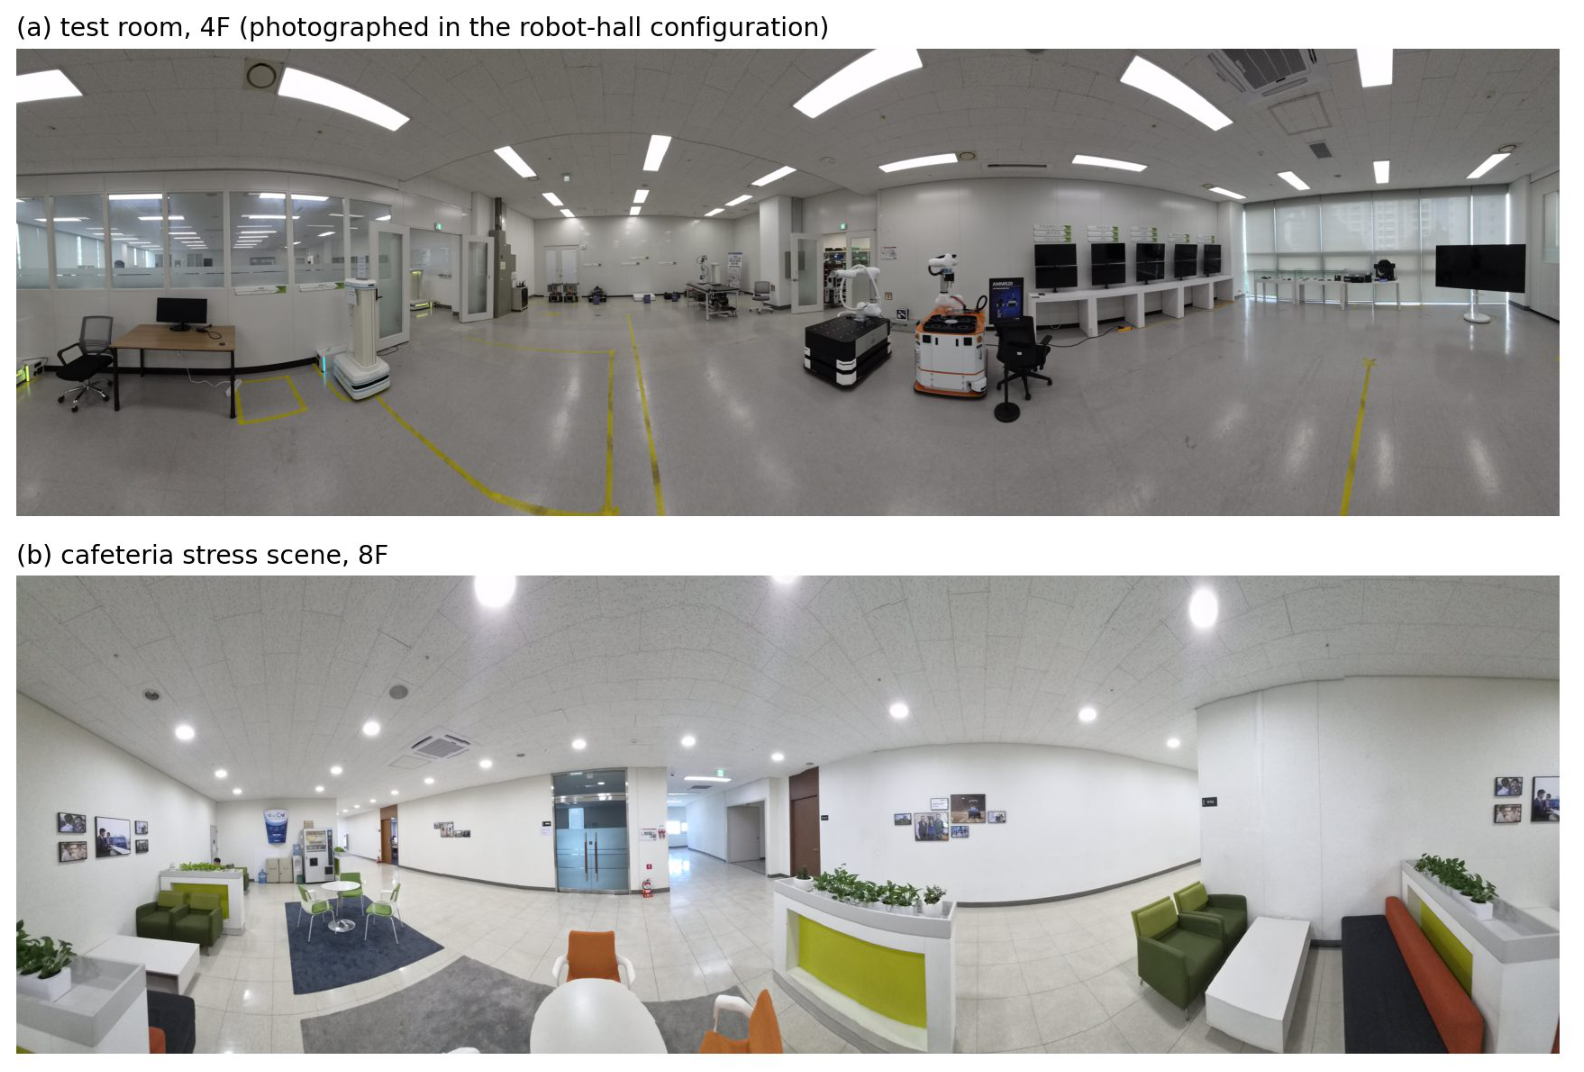
The two experimental sites. (
a) The 4F test room, photographed in its robot-hall configuration (the showroom epoch T1 is an earlier furnishing of the same room; visible: the AMMR platforms, the wall-mounted monitor bank of
Section 5.2, and the disinfection robot). (
b) The 8F cafeteria stress scene of
Section 5.8: fabric sofas, planter partitions, the vending row, and—center right—the brown door recovered by escalation on full-resolution renders.
Figure 9.
The two experimental sites. (
a) The 4F test room, photographed in its robot-hall configuration (the showroom epoch T1 is an earlier furnishing of the same room; visible: the AMMR platforms, the wall-mounted monitor bank of
Section 5.2, and the disinfection robot). (
b) The 8F cafeteria stress scene of
Section 5.8: fabric sofas, planter partitions, the vending row, and—center right—the brown door recovered by escalation on full-resolution renders.
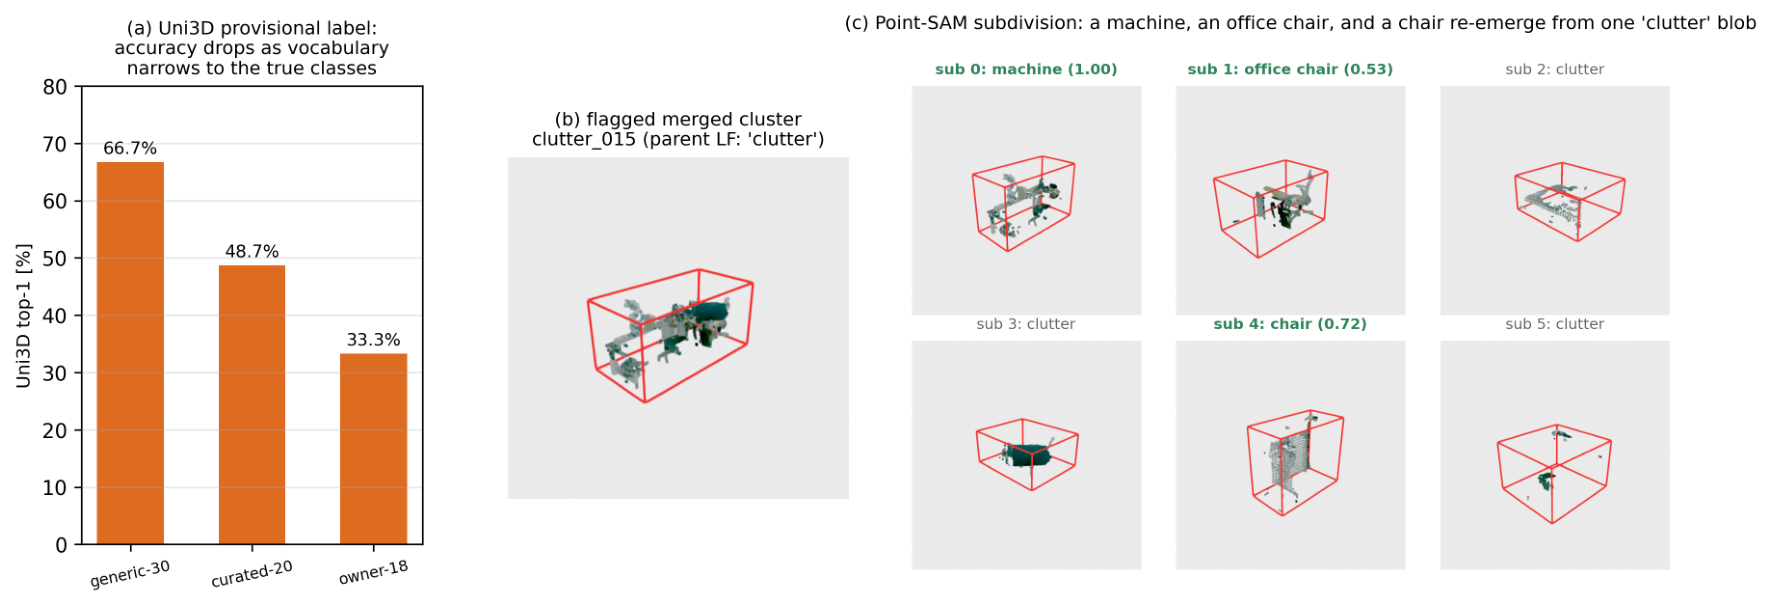
Figure 10.
Learned components used as bounded tools. (
a) The Uni3D provisional label degrades as the vocabulary narrows to the deployment’s true classes (
Section 5.8)—why it is treated as untrusted context. (
b,
c) Conditional Point-SAM refinement of a flagged merged cluster: a machine, an office chair, and a chair re-emerge from a single
clutter blob, each re-verified independently.
Figure 10.
Learned components used as bounded tools. (
a) The Uni3D provisional label degrades as the vocabulary narrows to the deployment’s true classes (
Section 5.8)—why it is treated as untrusted context. (
b,
c) Conditional Point-SAM refinement of a flagged merged cluster: a machine, an office chair, and a chair re-emerge from a single
clutter blob, each re-verified independently.
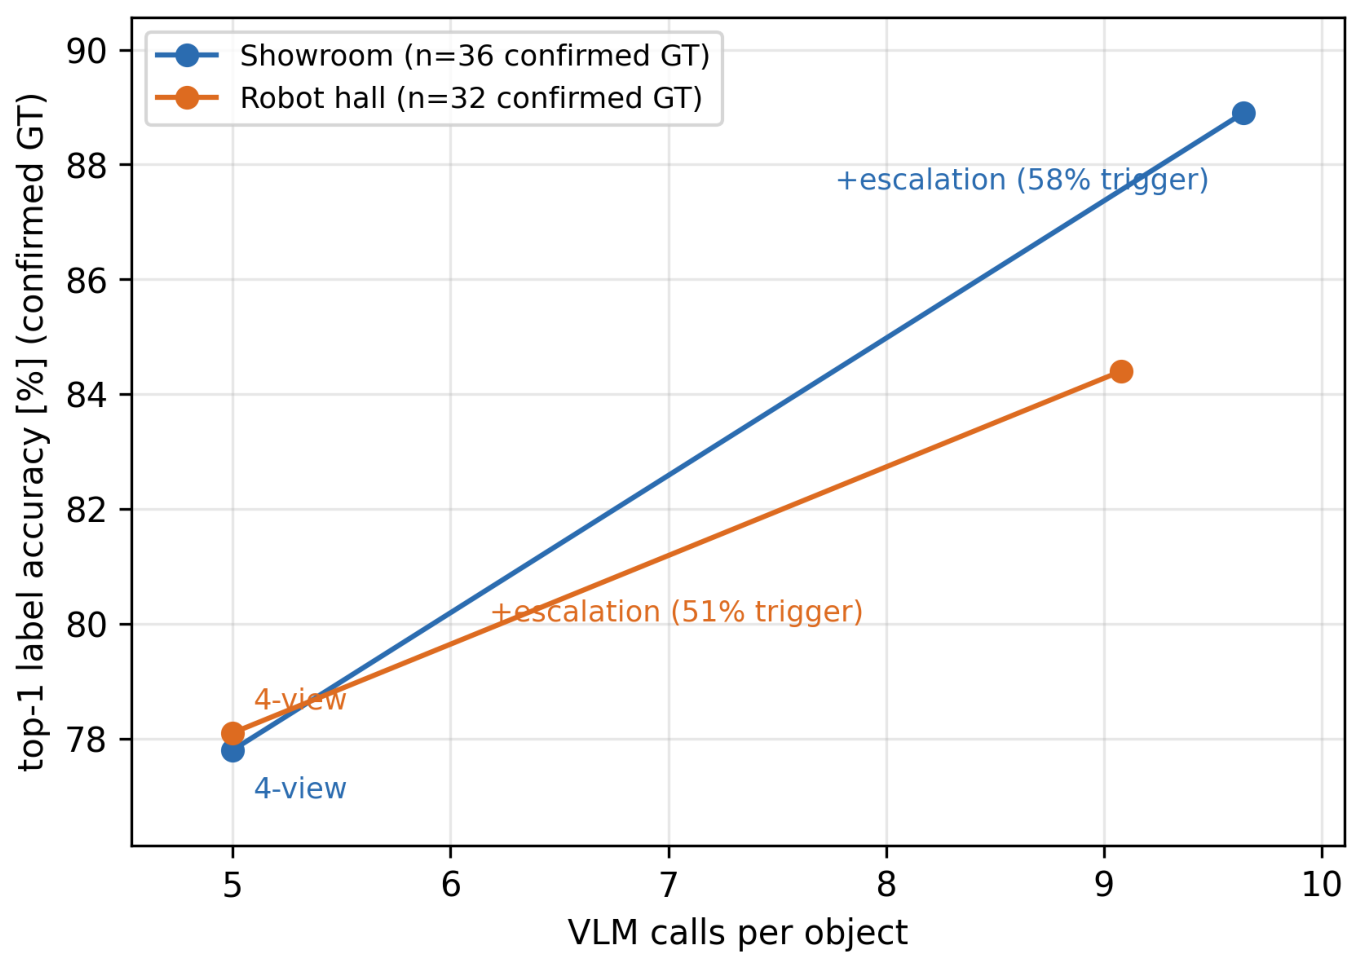
Figure 11.
Escalation accuracy–cost curves for both scenes.
Figure 11.
Escalation accuracy–cost curves for both scenes.
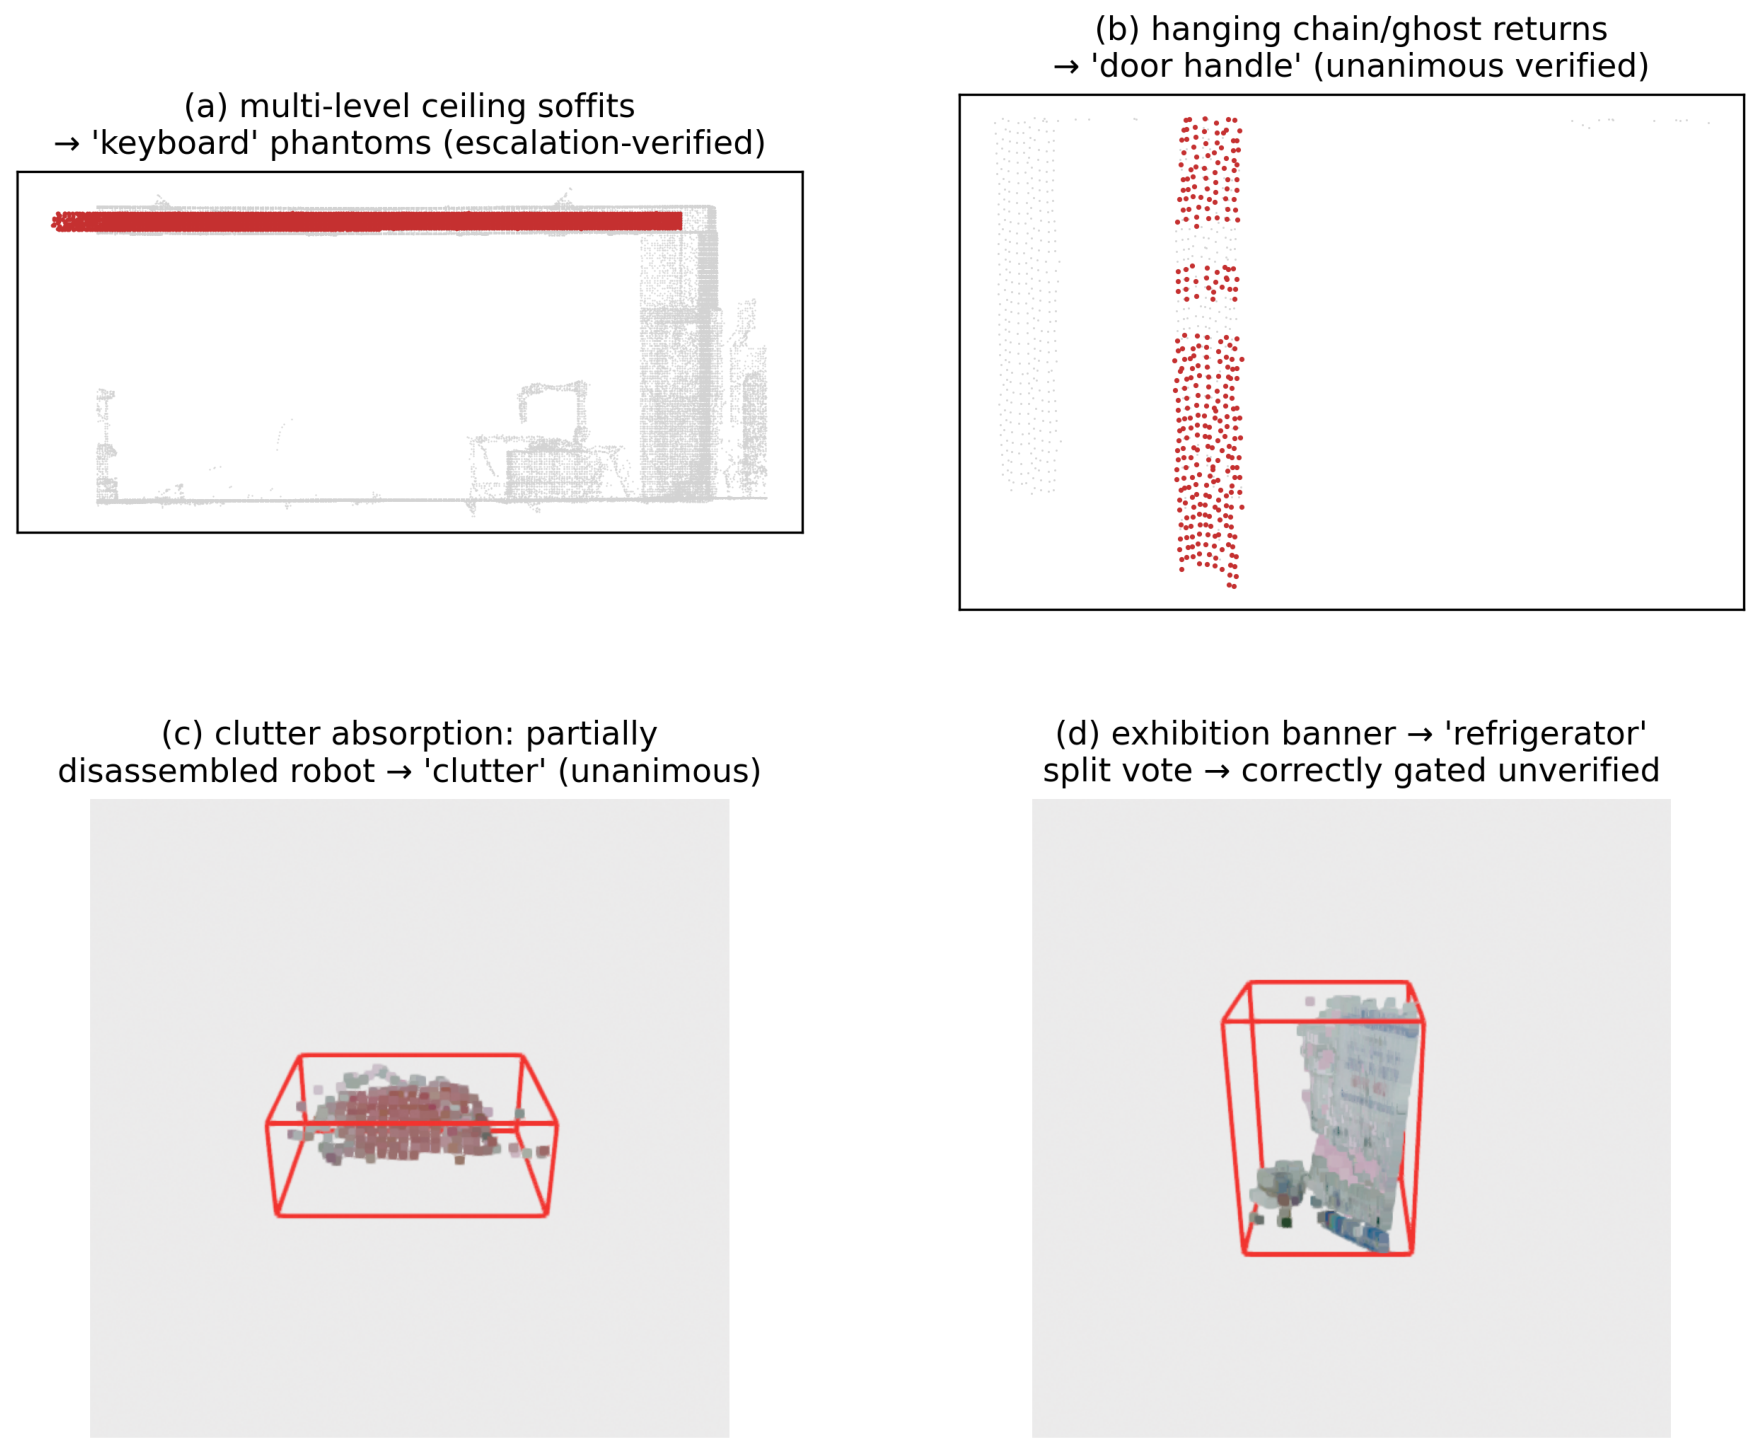
Figure 12.
Verification error taxonomy: remnant phantom, unanimous-but-wrong, clutter absorption, render ambiguity.
Figure 12.
Verification error taxonomy: remnant phantom, unanimous-but-wrong, clutter absorption, render ambiguity.
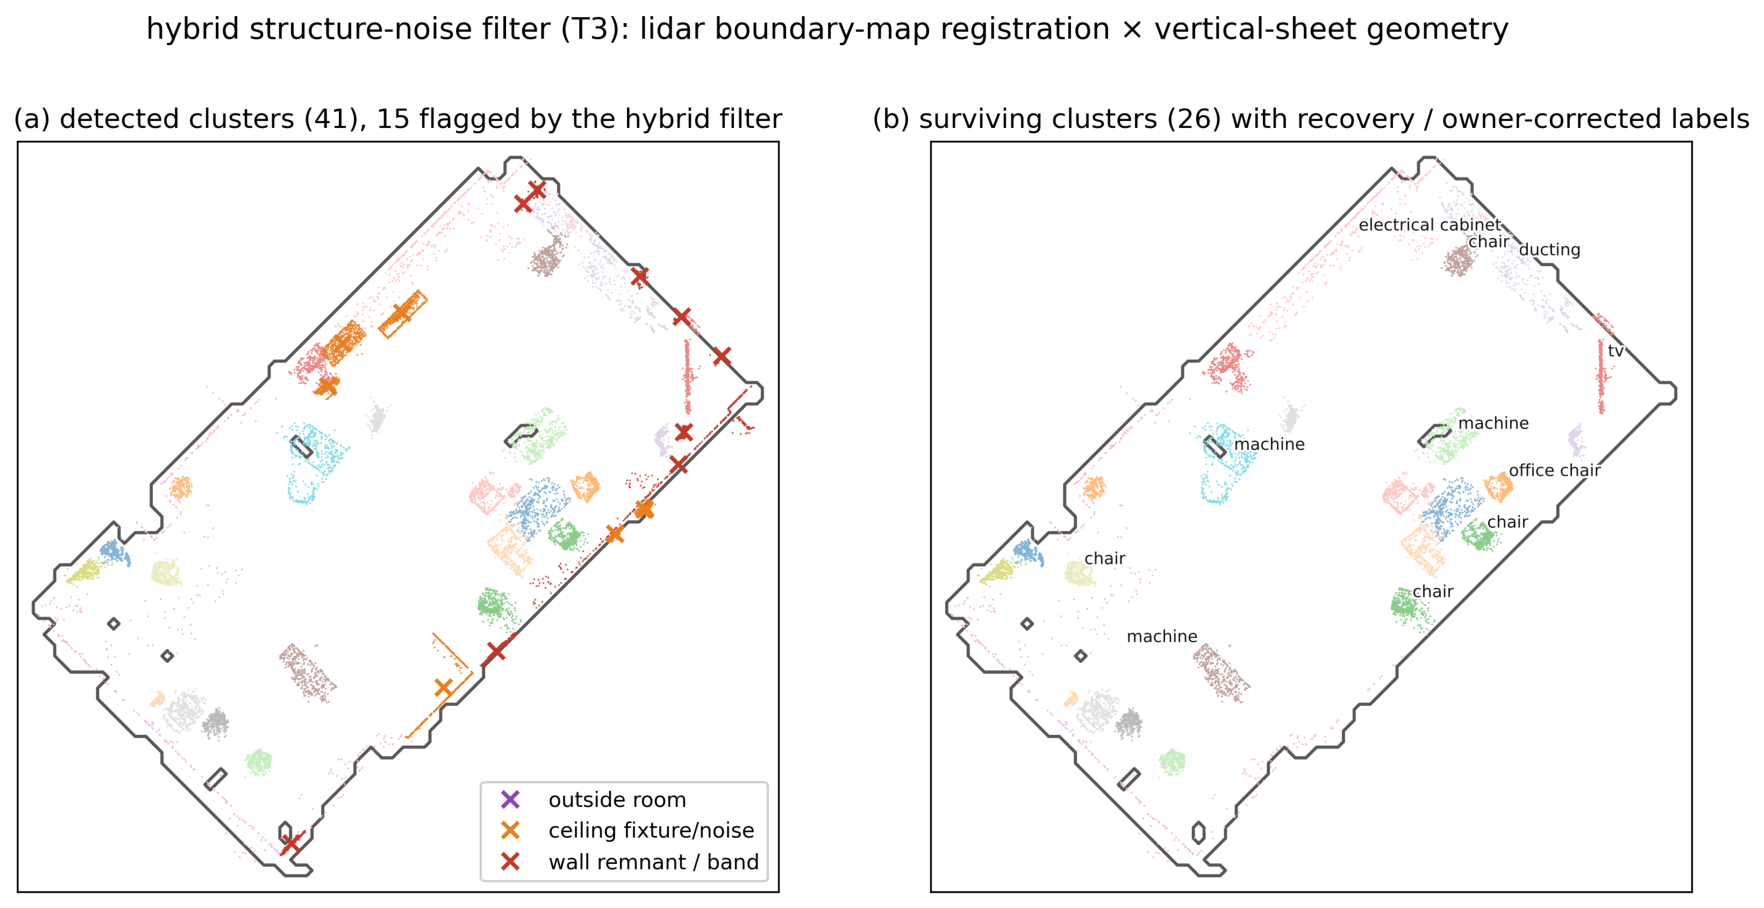
Figure 13.
Hybrid structure-noise filter on the T3 epoch. (a) All 41 detected clusters; the 15 flagged ones are colored by rule—wall remnant/band (grid-map hug × thin vertical sheet, or long full-height band), ceiling fixture/noise, outside the room boundary. (b) The 26 survivors with recovery/owner-corrected labels. The wall-flush monitor bank (labeled tv) and wall-mounted equipment survive; residual merge labels (electrical cabinet, ducting) are retained pipeline output, not corrections. Cluster colors in both panels are arbitrary per-cluster identifiers; the cross colors in (a) follow the in-panel legend.
Figure 13.
Hybrid structure-noise filter on the T3 epoch. (a) All 41 detected clusters; the 15 flagged ones are colored by rule—wall remnant/band (grid-map hug × thin vertical sheet, or long full-height band), ceiling fixture/noise, outside the room boundary. (b) The 26 survivors with recovery/owner-corrected labels. The wall-flush monitor bank (labeled tv) and wall-mounted equipment survive; residual merge labels (electrical cabinet, ducting) are retained pipeline output, not corrections. Cluster colors in both panels are arbitrary per-cluster identifiers; the cross colors in (a) follow the in-panel legend.
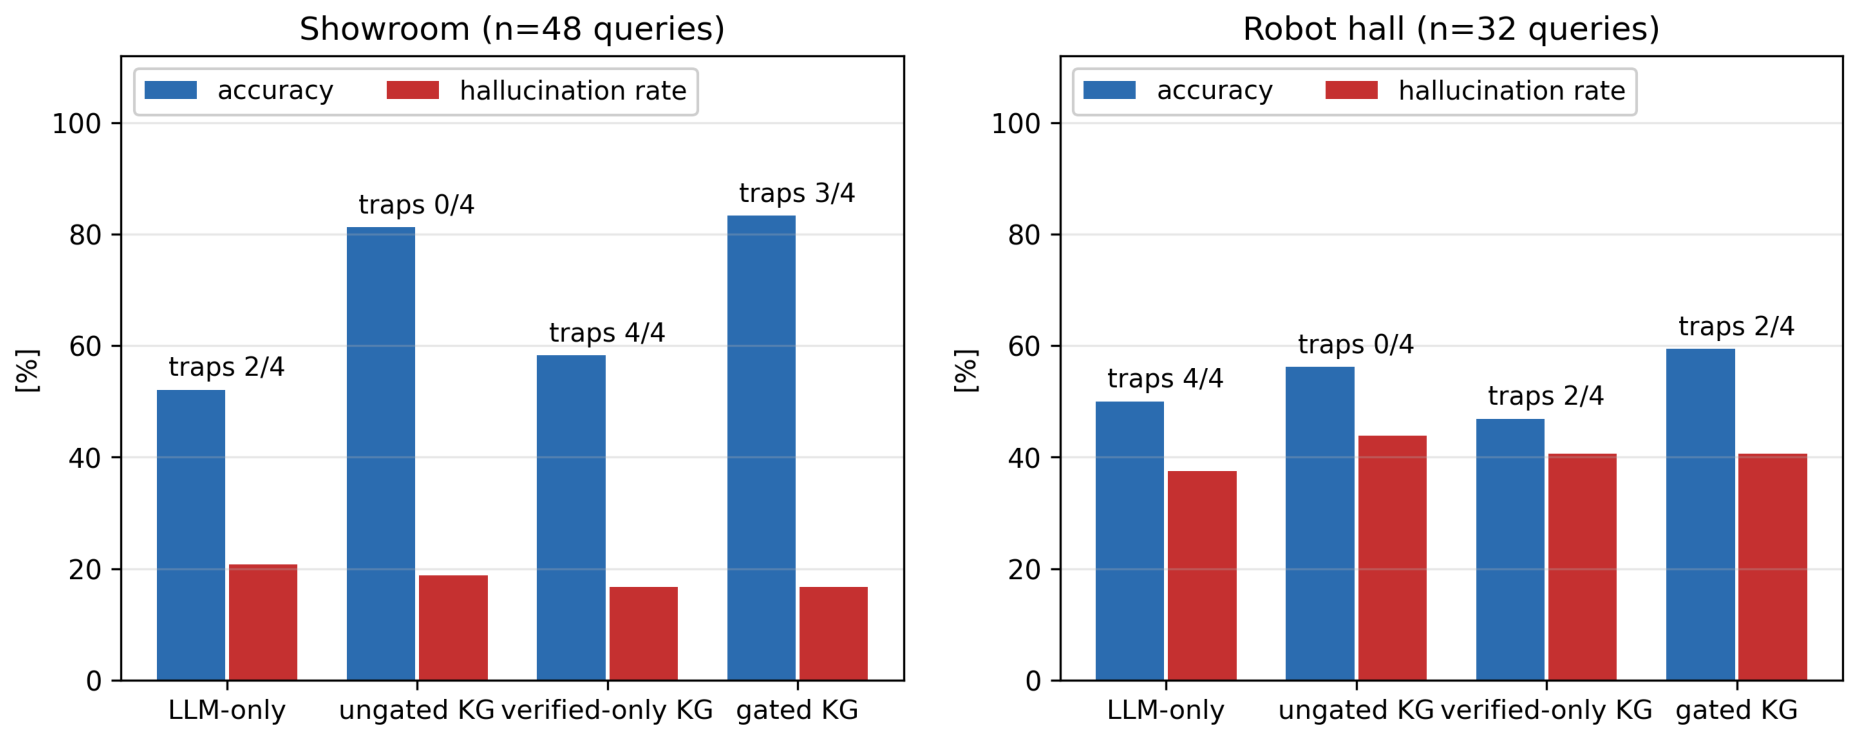
Figure 14.
Four-condition query benchmark with trap-question panel.
Figure 14.
Four-condition query benchmark with trap-question panel.
Figure 15.
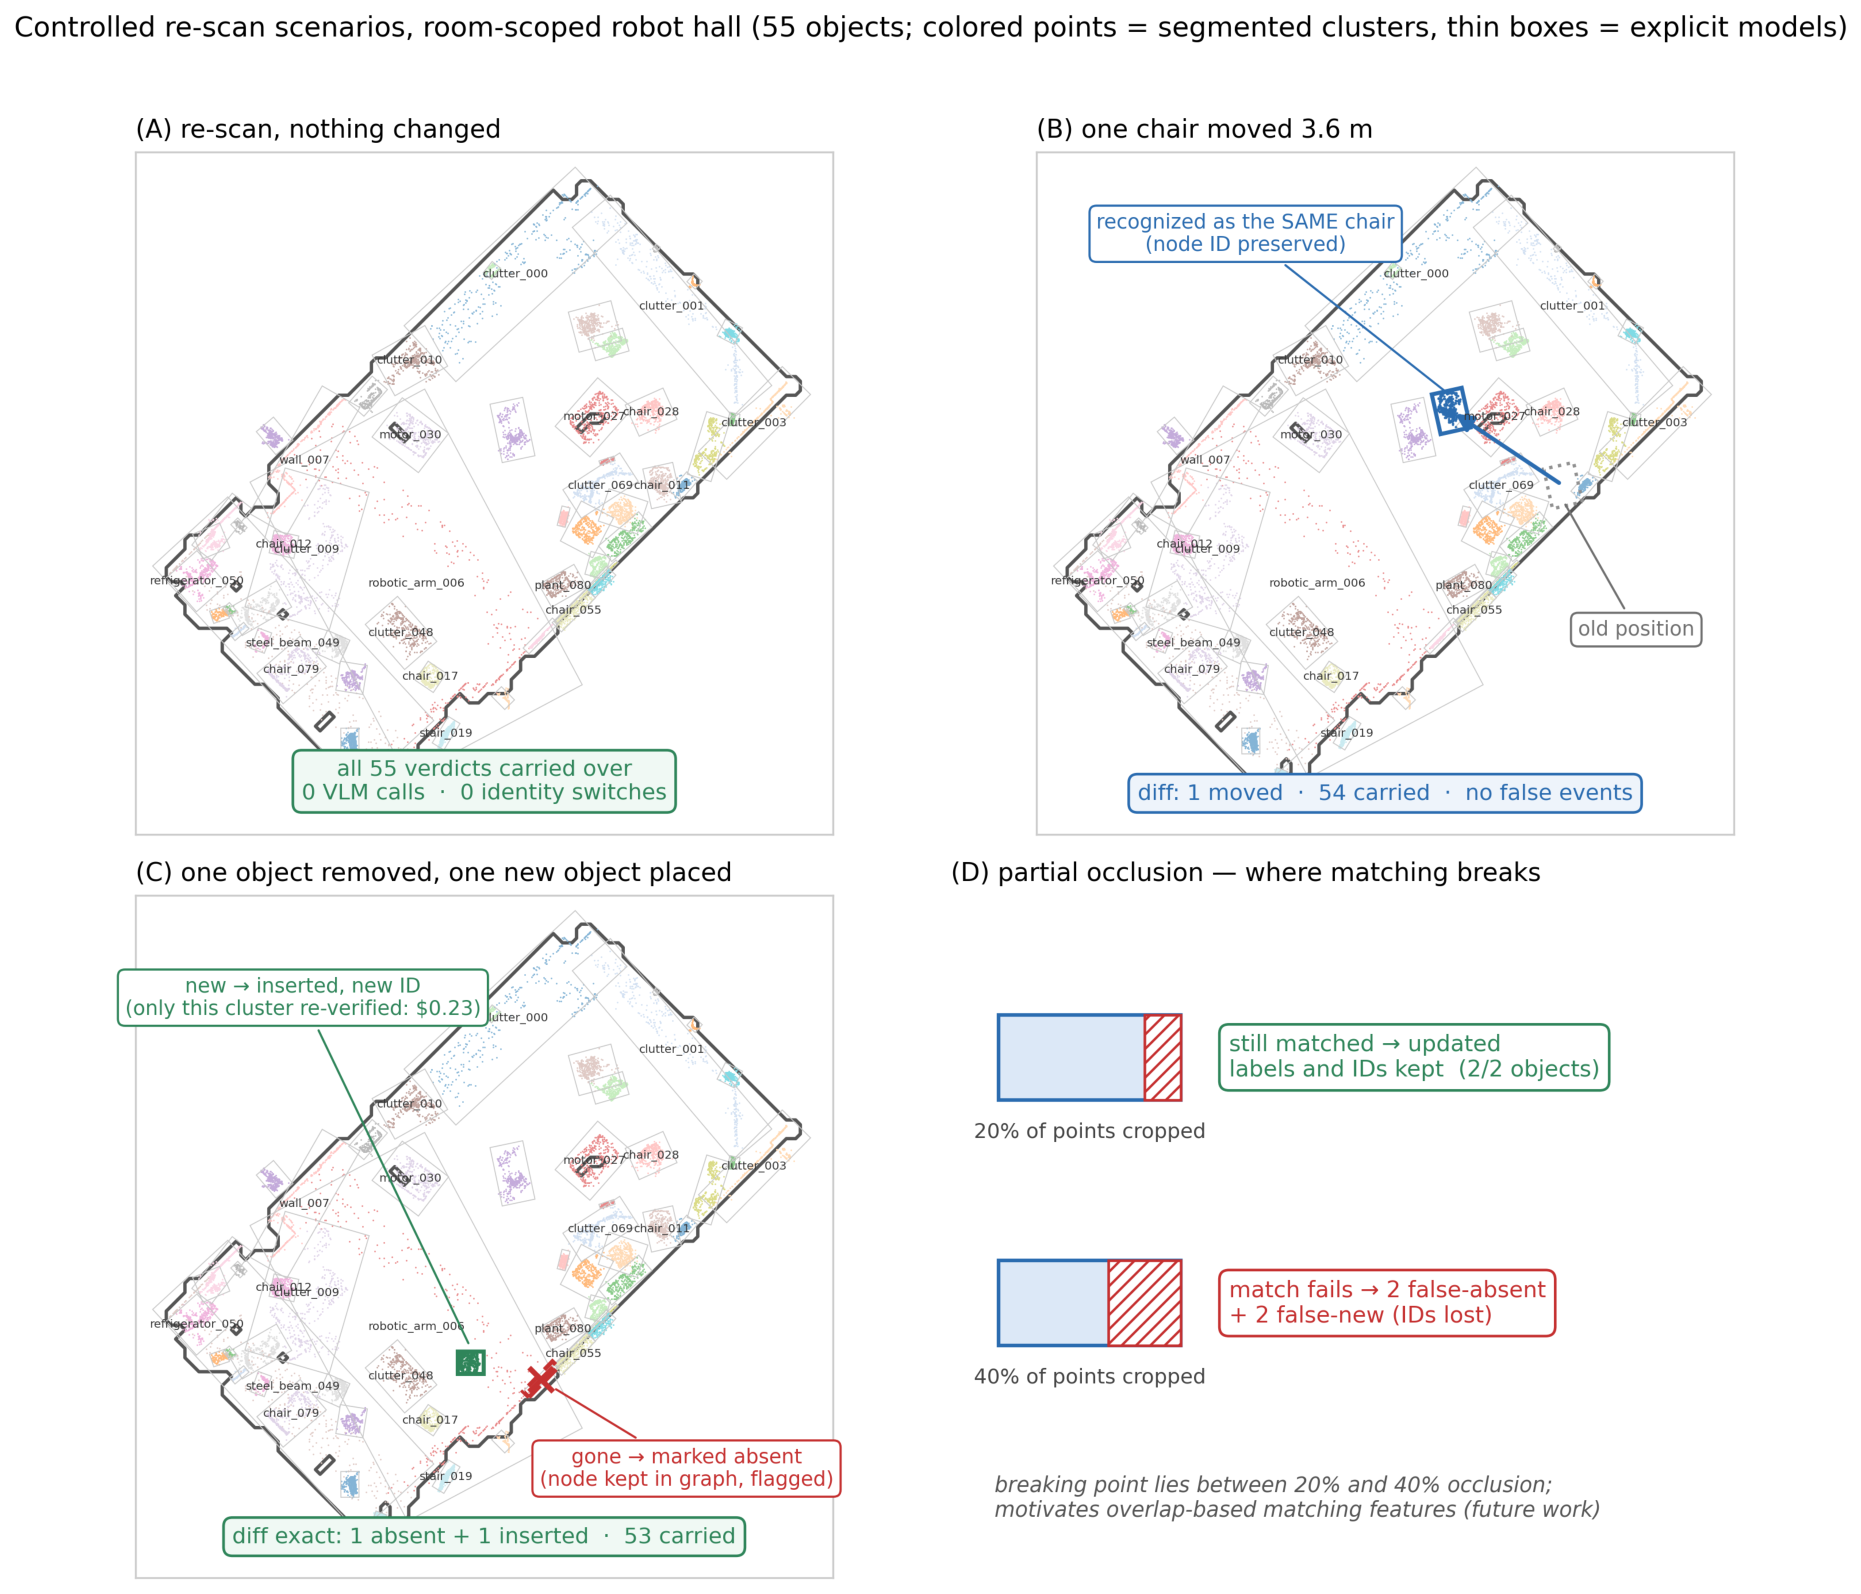
Controlled re-scan scenarios A–D (room-scoped robot hall, 55 objects), top-down view. Colored points are the segmented clusters, thin rotated rectangles their explicit-model footprints with node names, and the dark contour the test-room boundary; each edited object is annotated with the matcher’s decision. (A) A repeat scan with no changes carries all 55 verdicts at zero VLM cost. (B) A 3.6 m chair move is classified moved with its node ID preserved. (C) A removed object is marked absent (node kept and flagged) and a newly placed object is inserted under a new ID; only the insertion is re-verified. (D) Partial occlusion: both cropped objects still match at 20%, but at 40% matching fails into two false-absent plus two false-new pairs—the matcher’s quantified breaking point. Call-out and box colors follow the diff state (blue = moved with ID preserved, green = inserted, red = absent); cluster point colors are arbitrary per-cluster identifiers.
Figure 15.
Controlled re-scan scenarios A–D (room-scoped robot hall, 55 objects), top-down view. Colored points are the segmented clusters, thin rotated rectangles their explicit-model footprints with node names, and the dark contour the test-room boundary; each edited object is annotated with the matcher’s decision. (A) A repeat scan with no changes carries all 55 verdicts at zero VLM cost. (B) A 3.6 m chair move is classified moved with its node ID preserved. (C) A removed object is marked absent (node kept and flagged) and a newly placed object is inserted under a new ID; only the insertion is re-verified. (D) Partial occlusion: both cropped objects still match at 20%, but at 40% matching fails into two false-absent plus two false-new pairs—the matcher’s quantified breaking point. Call-out and box colors follow the diff state (blue = moved with ID preserved, green = inserted, red = absent); cluster point colors are arbitrary per-cluster identifiers.
Figure 16.
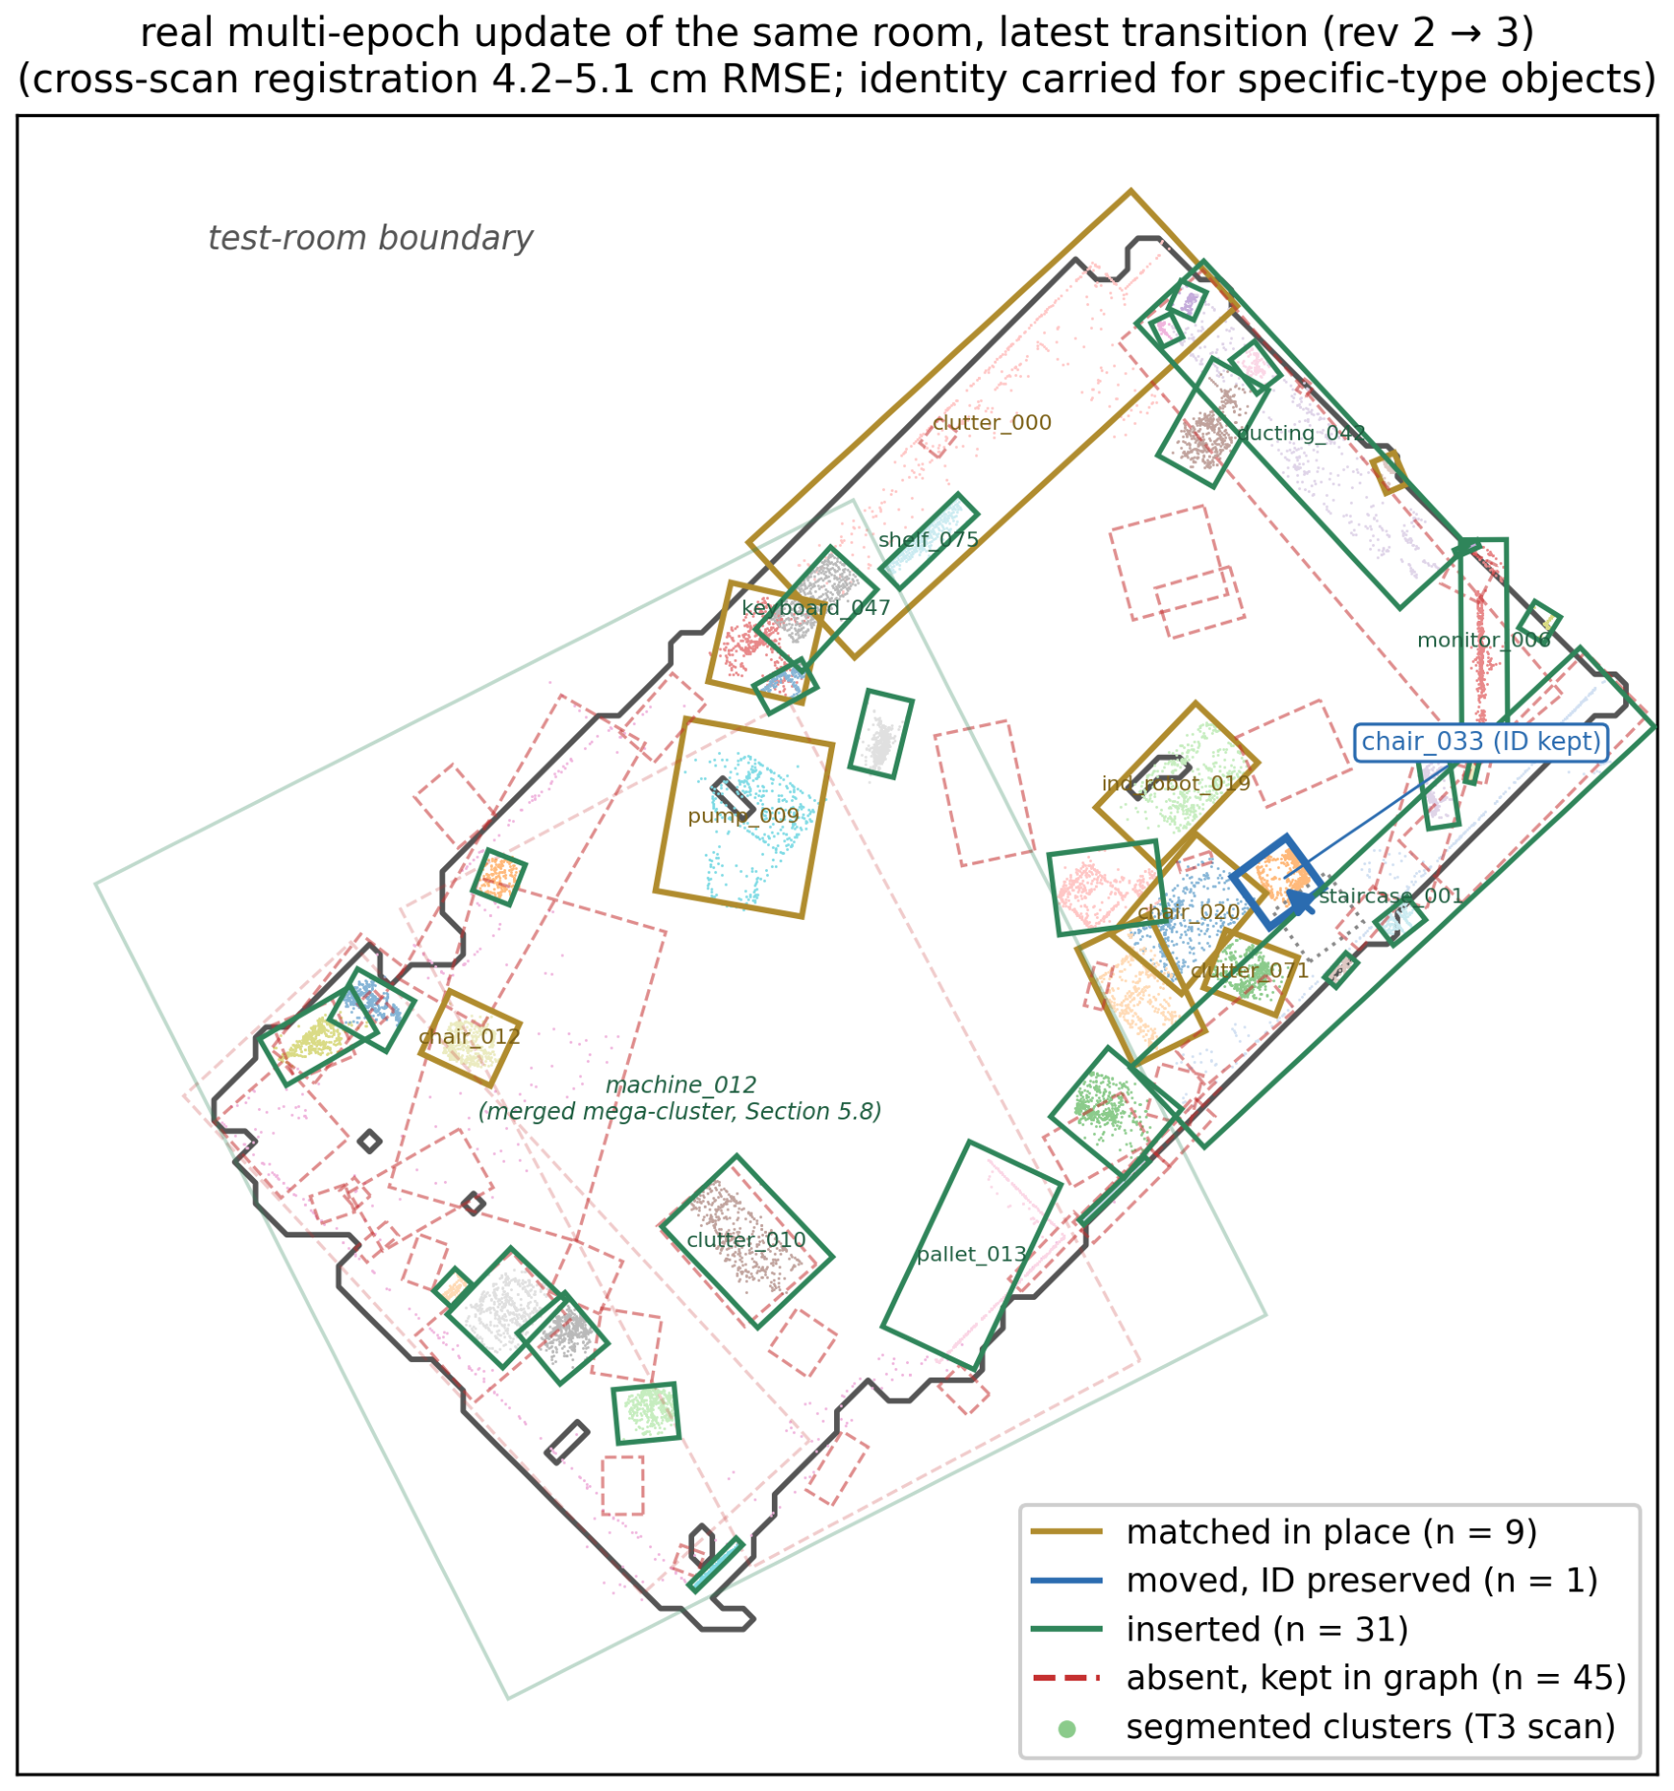
Real multi-epoch update, latest transition (T2→T3), top-down view. Colored points are the T3 segmented clusters inside the test-room boundary; yaw-rotated node footprints are colored by diff state (matched, moved with ID preserved, inserted, absent), with names on specific-type objects. Oversized footprints of merged mega-clusters (e.g.,
machine_012,
Section 5.8) are faded. Legend counts are the number of objects per diff state.
Figure 16.
Real multi-epoch update, latest transition (T2→T3), top-down view. Colored points are the T3 segmented clusters inside the test-room boundary; yaw-rotated node footprints are colored by diff state (matched, moved with ID preserved, inserted, absent), with names on specific-type objects. Oversized footprints of merged mega-clusters (e.g.,
machine_012,
Section 5.8) are faded. Legend counts are the number of objects per diff state.
Figure 17.
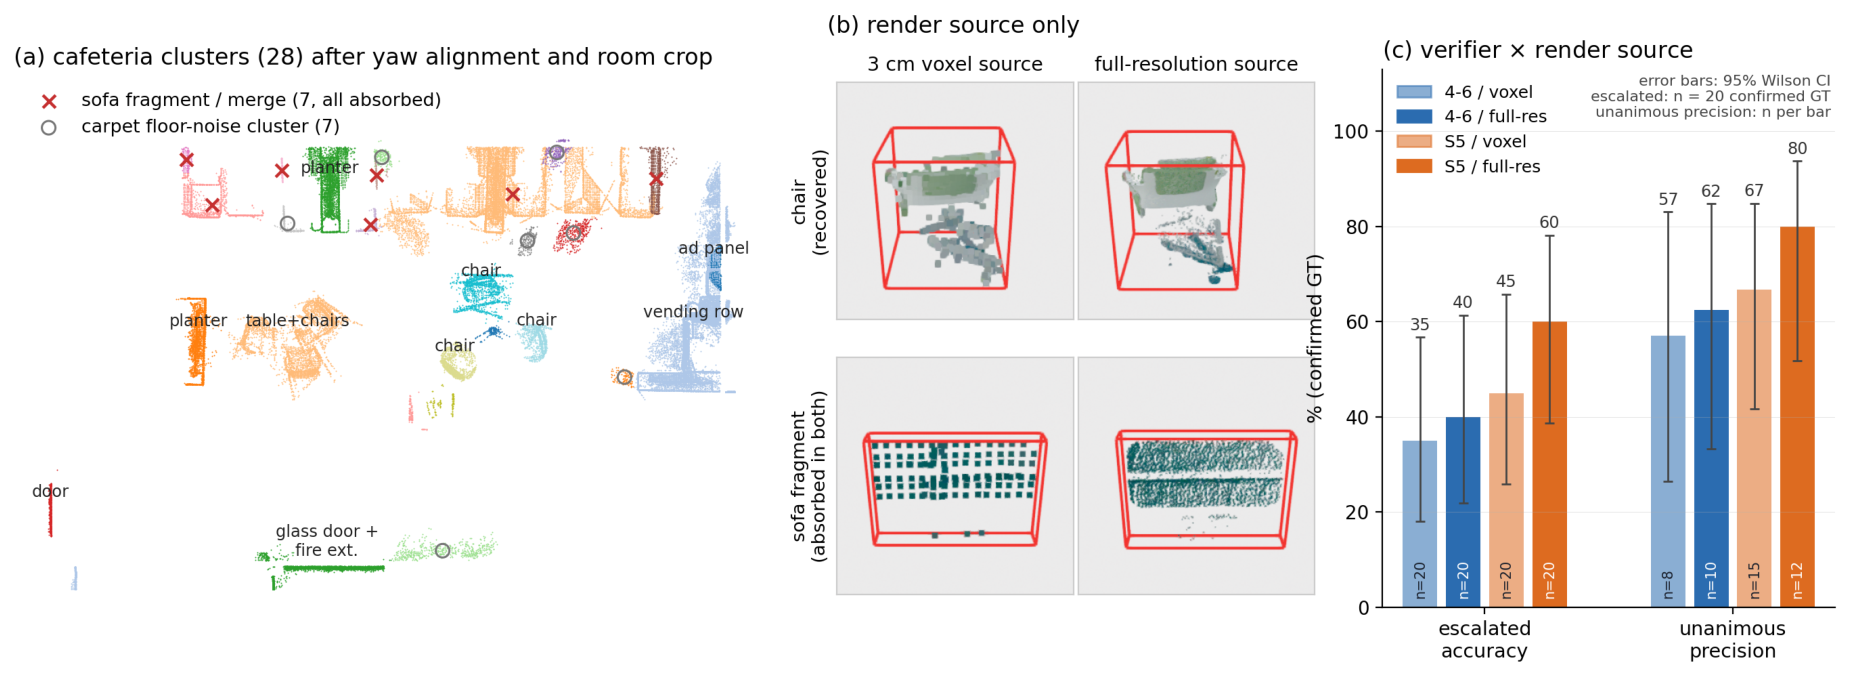
Cafeteria stress scene. (
a) The 28 clusters after automatic yaw alignment and room crop; crosses mark the seven sofa fragments/merges (absorbed as
clutter in every condition of
Table 12), circles the seven carpet floor-noise clusters. (
b) One cluster, rendered from the 3 cm working cloud (left) and from full-resolution re-associated points (right) under the identical 512-px protocol: the chair (top) is recovered by the render-source change alone; the sofa fragment (bottom) is not. (
c) Escalated accuracy (confirmed GT,
n = 20 per cell) and unanimous precision (per-bar
n = 8–15 unanimous objects, annotated on each bar) across verifier × render source; error bars are 95% Wilson intervals, wide on the precision bars because unanimous sets are small—the point estimates order the cells, the intervals bound how far. Cluster colors in (
a) are arbitrary per-cluster identifiers; bar colors in (
c) follow the in-panel legend (verifier by render source).
Figure 17.
Cafeteria stress scene. (
a) The 28 clusters after automatic yaw alignment and room crop; crosses mark the seven sofa fragments/merges (absorbed as
clutter in every condition of
Table 12), circles the seven carpet floor-noise clusters. (
b) One cluster, rendered from the 3 cm working cloud (left) and from full-resolution re-associated points (right) under the identical 512-px protocol: the chair (top) is recovered by the render-source change alone; the sofa fragment (bottom) is not. (
c) Escalated accuracy (confirmed GT,
n = 20 per cell) and unanimous precision (per-bar
n = 8–15 unanimous objects, annotated on each bar) across verifier × render source; error bars are 95% Wilson intervals, wide on the precision bars because unanimous sets are small—the point estimates order the cells, the intervals bound how far. Cluster colors in (
a) are arbitrary per-cluster identifiers; bar colors in (
c) follow the in-panel legend (verifier by render source).
Figure 18.
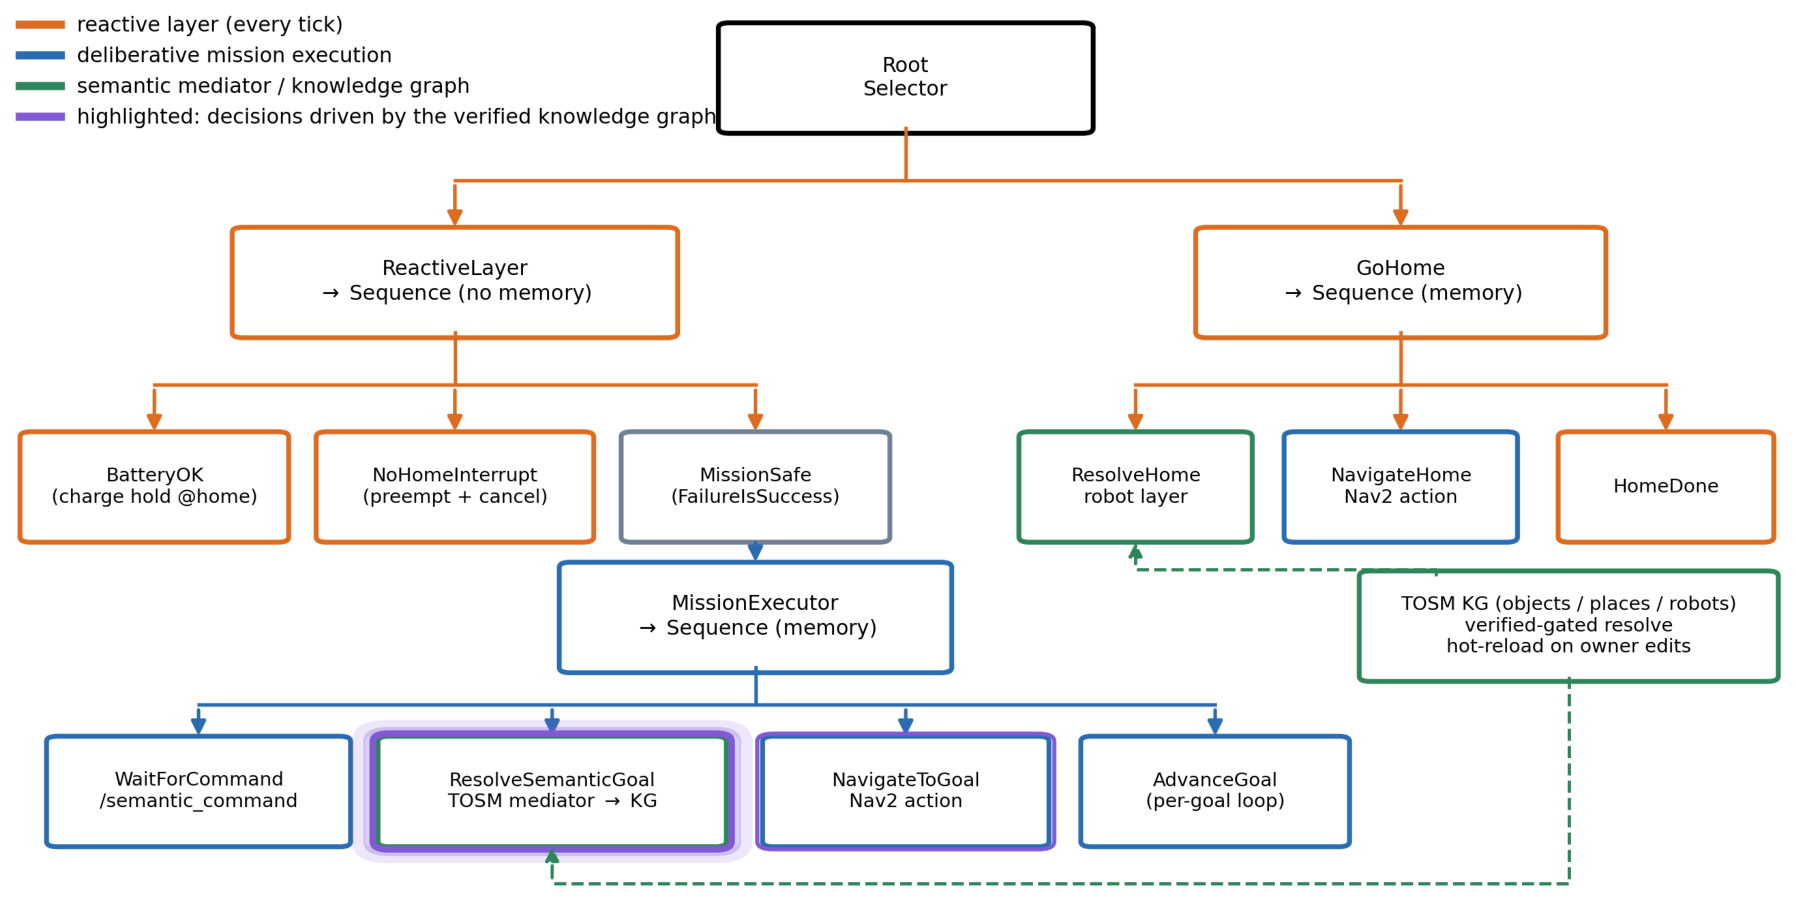
Hybrid deliberative/reactive mission behavior tree. The reactive layer re-evaluates battery and interrupt conditions every tick and can preempt navigation (canceling the active Nav2 goal); the deliberative branch resolves semantic commands through the TOSM mediator, which hot-reloads the knowledge graph when the management console edits it. Highlighted nodes (violet) are the decisions the verified knowledge graph drives: the semantic-resolve node, where a gated graph refuses phantom or unverified goals, and the navigation node that consumes the resolved pose; the unhighlighted reactive nodes are generic behavior-tree machinery.
Figure 18.
Hybrid deliberative/reactive mission behavior tree. The reactive layer re-evaluates battery and interrupt conditions every tick and can preempt navigation (canceling the active Nav2 goal); the deliberative branch resolves semantic commands through the TOSM mediator, which hot-reloads the knowledge graph when the management console edits it. Highlighted nodes (violet) are the decisions the verified knowledge graph drives: the semantic-resolve node, where a gated graph refuses phantom or unverified goals, and the navigation node that consumes the resolved pose; the unhighlighted reactive nodes are generic behavior-tree machinery.
Figure 19.
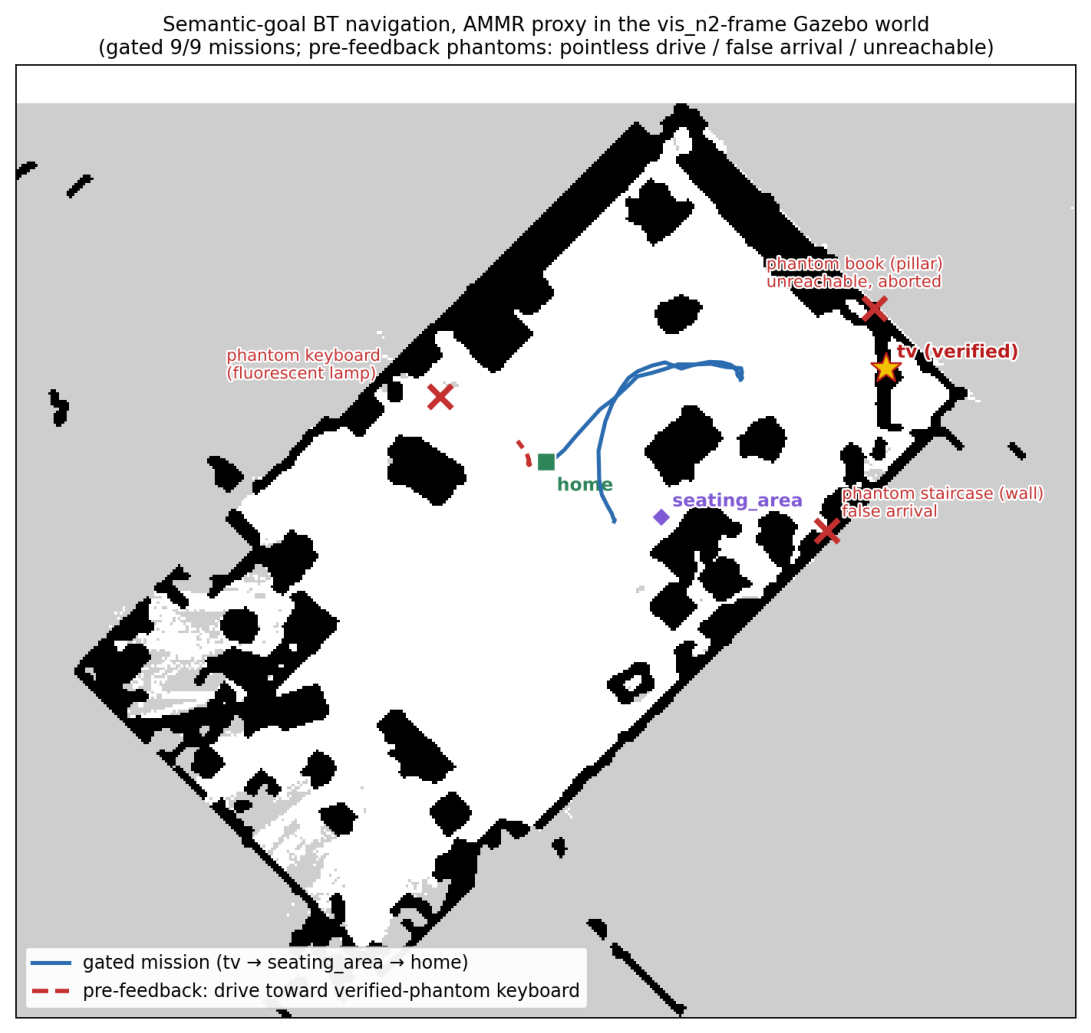
Semantic-goal navigation of the AMMR proxy in the Gazebo twin of the test room (world, map, and knowledge graph share the exploration-scan frame). Blue: a gated three-mission run (TV → seating area → home). Red dashed: against the pre-feedback graph the robot drives toward a verified-phantom keyboard—a fluorescent lamp; crosses mark the three phantom goals with their failure modes (pointless drive, false arrival, unreachable). All three are refused once structure filtering and owner feedback are applied. These runs establish the knowledge-graph–to–mission interface in a physics simulation;
Section 6.3 repeats the interface on the physical platform.
Figure 19.
Semantic-goal navigation of the AMMR proxy in the Gazebo twin of the test room (world, map, and knowledge graph share the exploration-scan frame). Blue: a gated three-mission run (TV → seating area → home). Red dashed: against the pre-feedback graph the robot drives toward a verified-phantom keyboard—a fluorescent lamp; crosses mark the three phantom goals with their failure modes (pointless drive, false arrival, unreachable). All three are refused once structure filtering and owner feedback are applied. These runs establish the knowledge-graph–to–mission interface in a physics simulation;
Section 6.3 repeats the interface on the physical platform.
Figure 20.
Real-robot semantic missions (
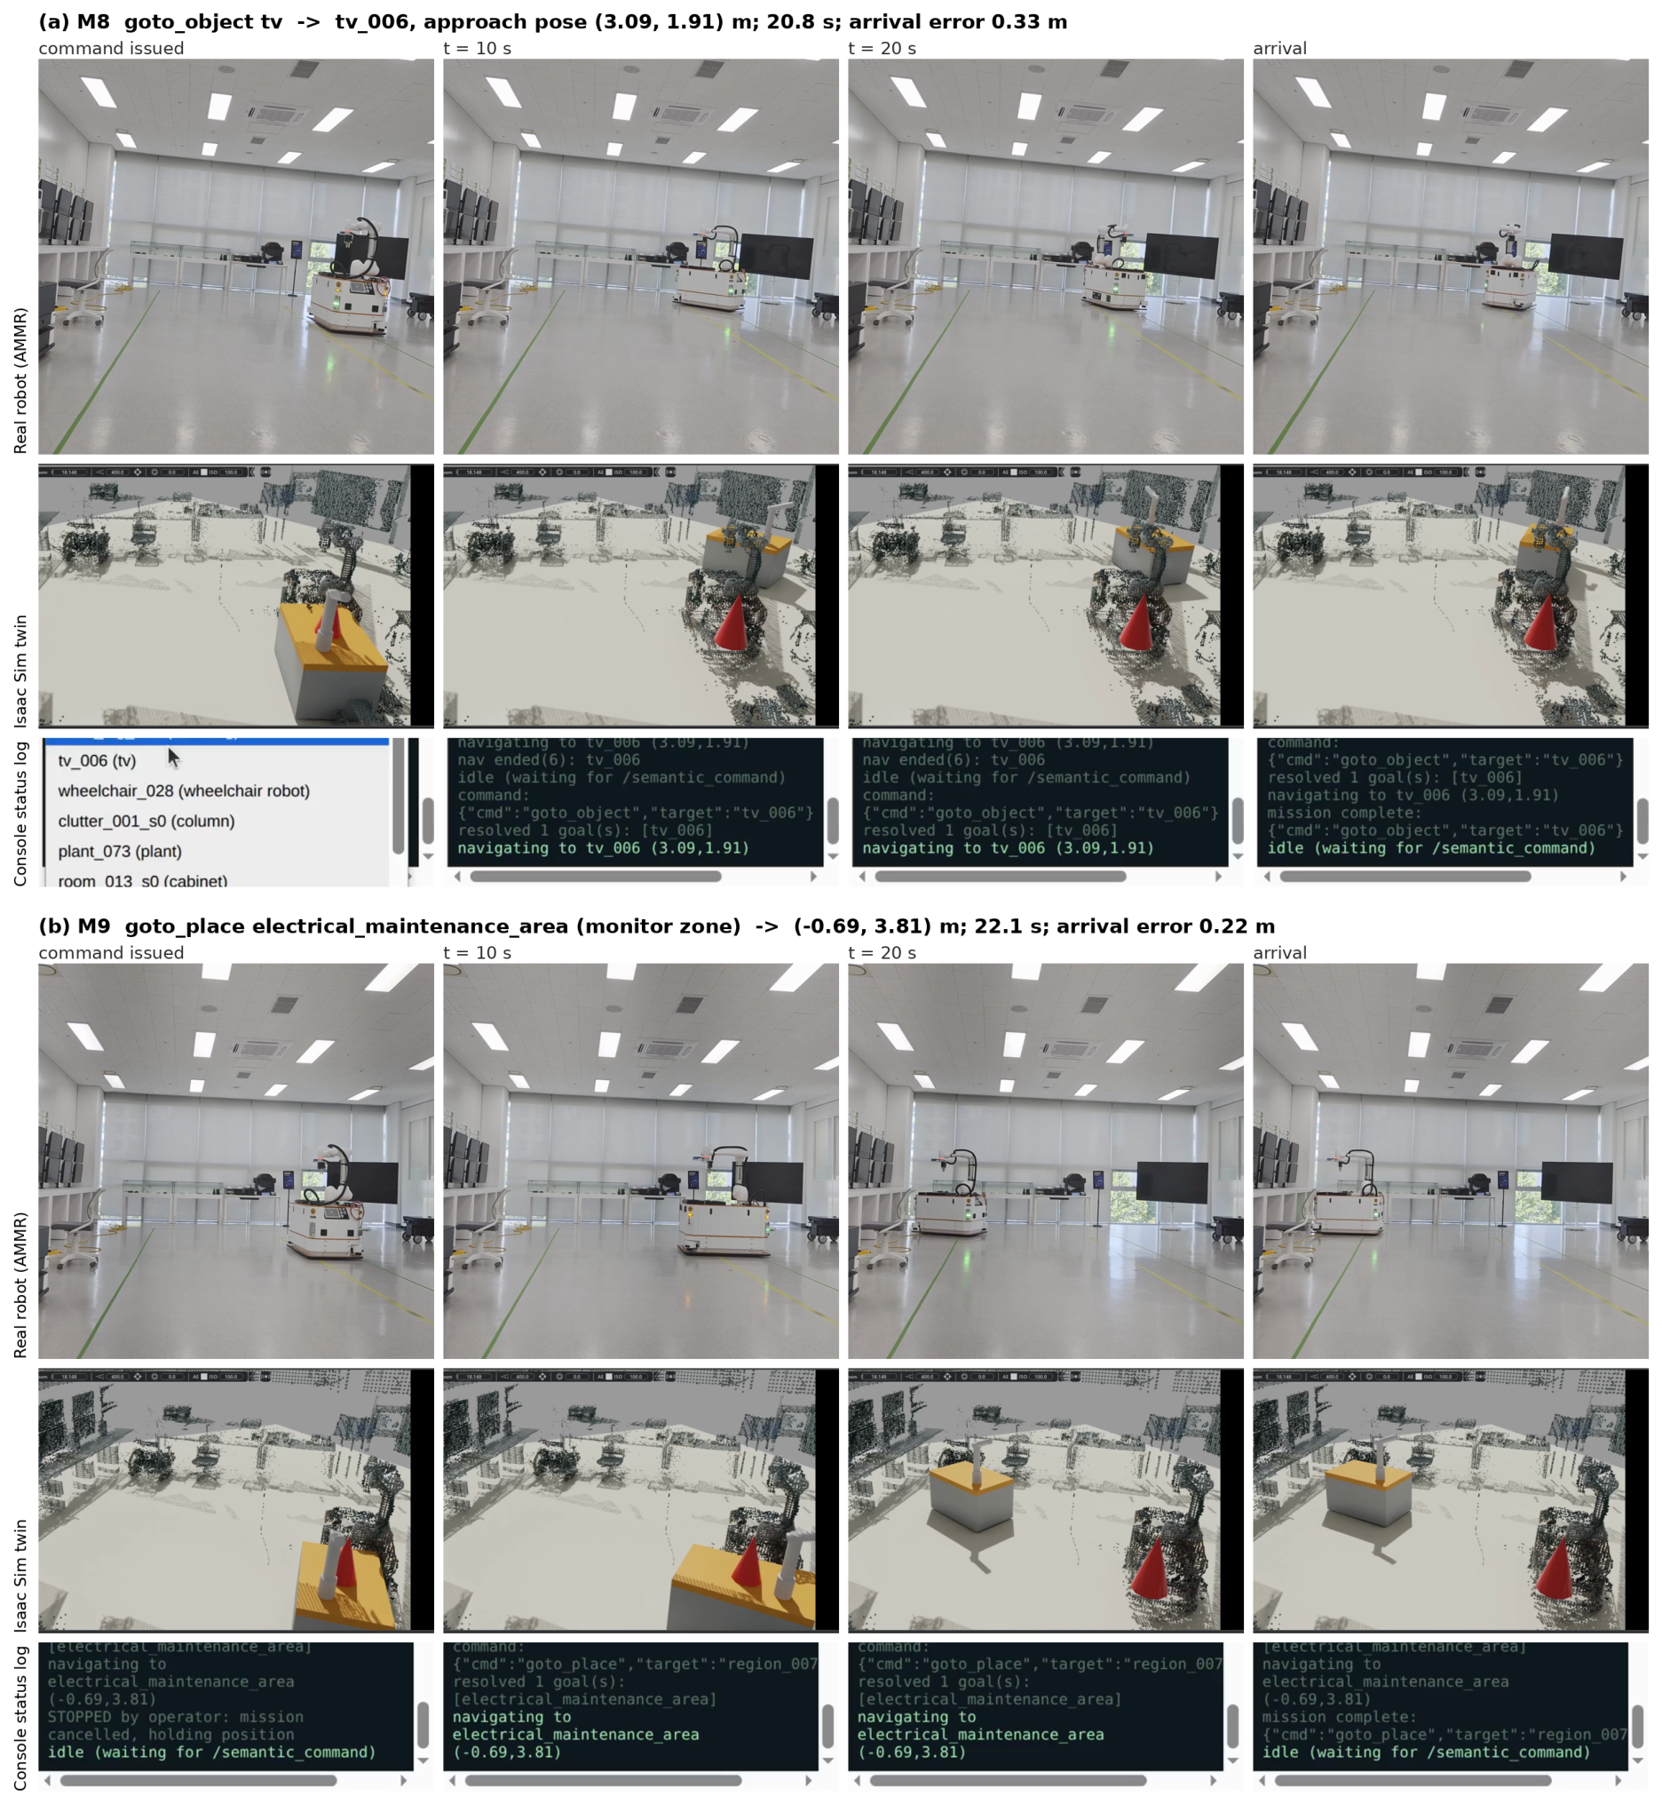
Table 14). Rows:the physical AMMR, the Isaac Sim twin derived from the same knowledge graph (the red cone marks the twin’s goal handle), and the management console’s status log; columns: command issued, 10 s, 20 s, and arrival. (
a)
goto_object tv: the mediator resolves the verified node
tv_006 to an approach pose and the robot arrives
m from it in
s. (
b)
goto_place electrical_maintenance_area: the region containing the monitor workstation, reached in
s with
m error.
Video S1 shows the synchronized footage. The console panels are cropped screenshots of a scrolling status log; lines cut at a panel edge are earlier or later log entries, and the decisive status lines are shown in full.
Figure 20.
Real-robot semantic missions (
Table 14). Rows:the physical AMMR, the Isaac Sim twin derived from the same knowledge graph (the red cone marks the twin’s goal handle), and the management console’s status log; columns: command issued, 10 s, 20 s, and arrival. (
a)
goto_object tv: the mediator resolves the verified node
tv_006 to an approach pose and the robot arrives
m from it in
s. (
b)
goto_place electrical_maintenance_area: the region containing the monitor workstation, reached in
s with
m error.
Video S1 shows the synchronized footage. The console panels are cropped screenshots of a scrolling status log; lines cut at a panel edge are earlier or later log entries, and the decisive status lines are shown in full.
Table 1.
Positioning against DK-SMF [
17]. The table is the authors’ own tabulation: the DK-SMF column paraphrases that paper’s published description and reproduces none of its tables or figures.
Table 1.
Positioning against DK-SMF [
17]. The table is the authors’ own tabulation: the DK-SMF column paraphrases that paper’s published description and reproduces none of its tables or figures.
| Axis | DK-SMF | This Work |
|---|
| Sensing | RGB-D exploration | registered TLS (BLK360) |
| Label trust | domain-knowledge filtering | multi-view verification + escalation |
| Lifecycle | build-once | mint-once IDs, incremental upsert |
| Place semantics | SLIC + LLM over detections | SLIC + ring codes over verified objects |
Table 2.
Capability comparison of environment representations. Each “this work” cell cites the section that substantiates it experimentally; the 2D-map and 3D-scan columns state definitional properties of those representations [
39,
41] rather than measured results.
Table 2.
Capability comparison of environment representations. Each “this work” cell cites the section that substantiates it experimentally; the 2D-map and 3D-scan columns state definitional properties of those representations [
39,
41] rather than measured results.
Table 3.
Scene statistics (deterministic detection “det” sets, after structure-remnant filtering). T1 semantic processing starts from a manually wall-removed export (4.9 M points) of the 46.3 M-point raw scan.
Table 3.
Scene statistics (deterministic detection “det” sets, after structure-remnant filtering). T1 semantic processing starts from a manually wall-removed export (4.9 M points) of the 46.3 M-point raw scan.
| | Showroom (T1) | Robot Hall (T2) | Re-Scan (T3) |
|---|
| Scan mode | manual, 1 setup | exploration | exploration (SOTA), 6 setups |
| Raw points | 46.3 M | 68.6 M | 70.2 M |
| Clean cloud (post-removal) | — | 267 K | 294 K |
| Objects (filtered) | 38 | 81 | 79 |
| Room-scoped | 38 | 55 | 41 |
| Removed planes | 10 | 10 | 10 |
Table 4.
Evaluation-set lineage: how every cluster set used in
Section 5 derives from its scan. All counts are recomputed from the archived stage outputs in the data package;
† marks the one count grounded only in the experiment log. “conf.” = GT-confirmed.
Table 4.
Evaluation-set lineage: how every cluster set used in
Section 5 derives from its scan. All counts are recomputed from the archived stage outputs in the data package;
† marks the one count grounded only in the experiment log. “conf.” = GT-confirmed.
| Lineage | Stage Flow (Cluster Counts) |
|---|
| Showroom 57-set (Section 5.3) | 30 pre-split → 57 split → 50 after soffit filter → 50 GT-scored (36 conf.) |
| Showroom det set | 45 raw → 38 after soffit filter → 38 room-scoped |
| Robot hall det | 88 raw → 81 filtered → 55 room-scoped → 51 GT-scored (32 conf.) |
| T3 det1 | 79 merged → 41 room-scoped (= owner audit set) → 26 filter survivors |
| T3 det2 (precut) | 66 → 35 room-scoped → 27 to VLM (8 wall sheets excluded) |
| T3 det3/det4 | 33 consolidated → 46 † adjudicated |
| Cross-epoch KG (present) | rev7→14: 47, 49, 51, 63, 64, 64, 46, 46 (current) |
| det5 frozen re-run (Section 5.7) | 66 → 35 in-room, scored vs. the 46-object graph |
| Cafeteria 8F | 28 → 25 GT-scored (20 conf.) |
Table 5.
Segmentation×classification backbone comparison on a wall-removed industrial TLS scene. The metrics are screening proxies (no point-level GT) and do not measure instance quality; the PTv3 row is a semantic-segmentation head whose outputs are not instance-comparable with the clustering rows and is included only to document why closed-set semantic heads were screened out. Instance quality of the retained backbone is validated independently in
Section 5.2 (owner-referenced sweep) and
Section 5.7 (end-to-end recall). Bold marks the retained backbone.
Table 5.
Segmentation×classification backbone comparison on a wall-removed industrial TLS scene. The metrics are screening proxies (no point-level GT) and do not measure instance quality; the PTv3 row is a semantic-segmentation head whose outputs are not instance-comparable with the clustering rows and is included only to document why closed-set semantic heads were screened out. Instance quality of the retained backbone is validated independently in
Section 5.2 (owner-referenced sweep) and
Section 5.7 (end-to-end recall). Bold marks the retained backbone.
| Pipeline | Coverage | Unnameable | Classes | Dominant Failure |
|---|
| DBSCAN + Uni3D | 98.3% | 23.3% | 13 | unlabeled coverage |
| SPFormer + Uni3D | 51.1% | 45.9% | 9 | furniture bias (chair 67/88) |
| PTv3 (semantic) | — | — | 17/20 emitted | 46% “wall” after removal |
| DBSCAN + PointCLIP V2 | 98.3% | — | 1–7 | collapse (pipe 23/30) |
Table 6.
Verification accuracy against confirmed GT, and per-tier precision. Accuracy rows are over confirmed GT (n = 36/32); trigger rates and tier counts are over all GT-scored clusters (50 showroom/51 robot hall), so, e.g., 21 unanimous + 29 split = 50. Bold marks the higher accuracy of the two configurations per scene.
Table 6.
Verification accuracy against confirmed GT, and per-tier precision. Accuracy rows are over confirmed GT (n = 36/32); trigger rates and tier counts are over all GT-scored clusters (50 showroom/51 robot hall), so, e.g., 21 unanimous + 29 split = 50. Bold marks the higher accuracy of the two configurations per scene.
| | Showroom (n = 36) | Robot Hall (n = 32) |
|---|
| | Base-4 | Escalated | Base-4 | Escalated |
|---|
| Accuracy | 77.8% | 88.9% | 78.1% | 84.4% |
| 95% Wilson CI | 61.9–88.3 | 74.7–95.6 | 61.2–89.0 | 68.2–93.1 |
| Recovered/regressed | 5/1 | 3/0 |
| Escalation trigger | 58% (29/50) | 51% (26/51) |
| Unanimous precision | 100% (19/19; 21 unan.) | 94.4% (17/18; 25 unan.) |
| Escalated precision | 100% | 88.9% |
| Unverified precision | 60% | 40% |
Table 7.
Per-tier precision, recall, and on confirmed ground truth (synonym-tolerant). Recall counts a confirmed object as retrieved only if the tier contains it with the correct type; the unverified row is the abstention tier, so its “precision” is only the fraction of abstained objects whose withheld top vote happened to be correct. Italic rows are the per-scene totals (all GT-scored and confirmed objects).
Table 7.
Per-tier precision, recall, and on confirmed ground truth (synonym-tolerant). Recall counts a confirmed object as retrieved only if the tier contains it with the correct type; the unverified row is the abstention tier, so its “precision” is only the fraction of abstained objects whose withheld top vote happened to be correct. Italic rows are the per-scene totals (all GT-scored and confirmed objects).
| Scene | Tier | n | | Prec. | Rec. | |
|---|
| Showroom | verified (unanimous) | 21 | 19 | 1.000 | 0.528 | 0.691 |
| | verified_escalated | 8 | 7 | 1.000 | 0.194 | 0.326 |
| | combined verified | 29 | 26 | 1.000 | 0.722 | 0.839 |
| | unverified (abstained) | 21 | 10 | 0.600 | 0.167 | 0.261 |
| | confirmed GT total | 50 | 36 | | | |
| Robot hall | verified (unanimous) | 25 | 18 | 0.944 | 0.531 | 0.680 |
| | verified_escalated | 16 | 9 | 0.889 | 0.250 | 0.390 |
| | combined verified | 41 | 27 | 0.926 | 0.781 | 0.847 |
| | unverified (abstained) | 10 | 5 | 0.400 | 0.062 | 0.108 |
| | confirmed GT total | 51 | 32 | | | |
| Cafeteria | verified (unanimous) | 8 | 7 | 0.571 | 0.200 | 0.296 |
| | verified_escalated | 6 | 3 | 0.333 | 0.050 | 0.087 |
| | combined verified | 14 | 10 | 0.500 | 0.250 | 0.333 |
| | unverified (abstained) | 11 | 10 | 0.200 | 0.100 | 0.133 |
| | confirmed GT total | 25 | 20 | | | |
Table 8.
Ground-truth object classes per scene, grouped into families, with each object’s verification outcome in the canonical run (synonym-tolerant matching as in the escalation analysis). “Filtered” = excluded before scoring (structure artifact or out of room scope). For the T3 owner audit, correctness follows the owner’s category labels; one verified cluster with no owner answer is counted as wrong in the total row only. Italic rows are per-scene totals.
Table 8.
Ground-truth object classes per scene, grouped into families, with each object’s verification outcome in the canonical run (synonym-tolerant matching as in the escalation analysis). “Filtered” = excluded before scoring (structure artifact or out of room scope). For the T3 owner audit, correctness follows the owner’s category labels; one verified cluster with no owner answer is counted as wrong in the total row only. Italic rows are per-scene totals.
| Scene | Family | GT | Corr. | Wrong | Unver. | Filt. |
|---|
| Showroom (57-set) | seating | 5 | 4 | 1 | 0 | 0 |
| | robots | 4 | 0 | 1 | 3 | 0 |
| | displays/monitors | 5 | 0 | 0 | 5 | 0 |
| | machines/electrical | 6 | 3 | 0 | 3 | 0 |
| | furniture | 2 | 0 | 0 | 2 | 0 |
| | fixtures | 6 | 0 | 0 | 6 | 0 |
| | structure-noise | 7 | 0 | 0 | 0 | 7 |
| | clutter/unknown | 22 | 20 | 0 | 2 | 0 |
| | total | 57 | 27 | 2 | 21 | 7 |
| Robot hall (det) | seating | 5 | 4 | 0 | 1 | 0 |
| | robots | 3 | 0 | 1 | 2 | 0 |
| | displays/monitors | 1 | 0 | 0 | 0 | 1 |
| | machines/electrical | 1 | 0 | 0 | 0 | 1 |
| | furniture | 2 | 0 | 0 | 0 | 2 |
| | fixtures | 8 | 3 | 1 | 4 | 0 |
| | structure-noise | 8 | 0 | 0 | 1 | 7 |
| | clutter/unknown | 53 | 25 | 7 | 2 | 19 |
| | total | 81 | 32 | 9 | 10 | 30 |
| Cafeteria | seating | 10 | 1 | 4 | 5 | 0 |
| | machines/electrical | 1 | 1 | 0 | 0 | 0 |
| | furniture | 1 | 0 | 1 | 0 | 0 |
| | fixtures | 5 | 0 | 1 | 4 | 0 |
| | structure-noise | 3 | 0 | 0 | 0 | 3 |
| | clutter/unknown | 8 | 4 | 2 | 2 | 0 |
| | total | 28 | 6 | 8 | 11 | 3 |
| T3 re-scan (owner GT) | seating | 5 | 2 | 2 | 1 | 0 |
| | robots | 8 | 0 | 6 | 2 | 0 |
| | displays/monitors | 2 | 0 | 1 | 1 | 0 |
| | machines/electrical | 4 | 0 | 4 | 0 | 0 |
| | furniture | 4 | 0 | 3 | 1 | 0 |
| | fixtures | 4 | 0 | 2 | 2 | 0 |
| | structure-noise | 9 | 0 | 6 | 3 | 0 |
| | clutter/unknown | 5 | 4 | 0 | 0 | 0 |
| | total | 41 | 6 | 25 | 10 | 0 |
Table 9.
Query benchmark, four conditions (accuracy/hallucination rate/traps blocked), with abstention counts. Question sets: showroom n = 48 (14 symbolic, 12 explicit, 9 implicit, 9 scene-level, 4 trap); robot hall n = 32 (15 symbolic, 12 explicit, 1 scene-level, 4 trap). An abstention counts against accuracy (the denominator is always n) but is not a hallucination; the verified-only condition’s low accuracy is largely its abstention cost. Bold marks the best accuracy per scene.
Table 9.
Query benchmark, four conditions (accuracy/hallucination rate/traps blocked), with abstention counts. Question sets: showroom n = 48 (14 symbolic, 12 explicit, 9 implicit, 9 scene-level, 4 trap); robot hall n = 32 (15 symbolic, 12 explicit, 1 scene-level, 4 trap). An abstention counts against accuracy (the denominator is always n) but is not a hallucination; the verified-only condition’s low accuracy is largely its abstention cost. Bold marks the best accuracy per scene.
| | LLM-Only | Ungated | Verified-Only | Gated |
|---|
| Showroom (n = 48) | 52.1%/20.8%/2/4 | 81.2%/18.8%/0/4 | 58.3%/16.7%/4/4 | 83.3%/16.7%/3/4 |
| abstentions | 13 | 0 | 12 | 0 |
| Robot hall (n = 32) | 50.0%/37.5%/4/4 | 56.2%/43.8%/0/4 | 46.9%/40.6%/2/4 | 59.4%/40.6%/2/4 |
| abstentions | 4 | 0 | 4 | 0 |
Table 10.
Cumulative automated recall of the full re-run against the owner-corrected 46-object graph (no owner input in the run itself). Bold marks the final cumulative recall.
Table 10.
Cumulative automated recall of the full re-run against the owner-corrected 46-object graph (no owner input in the run itself). Bold marks the final cumulative recall.
| Automated Layers (Cumulative) | GT Recall | In-Room Precision |
|---|
| Verified path (Section 4.2, Section 4.3 and Section 4.4) | 13/46 (28%) | 37% |
| +diffuseness re-split | 26/46 (57%) | 53% |
| +wall-compound gate | 36/46 (78%) | 60% |
| +structure-condition ensemble | 37/46 (80%) | 49% |
| +wall-compound panel square-up (Section 4.7, layer 2) | 39/46 (85%) | 51% |
Table 11.
Verifier-model comparison: identical Stage-B late fusion + escalation on the same 35 in-room clusters, scored against the owner-corrected graph. Bold marks the best value per column (ties are all bolded).
Table 11.
Verifier-model comparison: identical Stage-B late fusion + escalation on the same 35 in-room clusters, scored against the owner-corrected graph. Bold marks the best value per column (ties are all bolded).
| Verifier | Verified | Esc.-Resolved | Unverified | Type-Correct 1 | Calls | Cost 2 |
|---|
| Claude Sonnet 5 | 26 | 3 | 6 | 7/13 | 247 | $2.49 |
| GPT-5.6 (luna) | 21 | 7 | 7 | 7/13 | 287 | $0.11 |
| Claude Opus 5 | 17 | 8 | 10 | 7/13 | 319 | $5.28 |
| Claude Sonnet 4.6 | 15 | 6 | 14 | 6/13 | 335 | $3.00 |
| Claude Haiku 4.5 | 9 | 9 | 17 | 5/13 | 383 | $1.13 |
Table 12.
Cafeteria stress scene: verification under verifier × render source (the identical 512 px multi-view protocol of
Section 4.4 throughout). Accuracy is escalated accuracy on confirmed GT (
n = 20; the fragment-excluded column drops the five confirmed sofa-fragment clusters,
n = 15); unanimous precision is over confirmed unanimous votes. In every cell, 0 of the 7 sofa clusters are recovered. Bold marks the best value per column.
Table 12.
Cafeteria stress scene: verification under verifier × render source (the identical 512 px multi-view protocol of
Section 4.4 throughout). Accuracy is escalated accuracy on confirmed GT (
n = 20; the fragment-excluded column drops the five confirmed sofa-fragment clusters,
n = 15); unanimous precision is over confirmed unanimous votes. In every cell, 0 of the 7 sofa clusters are recovered. Bold marks the best value per column.
| Verifier | Render Source | Esc. Acc. | (Excl. Fragments) | Unan. Prec. | Trigger |
|---|
| Sonnet 4–6 | 3 cm voxel cloud | 35.0% | 46.7% | 57.1% | 68% |
| Sonnet 4–6 | full-resolution | 40.0% | 53.3% | 62.5% | 60% |
| Sonnet 5 | 3 cm voxel cloud | 45.0% | 60.0% | 66.7% | 40% |
| Sonnet 5 | full-resolution | 60.0% | 80.0% | 80.0% | 52% |
Table 13.
Phantom-goal mission waste in simulation (AMMR proxy). The same three commands are resolved against the knowledge graph before and after structure filtering + owner feedback (both with the verification gate active). Wasted path includes the return leg.
Table 13.
Phantom-goal mission waste in simulation (AMMR proxy). The same three commands are resolved against the knowledge graph before and after structure filtering + owner feedback (both with the verification gate active). Wasted path includes the return leg.
| KG State | Phantom Target (Truth) | Outcome | Wasted Path | Wasted Time |
|---|
| pre-feedback | keyboard (fluorescent lamp) | driven | 1.7 m | 16.8 s |
| pre-feedback | staircase (bare wall) | false arrival | 0.6 m | 5.7 s |
| pre-feedback | book (wall pillar) | unreachable, aborted | 0 m | 22.2 s |
| filtered + owner feedback | all three | refused | 0 m | ∼1 s |
Table 14.
Real-robot semantic missions on the AMMR (test room, 15 September 2026). Goals are resolved by the mediator in the scan frame; distance is straight-line start-to-goal; arrival error is the localized-pose–to–goal distance at mission completion.
Table 14.
Real-robot semantic missions on the AMMR (test room, 15 September 2026). Goals are resolved by the mediator in the scan frame; distance is straight-line start-to-goal; arrival error is the localized-pose–to–goal distance at mission completion.
| Command | Resolved Goal (m) | Dist. | Time | Err. | Outcome |
|---|
| goto_object tv | tv_006 approach (3.09, 1.91) | 4.0 m | 14 s | 0.34 m | completed |
| goto_object tv (Figure 20a) | tv_006 approach (3.09, 1.91) | 3.6 m | 20.8 s | 0.33 m | completed |
| goto_place electrical_maintenance_area (Figure 20b) | region (−0.69, 3.81) | 3.9 m | 22.1 s | 0.22 m | completed |
| goto_place display_briefing_area | region (3.31, 1.76) | 0.1 m | <1 s | 0.11 m | completed (already inside) |
| goto_object keyboard (×2, phantom) | — | — | <1 s | — | refused by gate, no motion |