Article

Relation Prototype Re-Scoring for CLIP-Based Logical Anomaly Detection and Localization

1
Division of Electronics and Communications Engineering, Pukyong National University, 45 Yongso-ro, Nam-gu, Busan 48513, Republic of Korea
2
Department of Artificial Intelligence Convergence, Graduate School, Pukyong National University, 45 Yongso-ro, Nam-gu, Busan 48513, Republic of Korea
Electronics 2026, 15(18), 4293; https://doi.org/10.3390/electronics15184293 (registering DOI)
Submission received: 4 August 2026 / Revised: 14 September 2026 / Accepted: 17 September 2026 / Published: 19 September 2026

Abstract

CLIP-based anomaly detectors have markedly advanced training-free and zero-shot industrial anomaly detection and localization, yet their predictions remain dominated by patch-wise vision–language similarity or anomaly-aware feature scoring. This formulation is intrinsically limited for logical anomalies, in which every visible part can appear locally normal while its count, position, arrangement, or co-occurrence violates a normal configuration. We introduce a training-free relation prototype re-scoring module that reuses the semantic–spatial relations already encoded by the visual transformer. Because patch tokens contain positional embeddings, the self-attention graph is position-aware as well as content-dependent; we use it as a message-passing operator over detector-specific patch features. Normal images define category-wise, spatially indexed relation prototypes, and each test patch is scored by the Euclidean deviation of its attention-aggregated feature from the corresponding normal prototype. The resulting map supports both dense localization and map-derived image detection. Although we also report the feature-relation map alone to analyze its intrinsic behavior, the final method fuses this map with the original anomaly map so that relation-sensitive evidence is added without discarding the baseline detector’s local appearance cues. We develop the method on AnomalyCLIP and verify its generality on WinCLIP and AA-CLIP. On the logical split of MVTec LOCO AD, the proposed fusion improves AnomalyCLIP from 53.9 to 74.4 pixel AUROC and from 28.7 to 52.7 pixel AUPRO, while image AUROC rises from 50.5 to 71.7. Similar improvements are observed for WinCLIP and AA-CLIP. On CAD-SD, the proposed fusion reaches 92.0 and 93.8 image AUROC for AnomalyCLIP and WinCLIP, respectively, on co-occurrence anomalies. Experiments on the structural split of MVTec LOCO AD and the MVTec AD benchmark show why the baseline map must be retained: fusion preserves substantially more local-defect evidence than relation-only scoring, although its benefit remains detector- and category-dependent. These results identify semantic–spatial relation deviation as a missing cue in CLIP-based logical anomaly detection and localization, without requiring explicit component models, symbolic rules, additional training, or modification of the baseline architecture.

1. Introduction

Industrial visual anomaly detection aims to identify defective samples and localize abnormal regions while using few or no anomalous training examples. Conventional methods model normal appearance through reconstruction, feature distributions, memory banks, distillation, or normalizing flows [1,2,3,4,5,6,7,8,9,10,11,12,13]. These approaches are highly effective when anomalies create visible local deviations such as scratches, dents, stains, or deformations. However, industrial inspection also contains logical anomalies: all parts may appear valid individually, but their presence, count, arrangement, or connection violates the normal logic of the product [14].
Large vision–language models (VLMs), particularly CLIP [15], have recently enabled generalizable zero- and few-shot anomaly detection. WinCLIP introduced compositional prompts and window-level CLIP features [16]; AnomalyCLIP learned object-agnostic normal and abnormal prompts together with dense visual adaptation [17]; and AA-CLIP strengthened anomaly-aware text anchors and patch-level visual alignment [18]. PromptAD, AdaCLIP, FiLo, and subsequent prompt-learning methods further improved pixel-level anomaly localization through more discriminative or input-adaptive vision–language prompts [19,20,21,22,23]. Nevertheless, these methods still primarily answer the local question: Does this patch look abnormal with respect to a learned or prompted abnormality concept?
However, that perspective is insufficient for logical anomalies. A product may contain valid-looking parts that are misplaced, duplicated, or arranged incorrectly, or it may lack an expected component. Although their local appearance remains consistent with the normal feature manifold, their semantic and spatial relationships can become abnormal. MVTec LOCO AD was introduced to expose this gap by distinguishing structural anomalies from logical anomalies while providing pixel-level annotations for both [14]. To address this challenge, recent methods explicitly model components, object compositions, correspondences, or natural-language constraints [24,25,26,27,28,29,30,31]. Their strong image-level performance highlights the importance of relational reasoning for logical anomaly detection, but these approaches often rely on dedicated segmentation, object extraction, few-shot exemplars, or additional image-level reasoning pipelines, which can limit their applicability.
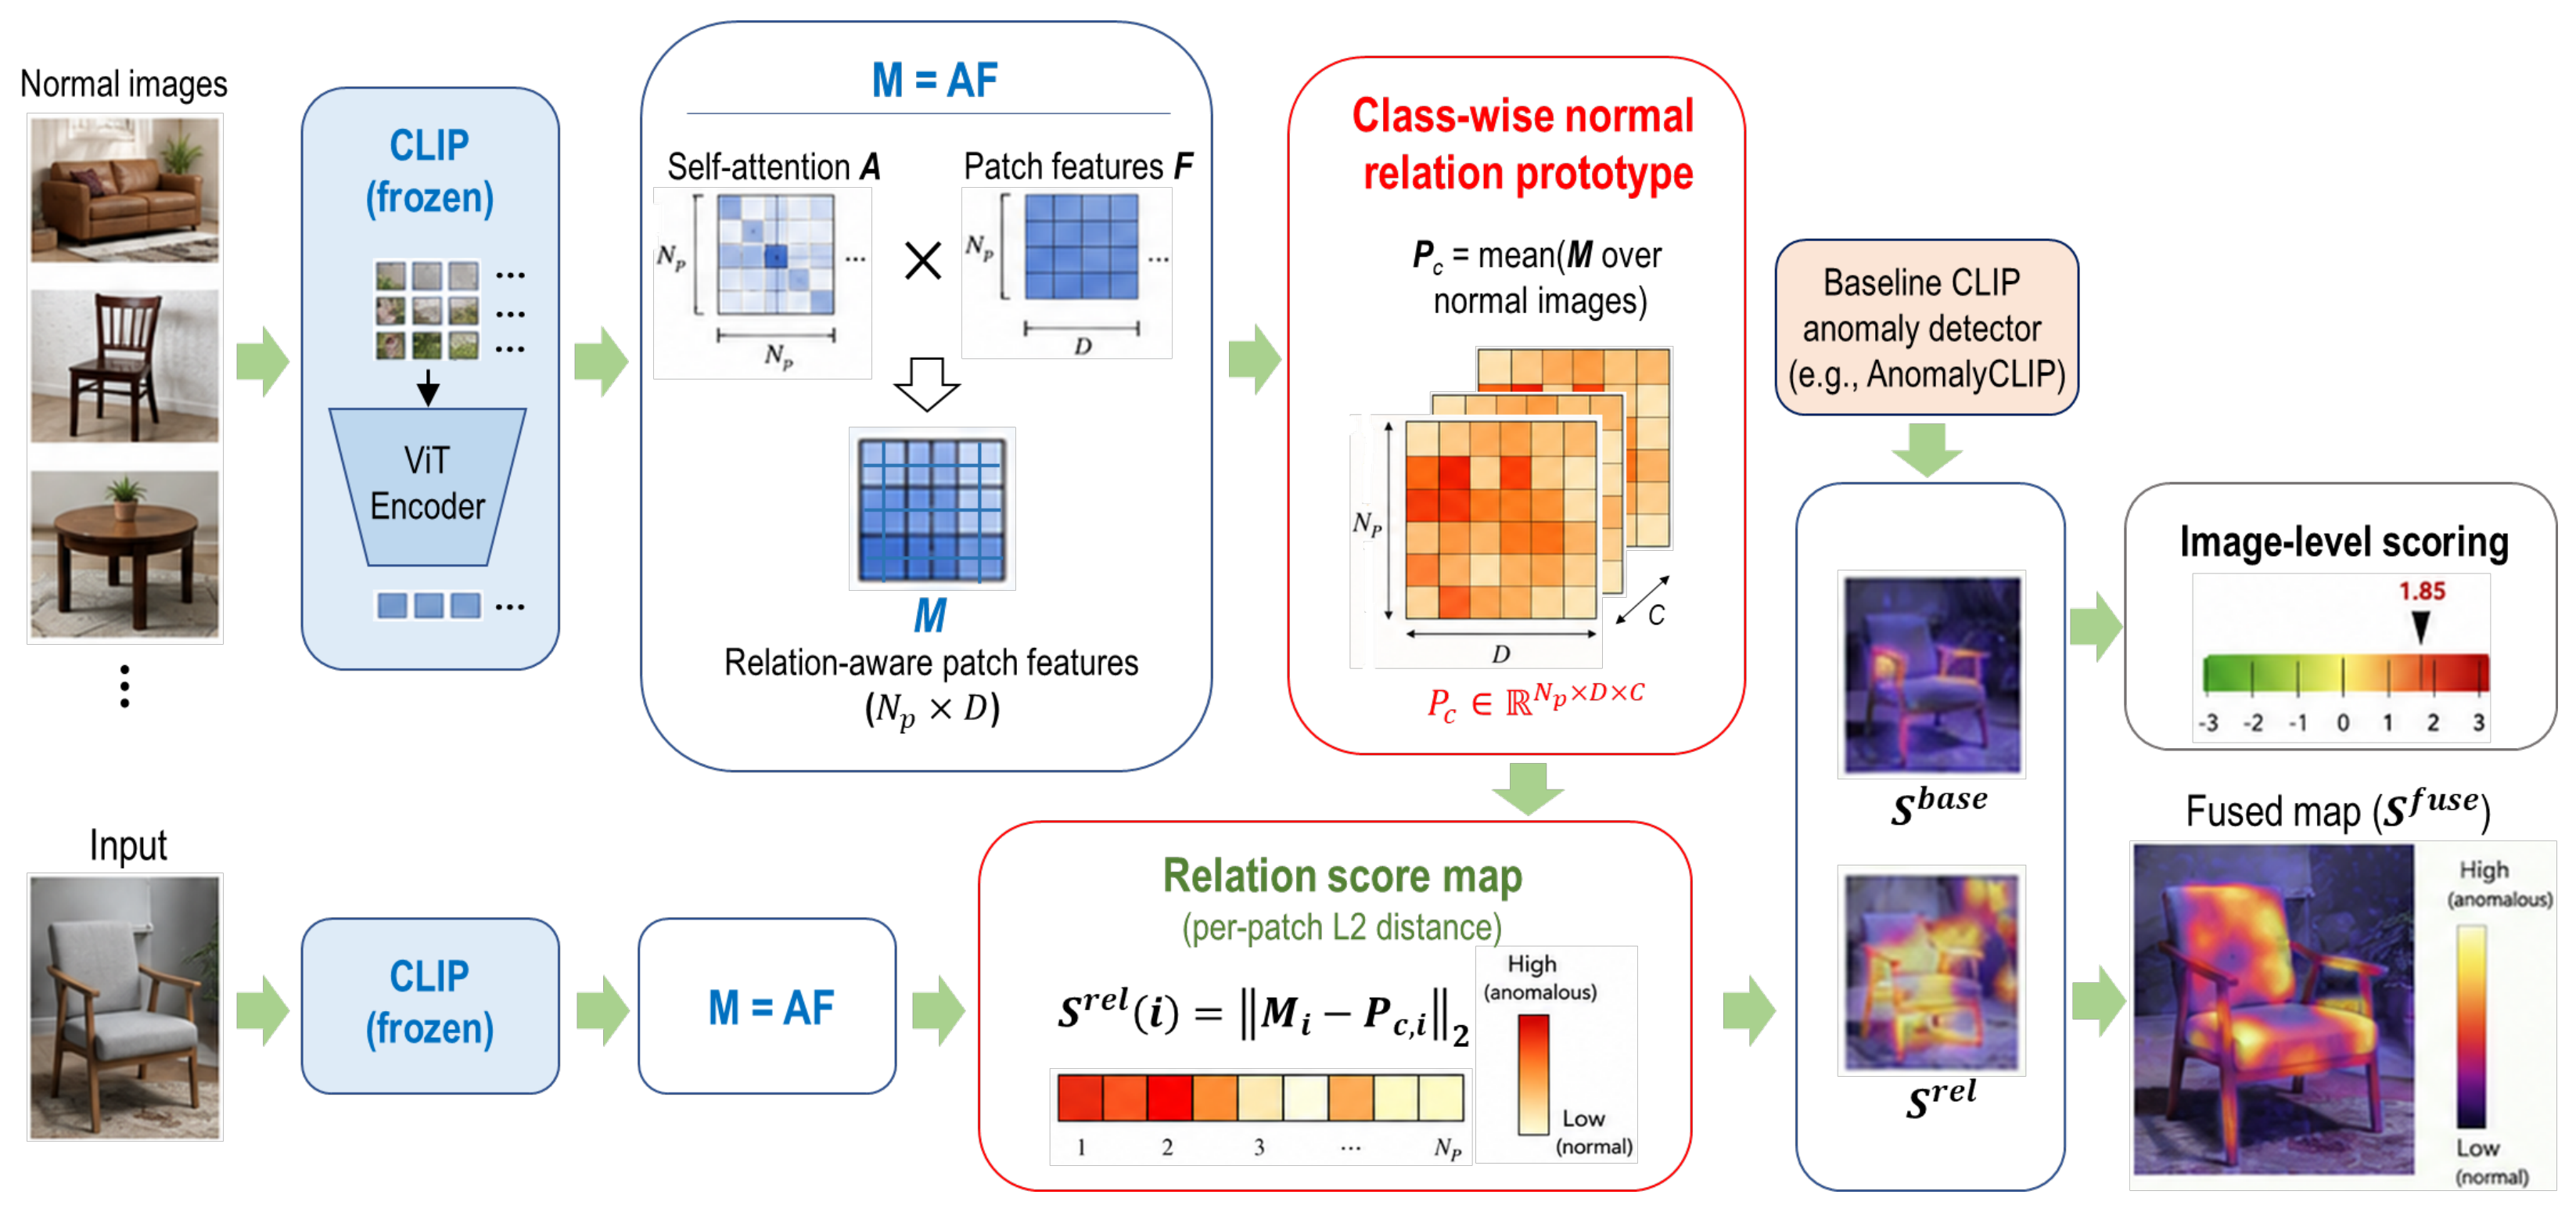
This work studies a narrower but practically important question: Can the relation information already present inside a CLIP-based anomaly detector improve logical anomaly detection and localization without training a new logical reasoning model? Our answer is Relation Prototype Re-scoring. For an image with patch features F and visual self-attention A, we construct a relation-aware representation M = A F . A normal training set defines a category-wise prototype P, and the patch relation score is the Euclidean distance M i P i 2 . Attention is therefore not interpreted as an anomaly heatmap by itself. It acts as a message-passing operator that converts local patch features into context-conditioned representations.
Crucially, this context is inherently both semantic and spatial. In vision transformers, positional embeddings are added to patch embeddings before self-attention is computed, allowing the resulting attention graph to encode not only visual similarity but also token identity and spatial arrangement. Furthermore, our normal relation prototype remains indexed by patch position. The relation score therefore asks: “does patch i participate in the normal semantic–spatial configuration of this object?” This formulation is directly relevant to logical anomalies involving missing, duplicated, misplaced, or incorrectly connected parts. It also explains why explicitly appending a separate positional cue did not improve the best-performing relation feature in our ablation study: spatial information is already embedded throughout the transformer via positional embeddings, propagated by self-attention, and preserved by the spatial indexing of the normal prototype.
We investigate two relation formulations. An initial attention-difference variant (V1) directly measures discrepancies between test and normal attention matrices. In contrast, our final feature-relation variant (V2) compares attention-aggregated patch features against normal relation prototypes. The substantial performance gap between V1 and V2 for pixel-level localization indicates that attention weights alone are insufficient; the discriminative signal arises primarily from deviations in spatially indexed feature content, while attention-guided propagation provides an additional gain.
We adopt AnomalyCLIP as the main analysis baseline because its DPAM patch features and separate query–key (q-k) and value–value (v-v) attention branches enable a detailed examination of representation and relation cues. WinCLIP and AA-CLIP are also included to evaluate the generality of the proposed relation prototype across both a training-free baseline and a stronger anomaly-aware baseline. MVTec LOCO AD [14] serves as the primary benchmark for logical anomaly detection, while CAD-SD [24] provides external validation on co-occurrence anomalies. Because the AnomalyCLIP and AA-CLIP checkpoints used in this study were trained on VisA [32], MVTec AD [3] is used as a benchmark to evaluate the generalization to conventional surface anomalies.
Our objective is not to replace existing logical anomaly detection pipelines. More importantly, we do not convert a CLIP-based baseline into a logical-anomaly-specific detector or alter its learned representation. Instead, we retain the original anomaly map and augment it with a relation map computed from the detector’s existing attention matrices and patch features, using a prototype constructed only from normal images. While the underlying CLIP-based detectors are designed for zero-shot anomaly detection, the proposed relation re-scoring module additionally constructs category-specific relation prototypes from normal reference images of the target category. Therefore, our extension is more accurately characterized as a training-free method using normal reference images rather than a strictly zero-shot method.
The main contributions of this work are summarized as follows:
  • We formulate logical anomaly detection as a deviation from the normal semantic–spatial compatibility of patch features, rather than from local patch appearance alone. By using self-attention as a relation operator, the proposed representation extends patch-wise anomaly evidence to context-conditioned feature deviation without introducing an explicit component or symbolic relation model.
  • We propose a lightweight, training-free relation prototype re-scoring module that reuses the attention matrices and patch features already produced by an existing CLIP-based detector. The resulting relation map is fused with the unchanged baseline anomaly map, adding logical-anomaly sensitivity without requiring additional annotations, learnable parameters, retraining, checkpoint modification, or architectural changes.
  • We investigate two relation formulations—an attention-difference variant (V1) and a feature-relation prototype variant (V2)—and show that spatially indexed feature prototypes provide a strong logical-anomaly cue and that attention-guided feature propagation further improves this representation, whereas attention differences alone remain insufficient.
  • We demonstrate improved logical-anomaly localization and image-level detection across three representative CLIP-based anomaly detectors (AnomalyCLIP, WinCLIP, and AA-CLIP), together with analyses of relation maps, fusion strategies, score calibration, baseline strength, and anomaly type.
  • We validate the generality and limitations of the proposed relation cue through additional experiments on MVTec LOCO AD, CAD-SD, and MVTec AD, clarifying when semantic–spatial relation information is beneficial and where its effectiveness is inherently limited.

2. Related Work

2.1. Unsupervised Industrial Anomaly Detection

Early deep anomaly detection methods focused on learning compact representations of normal data or estimating one-class decision boundaries [4]. Patch SVDD extended one-class representation learning to patch-level anomaly detection and segmentation through self-supervised training [33]. With the emergence of powerful pretrained vision models, feature-based approaches became dominant: PaDiM models spatially indexed Gaussian distributions over multiscale patch features, whereas PatchCore constructs a coreset memory bank and uses nearest-neighbor distances for anomaly scoring [5,6]. In parallel, reconstruction-based and synthetic-anomaly methods, such as DRAEM and CutPaste, generate proxy defects to train discriminative localization heads [7,34]. Other approaches model discrepancies between teacher and student representations through knowledge distillation [8] or estimate the density of normal features using normalizing flows [9,10]. More recent methods, including UniAD, SimpleNet, and EfficientAD, further advance multi-class modeling, discriminative learning, or computational efficiency [11,12,13]. Comprehensive surveys provide detailed taxonomies of these methods according to their underlying paradigms [1,2].
Despite their methodological differences, these approaches predominantly model the distribution of local visual appearance. Although deep feature representations implicitly capture contextual information through large receptive fields, they do not explicitly model the semantic or spatial relationships among object components. As a result, they often struggle with logical anomalies, where each local region may appear visually normal while the overall object configuration is incorrect. This limitation is highlighted by MVTec LOCO AD, which explicitly distinguishes structural anomalies from logical anomalies and demonstrates that local appearance alone is insufficient for reliable anomaly detection [14].

2.2. Vision–Language Models for Anomaly Detection

CLIP learns aligned visual and textual representations from large-scale image–text supervision, providing strong semantic representations with excellent zero-shot transferability [15]. Built upon vision transformers [35,36], it has become the foundation of many recent zero- and few-shot industrial anomaly detection methods. However, because CLIP is pretrained for image–text alignment rather than dense anomaly localization, additional mechanisms are typically introduced to improve patch-level anomaly prediction. WinCLIP addresses this limitation by combining compositional prompt ensembles with multiscale window-based feature matching [16]. AnomalyCLIP learns object-agnostic normality and abnormality prompts together with a Dense Prompt Attention Module (DPAM) to enhance dense visual representations [17]. AA-CLIP further improves anomaly discrimination by separately optimizing anomaly-aware text representations and patch-level visual alignment [18]. PromptAD incorporates textual priors within a dual-branch framework [19], AdaCLIP adapts CLIP through hybrid static and image-conditioned learnable prompts [20], and FiLo improves fine-grained anomaly localization through richer textual descriptions of defect characteristics [21]. More recent methods further refine prompt learning by incorporating fine-grained semantic or frequency-domain information to improve local anomaly sensitivity [22,23]. AnomalyGPT extends CLIP-based anomaly detection to multimodal instruction following and conversational reasoning [37].
Despite their different architectures, these methods share a common objective of improving the alignment between visual features and textual descriptions of normality or abnormality. Consequently, anomaly localization remains primarily driven by patch-level vision–language similarity, patch-level feature adaptation, or local window-based matching. In contrast, our approach is complementary rather than alternative. We leave the detector architecture and parameters unchanged, reuse its existing attention matrices and patch features, and retain its original anomaly map. The proposed output is obtained by fusing that map with the relation map rather than replacing the detector’s local anomaly response.

2.3. Logical and Co-Occurrence Anomaly Detection

MVTec LOCO AD established a benchmark for industrial logical anomaly detection by distinguishing structural defects from anomalies that violate constraints on component quantity, location, combination, or arrangement [14]. Subsequent studies have addressed these higher-level anomalies by explicitly modeling component composition or inter-object relationships. SA-PatchCore augments a memory-bank-based detector with self-attention to capture co-occurrence patterns and introduces CAD-SD, which includes both local Scratch/Paint defects and co-occurrence anomalies such as Over-coupling and Lacking [24]. ComAD first decomposes an object into components and detects logical inconsistencies by modeling component-level measurements and their relationships [26]. PSAD employs few-shot component segmentation and combines memory banks built from component histograms, composition embeddings, and patch-level representations [25].
Other approaches incorporate object-level correspondence, semantic composition modeling, or vision–language reasoning. SAM-LAD uses Segment Anything to obtain object masks and performs object matching with graph-attention-based representations for zero-shot logical anomaly detection [27,38]. LogicQA generates questions concerning component presence, arrangement, and quantity from normal reference images and detects violations through VLM responses [28]. SALAD explicitly learns the distribution of semantic composition maps [29], ObjectCore represents object composition and identifies mismatches through object-level correspondence and bipartite matching [30], and ComGEN learns component-aware representations and synthesizes logical anomalies for downstream detector training [31].
These studies share the observation that local appearance alone may be insufficient when an anomaly arises from an invalid relationship among normal-looking components. Our work follows this motivation but differs in methodological scope. Rather than introducing a separate component segmentation or object-matching pipeline, learning a dedicated composition model, or performing image-level rule reasoning, we extract relational information already encoded in the visual transformer of an existing CLIP-based anomaly detector. We then convert this information into a dense, training-free re-scoring map that evaluates the compatibility of each patch with the normal semantic–spatial configuration of the object.

2.4. Self-Attention as a Relation Operator

Self-attention models data-dependent interactions among tokens by allowing each token to aggregate information from other tokens according to learned attention weights [36]. In vision transformers, positional embeddings are added to patch embeddings before q-k attention is computed [35]. Therefore, the resulting attention pattern reflects not only visual compatibility among patches but also their positional identity and spatial arrangement.
Previous studies have shown that self-supervised vision transformers naturally capture relationships among image patches, grouping patches that belong to the same object or part even without dense supervision [39,40]. Motivated by these observations, we interpret the attention matrix as a semantic–spatial relation operator rather than merely as a saliency map. Specifically, the attention matrix A determines how contextual information is propagated across spatially indexed patches, while the feature matrix F specifies the visual content being propagated. Their product, A F , therefore represents relation-aggregated patch features that preserve both semantic and spatial context.
Under this formulation, a logical anomaly may arise from changes in the attention structure, the propagated feature content, or the compatibility of the resulting relation-aggregated features with the normal object configuration. Rather than relying on attention magnitude alone, our method evaluates these relation-aggregated features against normal relation prototypes to expose semantic–spatial inconsistencies.

3. Method

3.1. Problem Formulation

Let D c n denote the set of normal training images for category c, and let x be a test image. A CLIP-based anomaly detector produces a dense anomaly map S base ( x ) R H × W together with visual patch features
F ( x ) = [ F 1 ( x ) , , F N ( x ) ] R N × C .
We additionally extract a head-averaged patch-to-patch self-attention matrix A ( x ) R N × N from the visual encoder, removing the CLS-token row and column before constructing patch relations. The baseline detector remains frozen, and neither its architecture nor its original anomaly map is modified; the proposed module only reads intermediate representations and computes an additional score after the forward pass.
Our goal is to estimate a relation map S rel ( x ) that is spatially aligned with the detector’s base anomaly map while capturing deviations from the normal semantic–spatial configuration. The final output fuses the proposed relation map with the unchanged base anomaly map. Standalone relation scores are reported only to isolate the contribution of each relation formulation. The relation map is used for both pixel-level localization and image-level anomaly detection, although the corresponding scoring strategies differ.
For pixel-level localization, the base and relation maps are normalized independently because they generally have different numeric ranges:
S ˜ ( x ) = S ( x ) min   S ( x ) max   S ( x ) min   S ( x ) + ϵ .
The normalized maps are then fused according to the strategy described in Section 3.6:
S loc fuse ( x ) = fusion S ˜ base ( x ) , S ˜ rel ( x ) .
Image-level anomaly detection follows a separate raw-score pathway described in Section 3.7.
Figure 1 illustrates the overall framework. The underlying CLIP-based detector produces the base anomaly map, patch features F, and self-attention matrix A, while normal training images are used only to construct the category-wise relation prototype. During inference, the resulting relation map is used in two separate pathways: a normalized fusion pathway for dense anomaly localization and a raw-score pathway for image-level anomaly detection. This separation ensures that spatial fusion benefits from per-image normalization while preserving valid score comparisons across different test images.

3.2. Why Relation Re-Scoring Detects Logical Anomalies

Many patch-based anomaly detectors can be abstracted as assigning each patch an anomaly score primarily from its local feature representation, i.e.,  g ( F i ) . This strategy is effective when an anomaly directly perturbs the local appearance encoded in F i . Logical anomalies, however, often preserve the local appearance of individual components while altering their semantic–spatial relationships through missing, duplicated, misplaced, or incorrectly connected parts. Consequently, the local feature F i may remain close to the normal feature manifold even though the surrounding object configuration is abnormal.
Our relation representation is defined as M = A F , where the attention matrix A determines how contextual information is propagated and F specifies the propagated visual features. Under perturbations Δ A and Δ F , the resulting change becomes
Δ M = ( A + Δ A ) ( F + Δ F ) A F = A Δ F + Δ A F + Δ A Δ F .
The first term, A Δ F , propagates local appearance changes through the normal relation structure. The second term, Δ A F , captures changes in semantic–spatial relationships even when the local visual features remain plausible. The final term, Δ A Δ F , represents the interaction between appearance and relational changes. Therefore, the relation representation responds jointly to changes in both feature content and inter-patch relations.
This decomposition provides an intuitive explanation for the behavior of relation re-scoring. Changes in component presence, position, or connectivity can perturb the attention structure or its interaction with otherwise plausible patch features, allowing the relation representation to respond even when local appearance remains close to normal. In contrast, for highly localized surface defects, the anomaly is already well represented by the local feature perturbation Δ F , while relation aggregation can spread or attenuate that local evidence. Therefore, relation re-scoring should be viewed as a complementary mechanism that is expected to be most effective when anomaly evidence arises from semantic–spatial inconsistency rather than isolated appearance changes. This decomposition provides the theoretical basis for the proposed re-scoring: it extends anomaly evidence from local feature deviation to deviations in the compatibility between visual content and its expected semantic–spatial context.

3.3. Position-Aware Attention and Feature Extraction

Let e i ( x ) denote the visual embedding of patch i and p i its positional embedding. The input token for patch i is
Z i ( 0 ) ( x ) = e i ( x ) + p i .
At transformer layer , q-k self-attention is computed as
A ( ) ( x ) = softmax Q ( ) ( x ) K ( ) ( x ) d ,
where the softmax is applied along the key dimension. Because  Q ( ) and K ( ) are derived from tokens initialized with both visual and positional embeddings and subsequently updated through repeated self-attention and feed-forward transformations, A ( ) encodes appearance-dependent semantic–spatial relations among image patches. This does not imply that the transformer enforces an explicit coordinate-based rule; rather, it indicates that inter-patch affinities are jointly conditioned by visual evidence and the positional structure provided to the transformer.
For each selected layer , we first average the attention matrices across heads after removing the CLS-token row and column, resulting in a patch-to-patch attention matrix A ^ ( ) ( x ) R N × N . The remaining patch-to-patch attention matrix is then row-normalized so that each patch distributes unit attention over the remaining patch tokens before feature propagation. The relation-aggregated representation is obtained by averaging the propagated features over the selected layers:
M ( x ) = 1 | L | L A ^ ( ) ( x ) F ( x ) ,
where L denotes the set of transformer layers used for relation extraction. In the main AnomalyCLIP experiments, L contains the final five transformer layers.
The feature source is chosen to match the underlying anomaly detector. WinCLIP uses its CLIP patch representations, AnomalyCLIP uses DPAM-enhanced patch features, and AA-CLIP uses its adapted anomaly-aware patch features. For AnomalyCLIP, we construct the relation graph from the original q-k self-attention rather than the DPAM v-v attention, while using the DPAM patch features as the propagated content. This design follows the distinct roles of the transformer components. The q-k attention matrix explicitly represents pairwise attention affinities that determine how information is propagated across patches, making it a natural representation of semantic–spatial relations. In contrast, DPAM v-v attention is designed to enhance dense anomaly features through value-based aggregation. Although it can also define patch affinities, the ablation results show that it is less effective than q-k attention as the relation graph when DPAM features are used as the propagated content.

3.4. V1: Attention-Difference Relation Score

V1 serves as a preliminary ablation to examine whether deviations in attention affinities alone provide sufficient evidence for logical anomaly detection.
For category c, the normal attention prototype is constructed by averaging the attention matrices of normal training images:
A ¯ c = 1 | D c n | x D c n A ( x ) .
For test patch i, V1 measures deviations in both its outgoing and incoming attention affinities:
S i V 1 ( x ) = 1 2 N j = 1 N | A i j ( x ) A ¯ c , i j | + | A j i ( x ) A ¯ c , j i | .
The outgoing term measures how the attention assigned by patch i to other patches deviates from the normal prototype, whereas the incoming term measures deviations in how other patches attend to patch i. Therefore, V1 evaluates changes in the attention-based relation structure without considering the visual content transmitted through those relations. It is an attention-difference score rather than a feature-distance score.

3.5. V2: Feature-Relation Prototype

V2 is the final relation formulation, while the proposed detector output is obtained by fusing the V2 relation map with the unchanged baseline anomaly map. It uses self-attention as a relation operator over patch features.
For patch i, the relation-aggregated feature is defined as
M i ( x ) = j = 1 N A i j ( x ) F j ( x ) , M ( x ) = A ( x ) F ( x ) ,
where A i j ( x ) determines the contribution of patch j to the relation representation of patch i. For simplicity, A ( x ) denotes the layer-averaged attention defined in Equation (7). For each category c, a spatially indexed normal relation prototype is constructed by averaging the relation features of normal training images:
P c = 1 | D c n | x D c n M ( x ) .
Then, the relation anomaly score for patch i is computed as the Euclidean distance between the observed relation feature and its corresponding normal prototype:
S i V 2 ( x ) = M i ( x ) P c , i 2 .
The resulting patch-level scores are reshaped to the token grid and bilinearly upsampled to the input image resolution. Unless otherwise stated, the relation map is defined as S rel = S V 2 .
The relation prototype remains sensitive to spatial layout through two complementary mechanisms. First, the attention affinities are derived from transformer tokens that incorporate positional embeddings. Second, the prototype preserves each patch position instead of pooling all relation features into a single order-invariant representation. As a result, each patch is compared with the normal semantic–spatial context expected at the corresponding location, allowing displacement, absence, duplication, and invalid co-occurrence to appear as mismatches from the category-specific configuration.
This spatially indexed formulation assumes approximate spatial correspondence between normal reference and test images and is therefore best suited to controlled industrial inspection settings in which the object occupies a similar position, scale, orientation, and viewpoint. Exact pixel-level registration is not required because the comparison is performed on patch-level relation representations; nevertheless, geometric changes large enough to shift semantic components to different patch locations can increase the relation score even for normal samples. Consequently, robustness may degrade under substantial translation, scale variation, in-plane rotation, viewpoint change, or object misalignment, as discussed in Section 5.4.

3.6. Relation Map Fusion

The standalone relation map is evaluated to quantify the information supplied by V1 and V2, but it is not intended to replace the base detector. The final method combines V2 with the baseline anomaly map so that logical-relation evidence is added while the detector’s original local-defect response is retained. Let S ˜ b a s e denote the normalized anomaly map produced by the underlying detector and S ˜ r e l the normalized relation map computed by V1 or V2. We consider the general fusion form of Equation (3). This formulation includes relation-only inference, equal fusion, and weighted combinations as special cases. In particular, we evaluate S = S ˜ rel , S = S ˜ base + S ˜ rel , and weighted variants: S = S ˜ base + α S ˜ rel ( 0 < α < 1 ) or S = β S ˜ base + S ˜ rel ( 0 < β < 1 ) .
The relation map is treated as a substantial source of anomaly evidence rather than merely as a weak refinement term, so its contribution is not assumed a priori to be small. At the same time, fusion remains essential to the proposed formulation because it retains the baseline detector’s appearance-based evidence. We therefore evaluate multiple fusion strategies to determine an appropriate balance between the two cues.

3.7. Map-Based Image-Level Scoring

The proposed relation map is generated after the detector’s forward pass and therefore does not alter the CLS-token representation used by existing image-level classifiers. To evaluate the image-level contribution of the relation map itself, we derive image scores directly from the anomaly maps. Image-level scoring is performed on the raw anomaly maps rather than on the normalized maps used for spatial fusion. Although per-image min–max normalization is suitable for combining spatial maps within an image, it removes the absolute score scale required for comparing anomaly scores across different test images.
For an anomaly map S, the image score can be computed as
s r ( x ; S ) = 1 K r p TopK r ( S ) S p , K r = max ( 1 , r H W ) ,
for r { 0.01 , 0.05 } , together with the maximum score. In this study, Top-5% ( r = 0.05 ) is used as the primary image-level score, since logical anomalies typically occupy localized part-level regions rather than appearing as isolated peak responses.
The raw image scores produced by the base and relation maps may follow different category-dependent distributions. We therefore standardize them using category-specific statistics estimated exclusively from normal training images:
z c , r m ( x ) = s r ( x ; S m ) μ c , r m σ c , r m + ϵ , m { base , rel } .
The standardized scores are then combined with equal weights:
s c , r fuse ( x ) = z c , r base ( x ) + z c , r rel ( x ) .

3.8. Computational Overhead

The proposed relation module requires no additional network training. Relation prototypes are constructed by a single forward pass over the normal training images without backpropagation or parameter optimization. At inference, the attention matrices are already available from the transformer forward pass, so the additional computation is limited to relation-feature aggregation, prototype comparison, and map fusion. The dominant operation is the matrix multiplication A F , whose computational complexity is O ( L N 2 C ) for L selected transformer layers, N patch tokens, and feature dimension C.
The relation prototype requires storing one N × C feature matrix per category, resulting in a memory complexity of O ( N C ) per category. In the main AnomalyCLIP configuration ( 37 × 37 patch tokens), the proposed method introduces only a small computational and memory overhead.
Because it introduces no learnable parameters and requires no retraining, checkpoint modification, or architectural change, the proposed module can be incorporated into existing CLIP-based anomaly detectors as a post hoc plug-in.

4. Experiments

4.1. Experimental Setup

Datasets. MVTec LOCO AD serves as the primary benchmark. It contains five industrial object categories and provides image- and pixel-level annotations for both logical and structural anomalies [14]. CAD-SD is a single-category screw-assembly dataset introduced with SA-PatchCore [24]. Following the anomaly definitions provided with the dataset, we regard Over-coupling and Lacking as logical anomalies involving incorrect component composition or co-occurrence, whereas Scratch and Paint are treated as local surface anomalies. Since CAD-SD does not provide pixel-level ground-truth masks, we report only image-level results on this dataset. MVTec AD contains 15 industrial categories with image- and pixel-level annotations for local surface and structural defects [3]. It is used as an additional benchmark for measuring generalization to conventional local anomalies.
Baselines and checkpoints. AnomalyCLIP is used as the primary development baseline. We use its official implementation and the checkpoint trained on VisA [32] that is released through the official repository [41]. WinCLIP is included as a training-free CLIP-based reference and therefore requires no anomaly-detection checkpoint trained on a source dataset. AA-CLIP is included as a stronger anomaly-aware baseline. Since no official pretrained checkpoint was available, we trained AA-CLIP on VisA using the official implementation [42]. Unlike its default 32-shot setting, we used the full VisA training set, and the final-epoch checkpoints were used for all experiments. Detailed training settings are provided below.
The VisA-trained AnomalyCLIP and AA-CLIP checkpoints are kept fixed when evaluating MVTec LOCO AD, CAD-SD, and MVTec AD. Thus, no anomalous sample or anomaly annotation from any target benchmark is used for detector training or checkpoint adaptation. For the proposed method, only normal training images from the corresponding target category are used to construct the relation prototypes. Prototype construction requires only forward inference and does not update detector parameters. For CAD-SD, the text prompt category is specified as screw assembly.
Implementation details. AnomalyCLIP and AA-CLIP use the CLIP ViT-L/14@336px backbone, whereas WinCLIP uses ViT-B/16-plus-240 with LAION-400M pretrained weights (laion400m_e31). AnomalyCLIP uses the official VisA-trained checkpoint, while AA-CLIP uses the VisA-trained full-shot adapters described above. Input images are resized using bicubic interpolation and center-cropped to 518 × 518 for AnomalyCLIP and AA-CLIP and to 240 × 240 for WinCLIP, followed by standard CLIP normalization. These resolutions yield relation-feature grids of 37 × 37 , 15 × 15 , and  37 × 37 , respectively. For V2, the patch features are 2 -normalized, and the relation graph is obtained from the last five visual-transformer blocks; patch-to-patch attention is averaged over heads and row-normalized after removing the class token. The resulting relation maps are bilinearly upsampled, and  ϵ = 10 6 is used for numerical stability. The original detector-specific anomaly-map computations are retained, including Gaussian smoothing with σ = 4 , and all detector and relation-module settings are fixed across datasets without dataset-specific tuning.
For AA-CLIP, full-shot training uses the official preprocessing and augmentation pipeline. The text and image adapters are trained for 5 and 20 epochs using Adam ( β 1 = 0.5 , β 2 = 0.999 ), with learning rates of 1 × 10 5 and 5 × 10 4 and batch sizes of 16 and 2, respectively; the random seed is fixed to 111. Images are resized to 518 × 518 and normalized using the standard CLIP statistics; the official geometric augmentations are applied during adapter training, with additional color augmentation used only for the image adapter.
Normal reference images. The proposed relation module is training-free but uses normal reference images from each target category to construct category-specific relation prototypes. Unless otherwise specified, all normal images in the official training split are used, without limiting the number of prototype samples. MVTec LOCO AD uses 1778 normal reference images across five categories (351 for breakfast box, 335 for juice bottle, 372 for pushpins, 360 for screw bag, and 360 for splicing connectors). CAD-SD uses 400 normal images for its single screw assembly category. MVTec AD uses 3629 normal images across 15 categories, ranging from 60 (toothbrush) to 391 (hazelnut) images per category. The sensitivity to the number of normal reference images is analyzed in Appendix B.1.
Metrics. Dense anomaly localization is evaluated using pixel-level area under the receiver operating characteristic curve (AUROC) and per-region overlap (AUPRO). Image-level detection is evaluated using image AUROC and average precision (AP), where the image anomaly score is computed from the top 5% of the raw anomaly map as described in Equation (13). Because the proposed relation module modifies dense anomaly maps rather than the detector-specific image scoring functions, both the baseline and the proposed variants are evaluated using a common map-derived image scoring protocol. A common map-derived image score is used for all detectors because their original implementations employ different image-level scoring mechanisms. Using the same aggregation protocol allows the effect of the proposed relation re-scoring to be compared under a unified evaluation criterion rather than being influenced by detector-specific image-score definitions. All metrics are computed separately for each object category and then averaged across object categories. Pixel-level evaluation uses the normalized localization maps in Equation (3), whereas image-level evaluation uses the raw anomaly scores in Equations (13)–(15).
Model-selection protocol. The proposed method contains no learnable parameters. All design choices (attention source, number of attention layers, propagated feature layer, positional cue, image-level aggregation strategy, and fusion formulation/weights) were determined through the design-ablation study using AnomalyCLIP on the MVTec LOCO AD logical split. No separate validation split was created. After fixing a single configuration, the same settings were applied without modification to WinCLIP, AA-CLIP, CAD-SD, and MVTec AD.

4.2. Main Logical-Anomaly Results on AnomalyCLIP

Table 1 reports the category-averaged results of AnomalyCLIP on the logical-anomaly split of MVTec LOCO AD. Here, V1 denotes the attention-difference relation map, whereas V2 denotes the feature-relation map constructed from attention-aggregated patch features. V1 alone achieves only 51.0 pixel AUROC and 11.0 AUPRO, indicating that attention-affinity deviations alone provide limited localization capability. Fusing V1 with the baseline improves the localization performance to 52.4 AUROC and 24.3 AUPRO, but both remain below the baseline results of 53.9 AUROC and 28.7 AUPRO. At the image level, V1 reaches 59.6 AUROC and 60.9 AP, while fusion with the baseline retains 59.6 AUROC but reduces AP to 59.2. These results indicate that attention-difference information can increase the overall anomaly response, but the resulting map remains too spatially diffuse to serve as a reliable dense localization cue.
In contrast, V2 alone achieves 74.2 pixel AUROC and 51.7 AUPRO, substantially outperforming both the baseline and V1. This demonstrates that the proposed feature-relation representation provides a much stronger cue for logical anomaly localization. Combining V2 with the baseline yields the best overall results of 74.4 pixel AUROC, 52.7 AUPRO, and 71.7 image AUROC, corresponding to absolute gains of 20.5, 24.0, and 21.2 percentage points over the baseline, respectively. These gains show that the effect of relation re-scoring is substantial on the primary logical-anomaly task. Although V2 alone achieves a slightly higher image AP than the fused result, the proposed fusion consistently provides the best overall balance between image-level detection and pixel-level localization. Therefore, reporting both “V2 only” and “Baseline + V2” distinguishes the intrinsic capability of the proposed relation scoring from its complementary effect when integrated with the baseline detector.
Category-wise results are provided in Appendix C.1, Table A6 and Table A7. The improvements are observed across multiple object categories rather than being dominated by a single category, while also revealing differences between improvements in global image ranking and dense region localization, particularly for the screw bag category.

4.3. Generality Across WinCLIP and AA-CLIP

Table 2 evaluates the proposed relation formulation on two additional CLIP-based anomaly detectors, WinCLIP and AA-CLIP. The same post hoc computation is applied across detectors while each detector, its parameters, and its original anomaly map remain unchanged.
For WinCLIP, V2 alone substantially improves logical anomaly detection, increasing pixel AUROC from 51.2 to 70.1, pixel AUPRO from 27.1 to 41.6, and image AUROC from 55.5 to 69.4. Although the fused result remains better than the original baseline, it is slightly inferior to V2 alone in the localization metrics. Compared with AnomalyCLIP, the larger improvement observed for WinCLIP suggests that the proposed relation representation is particularly beneficial when the underlying baseline provides relatively weak patch-wise localization. In this case, the relation cue becomes the dominant source of logical anomaly evidence.
AA-CLIP exhibits a slightly different behavior. V2 alone achieves the highest image-level performance, with 66.4 AUROC and 68.7 AP. At the pixel-level, it preserves a similar pixel AUROC, but substantially reduces pixel AUPRO, indicating less accurate region coverage than the baseline. Integrating V2 with the baseline yields a small numerical increase in pixel AUROC from 62.9 to 63.6, while improving pixel AUPRO from 45.8 to 48.4 and image AUROC from 50.9 to 63.1. Given the small magnitude of the pixel-AUROC difference, we do not interpret this change alone as evidence of a statistically meaningful improvement. In contrast, Baseline + V1 yields only modest gains in AUPRO and the image-level metrics, reduces pixel AUROC, and remains clearly weaker than Baseline + V2 for localization.
Although AA-CLIP achieves the strongest baseline performance on the logical-anomaly split, V2 is less effective with AA-CLIP than with AnomalyCLIP or WinCLIP, both independently and after fusion. This contrast indicates that baseline anomaly-detection performance and compatibility with relation-based modeling are not necessarily correlated. The effectiveness of V2 therefore depends not only on the strength of the underlying detector but also on whether its feature representation preserves information suitable for semantic–spatial relation modeling.
Overall, the results demonstrate that the proposed feature-relation formulation generalizes consistently across different CLIP-based anomaly detectors despite their substantially different localization mechanisms. Complete category-wise localization and image-detection results for WinCLIP and AA-CLIP on the logical-anomaly split of MVTec LOCO AD are provided in Appendix C, Table A10, Table A11, Table A14, and Table A15.

4.4. Positioning Against Logical-Anomaly-Specific Methods

Table 3 positions the proposed method relative to recent logical-anomaly-specific approaches in terms of their required supervision, additional resources, and modeling assumptions. Therefore, the reported image-level performance should be interpreted as a qualitative comparison rather than a controlled leaderboard.
PSAD relies on manually annotated component masks to train an additional segmentation network and construct multiple component- and patch-level memory banks. SALAD removes manual component annotation but still requires a pseudo-label generation pipeline based on DINO [39] and SAM-HQ [43], training of a component segmentation network, and discriminative learning with synthetic logical anomalies. ObjectCore depends on few-shot support images together with an open-world object detector and a mask-generation model. LogicQA avoids task-specific training and annotation but relies on a large pretrained vision–language model and repeated question-generation and question-answering inference.
These methods explicitly model object composition, component relationships, or logical reasoning, providing strong priors for image-level logical anomaly detection. Therefore, their reported AUROC is obtained under substantially different supervision, reference-data, computational, and modeling assumptions, making direct performance comparison inappropriate.
In contrast, the proposed method introduces no additional annotations, object detectors, mask generators, synthetic logical anomalies, or explicit reasoning modules. Instead, it exploits the semantic–spatial relationships already encoded in pretrained CLIP features and constructs only normal relation prototypes. The objective is not to replace dedicated logical-reasoning systems or convert the baseline into a logical-anomaly-specific model. Instead, the unchanged baseline map is fused with relation evidence extracted from the same transformer, extending sensitivity to logical anomalies while retaining the detector’s original dense anomaly pathway and requiring no separate logical-analysis pipeline.

4.5. Results on Structural Anomalies

Table 4 reports the corresponding results on the structural-anomaly split of MVTec LOCO AD. Unlike logical anomalies, structural defects are typically characterized by localized appearance changes, making accurate local evidence more important than relational context.
For AnomalyCLIP, V1 remains ineffective, achieving only 59.4/12.8 pixel AUROC/AUPRO and 46.9/42.5 image AUROC/AP. Baseline + V1 restores much of the lost local information (71.7/52.2), but still does not reach the baseline performance. V2 alone also substantially degrades region precision. Although Baseline + V2 achieves the best pixel AUROC and image-level performance, it lowers pixel AUPRO compared with the baseline, indicating that relation modeling improves pixel ranking and image-level detection but does not consistently preserve accurate defect regions.
For WinCLIP, the proposed V2 fusion improves both pixel AUROC (77.3 to 80.8) and pixel AUPRO (42.4 to 54.9), demonstrating that relation context can complement a relatively weak local anomaly map. In contrast, Baseline + V1 provides only a modest AUPRO gain and decreases the other three metrics.
AA-CLIP exhibits a different behavior. The baseline already achieves the strongest structural localization (89.7 pixel AUROC and 76.5 AUPRO), while both Baseline + V1 (88.1/68.9) and Baseline + V2 (89.2/73.7) reduce localization performance. Furthermore, both relation-only variants remain substantially below the baseline, indicating limited compatibility between AA-CLIP’s anomaly-aware features and the proposed relation representation for structural defects in this setting.
Appendix C, Table A8, Table A9, Table A12, Table A13, Table A16, and Table A17 provide the complete category-wise results. Overall, the effectiveness of relation modeling is considerably more dependent on the underlying detector for structural anomalies than for logical anomalies. These results also explain why Baseline + V2, rather than V2 only, is the proposed configuration: retaining the baseline map substantially restores local-defect evidence.
This observation is consistent with the nature of the two anomaly types. Structural defects usually produce strong local appearance changes that are already captured by patch-level representations, so replacing or averaging these responses with contextual information can weaken localization accuracy. In contrast, logical anomalies often exhibit only subtle local appearance changes, making deviations in semantic–spatial relationships a more informative cue. These complementary characteristics define the scope of the proposed relation modeling.

4.6. External Validation on CAD-SD

Table 5 reports image-level results on CAD-SD, where Over-coupling and Lacking are treated as logical co-occurrence anomalies, while Scratch and Paint represent surface defects. The results provide external evidence that relation-based scoring is particularly effective for detecting co-occurrence violations.
For AnomalyCLIP, V2 alone increases logical-anomaly AUROC from 50.0 to 96.0 and AP from 27.8 to 91.5. Baseline + V2 also substantially outperforms the baseline, although it does not retain the full gain of the relation-only score. On the surface subset, all variants achieve nearly saturated performance, making it difficult to assess anomaly-type specificity from AnomalyCLIP alone.
WinCLIP provides the clearest separation between the two anomaly types. V2 alone improves logical AUROC from 36.5 to 98.7 and AP from 22.1 to 97.4. In contrast, its surface AUROC/AP decreases from 76.6/62.6 to 54.8/31.8. Baseline fusion recovers much of the lost surface performance but remains slightly below the baseline. This contrast indicates that relation scoring is highly informative for co-occurrence violations but cannot replace the local appearance evidence required for surface-defect detection.
AA-CLIP exhibits a similar pattern. V2 alone raises logical AUROC from 18.5 to 68.1 and AP from 18.1 to 54.8, while reducing surface AUROC/AP from 91.1/86.7 to 72.6/42.8. Baseline + V2 retains only part of the logical improvement but slightly improves the surface baseline to 93.9 AUROC and 90.9 AP. Together with the WinCLIP results, this consistent pattern indicates that relation-only scoring is particularly effective for co-occurrence anomalies, whereas fusion with the local baseline is important for preserving appearance-based defect evidence.
Overall, the consistent behavior across all three detectors supports the intended role of V2: it captures violations of normal semantic–spatial relationships that may not produce a strong local appearance shift. In contrast, surface anomalies are more directly represented by local feature deviations and therefore benefit less consistently from relation-only scoring. Complete results, including the corresponding V1 variants, are provided in Appendix D, Table A18.

4.7. Additional Evaluation on MVTec AD

Table 6 further evaluates the proposed method on MVTec AD, a widely used benchmark that primarily contains structural and surface defects. The results show that relation-only scoring cannot generally replace the local anomaly evidence required for this setting.
For AnomalyCLIP, Baseline + V2 improves pixel AUROC from 88.2 to 89.2 and also increases both image-level metrics. However, pixel AUPRO decreases from 80.5 to 77.5, indicating that the fused response improves overall pixel ranking but produces less precise region-level localization. V2 alone performs substantially below the baseline, further showing that relation context is insufficient as a standalone cue for many MVTec AD defects.
For WinCLIP, relation modeling is consistently beneficial. Even V2 alone outperforms the baseline across all pixel- and image-level metrics, improving pixel AUROC/AUPRO from 83.0/58.9 to 88.3/70.2. Baseline + V2 further increases performance to 90.3/77.5 with corresponding improvements in image AUROC and AP. Unlike the other detectors, these results indicate that relation modeling itself provides a stronger anomaly representation than the original WinCLIP baseline, while baseline fusion further combines complementary local and relational evidence.
AA-CLIP shows a different fusion outcome. Its baseline already achieves 91.0 pixel AUROC and 88.0 AUPRO, whereas Baseline + V2 reduces these metrics to 89.5 and 81.6, respectively, despite improving image-level detection. Together with the decrease in AnomalyCLIP AUPRO and the weak relation-only results, this finding shows that relation context does not consistently improve dense localization when local structural cues are already captured effectively by the transferred baseline.
Overall, the effectiveness of V2 on MVTec AD depends strongly on the underlying detector. For WinCLIP, relation modeling alone already provides a stronger anomaly representation than the original baseline, and fusion further improves performance by combining local and relational cues. In contrast, AnomalyCLIP and AA-CLIP continue to rely primarily on local texture, boundary, and material evidence for accurate dense localization. As detailed by the category-wise results, relation re-scoring is most helpful for categories containing orientation, component, or configuration changes, whereas texture-dominated categories with strong baseline responses show smaller or negative changes. Complete V1/V2 results and category-wise baseline and fusion results are provided in Appendix E, Table A19 and Table A20.

4.8. Ablation Studies and Design Analysis

We evaluate the principal design choices on the logical-anomaly split of MVTec LOCO AD using AnomalyCLIP. Table 7 summarizes the main comparisons, while complete parameter sweeps are reported in Appendix B, Table A1, Table A2 and Table A3.
Relation content. The first block of Table 7 compares four relation representations. The position-only relation replaces semantic feature similarity with patch-coordinate information, so that relation propagation depends only on spatial proximity. The raw-feature prototype directly compares each patch feature F i with the normal feature prototype at the same spatial index, without attention-based feature propagation. The attention-propagated feature relation corresponds to the proposed V2 formulation without the additional explicit position term, where the patch features are propagated through the attention graph before constructing the position-indexed normal prototype, whereas the fourth variant combines the attention-propagated semantic features with an explicit coordinate-derived position term. Under the preliminary early-fusion formulation, the position-only configuration achieves 55.7 pixel AUROC and 31.2 AUPRO, providing only a modest improvement over the AnomalyCLIP baseline of 53.9/28.7. The raw-feature prototype substantially improves performance to 63.2/38.2, showing that position-indexed normal feature statistics themselves provide a strong anomaly cue. The attention-propagated feature relation further improves performance to 63.9/39.0. Adding an explicit coordinate-derived positional term produces 63.9/38.7 and therefore does not improve upon the attention-propagated feature result. The complete relation-weight sweep in Table A1 of Appendix B shows the same overall ordering.
These results show that position-indexed feature prototypes account for a substantial portion of the improvement, while attention-based feature propagation provides an additional gain. However, explicit coordinates are not the primary source of the gain. Spatial information is already incorporated through the visual transformer: positional embeddings affect attention formation across layers, while the category-specific prototype ( P c , i ) retains the expected patch index. Consequently, the attention-propagated feature relation (V2) can characterize deviations from a semantic–spatial relation pattern without an additional absolute-coordinate term. Explicit positional cues may also introduce sensitivity to alignment, scale, or viewpoint variation.
Attention graph. The second block compares the attention representation used to define the relation graph. Using relation maps aggregated from the last five layers, DPAM v-v attention obtains 70.6 pixel AUROC and 46.7 AUPRO, whereas the original q-k attention reaches 74.2/51.7. Because both configurations use V2 only, the difference directly reflects the choice of relation graph rather than its fusion with the baseline.
This comparison supports the use of q-k attention as the semantic–spatial graph for message passing. The q-k representation describes contextual dependencies between patch queries and keys, while DPAM features provide the anomaly-sensitive content propagated through these dependencies. In contrast, using the same v-v mechanism to define the relation affinity and produce the anomaly-aware feature content may yield less complementary information.
Table A2 in Appendix B further evaluates the number of aggregated attention layers and the feature source. The one-, three-, and five-layer v-v variants remain relatively close, with the best AUROC and AUPRO obtained by different aggregation depths. The selected last-five-layer q-k configuration nevertheless outperforms all evaluated v-v alternatives on both metrics. Using the preceding feature layer instead of the final layer also reduces performance under the v-v setting, supporting the use of late semantic features.
Fusion formulation and weight. The final row of Table 7 combines the selected q-k relation map with the baseline anomaly map. Equal weighting, corresponding to β = 1 in β S base + S rel , achieves the best overall result of 74.4 pixel AUROC and 52.7 AUPRO. This slightly improves upon the relation-only q-k result of 74.2/51.7, indicating that the baseline retains complementary local anomaly evidence.
The complete fusion analysis in Table A3 of Appendix B explains the transition from the preliminary to the final formulation. Under S base + α S rel , performance improves continuously as α increases over the evaluated range, showing that the relation score should not be treated as only a small correction to the baseline. After reparameterizing the fusion as β S base + S rel , performance remains stable across a broad range of β , and equal fusion yields the highest observed AUPRO while retaining the best AUROC. We therefore fix β = 1 without category-specific tuning.
Overall, the ablations support three design conclusions. First, spatially indexed feature prototypes account for a substantial part of the improvement, while attention propagation provides a further gain; explicit coordinate information alone is considerably less effective and provides little additional benefit when combined with semantic features. Second, original q-k attention provides a more effective relation graph than DPAM v-v similarity in the evaluated configuration. Third, the relation branch provides a major complementary logical-anomaly cue rather than merely a small correction to the baseline, while equal fusion preserves complementary local evidence from the baseline.

4.9. Qualitative Analysis

Figure 2, Figure 3, Figure 4 and Figure 5 present qualitative visualizations of the proposed method on representative logical, structural, co-occurrence, and surface anomalies using AnomalyCLIP. These examples illustrate how semantic–spatial relation modeling influences the anomaly maps and complement the quantitative results presented in the previous sections. The visualizations are interpreted together with the relation formulation in Equations (10)–(12), highlighting how deviations from the normal semantic–spatial relations contribute to anomaly localization.
To examine the cross-detector applicability of the proposed relation modeling, Figure A1 in Appendix A compares results from AnomalyCLIP, WinCLIP, and AA-CLIP on the same MVTec LOCO AD logical-anomaly examples.

4.9.1. Logical Anomalies on MVTec LOCO AD

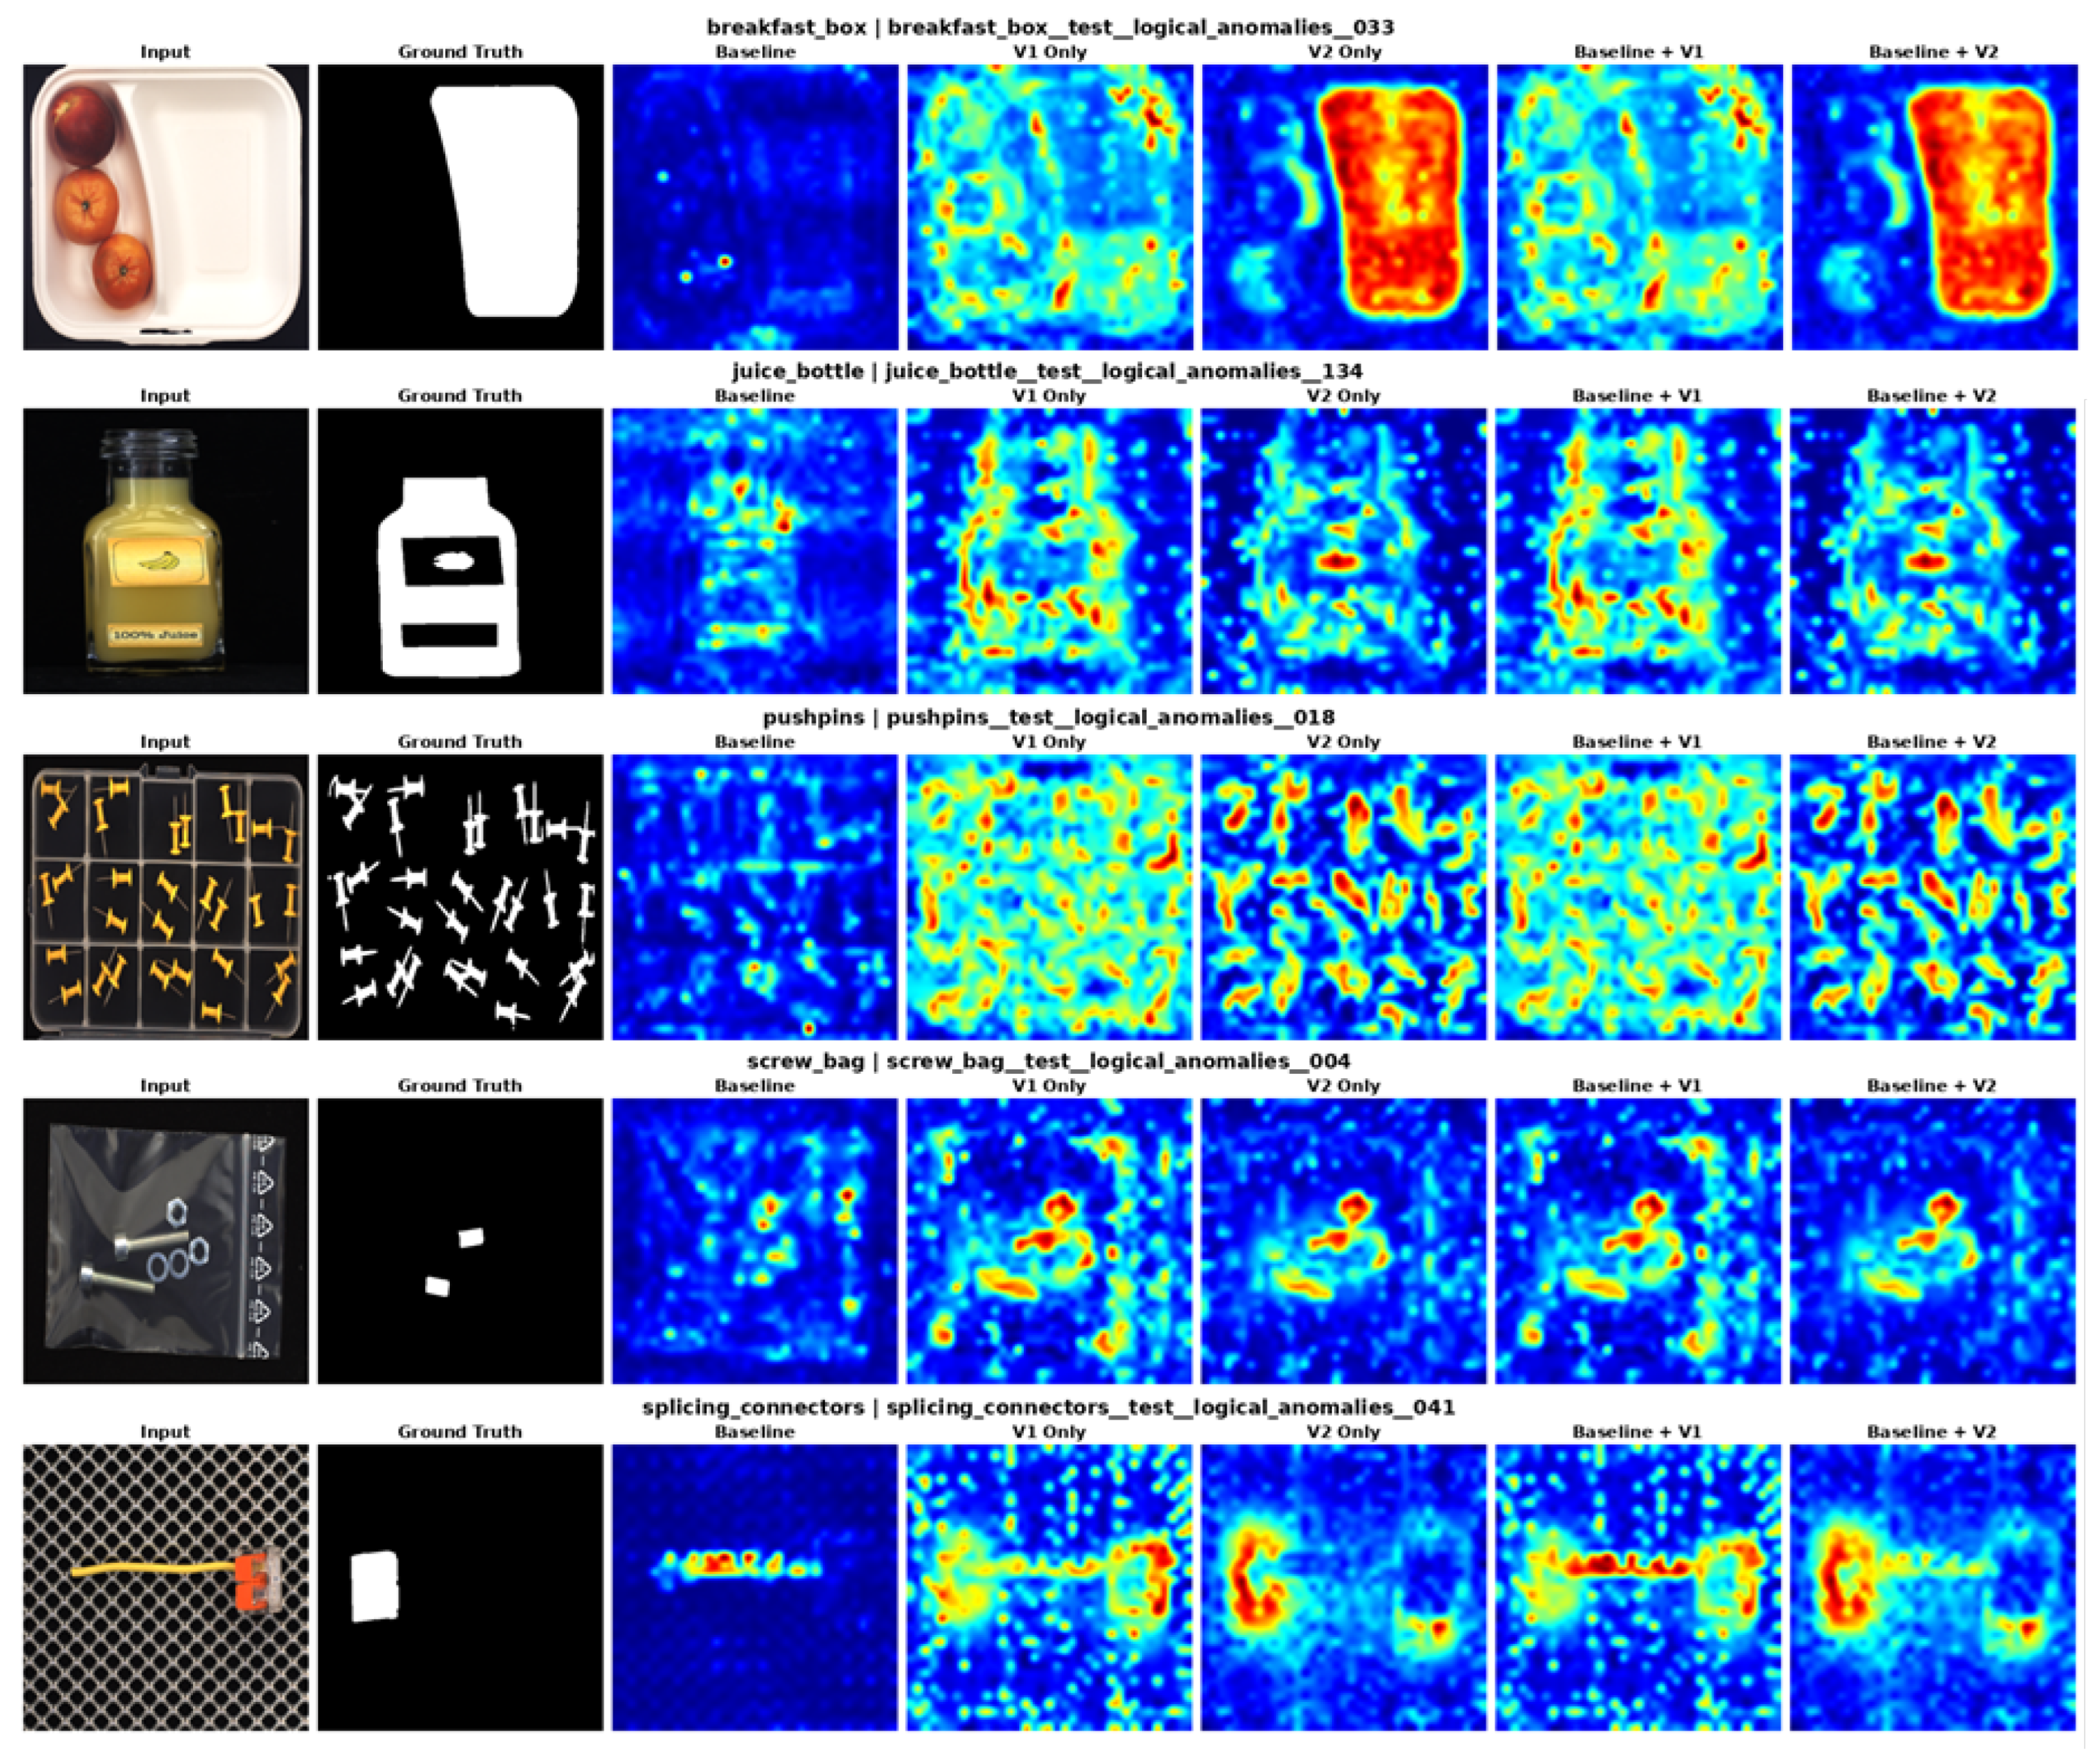
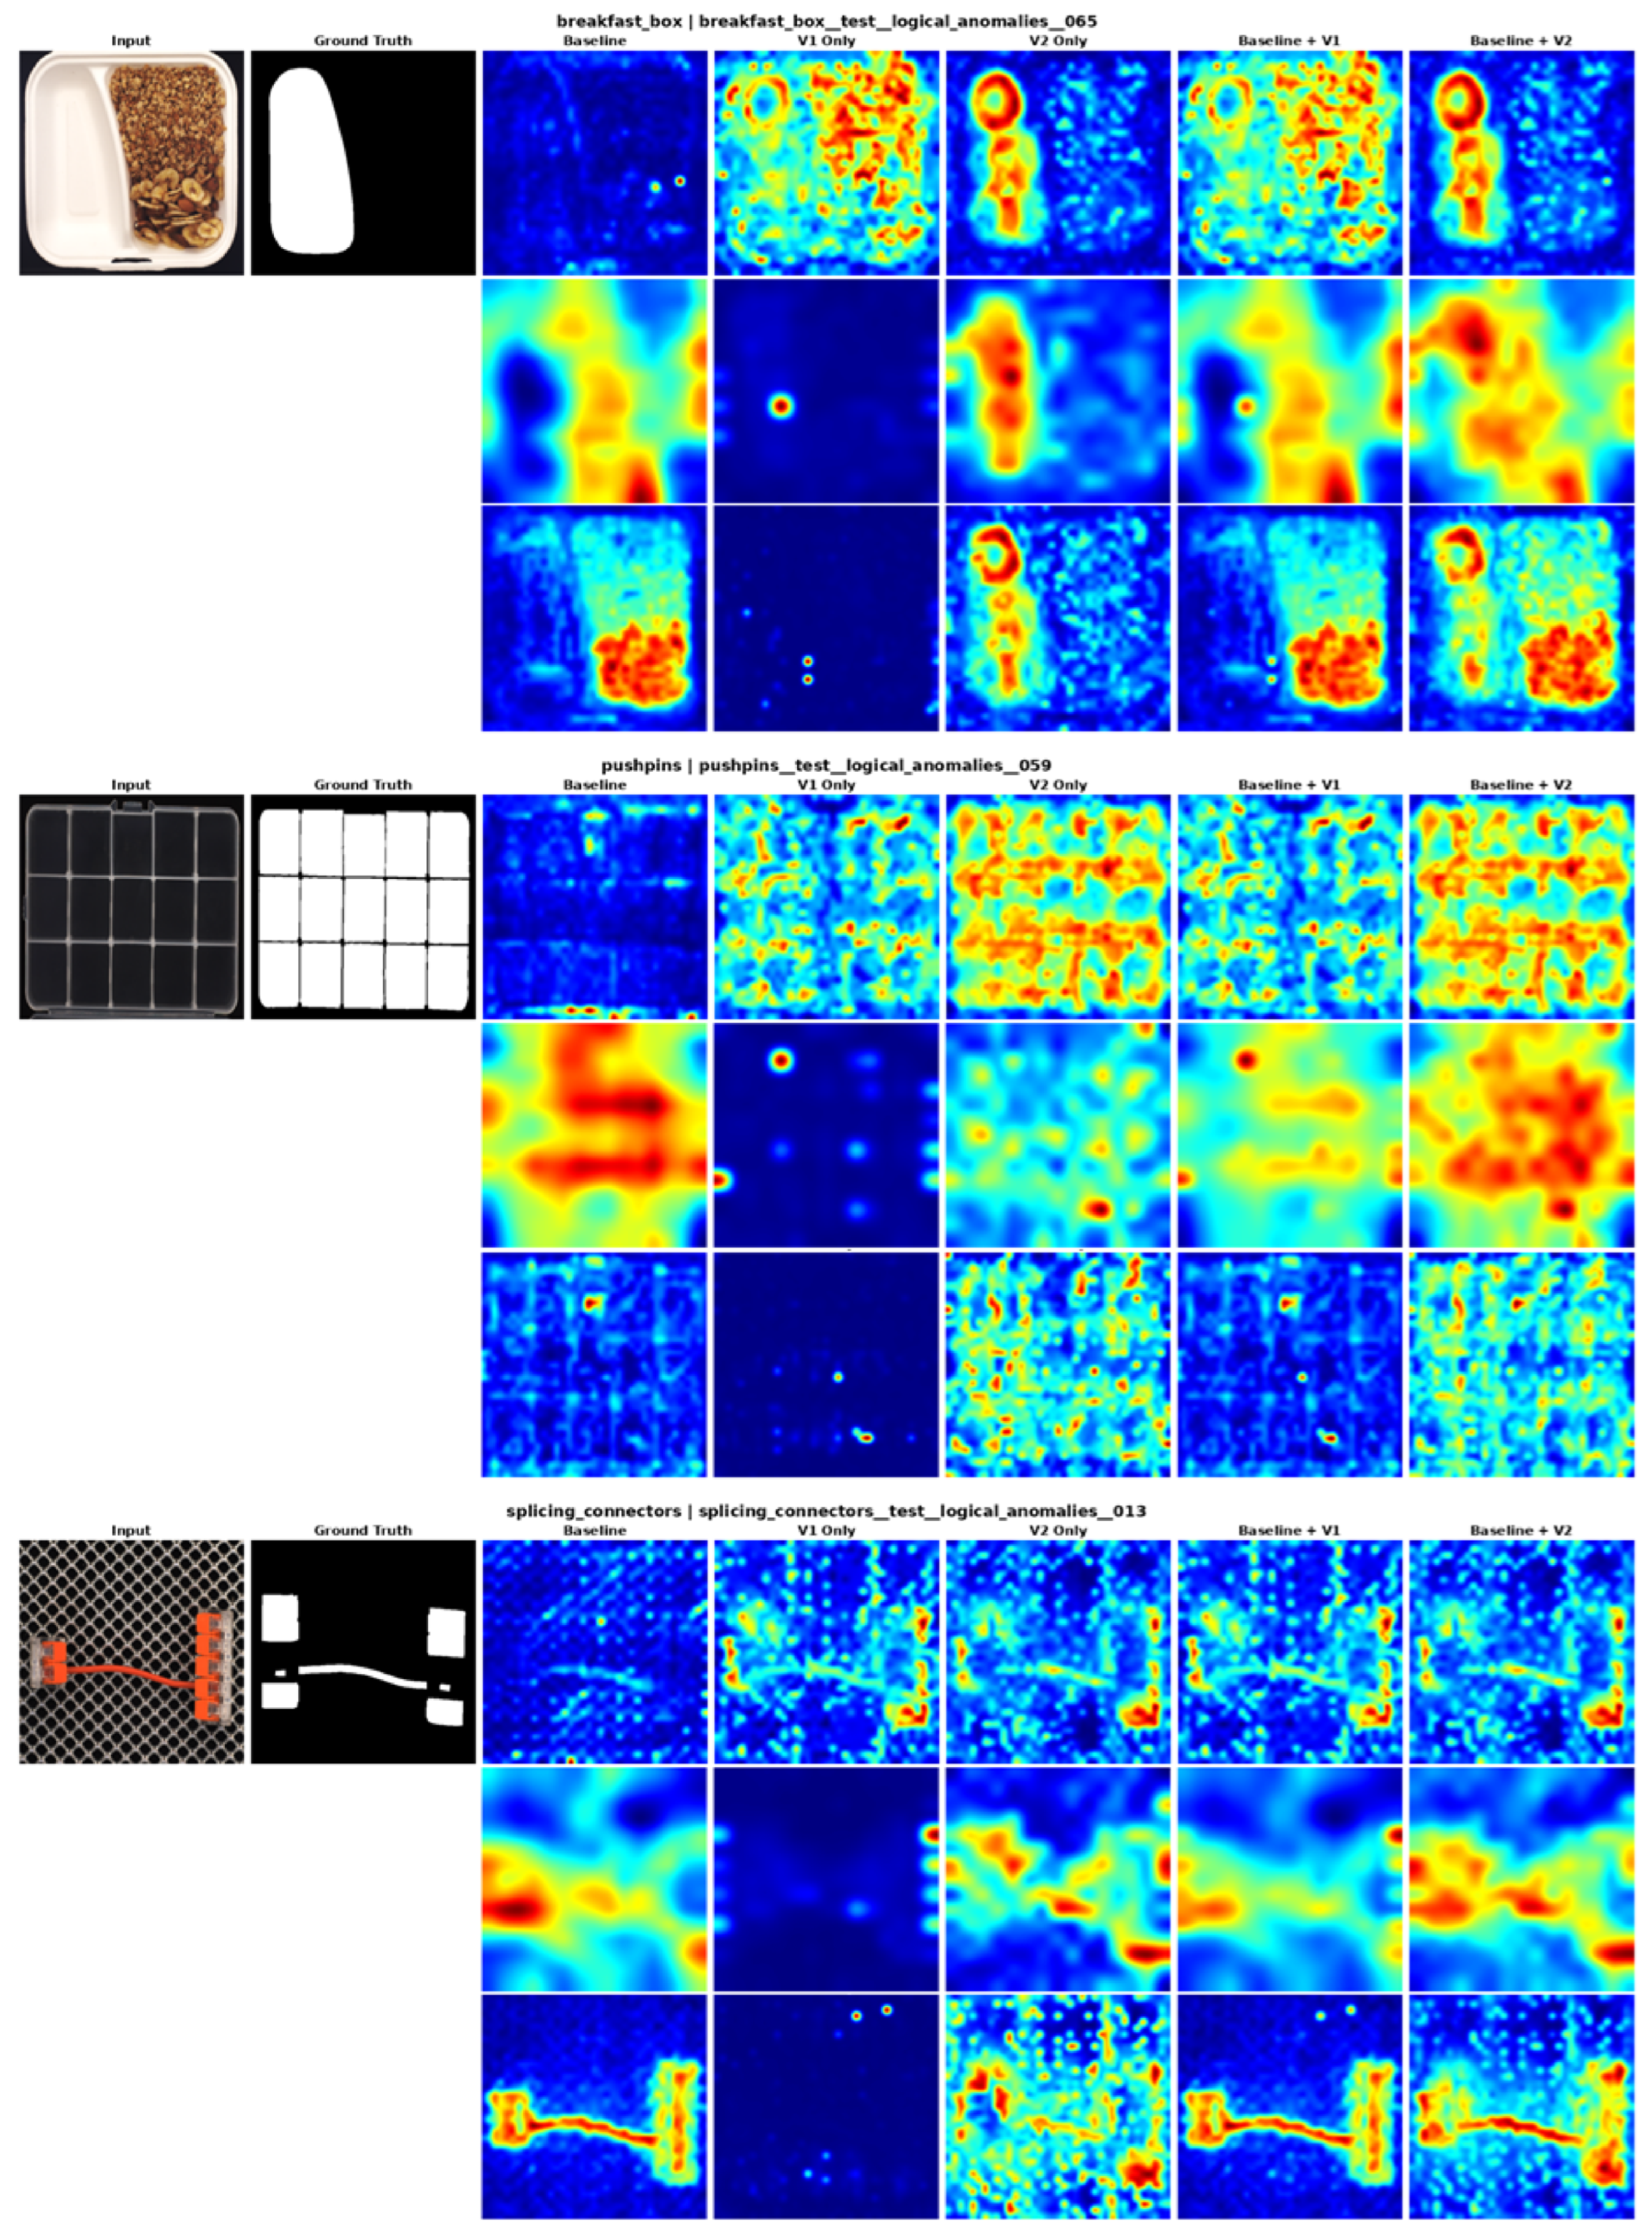
Figure 2 compares the AnomalyCLIP baseline, V1 only, V2 only, and their fused variants on representative logical anomalies from MVTec LOCO AD. The examples include missing, misplaced, duplicated, and incorrectly connected components in the breakfast box, juice bottle, pushpins, screw bag, and splicing connectors categories. The patch-wise baseline mainly responds to locally unusual appearance and is therefore often weak when the individual components remain visually plausible but violate the expected product configuration through their presence, number, position, or connectivity.
V1 measures changes in the attention-connectivity pattern without considering the feature content propagated through the relation graph. It can respond to broad configurational changes, but its activation is often spatially diffuse or does not align clearly with the component responsible for the logical violation. In contrast, V2 evaluates whether the attention-aggregated feature content is consistent with the normal relation prototype at each patch location. Therefore, it can assign a high anomaly score to a locally plausible component when that component appears at an unexpected location, replaces an expected part, occurs in an incorrect number, or participates in an abnormal spatial relationship.
Figure 2. Qualitative comparison on representative MVTec LOCO AD logical anomalies using AnomalyCLIP. V1 measures changes in attention-connectivity, whereas V2 measures the L2 deviation between attention-aggregated features and normal relation prototypes. Compared with the patch-wise baseline and V1, V2 more clearly highlights components or expected regions associated with missing, displaced, duplicated, or incorrectly connected parts, while Baseline + V2 preserves complementary local anomaly evidence.
Electronics 15 04293 g002
This distinction is visible across the examples in Figure 2. For breakfast box and splicing connectors, V2 produces a more coherent response over the component or region involved in the configuration error. For pushpins and screw bag, it better reflects changes in component arrangement or count than the patch-wise baseline. In the juice bottle example, V2 responds more selectively to the small component associated with the logical violation, whereas the baseline mainly produces a broader appearance-driven response. These qualitative observations are consistent with the quantitative results in Table 1, where V1 provides only limited localization gains, whereas V2 yields substantially stronger pixel-level performance.
Baseline + V2 combines complementary local and relational evidence. The baseline preserves responses to locally unusual appearance, whereas V2 highlights components or expected locations involved in the logical inconsistency. Across several examples, the fused map produces a clearer response than either the baseline or V1-based fusion, although the degree of improvement varies across categories.

4.9.2. Structural Anomalies on MVTec LOCO AD

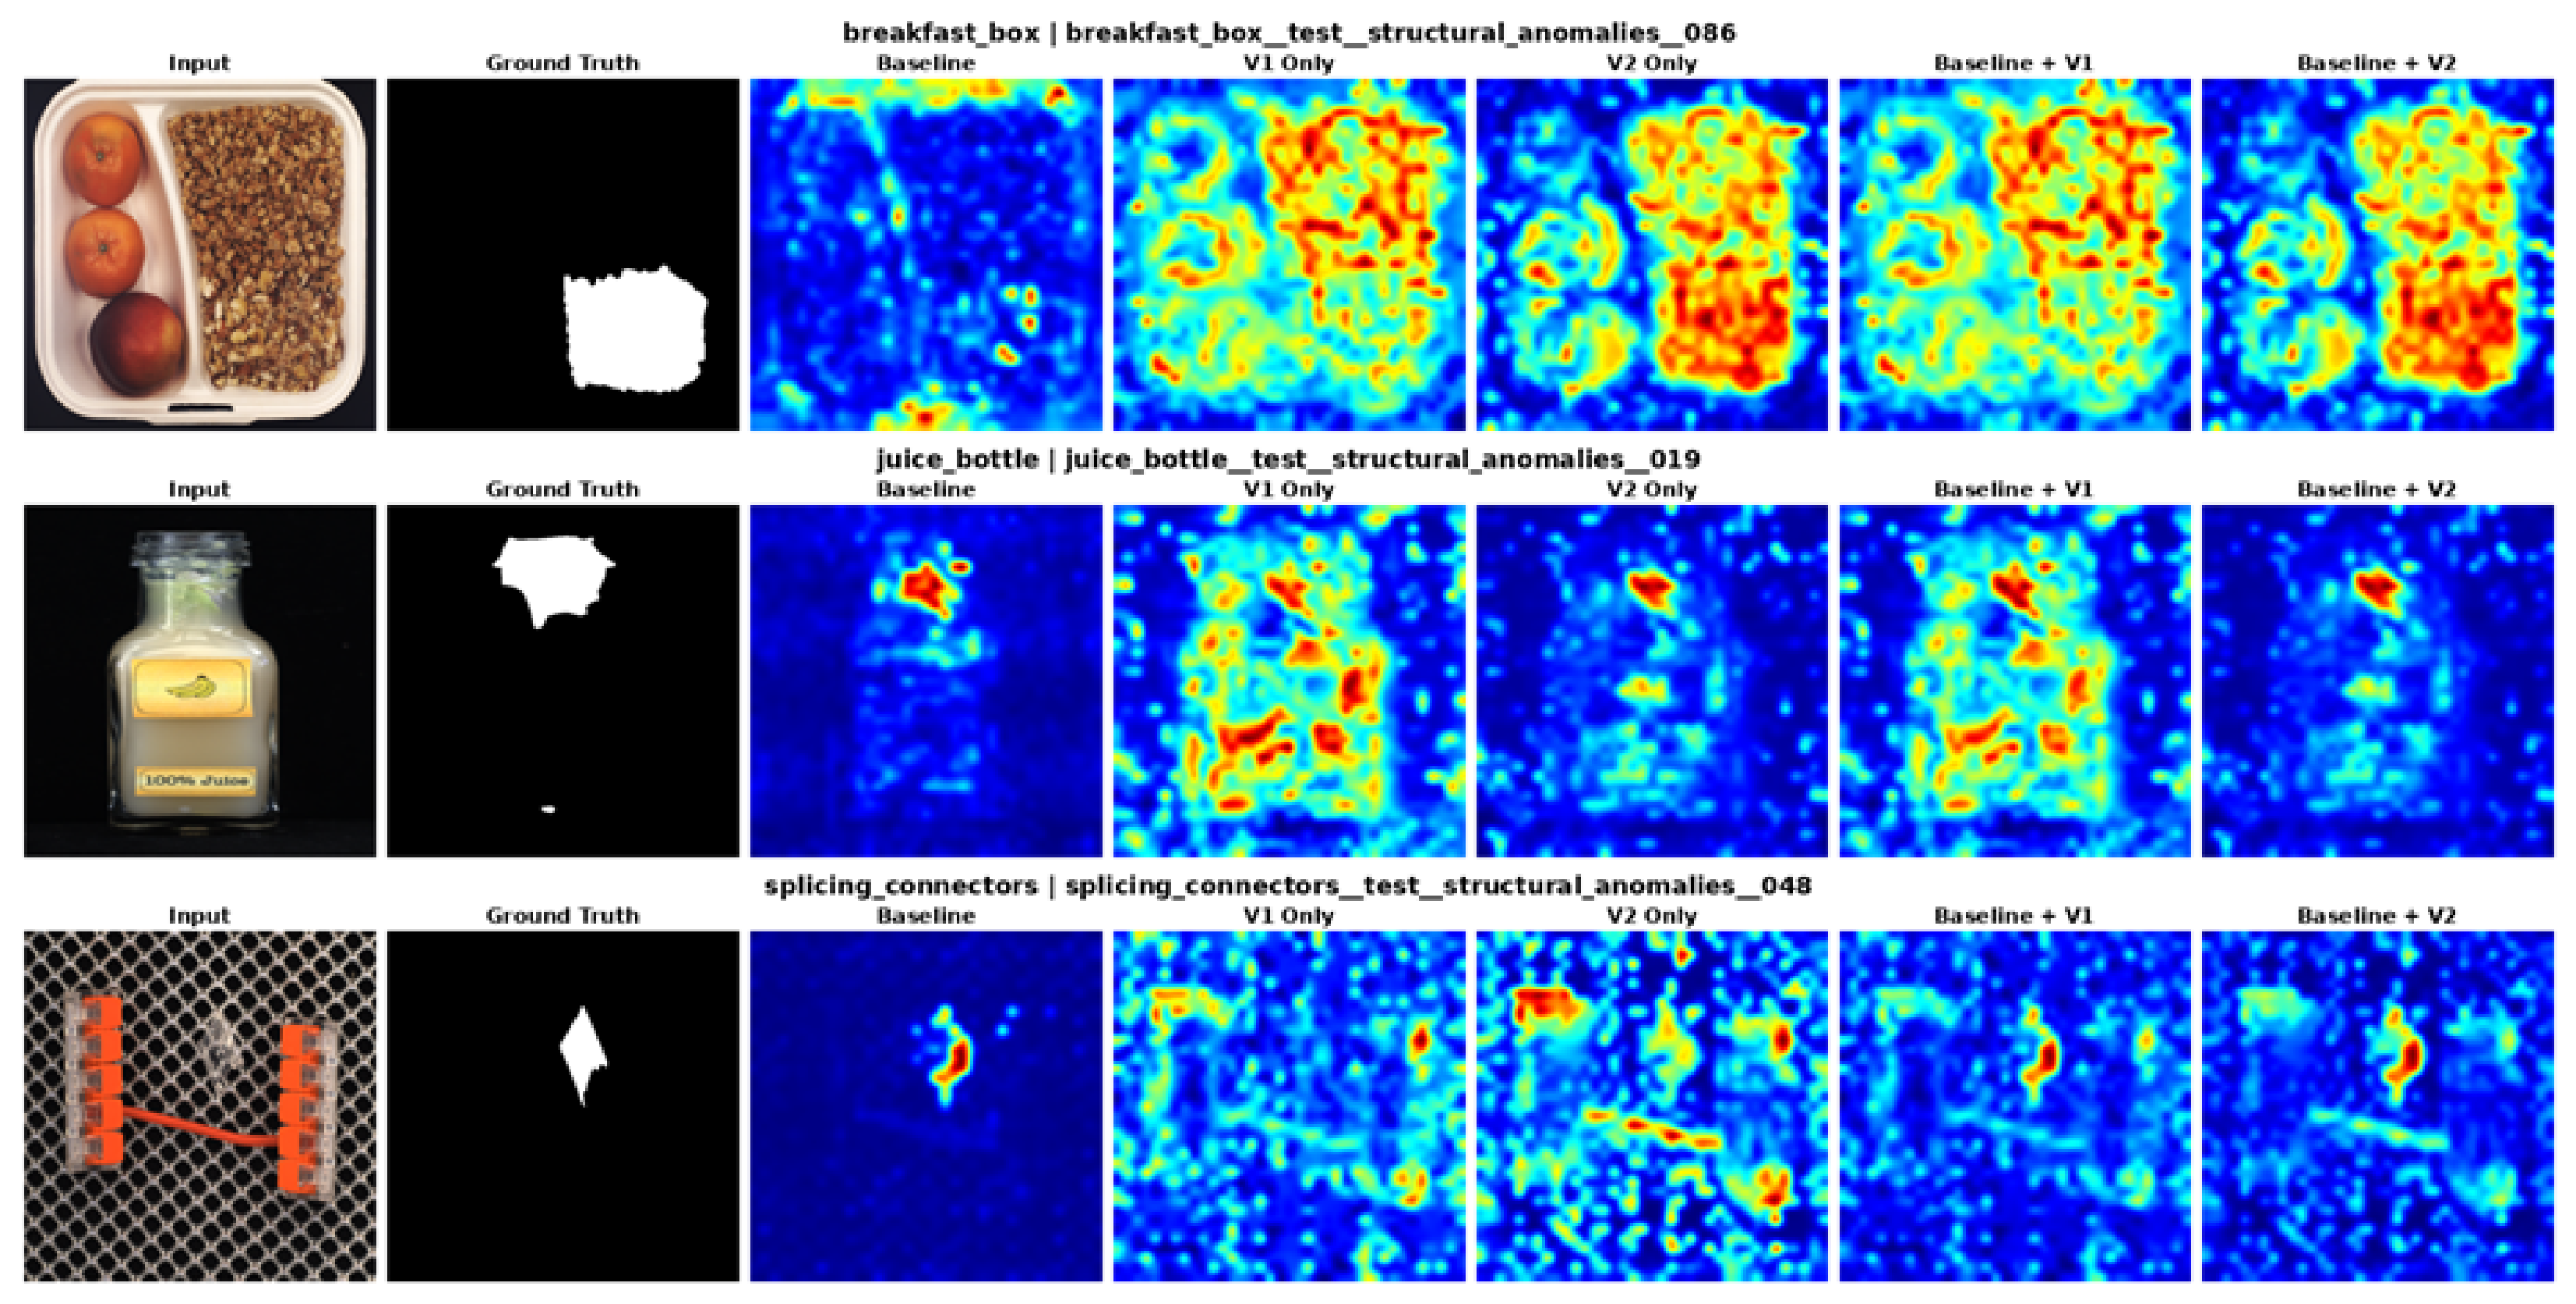
Figure 3 exhibits a different response pattern from the logical anomalies. Structural defects are typically characterized by localized appearance changes, such as cracks, deformations, or boundary irregularities, which are effectively captured by the patch-wise baseline. Consequently, the baseline generally produces sharper localization than the relation maps for small structural defects.
Figure 3. Qualitative comparison on representative MVTec LOCO AD structural anomalies using AnomalyCLIP. The baseline responds more precisely to localized appearance changes, whereas V2 primarily captures structural changes that influence semantic–spatial relations across multiple patches. Baseline + V2 combines complementary local appearance and relation cues, with the degree of improvement depending on the spatial extent of the defect.
Electronics 15 04293 g003
V1 exhibits a similar tendency to V2 by responding to broader structural changes rather than fine local appearance variations. However, because it measures only changes in attention connectivity, its responses are generally more diffuse and less precisely aligned with the structural defects than the baseline.
V2 evaluates deviations from normal semantic–spatial relations rather than local appearance itself. When a defect is confined to a small portion of a patch, it may not substantially alter the contextual relations between neighboring patches, resulting in a relatively weak relation response. This behavior is evident in the juice bottle and splicing connectors examples, where the baseline localizes the structural defects more precisely than V1 and V2.
In contrast, when the structural anomaly affects a larger semantic region, both V1 and V2 respond more strongly. The breakfast box example shows that V2 produces a more coherent response over the defective food region, indicating that larger structural modifications can also alter the semantic–spatial relations captured by the proposed representation.
These observations are consistent with the quantitative results in Table 4. The baseline remains more effective for fine local defects, whereas relation modeling provides complementary structural evidence when a structural change affects a broader semantic region or inter-patch geometry. Although the visual effect of fusion is not consistently distinct across these examples, the quantitative results indicate that combining local appearance and relation cues can still benefit particular metrics and categories.

4.9.3. Co-Occurrence and Surface Anomalies on CAD-SD

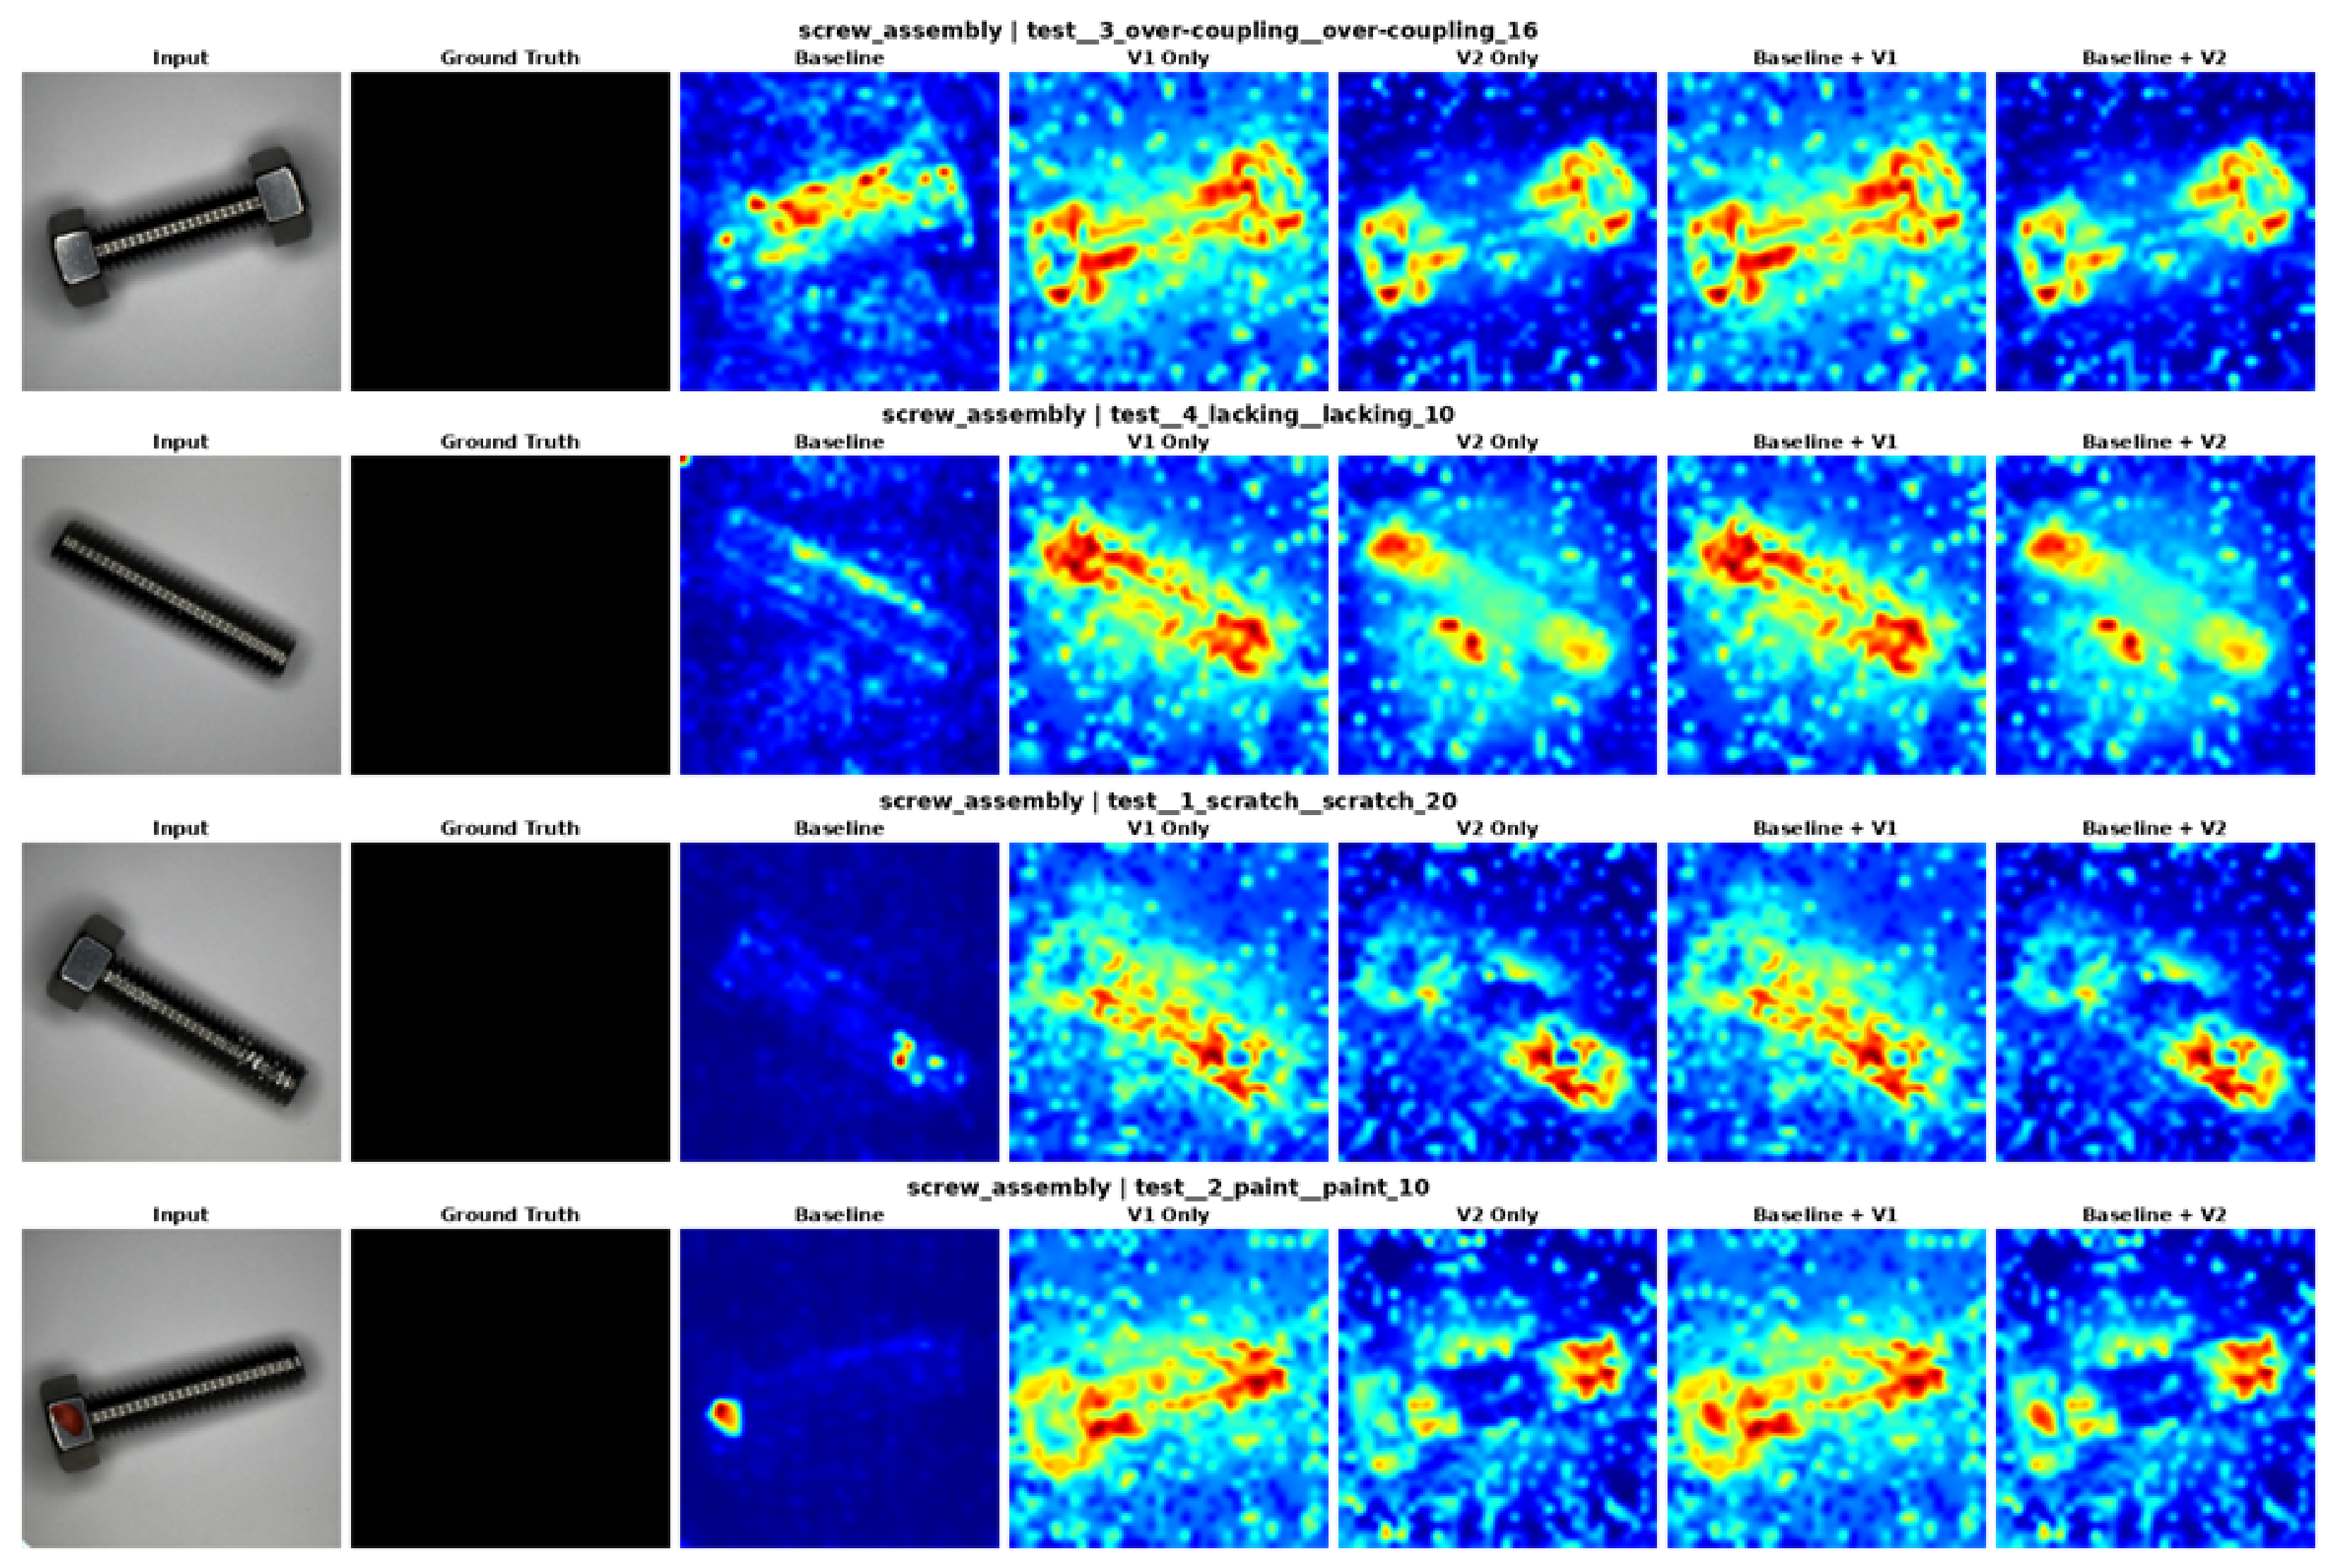
Figure 4 further illustrates the different behaviors of the proposed relation modeling on co-occurrence and surface anomalies in CAD-SD. Over-coupling and Lacking violate the expected relationships between otherwise normal assembly components while largely preserving their local appearance. Consequently, the patch-wise baseline often produces relatively weak or incomplete responses because the individual screw and nut components remain visually plausible.
Figure 4. Qualitative comparison on representative CAD-SD anomalies using AnomalyCLIP. V2 produces clear responses to co-occurrence anomalies (Over-coupling and Lacking) by highlighting disrupted component relations, whereas surface anomalies (Scratch and Paint) remain primarily characterized by local appearance changes. Baseline + V2 combines complementary local appearance and relation cues.
Electronics 15 04293 g004
V1 shows a similar qualitative tendency to V2 by responding to changes in component configuration. However, its responses are generally more diffuse and less focused on the components responsible for the co-occurrence violation. Incorporating the propagated feature content in V2 produces more coherent responses over the altered assembly, making the distinction between normal and abnormal configurations more evident.
As a result, V2 responds strongly to the altered assembly configuration in both Over-coupling and Lacking, highlighting the affected components or their expected locations. The fused map exhibits a similar response pattern, indicating that the relation cue dominates the localization of co-occurrence anomalies. These qualitative observations are consistent with the substantial improvement on the logical subset reported in Table 5.
A different behavior is observed for Scratch and Paint. These anomalies are primarily characterized by localized texture or color changes rather than changes in component relationships. Accordingly, the baseline remains the dominant source of localization, while the relation maps provide relatively weaker responses. The fused maps therefore remain visually similar to the baseline, indicating that relation modeling contributes less when the anomaly is confined to local appearance without altering the underlying component configuration.

4.9.4. Structural and Surface Anomalies on MVTec AD

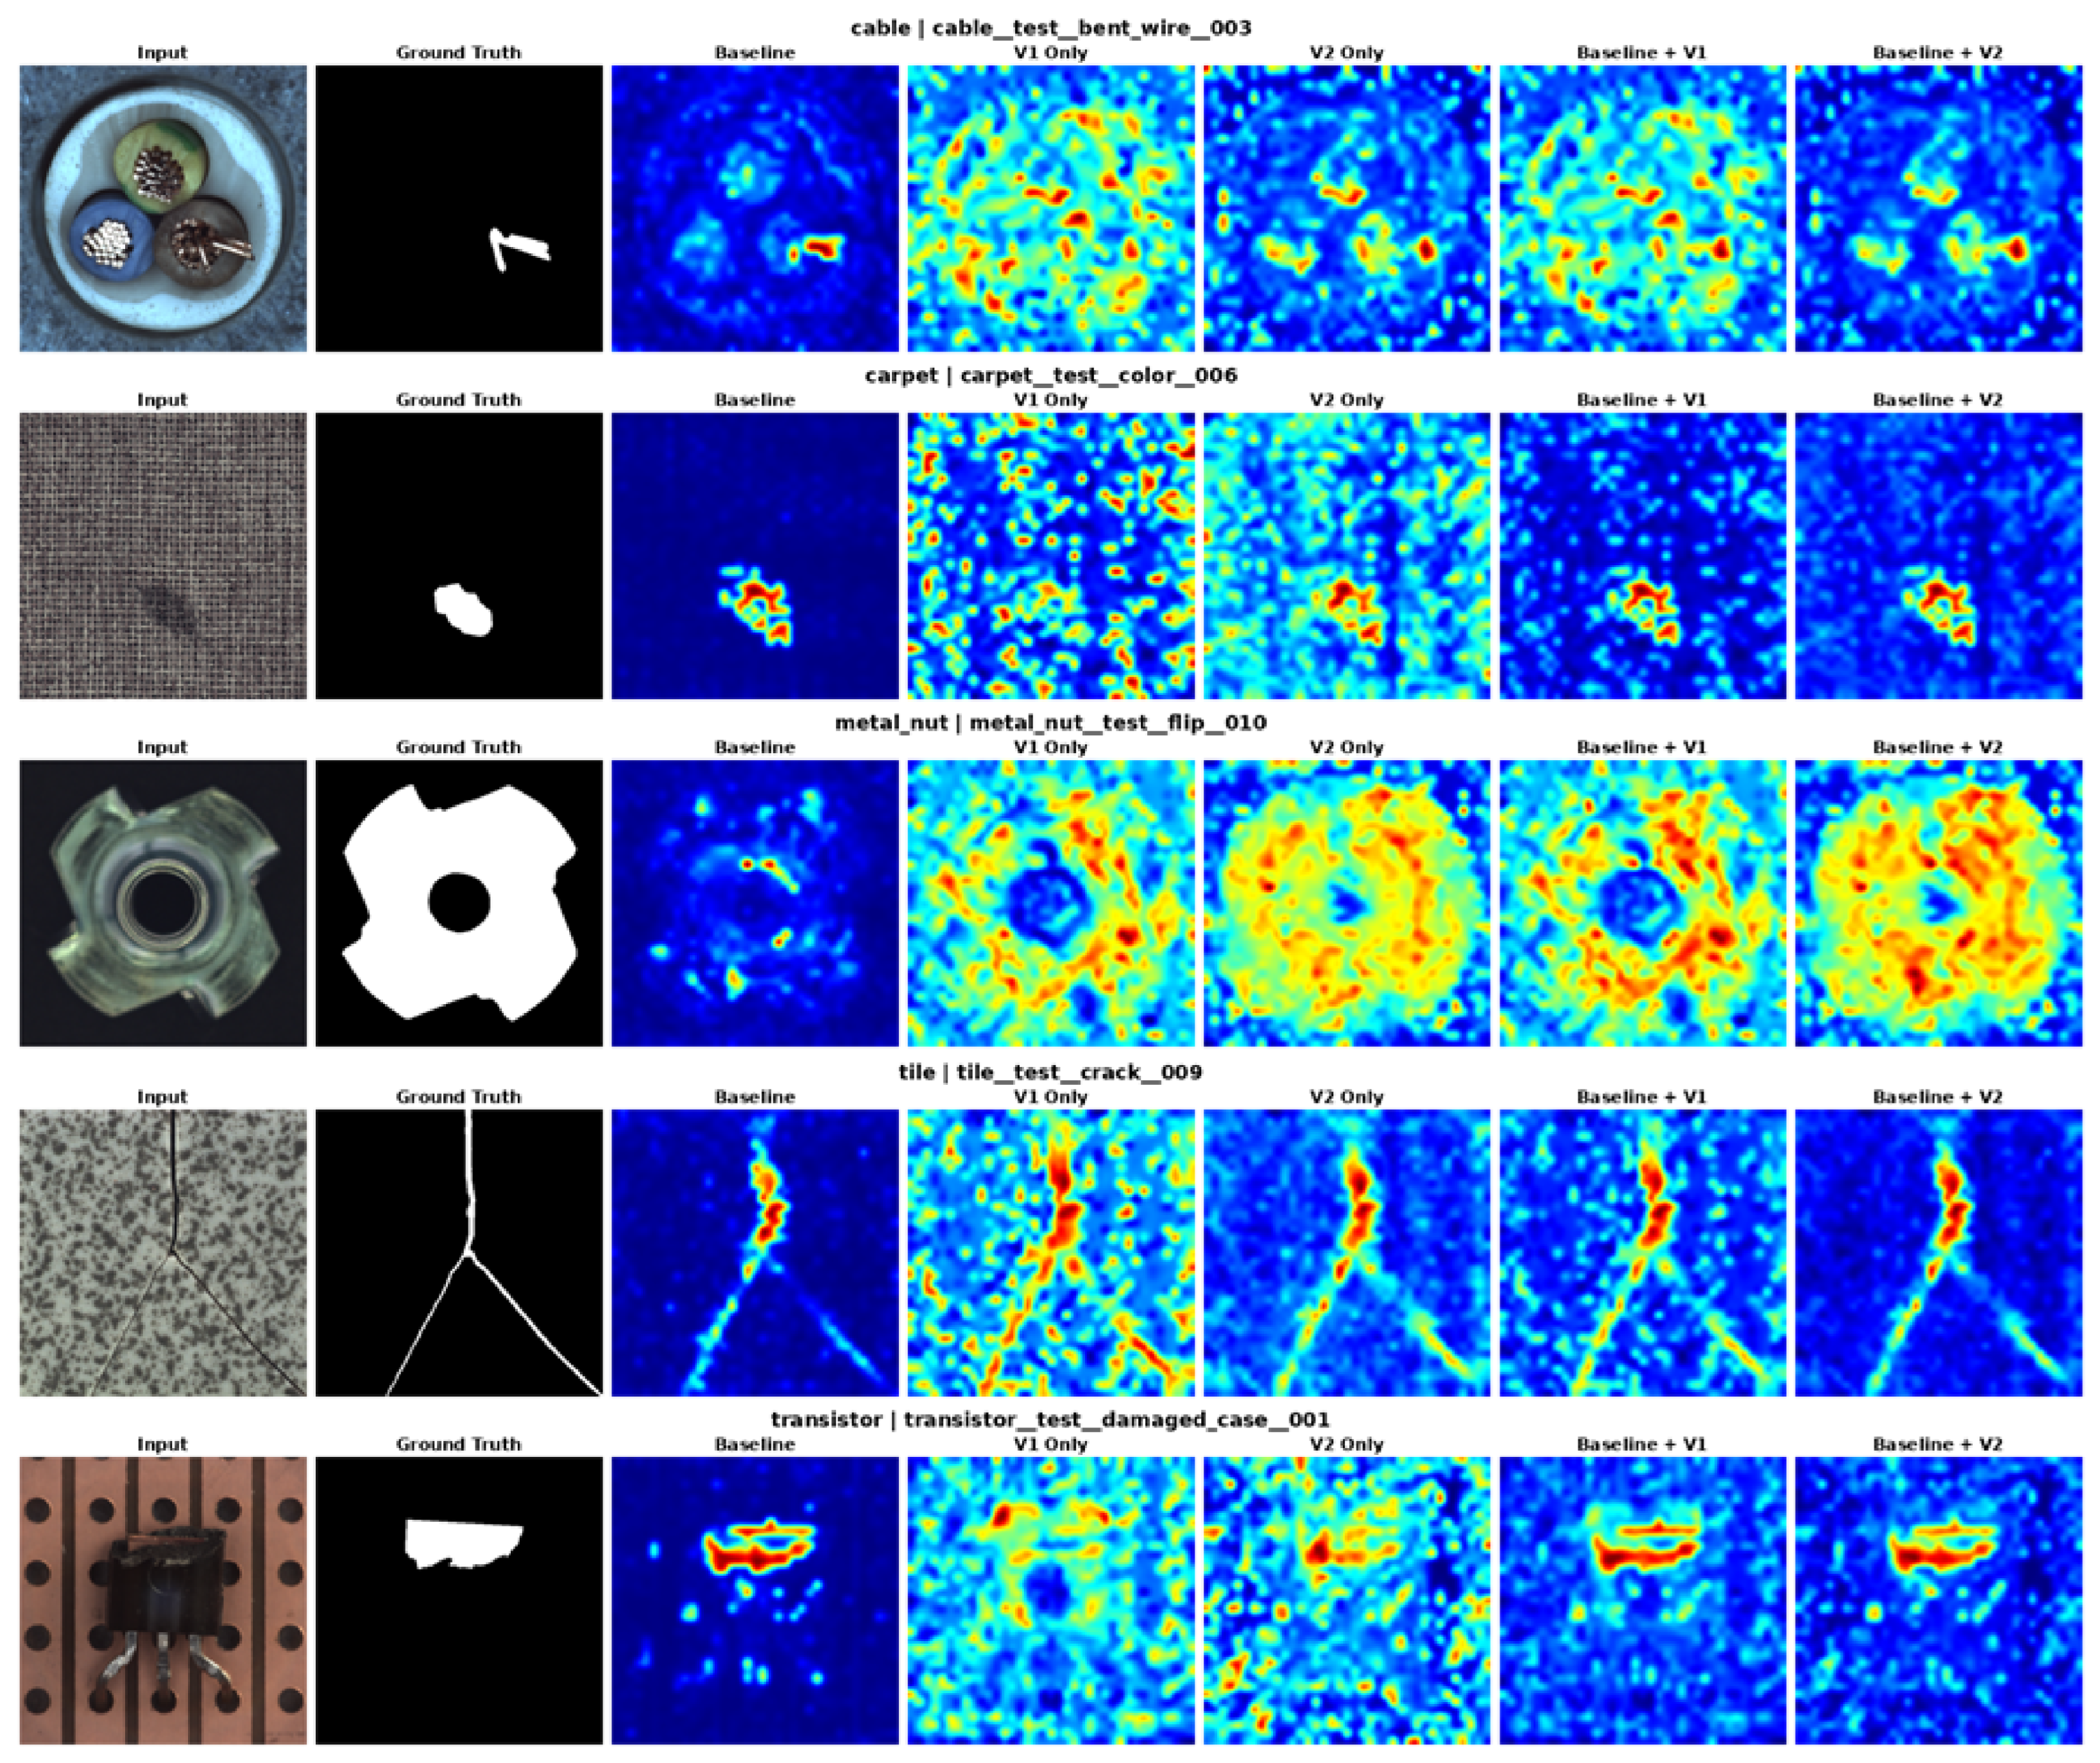
Figure 5 illustrates the behavior of AnomalyCLIP on MVTec AD together with the proposed V1 and V2 variants. Although MVTec AD is primarily used to evaluate surface anomalies, its defect types are not uniformly limited to local texture or material changes. Some samples also involve changes in object orientation, component arrangement, or structural integrity, making semantic–spatial relation cues potentially informative.
Figure 5. Qualitative results on MVTec AD using AnomalyCLIP. Although MVTec AD primarily contains surface anomalies, some defects also disrupt object-level configuration or component relations. The baseline remains effective for compact local defects, whereas V2 provides additional responses to relation-sensitive anomalies such as flipped or displaced components. Therefore, their fusion can improve localization when local appearance and semantic–spatial relation cues are complementary.
Electronics 15 04293 g005
For compact local defects, such as the color anomaly in carpet, the baseline produces a more precise response, whereas both V1 and V2 are relatively diffuse or weak. This behavior is consistent with the lower V2-only AUPRO reported in Table 6, indicating that relation modeling alone is not well suited to fine-grained surface localization. In contrast, V2 provides meaningful responses for relation-sensitive cases. For example, the flipped metal nut violates the expected object orientation, while the transistor sample contains a large component separated from its normal configuration. In these cases, V2 responds to the disrupted object- or component-level relations rather than only to local appearance differences.
The coexistence of compact surface defects and relation-sensitive anomalies explains why fusion can improve several aggregate metrics despite the weaker standalone localization of V2. For purely local defects, the fused map largely follows the baseline response, whereas for samples involving abnormal orientation or component configuration, V2 can contribute complementary evidence. Therefore, the qualitative results support the quantitative improvement of Baseline + V2 in Table 6: relation modeling does not uniformly improve every MVTec AD sample, but it can improve the overall performance by addressing anomaly patterns that are not fully characterized by local appearance cues.

4.9.5. Interpreting the Relation Maps

The qualitative observations across Figure 2, Figure 3, Figure 4 and Figure 5 are consistent with the perturbation analysis in Equation (4). Relation modeling is most effective when an anomaly alters semantic context or the spatial configuration of object components, producing changes in both the propagated feature term, A Δ F , and the attention structure term, Δ A F . Such behavior is evident for logical anomalies in MVTec LOCO AD and CAD-SD, as well as relation-sensitive samples in MVTec AD, where V2 highlights missing, displaced, flipped, or structurally disconnected components. In contrast, compact local defects primarily produce localized feature perturbations with limited changes in attention structure, reducing the contribution of relation modeling.
The visualizations also support the interpretation that the proposed prototypes encode semantic–spatial rather than purely semantic information. In many examples, V2 responds not only to the anomalous component itself but also to its expected location or surrounding semantic context. This behavior is consistent with the use of positional embeddings in attention computation together with the spatially indexed prototype P c , i . It also explains why explicitly appending coordinate information provides little additional benefit, as much of the required layout information is already represented by the attention graph and the position-specific prototypes.
Finally, the qualitative results clarify the complementary roles of local appearance and relation modeling. Relation cues are particularly effective for anomalies involving object configuration or component relationships, whereas the baseline remains more reliable for compact texture and material defects. Consequently, the proposed fusion improves robustness not because either cue is universally superior, but because the two cues respond to different types of anomalous evidence.

5. Discussion

5.1. What the Relation Prototype Represents

The proposed prototype does not encode an explicit symbolic rule, such as “exactly one component must be present” or “part A must be connected to part B.” Instead, it represents the expected attention-aggregated feature at each patch position under normal configurations. Therefore, it models the first-order statistics of semantic–spatially conditioned patch features rather than discrete logical constraints.
Semantic information is introduced through detector-specific patch features and content-dependent attention, while spatial information is retained through transformer positional embeddings and the position-indexed prototype P c , i . This representation can capture distributed dependencies involving component identity, expected location, orientation, and surrounding context without requiring component annotations or manually defined rules.
The same property also limits interpretability. The proposed method detects deviations from normal semantic–spatial relations, but it does not explicitly determine whether the underlying violation is caused by absence, duplication, incorrect count, displacement, or an invalid connection. Therefore, methods based on explicit component parsing or visual question answering may remain preferable when exact rule verification or human-readable explanations are required [25,28,29].

5.2. Why Image-Level and Pixel-Level Metrics Can Differ

Image-level and pixel-level metrics evaluate different properties of the anomaly response. Image AUROC measures whether normal and anomalous images can be separated, whereas pixel AUROC, AP, and AUPRO depend on how accurately the response overlaps the anomalous region.
This distinction is particularly evident for V1. Changes in attention connectivity may produce a detectable image-level signal even when the corresponding heatmap is spatially diffuse. As a result, V1 can improve image-level separation without providing comparably accurate localization. V2 produces substantially stronger localization than V1 by evaluating feature deviations against spatially indexed normal prototypes, with attention aggregation providing additional contextualization beyond the raw feature representation, but its performance still depends on the spatial extent and type of anomaly.
Relation-only scoring is particularly effective for anomalies involving missing, displaced, duplicated, flipped, or disconnected components, whereas compact local defects may remain better localized by the baseline. Fusion can improve pixel-level performance when the two maps contain complementary evidence, but its benefit need not be uniform across datasets, backbones, or anomaly types. These observations motivate evaluating both image- and pixel-level performance and interpreting relation modeling as a complementary source of anomaly evidence rather than a replacement for local appearance cues.

5.3. Relation to Attention-Based Prior Work

SA-PatchCore also leverages self-attention to improve the detection of co-occurrence anomalies [24], but it differs from our method in both the role assigned to attention and the representation on which anomaly scoring is performed. In SA-PatchCore, self-attention is incorporated into a PatchCore-style feature and memory-bank framework to enhance or contextualize patch representations before conventional feature-space matching. Therefore, attention serves primarily as a feature augmentation mechanism, while anomaly detection remains based on distances between the resulting patch features and stored normal features.
Instead, our method treats attention as a semantic–spatial message-passing operator. Given detector-specific CLIP patch features F and an attention matrix A, V2 forms the propagated representation M = A F , where each patch receives semantic feature content from other patches according to their learned semantic and positional affinities. Rather than refining appearance features, we explicitly model the distribution of these propagated relation messages under normal conditions and define anomaly scores as deviations from category-wise normal prototypes in this relation space. Consequently, the anomaly representation is fundamentally different from that of SA-PatchCore: the anomaly score is computed from relation-message deviations, not from contextualized appearance features. Although both methods employ self-attention to incorporate contextual information beyond local appearance, SA-PatchCore uses attention to improve feature representations for conventional memory matching, whereas our method uses attention to construct an explicit semantic–spatial relation representation for training-free relation re-scoring in CLIP-based anomaly detectors.

5.4. Limitations and Future Directions

The proposed method relies on spatially indexed relation prototypes, assuming that corresponding semantic components appear at approximately consistent patch locations across normal and test images. This assumption is generally reasonable for controlled industrial inspection, where the camera setup and object placement are constrained. However, translation, scale changes, rotation, viewpoint variation, or object misalignment that moves normal semantic components across patch locations can produce relation deviations even in the absence of a true anomaly, potentially increasing false-positive responses. The current method does not explicitly compensate for such geometric variation. Extending the framework with object-centric alignment, position-tolerant matching, or pose-invariant relation representations would improve its applicability to less constrained environments.
Another limitation is that each spatial relation prototype is represented by a single mean. Although this formulation is simple and training-free, it may not adequately characterize categories with multiple valid layouts, orientations, or component states. Multiple prototypes, non-parametric relation memories, or probabilistic representations could model multimodal normal configurations while also providing an estimate of relation uncertainty. Such uncertainty could further indicate when the relation response is sufficiently reliable to complement the baseline anomaly map.
The method identifies deviations from normal semantic–spatial configurations but does not infer explicit logical rules. It can localize an abnormal component or region without determining whether the underlying cause is an incorrect count, a missing part, displacement, or an invalid connection. Integrating the dense relation map with component-level recognition or vision–language reasoning could support explicit verification of these anomaly types and provide human-readable explanations without discarding the localization capability of the proposed representation.
The current implementation computes dense interactions between patch tokens, resulting in quadratic complexity with respect to the number of patches. This cost can become substantial at high input resolutions, where small anomalies require finer tokenization. Sparse neighborhood propagation, hierarchical token aggregation, or low-rank approximations could reduce the computational burden while retaining the contextual information needed for relation modeling.
The design parameters were selected from a single benchmark rather than a separate validation split. Although the resulting configuration generalized well to different detectors and datasets without further tuning, future work should investigate validation protocols that completely separate configuration selection from the final evaluation.
Finally, the proposed method relies on a fixed fusion weight selected empirically using the alpha- and beta-weighting frameworks presented in Appendix B. Equal-weight fusion yielded the best overall performance in the AnomalyCLIP-based validation experiments, but a weight selected for a particular backbone and evaluation setting may not generalize optimally across datasets or anomaly types. Therefore, adaptive fusion is an important direction for future work; however, estimating map reliability without anomaly supervision remains a challenging problem in the training-free setting. Moreover, CAD-SD contains only a single object category and does not provide pixel-level annotations, which limits both the statistical characterization of its image-level results and the dense quantitative evaluation of co-occurrence anomalies. Therefore, the reported CAD-SD results should be interpreted as external validation rather than as a comprehensive statistical assessment. Future evaluation on more diverse co-occurrence benchmarks with pixel-level masks and uncertainty estimates would enable a more comprehensive assessment of relation-based localization.

6. Conclusions

We presented a training-free relation prototype re-scoring framework that broadens the sensitivity of existing CLIP-based anomaly detectors to include logical anomalies. The proposed method treats position-aware visual self-attention as a semantic–spatial message-passing operator over detector-specific patch features and measures each patch by its deviation from a category-wise normal relation prototype. Through matched standalone and fusion experiments, we showed that direct attention differences, represented by V1, provide only limited and spatially diffuse anomaly evidence. In contrast, V2 captures deviations in attention-aggregated feature content and therefore provides substantially stronger localization cues for anomalies that disrupt expected component identity, position, orientation, or configuration. The final method combines this relation evidence with the baseline anomaly map using the empirically selected equal-weight fusion.
Experiments with AnomalyCLIP, WinCLIP, and AA-CLIP demonstrate that the proposed relation re-scoring consistently strengthens logical anomaly localization and map-derived image-level detection on MVTec LOCO AD. Results on CAD-SD further confirm its sensitivity to co-occurrence violations, while evaluations on structural and surface anomalies from different benchmarks clarify the complementary roles of local appearance and semantic–spatial relation cues. In particular, the relation map is most effective for configurational abnormalities, whereas the baseline remains important for compact texture and material defects. This anomaly-type dependence is consistent with the intended complementary role of the proposed relation cue: it is designed to supply semantic–spatial evidence that is missing from local anomaly maps, not to replace appearance-based detection for every defect type. Therefore, retaining both maps provides a practical mechanism for adding logical sensitivity while preserving local evidence more effectively than relation-only scoring, although the benefit of fixed fusion remains detector- and category-dependent.
Unlike approaches that require component annotations, explicit object extraction and matching, additional composition-model training, or vision–language rule verification, the proposed framework introduces no learnable parameters and directly exploits relational information already present in CLIP representations. Therefore, it can be incorporated into multiple CLIP-based detectors without changing their architecture, checkpoints, or training procedures. Overall, the results establish attention-guided feature deviation as an effective representation for dense logical anomaly analysis and provide a simple, general plug-in that supplements local appearance modeling with sensitivity to semantic–spatial configuration.


Funding

This research received no external funding.

Data Availability Statement

The data presented in this study are openly available in MVTec LOCO AD at https://www.mvtec.com/research-teaching/datasets/mvtec-loco-ad, accessed on 4 August 2026.

Conflicts of Interest

The author declares no conflicts of interest.

Abbreviations

The following abbreviations are used in this manuscript:
VLMvision–language model
DPAMdense prompt attention module
AUROCarea under the receiver operating characteristic curve
AUPROarea under per-region overlap
APaverage precision

Appendix A. Cross-Model Qualitative Analysis

Figure A1 presents qualitative comparisons across WinCLIP, AnomalyCLIP, and AA-CLIP using the same logical anomaly examples from MVTec LOCO AD. Although the three detectors produce different baseline anomaly maps, the proposed relation re-scoring often adds responses in regions where the normal semantic–spatial configuration is violated.
Figure A1. Cross-model qualitative comparison on MVTec LOCO AD logical anomalies. Across WinCLIP, AnomalyCLIP, and AA-CLIP, relation re-scoring adds responses to semantic–spatial inconsistencies, although the magnitude and localization quality of those responses vary by detector. The relative contribution of the relation map reflects differences in the information already encoded in each baseline patch representation.
Electronics 15 04293 g0a1
The relative contribution of the relation map depends on the underlying detector. For WinCLIP, relation re-scoring often introduces logical evidence that is only weakly represented in the baseline map. For AnomalyCLIP, the detector-specific patch representation produces a strong relation response, resulting in highly consistent standalone and fused localization. AA-CLIP starts from a stronger anomaly-aware baseline, but the relation map still provides complementary responses for logical anomalies that are not fully emphasized by local appearance alone.
These examples show that the proposed formulation is detector-agnostic at the integration level: the same relation-prototype procedure can be applied without modifying the backbone or retraining the detector. Rather than replacing the baseline anomaly map, relation re-scoring provides an additional semantic–spatial cue whose contribution naturally varies according to the information already captured by the underlying detector.

Appendix B. Detailed Design and Fusion Ablations

This section provides the detailed ablation results underlying the design choices summarized in Section 4.8. These experiments were conducted once on the AnomalyCLIP logical split to determine a single fixed configuration that was subsequently used unchanged in all remaining experiments. The experiments examine three questions: whether the improvement arises from spatially indexed feature prototypes alone or benefits from attention-based feature propagation, and whether explicit positional cues provide additional information; which attention and feature representations are most effective for V2; and how the baseline and relation maps should be combined. Because the full feature–position sweep contains many configurations with only marginal differences, Table A1 reports the best result for each relation weight within each cue family, selected over the tested layer counts and, for the combined cue, over the position weights. Table A2 and Table A3 report the complete configurations used to determine the final attention source, feature layer, and fusion rule.
Table A1. Ablation of raw-feature, attention-propagated feature-relation, and explicit positional cues on the MVTec LOCO AD logical split. Each entry reports the best result for the corresponding relation weight α , selected over the tested layer counts. For V2 + explicit position, the result is additionally selected over position weights { 0.1 , 0.5 , 1.0 , 2.0 } . All configurations use the preliminary fusion form S base + α S rel . The best results are marked in bold.
Cue α = 0.005 α = 0.01 α = 0.03 α = 0.05
AUROCAUPROAUROCAUPROAUROCAUPROAUROCAUPRO
Position-only54.129.254.429.455.129.955.731.2
Raw-feature prototype55.429.256.830.460.834.663.238.2
Attention-propagated feature relation (V2)55.430.056.930.761.335.463.939.0
V2 + explicit position55.330.156.731.361.235.763.938.7
Table A1 shows that spatially indexed raw-feature prototypes already account for a substantial portion of the improvement over the baseline. Across the tested relation weights, the raw-feature prototype consistently outperforms position-only scoring, reaching 63.2 pixel AUROC and 38.2 AUPRO at α = 0.05 , compared with 55.7/31.2 for position-only scoring. Propagating the same feature content through the attention graph provides a further improvement across the tested weights, reaching 63.9/39.0 at α = 0.05 . This comparison indicates that the benefit of V2 cannot be attributed solely to attention propagation; position-indexed normal feature statistics themselves provide a strong anomaly cue, while attention-based contextual propagation further improves the representation. Adding an explicit positional term to V2 yields small AUPRO gains at several low or intermediate relation weights, but it does not improve the best overall result and is slightly inferior in AUPRO at α = 0.05 . Position-only scoring also remains close to the baseline throughout the tested range, indicating that coordinate deviation alone provides limited evidence for logical anomalies. Together, these results support the attention-propagated feature relation as the relation content used in the subsequent analyses, while showing that an additional coordinate-based score is unnecessary. Spatial information is already retained through transformer positional embeddings and the position-indexed prototype.
Table A2. Ablation of attention source, attention-layer count, and propagated feature layer for V2-only scoring on the MVTec LOCO AD logical split. “v-v” denotes DPAM value–value attention, whereas “q-k” denotes the original query–key attention. Feature layer 1 is the final layer and 2 is the preceding layer. The best results are marked in bold.
Attention/Layers/FeaturePixel AUROCPixel AUPRO
v-v/1/ 1 69.945.7
v-v/3/ 1 70.047.1
v-v/5/ 1 70.646.7
v-v/5/ 2 69.643.1
q-k/5/ 1 74.251.7
The v-v results show that V2 is not highly sensitive to the exact number of final attention layers, with one-, three-, and five-layer aggregation producing comparable performance. In contrast, replacing the final-layer patch feature with the preceding-layer feature reduces both AUROC and AUPRO, indicating that the final anomaly-aware representation is better aligned with the category-wise relation prototype. The largest improvement is obtained by replacing DPAM v-v attention with the original q-k attention while retaining the final-layer feature. This result supports the final design in which q-k attention defines the semantic–spatial propagation structure and detector-specific patch features provide the propagated content.
Table A3. Fusion-weight analysis on the MVTec LOCO AD logical split. The upper block evaluates the relation map as a weighted correction to the baseline, S base + α S rel . The lower block assigns unit weight to the selected V2 relation map and varies the baseline contribution, β S base + S rel . This two-stage analysis is used to determine the equal-weight fusion adopted in the final method. The best results are marked in bold.
ParameterizationWeightPixel AUROCPixel AUPRO
S base + α S rel α = 0.005 55.729.8
α = 0.01 57.430.8
α = 0.03 63.235.2
α = 0.05 66.837.4
α = 0.10 71.044.7
β S base + S rel β = 0 (V2 only)74.251.7
β = 0.1 74.352.0
β = 0.3 74.351.9
β = 0.5 74.452.2
β = 0.7 74.452.5
β = 1.0 74.452.7
Table A3 shows that V2 should not be introduced merely as a weak residual correction. Under the S base + α S rel parameterization, performance continues to improve as the relation contribution increases, indicating that the relation map provides a major source of anomaly evidence rather than a small refinement to the baseline. The second parameterization therefore fixes the relation map at unit weight and varies the baseline contribution. Relative to V2 only, adding the baseline consistently improves AUPRO, while AUROC changes by at most 0.2 points over β [ 0.1 , 1.0 ] . The best result is obtained at β = 1.0 , corresponding to equal-weight fusion. This empirical stability motivates the fixed equal-weight formulation used in the main experiments.

Appendix B.1. Sensitivity to the Number of Normal Reference Images

The proposed relation prototype is constructed from normal reference images of each target category. To examine its dependence on the amount of target-domain normal data, we vary the number of normal reference images per category on the MVTec LOCO AD logical split using AnomalyCLIP and the final Baseline+V2 configuration. We evaluate 5, 10, 25, 50, 100, and 200 randomly sampled normal images per category, as well as all available normal training images (335–372 images per category). For each limited-reference setting, we report the mean and standard deviation over three random reference subsets; the All setting uses all available normal images and is therefore deterministic.
Table A4. Sensitivity to the number of normal reference images per category on the MVTec LOCO AD logical split. Limited-reference results are reported as mean ± standard deviation over three random reference subsets. All denotes the use of all available normal training images for each category.
References/CategoryPixel AUROCAUPROImage AUROCImage AP
571.62 ± 0.4248.18 ± 0.9167.45 ± 1.4369.42 ± 0.99
1072.79 ± 0.5650.06 ± 0.6471.35 ± 0.5773.31 ± 0.93
2573.57 ± 0.4251.47 ± 0.5571.18 ± 1.0073.42 ± 1.24
5073.94 ± 0.2352.05 ± 0.4571.79 ± 0.1473.91 ± 0.37
10074.22 ± 0.1852.38 ± 0.0871.77 ± 0.0873.87 ± 0.16
20074.36 ± 0.0252.80 ± 0.1771.82 ± 0.2374.06 ± 0.21
All74.4052.6871.7274.00
As the number of normal references increases, localization performance improves progressively and approaches saturation. Pixel AUROC increases from 71.62 with five references to 73.94 with 50 references and 74.40 when all normal images are used, while AUPRO increases from 48.18 to 52.05 and 52.68, respectively. Image-level performance converges even earlier: using only 10 references already yields 71.35 AUROC and 73.31 AP, compared with 71.72 and 74.00 when all references are used. From 50 references onward, both image-level performance and the variation across random reference subsets remain highly stable. These results indicate that the proposed relation prototype benefits from additional normal references but does not require the complete normal training set to achieve performance close to the full-reference configuration.
For completeness, the numbers of normal reference images for the 15 MVTec AD categories are: bottle (209), cable (224), capsule (219), carpet (280), grid (264), hazelnut (391), leather (245), metal nut (220), pill (267), screw (320), tile (230), toothbrush (60), transistor (213), wood (247), and zipper (240).

Appendix B.2. Image-Level Scoring Protocol

The main experiments use a unified Top-5% map-derived image score for both the baseline and the proposed variants because the original CLIP-based detectors employ different detector-specific image-level scoring mechanisms, while the proposed relation module modifies dense anomaly maps rather than those detector-specific scoring functions. To examine whether this unified aggregation substantially distorts the image-level behavior of the baseline, we additionally report the original AnomalyCLIP image score on the MVTec LOCO AD logical split in Table A5.
The official AnomalyCLIP image score yields higher baseline performance than the unified Top-5% map-derived score, improving image AUROC/AP from 50.5/54.0 to 57.3/60.0. Nevertheless, Baseline+V2 reaches 71.7/74.0 under the unified protocol, remaining substantially above the original baseline reference. Although these two results are not directly comparable because they use different scoring functions, the additional comparison indicates that the observed image-level improvement cannot be explained solely by the choice of the Top-5% aggregation.
Table A5. Comparison of image-level scoring protocols on the MVTec LOCO AD logical split using AnomalyCLIP. The official AnomalyCLIP score is reported for the original baseline as a reference, whereas the common Top-5% map-derived score is used for the controlled baseline–proposed comparison throughout the paper.
MethodImage ScoringImage AUROCImage AP
BaselineOfficial AnomalyCLIP57.360.0
BaselineTop-5% map score50.554.0
Baseline + V2Top-5% map score71.774.0

Appendix C. Category-Specific Behavior on MVTec LOCO AD

This appendix presents the category-wise pixel AUROC, pixel AUPRO, image AUROC, and image AP for AnomalyCLIP, WinCLIP, and AA-CLIP on both the logical and structural splits of MVTec LOCO AD. The following analysis focuses on categories that exhibit distinctive localization, detection, or fusion behavior.

Appendix C.1. AnomalyCLIP

Table A6 and Table A7 reveal several category-specific effects beyond the overall logical-split improvement. The largest localization gains occur for breakfast box, where Baseline + V2 raises AUPRO from 12.8 to 60.5, and for pushpins, where AUPRO increases from 33.5 to 55.9. These categories contain spatially distributed logical violations, and the V2 response covers the relevant configuration more completely than the baseline map. Juice bottle also shows a consistent improvement in both pixel and image metrics.
A different pattern appears for screw bag. Baseline + V2 changes pixel AUROC only marginally, from 61.8 to 61.5, but increases AUPRO from 39.4 to 55.6. This suggests that V2 improves the spatial extent of the detected region without substantially changing the overall ranking of anomalous and normal pixels. At the image level, however, neither V2 only nor fusion improves clearly over the baseline for this category, indicating that better localization does not necessarily translate into stronger image-level separation.
The image results for breakfast box are particularly distinctive: V2 only reaches 98.5 AUROC and 98.6 AP, substantially exceeding the baseline. In contrast, pushpins remains difficult at the image level despite strong pixel improvements, suggesting that its anomalous regions can be localized without producing a comparably strong global score. Across all categories, V1 remains substantially weaker than V2 for localization, showing that direct attention variation is insufficient to explain the category-wise gains.
Table A6. Category-wise pixel-level results for AnomalyCLIP on the MVTec LOCO AD logical split. Each entry reports pixel AUROC/AUPRO.
CategoryBaselineV1 OnlyBaseline + V1V2 OnlyBaseline + V2 (Proposed)
breakfast_box51.5/12.856.7/7.151.2/12.285.9/59.286.1/60.5
juice_bottle66.6/39.651.7/20.961.6/27.382.4/58.982.9/60.1
pushpins38.1/33.552.5/14.444.3/28.677.6/54.776.6/55.9
screw_bag61.8/39.445.9/7.755.7/39.060.5/54.861.5/55.6
splicing_connectors51.3/18.348.4/5.149.4/14.564.7/30.764.9/31.3
Mean53.9/28.751.0/11.052.4/24.374.2/51.774.4/52.7
Table A7. Category-wise image-level results for AnomalyCLIP on the MVTec LOCO AD logical split. Each entry reports image AUROC/AP.
CategoryBaselineV1 OnlyBaseline + V1V2 OnlyBaseline + V2 (Proposed)
breakfast_box40.9/46.870.7/67.664.9/59.198.5/98.696.7/96.6
juice_bottle55.3/68.957.0/68.459.1/70.283.2/90.784.3/90.9
pushpins46.6/38.953.8/44.249.0/39.455.0/54.555.7/54.0
screw_bag54.2/55.958.5/61.759.0/58.648.9/55.652.1/55.4
splicing_connectors55.6/59.657.9/62.466.2/69.070.2/73.769.9/73.0
Mean50.5/54.059.6/60.959.6/59.271.1/74.671.7/74.0
Table A8 and Table A9 show that the effect of relation re-scoring is more category-dependent for structural anomalies. Baseline + V2 improves pixel AUROC in most categories, with especially large gains for breakfast box and splicing connectors. However, AUROC and AUPRO do not always move together. For breakfast box, fusion raises AUROC from 55.2 to 78.6 but lowers AUPRO from 49.2 to 45.1, implying improved pixel ranking but less accurate region coverage.
The categories with strong baseline localization, such as juice bottle, pushpins, and screw bag, benefit mainly from retaining the local anomaly map in the fusion. V2 only is considerably weaker in AUPRO for these categories, whereas fusion restores part of the lost region coverage and, for some categories, slightly exceeds the baseline. At the image level, Baseline + V2 improves all five category AUROCs and produces the largest gain for breakfast box. This indicates that relation evidence can strengthen category-level detection even when its standalone pixel map is spatially diffuse.
Table A8. Category-wise pixel-level results for AnomalyCLIP on the MVTec LOCO AD structural split. Each entry reports pixel AUROC/AUPRO.
CategoryBaselineV1 OnlyBaseline + V1V2 OnlyBaseline + V2 (Proposed)
breakfast_box55.2/49.257.8/5.553.8/45.976.9/27.478.6/45.1
juice_bottle86.4/77.150.1/18.177.9/63.276.6/44.980.0/59.3
pushpins85.2/59.570.7/27.083.4/56.782.4/54.286.5/63.7
screw_bag87.4/62.559.9/5.384.9/58.881.0/48.888.0/63.7
splicing_connectors59.8/40.258.5/8.158.6/36.571.4/33.272.7/41.5
Mean74.8/57.759.4/12.871.7/52.277.7/41.781.1/54.7
Table A9. Category-wise image-level results for AnomalyCLIP on the MVTec LOCO AD structural split. Each entry reports image AUROC/AP.
CategoryBaselineV1 OnlyBaseline + V1V2 OnlyBaseline + V2 (Proposed)
breakfast_box55.4/62.949.9/47.959.2/62.468.8/72.372.4/77.3
juice_bottle74.9/81.049.3/51.074.1/80.662.7/62.476.4/81.6
pushpins74.3/68.741.7/31.868.2/60.670.7/60.278.4/73.2
screw_bag69.6/67.949.3/41.265.8/64.460.6/55.871.0/69.1
splicing_connectors65.1/60.044.4/40.859.6/56.858.8/50.366.0/62.7
Mean67.9/68.146.9/42.565.4/65.064.3/60.272.8/72.8

Appendix C.2. WinCLIP

Table A10 and Table A11 show that WinCLIP exhibits pronounced category variation between V2-only and fused scoring. For breakfast box, V2 only is substantially stronger than fusion at both pixel and image levels, reaching 86.4/64.0 for pixel AUROC/AUPRO and 90.2/91.4 for image AUROC/AP. This result suggests that equal fusion with the relatively weak baseline dilutes part of the stronger standalone relation response.
In contrast, juice bottle benefits clearly from fusion: Baseline + V2 reaches 85.2/59.0 at the pixel level, exceeding both the baseline and V2 only. This category therefore contains useful evidence in both the local and relation maps. Splicing connectors shows a related but distinct pattern. V2 only provides the highest pixel AUROC, while fusion gives the highest AUPRO, suggesting that the relation map improves anomaly ranking and the baseline helps refine region overlap.
Pushpins remains the most difficult category. Although V2 improves pixel localization over the baseline, its image AUROC is lower than the baseline, indicating that localized relation responses do not aggregate reliably into an image-level score. These category differences explain why WinCLIP V2 only and Baseline + V2 obtain similar aggregate image performance despite noticeably different spatial behavior.
Table A10. Category-wise pixel-level results for WinCLIP on the MVTec LOCO AD logical split. Each entry reports pixel AUROC/AUPRO.
CategoryBaselineV1 OnlyBaseline + V1V2 OnlyBaseline + V2 (Proposed)
breakfast_box56.5/17.260.7/25.545.4/12.886.4/64.072.0/40.6
juice_bottle79.6/45.765.5/43.080.4/50.672.5/40.885.2/59.0
pushpins23.1/20.346.1/14.743.2/16.563.0/28.750.4/26.0
screw_bag56.9/13.747.9/20.351.1/12.360.9/38.457.3/21.8
splicing_connectors39.9/38.760.3/17.757.2/43.668.0/36.064.1/49.1
Mean51.2/27.156.1/24.355.5/27.270.1/41.665.8/39.3
Table A11. Category-wise image-level results for WinCLIP on the MVTec LOCO AD logical split. Each entry reports image AUROC/AP.
CategoryBaselineV1 OnlyBaseline + V1V2 OnlyBaseline + V2 (Proposed)
breakfast_box62.7/68.358.3/58.658.1/64.990.2/91.486.0/87.6
juice_bottle53.1/69.672.0/78.364.4/75.876.2/85.576.5/86.6
pushpins59.6/51.155.1/42.158.9/48.947.8/43.956.5/48.9
screw_bag54.0/59.365.2/65.764.2/65.863.7/62.061.0/64.1
splicing_connectors48.2/48.060.0/55.355.7/52.869.1/71.666.8/66.4
Mean55.5/59.362.1/60.060.2/61.669.4/70.969.4/70.7
Table A12 and Table A13 show that the effect of relation fusion varies considerably across structural categories. The largest improvement occurs for juice bottle, where V2 only performs substantially worse than the baseline, yet fusion increases AUPRO from 61.9 to 72.8. This indicates that the relation response provides complementary evidence that becomes effective only when combined with the local anomaly map.
A different behavior is observed for screw bag. Here, V2 only already achieves the strongest standalone localization (82.6/51.4), whereas equal-weight fusion decreases both AUROC and AUPRO. This category illustrates that the empirically selected fixed fusion weight is not universally optimal and that the relative contribution of baseline and relation cues remains category dependent.
In contrast, splicing connectors shows almost unchanged AUROC but a substantial AUPRO improvement from 54.7 to 63.7 after fusion, suggesting that relation information mainly improves region coverage while preserving the baseline ranking performance.
Table A12. Category-wise pixel-level results for WinCLIP on the MVTec LOCO AD structural split. Each entry reports pixel AUROC/AUPRO.
CategoryBaselineV1 OnlyBaseline + V1V2 OnlyBaseline + V2 (Proposed)
breakfast_box73.4/28.278.5/36.670.1/33.883.6/47.181.2/49.3
juice_bottle89.4/61.952.2/47.183.8/70.054.7/39.786.2/72.8
pushpins70.0/36.074.9/30.271.9/36.975.0/35.078.0/43.7
screw_bag64.7/31.172.5/33.257.9/27.782.6/51.470.2/44.9
splicing_connectors88.9/54.776.5/32.587.3/55.979.6/49.288.2/63.7
Mean77.3/42.470.9/35.974.2/44.875.1/44.580.8/54.9
Table A13. Category-wise image-level results for WinCLIP on the MVTec LOCO AD structural split. Each entry reports image AUROC/AP.
CategoryBaselineV1 OnlyBaseline + V1V2 OnlyBaseline + V2 (Proposed)
breakfast_box51.9/55.249.4/50.749.3/53.672.4/75.165.5/70.5
juice_bottle63.2/65.759.7/60.165.9/66.558.4/55.663.5/63.9
pushpins59.4/48.851.0/36.856.1/45.156.7/38.259.4/46.2
screw_bag72.9/66.959.7/45.972.1/58.680.3/70.284.3/79.1
splicing_connectors64.4/55.556.5/50.563.0/59.456.9/49.664.6/58.8
Mean62.4/58.455.3/48.861.3/56.764.9/57.767.5/63.7

Appendix C.3. AA-CLIP

Table A14 and Table A15 show that AA-CLIP retains stronger category-specific baseline localization than the other detectors, but relation evidence remains useful in selected cases. For juice bottle, Baseline + V2 improves both pixel AUROC and AUPRO, reaching 80.1/52.7. For screw bag, fusion lowers pixel AUROC relative to the baseline but raises AUPRO from 48.1 to 53.2, indicating improved coverage of the annotated region.
Splicing connectors exhibits an unusual metric pattern. The baseline already achieves a very high AUPRO of 68.6 despite a moderate AUROC of 58.6. Baseline + V1 further increases AUPRO to 71.9 while reducing AUROC, whereas V2 only performs poorly in AUPRO. This suggests that the anomaly response is concentrated in the correct region but does not rank all anomalous pixels consistently above the background. The category therefore favors retention of the baseline spatial structure rather than standalone V2 scoring.
At the image level, V2 only produces very strong results for breakfast box and juice bottle, but equal fusion reduces both scores. The opposite occurs for pushpins and screw bag, where fusion partially recovers the weaker standalone relation score. Consequently, the category-wise results illustrate why the AA-CLIP logical result benefits from relation information overall but does not admit a uniformly optimal balance between standalone and fused scoring.
Table A16 and Table A17 confirm that AA-CLIP already provides highly competitive structural localization across all categories. Baseline + V2 slightly improves pixel AUROC for breakfast box and screw bag, but generally does not improve AUPRO. The strongest baseline categories, screw bag and splicing connectors, already reach AUPRO values above 84, leaving little room for relation re-scoring.
Pushpins is the only structural category for which fusion slightly improves AUPRO over the baseline, from 69.5 to 70.0, while preserving a similarly high AUROC. In contrast, splicing connectors shows the largest degradation under Baseline + V2, with AUPRO decreasing from 85.9 to 78.8. This suggests that the relation response can broaden or redistribute an already precise baseline map in a way that reduces overlap quality.
Table A14. Category-wise pixel-level results for AA-CLIP on the MVTec LOCO AD logical split. Each entry reports pixel AUROC/AUPRO.
CategoryBaselineV1 OnlyBaseline + V1V2 OnlyBaseline + V2 (Proposed)
breakfast_box59.2/24.752.6/5.157.4/25.170.6/33.666.9/32.1
juice_bottle79.7/46.654.5/18.678.4/46.473.0/45.880.1/52.7
pushpins51.8/40.952.4/14.846.4/40.756.9/25.353.2/38.8
screw_bag65.4/48.148.4/15.063.8/47.151.9/41.260.3/53.2
splicing_connectors58.6/68.649.1/4.250.3/71.956.5/17.257.4/65.1
Mean62.9/45.851.4/11.559.3/46.261.8/32.663.6/48.4
Table A15. Category-wise image-level results for AA-CLIP on the MVTec LOCO AD logical split. Each entry reports image AUROC/AP.
CategoryBaselineV1 OnlyBaseline + V1V2 OnlyBaseline + V2 (Proposed)
breakfast_box48.0/58.065.0/61.654.4/61.187.9/88.874.1/77.1
juice_bottle45.6/59.859.1/70.952.7/65.979.2/87.866.4/77.5
pushpins53.5/46.654.3/48.455.3/47.545.8/41.551.7/49.2
screw_bag58.7/59.850.2/52.456.4/58.550.8/56.257.5/60.7
splicing_connectors48.6/53.957.2/60.857.3/52.268.3/69.265.6/63.7
Mean50.9/55.657.2/58.855.2/57.166.4/68.763.1/65.7
The image-level results show a similar pattern. Baseline + V2 remains close to the baseline for pushpins and screw bag, but decreases performance for breakfast box, juice bottle, and particularly splicing connectors. These category results indicate that the baseline is already strong and relation scoring provides only limited additional evidence for these predominantly local defects.
Table A16. Category-wise pixel-level results for AA-CLIP on the MVTec LOCO AD structural split. Each entry reports pixel AUROC/AUPRO.
CategoryBaselineV1 OnlyBaseline + V1V2 OnlyBaseline + V2 (Proposed)
breakfast_box81.0/68.955.8/5.580.3/54.569.8/22.884.4/68.0
juice_bottle89.0/74.253.2/18.387.8/66.668.3/37.886.4/70.5
pushpins91.3/69.566.3/15.089.3/65.575.4/43.690.3/70.0
screw_bag91.5/84.163.1/13.888.0/71.579.0/43.892.4/81.4
splicing_connectors95.7/85.957.8/10.195.1/86.356.5/25.792.6/78.8
Mean89.7/76.559.2/12.588.1/68.969.8/34.789.2/73.7
Table A17. Category-wise image-level results for AA-CLIP on the MVTec LOCO AD structural split. Each entry reports image AUROC/AP.
CategoryBaselineV1 OnlyBaseline + V1V2 OnlyBaseline + V2 (Proposed)
breakfast_box53.3/57.044.6/45.835.4/40.349.0/46.452.9/51.4
juice_bottle70.0/77.452.5/55.468.6/71.349.6/52.466.3/72.5
pushpins69.5/63.143.4/32.748.2/38.759.3/50.668.9/64.9
screw_bag67.7/62.958.1/50.258.7/48.655.8/47.768.0/61.1
splicing_connectors69.0/65.546.1/40.756.7/48.352.1/43.364.1/54.2
Mean65.9/65.248.9/45.053.5/49.453.2/48.164.0/60.8

Appendix D. Complete Variant Results on CAD-SD

Table A18 complements the main text by reporting the complete V1 variants in addition to the baseline and V2 results. For AnomalyCLIP and WinCLIP, V1 improves over the baseline on the logical subset but remains substantially weaker than V2, indicating that direct attention-connectivity changes capture only part of the relevant relational structure.
AA-CLIP shows a notable exception: V1 only reaches 93.4 AUROC and 88.2 AP on the logical subset, clearly outperforming both its baseline and V2-only result. CAD-SD logical anomalies are defined by over-coupled or missing components within a rigid and repetitive screw-assembly layout. Such changes directly alter the expected connectivity among repeated parts, which can make attention-difference scoring particularly discriminative. However, both V1 and V2 deteriorate markedly when fused with the AA-CLIP baseline. The shared degradation of both fused variants is consistent with the weak transferred baseline diluting the stronger standalone relation responses under equal-weight fusion. On the surface subset, V1 only is consistently weaker than the baseline, further indicating that direct attention-connectivity changes are better suited to relation-centric configuration errors than to local appearance defects.
Table A18. Complete CAD-SD variant comparison. Results include the baseline, standalone V1 and V2 relation maps, and their equal-weight fusion with the baseline. Logical denotes the Over-coupling and Lacking subsets, while Surface denotes Scratch and Paint.
CLIP DetectorSubsetVariantImage AUROCImage AP
AnomalyCLIPLogicalBaseline50.027.8
V1 only68.367.1
Baseline + V173.568.2
V2 only96.091.5
Baseline + V2 (Proposed)92.080.8
SurfaceBaseline99.197.8
V1 only66.743.8
Baseline + V199.298.3
V2 only100.0100.0
Baseline + V2 (Proposed)100.0100.0
WinCLIPLogicalBaseline36.522.1
V1 only53.530.3
Baseline + V144.025.1
V2 only98.797.4
Baseline + V2 (Proposed)93.888.6
SurfaceBaseline76.662.6
V1 only51.028.4
Baseline + V170.249.5
V2 only54.831.8
Baseline + V2 (Proposed)74.357.5
AA-CLIPLogicalBaseline18.518.1
V1 only93.488.2
Baseline + V168.551.5
V2 only68.154.8
Baseline + V2 (Proposed)31.720.7
SurfaceBaseline91.186.7
V1 only60.735.2
Baseline + V188.079.8
V2 only72.642.8
Baseline + V2 (Proposed)93.990.9

Appendix E. Complete Variant and Category-Wise Results on MVTec AD

Table A19 complements the main text by including the V1 variants. Across all three detectors, V1 only performs substantially worse than V2 only, indicating that attention-difference statistics alone do not transfer well to surface-defect localization. Baseline + V1 generally recovers much of the baseline performance but rarely provides additional gains, suggesting that V1 contributes limited complementary information for MVTec AD. These observations contrast with the CAD-SD logical results, where V1 can become competitive on specific relation-centric anomalies.
Table A19. Complete MVTec AD variant comparison. Results include the baseline, standalone V1 and V2 relation maps, and their equal-weight fusion with the baseline. The best results are marked in bold.
CLIP DetectorVariantPixel AUROCPixel AUPROImage AUROCImage AP
AnomalyCLIPBaseline88.280.591.696.4
V1 only52.812.138.668.6
Baseline + V185.577.288.695.0
V2 only80.951.484.992.8
Baseline + V2 (Proposed)89.277.595.197.9
WinCLIPBaseline83.058.987.694.2
V1 only78.149.158.478.2
Baseline + V182.964.585.292.8
V2 only88.370.287.894.3
Baseline + V2 (Proposed)90.377.591.896.5
AA-CLIPBaseline91.088.092.096.3
V1 only55.211.439.368.4
Baseline + V190.883.289.495.2
V2 only73.248.078.490.6
Baseline + V2 (Proposed)89.581.694.497.3
Table A20 shows that the effectiveness of relation re-scoring depends strongly on the object category. For AnomalyCLIP, the largest improvements occur on bottle, cable, metal nut, and toothbrush, whereas several texture-dominated categories, including carpet, grid, and tile, experience reduced localization performance. AA-CLIP exhibits a similar trend, with gains concentrated on cable, metal nut, and transistor but decreases on categories where the baseline is already highly accurate.
This behavior is consistent with the characteristics of the underlying defect types. Although MVTec AD is primarily a surface-anomaly benchmark, several object categories include defects that alter orientation, component presence, or spatial configuration in addition to local appearance. Such defects provide relational cues that can be exploited by relation re-scoring, whereas homogeneous texture anomalies already produce strong local responses and leave less room for relational refinement. The more uniform gains observed for WinCLIP are also consistent with its weaker baseline localization, which leaves greater scope for complementary relation evidence. These trends further support retaining the baseline map: the relation cue adds sensitivity to configuration changes, while the original map preserves responses to texture-dominated defects.
Table A20. Category-wise pixel-level results on MVTec AD for the baseline and the proposed Baseline + V2 fusion. Each entry reports pixel AUROC/AUPRO.
CategoryAnomalyCLIPWinCLIPAA-CLIP
BaselineProposedBaselineProposedBaselineProposed
bottle82.5/78.590.8/82.278.9/57.489.8/75.791.2/86.890.2/82.0
cable74.2/60.088.7/60.468.8/44.382.4/53.183.8/76.888.0/71.8
capsule93.0/87.690.7/80.281.4/56.590.9/76.795.5/93.595.7/92.9
carpet98.4/95.493.4/90.291.7/66.698.6/95.299.3/97.795.7/91.3
grid94.2/79.785.3/63.074.3/39.592.7/80.897.6/93.990.0/75.9
hazelnut96.9/93.995.1/91.696.9/83.496.0/84.197.7/92.795.1/82.5
leather98.7/95.197.0/95.394.9/84.499.2/98.599.4/99.396.7/97.3
metal_nut73.2/70.890.0/75.259.6/34.271.3/55.070.2/77.381.6/73.5
pill90.7/89.885.4/84.689.2/54.286.6/77.884.9/92.983.2/91.8
screw97.2/89.090.1/71.391.0/69.991.0/71.998.7/93.996.6/88.5
tile93.2/84.588.1/80.180.4/57.689.0/80.188.5/85.877.3/66.4
toothbrush89.4/87.996.8/81.785.0/67.396.0/77.595.2/91.096.6/90.5
transistor66.0/55.772.8/62.277.3/43.882.5/63.169.2/56.574.0/59.0
wood96.3/90.092.9/90.086.8/58.392.6/85.397.2/97.293.9/91.8
zipper79.4/50.080.9/53.988.7/65.695.6/87.495.8/85.288.6/69.4
Mean88.2/80.589.2/77.583.0/58.990.3/77.591.0/88.089.5/81.6

References

  1. Pang, G.; Shen, C.; Cao, L.; van den Hengel, A. Deep Learning for Anomaly Detection: A Review. ACM Comput. Surv. 2021, 54, 1–38. [Google Scholar] [CrossRef] [Scilit]
  2. Liu, J.; Xie, G.; Wang, J.; Li, S.; Wang, C.; Zheng, F.; Jin, Y. Deep Industrial Image Anomaly Detection: A Survey. Mach. Intell. Res. 2024, 21, 104–135. [Google Scholar] [CrossRef] [Scilit]
  3. Bergmann, P.; Fauser, M.; Sattlegger, D.; Steger, C. The MVTec Anomaly Detection Dataset: A Comprehensive Real-World Dataset for Unsupervised Anomaly Detection. Int. J. Comput. Vis. 2021, 129, 1038–1059. [Google Scholar] [CrossRef] [Scilit]
  4. Ruff, L.; Vandermeulen, R.A.; Goernitz, N.; Deecke, L.; Siddiqui, S.A.; Binder, A.; Müller, E.; Kloft, M. Deep One-Class Classification. In Proceedings of the 35th International Conference on Machine Learning, Stockholm, Sweden, 10–15 July 2018; pp. 4393–4402. Available online: https://proceedings.mlr.press/v80/ruff18a.html (accessed on 4 August 2026).
  5. Defard, T.; Setkov, A.; Loesch, A.; Audigier, R. PaDiM: A Patch Distribution Modeling Framework for Anomaly Detection and Localization. In International Conference on Pattern Recognition Workshops; Springer: Berlin/Heidelberg, Germany, 2021; pp. 475–489. [Google Scholar] [CrossRef] [Scilit]
  6. Roth, K.; Pemula, L.; Zepeda, J.; Scholkopf, B.; Brox, T.; Gehler, P. Towards Total Recall in Industrial Anomaly Detection. In Proceedings of the IEEE/CVF Conference on Computer Vision and Pattern Recognition, New Orleans, LA, USA, 18–24 June 2022; pp. 14318–14328. [Google Scholar] [CrossRef] [Scilit]
  7. Zavrtanik, V.; Kristan, M.; Skocaj, D. DRAEM: A Discriminatively Trained Reconstruction Embedding for Surface Anomaly Detection. In Proceedings of the IEEE/CVF International Conference on Computer Vision, Montreal, QC, Canada, 10–17 October 2021; pp. 8330–8339. [Google Scholar] [CrossRef] [Scilit]
  8. Deng, H.; Li, X. Anomaly Detection via Reverse Distillation from One-Class Embedding. In Proceedings of the IEEE/CVF Conference on Computer Vision and Pattern Recognition, New Orleans, LA, USA, 18–24 June 2022; pp. 9737–9746. [Google Scholar] [CrossRef] [Scilit]
  9. Rudolph, M.; Wandt, B.; Rosenhahn, B. Same Same But DifferNet: Semi-Supervised Defect Detection with Normalizing Flows. In Proceedings of the IEEE Winter Conference on Applications of Computer Vision, Waikoloa, HI, USA, 3–8 January 2021; pp. 1907–1916. [Google Scholar] [CrossRef] [Scilit]
  10. Gudovskiy, D.; Ishizaka, S.; Kozuka, K. CFLOW-AD: Real-Time Unsupervised Anomaly Detection With Localization via Conditional Normalizing Flows. In Proceedings of the IEEE/CVF Winter Conference on Applications of Computer Vision, Waikoloa, HI, USA, 3–8 January 2022; pp. 98–107. Available online: https://openaccess.thecvf.com/content/WACV2022/html/Gudovskiy_CFLOW-AD_Real-Time_Unsupervised_Anomaly_Detection_With_Localization_via_Conditional_Normalizing_WACV_2022_paper.html (accessed on 4 August 2026).
  11. You, Z.; Cui, L.; Shen, Y.; Yang, K.; Lu, X.; Zheng, Y.; Le, X. A Unified Model for Multi-Class Anomaly Detection. Adv. Neural Inf. Process. Syst. 2022, 35, 4571–4584. Available online: https://proceedings.neurips.cc/paper_files/paper/2022/hash/1d774c112926348c3e25ea47d87c835b-Abstract-Conference.html (accessed on 4 August 2026). [CrossRef] [Scilit]
  12. Liu, Z.; Zhou, Y.; Xu, Y.; Wang, Z. SimpleNet: A Simple Network for Image Anomaly Detection and Localization. In Proceedings of the IEEE/CVF Conference on Computer Vision and Pattern Recognition, Vancouver, BC, Canada, 17–24 June 2023; pp. 20402–20411. [Google Scholar] [CrossRef] [Scilit]
  13. Batzner, K.; Heckler, L.; Konig, R. EfficientAD: Accurate Visual Anomaly Detection at Millisecond-Level Latencies. In Proceedings of the IEEE Winter Conference on Applications of Computer Vision, Waikoloa, HI, USA, 3–8 January 2024; pp. 128–138. Available online: https://openaccess.thecvf.com/content/WACV2024/html/Batzner_EfficientAD_Accurate_Visual_Anomaly_Detection_at_Millisecond-Level_Latencies_WACV_2024_paper.html (accessed on 4 August 2026).
  14. Bergmann, P.; Batzner, K.; Fauser, M.; Sattlegger, D.; Steger, C. Beyond Dents and Scratches: Logical Constraints in Unsupervised Anomaly Detection and Localization. Int. J. Comput. Vis. 2022, 130, 947–969. [Google Scholar] [CrossRef] [Scilit]
  15. Radford, A.; Kim, J.W.; Hallacy, C.; Ramesh, A.; Goh, G.; Agarwal, S.; Sastry, G.; Askell, A.; Mishkin, P.; Clark, J.; et al. Learning Transferable Visual Models From Natural Language Supervision. In International Conference on Machine Learning; PMLR: Online, 2021; Volume 139, pp. 8748–8763. Available online: https://proceedings.mlr.press/v139/radford21a.html (accessed on 4 August 2026).
  16. Jeong, J.; Zou, Y.; Kim, T.; Zhang, D.; Ravichandran, A.; Dabeer, O. WinCLIP: Zero-/Few-Shot Anomaly Classification and Segmentation. In Proceedings of the IEEE/CVF Conference on Computer Vision and Pattern Recognition, Vancouver, BC, Canada, 17–24 June 2023; pp. 19606–19616. [Google Scholar] [CrossRef] [Scilit]
  17. Zhou, Q.; Pang, G.; Tian, Y.; He, S.; Chen, J. AnomalyCLIP: Object-Agnostic Prompt Learning for Zero-Shot Anomaly Detection. In Proceedings of the International Conference on Learning Representations, Vienna, Austria, 7–11 May 2024; Available online: https://openreview.net/forum?id=buC4E91xZE (accessed on 4 August 2026).
  18. Ma, W.; Zhang, X.; Yao, Q.; Tang, F.; Wu, C.; Li, Y.; Yan, R.; Jiang, Z.; Zhou, S.K. AA-CLIP: Enhancing Zero-Shot Anomaly Detection via Anomaly-Aware CLIP. In Proceedings of the IEEE/CVF Conference on Computer Vision and Pattern Recognition, Nashville, TN, USA, 10–17 June 2025; pp. 4744–4754. Available online: https://openaccess.thecvf.com/content/CVPR2025/html/Ma_AA-CLIP_Enhancing_Zero-Shot_Anomaly_Detection_via_Anomaly-Aware_CLIP_CVPR_2025_paper.html (accessed on 4 August 2026).
  19. Li, W.; Goodge, A.; Liu, F.; Foo, C.-S. PromptAD: Zero-Shot Anomaly Detection Using Text Prompts. In Proceedings of the IEEE Winter Conference on Applications of Computer Vision, Waikoloa, HI, USA, 3–8 January 2024; pp. 1093–1102. Available online: https://openaccess.thecvf.com/content/WACV2024/html/Li_PromptAD_Zero-Shot_Anomaly_Detection_Using_Text_Prompts_WACV_2024_paper.html (accessed on 4 August 2026).
  20. Cao, Y.; Zhang, J.; Frittoli, L.; Cheng, Y.; Shen, W.; Boracchi, G. AdaCLIP: Adapting CLIP with Hybrid Learnable Prompts for Zero-Shot Anomaly Detection. In Proceedings of the European Conference on Computer Vision, Milan, Italy, 29 September–4 October 2024; pp. 55–72. [Google Scholar] [CrossRef] [Scilit]
  21. Gu, Z.; Zhu, B.; Zhu, G.; Chen, Y.; Li, H.; Tang, M.; Wang, J. FiLo: Zero-Shot Anomaly Detection by Fine-Grained Description and High-Quality Localization. In ACM Multimedia; ACM: New York, NY, USA, 2024. [Google Scholar] [CrossRef] [Scilit]
  22. Zhu, J.; Ong, Y.-S.; Shen, C.; Pang, G. Fine-Grained Abnormality Prompt Learning for Zero-Shot Anomaly Detection. In Proceedings of the IEEE/CVF International Conference on Computer Vision, Honolulu, HI, USA, 21–23 October 2025; Available online: https://openaccess.thecvf.com/content/ICCV2025/html/Zhu_Fine-grained_Abnormality_Prompt_Learning_for_Zero-shot_Anomaly_Detection_ICCV_2025_paper.html (accessed on 4 August 2026).
  23. Gong, C.; Chu, Q.; Liu, B.; Zhou, W.; Yu, N. FE-CLIP: Frequency Enhanced CLIP Model for Zero-Shot Anomaly Detection and Segmentation. In Proceedings of the IEEE/CVF International Conference on Computer Vision, Honolulu, HI, USA, 21–23 October 2025; Available online: https://openaccess.thecvf.com/content/ICCV2025/html/Gong_FE-CLIP_Frequency_Enhanced_CLIP_Model_for_Zero-Shot_Anomaly_Detection_and_ICCV_2025_paper.html (accessed on 4 August 2026).
  24. Ishida, K.; Takena, Y.; Nota, Y.; Mochizuki, R.; Matsumura, I.; Ohashi, G. SA-PatchCore: Anomaly Detection in Dataset With Co-Occurrence Relationships Using Self-Attention. IEEE Access 2023, 11, 1047–1057. [Google Scholar] [CrossRef] [Scilit]
  25. Kim, D.; An, S.; Chikontwe, P.; Kang, M.; Adeli, E.; Pohl, K.M.; Park, S.H. Few Shot Part Segmentation Reveals Compositional Logic for Industrial Anomaly Detection. In Proceedings of the AAAI Conference on Artificial Intelligence; PKP Publishing: Vancouver, BC, Canada, 2024; Volume 38, pp. 8591–8599. [Google Scholar] [CrossRef] [Scilit]
  26. Liu, T.; Li, B.; Du, X.; Jiang, B.; Jin, X.; Jin, L.; Zhao, Z. Component-Aware Anomaly Detection Framework for Adjustable and Logical Industrial Visual Inspection. Adv. Eng. Inform. 2023, 58, 102161. Available online: https://www.sciencedirect.com/science/article/pii/S1474034623002896 (accessed on 4 August 2026). [CrossRef] [Scilit]
  27. Peng, Y.; Lin, X.; Ma, N.; Du, J.; Liu, C.; Liu, C.; Chen, Q. SAM-LAD: Segment Anything Model Meets Zero-Shot Logic Anomaly Detection. Knowl.-Based Syst. 2025, 309, 113176. [Google Scholar] [CrossRef] [Scilit]
  28. Kwon, Y.; Moon, D.; Oh, Y.; Yoon, H. LogicQA: Logical Anomaly Detection with Vision Language Model Generated Questions. In Proceedings of the ACL Industry Track; Association for Computational Linguistics: Stroudsburg, PA, USA, 2025; pp. 394–406. [Google Scholar] [CrossRef] [Scilit]
  29. Fucka, M.; Zavrtanik, V.; Skocaj, D. SALAD: Semantics-Aware Logical Anomaly Detection. In Proceedings of the IEEE/CVF International Conference on Computer Vision, Honolulu, HI, USA, 21–23 October 2025; Available online: https://ieeexplore.ieee.org/document/11446115 (accessed on 4 August 2026).
  30. Fucka, M.; Zavrtanik, V.; Skocaj, D. ObjectCore: Efficient Few-Shot Logical Anomaly Detection Using Object Representations. In Proceedings of the IEEE/CVF Winter Conference on Applications of Computer Vision, Tucson, AZ, USA, 6–10 March 2026; pp. 3857–3867. Available online: https://openaccess.thecvf.com/content/WACV2026/html/Fucka_ObjectCore_-_Efficient_Few-shot_Logical_Anomaly_Detection_using_Object_Representations_WACV_2026_paper.html (accessed on 4 August 2026).
  31. Tong, X.; Chang, Y.; Zhao, Q.; Yu, J.; Wang, B.; Lin, J.; Lin, Y.; Mai, X.; Wang, H.; Tao, Z.; et al. Component-Aware Unsupervised Logical Anomaly Generation for Industrial Anomaly Detection. In Proceedings of the IEEE International Conference on Robotics and Automation, Atlanta, GA, USA, 19–23 May 2025; pp. 16722–16729. [Google Scholar] [CrossRef] [Scilit]
  32. Zou, Y.; Jeong, J.; Pemula, L.; Zhang, D.; Dabeer, O. SPot-the-Difference Self-Supervised Pre-training for Anomaly Detection and Segmentation. In Proceedings of the European Conference on Computer Vision, Tel Aviv, Israel, 23–27 October 2022; pp. 392–408. [Google Scholar] [CrossRef] [Scilit]
  33. Yi, J.; Yoon, S. Patch SVDD: Patch-Level SVDD for Anomaly Detection and Segmentation. In Asian Conference on Computer Vision; Springer: Cham, Switzerland, 2020; pp. 375–390. [Google Scholar] [CrossRef] [Scilit]
  34. Li, C.-L.; Sohn, K.; Yoon, J.; Pfister, T. CutPaste: Self-Supervised Learning for Anomaly Detection and Localization. In Proceedings of the IEEE/CVF Conference on Computer Vision and Pattern Recognition, Nashville, TN, USA, 20–25 June 2021; pp. 9664–9674. [Google Scholar] [CrossRef] [Scilit]
  35. Dosovitskiy, A.; Beyer, L.; Kolesnikov, A.; Weissenborn, D.; Zhai, X.; Unterthiner, T.; Dehghani, M.; Minderer, M.; Heigold, G.; Gelly, S.; et al. An Image is Worth 16x16 Words: Transformers for Image Recognition at Scale. arXiv 2021, arXiv:2010.11929. [Google Scholar]
  36. Vaswani, A.; Shazeer, N.; Parmar, N.; Uszkoreit, J.; Jones, L.; Gomez, A.N.; Kaiser, Ł.; Polosukhin, I. Attention Is All You Need. Adv. Neural Inf. Process. Syst. 2017, 30. Available online: https://proceedings.neurips.cc/paper_files/paper/2017/hash/3f5ee243547dee91fbd053c1c4a845aa-Abstract.html (accessed on 4 August 2026).
  37. Gu, Z.; Zhu, B.; Zhu, G.; Chen, Y.; Tang, M.; Wang, J. AnomalyGPT: Detecting Industrial Anomalies Using Large Vision-Language Models. In Proceedings of the AAAI Conference on Artificial Intelligence; PKP Publishing: Vancouver, BC, Canada, 2024; Volume 38, pp. 1932–1940. [Google Scholar] [CrossRef] [Scilit]
  38. Kirillov, A.; Mintun, E.; Ravi, N.; Mao, H.; Roll, C.; Gustafson, L.; Xiao, T.; Whitehead, S.; Berg, A.C.; Lo, W.Y.; et al. Segment Anything. In Proceedings of the IEEE/CVF International Conference on Computer Vision, Paris, France, 1–6 October 2023; pp. 4015–4026. [Google Scholar] [CrossRef] [Scilit]
  39. Caron, M.; Touvron, H.; Misra, I.; Jegou, H.; Mairal, J.; Bojanowski, P.; Joulin, A. Emerging Properties in Self-Supervised Vision Transformers. In Proceedings of the IEEE/CVF International Conference on Computer Vision, Montreal, QC, Canada, 10–17 October 2021; pp. 9650–9660. [Google Scholar] [CrossRef] [Scilit]
  40. Oquab, M.; Darcet, T.; Moutakanni, T.; Vo, H.; Szafraniec, M.; Khalidov, V.; Fernandez, P.; Haziza, D.; Massa, F.; El-Nouby, A.; et al. DINOv2: Learning Robust Visual Features without Supervision. arXiv 2024, arXiv:2304.07193. [Google Scholar]
  41. AnomalyCLIP Official Code. Available online: https://github.com/zqhang/AnomalyCLIP (accessed on 19 July 2026).
  42. AA-CLIP Official Code. Available online: https://github.com/Mwxinnn/AA-CLIP (accessed on 19 July 2026).
  43. Ke, L.; Ye, M.; Danelljan, M.; Liu, Y.; Tai, Y.-W.; Tang, C.-K.; Yu, F. Segment anything in high quality. In Proceedings of the 37th International Conference on Neural Information Processing Systems, New Orleans, LA, USA, 10–16 December 2023; pp. 29914–29934. [Google Scholar]
Figure 1. Overview of the proposed relation prototype re-scoring framework. The visual transformer produces patch features and position-aware self-attention, which togethers form relation-aggregated features. Category-wise relation prototypes are constructed from normal training images. During inference, the L2 deviation from the normal prototype yields a relation map. The resulting relation map is finally fused with the original anomaly map, enabling logical-anomaly sensitivity without modifying the baseline detector or introducing additional learnable parameters.
Electronics 15 04293 g001
Table 1. Results on the logical-anomaly split of MVTec LOCO AD using AnomalyCLIP. Pixel and image metrics are averaged across object categories. The best results are marked in bold. The proposed Baseline + V2 configuration achieves the best overall logical-anomaly performance, demonstrating that the feature-relation map (V2) complements the original anomaly map more effectively than the attention-difference map (V1).
MethodPixel AUROCPixel AUPROImage AUROCImage AP
Baseline53.928.750.554.0
V1 only51.011.059.660.9
Baseline + V152.424.359.659.2
V2 only74.251.771.174.6
Baseline + V2 (Proposed)74.452.771.774.0
Table 2. Generalization of the proposed relation formulation to WinCLIP and AA-CLIP on the logical-anomaly split of MVTec LOCO AD. The best results are marked in bold. The results demonstrate that the proposed feature-relation formulation generalizes across different CLIP-based detectors, although the magnitude of the improvement depends on the baseline representation.
BaselineMethodPixel AUROCPixel AUPROImage AUROCImage AP
WinCLIPBaseline51.227.155.559.3
V1 only56.124.362.160.0
Baseline + V155.527.260.261.6
V2 only70.141.669.470.9
Baseline + V2 (Proposed)65.839.369.470.7
AA-CLIPBaseline62.945.850.955.6
V1 only51.411.557.258.8
Baseline + V159.346.255.257.1
V2 only61.832.666.468.7
Baseline + V2 (Proposed)63.648.463.165.7
Table 3. Comparison with representative logical-anomaly-specific methods on the logical-anomaly split of MVTec LOCO AD. Image AUROC values are taken from the respective publications. The image AUROC of the proposed method corresponds to the AnomalyCLIP Baseline + V2 fusion. The results are reported for reference because the methods rely on different supervision, auxiliary models, and inference settings. The comparison highlights that the proposed method improves logical-anomaly capability without introducing additional supervision, auxiliary networks, or task-specific logical reasoning modules.
MethodRequired Supervision or Reference DataAdditional Models and Logical ModelingOutputImage AUROC
PSAD [25]Manually annotated component masks and additional unlabeled normal imagesA separately trained component segmentation network, together with component histograms, composition embeddings, and patch-level memory banksImage-level anomaly score with component- and segment-level anomaly evidence98.1
LogicQA [28]A few normal reference images; no manual annotation or task-specific trainingA pretrained VLM generates and answers questions about component presence, quantity, and spatial arrangementImage-level decision with a natural-language explanation; no dense anomaly map87.6
SALAD [29]Normal training images, automatically generated composition pseudo-labels, and synthetic logical anomaliesDINO and SAM-HQ generate pseudo-labels, followed by training of a component segmentation model and a discriminative composition branchImage-level anomaly score and segmentation map96.1
ObjectCore [30]A few normal support images; 4-shot results are reportedA fine-tuned open-world object detector and a mask-generation model, followed by object-level bipartite matchingImage-level decision with object-level anomaly attribution80.8
ProposedNormal training images only; no component labels, anomaly samples, manually specified logical rules, or selected support shotsNo separately trained auxiliary module; semantic–spatial relations from the CLIP visual transformer are summarized as normal relation prototypesMap-derived image-level score and dense pixel-level anomaly map71.7
Table 4. Results on the structural-anomaly split of MVTec LOCO AD. Pixel and image metrics are averaged across object categories. The best results are marked in bold. The results show that relation modeling is complementary to local appearance evidence for structural defects rather than a replacement for it.
BaselineMethodPixel AUROCPixel AUPROImage AUROCImage AP
AnomalyCLIPBaseline74.857.767.968.1
V1 only59.412.846.942.5
Baseline + V171.752.265.465.0
V2 only77.741.764.360.2
Baseline + V2 (Proposed)81.154.772.872.8
WinCLIPBaseline77.342.462.458.4
V1 only70.935.955.348.8
Baseline + V174.244.861.356.7
V2 only75.144.564.957.7
Baseline + V2 (Proposed)80.854.967.563.7
AA-CLIPBaseline89.776.565.965.2
V1 only59.212.548.945.0
Baseline + V188.168.953.549.4
V2 only69.834.753.248.1
Baseline + V2 (Proposed)89.273.764.060.8
Table 5. Image-level results on CAD-SD. Logical comprises the Over-coupling and Lacking subsets, whereas Surface comprises Scratch and Paint. Only image-level metrics are reported because CAD-SD does not provide pixel-level annotations. The best results are marked in bold. The proposed relation map is particularly effective for logical anomalies, whereas surface anomalies remain primarily dependent on local appearance cues.
BaselineSubsetMethodImage AUROCImage AP
AnomalyCLIPLogicalBaseline50.027.8
V2 only96.091.5
Baseline + V2 (Proposed)92.080.8
SurfaceBaseline99.197.8
V2 only100.0100.0
Baseline + V2 (Proposed)100.0100.0
WinCLIPLogicalBaseline36.522.1
V2 only98.797.4
Baseline + V2 (Proposed)93.888.6
SurfaceBaseline76.662.6
V2 only54.831.8
Baseline + V2 (Proposed)74.357.5
AA-CLIPLogicalBaseline18.518.1
V2 only68.154.8
Baseline + V2 (Proposed)31.720.7
SurfaceBaseline91.186.7
V2 only72.642.8
Baseline + V2 (Proposed)93.990.9
Table 6. Results on MVTec AD. The best results are marked in bold. The results indicate that relation modeling is most beneficial for categories containing stronger structural or configurational changes, while remaining complementary to local appearance evidence.
BaselineMethodPixel AUROCPixel AUPROImage AUROCImage AP
AnomalyCLIPBaseline88.280.591.696.4
V2 only80.951.484.992.8
Baseline + V2 (Proposed)89.277.595.197.9
WinCLIPBaseline83.058.987.694.2
V2 only88.370.287.894.3
Baseline + V2 (Proposed)90.377.591.896.5
AA-CLIPBaseline91.088.092.096.3
V2 only73.248.078.490.6
Baseline + V2 (Proposed)89.581.694.497.3
Table 7. Main design ablations on the logical-anomaly split of MVTec LOCO AD using AnomalyCLIP. Early-fusion variants use the preliminary formulation ( S base + α S rel ) with the best evaluated α , whereas the attention-graph comparison reports relation-only V2 results. The final configuration combines the selected q-k relation map with the baseline map using equal weights. The best results are marked in bold.
Design FactorConfigurationPixel AUROCPixel AUPRO
BaselineAnomalyCLIP53.928.7
Relation contentPosition-only relation (best early fusion)55.731.2
Raw-feature prototype (best early fusion)63.238.2
Attention-propagated feature relation, i.e., V2 (best early fusion)63.939.0
V2 + explicit position (best early fusion)63.938.7
Attention graphDPAM v-v graph (V2 only, last 5 layers)70.646.7
Original q-k graph (V2 only, last 5 layers)74.251.7
Final combinationq-k relation + equal fusion with baseline ( β = 1 )74.452.7
Disclaimer/Publisher’s Note: The statements, opinions and data contained in all publications are solely those of the individual author(s) and contributor(s) and not of MDPI and/or the editor(s). MDPI and/or the editor(s) disclaim responsibility for any injury to people or property resulting from any ideas, methods, instructions or products referred to in the content.