Article

Passive Microwave Angular Sensor Based on Local Perturbation of a Split-Ring Resonator

1
College of Information Science & Electronic Engineering, Zhejiang University, Hangzhou 310027, China
2
Department of Electrical and Information Engineering, Jiangsu University of Science and Technology, Zhenjiang 212003, China
*
Author to whom correspondence should be addressed.
Electronics 2026, 15(17), 3897; https://doi.org/10.3390/electronics15173897 (registering DOI)
Submission received: 7 August 2026 / Revised: 25 August 2026 / Accepted: 27 August 2026 / Published: 29 August 2026
(This article belongs to the Special Issue Trends and Prospects in Microwave Sensors)

Abstract

This work presents a microwave attitude sensing method and device based on localized perturbation of a split-ring resonator (SRR). The sensor comprises a planar SRR, parallel microstrip feed lines and a metallic disk that can move along a circular trajectory. When the sensor’s orientation is modified in a plane perpendicular to the ground, the metallic disk moves within the constrained structure under the influence of gravity and changes its position relative to the SRR, modulating the local near field and the microstrip coupling state. Consequently, variations in angle are observed across multiple S-parameter channels. The mechanism is validated through simulation and experimental measurements. The measured S-parameters are used to construct a circular residual mixture-of-experts Gaussian process regression (MoE-GPR) model, which is developed for 360° angle reconstruction. In leave-one-angle-out (LOAO) validation on data sampled at 2.5° intervals, the proposed reconstruction method achieves a mean absolute error (MAE) of 0.700°. When trained on data sampled at 10° intervals and tested on a dataset sampled at 2.5° intervals, the proposed method achieves an MAE of 1.125°, demonstrating its generalization across different angular sampling conditions. As no active electronics are required at the moving sensing element, the proposed configuration has potential for integration with RF sensing and communication platforms, as well as for inclination sensing referenced to gravity, orientation detection and structural health monitoring.

1. Introduction

Microwave resonant sensors have attracted considerable attention due to their low cost, compatibility with planar fabrication, and real-time sensing capability. Among the various resonant structures, split-ring resonators (SRRs) and their variants are widely used owing to their compact size, strong field localization, and high sensitivity to environmental perturbations. When integrated with transmission lines such as microstrip lines or coplanar waveguides, an SRR forms a resonant system whose spectral response can be readily monitored through S-parameters. Owing to their high sensitivity to environmental perturbations, resonant structures based on SRRs have been extensively investigated for dielectric characterization, chemical sensing, and biological detection [1].
Besides material characterization, SRRs have also been used to detect mechanical variables such as displacement, position, and rotation. Previous studies have shown that SRR-loaded transmission lines exhibit resonant responses that are highly sensitive to geometric perturbations, leading to the development of position and alignment sensors [2,3]. The sensing mechanisms rely on changes in electromagnetic coupling caused by relative motion between the resonant element and its surrounding structures. Martín et al. systematically classified microwave sensors based on resonant elements and identified resonant frequency, quality factor, and transmission magnitude as the principal observables of such devices [4].
In the field of angular displacement sensing, previous studies have exploited variations in the coupling state between a transmission line and a resonator with relative orientation to achieve angle detection. Examples include structures based on an SRR coupled to a coplanar waveguide [5] and structures based on an ELC resonator coupled to a microstrip line [6]. Angular information can be extracted from the shift in resonant frequency or the modulation of response amplitude caused by relative rotation [7]. In order to enhance the resonant response and detection sensitivity, active feedback resonant circuits have also been employed in angle sensing systems [8]. In recent years, stacked dual SRR structures have been utilized for rotation detection within the 0–180° range and have been further extended to displacement and strain measurements [9].
Despite these advances, most microwave angular displacement sensors still rely on rotation of the resonant structure or on changes in the relative orientation between the resonator and the transmission line [5,6,7,8,9,10]. In contrast, if the angular sensing based on conductor motion within a fixed resonant structure can modulate the local near field distribution without mechanically rotating the resonator, it will maintain a simple device configuration. For resonators with nonuniform field distributions, such position dependent perturbations can substantially alter both the local electromagnetic field distribution and the overall resonant response, offering potential for angular and attitude sensing.
In light of these considerations, this study proposes a planar microwave angular sensing scheme based on a coupled microstrip SRR resonant structure. Angular position is detected through the local electromagnetic perturbation produced when a metallic disk moves along a circular trajectory over the SRR. The localized conductive perturbation modifies the near-field distribution of the SRR and the port coupling state. These electromagnetic variations are reflected in the multichannel S-parameter responses and further extracted as spectral descriptors that vary with angle. A locally oriented mixture-of-experts Gaussian process regression (MoE-GPR) model is further developed to reconstruct the angular position of the metallic disk. When the disk moves under gravity inside the mechanically constrained structure, its angular position relative to the SRR can be used to infer the orientation of the sensing plane.
The structure of the remainder of this paper is as follows. Section 2 presents the geometry of the sensor and the equivalent circuit model. Section 3 describes the measurement process and the proposed angle reconstruction method. Section 4 discusses the measured results. Finally, conclusions are given in Section 5.

2. Sensor Design

2.1. Structural Design and Simulated S-Parameter Response

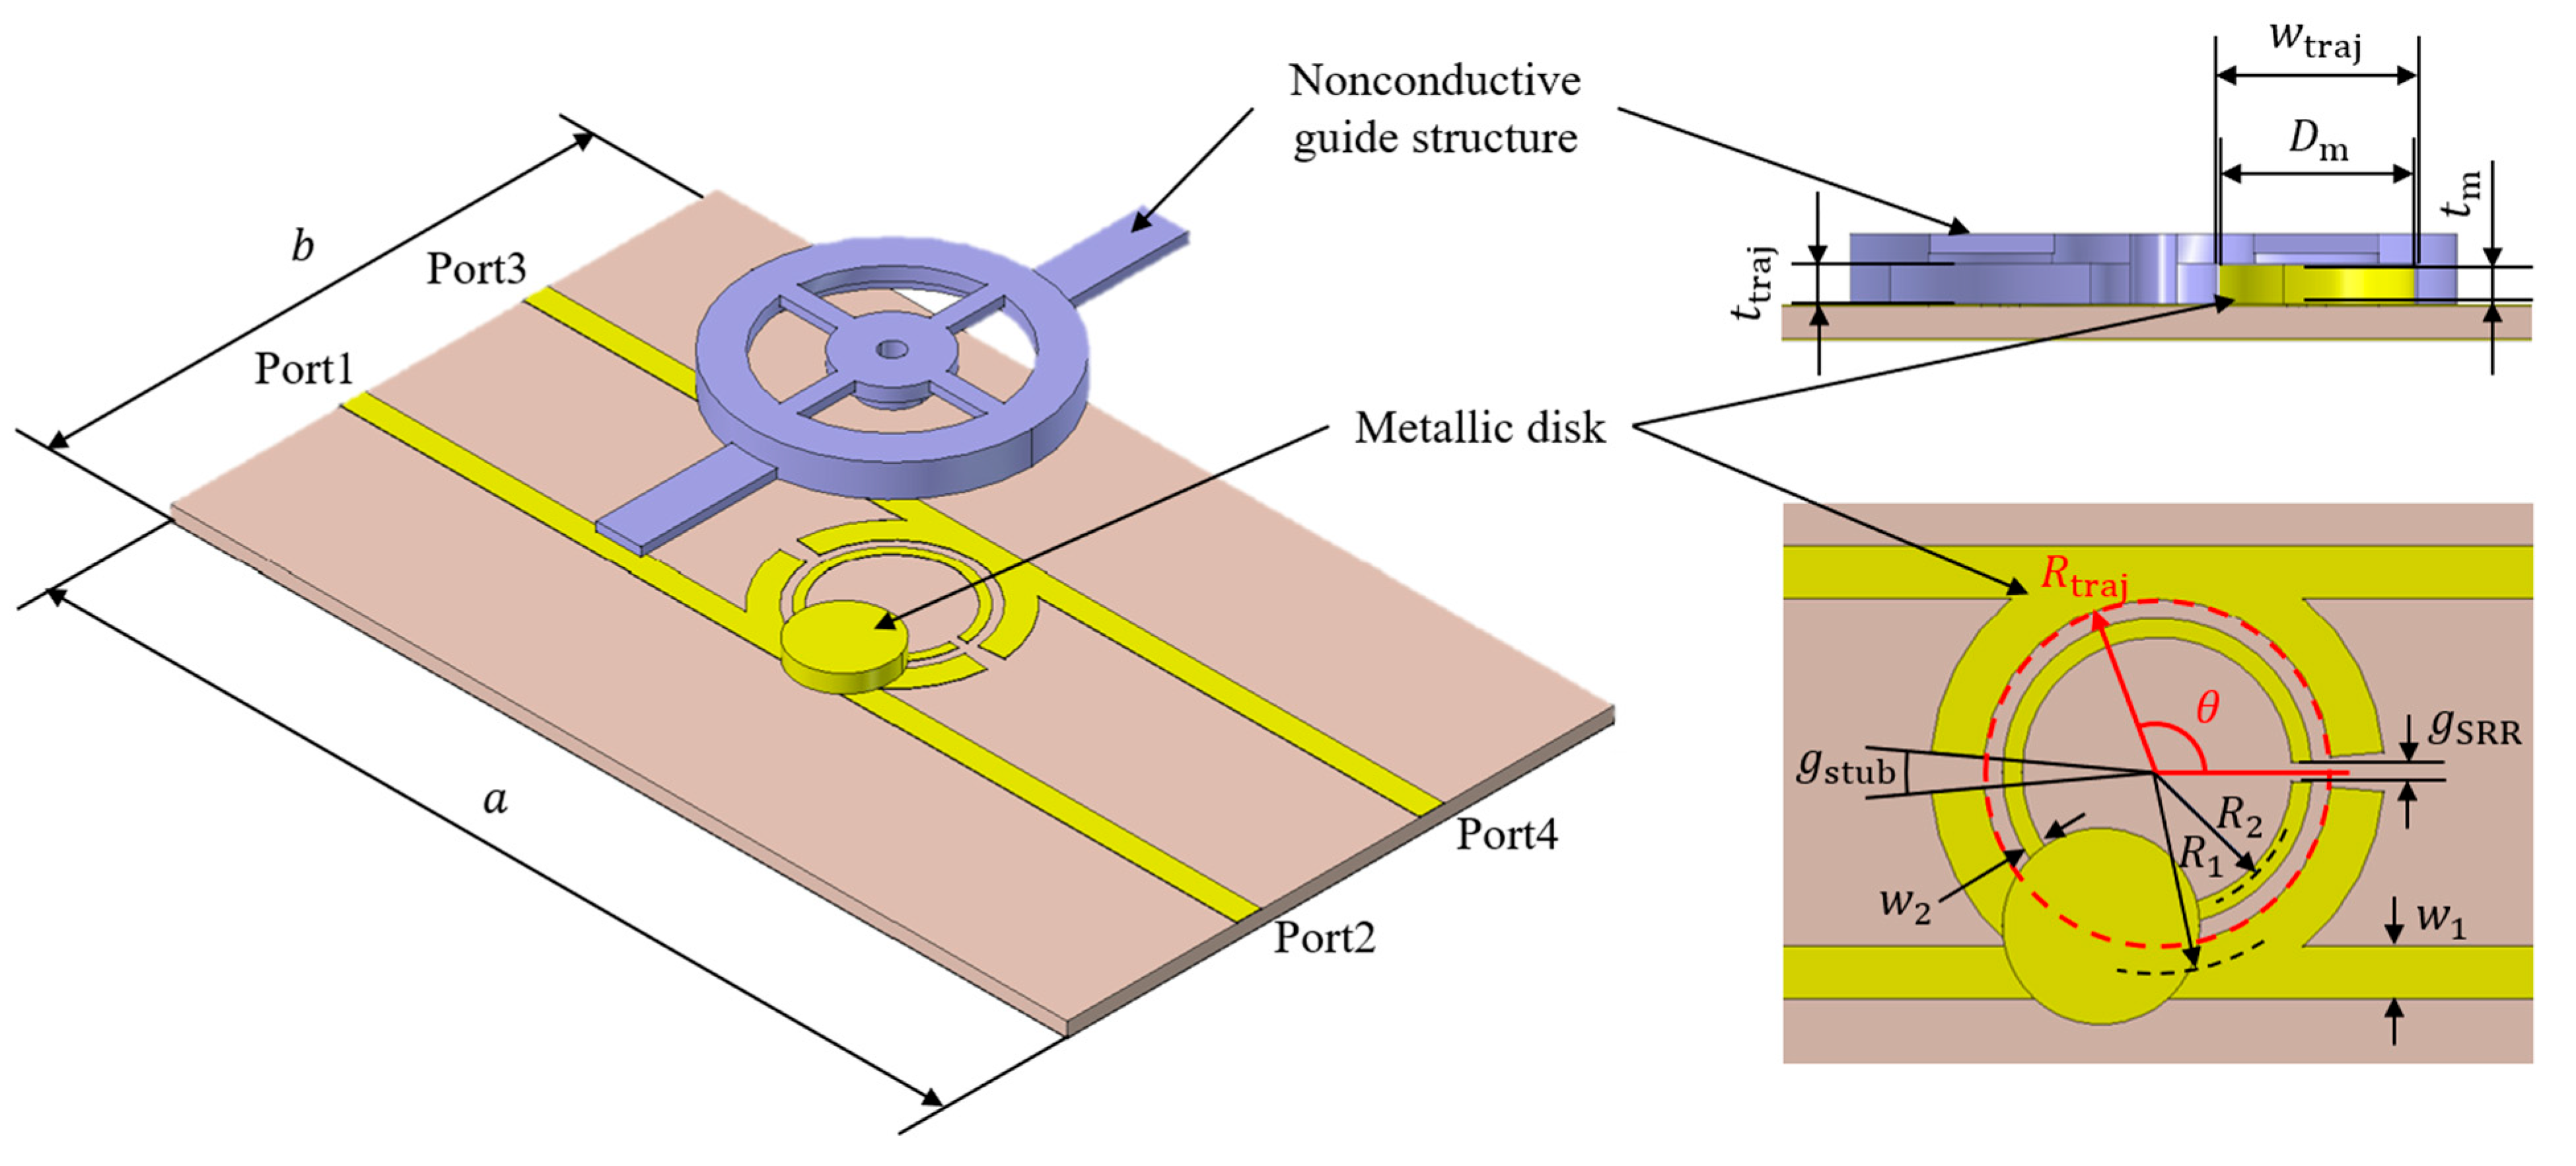
The proposed sensor for attitude sensing in a vertical plane consists of two parallel microstrip transmission lines, four arcuate coupling arms, a central SRR, and a metallic disk located above the resonator. As illustrated in Figure 1, the metallic disk is positioned above the SRR and is allowed to move along a circular trajectory around the resonator within the sensing plane. The two microstrip lines are placed on both sides of the SRR and coupled to the resonant structure through the arcuate coupling arms. The SRR is located at the center of the device, where the region near the split can exhibit a strong localized electric field. The metallic disk is positioned above the SRR and is guided by a nonconductive structure along a predefined circular trajectory. The angular position of the disk along this trajectory is defined as the attitude angle θ . During movement, the disk modifies the local near field distribution and coupling condition of the SRR, introducing angle dependent variations into the S-parameter responses of the structure.
The sensor is fabricated on an FR-4 dielectric substrate with a thickness of 1.6 mm, a relative permittivity of approximately 4.2, and a copper thickness of 35 μm. The nonconductive guide structure employed to constrain the motion of the metallic disk is fabricated from PLA, with a relative permittivity of 2.5. The SRR, coupling arms, and microstrip lines are patterned on the PCB copper top layer. The bottom layer of the PCB is the ground plane. Table 1 shows the key geometric parameters.
The geometric dimensions in Table 1 were determined by considering the operating frequency band, SRR field distribution, microstrip feeding conditions, and practical fabrication constraints. The width of the microstrip transmission line was designed to achieve a characteristic impedance of 50 Ω to match with the measurement system. The SRR radius, ring width, and split size were selected to confine the main resonant response within a certain measurement band. The radius and width of the coupling arms were then adjusted to control the coupling strength between the SRR and the two microstrip lines so that angular variations could produce both measurable resonance shifts and complementary amplitude responses in different channels. The diameter and motion radius of the metallic disk were selected as a compromise among local perturbation strength, available motion space, and the mechanical constraints of the guide structure.
These geometric parameters influence the sensitivity, monotonicity, and distinguishability of spectral features with respect to angular variations, thereby affecting angle reconstruction performance. Since this work primarily aims to demonstrate the feasibility of attitude sensing based on local SRR perturbations and multiport spectral reconstruction, the dimensions listed in Table 1 should be regarded as a feasible design satisfying the requirements of operating frequency, manufacturability, and stable motion, rather than a globally optimized solution for minimum reconstruction error. Systematic parameter sweeps, together with quantitative analysis of the relationships among geometry, electromagnetic sensitivity, and reconstruction accuracy, will be considered in future optimization studies.

2.2. Simulation and Mechanism Analysis

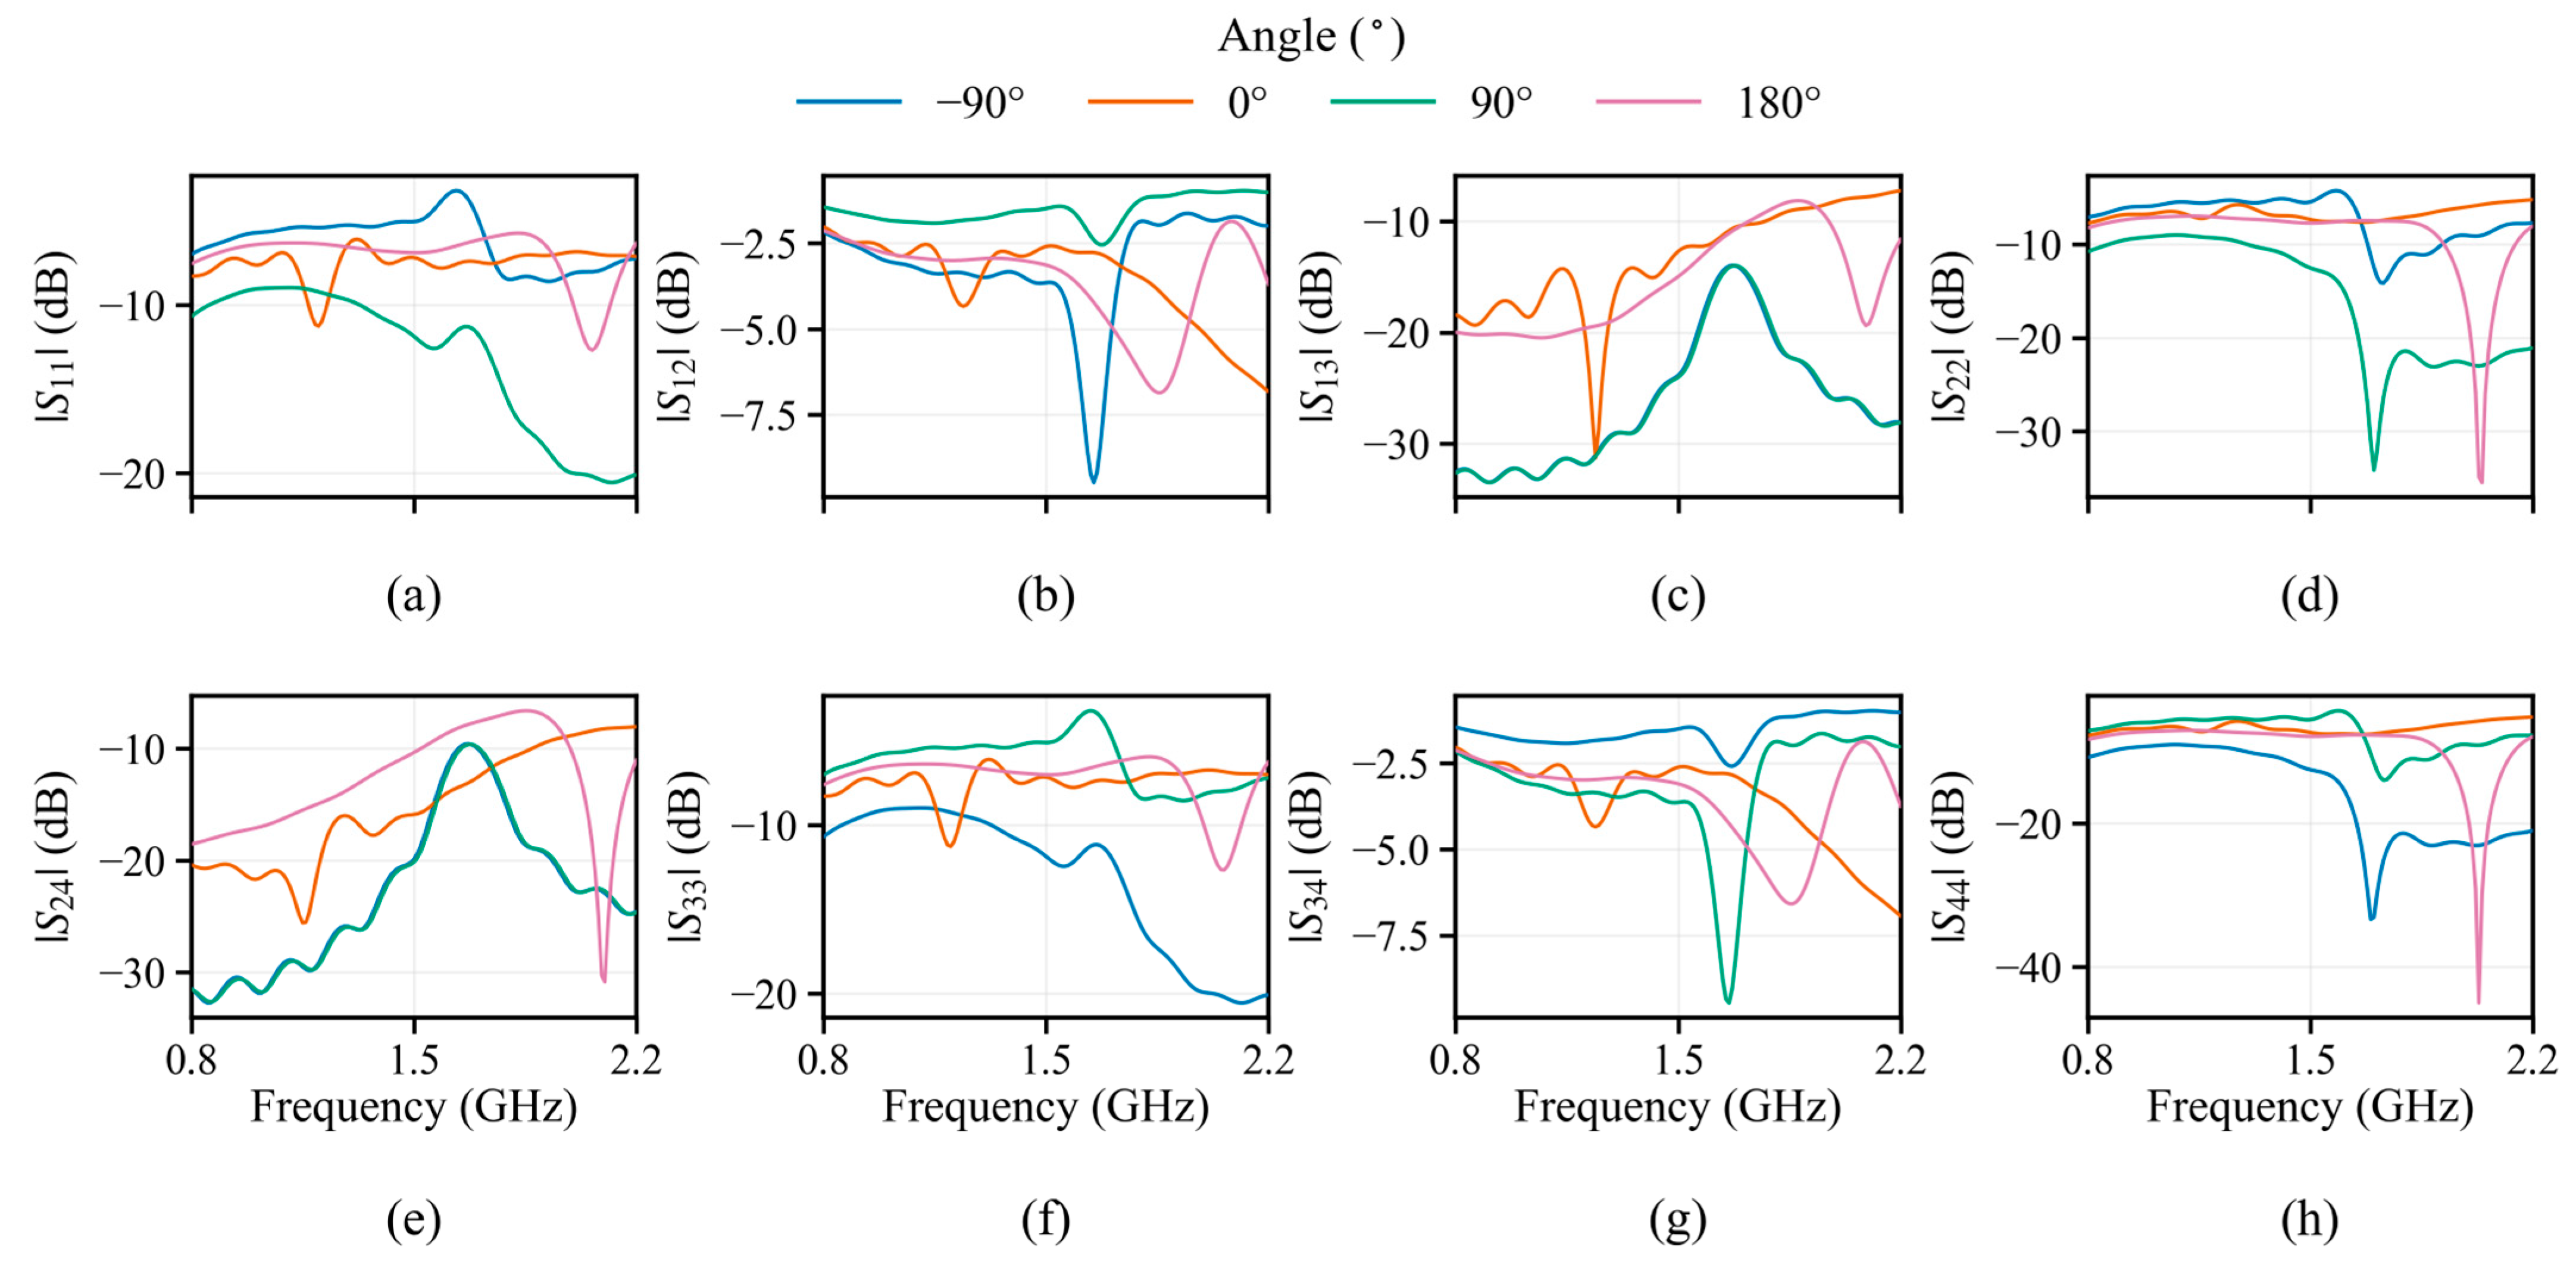
Before implementation, full wave simulations of the proposed structure were performed in CST Microwave Studio (CST) to evaluate its electromagnetic response. The metallic disk was placed at several representative positions along its circular trajectory, and multiport S-parameters were extracted at each position. Figure 2 shows the simulated S-parameter responses at these positions. The CST model retains the distributed geometry, material configuration, and local electromagnetic interactions of the fabricated structure.
The CST results show that the positions and magnitudes of resonant peaks and valleys vary with disk angle across multiple S-parameter channels. These variations demonstrate that the proposed structure converts the position of the metallic disk into distinguishable multiport spectral signatures.
The angle-dependent response originates from the distributed electromagnetic perturbation introduced by the metallic disk at different positions. The SRR can be viewed qualitatively as an effective resonant structure in which the circulating current contributes to the effective inductance, while the split and its localized electric field determine the effective capacitance. Its resonant frequency can therefore be approximated as
f 0 = 1 2 π L C
As the metallic disk moves along the circular trajectory, it acts as a movable floating conductor that perturbs the localized electromagnetic field around the SRR split. The resulting variations in effective capacitance, inductance, and electromagnetic coupling modify the spectral characteristics of the S-parameter responses.
When the metallic disk is removed, the interaction between the coupling arms and the SRR is relatively weak. When the metallic disk approaches the SRR split, an additional capacitive path is introduced between the SRR split and the metallic disk surface, increasing the equivalent capacitance of the resonator:
C e f f = C 0 + Δ C θ
Here, C 0 is the intrinsic capacitance of the SRR split, and Δ C θ denotes the additional capacitance introduced by the metallic disk. The increased effective capacitance lowers the resonant frequency. When the disk overlaps the split region of the SRR, C e f f reaches its maximum value, resulting in the largest downward resonance shift.
The metallic disk also alters the current distribution on the SRR. As the disk moves over different regions of the resonator, the magnetic field generated by the SRR current induces surface currents on the disk and changes the local magnetic field, thereby affecting the equivalent inductance of the resonator:
L e f f = L 0 + Δ L θ
Here, L 0 denotes the intrinsic inductance, while Δ L θ represents the inductive perturbation caused by the disk. This contribution is weaker than the capacitive perturbation at the split, but it becomes relevant when the disk is located away from that region and the effective current path and port coupling state are modified.
In addition to perturbing the SRR resonance, the disk modifies the coupling between the SRR and the microstrip lines, thereby affecting power distribution among different ports. This produces complementary variations across multiple transmission and reflection S-parameter channels.
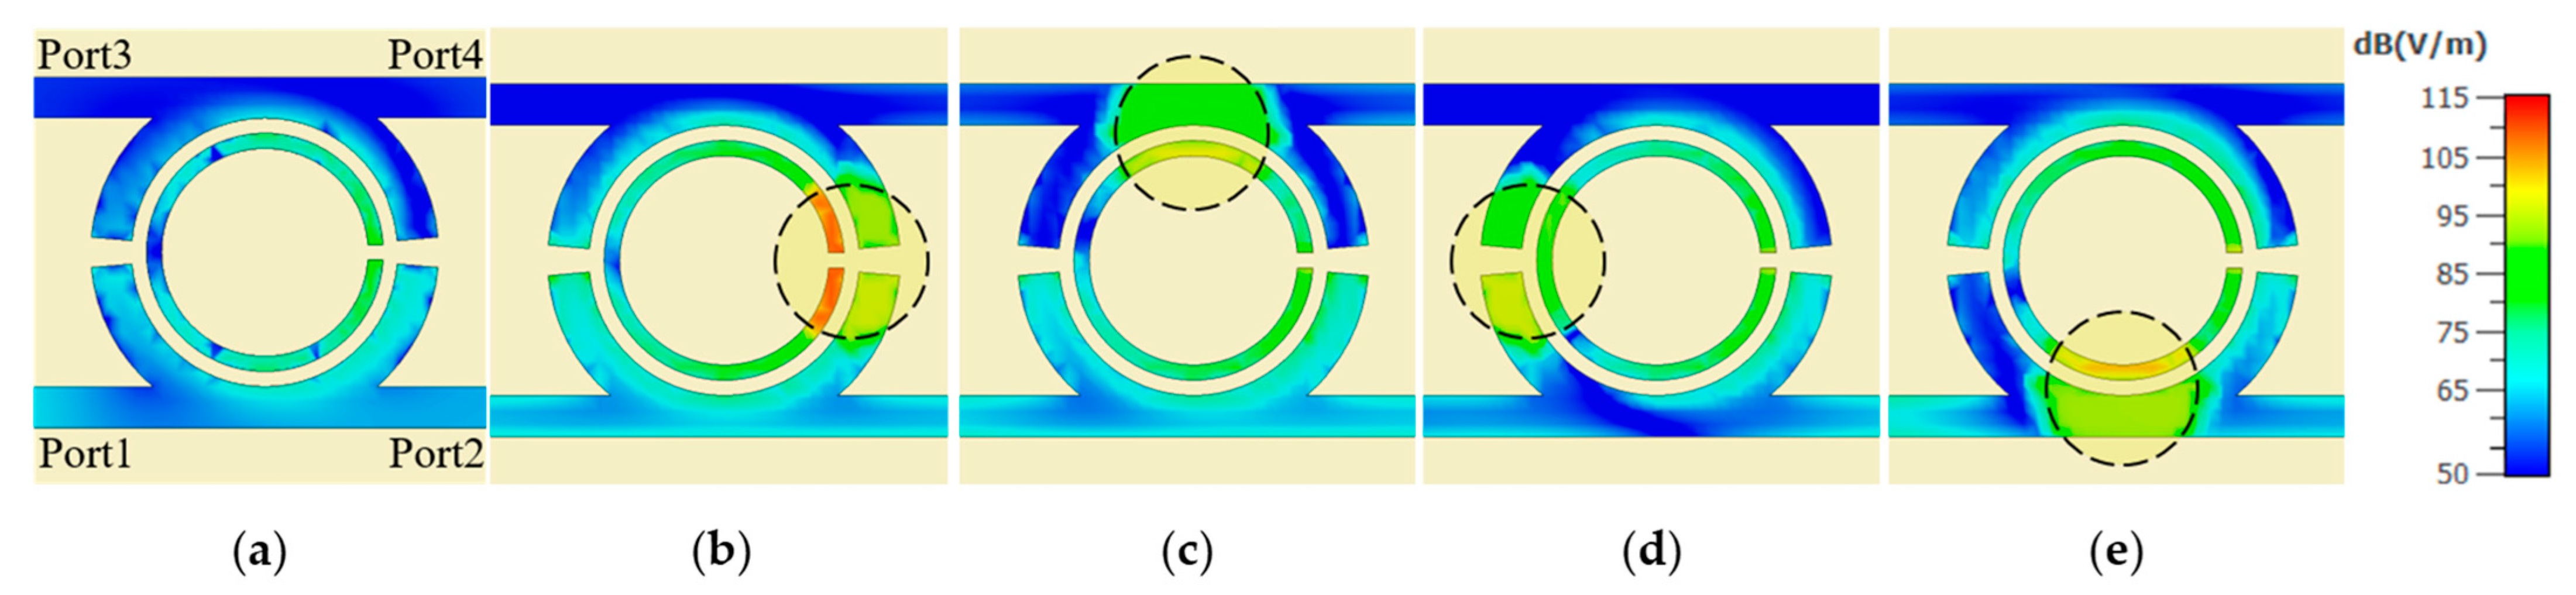
Figure 3 provides field evidence for the mechanism described above. Without the disk, the electric field is mainly concentrated around the SRR split. When the disk approaches the split, the floating conductor strongly perturbs this localized field and introduces an additional capacitive loading path. As the disk moves away from the split, this capacitive loading weakens, while changes in the current redistribution along the ring and the coupling variations become increasingly significant, leading to an upward shift of the resonant frequency.
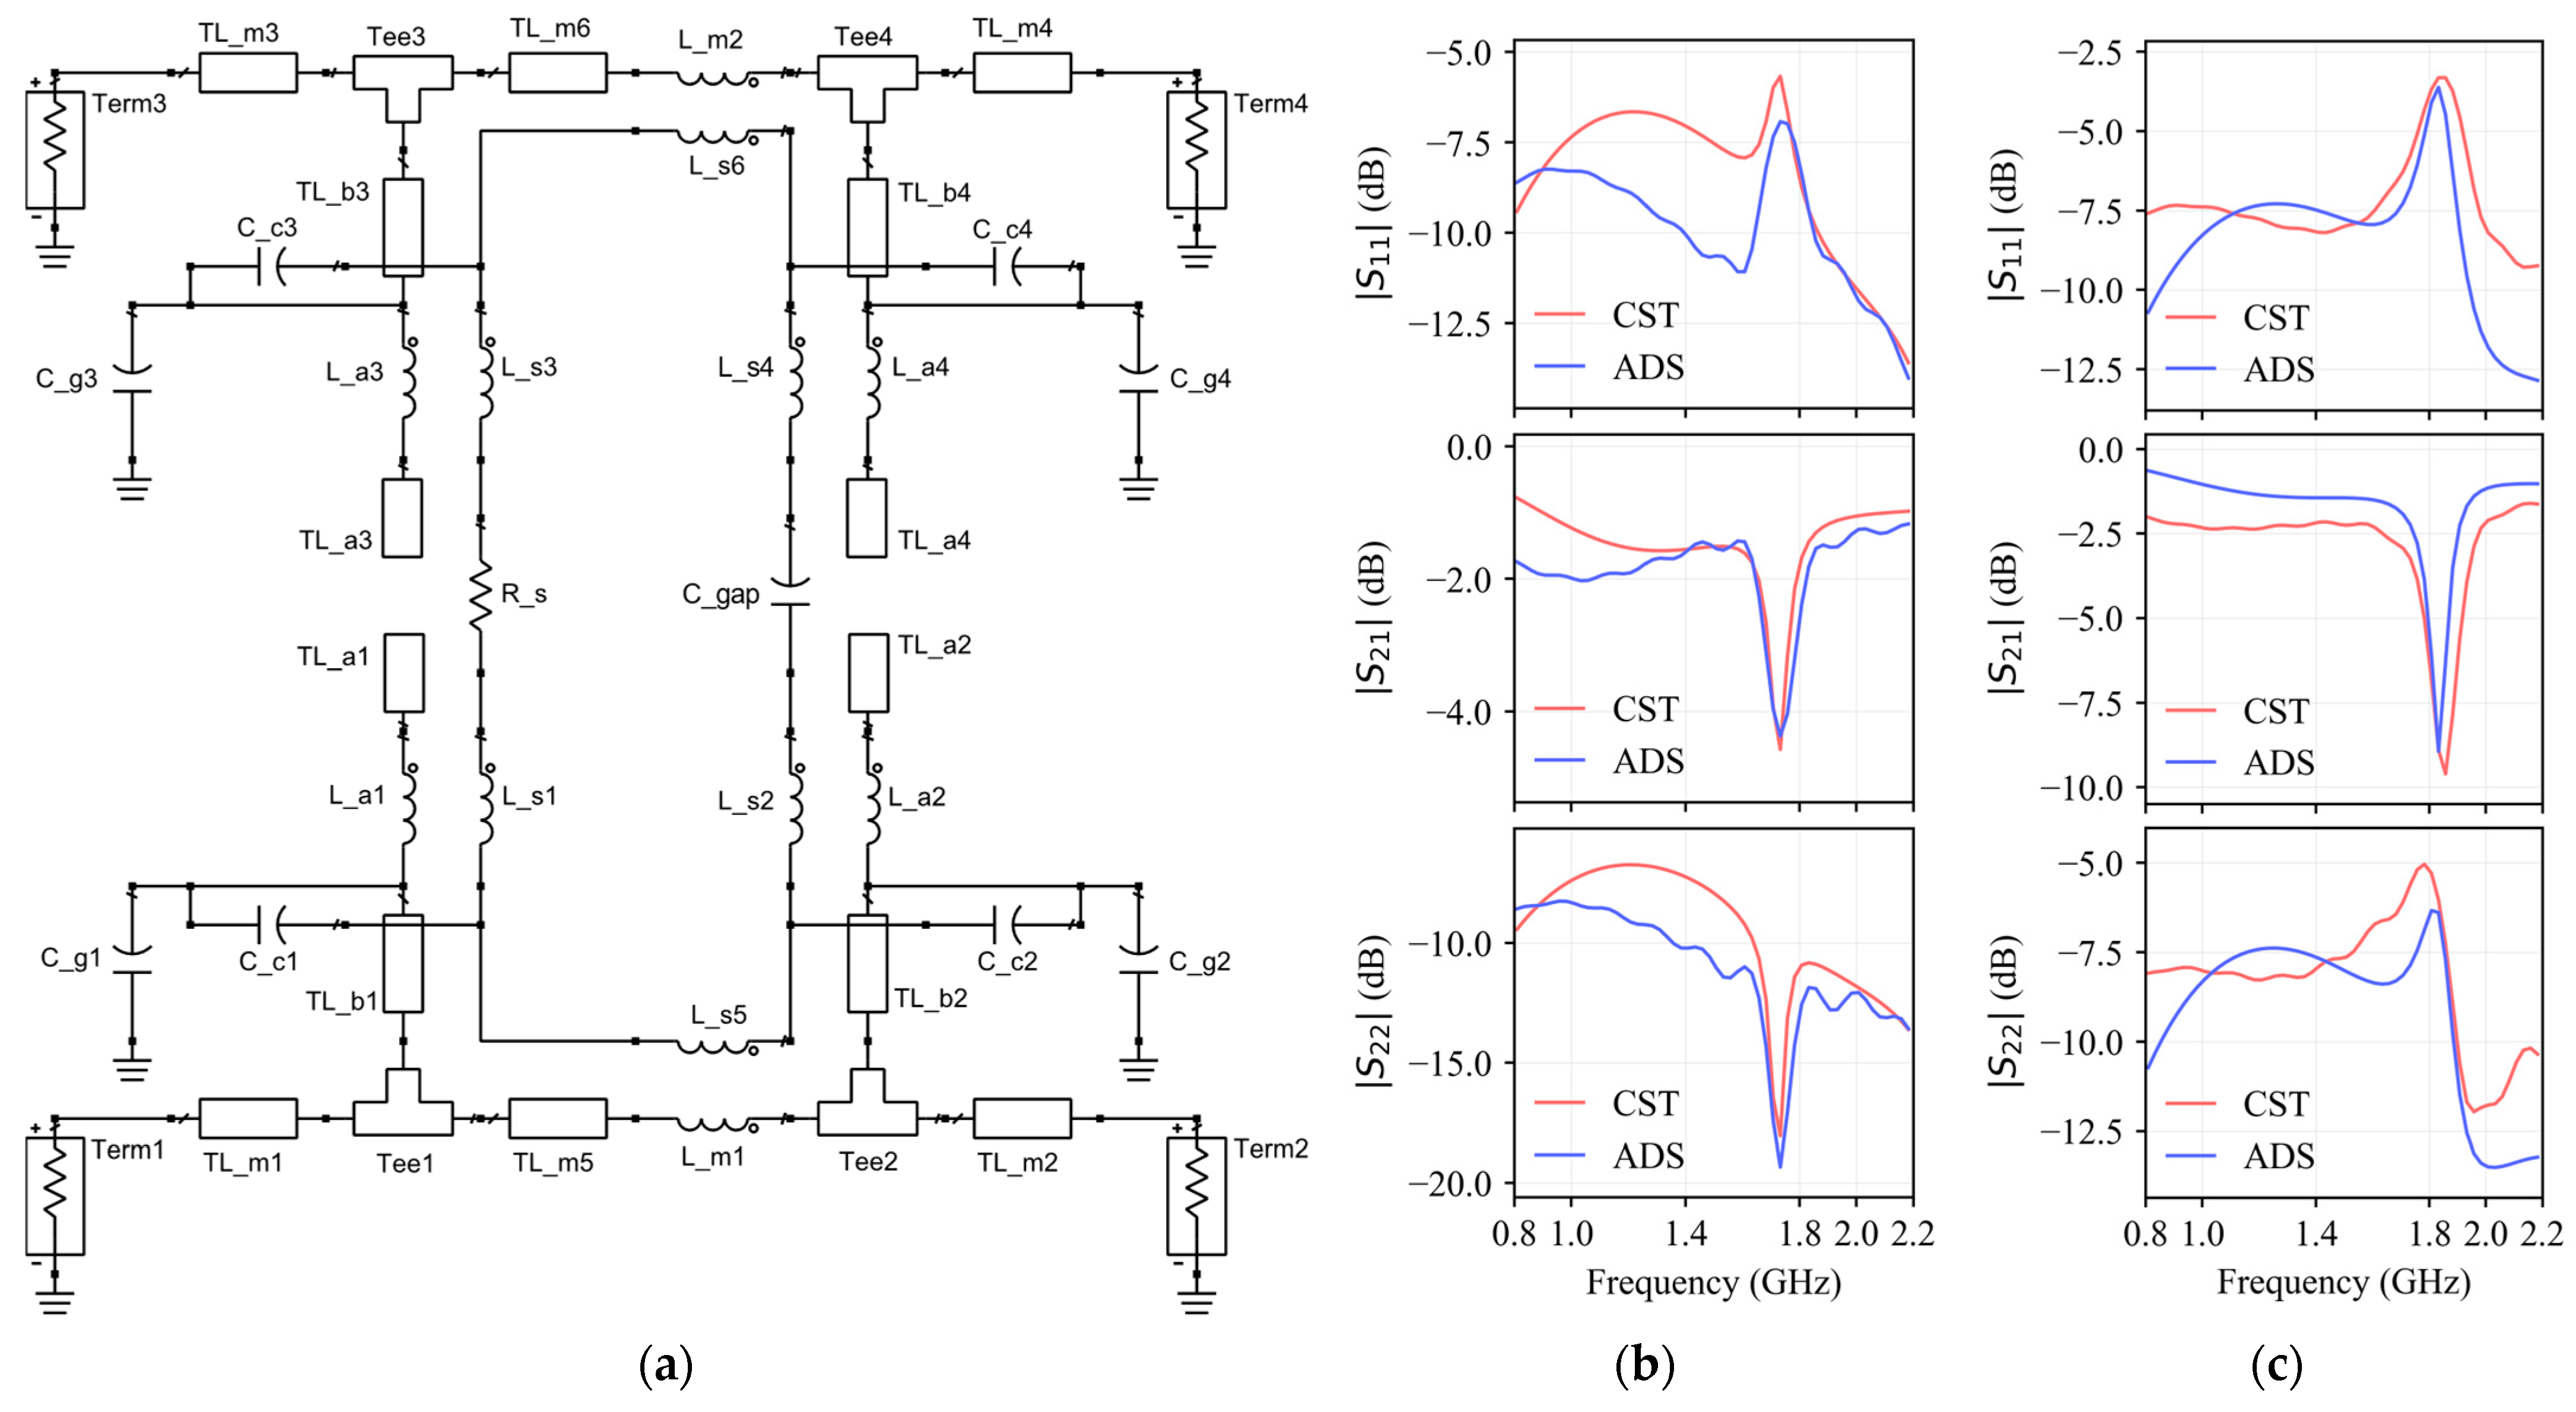
To further clarify the operating mechanism of the sensing structure, an ADS equivalent circuit model was established, as shown in Figure 4a. The model represents the background transmission paths, the SRR resonant branch, and the principal coupling paths using transmission line sections, lumped inductive and capacitive elements, and mutual couplings [11].
For different angular positions, the overall circuit topology, substrate properties and geometry related parameters of the microstrip and coupling structures were kept unchanged, while the local inductive and capacitive parameters associated with the SRR perturbation were adjusted to represent the angular variations. The substrate parameters were configured with H = 1.6   m m , ε r = 4.2 , T = 35   μ m , and t a n δ = 0.02 . The width of the microstrip lines and coupling arms was fixed at 2.7   m m . The connection topology of the mutual inductors (Mutual1–Mutual6) remained unchanged, with a constant coupling coefficient of K = 0.234 .
Figure 4b,c compare the ADS circuit simulations with the corresponding CST results for representative cases. Their agreement in the principal resonance locations and response trends indicates that the equivalent circuit captures the dominant angle-dependent behavior of the sensing structure. Table 2 summarizes the fitted effective parameters at four representative disk angles and provides a circuit level view of the capacitance and coupling changes associated with disk motion.
The capacitance-related parameters exhibit the strongest variation when the disk approaches the SRR split. For example, C1 decreases from 0.350 pF at 0 degrees to 0.155 pF at 180 degrees, reflecting the weakening of the effective capacitive perturbation as the disk moves away from the localized high field region.
At positions away from the split, variations in the effective inductive and auxiliary coupling parameters become more evident, consistent with the current redistribution and coupling changes indicated by the CST field results.
The ADS equivalent circuit model provides a compact circuit level interpretation of the distributed electromagnetic perturbation and helps explain the observed angle-dependent spectral variations. By retaining the interface together with the principal transmission line and coupling paths, the model can be incorporated with surrounding RF circuit models for rapid preliminary evaluation of integrated configurations. Candidate configurations can then be refined by CST full wave simulations to account for the detailed 3D geometry and distributed electromagnetic effects, thereby supporting more efficient joint design of the sensor and RF circuits.


3. Experiment and Measurement

3.1. Experiment Setup

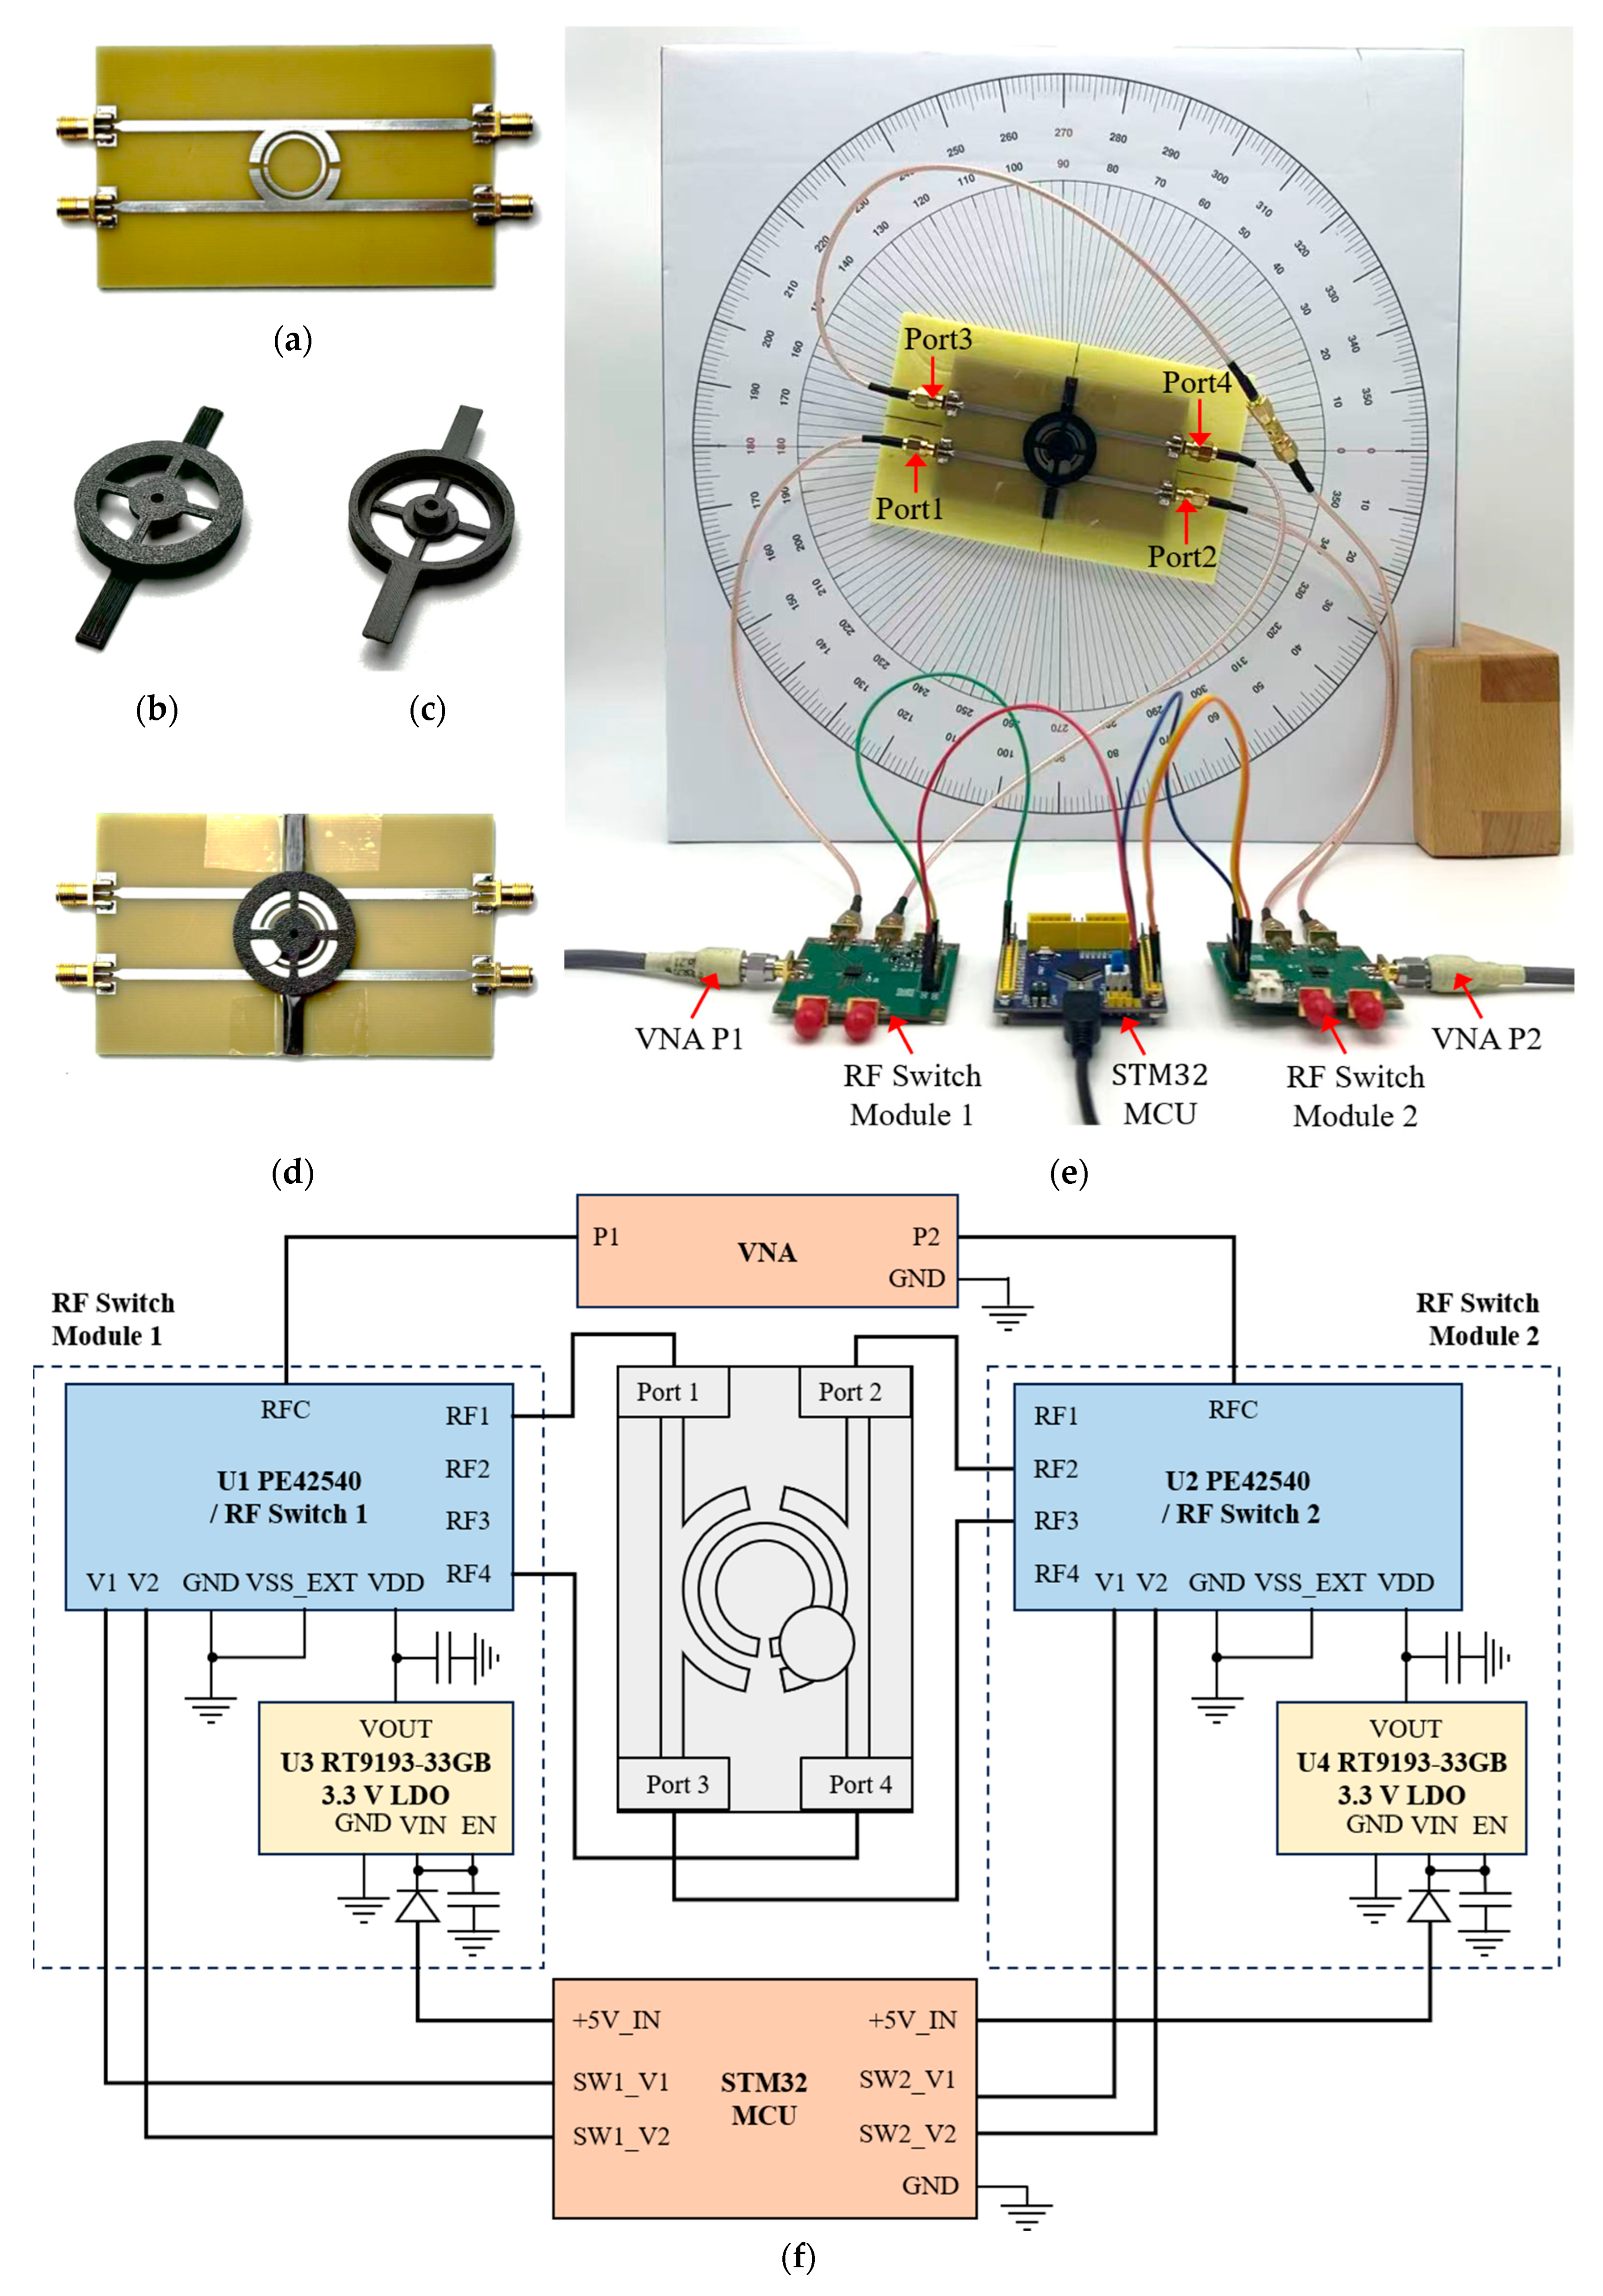
A prototype of the microstrip–SRR structure was fabricated using printed circuit board (PCB) technology. As shown in Figure 5a, the sensor was implemented on a 1.6 mm thick FR-4 substrate with a 35 μm copper layer. Standard SMA connectors were soldered to the microstrip ports to interface with the measurement equipment.
As shown in Figure 5d, the dielectric guide structure fabricated from PLA by 3D printing (see Figure 5b,c) holds the metallic disk above the SRR. The structure incorporates a guide groove that constrains the disk to move along a predefined circular trajectory. A thin insulating PET tape layer is inserted between the disk and the PCB surface to maintain a stable vertical separation. The angular loading and mounting arrangement is presented in Figure 5e. The assembled sensor prototype was mounted on a yellow reference board marked with vertical and horizontal centerlines for alignment. The prescribed angular positions were set according to the marked scale on the white board.
The fabricated sensor prototype was measured using a vector network analyzer (VNA, 3674G, Ceyear Technologies Co., Ltd., Qingdao, China) over the frequency range of 0.8–2.2 GHz, with 56 frequency samples for each S-parameter trace. Since the VNA provides only two measurement ports, two pSemi PE42540 absorptive SP4T RF switches (PE42540, pSemi Corporation, San Diego, CA, USA) were employed to construct an automatic switching network for selection among the four sensor ports. Figure 5f shows the connection configuration of the measurement system, including the VNA, RF switches, and sensor ports. The two VNA ports are connected to the common terminals of the RF switches, and different switch states are used to acquire the required S-parameter channels. Each switch utilizes two RF connection branches in the proposed configuration and is independently controlled by four 3.3 V logic signals generated by an STM32 microcontroller (STMicroelectronics, Geneva, Switzerland).
The PE42540 operates over the frequency range from 10 Hz to 8 GHz, covering the measurement band of 0.8–2.2 GHz. In the assembled circuit, the maximum insertion loss within the measurement band is approximately 1.61 dB, and good consistency is observed among the switching channels. Therefore, the switching network introduces minimal influence on the spectral descriptors used for angle reconstruction.
This system architecture supports automated measurement of eight S-parameters ( S 11 , S 12 , S 13 , S 22 , S 24 , S 33 , S 34 , and S 44 ). At each angular position, four reflection terms and four directional transmission terms were recorded. All measurements were performed using identical frequency sweep settings, port configurations and calibration references. Standard calibration was conducted prior to measurement to minimize systematic errors caused by cables, connectors, and RF switches.
Four datasets were collected, one at 2.5° angular intervals and three at 10° intervals. Each 10° scan contains 36 unique angular positions, while the 2.5° scan contains 144. Because −180° and 180° represent the same physical direction, they were treated as a single angular position during data organization and model evaluation to avoid duplicate counting. All reconstruction errors were calculated using circular angular distance to avoid discontinuity at the −180°/180° boundary.

3.2. Data Feature Extraction

To convert the measured microwave spectra into quantitative inputs for angle reconstruction, spectral descriptors were extracted from the measurement band of each selected S-parameter channel. This frequency range contains the dominant resonance variations induced by the metallic disk over the full angular movement, enabling effective characterization of angle-dependent spectral descriptors while reducing the influence of background fluctuations on feature extraction.
Depending on the spectral morphology of each S-parameter channel, the following descriptors were extracted: valley frequency S i j v f , valley magnitude S i j v d , averaged response within the band S i j m , peak frequency S i j p f , and peak magnitude S i j p v . Here, i is the excitation port index and j is the output port index. v f denotes the valley frequency descriptor within the measurement band. v d is the valley magnitude. m is the mean magnitude response over the measurement band. p f is the peak frequency descriptor, and p v the peak magnitude. Peak and valley frequencies and magnitudes describe resonance shifts and local amplitude modulation caused by disk rotation, whereas the mean magnitude response reflects changes in the transmission or reflection level and supplements the distinction between angular positions with similar peak or valley frequencies.
As demonstrated in Table 3, a fixed candidate pool of 24 spectral descriptors is constructed based on the eight S-parameter channels described above. Subsequent angle reconstruction models select their input subsets from this fixed descriptor pool, as outlined in Section 3.3.
Among these descriptors, S 22 v f , S 44 v f , S 22 v d , S 44 v d , S 11 m , S 12 m , S 13 m , S 22 m , S 24 m , S 33 m , S 34 m , and S 44 m can be reliably extracted over the full angular range and can therefore support basic global angle prediction or angular region classification. These 12 descriptors are defined as the global descriptor set and are hereafter referred to as the 12 global descriptors.

3.3. Angle Reconstruction

3.3.1. Model Rationale and Overall Architecture

Measurements over the full angular range show that the spectral descriptors derived from different S-parameter responses exhibit distinct local variation patterns. Their sensitivity, trends, and stability vary with the angular position of the metallic disk, indicating that the most informative descriptors differ among angular regions. A single global regression model is therefore insufficient to represent these heterogeneous response patterns effectively.
To address these regional nonlinearities, a mixture-of-experts (MoE) model is adopted to divide the angular domain into local regions and assign samples to specialized models through a gating mechanism. Meanwhile, Gaussian process regression (GPR) provides effective nonlinear modeling capability with a limited number of training samples [12,13,14]. The regional modeling capability of MoE and the nonlinear regression capability of GPR provide the basis for modeling the local angular responses of the spectral descriptors in this work.
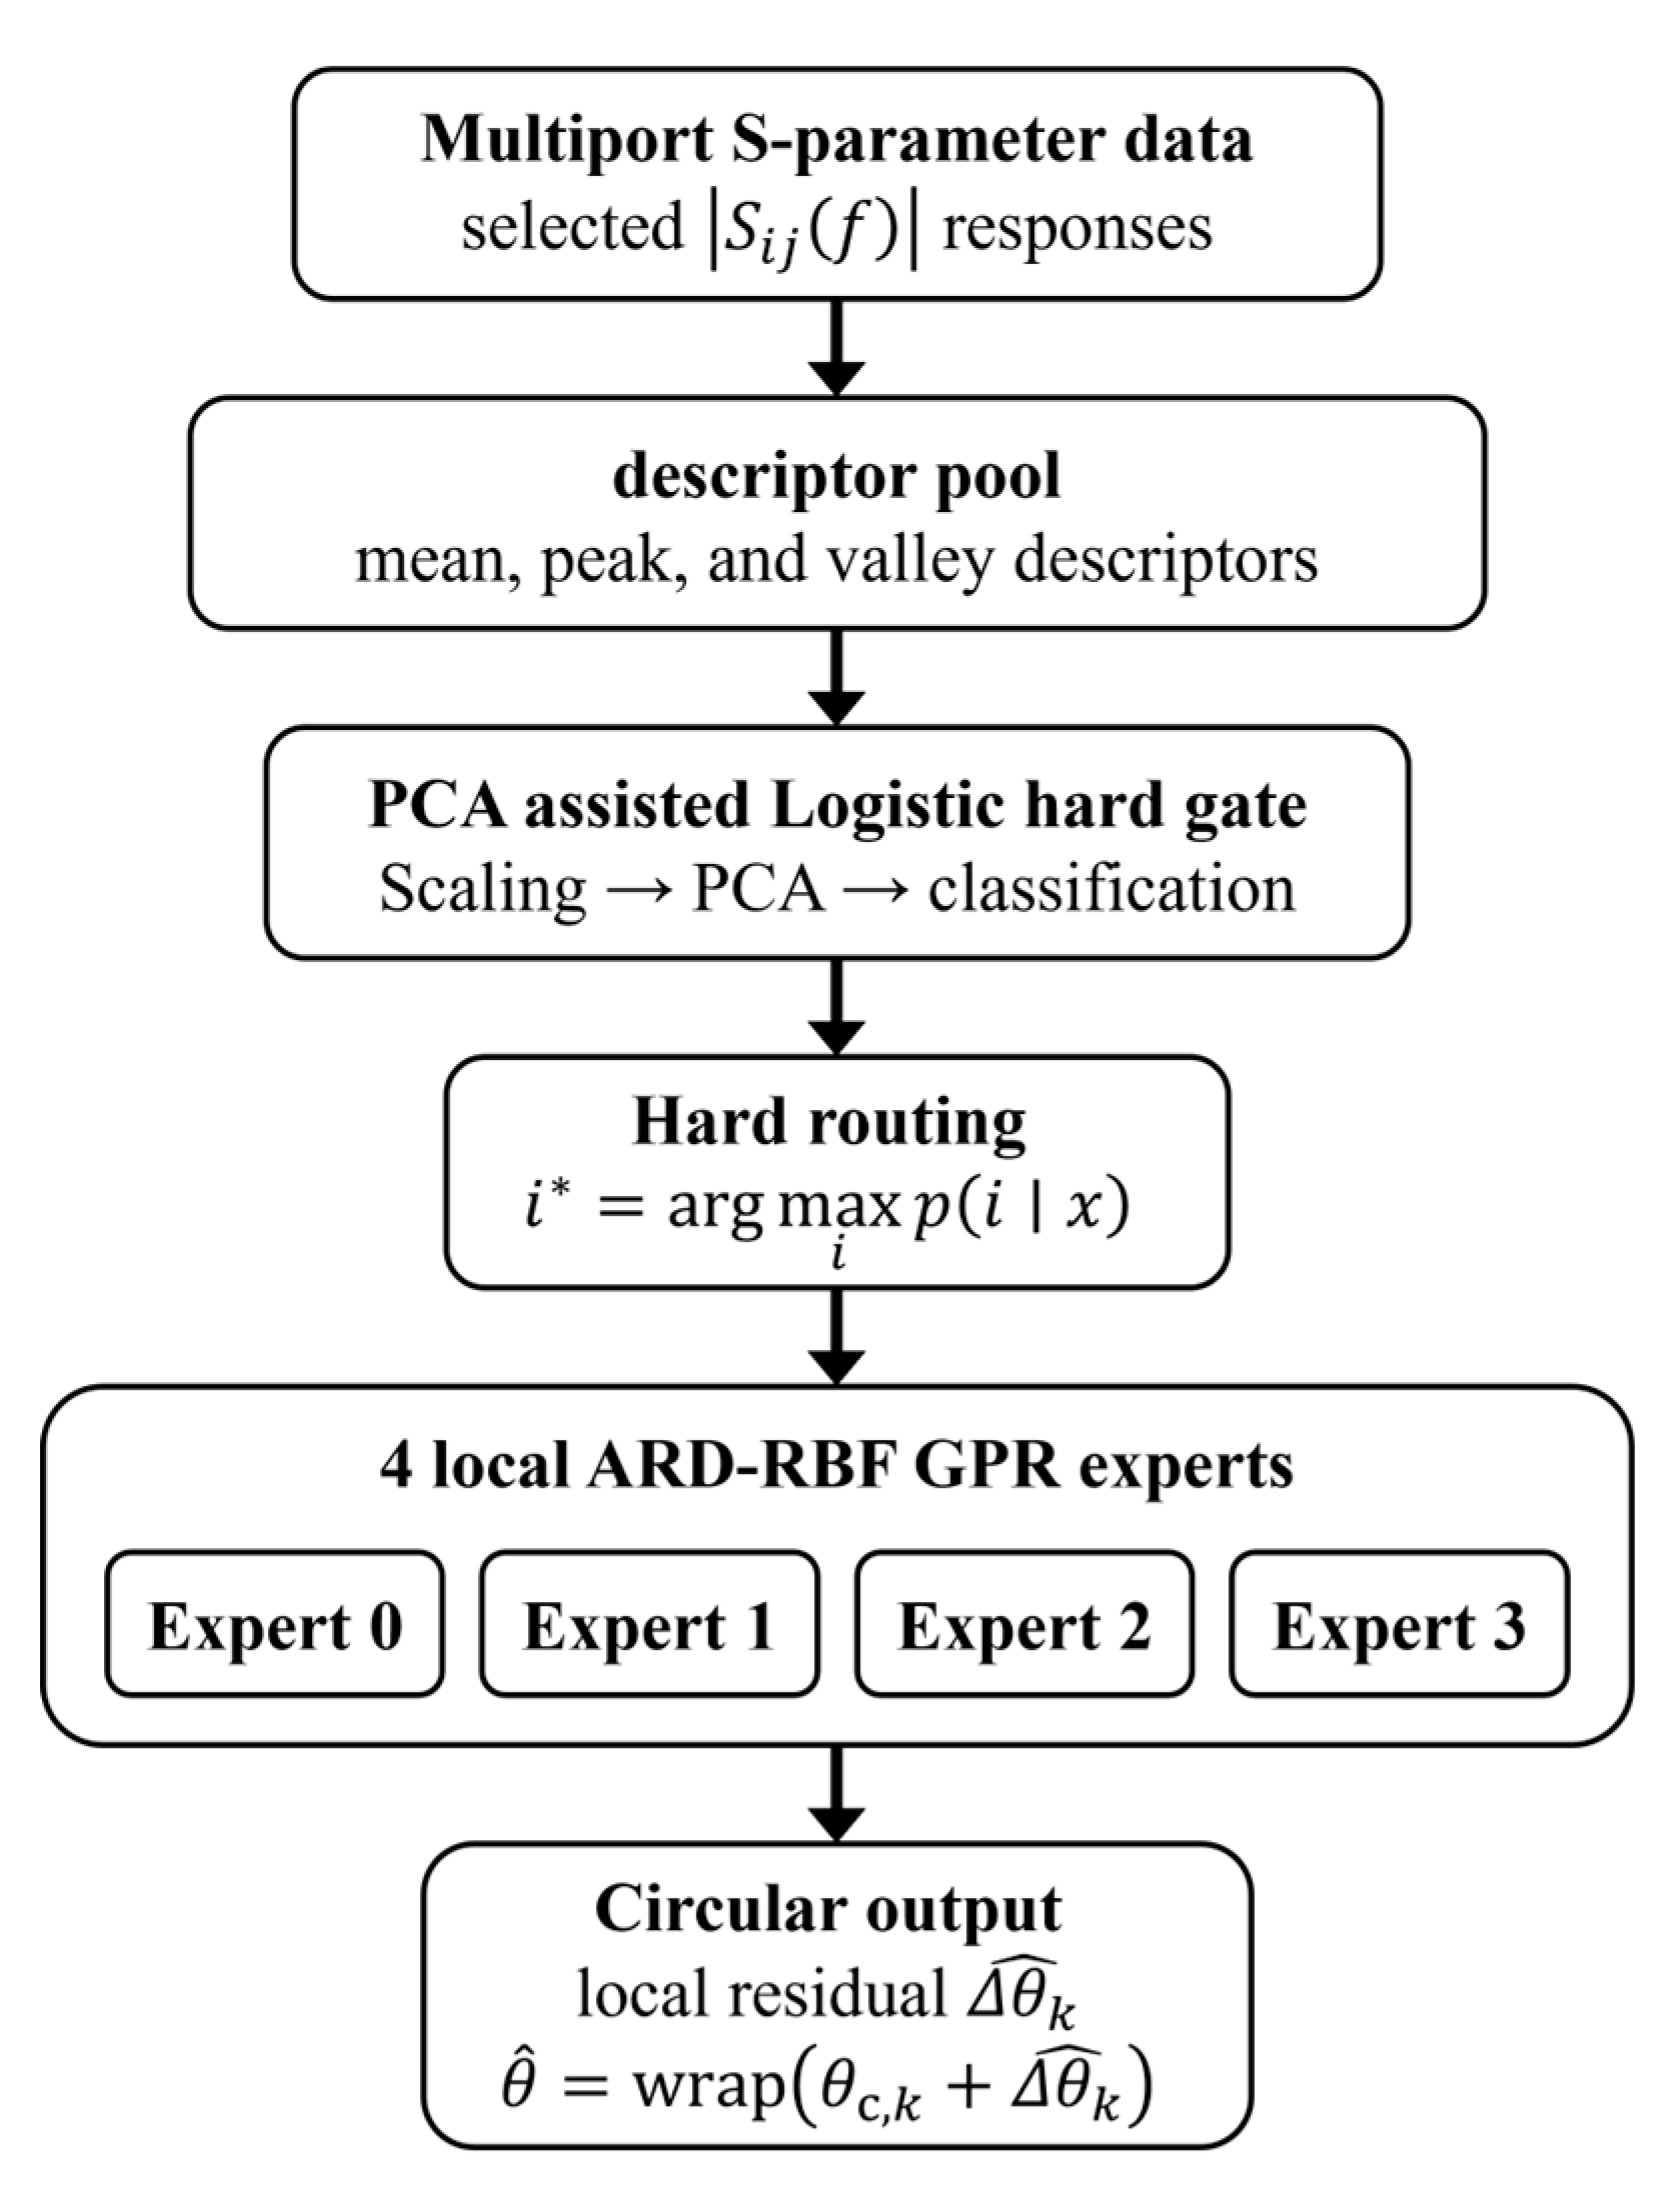
Inspired by these methods, this work develops an MoE-GPR framework for attitude angle reconstruction. As shown in Figure 6, the proposed MoE-GPR framework consists of four stages: spectral descriptor extraction, expert routing, local circular residual regression, and circular angle reconstruction. First, the global descriptors are preprocessed and supplied to the PCA assisted logistic hard gate, which assigns each sample to the most probable local expert through hard routing. The selected local GPR expert then uses a descriptor subset defined for that expert, hereafter referred to as the expert descriptor subset, to predict the shortest signed circular residual relative to its reference center. The final attitude angle is obtained by adding the predicted residual to the reference center and wrapping the result into the circular angular range.

3.3.2. Global Routing and Local Expert Regression

The extracted spectral descriptors contain angular information in different forms and on different scales. According to their functions in the MoE-GPR framework, they are divided into global descriptors for expert routing and expert-specific descriptors for local circular residual regression. The global descriptors must provide stable information over the full angular range for gate classification, whereas the expert-specific descriptors are selected to preserve local continuity and discrimination within each angular region.
Before being used for the PCA assisted logistic hard gate and the local GPR experts, all descriptors are standardized to eliminate numerical scale differences caused by their different physical meanings and units. The scaler parameters are calculated only from the training data within each split, ensuring that the test data do not affect the preprocessing. This preprocessing preserves their relative variations with angle while providing scale consistent inputs for subsequent PCA projection and GPR modeling.
The PCA assisted logistic hard gate uses the 12 global descriptors. After standardization, PCA projects the descriptors onto three principal components, thereby compressing correlated information and reducing input redundancy [15]. The 3D PCA scores are then supplied to an L2 regularized four class logistic regression model to estimate expert probabilities. During inference, each sample is assigned to the expert with the highest probability through hard routing. The scaler, PCA transformation, and classifier are fitted within training splits to prevent the test data from influencing the PCA representation or classification boundaries.
To improve prediction stability near the hard routing boundaries, each local GPR expert was trained using an expanded angular range that includes samples on both sides of its nominal partition boundary. The expert-specific descriptors were selected from the 24 candidate descriptors based on their repeatability, redundancy, and local predictive capability within the corresponding angular regions. Table 4 summarizes the configuration of the four local experts, including their reference centers, expanded training ranges, and selected input descriptors.
Angles are typically represented within (−180°,180°]. However, this linear representation introduces an artificial discontinuity because −180° and 180° correspond to adjacent physical orientations [16]. Direct regression of absolute angles would therefore reduce continuity near the circular boundary. To address this issue, each local GPR expert predicts the shortest signed circular residual between the target angle and its reference center. For expert k, the regression target is defined as
Δ θ k = w r a p θ θ c , k
where θ c , k is the circular residual reference center of local GPR expert k, and w r a p ( · ) maps an angle into ( 180 ° , 180 ° ] . After the local circular residual is predicted, it is added to the corresponding reference center, followed by another circular mapping operation:
θ ^ = w r a p θ c , k + Δ θ k ^
With this circular residual representation, each local GPR expert only models a continuous local response within its expanded angular range. It does not need to directly model the nonmonotonic mapping over the full circle, and avoids the discontinuity at the circular boundary. This formulation simplifies the regression target and improves the continuity of the reconstructed angle near the −180°/180° boundary.

3.3.3. Controlled Ablation and Evaluation Protocols

To systematically evaluate the contribution of each component in the proposed MoE-GPR framework, controlled baseline and ablation experiments were designed as summarized in Table 5. All configurations use the same outer training/test splits, circular error definition, and GPR modeling procedure to ensure a fair comparison. Traditional machine learning models, including support vector regression (SVR), random forest regression (RF), and k-nearest neighbor regression (KNN), are first introduced as global regression baselines. A global Gaussian process regression (Global GPR) model is further adopted as a stronger nonlinear baseline for comparison with the proposed local expert framework.
Starting from the Global GPR baseline (B0), three successive modifications are introduced to construct the final MoE-GPR model. B1 incorporates a PCA assisted logistic hard gate and four local GPR experts to evaluate the effect of angular domain decomposition. B2 replaces the shared global descriptors with expert-specific descriptors while keeping the routing strategy unchanged, allowing the contribution of local feature adaptation to be isolated. B3 further introduces expanded training angle ranges around routing boundaries to improve local regression stability. Therefore, comparisons between adjacent configurations isolate the effects of local expert architecture, expert-specific descriptors, and expanded boundary training ranges.
After model development, the global descriptors, the expert-specific descriptors, circular residual reference centers, routing regions, and the expanded training ranges are fixed. All the configurations use the same outer data splits, circular error definition, and GPR modeling procedure. Within each outer training split, feature standardization, PCA transformation, logistic classification, and GPR model fitting are performed using only the training data, while the test data are excluded from all parameter estimation.
Two evaluation protocols were adopted. First, LOAO evaluation was performed on the dataset sampled at 2.5° intervals to assess interpolation capability within the same sampling domain. For LOAO evaluation, the sample corresponding to the target angle was completely excluded from the training set in each fold. Second, the models were trained using the three datasets sampled at 10° intervals and tested on the dataset sampled at 2.5° intervals to evaluate robustness under different sampling and acquisition conditions, and this protocol is hereafter referred to as cross-sampling evaluation.
Reconstruction errors were calculated using circular angular distance to avoid discontinuity at the −180°/180° boundary. Mean absolute error (MAE), root mean square error (RMSE), 90th percentile error (P90), and maximum error (Max) were reported. Since hard routing may introduce additional uncertainty near expert boundaries, boundary MAE and routing accuracy were additionally evaluated in the LOAO experiment.

4. Results

4.1. Angle-Dependent Resonance Characteristics

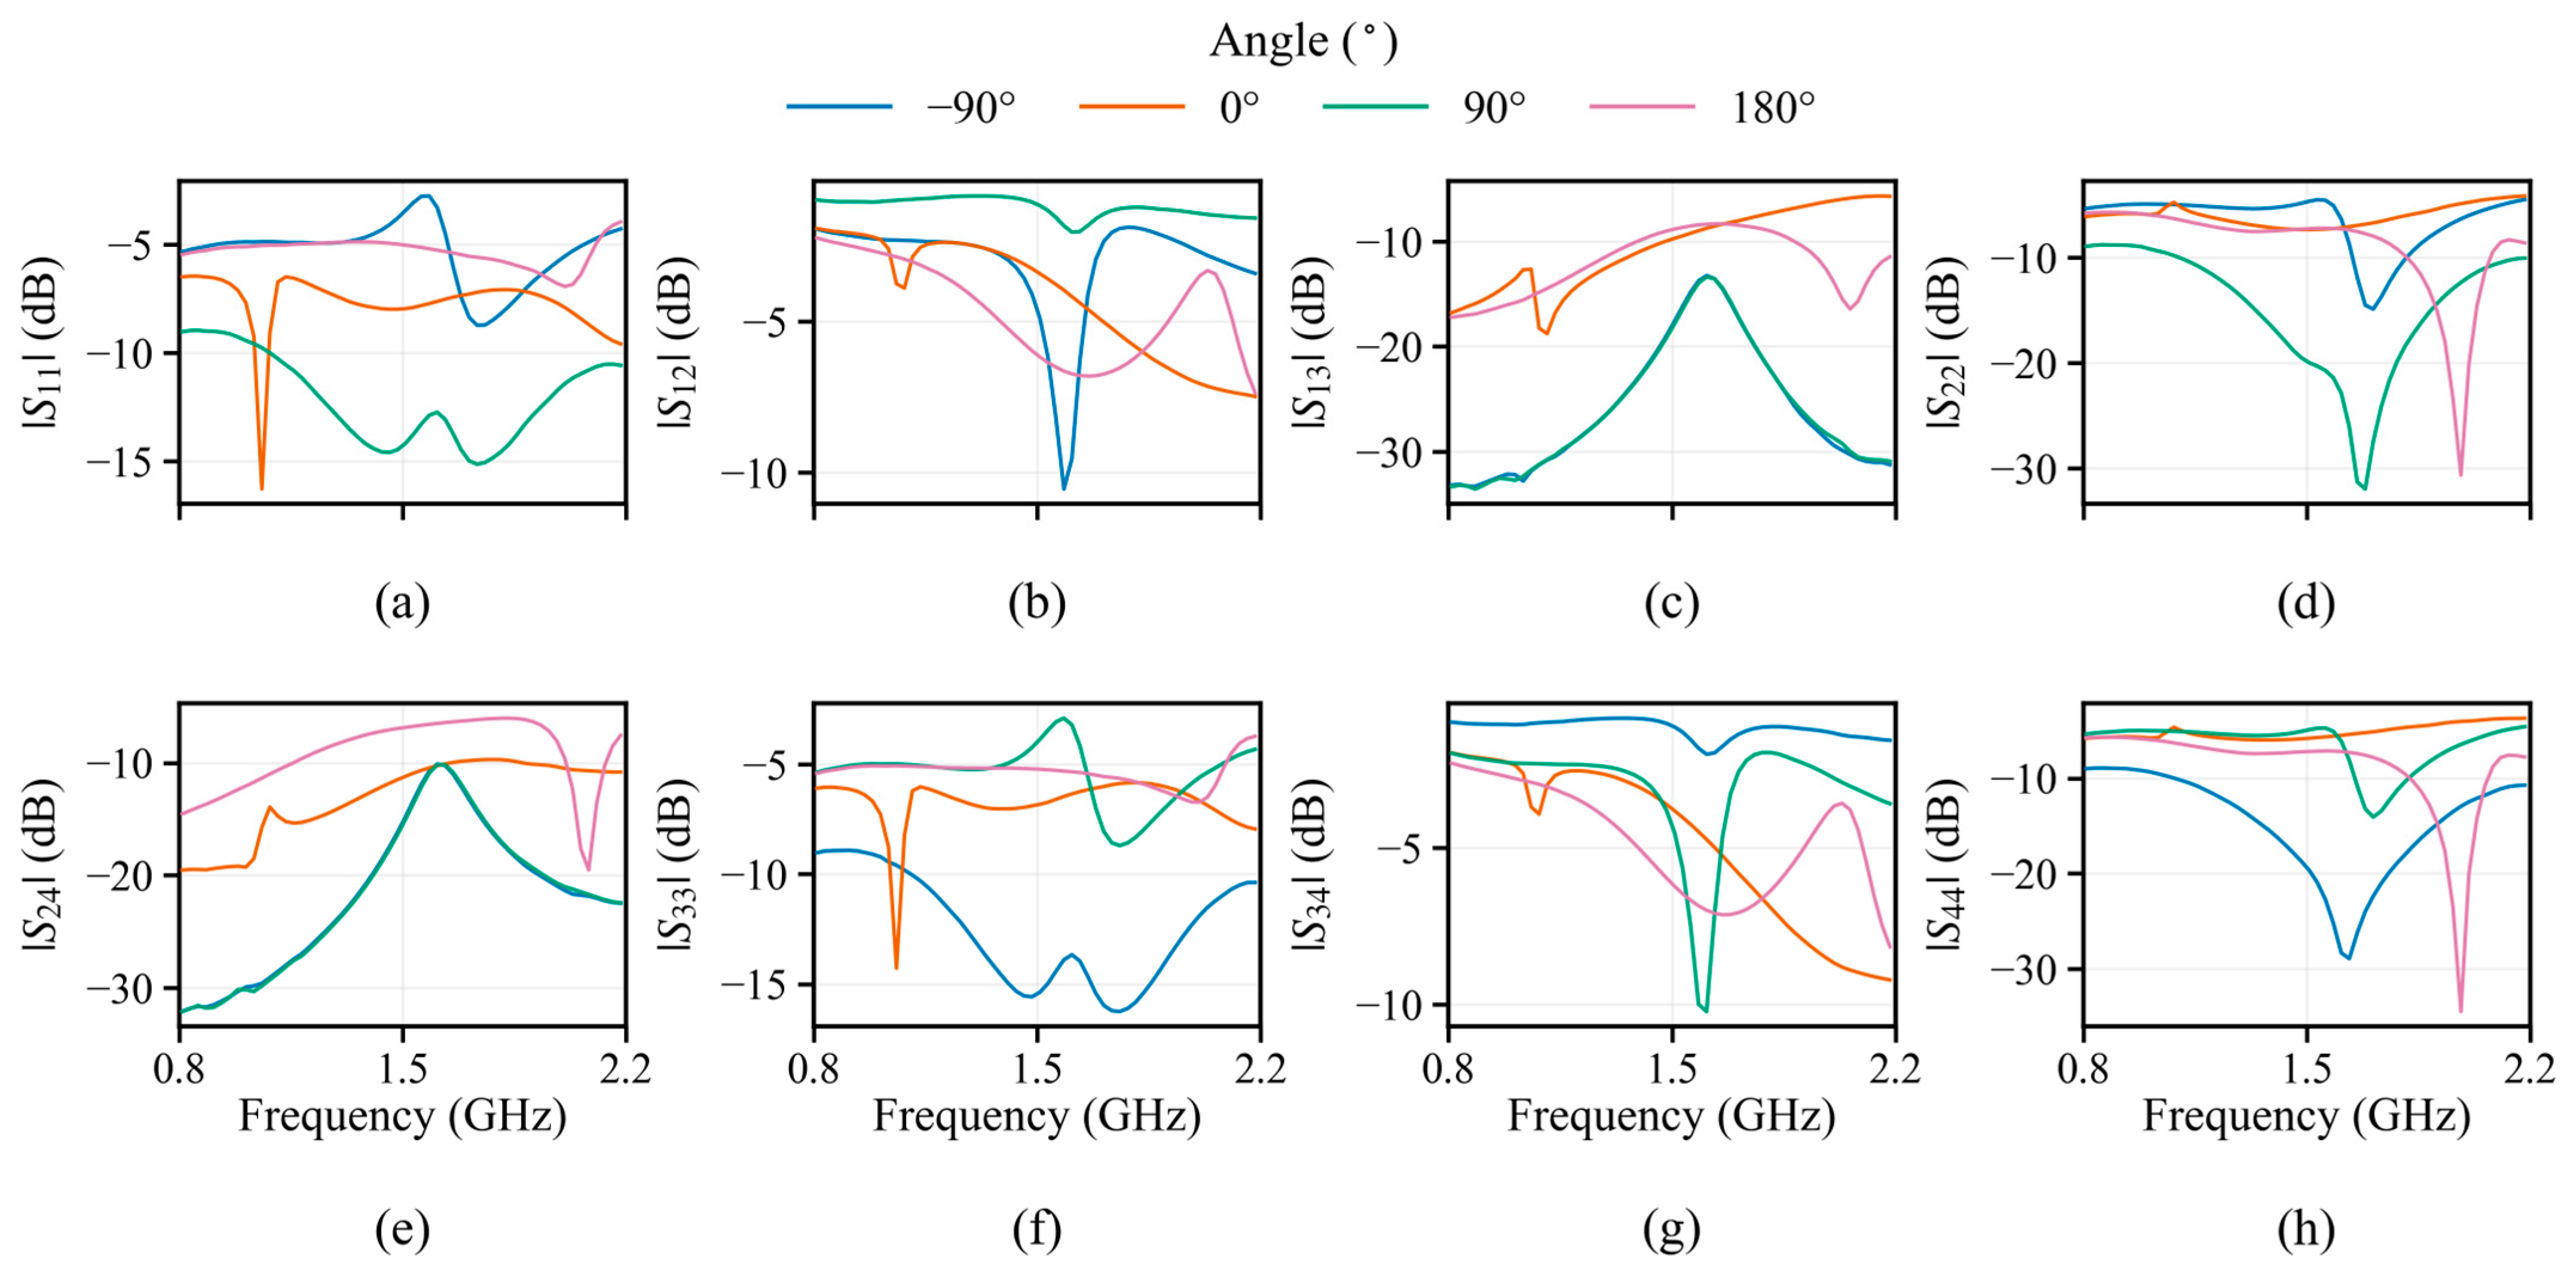
Figure 7 presents the measured responses of S 11 , S 12 ,   S 13 ,   S 22 ,   S 24 ,   S 33 ,   S 34 , and S 44 . As can be seen from the figure, several S-parameter channels exhibit distinct spectral variations with disk angle. The resonant positions, depths, and background magnitudes of the reflection responses S 11 , S 22 , S 33 , and S 44 vary with angle. Transmission responses such as S 12 and S 24 show local peaks and valleys, resonant envelopes, and amplitude modulation. These observations demonstrate that the rotating metallic disk effectively perturbs the local electromagnetic field distribution, thereby modulating both the equivalent capacitance and inductance of the resonant structure, as well as the coupling strength between ports. This, in turn, engenders measurable microwave responses that are dependent on disk angle.
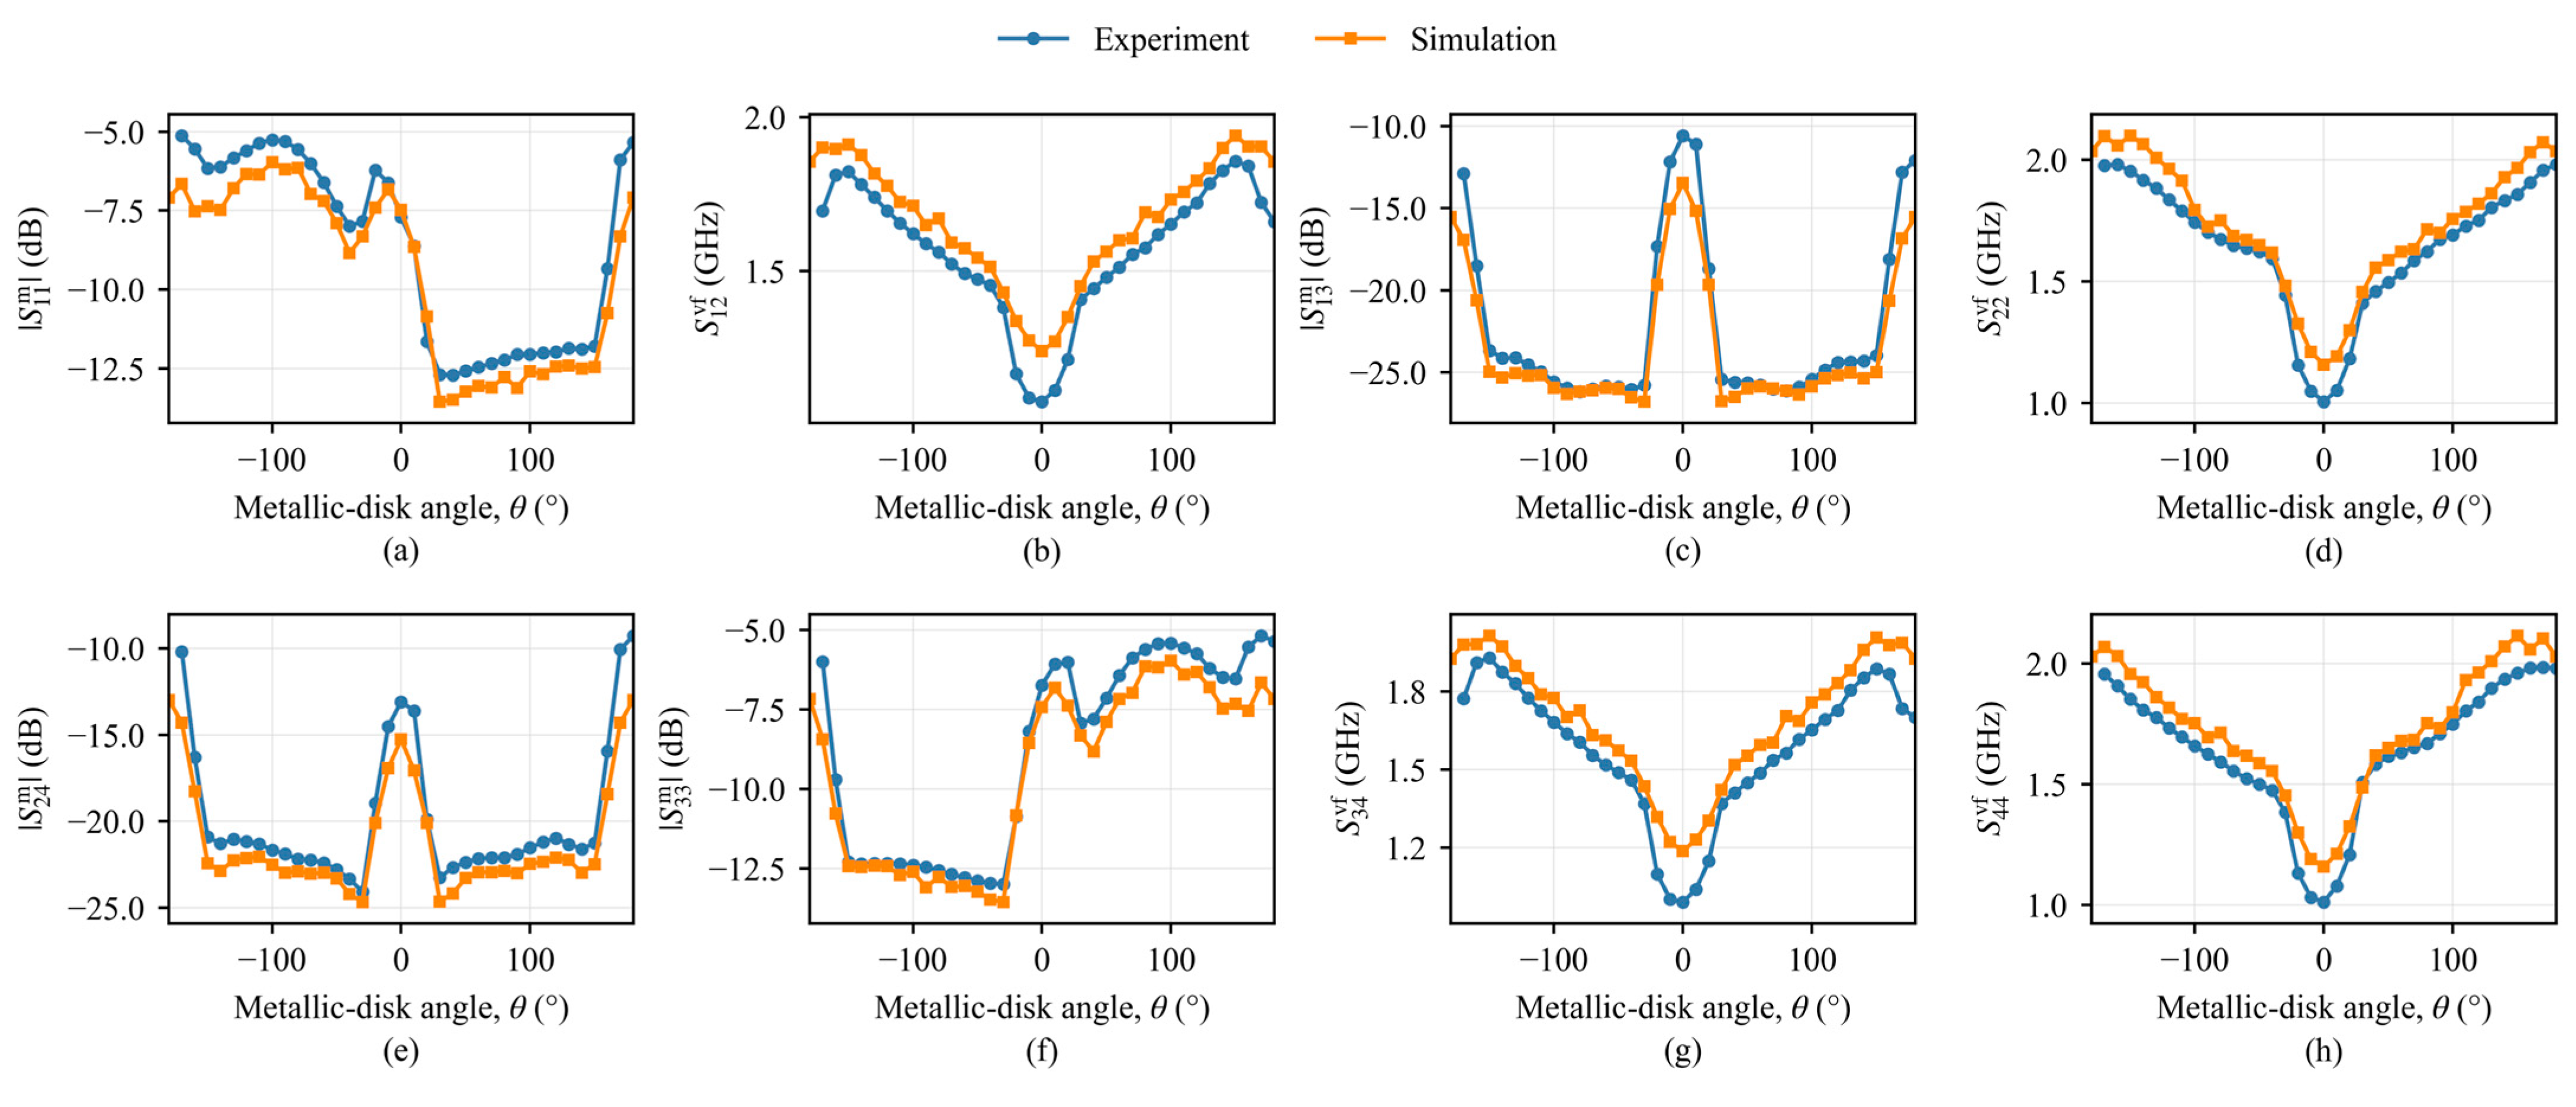
To verify the consistency between the simulated and measured electromagnetic responses, Figure 8 compares several representative spectral descriptors extracted from the CST full wave simulation and experiment. The simulations and experiments demonstrate a broadly consistent principal trend with angle, indicating that the full wave model captures the dominant electromagnetic responses induced by the movement of the metallic disk.
There are certain discrepancies between the experimental and simulation results. These deviations may originate from fabrication tolerances, SMA connector and cable parasites, variations in the gap between the disk and the PCB, and measurement fluctuations. Shallow resonance features are also more sensitive to background noise, which may reduce the stability of descriptor extraction. Nevertheless, the overall trends of the spectral descriptors remain consistent, supporting the validity of the proposed SRR perturbation mechanism for subsequent multichannel spectral reconstruction.
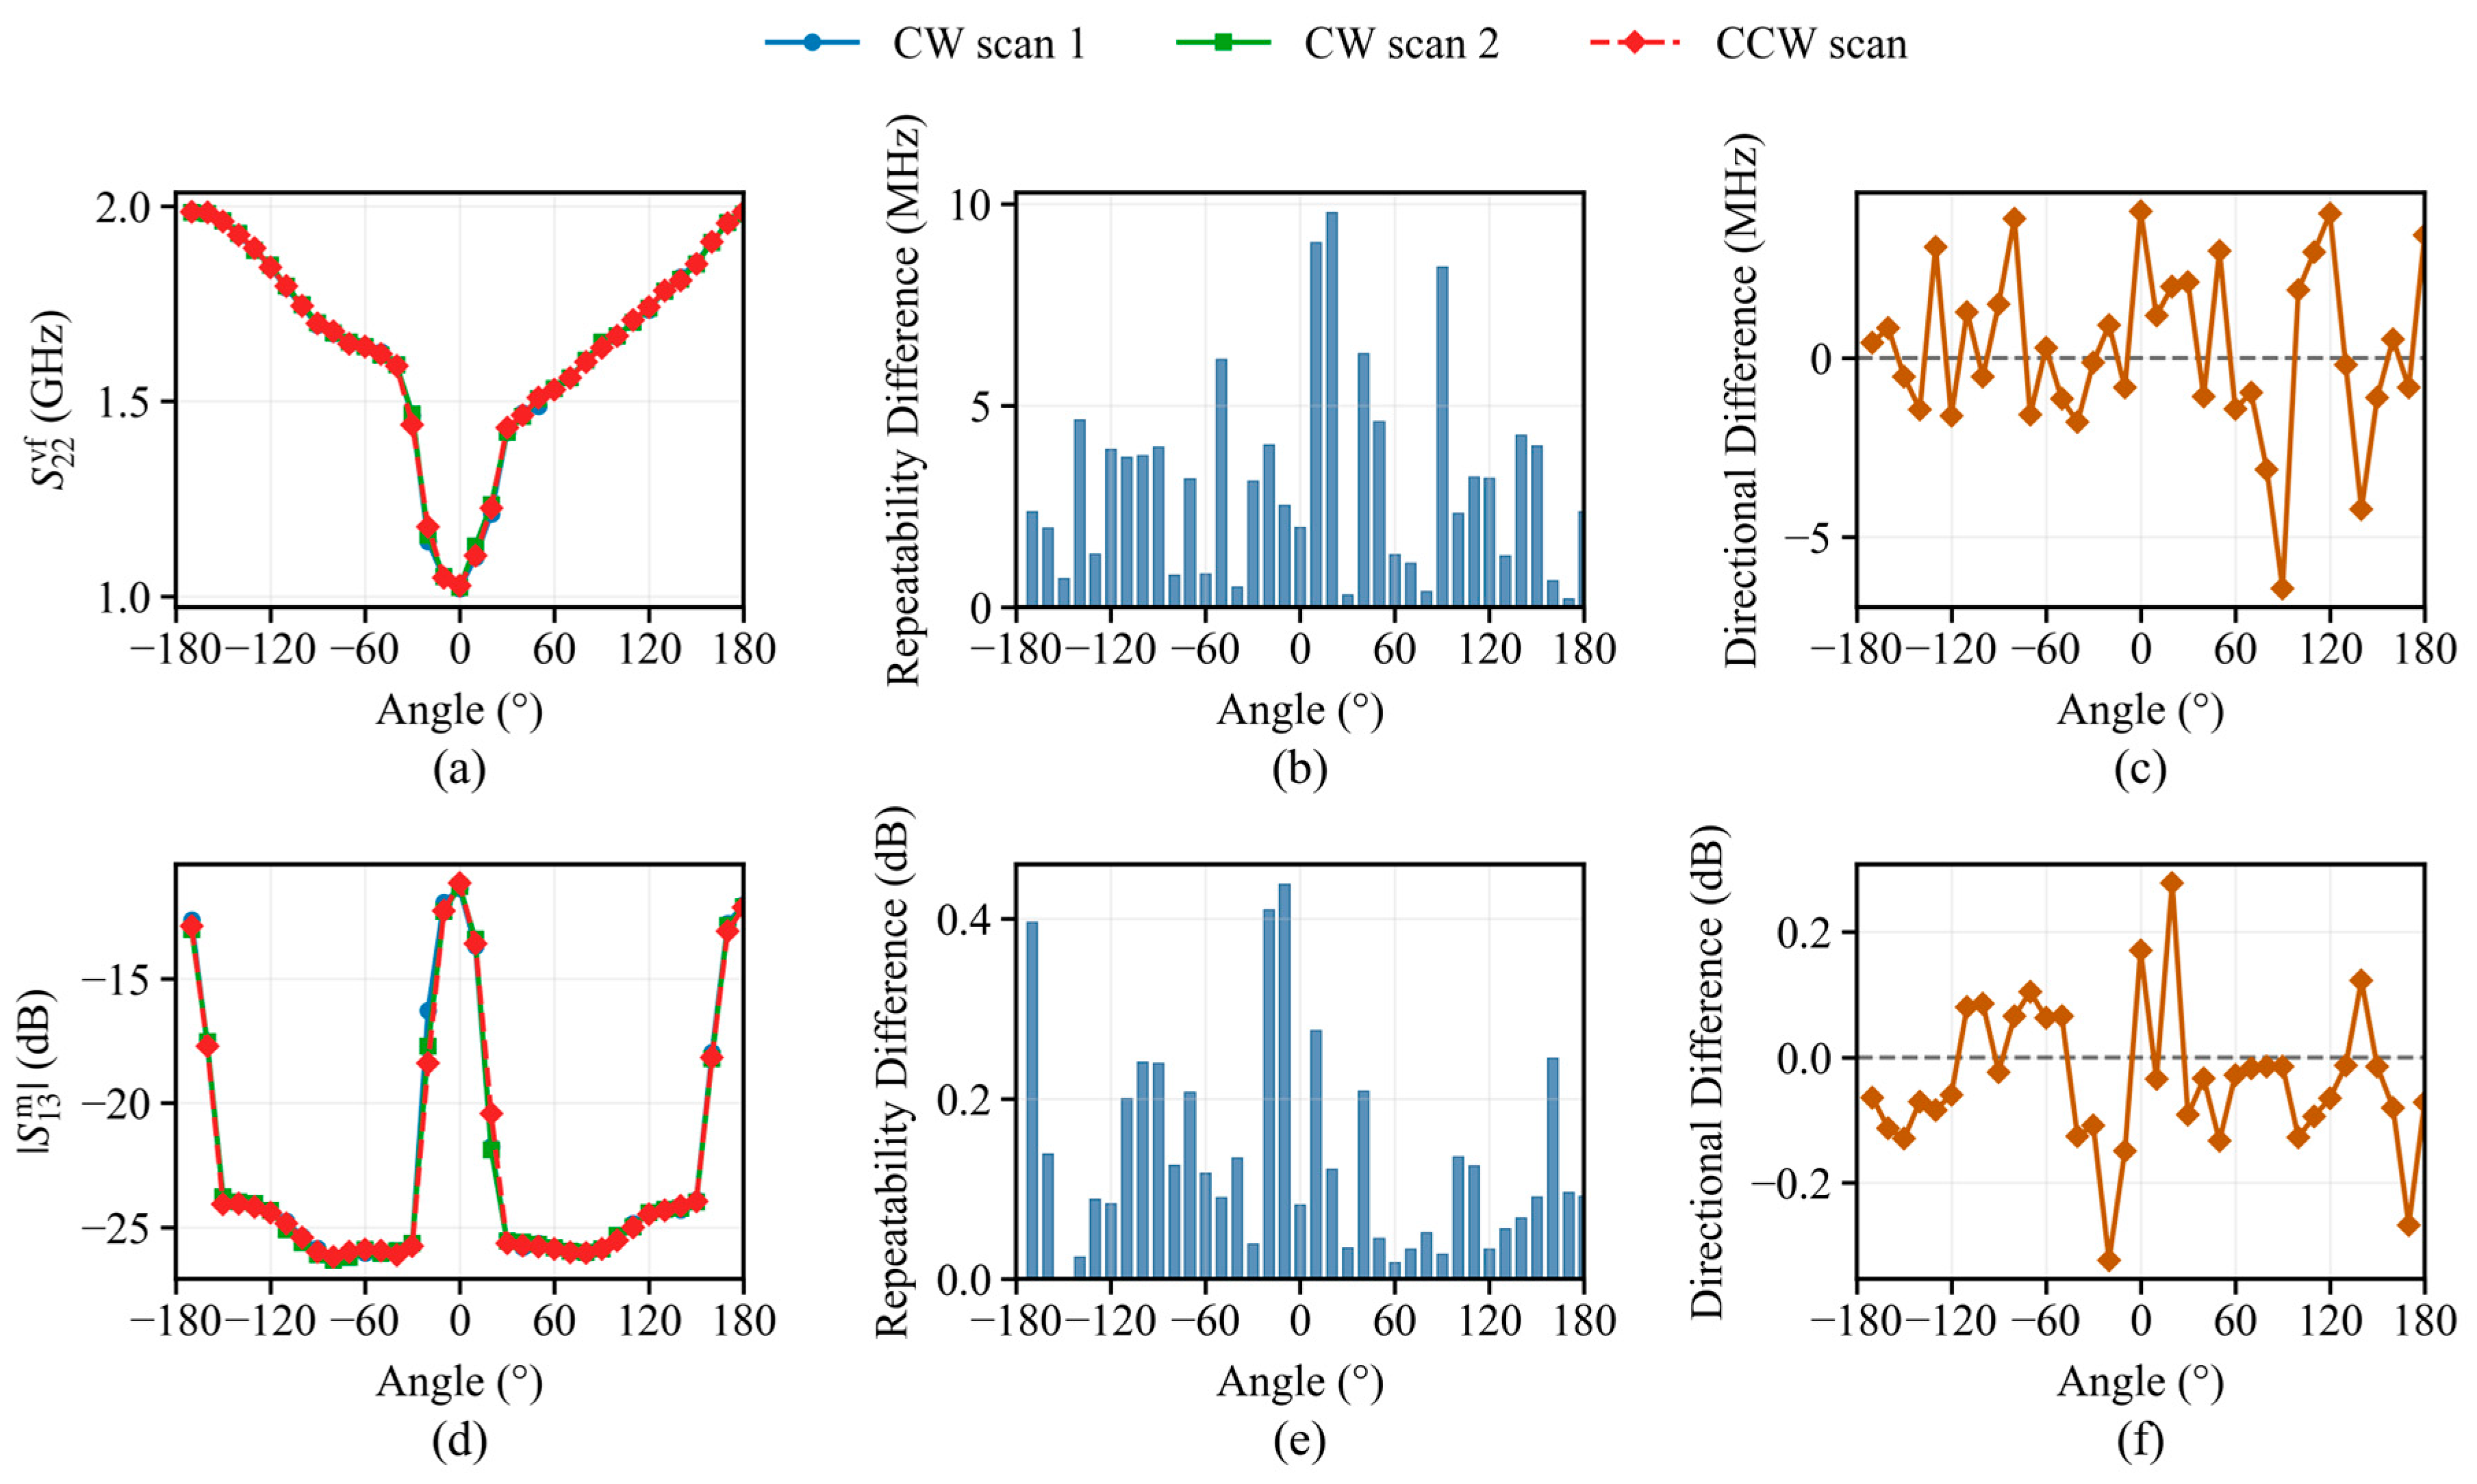
To further evaluate the measurement stability of the proposed sensor, three independent scans with 10° angular intervals were compared. Two scans were performed in the clockwise (CW) direction, while the third was performed in the counterclockwise (CCW) direction. The valley frequency of S 22 and the average magnitude of S 13 over the measurement band were selected as representative spectral descriptors to characterize the repeatability and directional consistency of the resonance position and overall amplitude response, respectively.
As shown in Figure 9a,d, the three scans exhibit highly consistent overall trends over the full angular range. To further evaluate repeatability under the same scanning direction, Figure 9b,e show the absolute differences between the two CW scans at each angular position. The mean repeatability difference of the S 22 valley frequency is 3.12 MHz, with a maximum of 9.80 MHz, while the corresponding values for the S 13 average magnitude are 0.134 dB and 0.438 dB. These differences are small relative to the overall variation ranges of the two descriptors, indicating good repeatability.
In addition, to examine the effect of scanning direction, the CCW scan was compared with the average of the two CW scans. The resulting differences are generally distributed around zero without an obvious systematic bias. The mean absolute directional differences are 1.84 MHz for the S 22 valley frequency and 0.094 dB for the S 13 average magnitude, with maximum absolute differences of 6.43 MHz and 0.323 dB, respectively. These results indicate that the influence of scanning direction on the representative spectral responses remains limited under the current quasi-static conditions.
The current experiment includes only a limited number of bidirectional scans and is therefore intended to characterize repeatability and directional consistency rather than providing a complete mechanical hysteresis evaluation. The remaining local deviations may arise from friction between the metallic disk and guide structure, fabrication tolerances, assembly gaps, and positioning errors. A more complete assessment of hysteresis will require additional bidirectional cycles and continuous dynamic motion experiments. Future work will focus on improving guide precision, reducing friction, and increasing the number of repeated measurements to further assess and reduce these mechanical uncertainties.

4.2. Angle Reconstruction Results

This section describes the analysis of the angle reconstruction results of the proposed MoE-GPR model. First, the standardized responses of the 12 global descriptors and their PCA representation are examined. The standardized descriptor trajectories of the local GPR experts are then used to discuss the relationship between the expert-specific descriptors and their corresponding local angular regions, followed by the LOAO results of the final frozen configuration B3. Controlled ablation is subsequently used to assess the contribution of individual model components, while a separate evaluation examines reconstruction when the sampling interval and acquisition run differ between training and testing.

4.2.1. Analysis and Performance of the Proposed Model

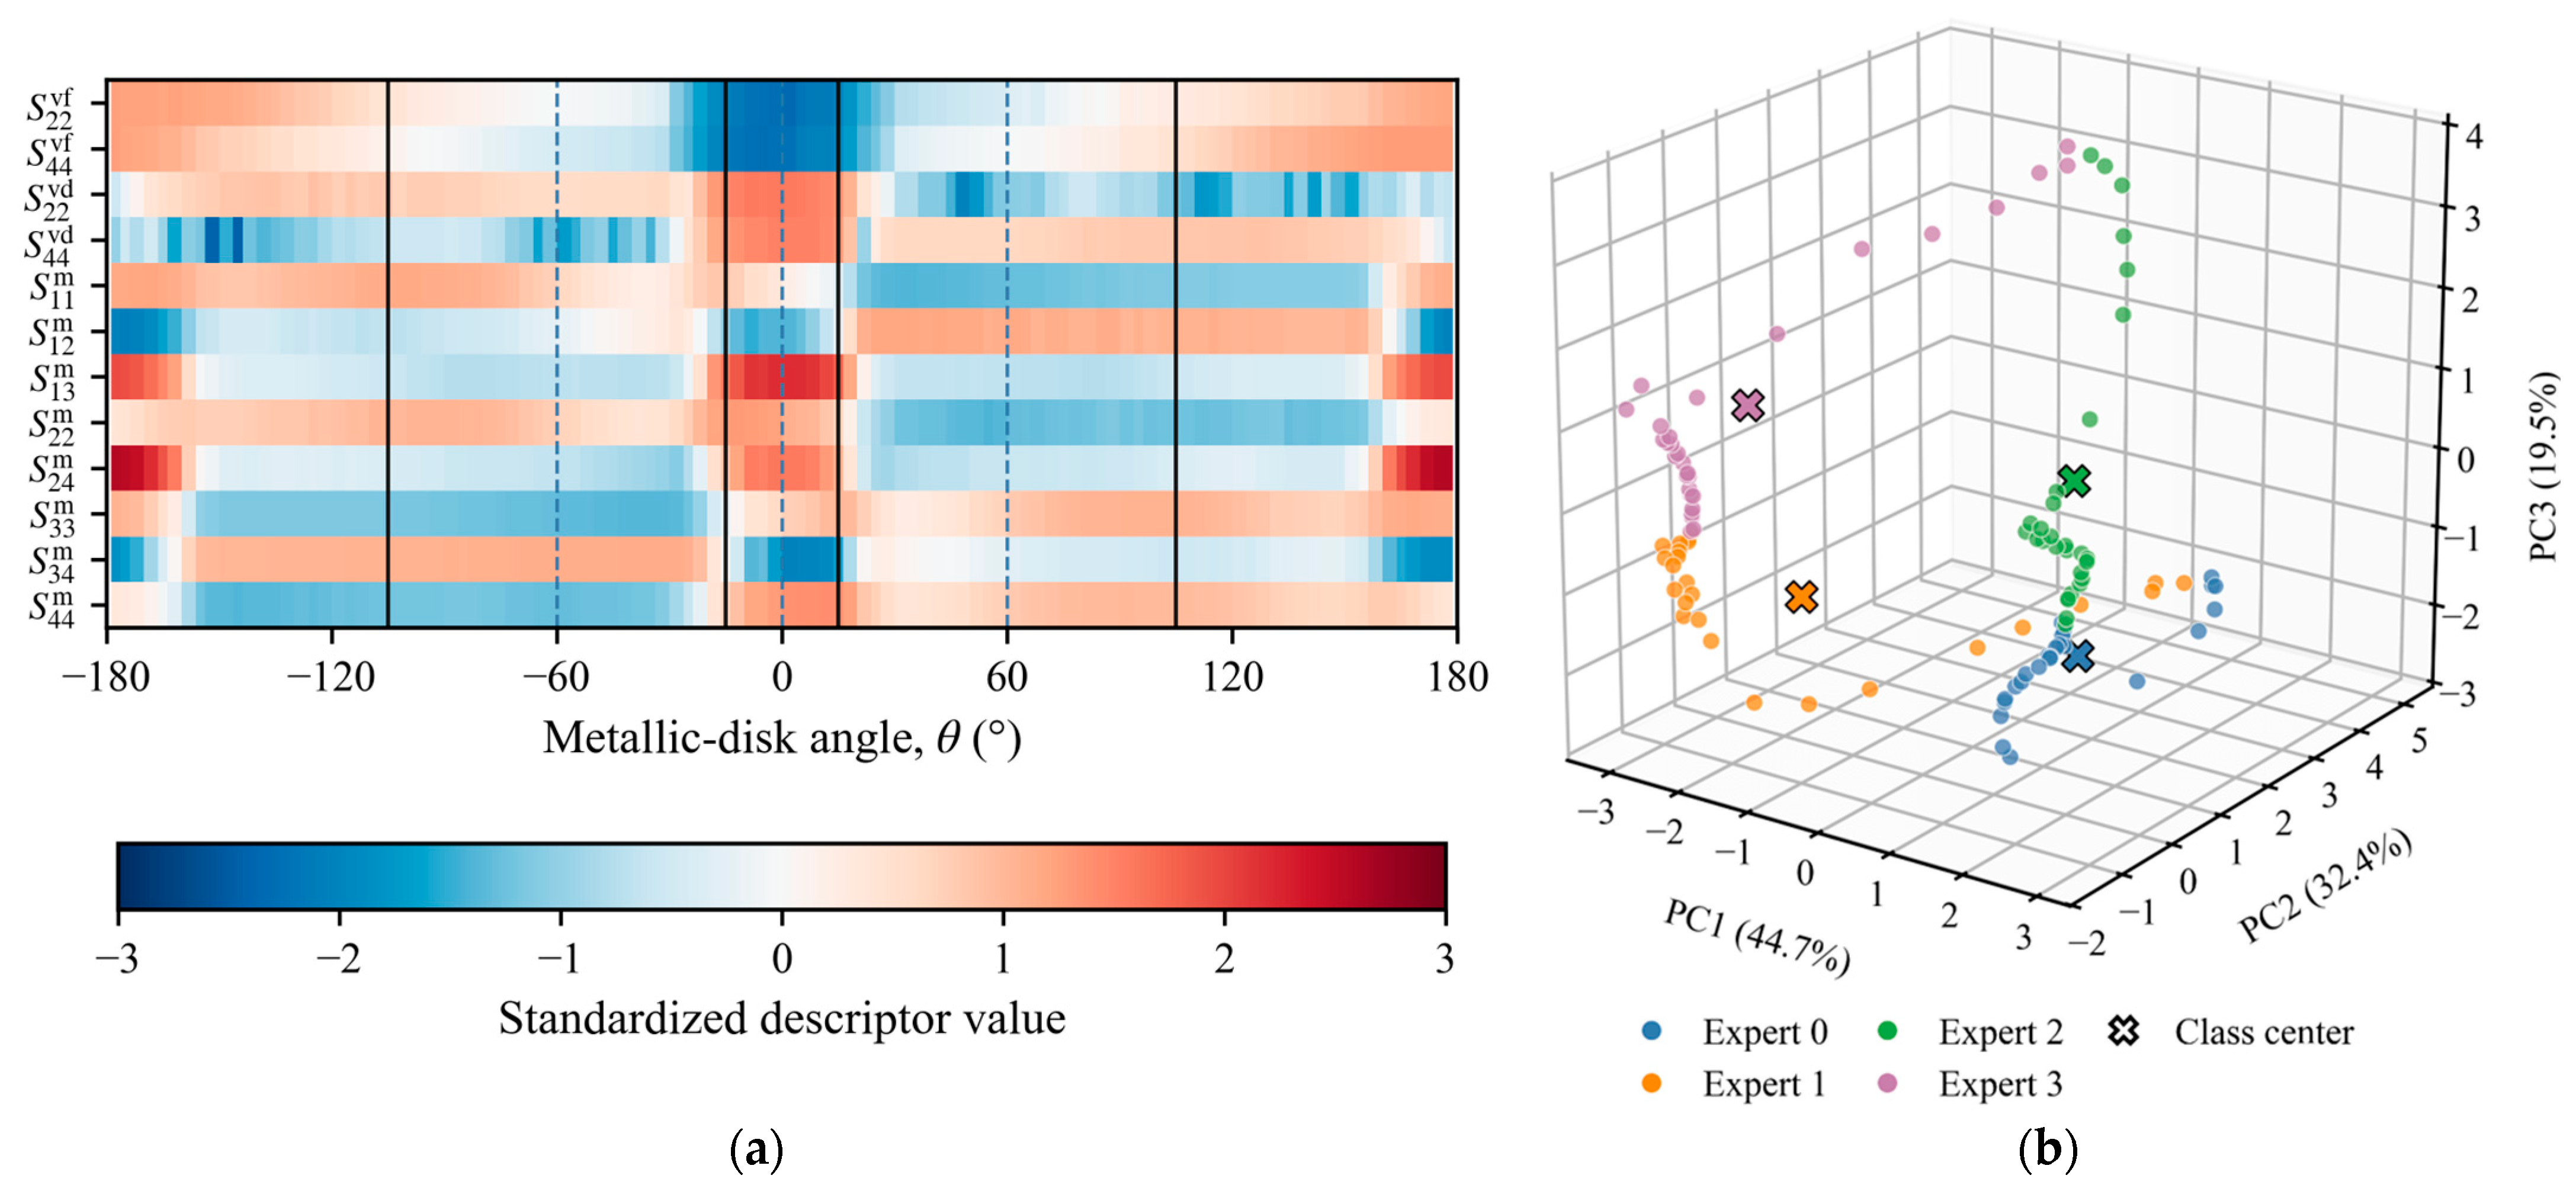
The PCA assisted logistic hard gate uses the 12 global descriptors to classify angular regions. Figure 10a shows their full angle responses after standardization using statistics calculated from the training data. The valley frequency, valley magnitude, and band averaged descriptors from multiple ports exhibit different variation trends with angle. Their complementary responses create distinguishable statistical differences among the nominal responsibility ranges of the four experts in the global descriptor space, providing the input basis for expert routing by the gate.
Figure 10b further shows the distribution of the 12 global descriptors in the 3D PCA space. PC1, PC2, and PC3 explain 44.7%, 32.4%, and 19.5% of the input variance, respectively, giving a cumulative explained variance of 96.6%. This result indicates that the three principal components retain most of the variation in the original global descriptors. Based on this representation, the PCA assisted logistic hard gate achieves a sample wise routing accuracy of 0.951 in LOAO evaluation, showing that the global descriptors provide reliable support for classifying the four nominal expert classes.
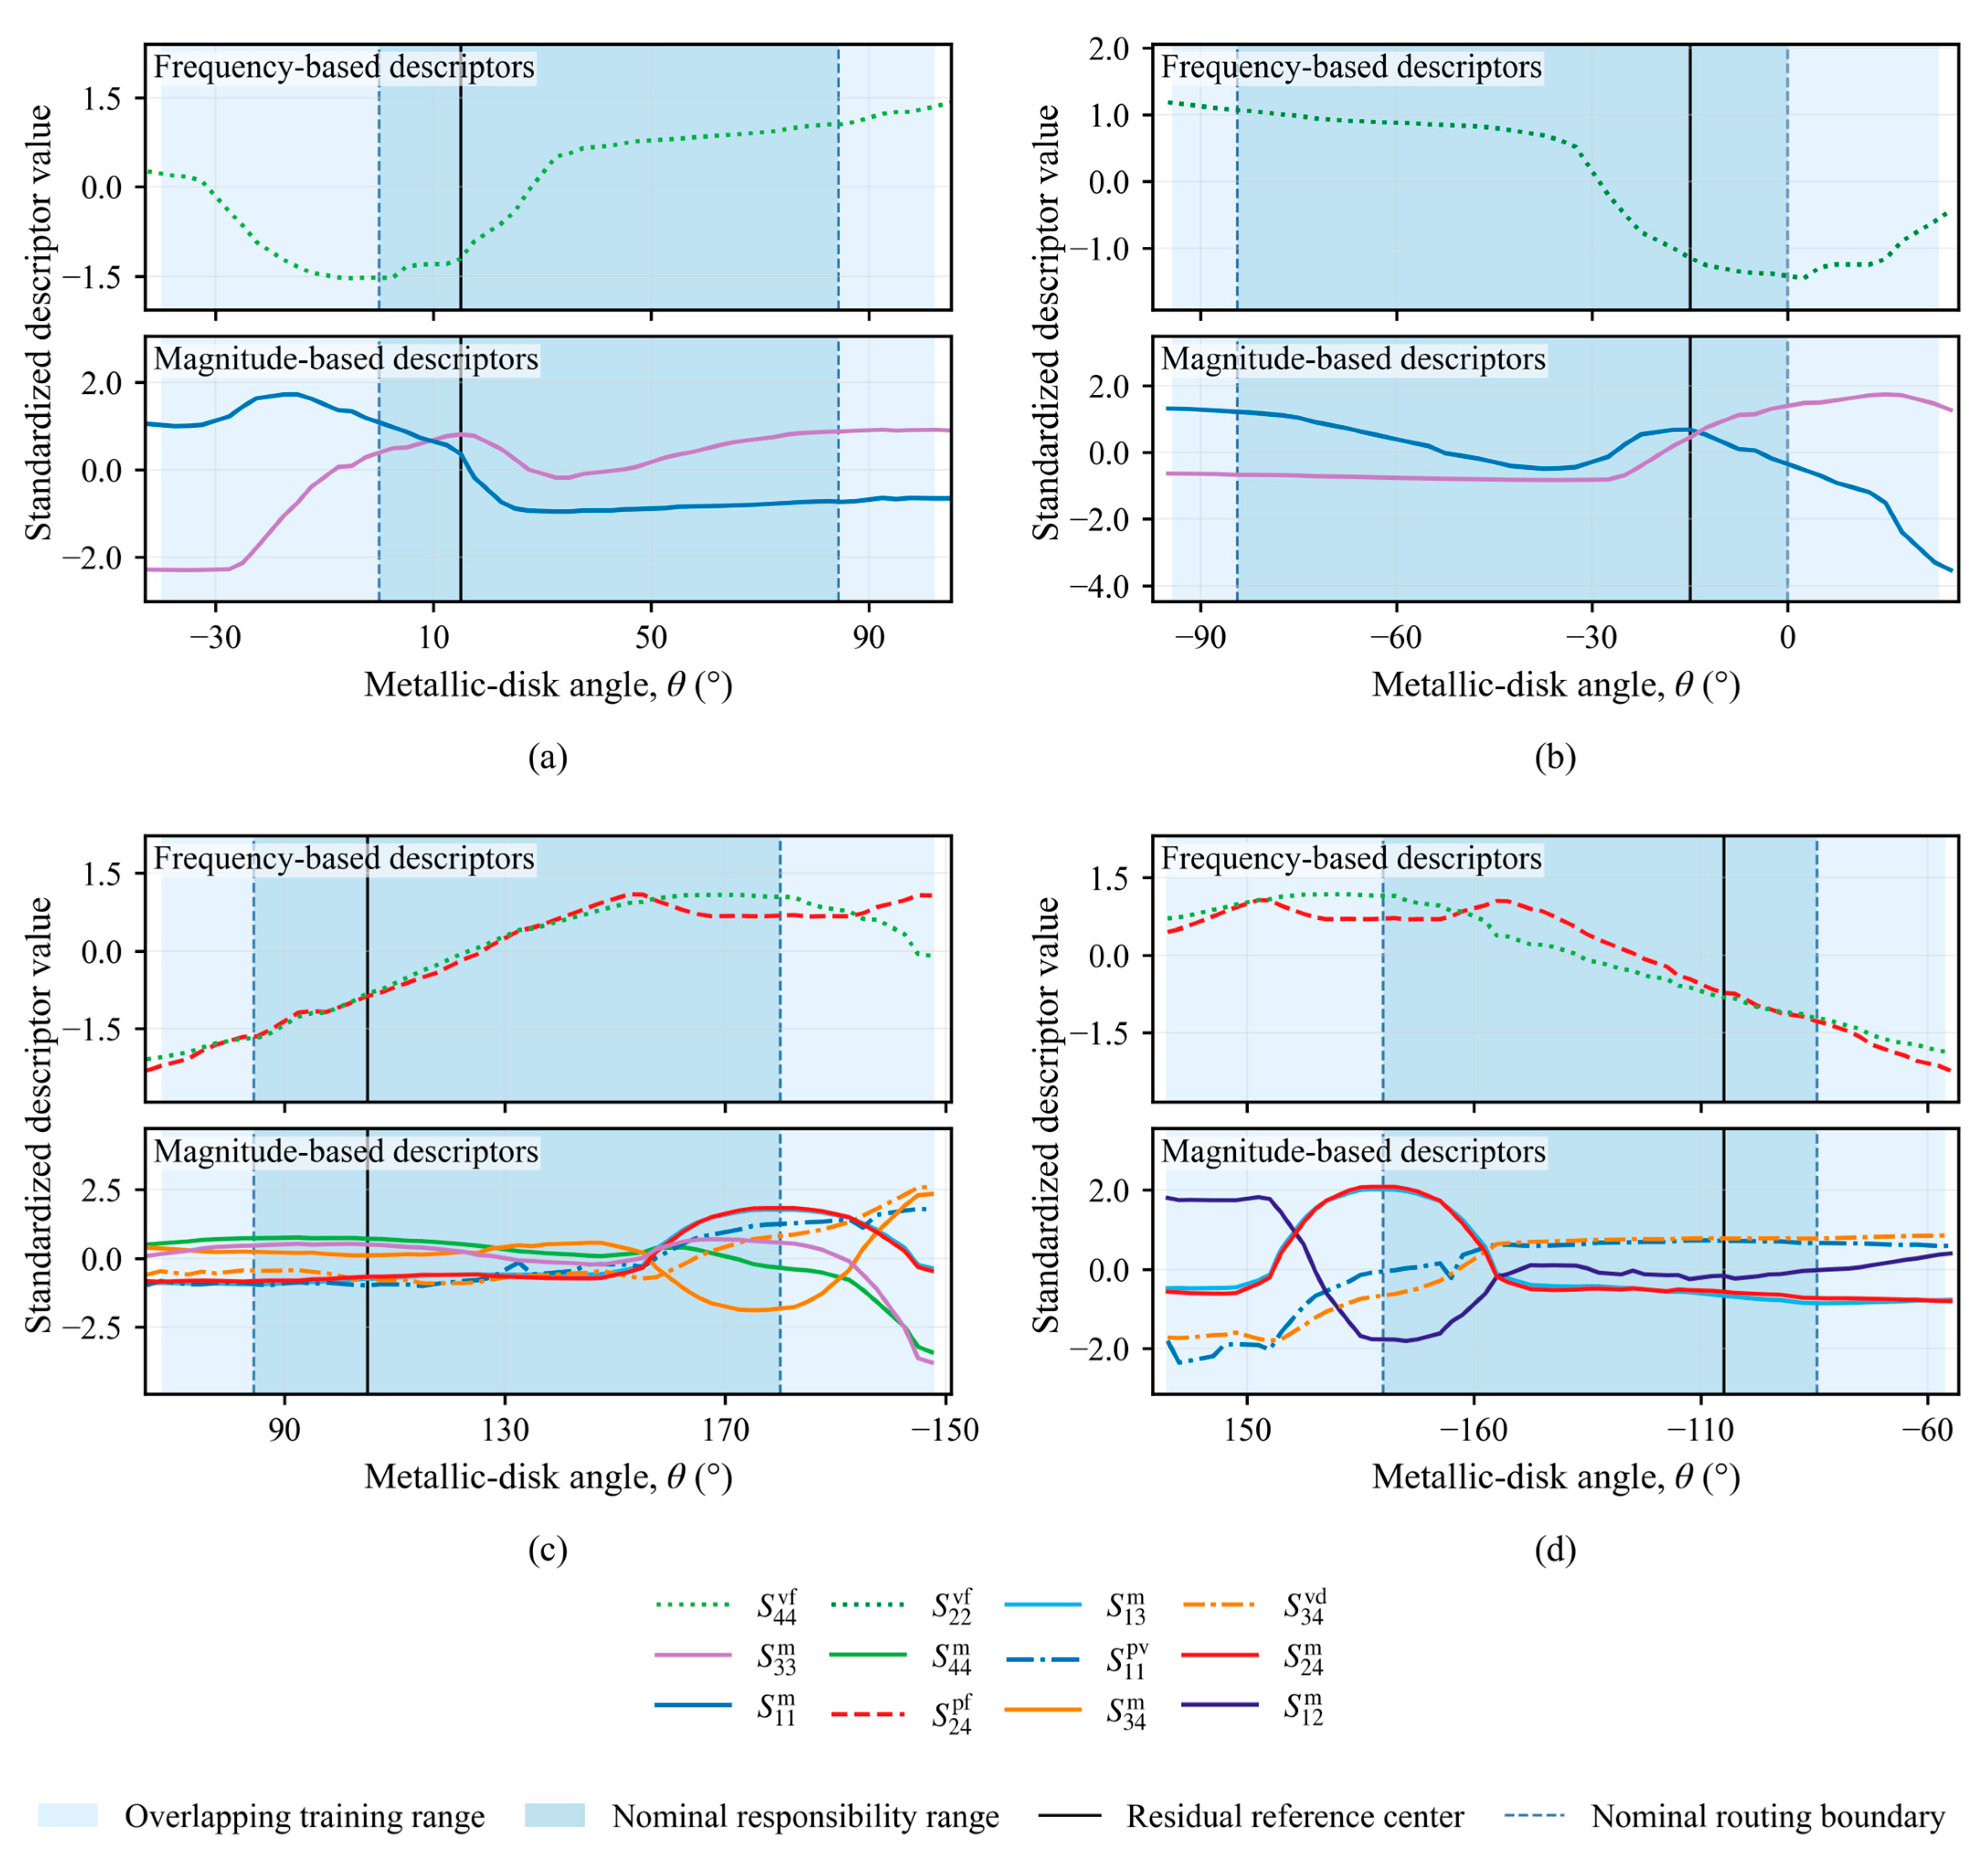
In addition to the PCA representation analyzed above for the PCA assisted logistic hard gate, Figure 11 presents the standardized trajectories of the spectral descriptors used by the four local GPR experts in the final frozen configuration. Experts 0 and 1 each use three expert-specific descriptors, mainly including reflection valley frequencies and band-averaged responses from multiple S-parameter channels. These descriptors characterize the relatively stable variations in resonance position and overall response level within the positive and negative small-angle regions. Expert 2 uses nine expert-specific descriptors, combining peak frequency, peak magnitude, valley frequency, valley magnitude, and band-averaged responses to characterize the more complex multichannel spectral responses in the positive large-angle region. Expert 3 uses seven expert-specific descriptors, with the band-averaged responses from multiple S-parameter channels providing additional angle-related information in the negative large-angle region. The four local GPR experts differ substantially in both their input compositions and the local variation patterns of their descriptors, indicating that the effective angular information provided by a spectral descriptor depends on the angular region. By selecting inputs more stable and discriminative within the corresponding local angular regions, the model enables each local GPR expert to learn the nonlinear mapping between the spectral descriptors and the circular residual for that region.
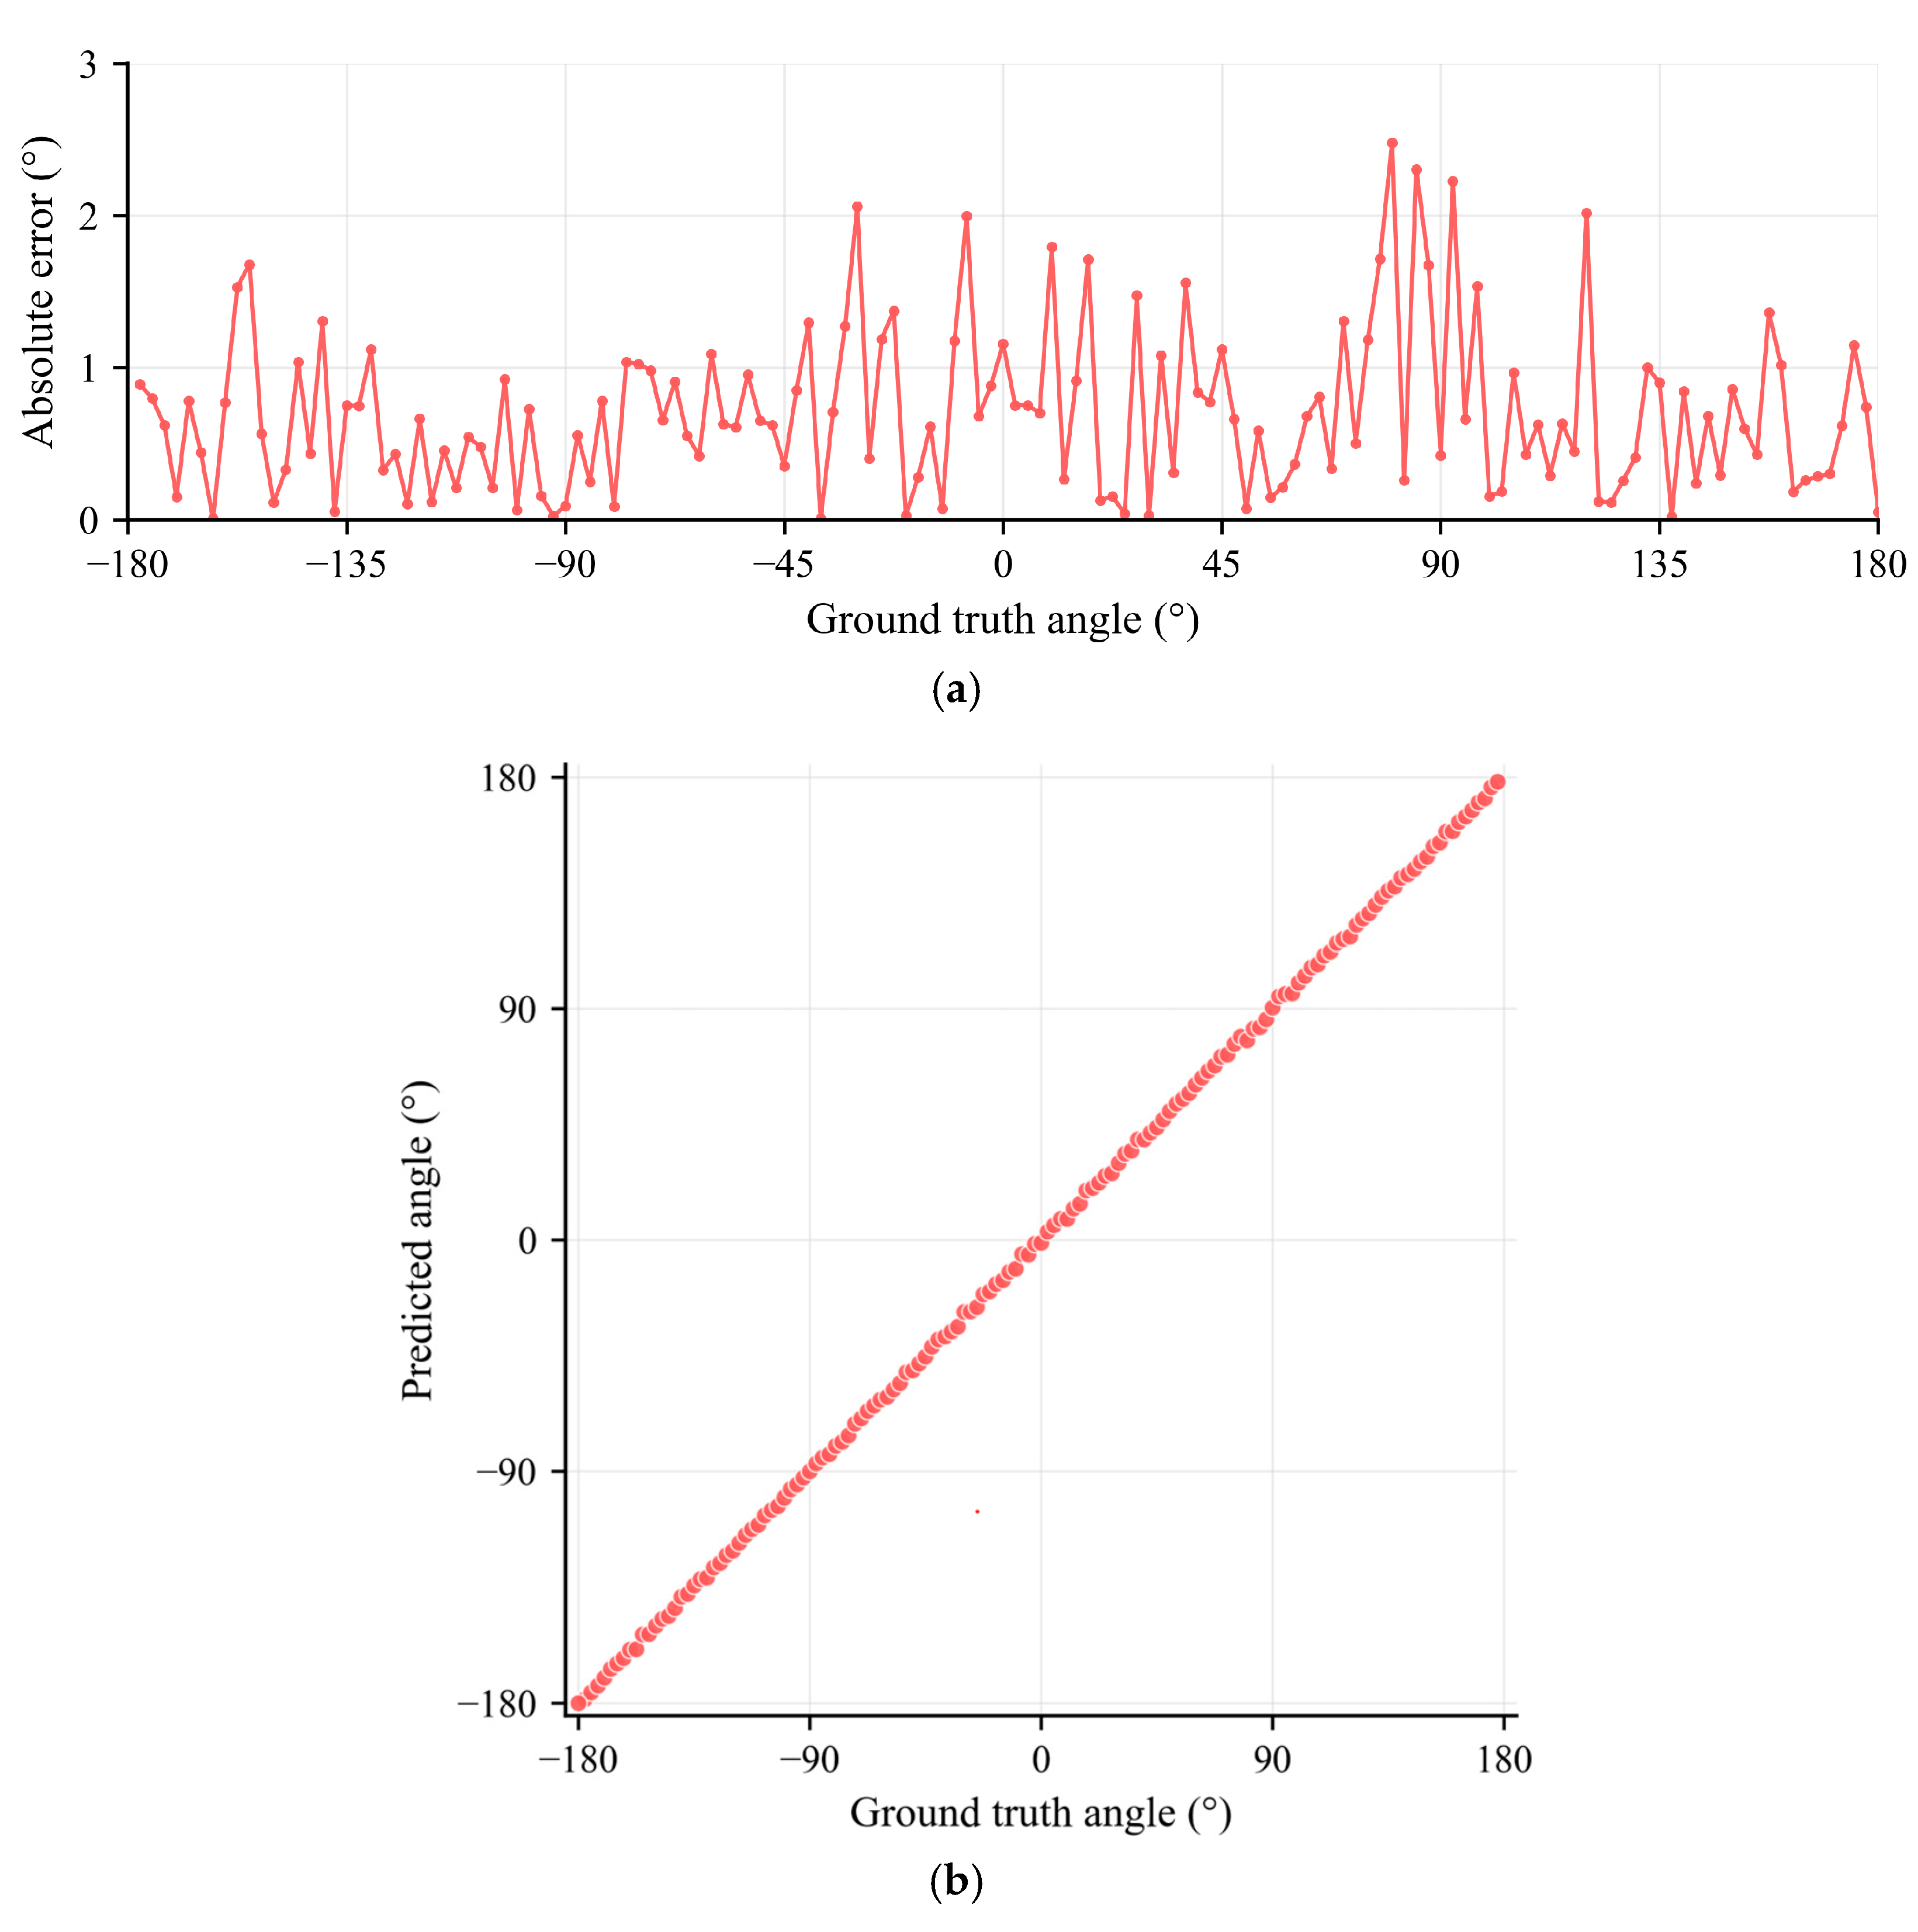
The final frozen configuration B3 achieved an MAE of 0.700°, an RMSE of 0.881°, a P90 of 1.444°, a maximum error of 2.480°, and a Boundary MAE of 0.921° in the LOAO evaluation. Figure 12a,b show the reconstructed angles and error distributions obtained from the LOAO evaluation. The low MAE and P90 indicate favorable average reconstruction accuracy and a concentrated error distribution over the full angular range. The maximum error of 2.480° shows that the error remains within a limited range. In addition, the Boundary MAE of 0.921° is lower than that of the global baseline, demonstrating stable reconstruction near the routing boundaries. The reconstructed angles cover the complete range from −180° to 180° without discontinuity at the circular boundary.
Since the dataset for the LOAO evaluation was independently acquired at 2.5° angular intervals, the smallest angular separation directly evaluated in this work is 2.5°. It should be noted that the MAE of 0.700° obtained by MoE-GPR represents the average reconstruction error of continuous angle estimation and should not be interpreted as the physical resolution of the sensor. Although the regression model can interpolate between calibrated angular positions, a dedicated resolution experiment with finer angular steps is required to quantitatively determine the minimum distinguishable angular displacement.
Based on current measurements, the proposed system demonstrates reliable reconstruction of angular states sampled at 2.5° intervals and achieves sub-degree average error under this sampling condition. Further improvement of the practical angular resolution requires rotation stages with higher precision, denser angular calibration, increased VNA frequency sampling density, and optimized spectral feature extraction to capture weaker spectral variations caused by smaller angular changes.

4.2.2. Controlled Ablation Analysis

To evaluate the effectiveness of the proposed MoE-GPR attitude reconstruction framework, it was first compared with conventional machine learning regressors and a global GPR model. A B0–B3 ablation study was then conducted to quantify the contribution of each component. All methods used the same data splits and circular error definition to ensure a fair comparison.
Table 6 presents the reconstruction results under the LOAO protocol. The conventional regression methods SVR, RF, and KNN achieved MAEs of 1.161°, 1.903°, and 2.659°, respectively. In comparison, Global GPR (B0) achieved an MAE of 0.918°, showing that GPR is more suitable for modeling the nonlinear relationship between spectral responses and angle when the available training data are limited. However, B0 still relies on a single global mapping and therefore cannot fully adapt to local response differences among different angular regions. It is thus used as the global baseline for the subsequent MoE-GPR ablation study.
Starting from B0, B1 introduces a PCA assisted logistic hard gate and four local GPR experts, while retaining the same 12 global descriptors as the input to all experts. Under this configuration, the MAE decreased only slightly from 0.918° to 0.907°, while the P90 and maximum error increased. This result indicates that angular partitioning and the local expert architecture alone do not provide a substantial improvement in reconstruction performance.
After the local expert inputs are replaced with expert-specific descriptors, B2 outperformed B1 across all evaluation metrics. Its MAE decreased from 0.907° to 0.741°, and its maximum error was also clearly reduced. This result indicates that the informative spectral content varies across angular regions and that adapting the descriptor inputs to each local expert allows these regional differences to be used more effectively. This modification therefore provides the main performance gain in the ablation study.
On the basis of B2, B3 further expands the training range of each local expert. All error metrics continued to decrease, with the MAE reaching 0.700° and the Boundary MAE also improving. Although the improvement from B2 to B3 is relatively modest, the result indicates that adding training samples near the nominal routing boundaries helps local circular residual regression near the boundaries and further improves the final reconstruction performance.
Overall, the final configuration B3 achieves lower average, tail, and boundary errors than the global baseline B0. Because configurations B1–B3 use the same PCA assisted logistic hard gate and sample wise routing results, their performance differences mainly arise from the expert-specific descriptors and expanded training ranges. These findings indicate that the improvement of the proposed MoE-GPR framework is not simply due to increased model complexity, but mainly results from explicitly modeling the nonuniform spectral responses across different angular regions. By combining angular partitioning, local descriptor selection, and additional training samples near the routing boundaries, the proposed model achieves more stable angle reconstruction over the full angular range.

4.2.3. Cross-Sampling Generalization Analysis

To further evaluate reconstruction under different sampling conditions, the frozen B0–B3 configurations were assessed using cross-sampling evaluation. Compared with the LOAO evaluation, this protocol introduces differences in both angular sampling interval and acquisition run, providing a more stringent assessment of model generalization from sparse calibration data to denser angular observations.
As shown in Table 7, the global baseline B0 achieved an MAE of 1.632°, while B1 reduced the average error but shows increased P90 and maximum errors, indicating that angular partitioning alone does not yield consistent improvement under cross-sampling conditions. With expert-specific descriptors, B2 reduced the MAE to 1.281° and also improved the tail and maximum errors, consistent with the trend observed in the LOAO ablation study. The final B3 configuration further lowered the MAE to 1.125° and yielded additional reductions in P90 and maximum error. Compared with B2, B3 shows more pronounced reductions in tail and extreme errors under cross-sampling evaluation. These results confirm that the performance gains introduced by expert-specific descriptors and expanded training ranges are retained under cross-sampling conditions, with B3 showing the best overall generalization performance.
Compared with the LOAO evaluation, the MAE increased from 0.700° to 1.125° under the cross-sampling condition. It should be noted that the two evaluations use training data with different angular sampling densities. The LOAO evaluation was based on data sampled at 2.5° intervals, whereas the cross-sampling evaluation used data sampled at 10° intervals for training. Therefore, the increase in error reflects both the reduced density of training samples and the difference in sampling conditions between training and testing, and should not be attributed solely to model overfitting. Despite the sparser training data, the model still achieved an MAE of 1.125°, indicating a certain degree of generalization across sampling conditions.

4.2.4. Discussion

Because each local expert in the MoE-GPR framework is trained only on samples from its corresponding angular region, the limited local sample size may increase the risk of overfitting. To mitigate this risk, each expert uses expert-specific descriptors matched to the local spectral response, reducing redundant inputs and limiting model complexity, while the kernel formulation and noise estimation of GPR provide additional regularization.
The generalization capability was further examined through two complementary evaluations. The low prediction error in the LOAO evaluation indicates that the model can interpolate unseen angular positions, while the cross-sampling evaluation provides a more stringent test of generalization under different sampling conditions. Taken together, the two evaluations show no obvious dependence on specific training angles, although the limited local sample size may still affect generalization robustness. Future work will enlarge the effective training sets of the local experts by incorporating additional angular samples, repeated measurements, and data acquired under different operating conditions.
Table 8 compares the proposed multiport SRR attitude sensor with representative planar microwave resonant sensors for angle measurement reported in previous studies. The comparison considers the sensing structure, angular perturbation mechanism, measurement range, readout strategy, and reported reconstruction performance.
Existing microwave angle sensors have demonstrated various mechanisms for converting mechanical motion into electromagnetic responses, including shifts in resonance frequency, amplitude variations, and multimode spectral changes [17,18,19,20,21,22,23]. However, many reported systems rely on one or a limited number of spectral observables and are optimized for specific angular ranges. Extending the sensing range to a full circle often requires additional resonant modes or specially engineered response patterns. Moreover, when spectral responses become nonmonotonic over a wide angular range, a single global mapping of spectral features to angles becomes difficult to establish.
Table 8. Comparison of the proposed sensor with representative planar microwave resonant angle sensors.
Ref.Resonant StructureAngular Perturbation MechanismRangeReadout/ReconstructionReported Performance
[5]CPW loaded with an S-SRRDriven rotation changes coupling between the line and resonator0–90°Transmission response/calibration90° dynamic range; angular error NR
[7]Microstrip line + rotatable CSRRRelative alignment changes resonant coupling0–90°Resonance frequency shiftLinear interval of 30–60°; angular error NR
[8]Open CSRR with active feedbackAlignment between the rotor and stator changes feedback response0–90°Reflection magnitude/resonance separationAverage sensitivity of 0.32/0.13 dB·deg−1
[19]Multimode resonator + rotatable stubStub rotation shifts multiple transmission zeros360°Transmission-zero frequency/spacing1.22 MHz·deg−1 over 360°
[20]Microstrip line loaded with an SRRSRR tilt changes reflection-notch depth through symmetry breaking25°Reflection notch depth at one frequency1 dB·deg−1 average (simulation)
[21]Half-wave microstrip resonatorOverlapping-line rotation changes the resonator response84° (±42°)Resonance frequency shift0.035° resolution; 0.384 mm·deg−1
[23]Slot-coupled dielectric resonatorResonator rotation changes differential frequency0–90°Differential frequency + inverse regression15.5 MHz·deg−1; RMSE of 2.13°
This workFour-port SRR + free diskGravity-driven disk motion360°Reflection and transmission responses/MoE-GPR0.700° MAE/0.881° RMSE/1.444° P90
NR indicates that the original publication did not report an angle reconstruction error.
In comparison, the proposed system integrates a metallic disk driven by gravity, an SRR sensing structure with four ports, and an MoE-GPR angle reconstruction framework. The metallic disk provides a passive mechanical response to gravity, while the multiport SRR generates complementary spectral responses over the full angular range. The proposed reconstruction framework further exploits these heterogeneous responses through global routing and local nonlinear regression, enabling reliable angle estimation under nonuniform spectral variations.
The proposed sensor achieved 360° attitude sensing referenced to gravity, with an MAE of 0.700°, an RMSE of 0.881°, and a P90 of 1.444° in LOAO evaluation. Under cross-sampling conditions, the system maintained an MAE of 1.125° when trained with 10° interval scans and tested with an independently acquired 2.5° interval dataset. These results demonstrate that the proposed approach integrates passive moving sensing, multiport spectral observation, and local nonlinear angle reconstruction within a unified microwave sensing platform.
Despite these advantages, the demonstrated capability remains limited by the sensing principle and current experimental configuration. The present sensing unit is mainly intended to measure angular variations within its sensing plane relative to the direction of gravity. Therefore, this study validates 360° angle sensing within a single plane referenced to gravity rather than complete 3D attitude reconstruction. When the sensor is tilted out of the calibrated sensing plane, both the projection of gravity onto the sensing plane and the mechanical state of the metallic disk change, causing the electromagnetic response to deviate from the calibration of the single plane. A single sensing unit therefore cannot uniquely determine an arbitrary 3D attitude.
For inclination measurement along multiple axes, several identical sensing units can be integrated with mutually orthogonal orientations to obtain gravity projections along different directions. Their outputs may then be combined through joint calibration or data fusion to estimate inclination along multiple axes. However, because gravity alone cannot provide the reference for rotation about the gravity vector, additional sensing mechanisms are required for complete 3D attitude estimation including heading information.
In addition to the limitation in attitude dimensionality, the dynamic response of the sensor remains to be fully characterized. Because the metallic disk is driven by gravity and perturbs the electromagnetic boundary conditions around the SRR, the proposed structure can support the measurement of angles that vary with time when the mechanical response time is sufficiently shorter than the characteristic time scale of the target motion. However, the present study mainly focused on static and quasi-static angular calibration, and dynamic tracking accuracy and system bandwidth have not yet been experimentally characterized. Under rapid motion conditions, mechanical factors such as disk inertia, guide friction, and collision effects may cause deviations from the instantaneous gravity direction and introduce additional measurement errors.
Future work will investigate dynamic response characteristics, including response delay, maximum trackable angular velocity, and errors induced by motion, through continuous rotation experiments. Modeling based on temporal sequences or auxiliary inertial sensing information may also be incorporated to compensate for dynamic errors under rapid motion conditions. In addition, systematic optimization of key geometric parameters will be conducted to improve the angular sensitivity and distinguishability of the spectral features, further enhancing the angle reconstruction performance. These efforts are expected to further extend the applicability of the proposed structure to dynamic attitude monitoring scenarios.

5. Conclusions

This study presents a passive microwave attitude sensor based on local SRR perturbation and multiport S-parameter responses. The metallic disk moves along a circular trajectory and modifies the near field distribution around the SRR and coupling structures. As a result, the peak, valley, and band averages extracted from different ports exhibit complementary variations with angle.
To exploit the nonuniform spectral characteristics over the full angular range, an MoE-GPR framework consisting of a PCA assisted logistic hard gate and four local GPR experts was developed. The gate uses 12 global descriptors to determine the nominal expert category, while each local expert predicts the circular residual relative to its reference center using sets of expert-specific descriptors containing 3, 3, 9, and 7 descriptors, respectively.
The experimental results demonstrate 360° angle sensing along a single axis and within the sensing plane, using gravity as the reference. In the LOAO evaluation, the final B3 configuration achieved an MAE of 0.700°, an RMSE of 0.881°, and a P90 of 1.444°. The controlled ablation demonstrates that the introduction of expert-specific descriptors provides the primary improvement in local residual regression, while expanded expert training coverage further improves the stability of predictions near expert boundaries. Under cross-sampling conditions, the frozen B3 configuration maintained an MAE of 1.125°, a P90 of 2.160°, and a maximum error of 4.841°, demonstrating a certain degree of generalization across different sampling conditions.
Overall, the proposed system integrates a passive metallic sensing element driven by gravity, microwave spectral readout through four ports, and nonlinear 360° angular reconstruction within a unified platform. Because the metallic disk is driven by gravity and requires no active electronics or electrical connections, the proposed configuration is compatible with passive microwave sensing architectures and offers potential for integration with RF sensing and communication platforms, as well as for inclination and structural health monitoring referenced to gravity. The present study mainly validates static and quasi-static sensing along a single axis, while dynamic response and extension to multiple axes remain to be further investigated. Future work will therefore focus on characterization under continuous motion, expansion of the training dataset under repeated and diverse operating conditions, and systematic optimization of key geometric parameters to further improve sensing sensitivity, reconstruction robustness, and applicability to dynamic attitude monitoring referenced to gravity.

Author Contributions

Conceptualization, Y.C. and J.H. (Jiangtao Huangfu); methodology, Y.C. and J.H. (Jiangtao Huangfu); software, Y.C.; validation, Y.C. and Z.C.; formal analysis, Y.C. and J.H. (Jingyuan Huang); investigation, Y.C., Z.C. and P.L.; resources, J.H. (Jiangtao Huangfu); data curation, Y.C. and M.W.; writing—original draft preparation, Y.C.; writing—review and editing, Y.C., Z.C., M.W., J.H. (Jingyuan Huang), X.L., P.L. and J.H. (Jiangtao Huangfu); visualization, Y.C. and X.L.; supervision, J.H. (Jiangtao Huangfu); project administration, J.H. (Jiangtao Huangfu); funding acquisition, J.H. (Jiangtao Huangfu). All authors have read and agreed to the published version of the manuscript.

Funding

This research was funded by the Shenzhen Science and Technology Program under Grant No. ZDCY20250901112800001.

Data Availability Statement

The original contributions presented in this study are included in the article. Further inquiries can be directed to the corresponding authors.

Conflicts of Interest

The authors declare no conflicts of interest. The research was conducted in the absence of any commercial or financial relationships that could be construed as a potential conflict of interest.

References

  1. Muñoz-Enano, J.; Vélez, P.; Gil, M.; Martín, F. Planar Microwave Resonant Sensors: A Review and Recent Developments. Appl. Sci. 2020, 10, 2615. [Google Scholar] [CrossRef] [Scilit]
  2. Naqui, J.; Durán-Sindreu, M.; Martín, F. Alignment and Position Sensors Based on Split Ring Resonators. Sensors 2012, 12, 11790–11797. [Google Scholar] [CrossRef] [Scilit]
  3. Horestani, A.K.; Fumeaux, C.; Al-Sarawi, S.F.; Abbott, D. Displacement Sensor Based on Diamond-Shaped Tapered Split Ring Resonator. IEEE Sens. J. 2013, 13, 1153–1160. [Google Scholar] [CrossRef] [Scilit]
  4. Martín, F.; Vélez, P.; Gil, M. Microwave Sensors Based on Resonant Elements. Sensors 2020, 20, 3375. [Google Scholar] [CrossRef] [Scilit] [PubMed]
  5. Naqui, J.; Coromina, J.; Karami-Horestani, A.; Fumeaux, C.; Martín, F. Angular Displacement and Velocity Sensors Based on Coplanar Waveguides (CPWs) Loaded with S-Shaped Split Ring Resonators (S-SRR). Sensors 2015, 15, 9628–9650. [Google Scholar] [CrossRef] [Scilit] [PubMed]
  6. Naqui, J.; Martín, F. Angular Displacement and Velocity Sensors Based on Electric-LC (ELC) Loaded Microstrip Lines. IEEE Sens. J. 2014, 14, 939–940. [Google Scholar] [CrossRef] [Scilit]
  7. Jha, A.K.; Delmonte, N.; Lamecki, A.; Mrozowski, M.; Bozzi, M. Design of Microwave-Based Angular Displacement Sensor. IEEE Microw. Wirel. Compon. Lett. 2019, 29, 306–308. [Google Scholar] [CrossRef] [Scilit]
  8. Ding, Y.; Lee, C.-S.; Li, Y.; Wang, Z.-Q.; Li, G.-F. An Angular Displacement Sensor Based Active-Feedback Open Complementary Split-Ring Resonator. IEEE Microw. Wirel. Compon. Lett. 2021, 31, 1079–1082. [Google Scholar] [CrossRef] [Scilit]
  9. Abdolrazzaghi, M.; Daneshmand, M. Multifunctional Ultrahigh Sensitive Microwave Planar Sensor to Monitor Mechanical Motion: Rotation, Displacement, and Stretch. Sensors 2020, 20, 1184. [Google Scholar] [CrossRef] [Scilit] [PubMed]
  10. Yan, J.; Chen, X.; Ma, R. A Planar Microwave Angular Displacement Sensor Based on Microstrip Line Loaded Split Ring Resonators. In Proceedings of the 2024 International Conference on Microwave and Millimeter Wave Technology (ICMMT), Beijing, China, 16–19 May 2024; pp. 1673–1675. [Google Scholar] [CrossRef] [Scilit]
  11. Baena, J.D.; Bonache, J.; Martín, F.; Sillero, R.M.; Falcone, F.; Lopetegi, T.; Laso, M.A.G.; García-García, J.; Gil, I.; Portillo, M.F.; et al. Equivalent-Circuit Models for Split-Ring Resonators and Complementary Split-Ring Resonators Coupled to Planar Transmission Lines. IEEE Trans. Microw. Theory Tech. 2005, 53, 1451–1461. [Google Scholar] [CrossRef] [Scilit]
  12. Rasmussen, C.E.; Williams, C.K.I. Gaussian Processes for Machine Learning; MIT Press: Cambridge, MA, USA, 2006. [Google Scholar]
  13. Jacobs, R.A.; Jordan, M.I.; Nowlan, S.J.; Hinton, G.E. Adaptive Mixtures of Local Experts. Neural Comput. 1991, 3, 79–87. [Google Scholar] [CrossRef] [Scilit] [PubMed]
  14. Jordan, M.I.; Jacobs, R.A. Hierarchical Mixtures of Experts and the EM Algorithm. Neural Comput. 1994, 6, 181–214. [Google Scholar] [CrossRef] [Scilit]
  15. Jolliffe, I.T.; Cadima, J. Principal Component Analysis: A Review and Recent Developments. Philos. Trans. R. Soc. A Math. Phys. Eng. Sci. 2016, 374, 20150202. [Google Scholar] [CrossRef] [Scilit] [PubMed]
  16. Mardia, K.V.; Jupp, P.E. Directional Statistics; John Wiley & Sons: Chichester, UK, 1999. [Google Scholar] [CrossRef] [Scilit]
  17. Hu, P.; Guo, J.; Tan, J. An Annular Planar-Capacitive Tilt Sensor with a 360° Measurement Range. IEEE Trans. Ind. Electron. 2016, 63, 2469–2476. [Google Scholar] [CrossRef] [Scilit]
  18. Maleki Gargari, A.; Ozbey, B.; Demir, H.V.; Altintas, A.; Albostan, U.; Kurc, O.; Ertürk, V.B. A Wireless Metamaterial-Inspired Passive Rotation Sensor with Submilliradian Resolution. IEEE Sens. J. 2018, 18, 4482–4490. [Google Scholar] [CrossRef] [Scilit]
  19. Teng, C.; Chio, C.-H.; Tam, K.W.; Lau, P.-Y. An Angular Displacement Microwave Sensor with 360° Dynamic Range Using Multi-Mode Resonator. IEEE Sens. J. 2021, 21, 2899–2907. [Google Scholar] [CrossRef] [Scilit]
  20. Horestani, A.K.; Shaterian, Z.; Mrozowski, M. A Compact and Lightweight Microwave Tilt Sensor Based on an SRR-Loaded Microstrip Line. In Proceedings of the 2022 24th International Microwave and Radar Conference (MIKON), Gdańsk, Poland, 12–14 September 2022; pp. 399–401. [Google Scholar] [CrossRef] [Scilit]
  21. Andevari, S.A.; Olvera-Cervantes, J.-L.; Saavedra, C.E. Inclination Sensor with a Wide Angle Measurement Range Using Half-Wavelength Microstrip Resonator. IEEE Access 2023, 11, 28699–28705. [Google Scholar] [CrossRef] [Scilit]
  22. Yi, Z.; Xia, Z.; Li, X.; Xu, K.; Xie, L.; Xue, S.; Wu, Y. Passive Inclination Sensor Based on a Patch Antenna with a Reconfigurable Water Load. Sensors 2024, 24, 6744. [Google Scholar] [CrossRef] [Scilit] [PubMed]
  23. Kumar, A.V.P.; Regalla, P. A Novel Microwave Dielectric Resonator-Based Differential Frequency Sensor for Angular Displacement Detection. Sens. Actuators A Phys. 2025, 388, 116480. [Google Scholar] [CrossRef] [Scilit]
Figure 1. The structure of the proposed attitude sensor, including the PCB substrate, microstrip transmission line, SRR, metallic disk and the nonconductive guide structure.
Electronics 15 03897 g001
Figure 2. CST full wave simulated S-parameters of the proposed sensor when the metallic disk is at different angular positions. (a) S 11 ; (b) S 12 ; (c) S 13 ; (d) S 22 ; (e) S 24 ; (f) S 33 ; (g) S 34 ; (h) S 44 .
Electronics 15 03897 g002
Figure 3. CST full wave simulated electric field distributions on the SRR plane for different angular positions of the metallic disk (Port 1 excitation). (a) Unperturbed structure; (b) field distribution with the metallic disk at θ = 0 ° ; (c) disk at θ = 90 ° ; (d) disk at θ = 180 ° ; (e) disk at θ = 90 ° . The black dashed circles indicate the corresponding positions of the metallic disk.
Electronics 15 03897 g003
Figure 4. Equivalent circuit of the proposed sensing structure and its simulation validation. (a) Equivalent circuit of the sensing structure; (b) comparison between ADS circuit simulation and CST full wave simulation without the metallic disk; (c) comparison between the two simulation methods with the disk at −135°.
Electronics 15 03897 g004
Figure 5. Fabricated device and experimental measurement system. (a) PCB sensor prototype; (b) front view of the 3D-printed nonconductive guide structure; (c) rear view of the 3D-printed nonconductive guide structure; (d) assembly of the PCB, guide structure, and the metallic disk; (e) angular loading and mounting arrangement; (f) circuit connection of the measurement system.
Electronics 15 03897 g005
Figure 6. Prediction pipeline of the MoE-GPR framework. In the hard routing stage, i * denotes the index of the local expert with the highest predicted gating probability.
Electronics 15 03897 g006
Figure 7. Measured S-parameter responses at different angular positions of the metallic disk. (a) S 11 ; (b) S 12 ; (c) S 13 ; (d) S 22 ; (e) S 24 ; (f) S 33 ; (g) S 34 ; (h) S 44 .
Electronics 15 03897 g007
Figure 8. Comparison of representative spectral descriptors extracted from CST full wave simulations and experimental measurements. (a) S 11 m ; (b) S 12 v f ; (c) S 13 m ; (d) S 22 v f ; (e) S 24 m ; (f) S 33 m ; (g) S 34 v f ; (h) S 44 v f ). Blue curves denote experimental results and orange curves denote simulation results.
Electronics 15 03897 g008
Figure 9. Repeatability and directional consistency of representative spectral descriptors during three independent scans over the full angular range. (a) Variation in the S 22 valley frequency; (b) repeatability difference in the S 22 valley frequency between the two CW scans; (c) directional difference in the S 22 valley frequency; (d) variation in the S 13 average magnitude; (e) repeatability difference in the S 13 average magnitude between the two CW scans; (f) directional difference in the S 13 average magnitude. The repeatability difference is defined as the absolute difference between the two CW scans, whereas the directional difference is defined as the CCW response minus the average response of the two CW scans.
Electronics 15 03897 g009
Figure 10. The 12 global descriptors used by the PCA assisted logistic hard gate and their representation in principal component space. (a) Standardized response heatmap of the 12 descriptors over the full angular range, with gray dashed lines and black solid lines denoting the circular residual reference centers and expert routing label boundaries, respectively; (b) distribution of measured samples in PC1–PC3 score space.
Electronics 15 03897 g010
Figure 11. Standardized trajectories of the spectral descriptors used by the four local GPR experts. (a) Expert 0, centered at 15°; (b) Expert 1, centered at −15°; (c) Expert 2, centered at 105°; (d) Expert 3, centered at −105°. The descriptors are standardized using samples from the corresponding expert training ranges. Frequency and magnitude descriptors are displayed separately. Light and dark shading indicate the expert training ranges and nominal responsibility ranges, respectively. Black solid lines mark the expert centers, whereas blue dashed lines mark the nominal boundaries.
Electronics 15 03897 g011
Figure 12. Angle reconstruction results of the final frozen configuration B3 in the LOAO evaluation. (a) Absolute reconstruction error as a function of the ground truth angle; (b) Predicted angle.
Electronics 15 03897 g012
Table 1. Geometrical parameters of the proposed sensing structure.
ParameterDescriptionValue
h Substrate thickness1.6 mm
a Substrate length100 mm
b Substrate width61 mm
R 1 Coupling arm radius10.2 mm
w 1 Coupling arm width2.7 mm
g s t u b Gap angle between coupling arms10°
R 2 SRR radius7.35 mm
w 2 SRR trace width1 mm
g S R R SRR split width1 mm
D m Metallic disk diameter10 mm
t Metallic disk thickness2 mm
R t r a j Metallic disk rotation radius R 1 + R 2 / 2 = 8.775   m m
w t r a j Guide track width10.2 mm
t t r a j Guide track thickness2.1 mm
Table 2. Representative fitted lumped parameters in the ADS equivalent circuit model under four angular positions.
Parameter CategoryComponent90°−90°180°
Ind. L s 3 / L s 1 8.00 nH8.01 nH8.01 nH5.04 nH
Ind. L s 4 / L s 2 8.00 nH8.00 nH7.99 nH9.76 nH
Ind. L s 6 / L s 5 1.10 nH1.23 nH1.26 nH1.28 nH
Ind. L a 3 / L a 1 0.100 nH0.0204 nH0.0112 nH0.0134 nH
Ind. L a 4 / L a 2 0.304 nH0.0198 nH0.0241 nH0.745 nH
Ind. L m 1 / L m 2 0.378 nH0.361 nH0.327 nH1.62 nH
Cap. C g a p 0.350 pF0.197 pF0.196 pF0.155 pF
Cap. C c 1 / C c 3 0.0570 pF0.488/0.102 pF0.105/0.546 pF0.807 pF
Cap. C c 2 / C c 4 1.40 pF0.238/0.203 pF0.196/0.253 pF0.00447 pF
Cap. C g 1 / C g 3 0.00324 pF0.0256/0.0101 pF0.00333/0.00297 pF1.40 pF
Cap. C g 2 / C g 4 0.986 pF0.107/0.637 pF0.621/0.0928 pF0.279 pF
Table 3. Candidate descriptor pool used for angle reconstruction.
Descriptor CategoryData Source
Peak magnitude S 11 p v , S 13 p v , S 24 p v , S 33 p v
Peak frequency S 11 p f , S 13 p f , S 24 p f , S 33 p f
Valley magnitude S 12 v d , S 22 v d , S 34 v d , S 44 v d
Valley frequency S 12 v f , S 22 v f , S 34 v f , S 44 v f
Band averaged magnitude S 11 m , S 12 m , S 13 m , S 22 m , S 24 m , S 33 m , S 34 m , S 44 m
Table 4. Center angles, training angle ranges, responsibility ranges, and final input descriptors of the four local GPR experts.
GPR ExpertCenterTraining Angle RangeGate Label RangeSelected S-Parameter Descriptors
0 15 ° [ 40.0 ° , 102.1 ° ) [ 0 ° , 84.4 ° ) S 44 v f ,   S 33 m ,   S 11 m
1 15 ° [ 94.4 ° , 23.2 ° ) [ 84.4 ° , 0 ° ) S 22 v f ,   S 11 m ,   S 33 m
2 105 ° 67.7 ° , 180 ° 180 ° , 152.0 ° 84.4 ° , 180 ° S 44 m ,   S 24 p f ,   S 13 m ,   S 11 p v ,   S 34 m ,   S 34 v d ,   S 24 m ,   S 44 v f ,   S 33 m
3 105 ° 132.2 ° , 180 ° [ 180 ° , 56.2 ° ) 180 ° , 84.4 ° S 24 p f ,   S 13 m ,   S 11 p v ,   S 12 m ,   S 34 v d ,   S 24 m ,   S 44 v f
Table 5. Model configurations used for the B0–B3 controlled ablation study.
IDRegression StructureGate InputRegression InputTraining Sample Assignment
SVRSupport vector regression12 global descriptorsComplete training set
RFRandom forest regression12 global descriptorsComplete training set
KNNK-nearest neighbor
regression
12 global descriptorsComplete training set
B0Global circular GPR12 global descriptorsComplete training set
B1Four expert MoE-GPRPCA assisted logistic hard gate using 12 global descriptors12 global descriptors shared by all expertsSamples within the nominal responsibility ranges
B2Four expert MoE-GPRPCA assisted logistic hard gate using 12 global descriptorsExpert-specific descriptor subsetsSamples within the nominal responsibility ranges
B3Four expert MoE-GPRPCA assisted logistic hard gate using 12 global descriptorsExpert-specific descriptor subsetsSamples within the expanded expert training ranges (Table 4)
Table 6. LOAO ablation results on the dataset sampled at 2.5° intervals for configurations B0–B3.
IDMAE (°)RMSE (°)P90 (°)Max (°)Boundary MAE (°)Routing Accuracy
SVR1.1611.5082.5466.6351.051
RF1.9032.6524.63111.5831.346
KNN2.6593.6605.33012.7112.102
B00.9181.1981.9154.1001.147
B10.9071.2711.8015.0451.1590.951
B20.7410.9501.5302.8971.0450.951
B30.7000.8811.4442.4800.9210.951
Table 7. Cross-sampling evaluation results.
IDMAE (°)P90 (°)Max (°)ΔMAE (°)
B01.6323.3876.738
B11.5093.5338.3680.123
B21.2812.6745.3940.228
B31.1252.1604.8410.156
Pairwise ΔMAE denotes the reduction in MAE relative to the preceding configuration. Positive values indicate improved accuracy.
Disclaimer/Publisher’s Note: The statements, opinions and data contained in all publications are solely those of the individual author(s) and contributor(s) and not of MDPI and/or the editor(s). MDPI and/or the editor(s) disclaim responsibility for any injury to people or property resulting from any ideas, methods, instructions or products referred to in the content.