1. Introduction
Wireless charging technologies have attracted considerable attention in applications such as unmanned aerial vehicles (UAVs) and electric vehicles (EVs) because they eliminate exposed electrical contacts and improve charging flexibility [
1,
2,
3,
4,
5]. Rail trams also represent a promising application scenario for inductive power transfer (IPT). Their fixed trajectories and exclusive rights-of-way enable charging infrastructure to be installed at predetermined locations, while the rails constrain lateral vehicle displacement and thereby reduce one source of coil misalignment. In addition, static or dynamic IPT may reduce dependence on overhead contact-line systems and decrease the required onboard energy-storage capacity [
6,
7]. However, these potential advantages do not imply that IPT implementation in rail trams is straightforward. The long vehicle body, high traction-energy demand, variation in the vertical air gap under different passenger loads, and dynamic operating conditions impose stricter requirements on transmission power, efficiency, output stability, and misalignment tolerance. As the principal component responsible for electromagnetic energy transfer, the magnetic coupler therefore requires an effective performance-evaluation method for comparing alternative design configurations.
The principal challenges in applying IPT systems to rail trams include achieving high transmission efficiency, high power capability, stable output, and sufficient tolerance to variations in the relative position of the transmitting and receiving coils. Existing studies have proposed different magnetic-coupler structures for specific performance objectives. Song et al. [
8] developed a narrow-rail three-phase magnetic coupler to reduce output-power fluctuations during dynamic wireless charging. Jiang et al. [
9] designed an M-shaped magnetic coupler for railway applications and investigated the effects of coil geometry and misalignment on its electrical parameters. Inoue et al. [
10] investigated a high-temperature superconducting coil structure to improve robustness against coil misalignment in wireless power transmission systems for railway vehicles. More recently, Zhu et al. [
11] proposed a flexible winding structure to enhance the coupling performance of wireless power transfer systems. These studies demonstrate that magnetic-coupler performance can be improved through structural optimization. However, most existing designs focus on one or several individual objectives, such as output power, transmission efficiency, power density, or misalignment tolerance. Improvements in one performance dimension may be accompanied by deterioration in another, making it difficult to select an appropriate configuration solely on the basis of a single indicator.
The design and selection of a magnetic coupler are therefore multi-criteria decision-making problems. In addition to output power and transmission efficiency, practical designs should consider output-voltage fluctuation, allowable air-gap variation, longitudinal misalignment, installation-space constraints, charging duration, vehicle operating speed, and the volume of the power-transfer components. The analytic hierarchy process (AHP) has been widely used to address multi-criteria decision-making problems, particularly when qualitative and quantitative criteria must be considered simultaneously [
12,
13,
14]. Fuzzy methods have also been combined with AHP to represent uncertainty in expert judgments [
13,
14,
15]. For IPT systems, existing evaluation studies have mainly focused on individual aspects, such as electromagnetic interference [
16], thermal performance [
17], and insulation performance [
18]. In the transportation field, Xiang et al. [
19] combined AHP with a fuzzy comprehensive evaluation method to compare conventional and interleaved DD–DD magnetic-coupler configurations for electric vehicles. Although such methods enable multiple indicators to be considered, their judgment matrices remain strongly dependent on expert pairwise comparisons. This dependence may introduce uncertainty when the expert group is small or when application-specific engineering experience is limited, as is currently the case for high-power IPT systems used in rail trams.
Bibliometric analysis provides a systematic method for identifying publication patterns, research priorities, and changes in scientific attention within a defined field [
20,
21,
22]. In the proposed framework, bibliometric keyword-occurrence statistics are used as an external source of evidence to support the initial construction of AHP judgment matrices. Indicators that occur more frequently in the selected literature dataset are regarded as indicators that have received greater research attention. However, publication frequency is not considered an absolute measure of engineering importance, and the proposed method does not completely eliminate subjectivity. Database selection, search strategy, keyword-cleaning procedures, synonym-merging rules, and the frequency-to-scale transformation may all influence the resulting weights. The purpose of introducing bibliometric evidence is therefore to reduce, rather than completely replace, the dependence of conventional AHP on the judgments of a small expert group. The resulting judgment matrices are subsequently examined using the AHP consistency test and sensitivity analysis.
Compared with conventional expert-based AHP, the proposed bibliometric-assisted AHP framework mainly modifies the source used to establish the initial pairwise importance relationships. Conventional AHP derives these relationships primarily from expert judgments, whereas the proposed approach uses keyword-occurrence statistics as supporting evidence and subsequently evaluates the logical consistency of the resulting matrices. The proposed method is particularly intended for preliminary design problems in which a substantial body of research literature is available but extensive application-specific expert data are not yet available.
The main contributions of this study are summarized as follows:
A hierarchical performance-evaluation framework is established for magnetic couplers used in rail–tram IPT systems. The framework incorporates power-efficiency characteristics, spatial characteristics, power density, time characteristics, and energy-transfer capability, thereby considering both electrical performance and vehicle-operating constraints.
A bibliometric-assisted AHP method is proposed to support the construction of judgment matrices using keyword-occurrence statistics. The method reduces the exclusive dependence of conventional AHP on a small group of experts while retaining the hierarchical decision structure and consistency test of AHP.
The dimensional differences among the evaluation indicators are explicitly considered. Indicators with different physical units and numerical ranges are converted into dimensionless values before weighted aggregation, providing a consistent basis for comparing candidate magnetic-coupler configurations.
A 2M2T low-floor tram is used as a case study, and the and magnetic-coupler configurations are evaluated using electromagnetic and circuit-simulation results. The case study demonstrates the application of the proposed framework under the operating and installation constraints of the investigated tram.
2. Establishment of the Evaluation Indicator System for the Magnetic Coupler of an IPT System
In evaluating the performance of a magnetic coupler in a rail–tram IPT system, considerations extend beyond the fundamental requirements of output power and transmission efficiency. Practical vehicle-related factors, such as installation space, the variation range of the air gap during operation, and the operating conditions of both static and dynamic charging, should also be considered. Accordingly, five sets of evaluation indicators are proposed:
Power-efficiency characteristics evaluation indicators;
Spatial characteristics evaluation indicators;
Power density evaluation indicators;
Time characteristics evaluation indicators;
Energy-transfer capability evaluation indicators.
The five indicator sets contain physical quantities with different units and numerical ranges. Therefore, their raw dimensional values are not directly aggregated. Before weighted evaluation, indicators appearing in weighted sums are converted into dimensionless values using the normalization procedure described in the AHP method section. In the following equations, the superscript N denotes a normalized dimensionless value. Physical indicators such as power density and energy-transfer capability retain their original definitions in this section and are normalized before they are combined with the other first-level indicators.
Definition 1. Power-Efficiency Characteristics Evaluation Indicators.
This set of indicators comprehensively evaluates the power-transfer capability, transmission efficiency, and output stability of the rail–tram IPT system. The selected primary indicators are average transmission efficiency, average transmission power, and instantaneous output-voltage stability.
The power-efficiency characteristics evaluation indicator can be expressed as
Here,
and
represent the average transmission efficiency and average transmission power, respectively. The output-voltage fluctuation is determined from the range
The term denotes the normalized output-voltage stability score derived from this fluctuation range. Because a smaller voltage fluctuation indicates better output stability, voltage fluctuation is treated as a cost-type indicator during normalization. The coefficients , , and are the corresponding local weights determined using AHP.
Definition 2. Spatial Characteristics Evaluation Indicators.
This set of indicators evaluates the spatial flexibility and misalignment tolerance of the magnetic coupler while satisfying the required power-efficiency performance. Because the lateral displacement of a rail tram is constrained by the rails, the selected spatial indicators are longitudinal displacement, transmission distance or vertical air gap, and angular deflection.
The spatial-characteristics evaluation indicator can be expressed as
Here, , , and represent the maximum allowable longitudinal displacement, transmission distance or vertical air gap, and angular deflection, respectively, while satisfying the required power-efficiency level . The coefficients , , and are the corresponding local weights. Larger allowable ranges indicate better spatial tolerance and are therefore treated as benefit-type indicators.
Definition 3. Power Density Evaluation Indicators.
Under the condition that the spatial characteristics, excitation current, and operating frequency remain unchanged, this set of indicators evaluates the output power that can be provided per unit volume of the principal power-transfer components, which mainly consist of the windings and magnetic cores.
The power-density evaluation indicator can be expressed as
Here, represents the system output power under the specified spatial operating condition, while and represent the volumes of the coil winding and magnetic core, respectively. The calculated power-density value is normalized before it is combined with the other first-level indicators. A larger value indicates better use of the available installation volume.
Definition 4. Time Characteristics Evaluation Indicators.
Subject to the requirement that the prescribed power-efficiency level is satisfied, this set of indicators evaluates the available vehicle-charging duration in both static and dynamic charging modes, as well as the operating speed during dynamic charging.
The time-characteristics evaluation indicator can be expressed as
Here, , , and represent the available static charging duration, available dynamic charging duration, and maximum allowable operating speed during dynamic charging, respectively, while satisfying the required power-efficiency level . The coefficients , , and are the corresponding local weights. Within the predefined vehicle-operation constraints, longer available charging durations and a higher allowable operating speed provide greater operational flexibility and are treated as benefit-type indicators.
Definition 5. Energy-Transfer Capability Evaluation Indicator.
With the time characteristics held constant and under constant excitation current and operating frequency, this indicator evaluates the amount of energy transferred during the available static and dynamic charging periods. Because the corresponding expression does not include a volume or mass term, it represents energy-transfer capability rather than conventional volumetric or gravimetric energy density. It can be expressed as
Here, represents the output power under the specified time characteristics. The physical dimension of is energy. Therefore, it describes energy-transfer capability rather than conventional volumetric or gravimetric energy density. The calculated value is normalized before it is combined with the other first-level indicators. A larger value indicates that more energy can be transferred during the available charging period.
Based on the analysis above, except for the power-efficiency characteristics, the remaining four indicator sets can be obtained mainly from vehicle-operation data and fundamental system parameters. To provide a more intuitive understanding of the influence of the fundamental parameters on magnetic-coupler performance, a third-level sub-objective is established specifically for the power-efficiency characteristics.
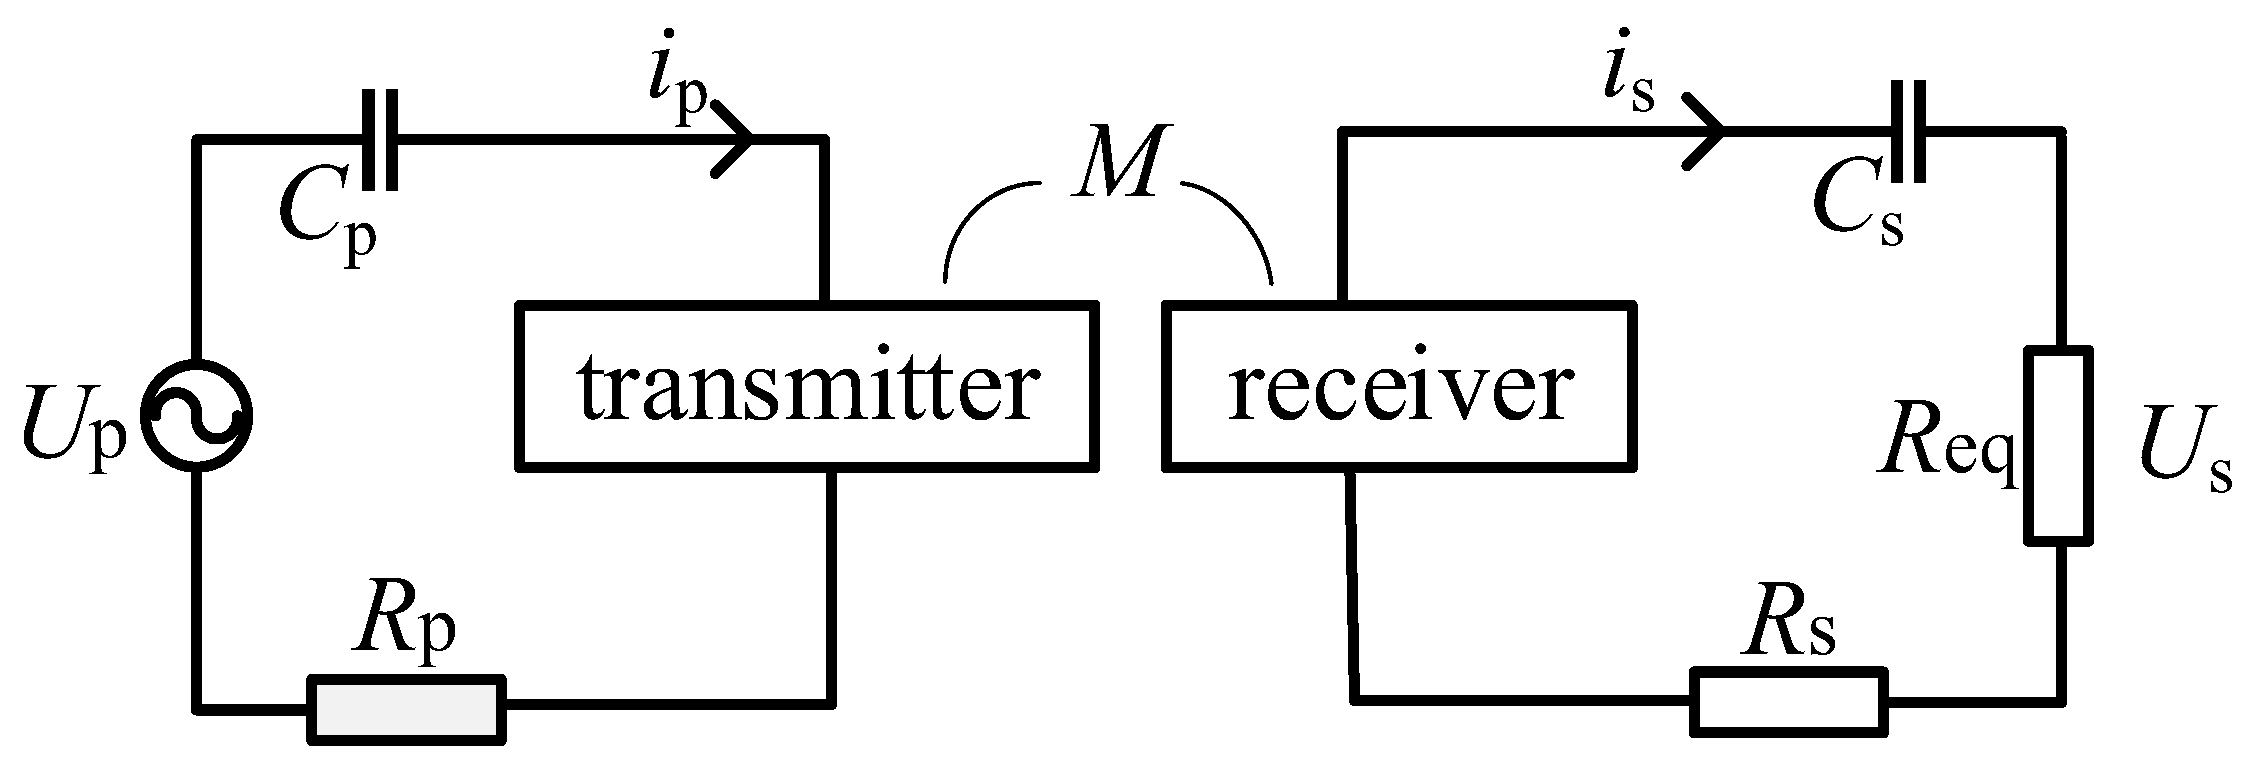
Referring to the simplified equivalent circuit of the IPT magnetic coupler shown in
Figure 1, the relationships among output power, transmission efficiency, output voltage, and the fundamental parameters can be expressed as follows:
and
Here, represents the induced current on the receiving side; is the equivalent load resistance on the receiving side; is the excitation current on the transmitting side; is the angular operating frequency, where ; M is the mutual inductance between the transmitting and receiving coils; and and are the stray resistances of the primary and secondary circuits, respectively.
Equation (
6) indicates that output power is mainly influenced by excitation current
, mutual inductance
M, operating frequency
f, and secondary-side stray resistance
. Equation (
7) indicates that transmission efficiency is mainly influenced by
M,
f,
, and
. Equation (
8) indicates that the secondary-side output voltage is mainly influenced by
,
M,
f, and
.
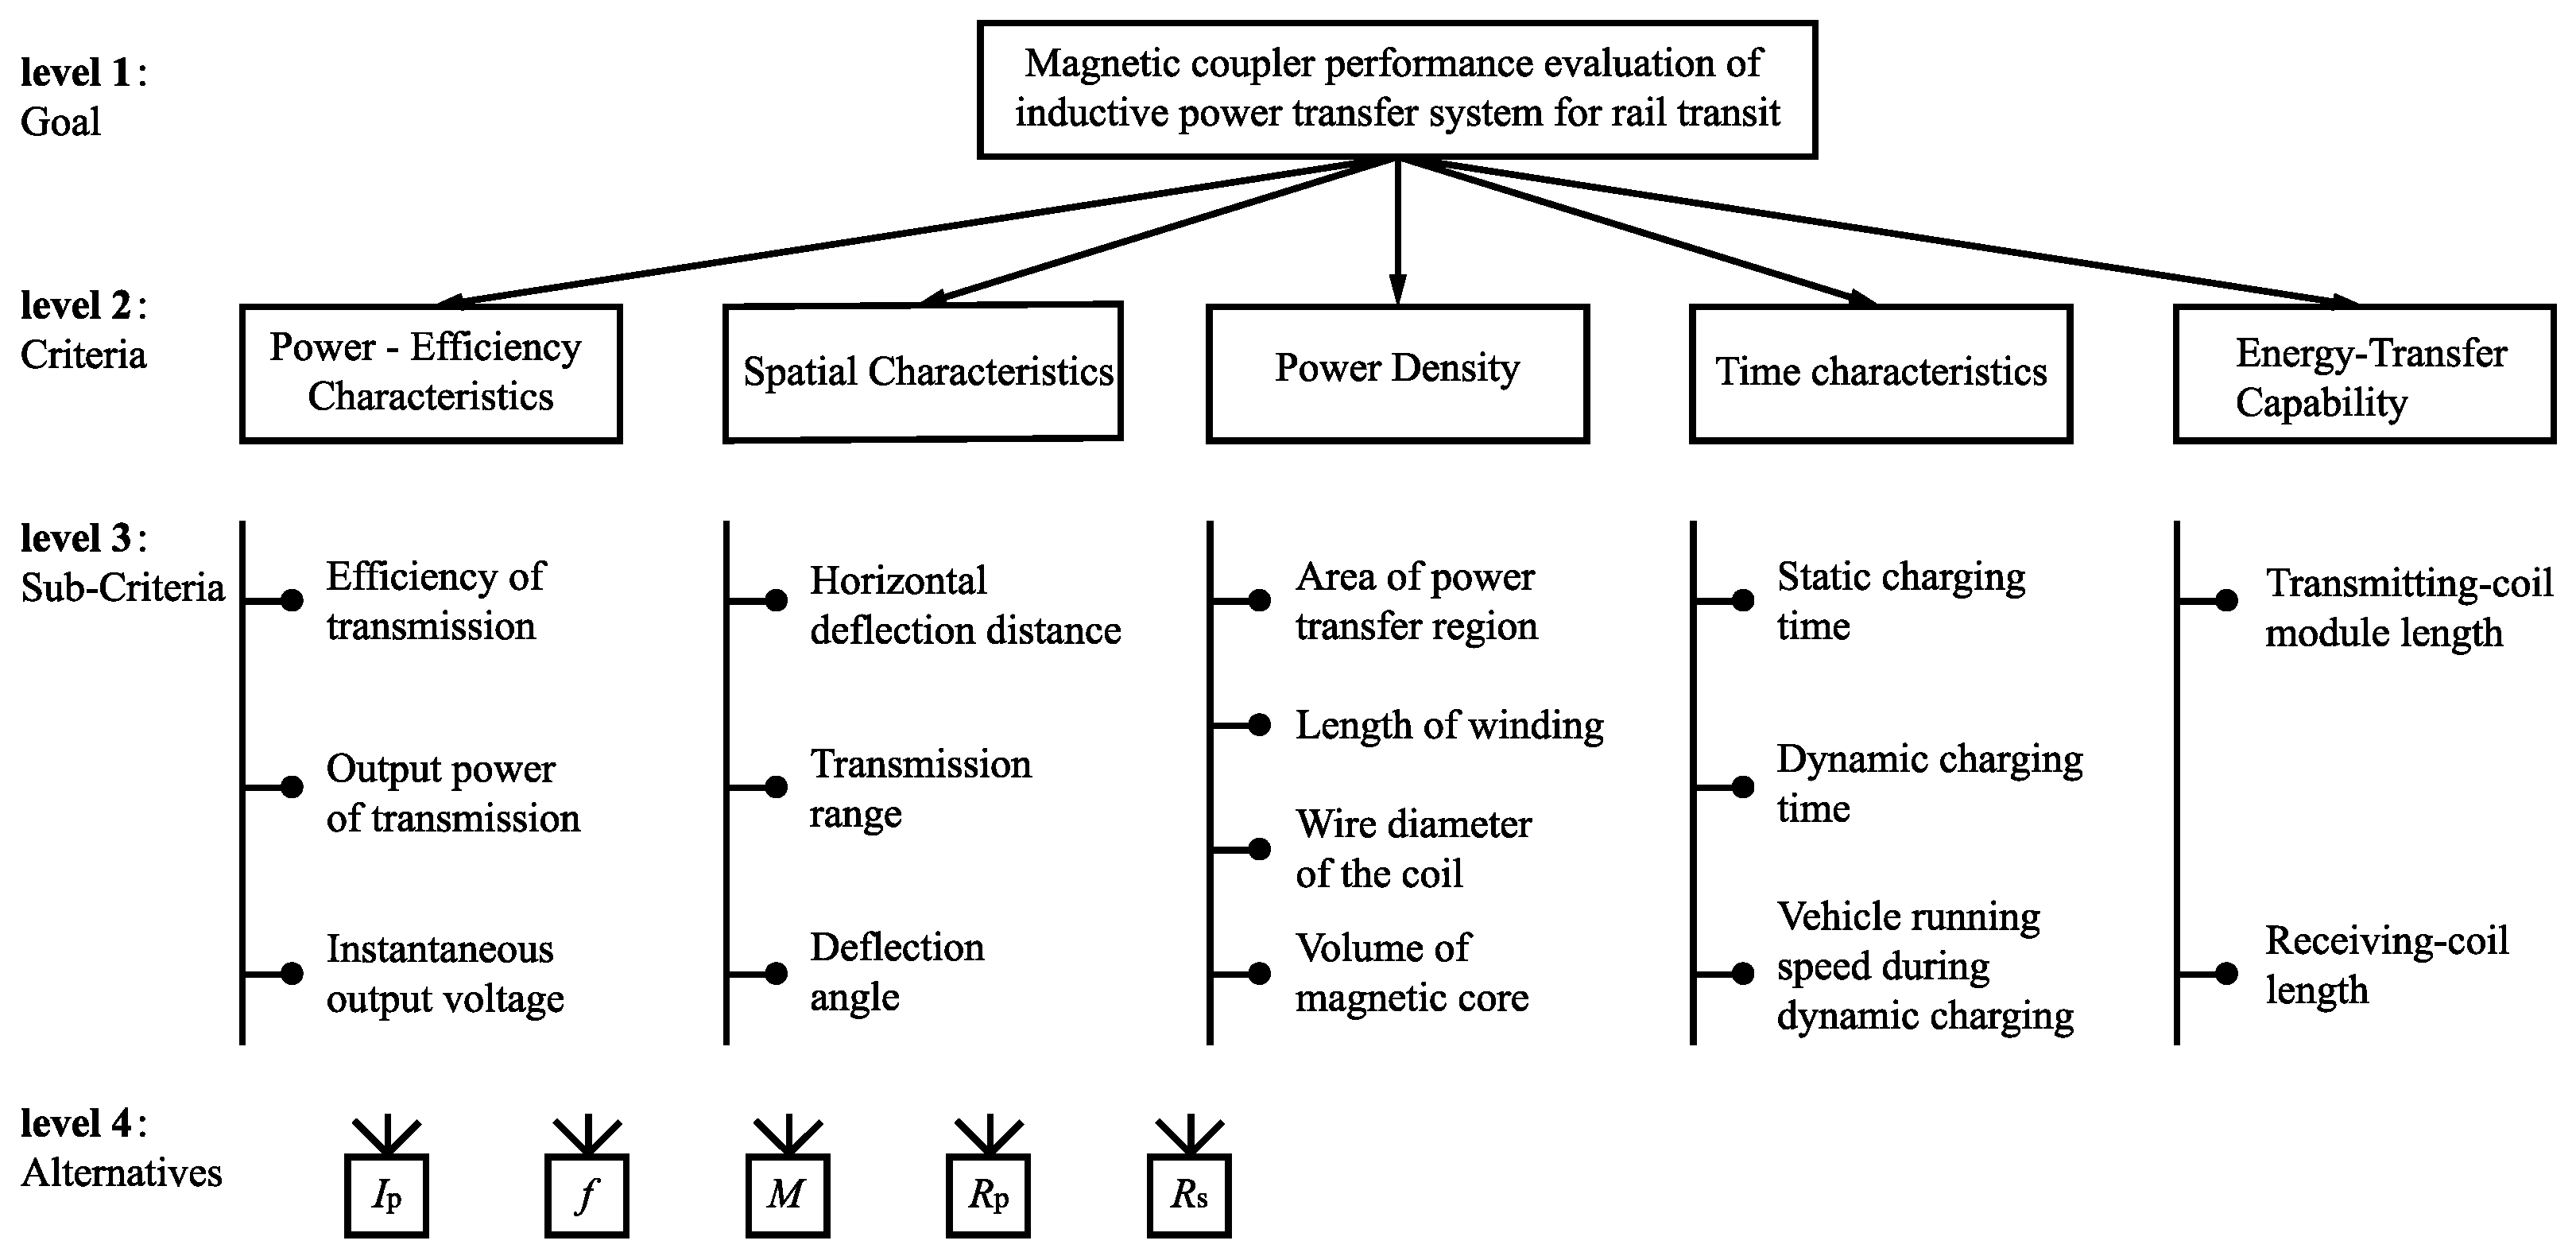
Accordingly, the excitation current, operating frequency, mutual inductance, and primary- and secondary-side stray resistances are selected as the fundamental parameters associated with the power-efficiency characteristics. Based on the five indicator sets, the hierarchical evaluation model for the magnetic coupler of a rail–tram IPT system is established, as shown in
Figure 2.
3. Bibliometric Analysis
The publications used in this study were retrieved from the Science Citation Index Expanded (SCI-Expanded) database in the Web of Science Core Collection (WoSCC). WoSCC was selected because it provides standardized bibliographic information, author keywords, institutional affiliations, and cited-reference data suitable for bibliometric analysis. Using a single database also avoids inconsistencies and duplicate records caused by combining different metadata formats from multiple databases.
The literature search was conducted on 31 December 2024. The search query was:
TS = (“wireless power trans*” AND “design*” AND “couple*”)
The wildcard symbol “*” was used to retrieve different forms of the relevant terms, such as “transfer”, “transmission”, “design”, “designing”, “coupler”, and “coupling”. The Topic field was selected to retrieve records in which these terms appeared in the title, abstract, author keywords, or Keywords Plus.
The publication period was set from 1 January 2014 to 31 December 2024. Records published outside this period were excluded to maintain a clearly defined and consistent study window. Only documents classified as “Article” were retained to maintain consistency in document type and to focus on peer-reviewed research articles. Documents belonging to other document types were excluded.
The final dataset contained 2943 records. All records were exported in BibTeX format using the “Full Record and Cited References” option. The bibliometric analyses, including annual publication analysis, country and institution analysis, source and author analysis, keyword grouping, thematic analysis, and trend analysis, were conducted using Biblioshiny, the web interface of the Bibliometrix R package running in R version 4.5.0.
For the indicator-oriented analysis presented later in
Section 3.5, directly related term variants were grouped under representative indicator terms. For example, “efficiency”, “efficient”, “high-efficiency”, and “efficiency optimization” were grouped under “Efficiency”, while “voltage”, “output voltage”, “constant-voltage”, and related expressions were grouped under “Voltage”. Terms with different technical meanings were not merged.
Keyword-occurrence frequency is used in this study as an indicator of the level of research attention received by a performance factor within the selected literature dataset. It is not regarded as a direct or absolute measurement of engineering importance. The database coverage, search terms, document-type restriction, keyword-selection procedure, and development stage of a research topic may all affect the observed frequency. Therefore, keyword statistics are used as supporting evidence for constructing the initial AHP judgment matrices, while the logical consistency and robustness of the resulting matrices are examined in the subsequent AHP analysis.
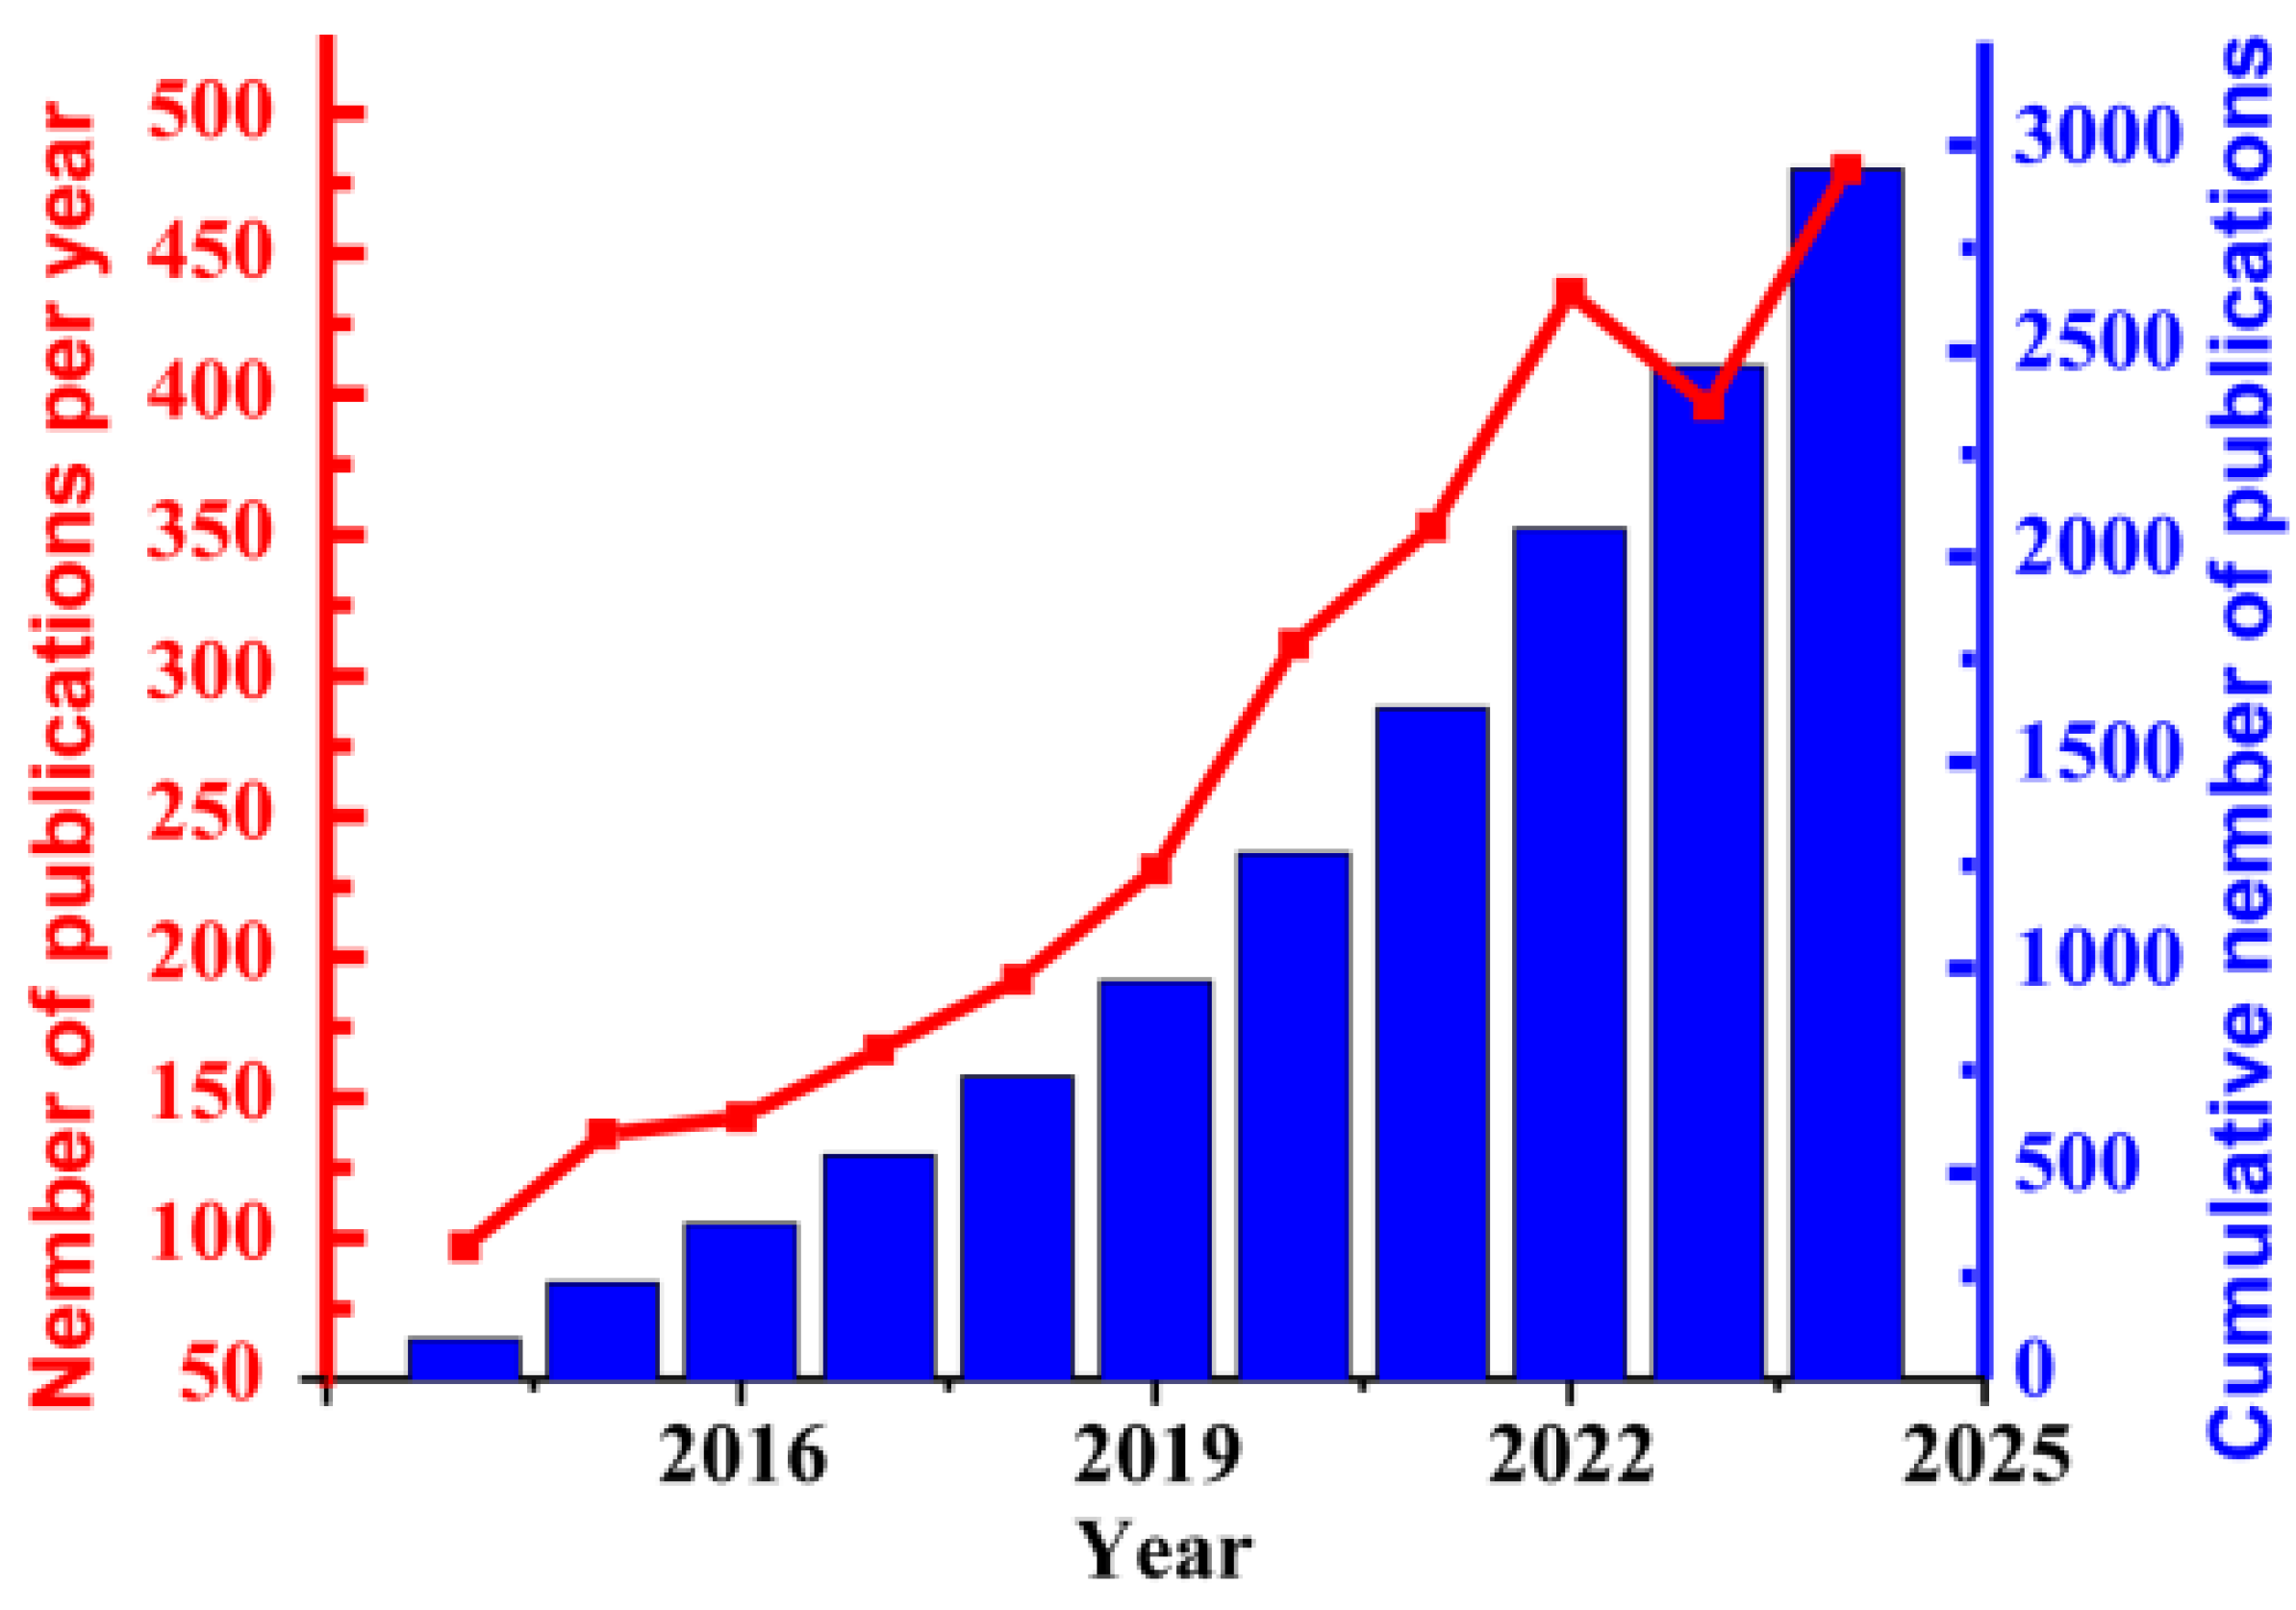
The annual distribution and cumulative number of publications are shown in
Figure 3. The overall increase in publication output during 2014–2024 indicates sustained and growing research interest in the design of magnetic couplers and related components for wireless power transfer systems.
3.1. Countries and Regions
Table 1 lists the ten countries or regions with the largest numbers of publications in the selected dataset. China ranked first with 1485 publications and 25,526 total citations, followed by the United States with 444 publications and 11,693 total citations. Republic of Korea, England, Canada, India, Japan, Italy, New Zealand, and Singapore were also among the ten most productive countries or regions.
The average publication year was 2021.02 for China and 2019.07 for the United States, indicating that a relatively large proportion of the Chinese publications appeared during the later years of the selected period. These results describe the geographic distribution of research activity in the retrieved dataset. However, publication number and citation number are affected by country size, research investment, database coverage, and publication practices and should not be interpreted as direct measurements of technical quality.
3.2. Institutions
The ten institutions with the largest numbers of publications are listed in
Table 2. Harbin Institute of Technology ranked first with 105 publications. Shanghai Jiao Tong University, the University of Auckland, and Zhejiang University each published 75 articles, followed by Chongqing University with 74 publications and the Chinese Academy of Sciences with 71 publications.
Nine of the ten institutions listed in
Table 2 are located in China, while the University of Auckland is located in New Zealand. This distribution is consistent with the large number of publications attributed to China in
Table 1. The institutional results provide contextual information on the main contributors represented in the selected dataset but are not directly used to determine the performance-indicator weights.
3.3. Journals
Table 3 presents the journals with the largest numbers of publications in the retrieved dataset. IEEE Transactions on Power Electronics ranked first with 304 publications, followed by IEEE Access with 169 publications and IEEE Transactions on Industrial Electronics with 141 publications.
The H-index values in
Table 3 describe the citation performance of the publications included in the present dataset rather than the overall journal-level H-index. Among the listed sources, IEEE Transactions on Power Electronics had the highest dataset-specific H-index of 63, followed by IEEE Transactions on Industrial Electronics with an H-index of 42 and IEEE Transactions on Microwave Theory and Techniques with an H-index of 36. The results indicate that power-electronics journals are major publication sources for research on wireless power transfer and magnetic-coupler design.
3.4. Authors
The ten most productive authors in the retrieved dataset are presented in
Table 4. Chunting C. Mi ranked first with 33 publications, followed by Aiguo Patrick Hu with 30 publications and Chunbo Zhu with 29 publications. Among the listed authors, Chunbo Zhu had the highest H-index of 17, while Chunting C. Mi, Dianguo Xu, Changsong Cai, and Junhua Wang each had an H-index of 16.
The publication and citation indicators describe author activity within the selected dataset. They provide contextual information on the development of the research field but are not used directly as substitutes for expert judgments in the AHP model.
3.5. Keyword-Occurrence Analysis
Keyword-occurrence analysis was conducted to identify the performance indicators that received sustained attention in the selected literature.
Table 5 presents the occurrence frequencies of the keywords associated with the power-efficiency characteristics and their fundamental parameters.
At the second indicator level, the representative term “Efficiency” had the largest occurrence frequency, with 317 occurrences, followed by “Power” with 192 occurrences and “Voltage” with 93 occurrences. These results indicate that transmission efficiency received the greatest research attention among the three power-efficiency indicators in the selected dataset.
At the third indicator level, “Frequency” occurred 120 times, followed by “Mutual inductance” with 39 occurrences, “Current” with 34 occurrences, and “Resistance” with 12 occurrences. The occurrence differences provide literature-derived evidence for establishing the initial pairwise importance relationships in the AHP judgment matrices.
However, a higher occurrence frequency is not assumed to prove that an indicator is always more important in every engineering application. The frequency represents research attention within the defined dataset, while the final weights are also subject to the AHP scale transformation, consistency test, and sensitivity analysis described in the following section.
3.6. Keyword Co-Occurrence and Thematic Analysis
The keyword co-occurrence analysis identified three major clusters in the research on wireless power transfer system design. The occurrence values in
Table 6 refer to individual keyword nodes in the co-occurrence network, whereas
Table 5 reports aggregated occurrences after grouping directly related term variants under representative indicator terms. The principal high-frequency terms in each cluster are summarized in
Table 6.
Cluster 1 is characterized by terms related to design and optimization, including “design”, “optimization”, “efficiency”, “system”, and “transmission”. Cluster 2 focuses on power-transfer technologies and contains terms such as “wireless power transfer”, “transfer system”, “power transfer system”, “frequency”, and “coils”. Cluster 3 contains terms associated with communication and networked applications, including “communication”, “networks”, “resource allocation”, “information”, and “internet”.
These clusters indicate that the retrieved literature covers not only the electromagnetic design and optimization of power-transfer systems, but also their interaction with communication and network infrastructures.
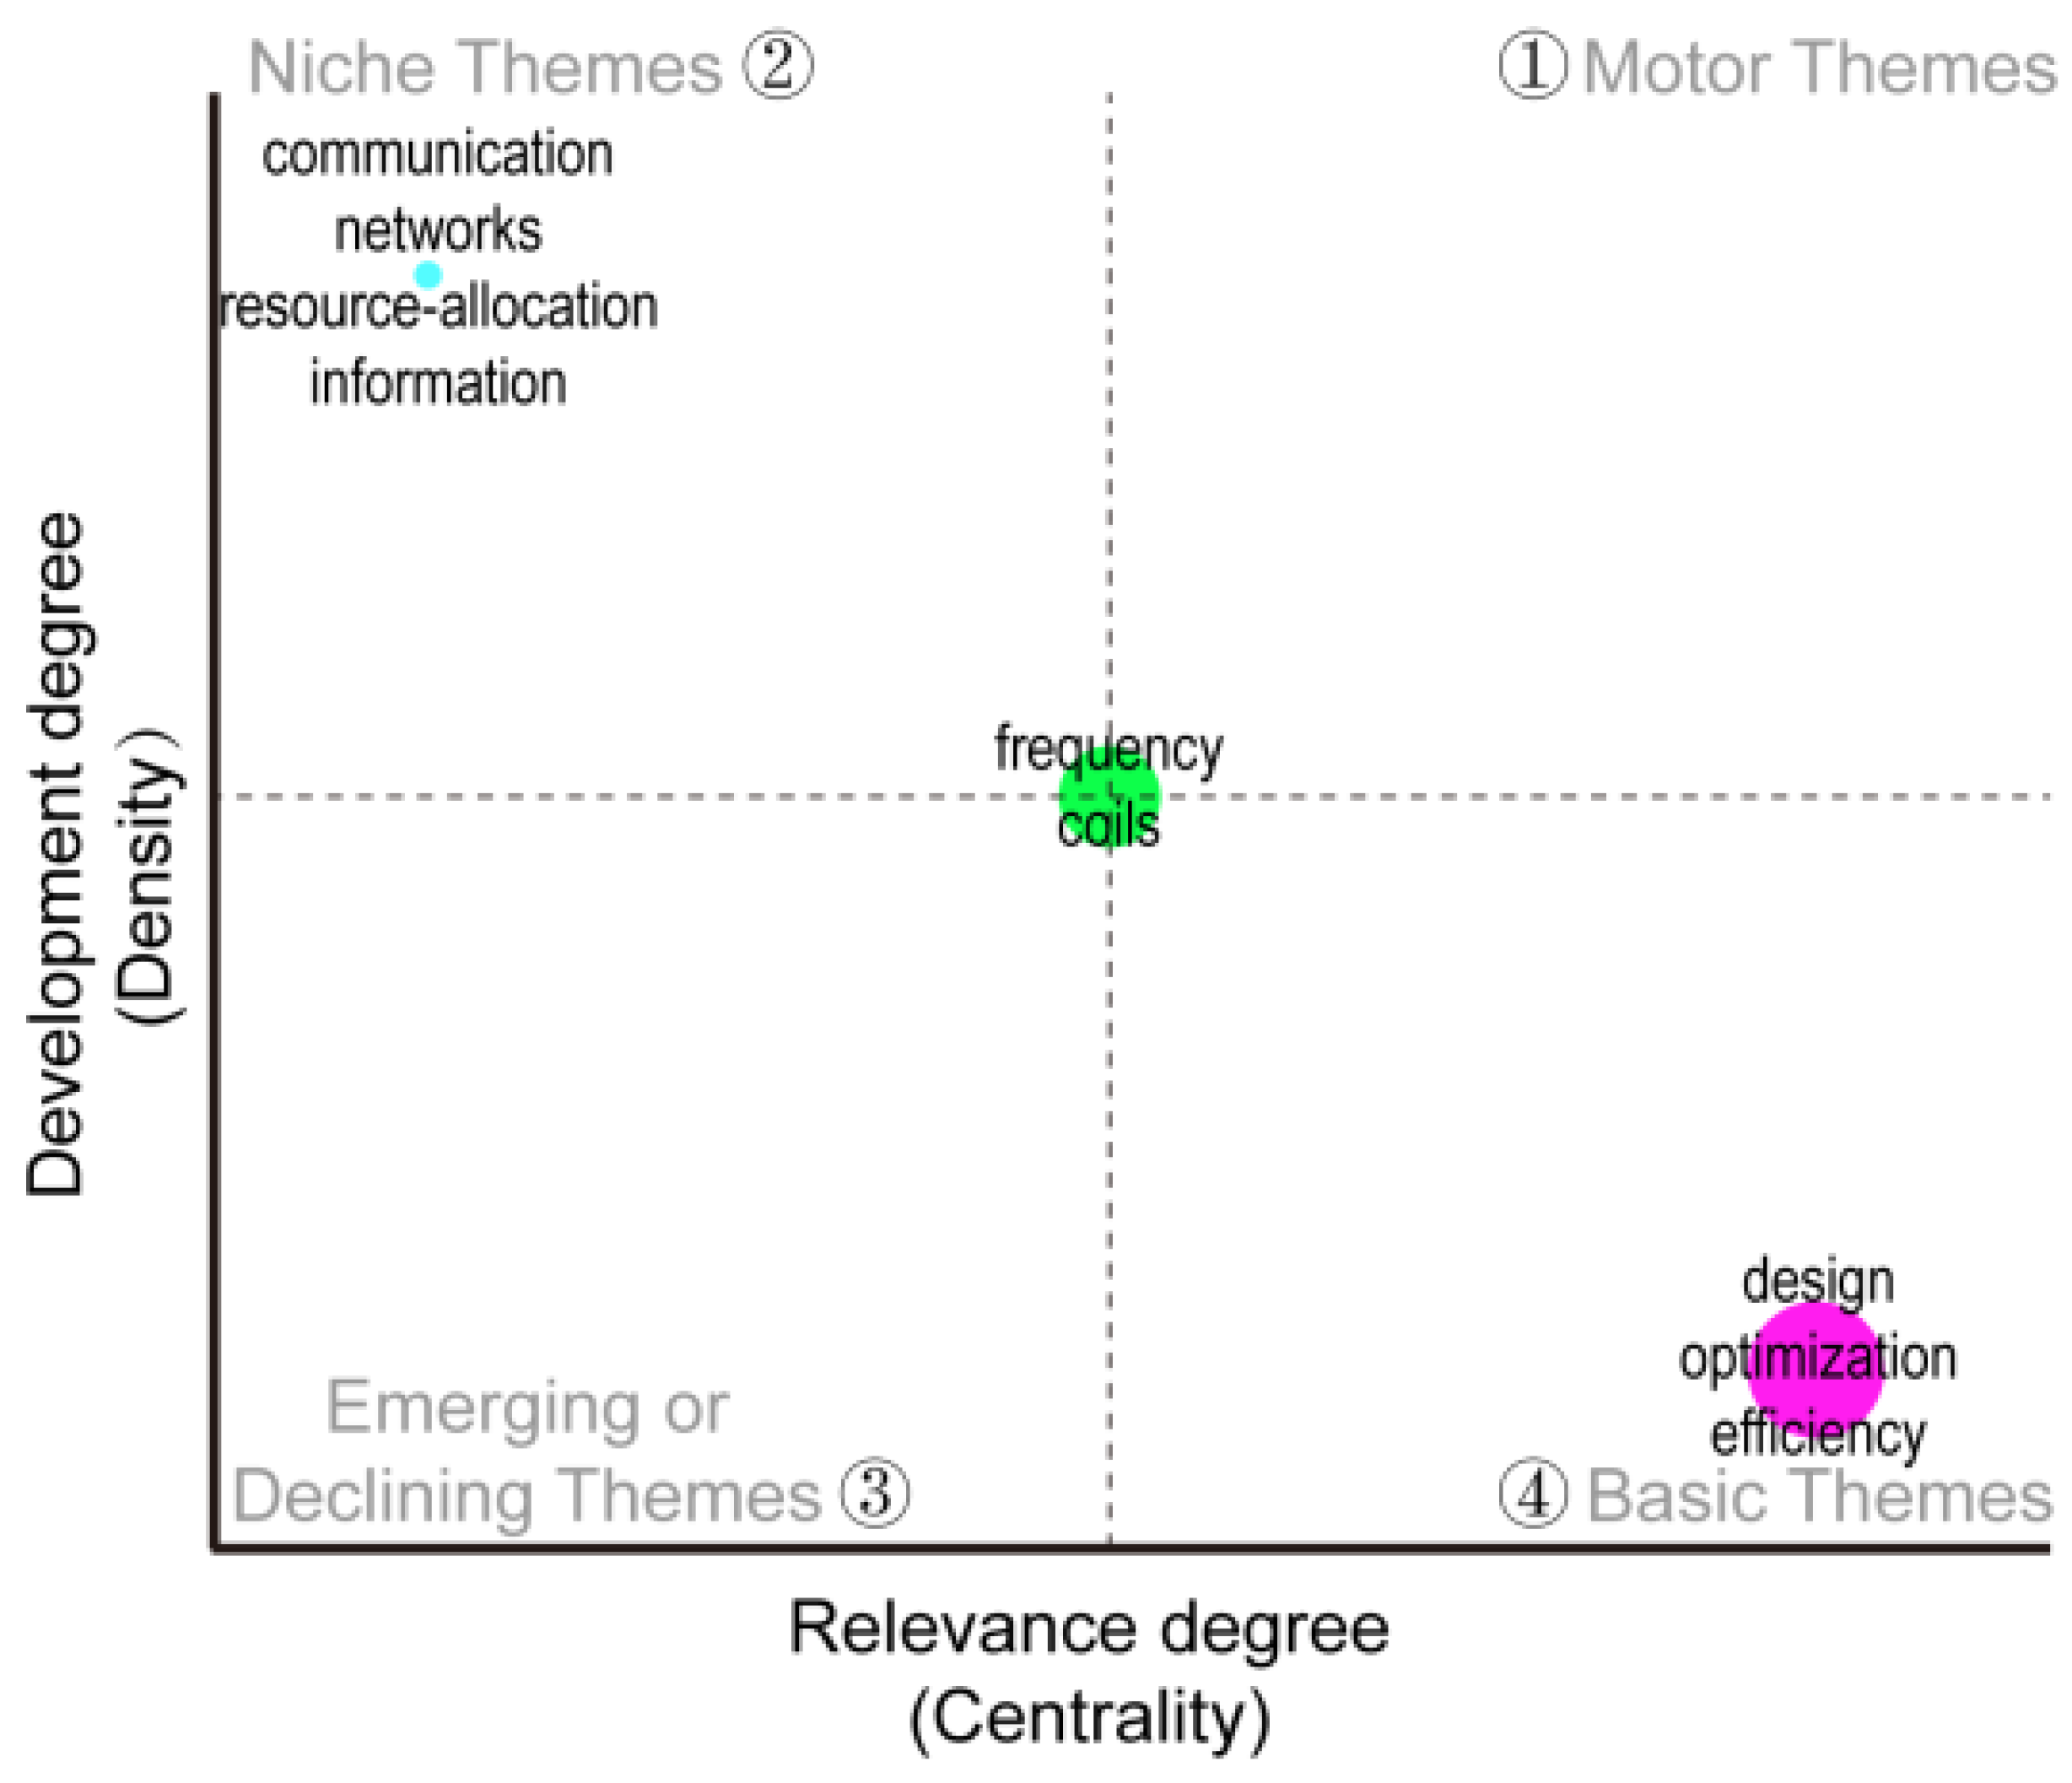
Figure 4 presents the thematic map of the retrieved literature. The horizontal axis represents thematic centrality, which reflects the relevance of a theme to the overall research field, while the vertical axis represents thematic density, which reflects the internal development of a theme.
Themes in the upper-right quadrant are motor themes with high centrality and high density. They are well developed and closely connected to the overall research field. Themes in the upper-left quadrant are niche themes with high density but relatively low centrality. These themes are internally developed but have limited connections with other themes. Themes in the lower-left quadrant are emerging or declining themes with low centrality and low density. Themes in the lower-right quadrant are basic themes with high centrality but relatively low density and represent fundamental topics with broad relevance to the field.
The thematic map indicates that design, optimization, efficiency, and power-transfer-related terms remain fundamental to IPT research, whereas communication- and network-related themes reflect the expansion of IPT toward coordinated infrastructure and connected-system applications.
3.7. Trend Analysis
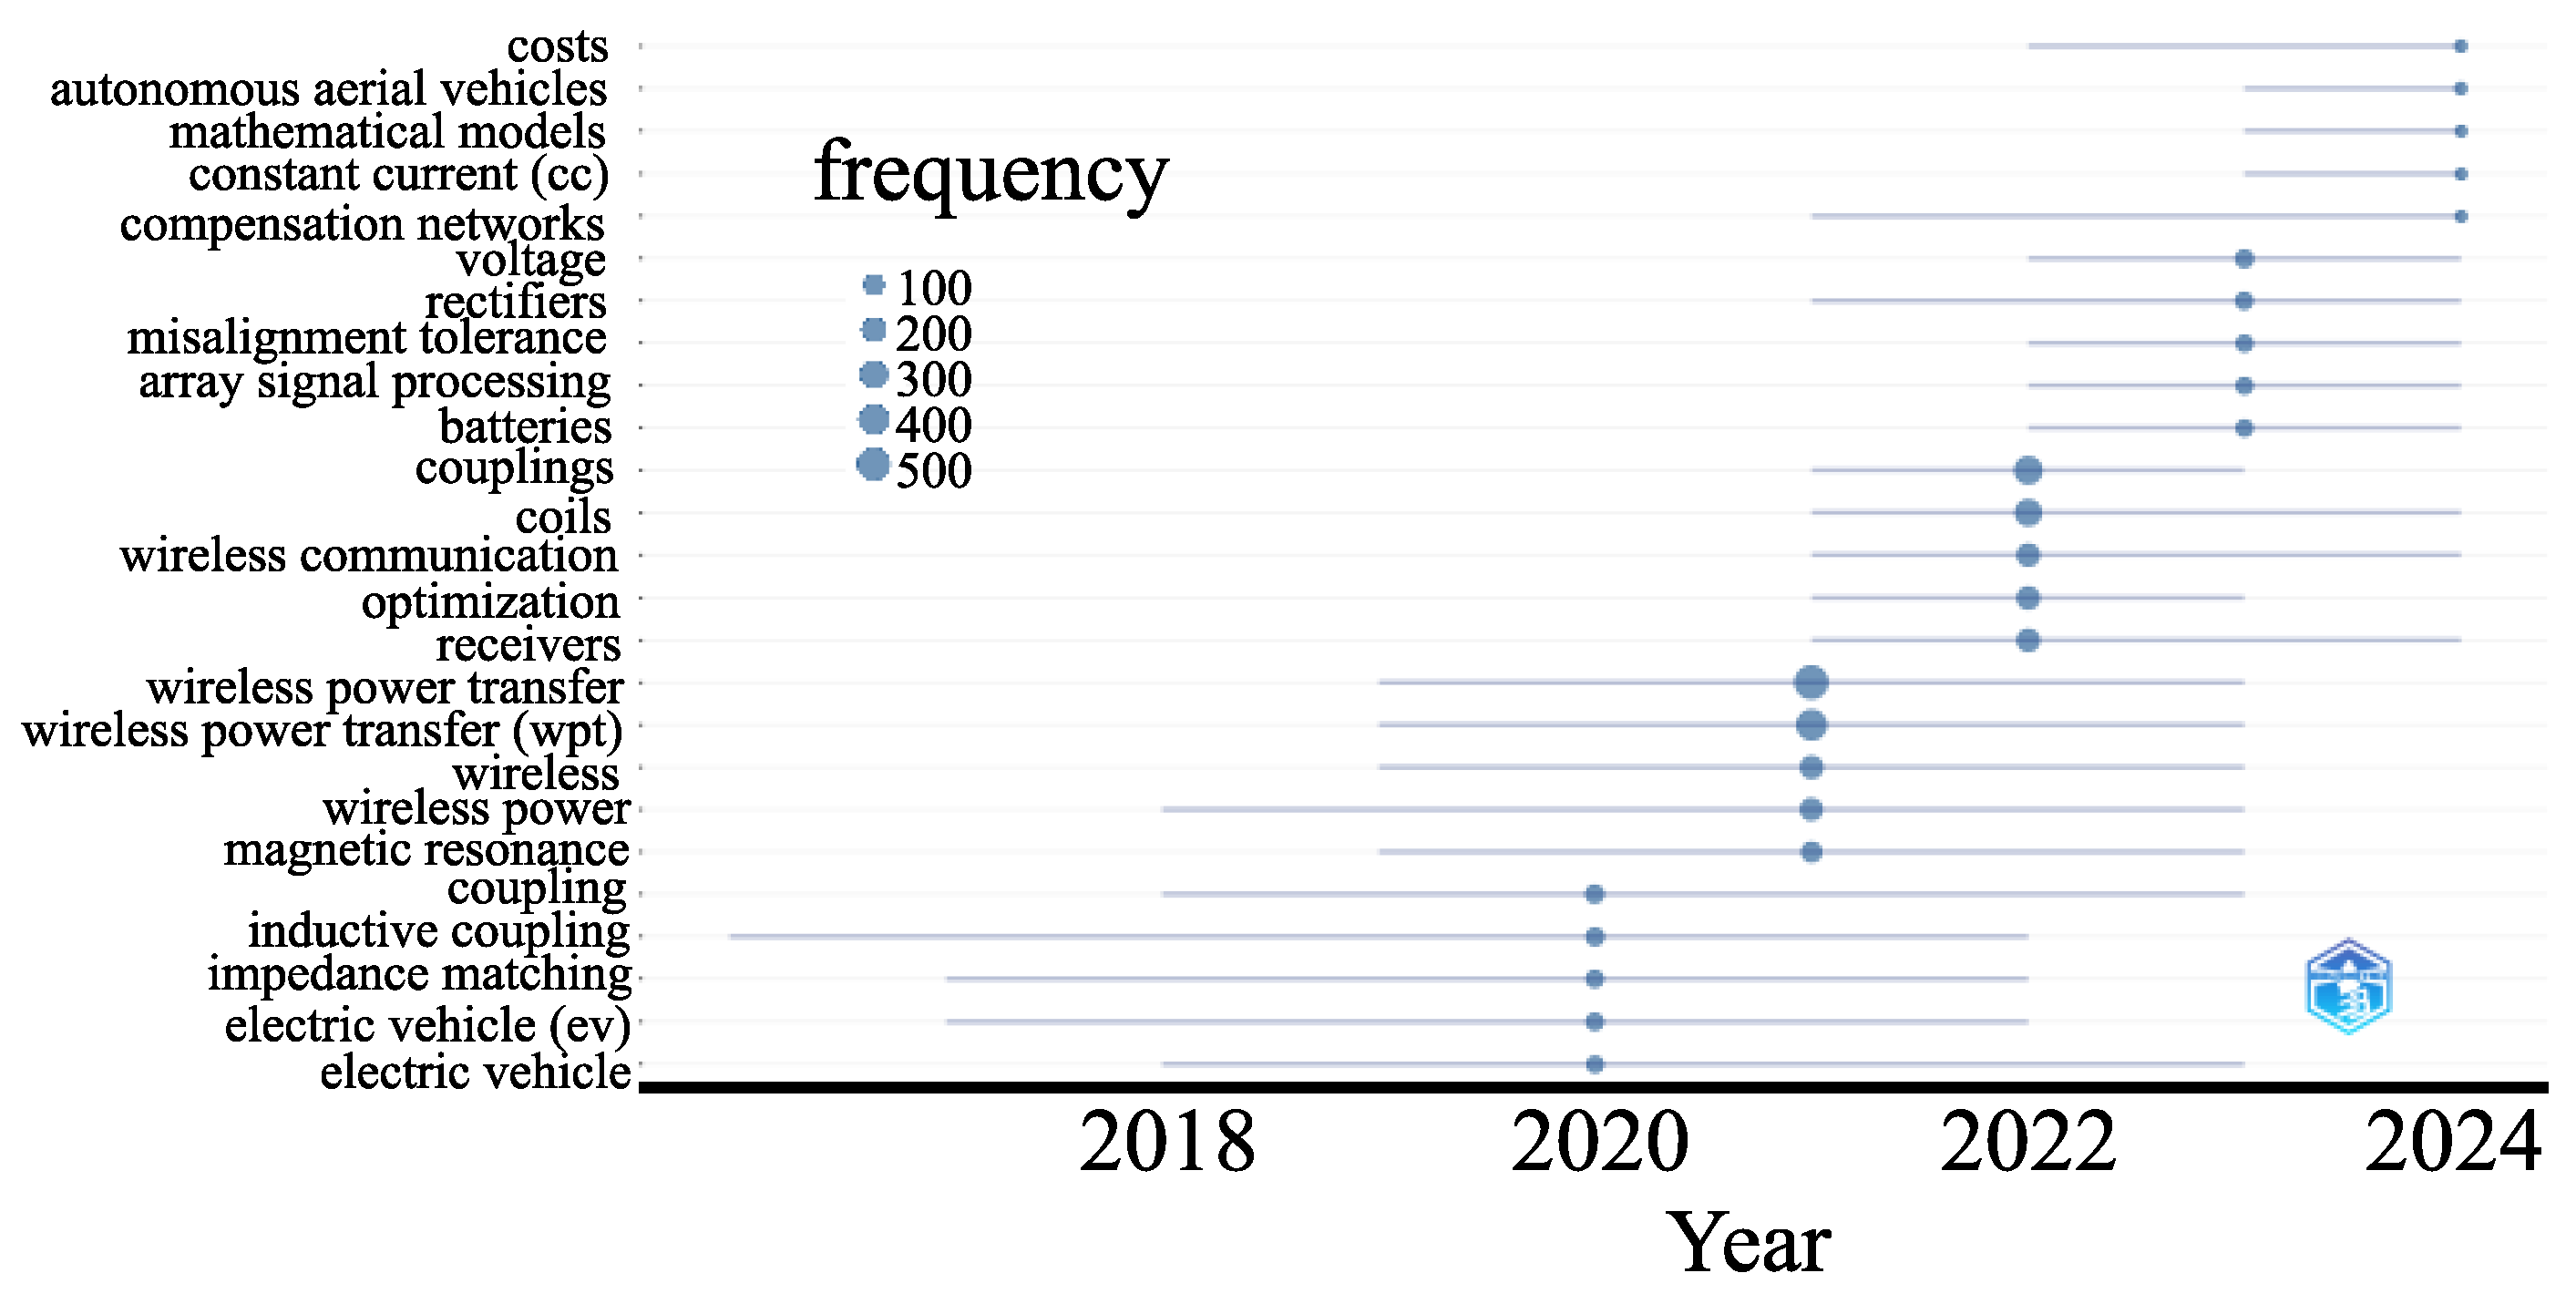
Figure 5 presents the temporal distribution of frequently occurring author keywords during the later years of the study period. Trend analysis helps identify changes in the research topics receiving attention over time.
The terms “design”, “voltage”, and “efficiency” appeared repeatedly during overlapping periods, indicating the continuing relationship among coupler design, output characteristics, and transmission performance. More recent appearances of terms related to constant-current operation and cost suggest increasing attention to output regulation and engineering implementation.
These results should be interpreted as publication trends within the selected dataset rather than as definitive predictions of future technological development. Recently introduced keywords may have relatively low total frequencies because they have had less time to accumulate publications, while mature technical topics may remain important even when their annual growth rate decreases.
3.8. Discussion
Based on the bibliometric results, the following observations can be made:
The annual number of publications generally increased during 2014–2024, indicating growing research attention to wireless power transfer system design and magnetic-coupler-related technologies.
China and the United States contributed the largest numbers of publications in the selected dataset. Several Chinese universities were also among the most productive institutions.
Power-electronics journals constituted the main publication sources, reflecting the close relationship between magnetic-coupler design, converter operation, transmission efficiency, and output control.
Efficiency, power, and voltage were the principal terms associated with the power-efficiency evaluation level. Frequency, mutual inductance, current, and resistance were identified as relevant fundamental parameters.
The keyword clusters and thematic map indicate that design, optimization, and power transfer remain fundamental research themes, while communication and network integration represent related areas of development.
On the basis of the research objective of this study, the occurrence frequencies of the indicator-related keywords are used as supporting evidence for establishing the initial AHP judgment matrices in the following section.
The present bibliometric analysis has several limitations. First, the dataset was obtained only from WoSCC and may not include relevant studies indexed exclusively in other databases, conference proceedings, patents, technical reports, or other document types. Second, the use of a specific search query may exclude studies that describe related technologies using different terminology. Third, keyword frequencies may be affected by differences in author terminology, publication growth, and the maturity of a research topic. A frequently occurring term represents a high level of research attention but does not necessarily have greater engineering importance in every rail–tram application. Fourth, the dataset covers complete publication years up to 2024 and therefore does not represent studies published after the end of that period.
For these reasons, bibliometric evidence is used to support rather than completely replace engineering judgment. The frequency-to-scale conversion, consistency evaluation, and sensitivity analysis of the resulting AHP judgment matrices are presented in the following section.
4. Bibliometric-Assisted Analytic Hierarchy Process Method
In practical applications, the optimization objectives of a rail–tram inductive power transfer (IPT) system may vary according to the vehicle operating conditions and design requirements. Therefore, different weights should be assigned to the evaluation indicators to reflect their relative importance under the investigated application conditions. A systematic weighting method is required to clarify the contribution of each indicator to the performance evaluation of the magnetic coupler.
The analytic hierarchy process (AHP) is a multi-criteria decision-making method that decomposes a complex decision problem into an ordered hierarchical structure and determines criterion weights through pairwise comparisons [
12,
23]. AHP combines qualitative judgments with quantitative calculations and uses a consistency test to examine the logical relationships among the pairwise comparisons.
In conventional AHP, the pairwise comparisons are mainly obtained from expert judgments. In the proposed bibliometric-assisted AHP method, keyword-occurrence statistics are introduced as supporting evidence for establishing the initial importance relationships among the indicators. Bibliometric evidence is not regarded as an absolute measure of engineering importance and does not completely replace application-specific engineering judgment. Its purpose is to reduce the exclusive dependence of conventional AHP on the judgments of a small expert group, particularly during the preliminary design stage of a high-power rail–tram IPT system.
Because the performance indicators defined in
Section 2 have different physical dimensions and numerical ranges, their original dimensional values are normalized before the AHP weights are applied. For a benefit-type indicator, for which a larger value represents better performance, the normalized value is calculated as
For a cost-type indicator, for which a smaller value represents better performance, the normalized value is calculated as
Here, is the original value of indicator j for candidate configuration i, and is the corresponding dimensionless value. If all candidate configurations have the same value for an indicator, the normalized value is set to 1 for all configurations. Because the assigned value is identical, that indicator does not affect their relative ranking. The normalization procedure separates the physical performance values from their relative importance weights and prevents quantities with different units from being directly aggregated.
The bibliometric-assisted AHP procedure consists of the following three steps.
- (1)
Construction of the Judgment Matrix
The construction of the judgment matrix is the central step of AHP. Let the indicators at a certain hierarchical level be denoted by
and let
be the corresponding judgment matrix. The element
represents the relative importance of indicator
compared with indicator
. The judgment matrix satisfies
Therefore, only one triangular part of the judgment matrix needs to be determined independently.
The conventional Saaty 1–9 scale is used to express the relative importance of two indicators [
12]. The meanings of the scale values are summarized in
Table 7.
In traditional AHP, the values of
are mainly determined through expert pairwise comparisons. In the proposed method, the occurrence frequencies of the indicator-related keywords are first used to establish the initial importance ordering. Let
denote the keyword-occurrence frequencies corresponding to the indicators in
F.
When , indicator is considered to have received greater research attention than indicator . When , the reverse importance relationship is established. When the occurrence frequencies are close and no clear application-specific difference exists, the two indicators are treated as equally or similarly important.
The magnitude of the frequency difference is then interpreted using the conventional verbal meanings of the Saaty scale. A small difference corresponds to a judgment close to 1, while progressively larger and clearer differences correspond to the values 3, 5, 7, and 9. The even values 2, 4, 6, and 8 are used when the comparison falls between two adjacent importance levels.
Keyword frequency is used primarily to support the initial ordering and relative-strength judgment. For comparisons involving vehicle-specific operating or installation requirements, such as charging duration, installation space, and allowable air-gap variation, the bibliometric evidence is considered together with the engineering constraints of the investigated tram. Therefore, the proposed approach is described as bibliometric-assisted AHP rather than a completely objective or fully data-driven weighting method.
The frequency-to-scale conversion is not claimed to be a unique mathematical equivalence between publication frequency and engineering importance. Different databases, search strategies, keyword-cleaning procedures, and application requirements may produce different initial scale values. To improve the reproducibility of the judgment-matrix construction, the pairwise judgments in this study are determined using a two-stage procedure. First, the available bibliometric evidence is used to identify the relative research attention associated with the indicators, while vehicle-specific engineering requirements are used as supplementary evidence for application-dependent criteria. Second, the combined evidence is translated into the conventional verbal importance levels of the Saaty scale shown in
Table 7. Therefore, the judgment values are not obtained by directly applying an arithmetic transformation to the raw keyword-frequency ratios.
For the first row of the first-level judgment matrix in Equation (
10), the assignments are made as follows: Power-efficiency characteristics are considered strongly more important than spatial characteristics because satisfying the rated-power and transmission-efficiency requirements is a fundamental feasibility condition, whereas spatial tolerance becomes relevant after acceptable power transfer has been achieved; therefore,
. Power-efficiency characteristics are judged to lie between moderately and strongly more important than power density because the available installation volume is important but remains secondary to satisfying the required electrical performance; therefore,
. Power-efficiency characteristics are considered moderately more important than time characteristics because the latter are strongly affected by vehicle speed and energized-track length; therefore,
. Finally, power-efficiency characteristics are considered only slightly more important than energy-transfer capability because energy-transfer capability is directly related to transferred power and available charging duration; therefore, the intermediate value
is used.
The remaining pairwise comparisons are established using the same procedure, and the reciprocal entries are then obtained from . Thus, each judgment value can be traced to an explicit qualitative importance level and its corresponding bibliometric and/or engineering evidence. The resulting values remain heuristic engineering judgments supported by bibliometric evidence rather than deterministic functions of publication frequency. To make the process transparent, the first-level judgment matrix and representative lower-level weighting calculations are explicitly reported in the case study. Their internal logical consistency is then examined using the AHP consistency test, and their stability under reasonable changes in the pairwise scale values is evaluated through sensitivity analysis.
The same scale is used for both the first-level and lower-level judgment matrices. However, the information supporting the comparisons may differ. Keyword-occurrence statistics provide the principal evidence for research-related electrical indicators, whereas vehicle-specific operating and installation requirements provide supplementary evidence for application-dependent indicators.
- (2)
Consistency Test for the Judgment Matrix
Because the judgment values are obtained through discrete pairwise comparisons, a judgment matrix may contain logical inconsistencies. For example, if is considered more important than , and is considered more important than , the comparison between and should be broadly compatible with these relationships. Therefore, each judgment matrix must undergo a consistency test before its weights are accepted.
For a completely consistent
n-order judgment matrix, the largest eigenvalue is equal to
n. When the matrix is not completely consistent, its largest eigenvalue
is greater than
n. The consistency index (CI) is calculated as
Here, is the largest eigenvalue of the judgment matrix, and n is the order of the matrix.
The corresponding random index (RI) is selected from
Table 8.
The consistency ratio is calculated as
When , the judgment matrix is considered to have acceptable consistency. When , the pairwise judgment values should be reviewed and adjusted until the consistency requirement is satisfied.
For a second-order judgment matrix, , and a reciprocal judgment matrix is automatically consistent. Therefore, the consistency ratio is not separately calculated for the second-order case.
The consistency test evaluates the internal logical compatibility of the pairwise comparisons. However, an acceptable value does not prove that the selected judgment values are uniquely correct. Therefore, the consistency test is supplemented by a sensitivity analysis that examines the stability of the criterion weights under reasonable perturbations of the pairwise scale values.
During the sensitivity analysis, when an element
is changed, its reciprocal element must be changed simultaneously according to
so that the reciprocal property of the judgment matrix is maintained. The consistency ratio should also be recalculated after each perturbation. The sensitivity analysis is used to assess the robustness of the weights to changes in the judgment values; it is not presented as proof that the frequency-to-scale conversion is mathematically unique.
- (3)
Determination of Criterion Weights
After a judgment matrix passes the consistency test, the criterion weights are calculated using the column-normalization and row-averaging procedure adopted in this study.
First, each element of the judgment matrix is divided by the sum of the elements in its corresponding column. This operation produces a column-normalized judgment matrix. Second, the normalized elements in each row are averaged to obtain the relative weight of the corresponding indicator. Finally, the resulting weight vector is normalized so that the sum of all weights is equal to one.
The resulting weight vector can be expressed as
where
The largest eigenvalue of the original judgment matrix is used for the consistency test, while the column-normalization and row-averaging procedure is used to calculate the criterion weights. This description is consistent with the numerical procedure applied to the judgment matrices in the case study.
The local weights describe the relative importance of indicators within the same criterion group. The first-level weights describe the relative importance of the five main performance dimensions. After the weights have been determined, they are applied to the normalized dimensionless performance values defined in
Section 2 and
Section 4.
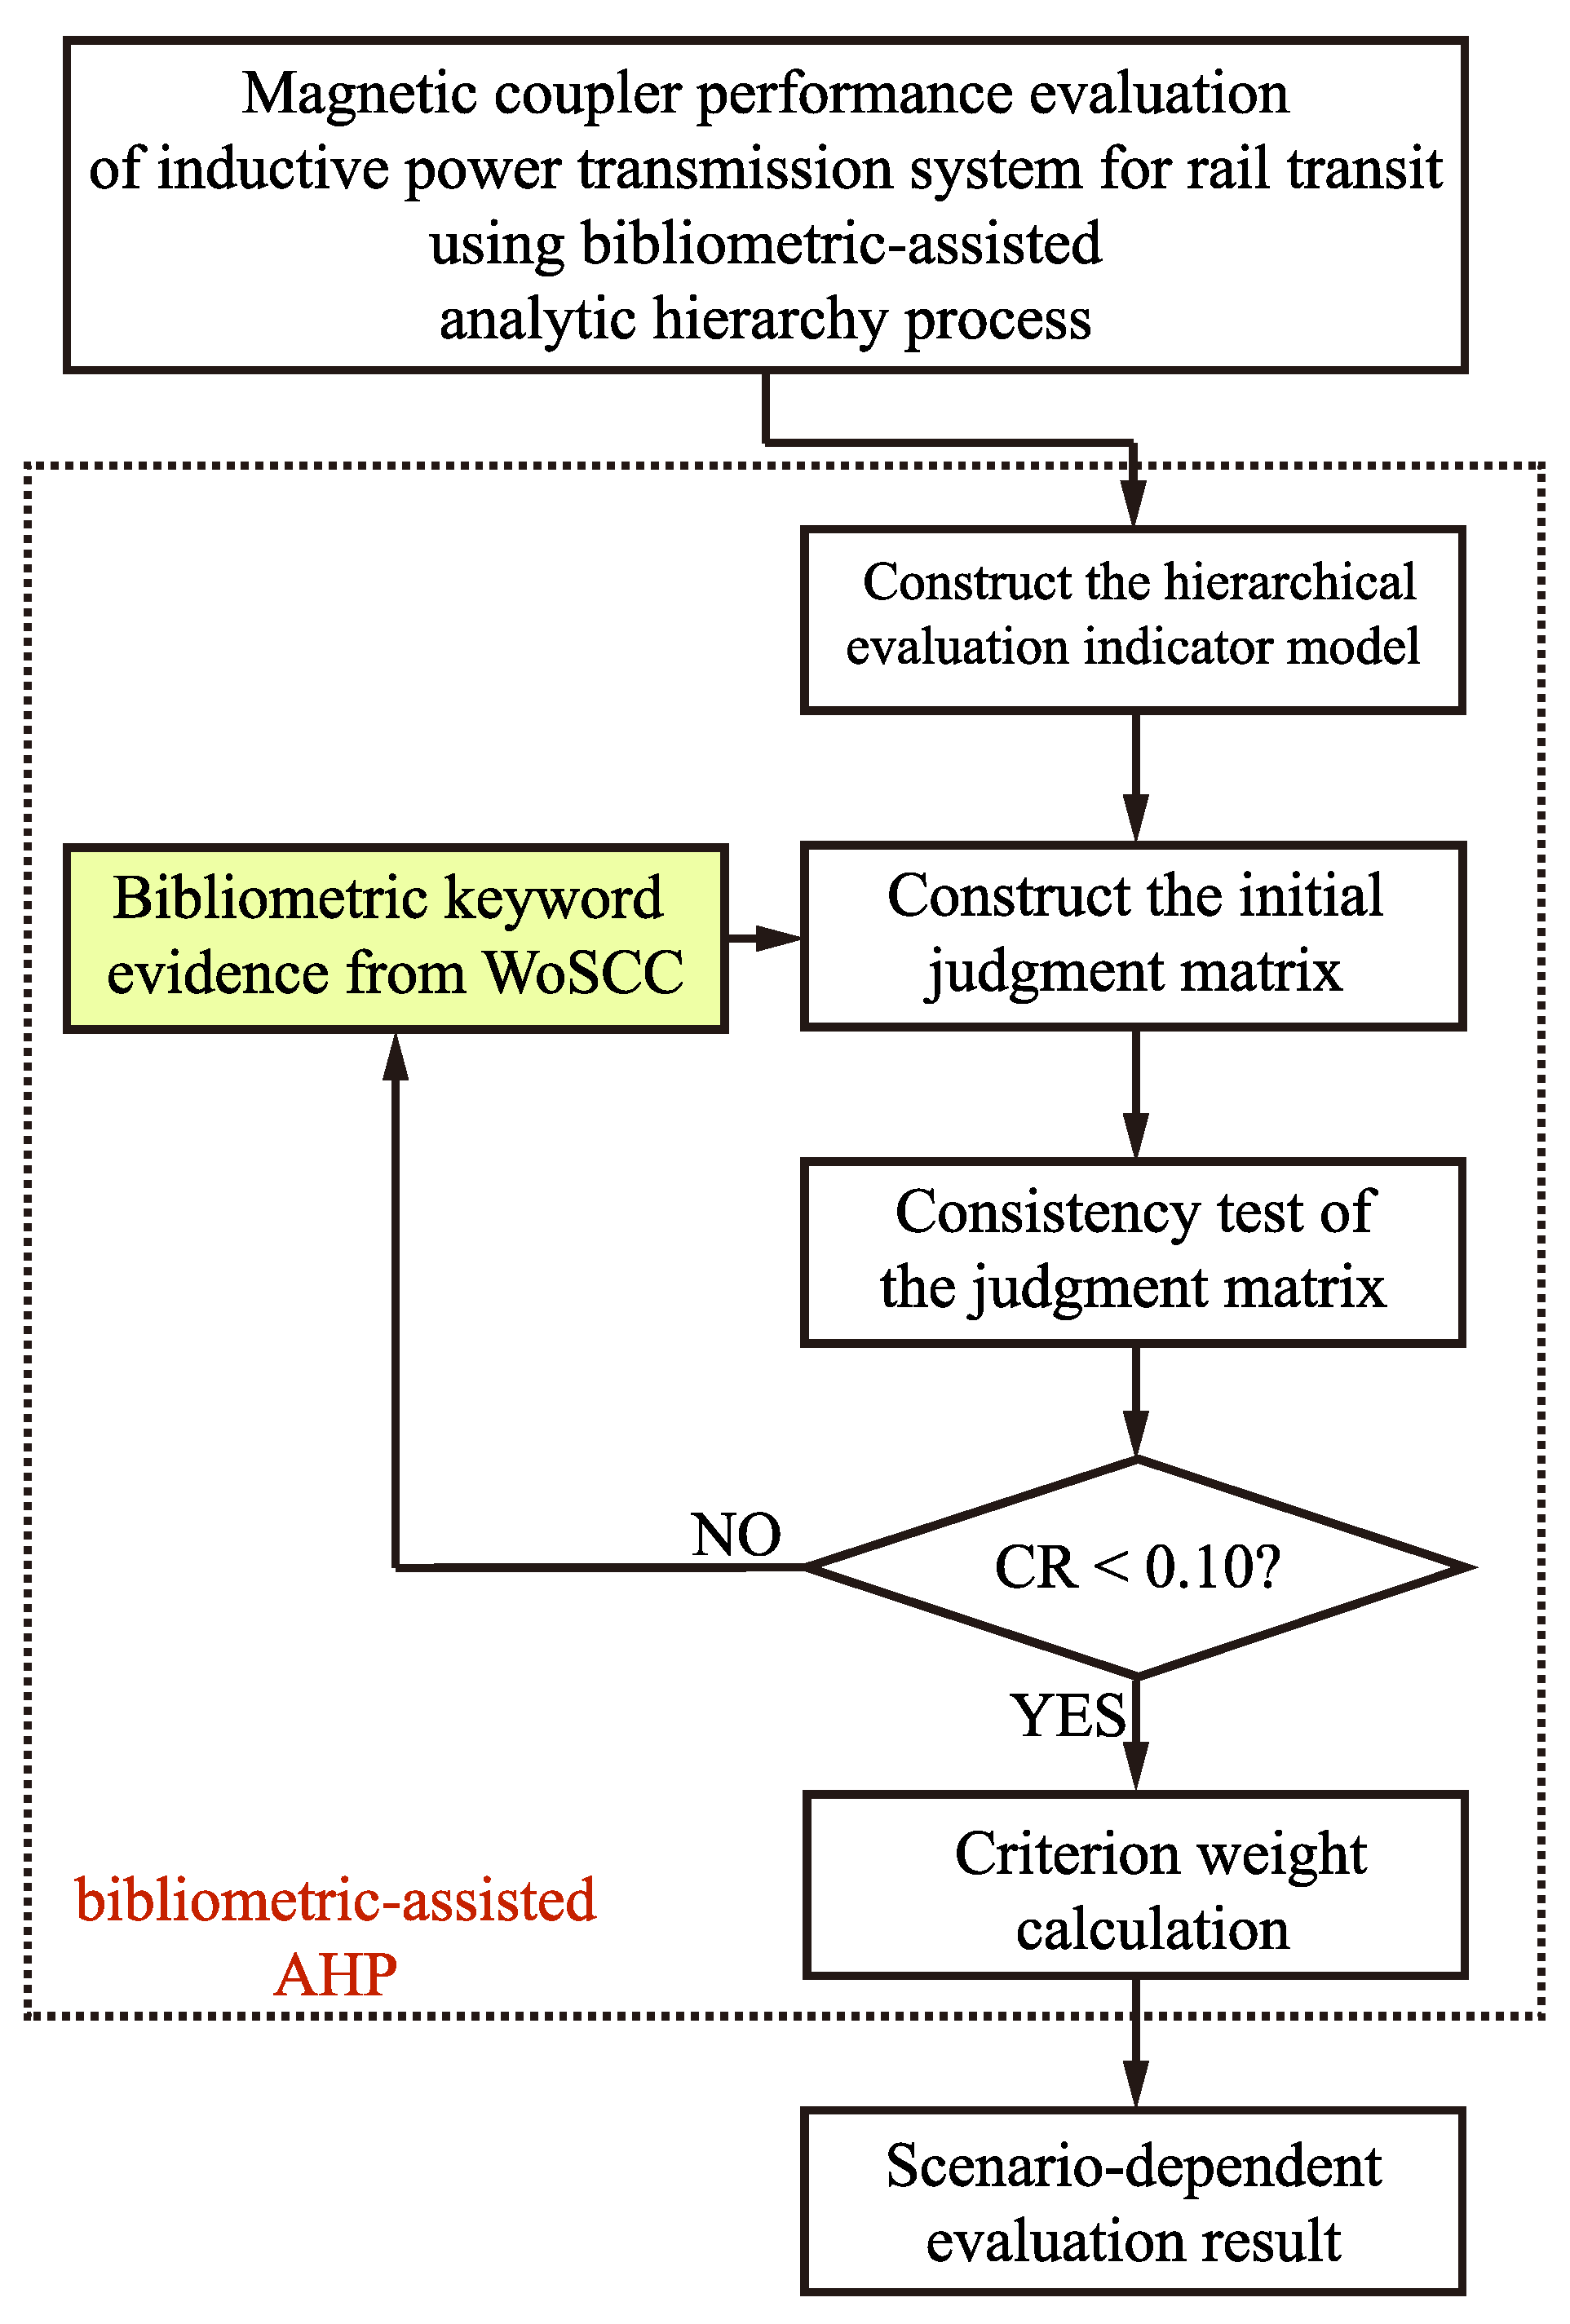
The overall process for establishing the bibliometric-assisted AHP evaluation model is shown in
Figure 6.
The proposed method retains the hierarchical structure, pairwise-comparison mechanism, and consistency test of conventional AHP, while introducing bibliometric evidence to support the initial construction of the judgment matrices. Compared with conventional AHP, the main difference lies in the source of supporting evidence used to establish the initial pairwise importance relationships.
Fuzzy AHP represents uncertainty in linguistic expert judgments using fuzzy numbers, whereas the present method focuses on supplementing limited expert information using literature-derived evidence. TOPSIS is mainly used to rank candidate alternatives after the criterion weights have been specified. The analytic network process (ANP) can represent interdependence among criteria but requires a more complex network structure and a larger number of pairwise comparisons. Entropy weighting derives criterion weights from the dispersion of alternative data; however, its discriminating ability may be limited when only a small number of candidate configurations are available.
This comparison is intended to clarify the methodological differences and applicable conditions of the methods. The proposed bibliometric-assisted AHP method is not claimed to be universally superior to conventional AHP, fuzzy AHP, TOPSIS, ANP, or entropy weighting. It is intended primarily for preliminary magnetic-coupler design problems in which a hierarchical indicator structure and a relevant literature base are available, but a large representative expert panel and a large set of comparable candidate designs are not available.
The method still has limitations. Keyword-occurrence statistics are affected by the selected database, search strategy, terminology, and publication period. In addition, the conversion from research attention to the discrete Saaty scale is heuristic and not unique. To mitigate these limitations, the first-level judgment matrix and representative lower-level weighting calculations are reported, consistency tests are conducted, and the stability of the criterion weights is examined under reasonable perturbations of the judgment values.
5. Case Study of a 2M2T Low-Floor Tram
A 2M2T 100% low-floor modern tram, comprising two motor cars and two trailer cars, is used as the case-study platform to demonstrate the application of the proposed evaluation framework. The purpose of this case study is to compare two practically feasible magnetic-coupler configurations under the installation and operating constraints of the investigated tram. It is not intended to establish a universal ranking applicable to all rail vehicles or magnetic-coupler structures.
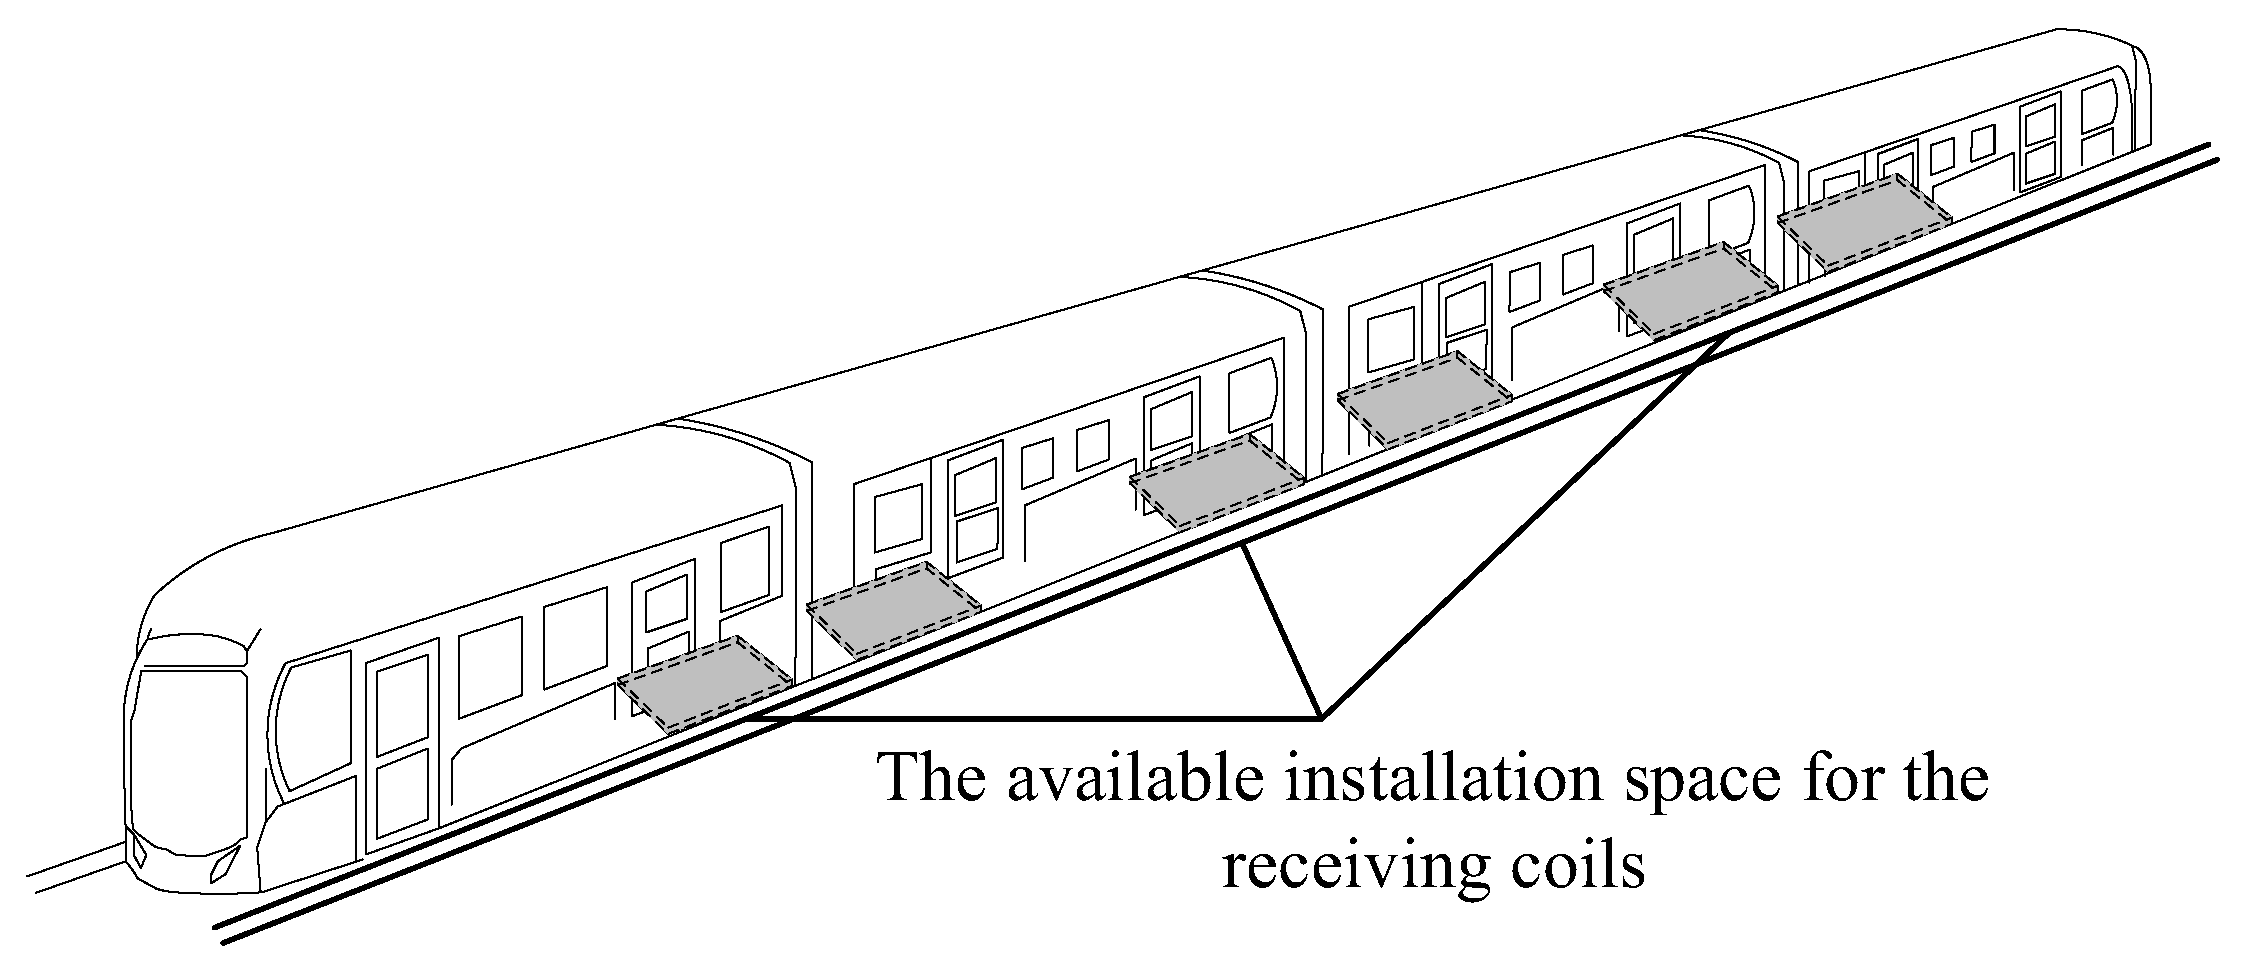
Figure 7 shows the vehicle formation and the available installation locations for the onboard receiving coils. The motor cars at the front and rear each provide one available installation area on the side opposite the driver’s cab. The two intermediate trailer cars provide additional installation areas in front of and behind their bogies.
Figure 8 shows the available installation space beneath the tram. Because of the bogies, anti-kinking devices, and structural components of the vehicle body, the onboard receiving equipment must be installed within the area indicated by the blue boundary.
Table 9 summarizes the principal structural parameters of the tram and the electrical requirements of the IPT system. AW0, AW2, and AW3 denote the three passenger-load conditions used in the vehicle specification. The vertical air gap varies with passenger load. Considering the three load conditions, the overall air-gap range used in the case study is 37.6–127 mm.
5.1. Two Magnetic-Coupler Configurations
The design of the coil configuration should consider both the available installation space and the practical complexity of the operating and control system. During dynamic charging, maintaining a relatively constant number of receiving coils within an energized transmitting-coil section is beneficial for limiting changes in the power allocated to each receiving coil.
The spacing between the onboard receiving coils influences the appropriate length of one transmitting-coil module. When one receiving coil leaves an energized section and another receiving coil enters it, an appropriate modular arrangement can reduce variations in the total coupling relationship. This arrangement is also beneficial for vehicle positioning during static charging.
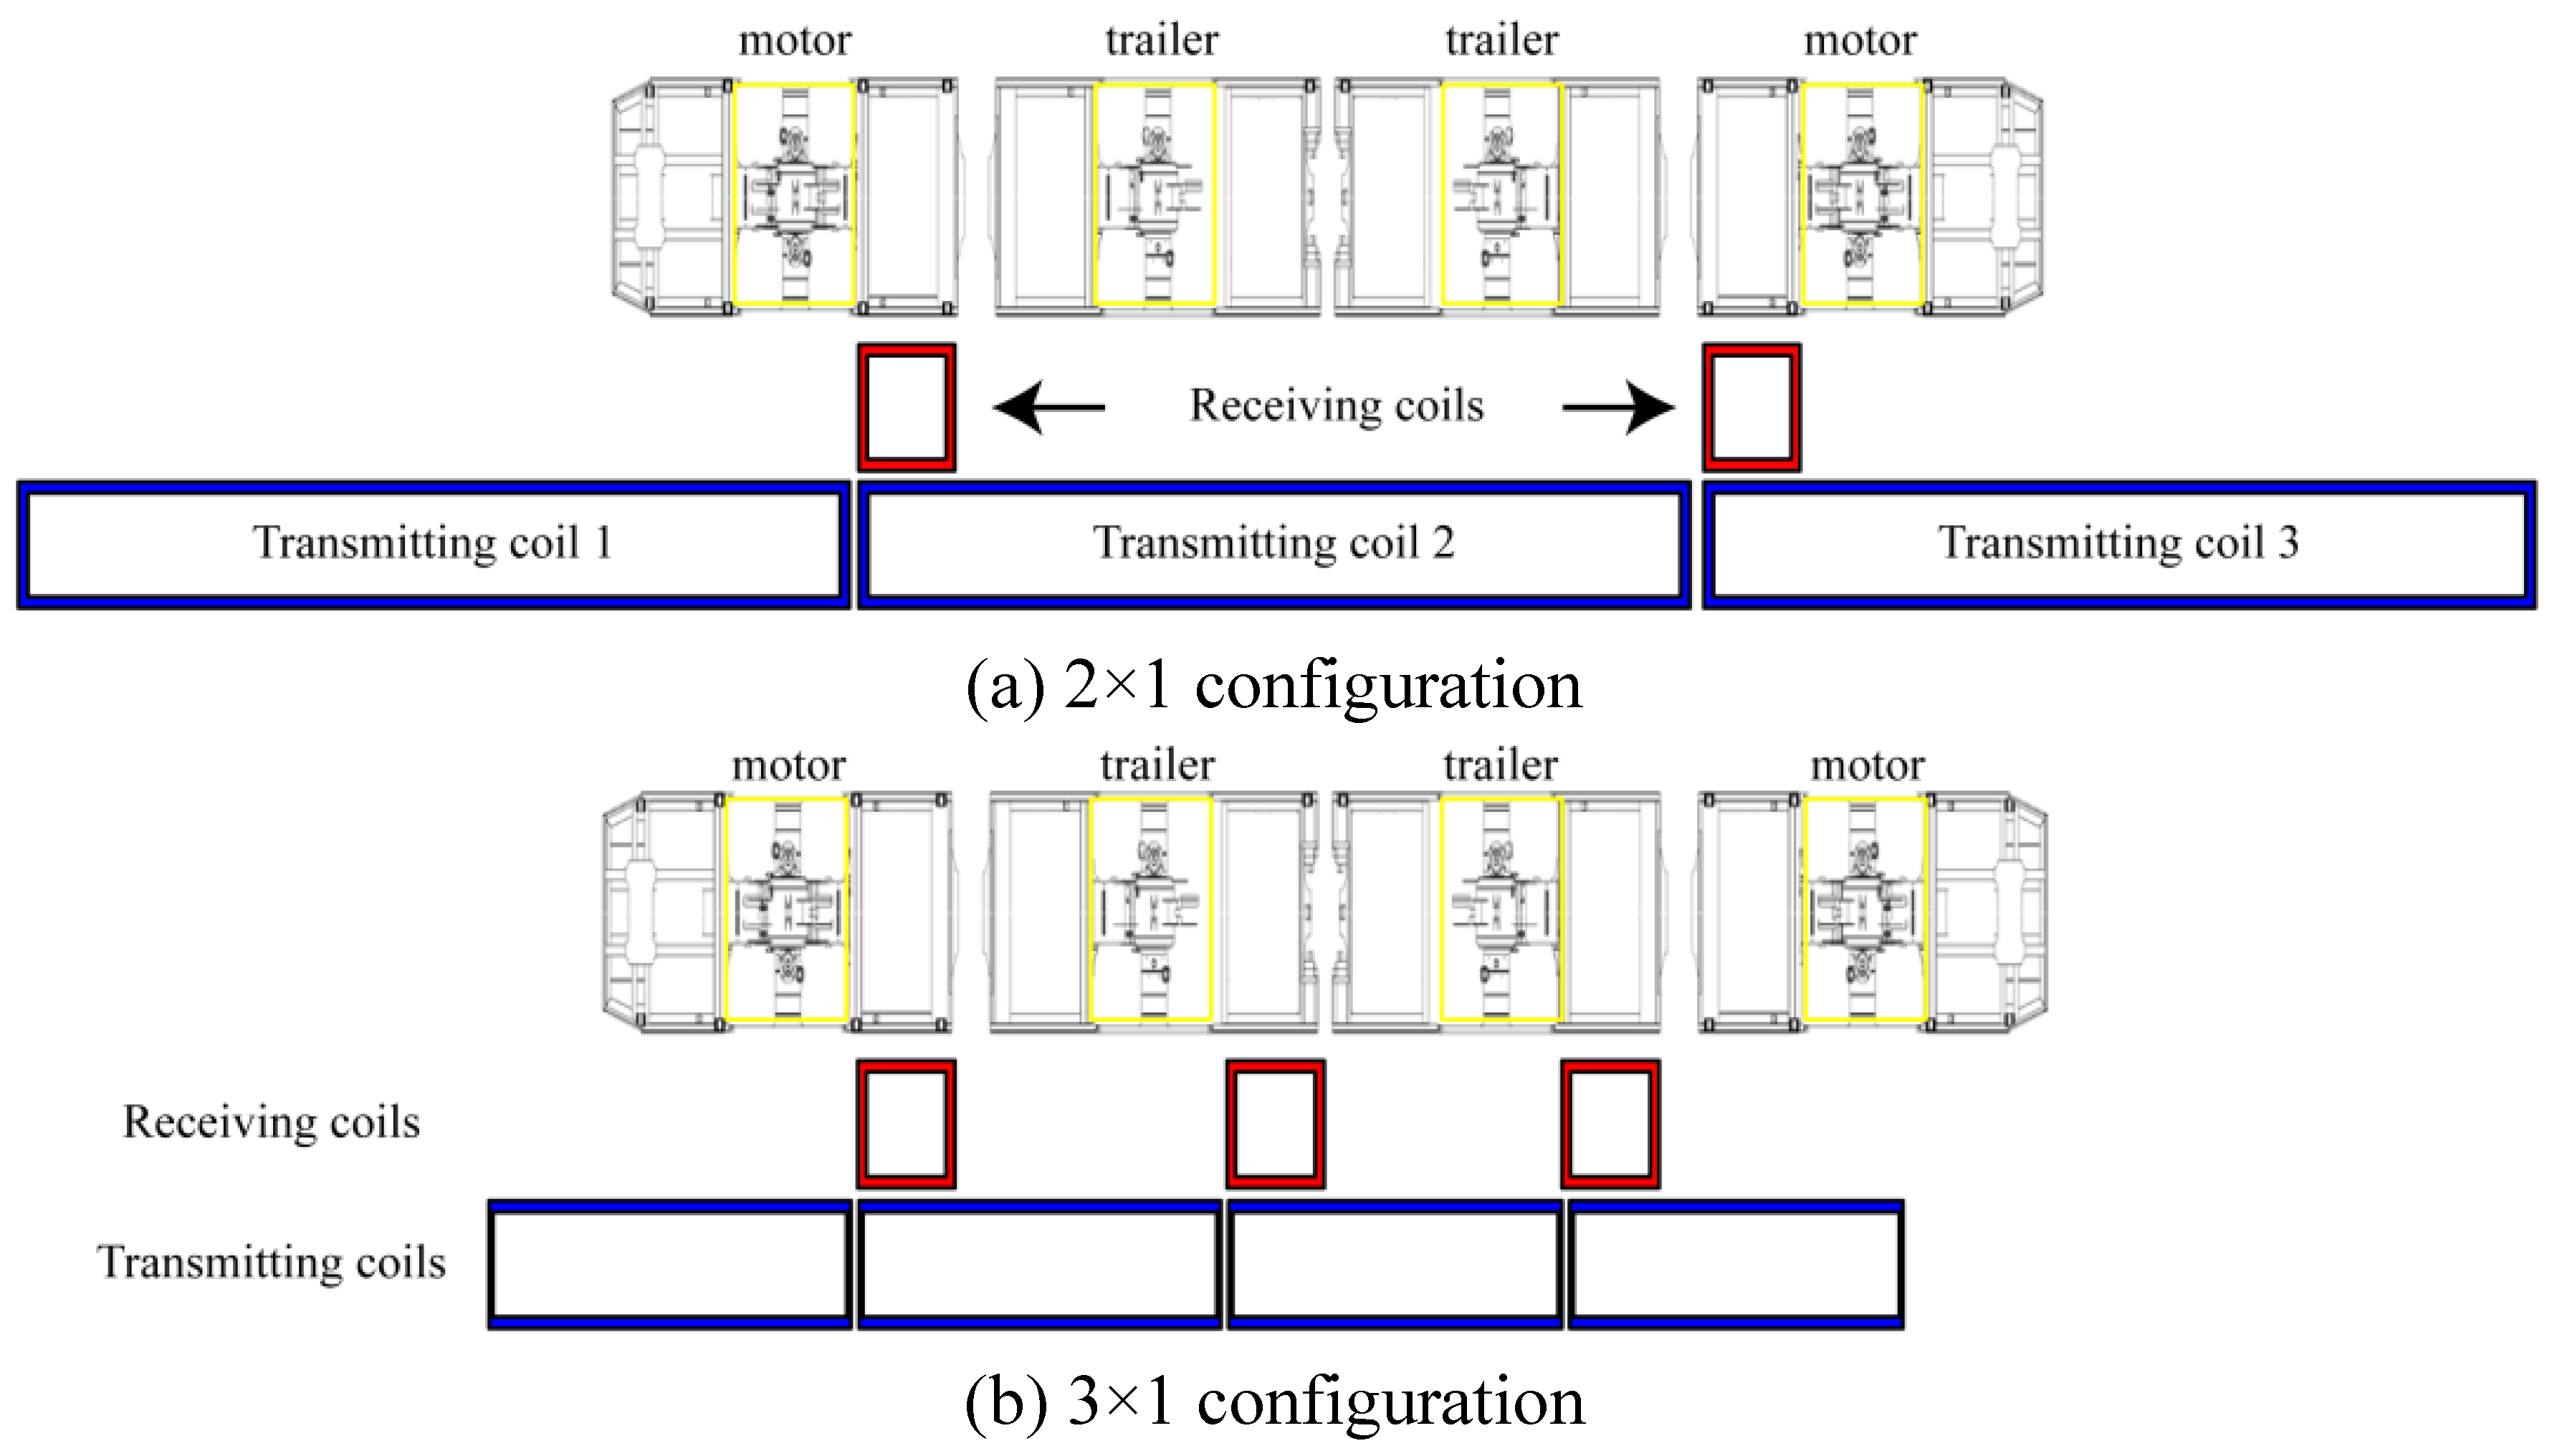
Considering the available underbody space and the modular arrangement of the transmitting and receiving coils, two practically feasible configurations, namely the
and
configurations, are selected, as shown in
Figure 9. These two configurations are engineering candidates for the investigated tram and do not represent all possible magnetic-coupler structures.
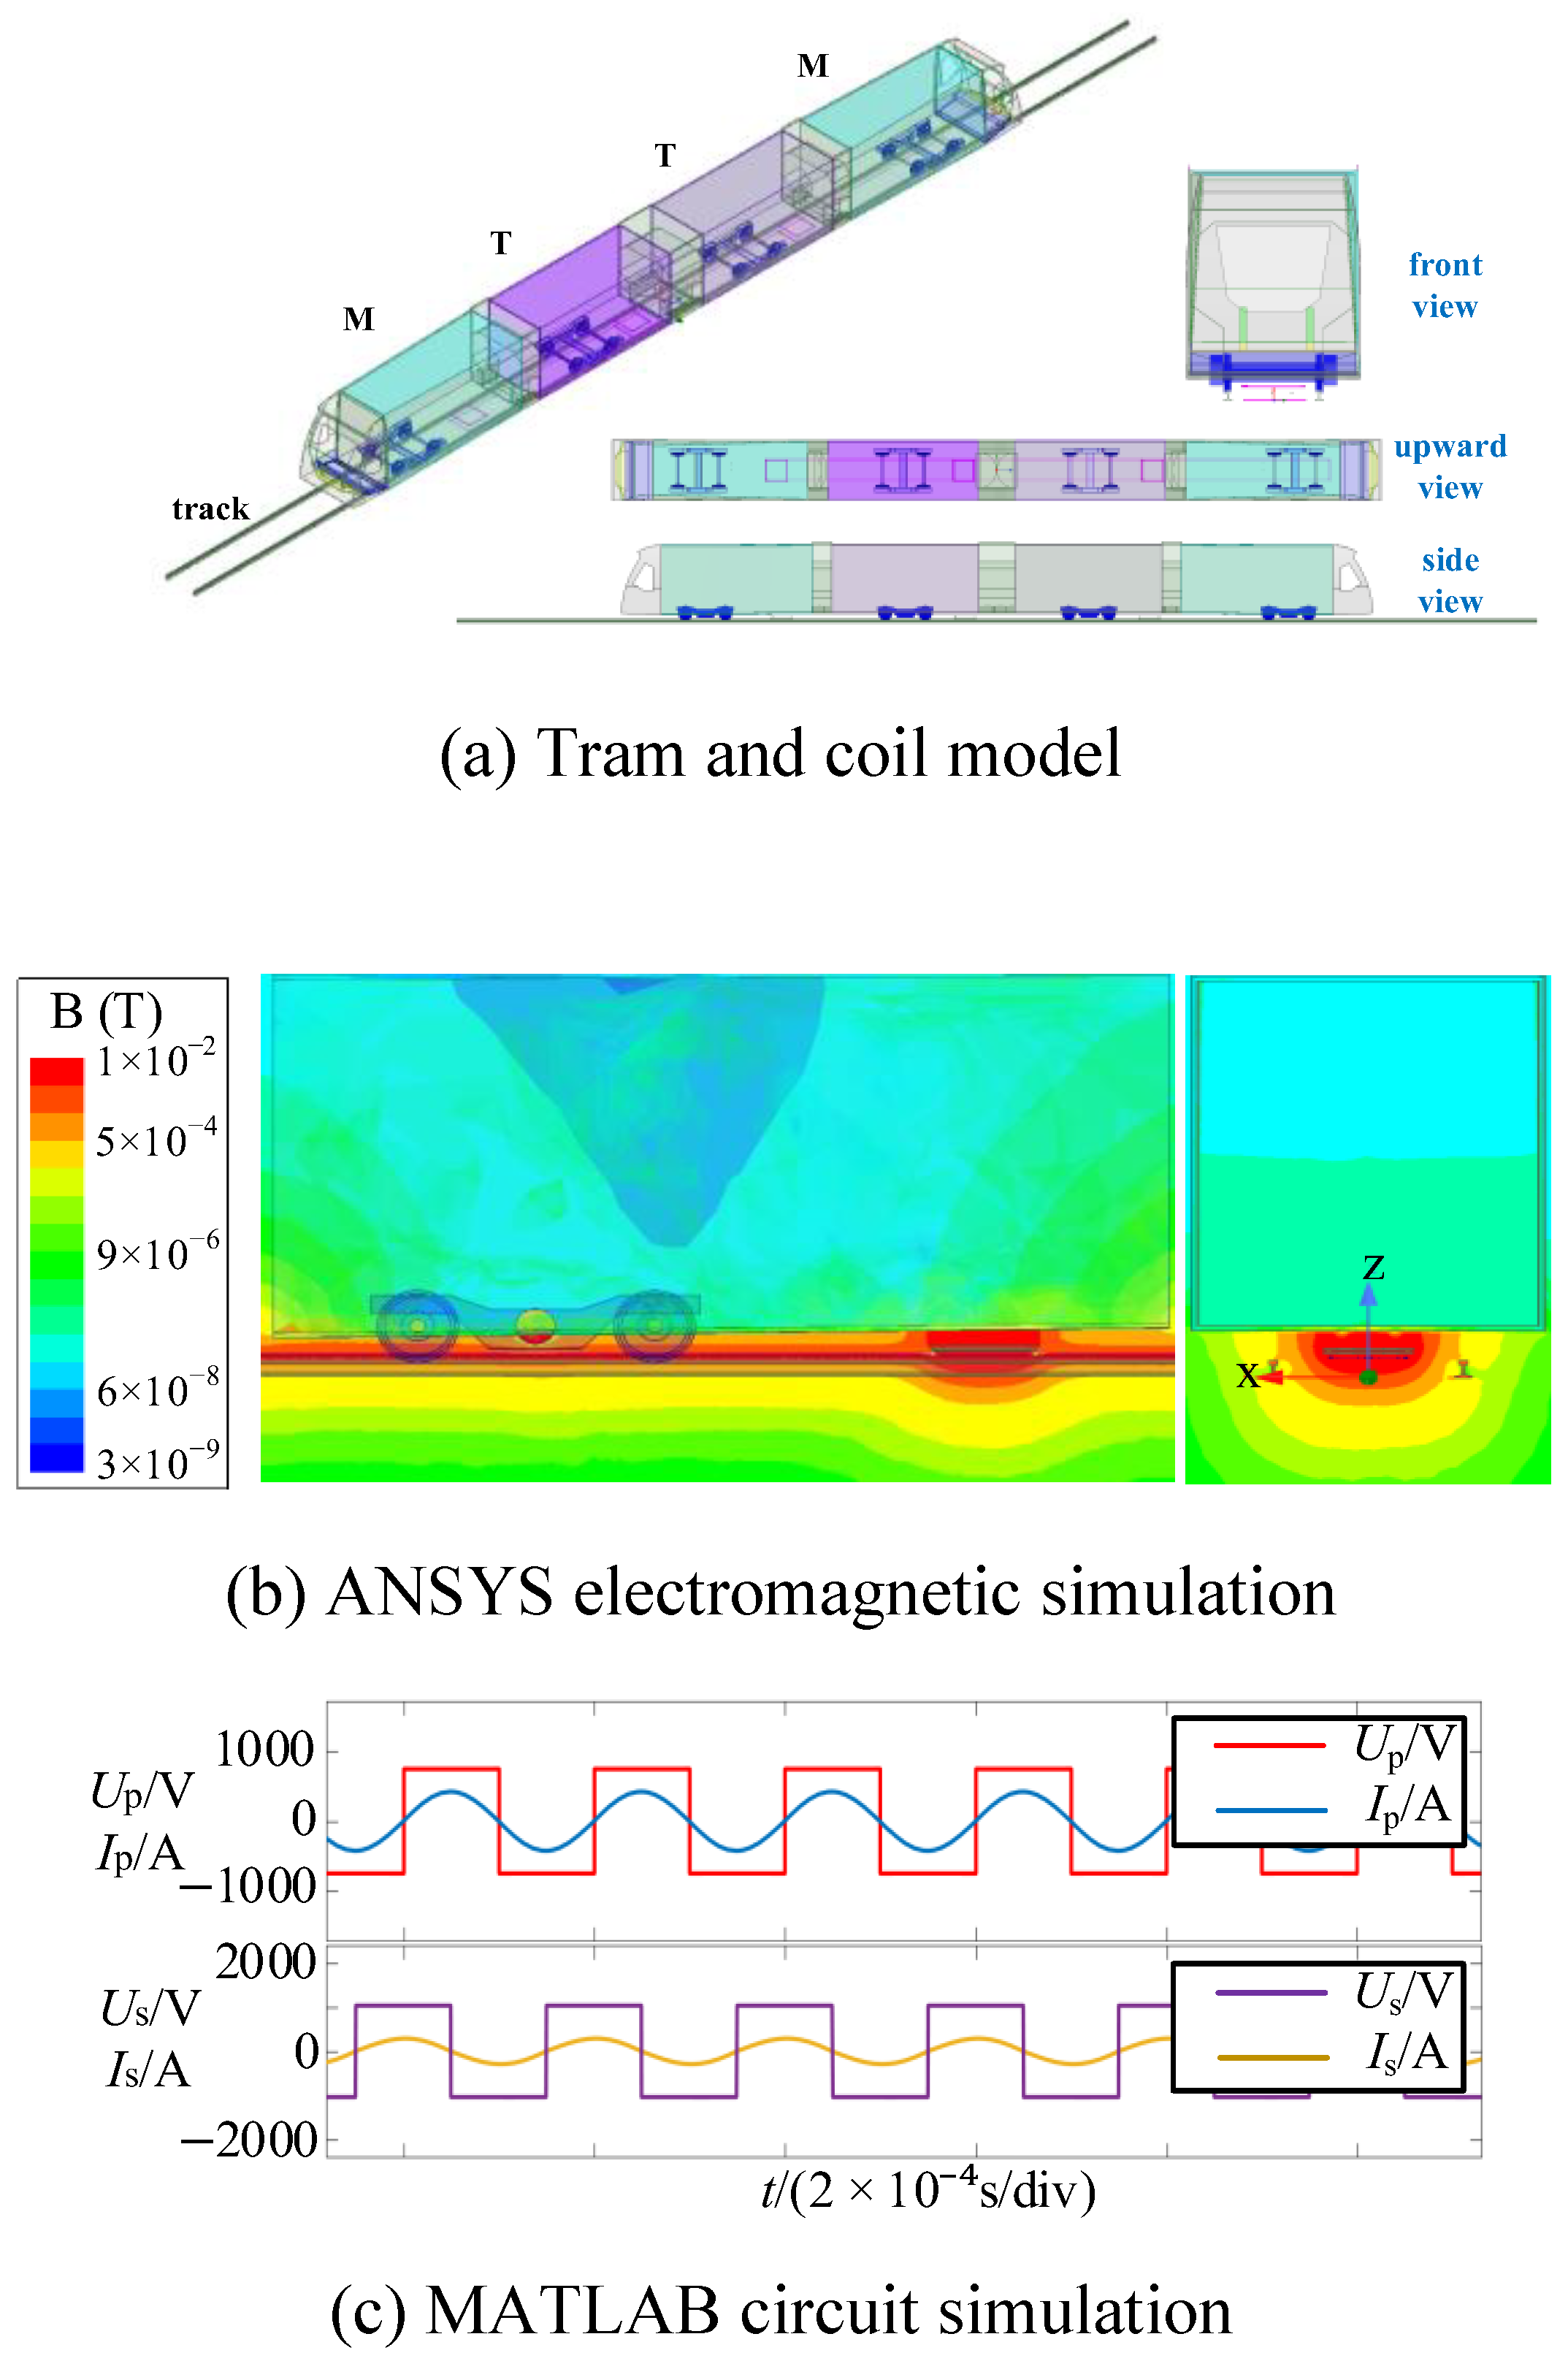
An electromagnetic model was established in ANSYS 18.2, and the resulting electromagnetic parameters were introduced into a MATLAB R2024b circuit model. The electromagnetic and circuit simulations were then used to compare the two configurations. The models and representative simulation results are shown in
Figure 10.
5.2. Performance Evaluation of the Two Configurations
5.2.1. Power-Efficiency Characteristics
The fundamental electrical parameters obtained from the electromagnetic and circuit simulations are summarized in
Table 10. The minimum turns denote the minimum primary-to-secondary turn combination used to satisfy the specified power-transfer requirements.
Because the transmitting coil of the configuration is shorter, its winding resistance is lower. Consequently, the target output performance can be obtained using a lower excitation current and a smaller secondary-coil turn number.
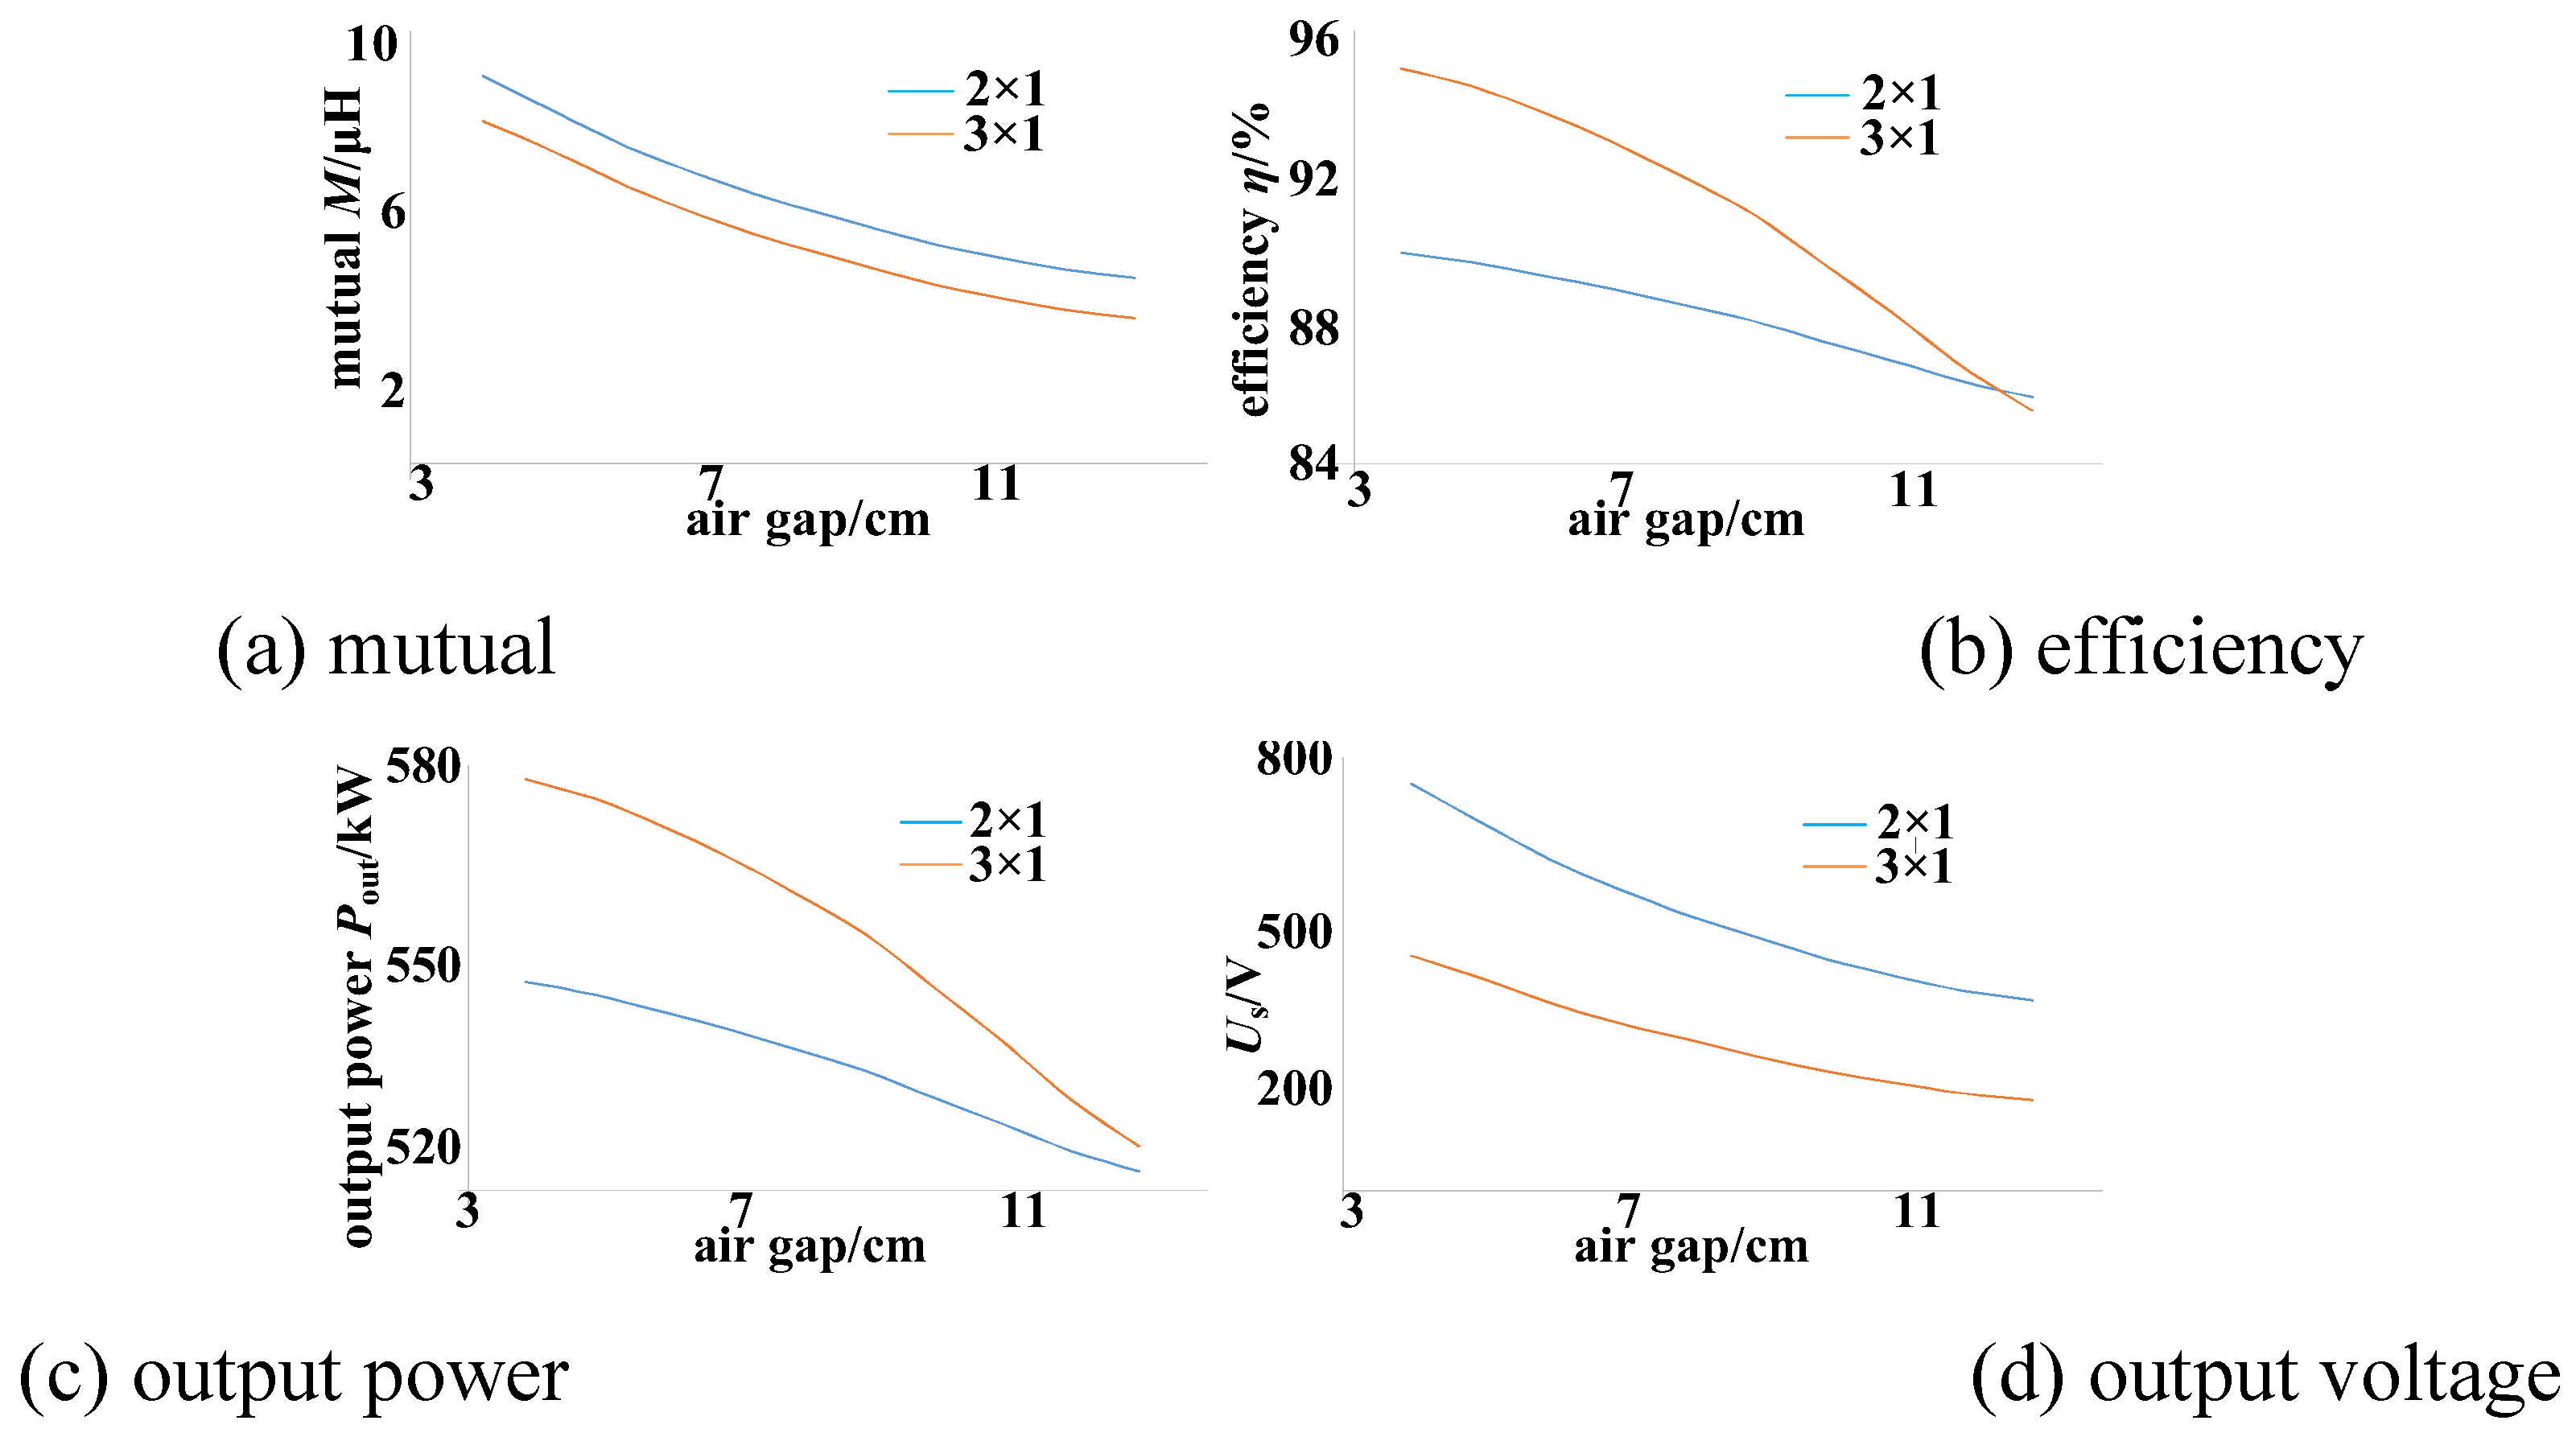
Figure 11 compares the mutual inductance, transmission efficiency, output power, and output voltage of the two configurations over the investigated air-gap range.
The corresponding power-efficiency parameters are summarized in
Table 11. The output-voltage fluctuation is calculated as the difference between the maximum and minimum output voltages.
The configuration has a higher average efficiency, a higher average output power, and a smaller voltage-fluctuation range. Therefore, it performs better according to the three power-efficiency sub-indicators considered in this study.
The absolute output-voltage level of the configuration is lower. At the same transmitted power, a lower voltage corresponds to a higher current. Therefore, the current ratings and losses of the secondary-side components should be considered during detailed converter design. A quantitative component-stress and thermal comparison is not included in the present study.
5.2.2. Spatial Characteristics
Based on the electromagnetic simulations, the spatial-performance ranges satisfying the prescribed transmission-efficiency condition are listed in
Table 12.
The air-gap and angular-deflection ranges are determined principally by the vehicle structure and are identical for the two configurations. The main difference is the allowable longitudinal displacement. The longer transmitting-coil section of the configuration provides a larger longitudinal operating range and a lower proportion of module-interface regions. Therefore, the configuration performs better in terms of longitudinal spatial tolerance.
5.2.3. Power Density
Power density is evaluated using the output power and the total volume of the windings and magnetic cores. Each conductor strand of the high-frequency Litz wire has a diameter of 0.1 mm. The
and
configurations use 15,000 and 10,000 strands, respectively, according to their current requirements. The transmitting coils have no magnetic core, whereas the receiving coils use a magnetic-core volume of
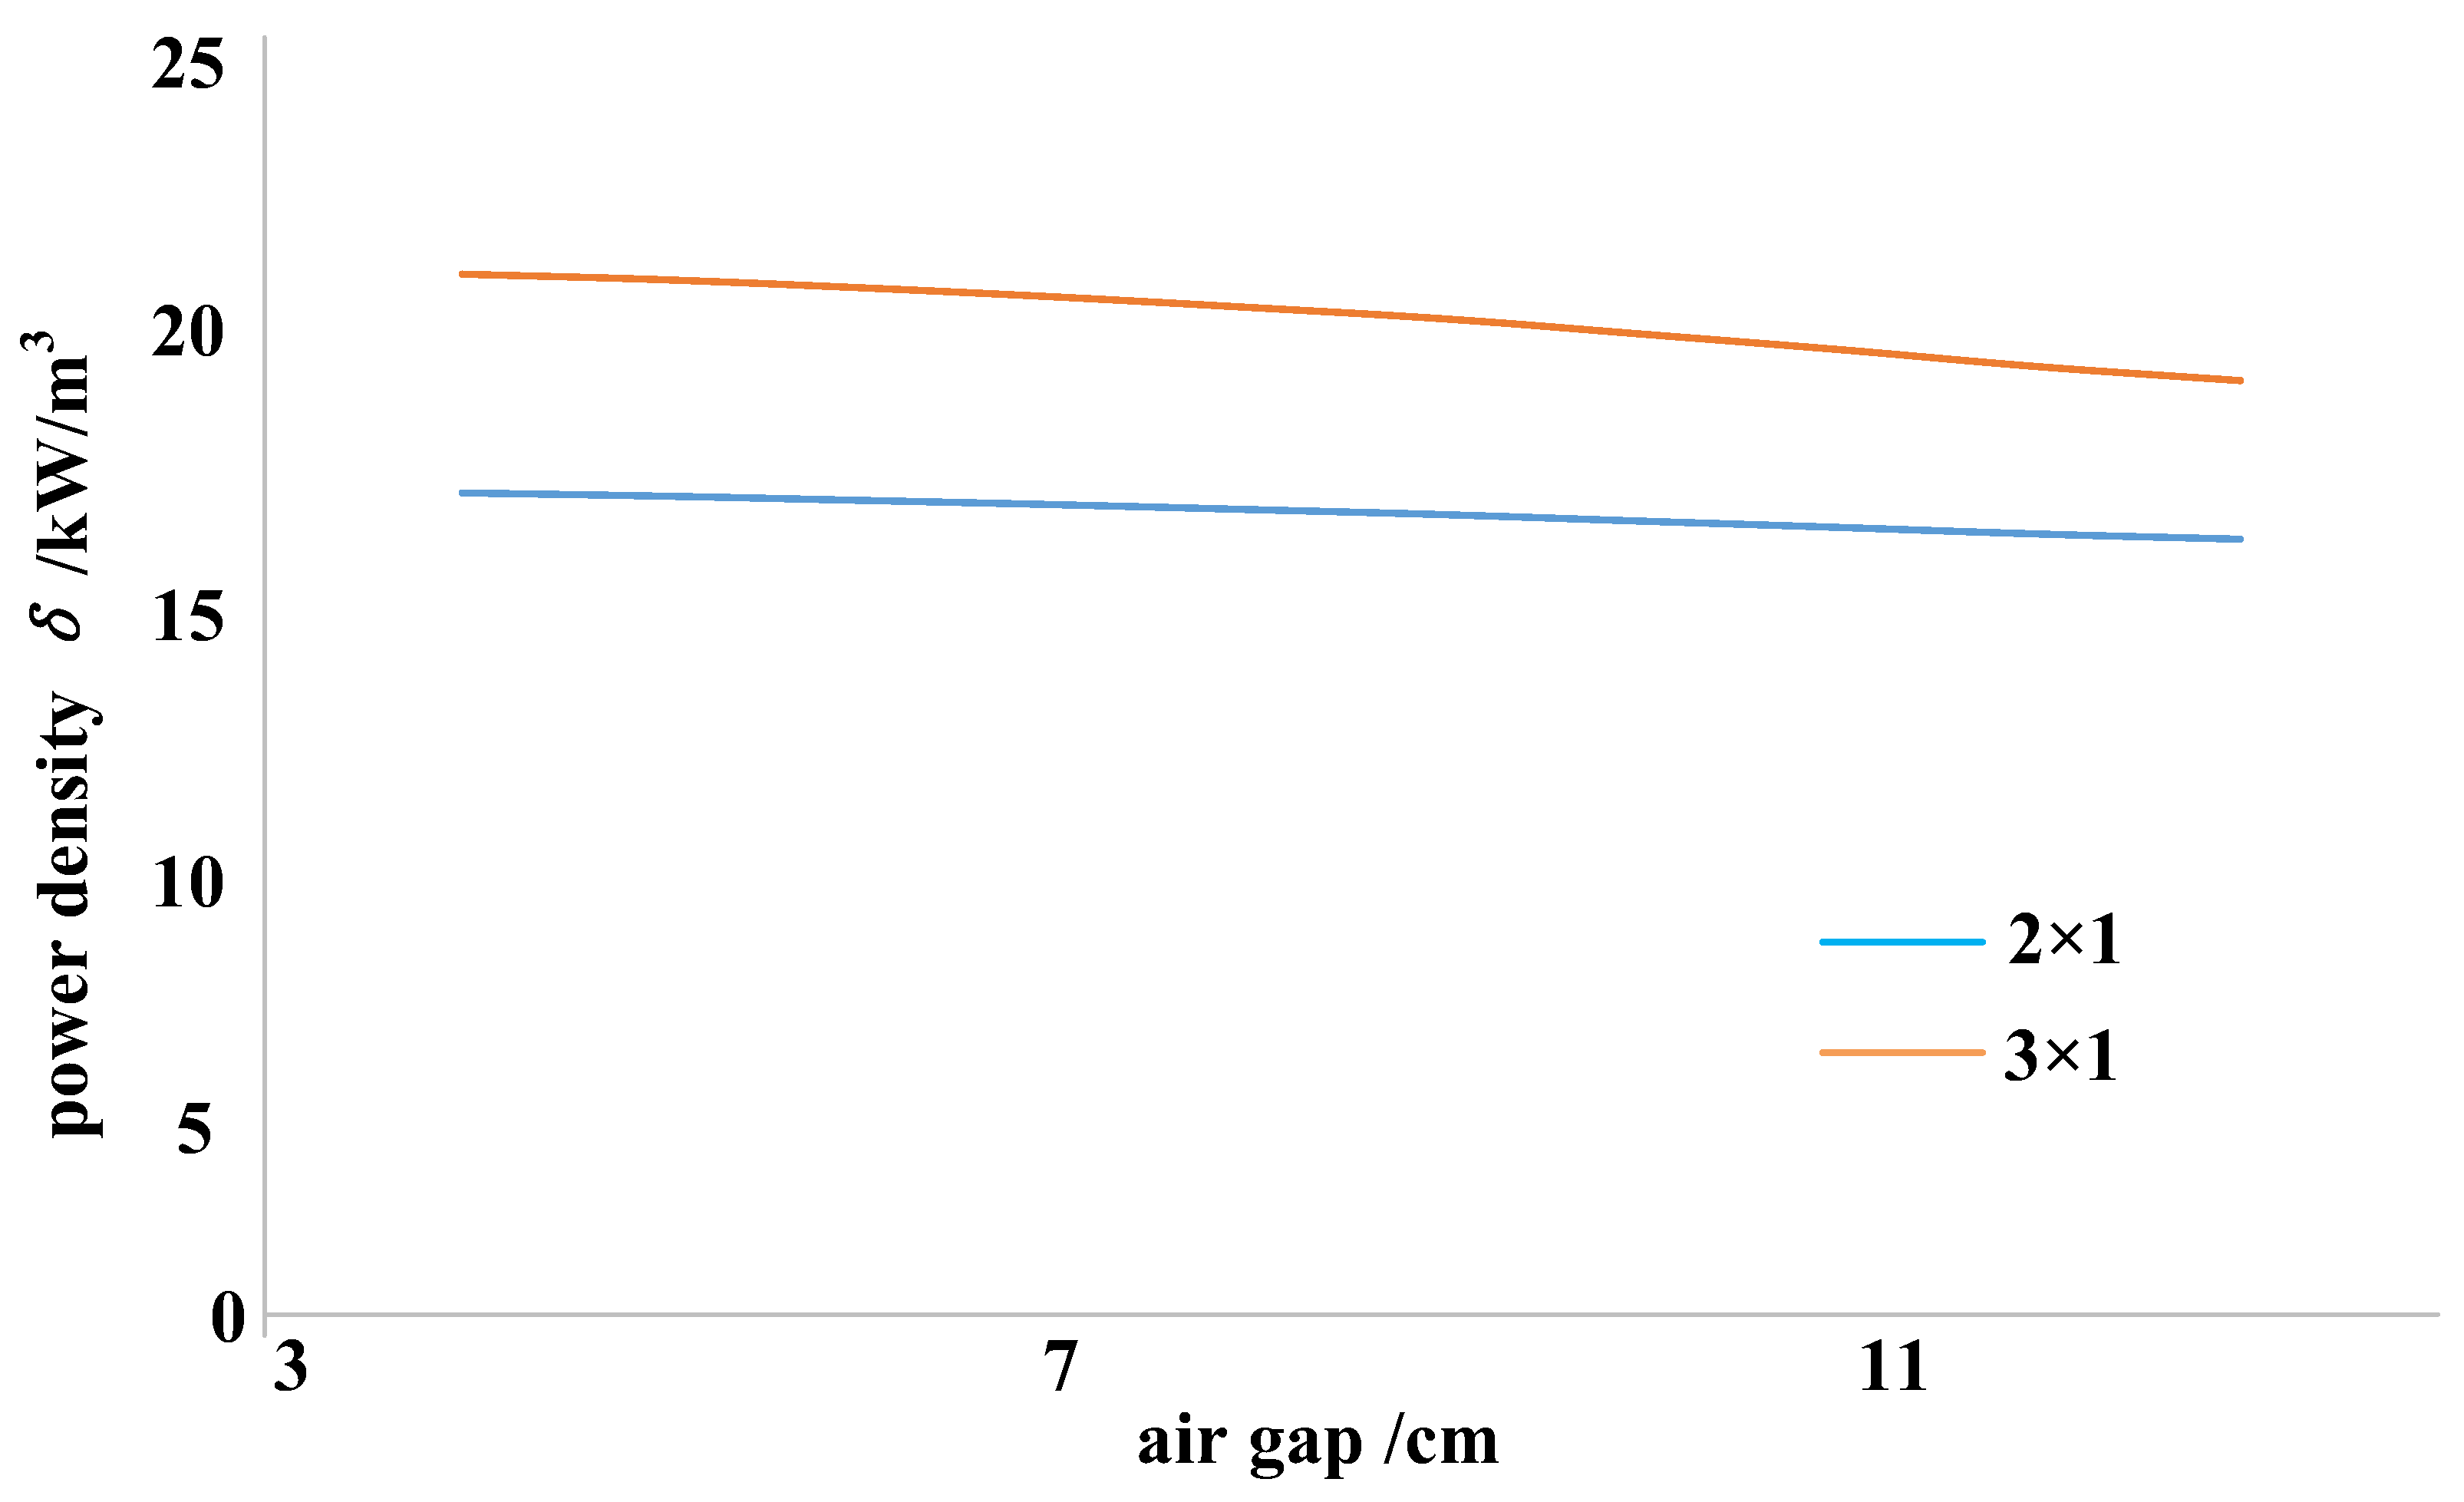
Figure 12 shows the variation in power density with air gap.
When the air gap is approximately 3–9 cm, the power-density variations of both configurations are relatively small, and the configuration has the higher power density. When the air gap exceeds approximately 9 cm, the power-density variation of the configuration becomes more pronounced, although its power-density value remains higher than that of the configuration.
Therefore, the configuration is preferable when maximizing power density is the principal objective. When operation over a relatively large air-gap range and smooth variation of power density are given greater priority, the decision should also consider the control strategy and the actual passenger-load distribution.
5.2.4. Time Characteristics
For the investigated tram, the maximum stationary charging time is 180 s, and the maximum vehicle operating speed is approximately 20 m/s. During dynamic charging, the charging duration depends on vehicle speed v and the number of energized transmitting-coil modules x.
The time-characteristic parameters are listed in
Table 13.
The two configurations have the same allowable static charging time and vehicle-speed range. The expressions and correspond to a comparison using the same number of transmitting-coil modules. However, the single-module lengths of the two configurations are different. Therefore, the same value of x does not represent the same total energized-track length.
For the same total effective energized length
, the available dynamic charging time is
for both configurations. Consequently, the difference shown in
Table 13 should not be interpreted as an intrinsic charging-time advantage of one magnetic coupler. Instead, it reflects the different module lengths and infrastructure segmentation of the two configurations.
The configuration requires fewer and longer transmitting modules for a given line length, whereas the configuration uses a larger number of shorter modules. The selection therefore depends on the required segmentation, switching strategy, installation conditions, and control requirements.
5.2.5. Energy-Transfer Capability
Energy-transfer capability is used to describe the amount of energy transferred during the available charging period because its calculation does not include a mass or volume denominator.
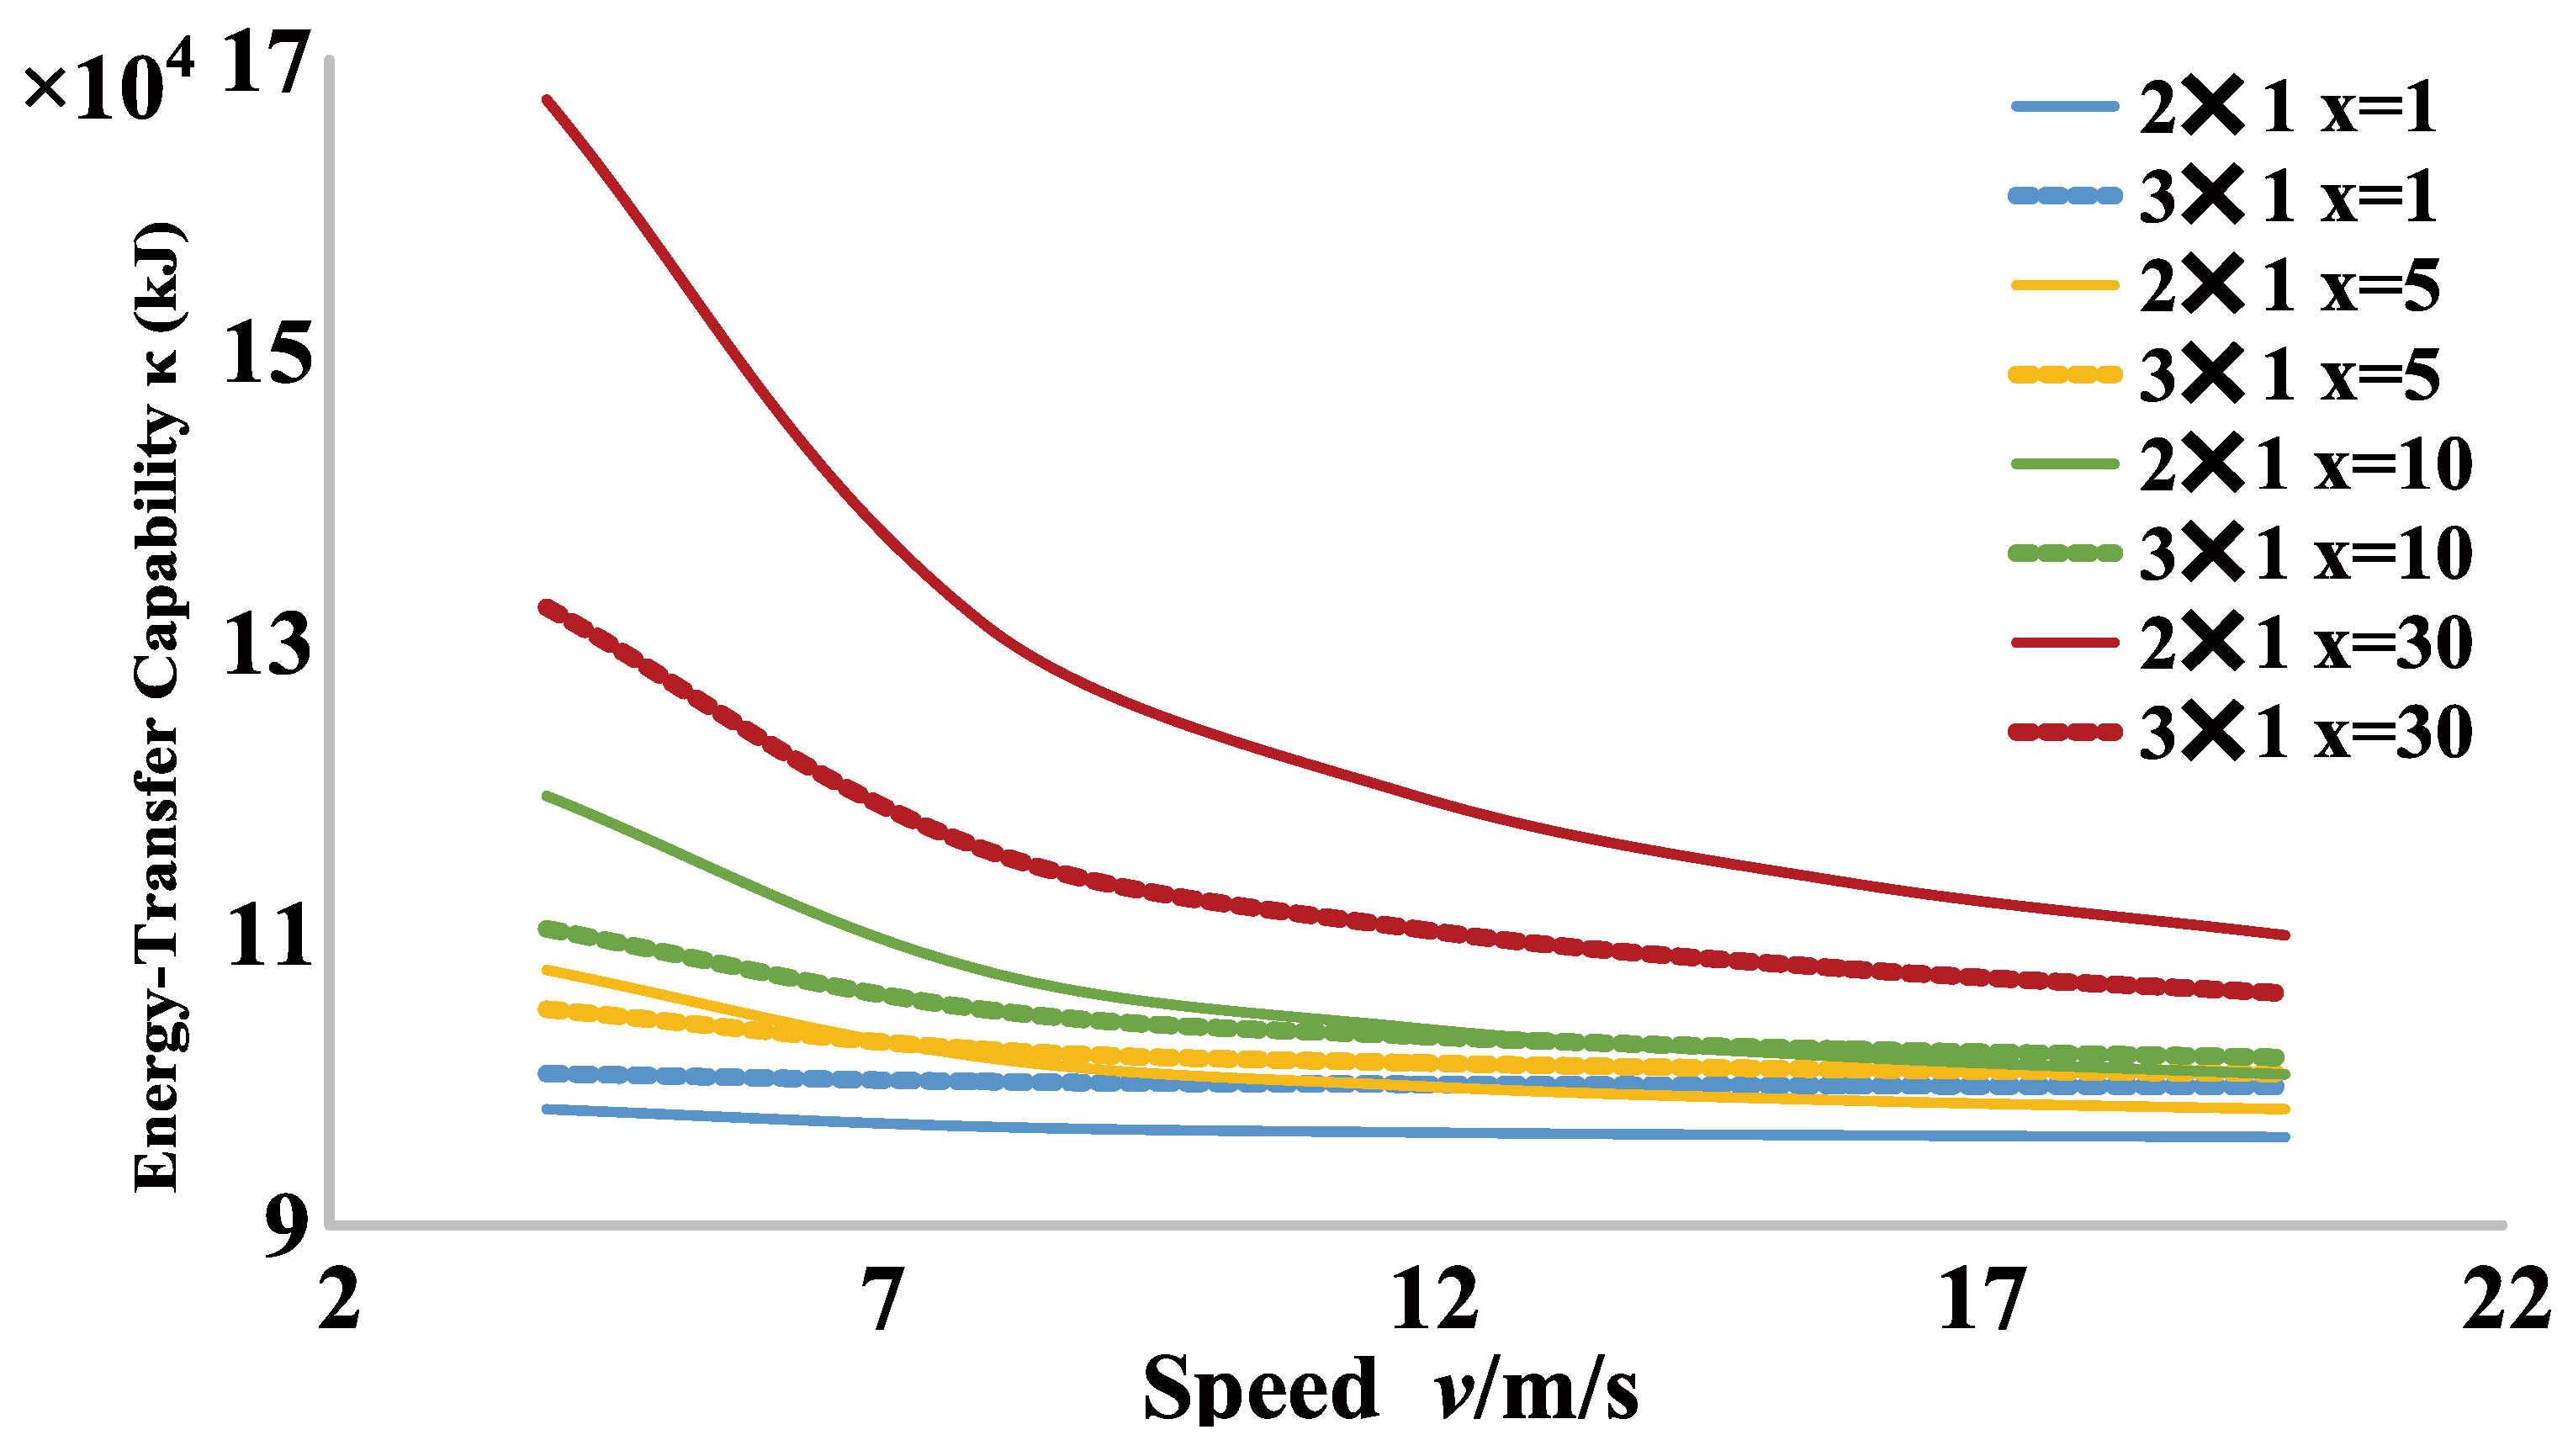
Figure 13 presents the energy-transfer capability as a function of vehicle speed for different numbers of energized modules. The variable
x denotes the number of transmitting-coil modules.
The quantity kW·s is equivalent to kJ.
Under the module-count-based comparison used in
Figure 13, the curves of the
configuration exhibit relatively smooth variations with speed. When the number of modules is small, the difference between the two configurations is limited. When the number of modules increases, the
configuration provides a longer total energized length because each module is longer, and its calculated energy-transfer capability becomes larger at lower vehicle speeds.
However, the results in
Figure 13 reflect the combined effects of output power, vehicle speed, module length, and total energized-track length. They should therefore be interpreted as system-level configuration results rather than as an intrinsic energy-performance comparison of the magnetic couplers alone.
For a fair comparison under the same infrastructure length, the total energized length should be fixed and the required numbers of modules should be adjusted accordingly. Under such a condition, the difference in energy-transfer capability is determined principally by the corresponding output-power characteristics.
5.2.6. Overall Engineering Comparison
The results demonstrate that neither configuration is superior under all evaluation dimensions.
The configuration is advantageous when average efficiency, output power, voltage stability, and power density are given higher priority. It is therefore more suitable for application scenarios dominated by stationary charging or compact high-power-density design.
The configuration provides a larger longitudinal operating range and requires fewer transmitting-coil modules and module interfaces for the same line length. It may therefore be preferable when longitudinal tolerance, reduced infrastructure segmentation, or dynamic operation across long energized sections is assigned greater priority.
The selection should consequently be based on the operating scenario and the associated criterion weights rather than on a universal ranking independent of the charging conditions.
Table 14 compares the principal construction resources required for a 1 km energized section.
The total conductor lengths of the two configurations are comparable. The configuration requires more transmitting-coil modules and more converter units, whereas the configuration requires fewer units with higher individual power ratings.
Because actual equipment prices, failure-rate data, redundancy strategies, maintenance labor costs, and life-cycle data are not available,
Table 14 is used only as a construction-resource comparison. No definitive cost, durability, or reliability ranking is made on the basis of component count alone.
Both configurations are modular and can be extended by increasing the number of transmitting-coil sections. For another rail vehicle, the geometry and modular arrangement should be redesigned according to the vehicle length, bogie positions, available installation space, air-gap range, and required power level.
5.3. Construction of the Weighted Evaluation Model
The judgment matrices are constructed using the bibliometric evidence described in
Section 3 together with the application-specific operating and installation requirements of the investigated tram. Keyword-occurrence frequency supports the initial importance ordering, while engineering constraints provide supplementary evidence for application-dependent comparisons.
The evaluation system includes the first-level judgment matrix W and the five lower-level judgment matrices , , , , and .
The first-level judgment matrix is
The rows and columns correspond, in order, to power-efficiency characteristics, spatial characteristics, power density, time characteristics, and energy-transfer capability.
The judgment matrices contain heuristic pairwise judgments and are not mathematically unique. Therefore, consistency testing is required before the weights are accepted.
For the first-level matrix in Equation (
10), the consistency parameters are
Because , the first-level matrix satisfies the AHP consistency requirement.
For the remaining five matrices , , , , and , the maximum eigenvalues are 3.0037, 3.0803, 4.0435, 3.0055, and 2.0000, respectively. Their corresponding consistency ratios are approximately 0.0032, 0.0692, 0.0161, 0.0047, and 0, respectively. Therefore, all six judgment matrices satisfy the consistency requirement.
Using the column-normalization and row-averaging procedure described in
Section 4, the first-level weight vector obtained from
W is
The corresponding first-level importance order is
Power-efficiency characteristics have the largest weight, followed by spatial characteristics and energy-transfer capability.
Taking the power-efficiency judgment matrix
as an example, its column-normalized matrix is
The corresponding local weight vector is
The normalized power-efficiency score is therefore
where
,
, and
are the normalized efficiency, output-power, and output-voltage-stability scores, respectively.
The relationships between the power-efficiency indicators and the fundamental electrical parameters can be summarized as
The combined relationship is therefore
After the five first-level scores have been calculated for a specified operating condition, the comprehensive score is expressed as
where all five terms are dimensionless normalized scores. As a worked numerical illustration of Equation (
15), consider a project-specific operating scenario in which the normalization and lower-level aggregation procedures have produced the following first-level dimensionless scores for the two candidate configurations:
and
where the elements are ordered as
. This illustrative score pattern is consistent with the trade-offs observed in the case study: the
configuration has better power-efficiency and power-density performance, whereas the
configuration has better longitudinal spatial tolerance. The equal time-characteristic score represents a project condition in which the two configurations are evaluated under the same prescribed charging-time requirement.
Substituting the scores of the
configuration into Equation (
15) gives
Similarly, for the
configuration,
Under this specified illustrative scenario, the
configuration therefore obtains the higher comprehensive score and would be selected. If the project places greater emphasis on spatial tolerance or infrastructure segmentation, the normalized criterion scores and/or application-specific pairwise judgments can change, and the preferred configuration may consequently change. This example is provided only to demonstrate the numerical use of Equation (
15); it is not presented as an additional experimental dataset or as a universal ranking of the two configurations.
A unique numerical comprehensive score requires a common and explicitly specified operating condition. In particular, power density varies with air gap, while energy-transfer capability varies with vehicle speed, module number, and energized-track length. The current dataset does not specify one unique combination of these variables as the universal design condition.
Therefore, an arbitrary air gap, vehicle speed, or module number is not selected solely to generate a single global ranking. Instead, the present case study reports scenario-dependent selection conclusions. Equation (
15) can be used to calculate a numerical comprehensive score once the operating air gap, vehicle speed, energized-track length, and charging strategy have been specified for a particular engineering project.
5.4. Sensitivity Analysis
Sensitivity analysis is conducted to examine whether reasonable changes in the first-level pairwise judgments substantially alter the criterion weights. The analysis is applied to the first-level judgment matrix
W in Equation (
10).
A one-at-a-time procedure is used. The elements
,
,
, and
are varied around their baseline values of 5, 4, 3, and 2, respectively. When an element
is changed, the corresponding reciprocal element is simultaneously updated according to
All other matrix elements remain unchanged. The criterion weights and consistency ratio are recalculated after each perturbation. The offsets considered are , , 0, , and . Only perturbations satisfying are retained.
The sensitivity results are summarized in
Table 15.
When is reduced from 2 to 1, the resulting consistency ratio is approximately 0.1015, which exceeds the acceptable threshold. This perturbation is therefore excluded from the accepted sensitivity range.
For all accepted perturbations, power-efficiency characteristics remain the highest-ranked criterion, and spatial characteristics remain the second-highest criterion. The lower-ranked criteria are generally stable, although power density and energy-transfer capability exchange positions when .
The results indicate that the dominant first-level priorities are stable under the tested local changes in the pairwise judgments. However, the sensitivity analysis does not prove that the conversion from keyword attention to the Saaty scale is unique. It demonstrates only that the principal weight ordering is not substantially altered by the tested local perturbations.
5.5. Discussion, Applicability, and Limitations
The case study demonstrates how the proposed framework can organize electrical, spatial, structural, and operational information when comparing magnetic-coupler configurations.
For the investigated tram, the configuration performs better in terms of average transmission efficiency, average output power, voltage stability, and power density. The configuration provides a larger longitudinal operating range and requires fewer transmitting-coil modules and power-electronic units for the same line length.
The resulting design decision is therefore scenario-dependent. The configuration is more suitable when power-efficiency characteristics and compact power density are dominant requirements. The configuration may be preferable when longitudinal tolerance, reduced infrastructure segmentation, and fewer module interfaces are assigned greater priority.
The framework can be applied to other magnetic-coupler structures when the corresponding electrical, spatial, power-density, time, and energy-transfer data are available. However, the judgment matrices and criterion weights should be reconsidered when the vehicle structure, power level, charging strategy, or operating environment changes.
The present validation has three principal limitations. First, the case study includes only one tram platform and two practically feasible configurations. It demonstrates the application of the framework but does not establish universal validity for all rail vehicles or magnetic-coupler structures.
Second, the performance data are obtained from electromagnetic and circuit simulations. Full-scale experimental validation of a 600 kW rail–tram IPT system requires full-size magnetic couplers, high-power converters, vehicle or track infrastructure, and appropriate electrical-safety facilities. Such experimental validation remains an important direction for future work.
Third, a quantitative comparison with expert-derived AHP, fuzzy AHP, or ANP is not included because no sufficiently representative expert judgment dataset or criterion-dependence network is available. Entropy weighting is also of limited interpretability when only two candidate configurations are compared. The present study therefore uses consistency testing and pairwise-judgment sensitivity analysis to evaluate the internal stability of the proposed weighting process, without claiming universal superiority over other multi-criteria decision-making methods.