Article

Derivation of Neutron SEE Cross-Section Energy Dependence from White Neutron Irradiation Experiments at CSNS-ANIS


Department of Nuclear Physics, China Institute of Atomic Energy, Beijing 102413, China
*
Author to whom correspondence should be addressed.
Electronics 2026, 15(16), 3502; https://doi.org/10.3390/electronics15163502
Submission received: 22 June 2026 / Revised: 15 July 2026 / Accepted: 24 July 2026 / Published: 7 August 2026
(This article belongs to the Section Semiconductor Devices)

Abstract

White neutron Single Event Effect (SEE) cross-sections were measured for two Static Random Access Memories (SRAMs) on the Atmospheric Neutron Irradiation Spectrometer at the China Spallation Neutron Source, and we applied the unfolding technique using a particle swarm optimization algorithm to extract the neutron energy dependence of SEE cross-sections from the experimental data. The calculated results agree well with the experimental data, validating this method. This method demonstrates how white neutron SEE experimental data can be effectively used with unfolding techniques to obtain the neutron energy dependence of SEE cross-sections for microelectronic devices.

1. Introduction

When primary cosmic rays enter the atmosphere, they interact with atmospheric nuclei (mainly nitrogen and oxygen), producing secondary particles such as neutrons, protons, gamma rays, pions, muons, etc., which form the atmospheric radiation environment [1]. Neutrons are the dominant component of the atmospheric radiation environment and can induce Single Event Effects (SEEs) in microelectronic devices, threatening their safe and reliable operation. Neutrons induce SEEs via recoils produced by nuclear reactions between neutrons and device materials, a process called the indirect ionization mechanism [2,3,4,5]. Neutron SEE cross-sections depend on the properties of recoils (energy, yield, linear energy transfer (LET), etc.), which in turn depend on neutron energy; consequently, neutron SEE cross-sections are dependent on neutron energy. The neutron energy dependence of SEE cross-sections is an important aspect in the study of neutron SEEs. If the neutron energy dependence of SEE cross-sections is known, it can be combined with the neutron energy spectrum of the application environment to predict neutron SEE error rates.
JEDEC standards JESD89A [6] and IEC-62396 [7] recommend using monoenergetic neutrons, quasi-monoenergetic neutrons and monoenergetic protons to obtain the neutron energy dependence of SEE cross-sections. Monoenergetic neutrons with energies below 20 MeV are mainly obtained through various nuclear reactions induced by different light particles, such as T(p,n), 7Li(p,n), D(d,n), etc. Above 20 MeV, higher incident energies trigger a multi-body breakup reaction, so only quasi-monoenergetic beams are available—these contain a “peak” component from two-body reactions and a “tail” from multi-body breakup processes. However, when using quasi-monoenergetic neutrons, and because tail neutrons can also induce SEEs, the influence of tail neutrons needs to be considered in order to extract the peak-only cross-section. To address this issue, the unfolding technique has been widely employed [8,9,10].
With the increasing availability of white neutron sources, researchers explored using white neutron SEE experimental data to obtain the neutron energy dependence of the SEE cross-sections. Yahagi et al. used the white neutron source at LANSCE, obtained modified neutron energy spectra by changing the thicknesses of polyethylene shields, and employed the unfolding technique to calculate the four parameters of the Weibull function [11]. In recent years, the time-of-flight (TOF) method has also been used for this purpose [12,13]. However, TOF is not universally applicable to all devices because for neutrons above 1 MeV, flight times are only a few nanoseconds, requiring the device tester to record an SEE within this short window—this is often achievable for some devices and introduces large errors.
In this paper, we employ a comprehensible unfolding technique to obtain the neutron energy dependence of SEE cross-sections by using white neutron experimental data and apply it to the white neutron SEE experimental data obtained from white neutron SEE experiments conducted on the Atmospheric Neutron Irradiation Spectrometer (ANIS) at the China Spallation Neutron Source (CSNS). This method will make the unfolding technique better able to obtain the neutron energy dependence of SEE cross-sections of microelectronic devices by using white neutron SEE experimental data.

2. The Principle of Calculation

When neutrons strike a device, they can cause SEEs via nuclear reactions with device materials and subsequent indirect ionization. The number of SEEs induced by neutrons with a specific energy spectrum during irradiation can be described using the following formula:
N S E E = C d Φ d E σ E d E
where N S E E is the number of SEEs induced by neutrons, C is the capacity of the device (bits), d Φ d E is the neutron energy spectrum (n∙cm−2·MeV−1), and σ E is the energy-dependent function of neutron SEE cross-sections (cm2/bit), which can often be expressed as the Weibull function, Bendel’s function or a linear function. Formula (1) represents a general expression. In the case when neutrons are monoenergetic, we can get the commonly adopted definition of the SEE cross-section N S E E = C σ E Φ . According to Formula (1), if we get the neutron spectrum d Φ d E and the number of SEEs during experiment N S E E , we can establish the equation for solving σ E ; each set of experimental data corresponds to one equation. If the spectra are different, the established equations will also be linearly independent. Therefore, multiple equations can be obtained by irradiating the device with neutrons of different energy spectra; then, the energy-dependent function of neutron SEE cross-sections σ E can be obtained by solving these equations. More equations provide more constraints and thus improve accuracy. In this paper, the energy-dependent function of neutron SEE cross-sections is chosen as the Weibull function:
σ E = 0 ,   E < E t h σ s a t 1 e E E t h W s , E E t h
where σ s a t is the saturation cross-section, E t h is the threshold energy, W is the width parameter, and s is the shape parameter.
The principle of solving the equation set is an iterative process, described as follows: first, a set of initial Weibull function parameters is chosen to define σ E and then integrated with neutron energy spectra during the irradiation experiments according to Formula (1). Then, the calculated values of the number of neutron SEE N S E E c a l are obtained. Next, the mean square error (MSE) between the calculated values and experimental ones of N S E E is calculated:
M S E = 1 N N S E E c a l N S E E e x p N S E E e x p 2
where N is the number of neutron energy spectra. The smaller the MSE is, the closer the calculated values ( N S E E c a l ) are to the experimental ( N S E E e x p ) ones, and the neutron energy dependence of the SEE cross-sections is closer to the correct solution. The minimum of MSE can be achieved by iterative algorithms. When the maximum number of iterations is reached or the MSE value falls below a certain limit (e.g., 0.001 in this work), the iteration process are stopped. Otherwise, the parameters of the Weibull function are modified, and the MSE is recalculated following the above process. The Weibull function parameters are obtained after stopping the iteration process, which represent the solution to the equation set; following this, the energy-dependent function of neutron SEE cross-sections σ E can be obtained. The aforementioned process transforms the problem of solving equations into an optimization problem, which can be addressed using optimization algorithms.

3. Experiments

3.1. Devices

Table 1 lists the devices used for the neutron irradiation experiments. ESA SEU Monitor is a 250 nm CMOS-based SRAM fabricated by the European Space Agency (ESA). It is a radiation-hardened device that can prevent multi-bit upset (MBU) and also has a high LET threshold for single event latch-up (SEL); its SEL threshold is 80 MeV·cm2/mg. CY7C1318KV18 is a 65 nm CMOS-based DDR-II SRAM manufactured by Cypress Semiconductor Corporation, whose operating voltage is 1.8 V, and it is written and read through a motherboard tester. The motherboard tester is powered at nominal voltage of 12 V.
The effect to be measured in both devices is single event upset (SEU). The two SRAMs are programmed with the checkerboard pattern. Both devices were irradiated at normal beam incidence.

3.2. Experiment Facility

The white neutron irradiation experiment was conducted on the ANIS which is located at the CSNS. The CSNS consists of an accelerator that can deliver protons with energy to achieve a kinetic energy of 1.6 GeV. These protons then reach the W-Ta spallation target and react with the target material to produce white neutrons through spallation reaction. The ANIS is in the forward direction at an orientation of 41° to the proton beam [14].
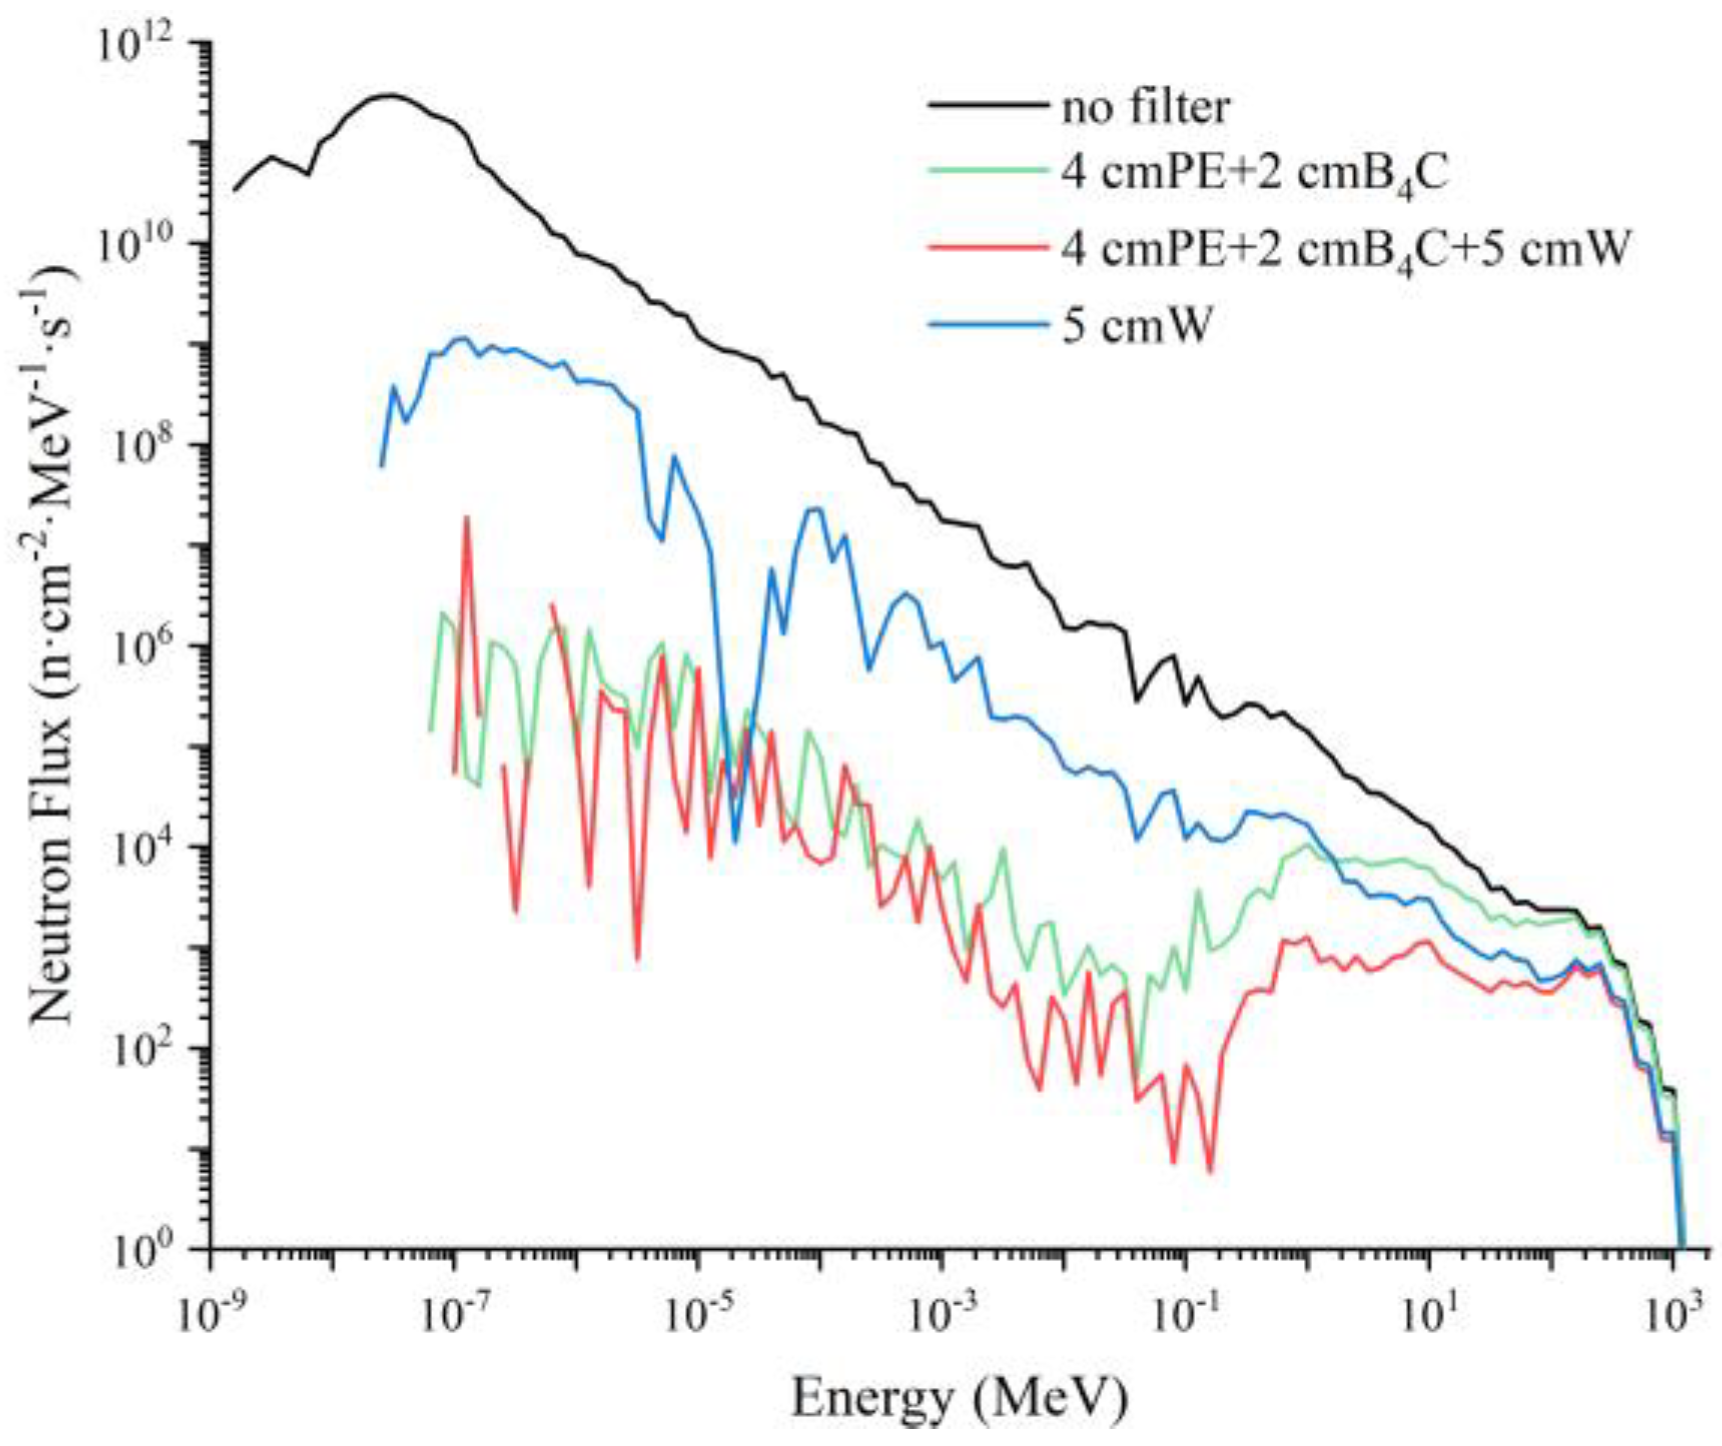
The energy range of the ANIS covers thermal neutrons up to 1.6 GeV. The ANIS has thermal neutron filters in order to decrease the fluence of thermal neutrons [14]. In this experiment, 4 cm of polyethylene and 2 cm of B4C were used as the thermal neutron filter. Additionally, the ANIS has neutron flux controllers with W blocks of different thicknesses in order to reduce the neutron flux intensity [14]. In this experiment, 5 cm of W blocks was used as the neutron flux controller. When there is no filter and no neutron flux controller, the differential energy spectrum matches the JEDEC standard well [15]. In this experiment, we also used a combination of a thermal neutron filter and neutron flux controller, so four different kinds of neutron spectra were used to irradiate two devices. The neutron energy spectra for the above situations, with the accelerator operating at a power of 140 kW, are shown in Figure 1. During the irradiation experiment, the real-time accelerator power P t was recorded at a fixed interval of 5 s, together with the start time t s and end time t e . Assuming a linear proportionality between the neutron yield and the beam power, the instantaneous neutron flux φ t for each 5 s interval was obtained by scaling the reference value, φ t = φ 140 × P t / 140 , where φ 140 is neutron flux when the accelerator operates at a power of 140 kW. Consequently, the total neutron fluence Φ was obtained by summing the contributions of all intervals between the t s and t e : Φ = i Δ t φ i = i Δ t × φ 140 × P i / 140 . The number of SEUs and the neutron fluence for all energy ranges during irradiation of the two SRAMs are listed in Table 2.

4. Results

4.1. Minimize MSE by Using Particle Swarm Optimization

The principle of calculation to obtain the energy-dependent function of neutron SEE cross-sections through white neutron SEE experimental data was introduced in Section 2. After SEE experiments, the number of SEEs caused by neutrons N S E E and neutron energy spectra d Φ d E are known and therefore the neutron energy dependence of SEE cross-sections can be calculated with the Formula (1). With four different neutron spectra used in the experiments, we established four equations for each SRAM to determine the energy-dependent function of neutron SEE cross-sections.
We employed the particle swarm optimization (PSO) algorithm to solve these equations. The fundamental idea behind this algorithm is to find the optimal solution through the collaboration and information sharing of individuals in a group [16]. The PSO algorithm has numerous applications in optimization functions and neural network training. Each particle corresponds to a candidate solution in a four-dimensional space (the four Weibull parameters). All individuals form a group, representing a set of possible solutions. Since the Weibull function has four parameters, there are four variables to be determined, and the position of each individual is represented by coordinates in a four-dimensional space.
In the initialization stage, we established 10 independent groups, with each group comprising 100 individuals. The minimum MSE value was selected from the results of these 10 groups. We set the maximum number of iterations to 200 and stop the iterative process when the MSE drops below 0.001. Once the calculation is completed, the minimum value of MSE and the corresponding parameters of the Weibull function are output.
In the initialization stage, the range of the four parameters of the Weibull function must also be set. For the saturation cross-section σ s a t , after experiments, the average SEE cross-sections of different energy spectra can be calculated based on the following formula of the SEE cross-section
σ a v g = N S E E C Φ
where Φ is the total fluence of neutrons. According to the definition of the Weibull function, the saturation cross-section is the maximum value of the cross-section, so the average cross-section σ a v g must be smaller than σ s a t ; therefore, the range of σ s a t was taken to be between 1 time and 10 times the largest average cross-section. The ranges of the remaining three parameters are determined by empirical values: the range of E t h was taken to be between 1 MeV and 14 MeV, the range of W was taken to be between 1 MeV and 30 MeV, and the range of s was taken to be between 0.5 and 5.
Although not required by the calculation method, we had previously measured 14 MeV monoenergetic neutron SEU cross-sections for both devices on the Cockcroft–Walton accelerator at the China Institute of Atomic Energy (CIAE). We therefore incorporated these data as an optional constraint in the PSO to guide the solution toward physically reasonable values, particularly in the low-energy region. Specifically, we required that the calculated cross-section at 14 MeV agree with the experimental value within a relative error of 30%. This constraint is not essential to the calculation method but helps reduce ambiguity in the parameter space. We chose 14 MeV because it lies in the sensitive region of the Weibull curve (near the knee) and reliable monoenergetic data were readily available; other energies could be used similarly if available.

4.2. The Results of the Calculation

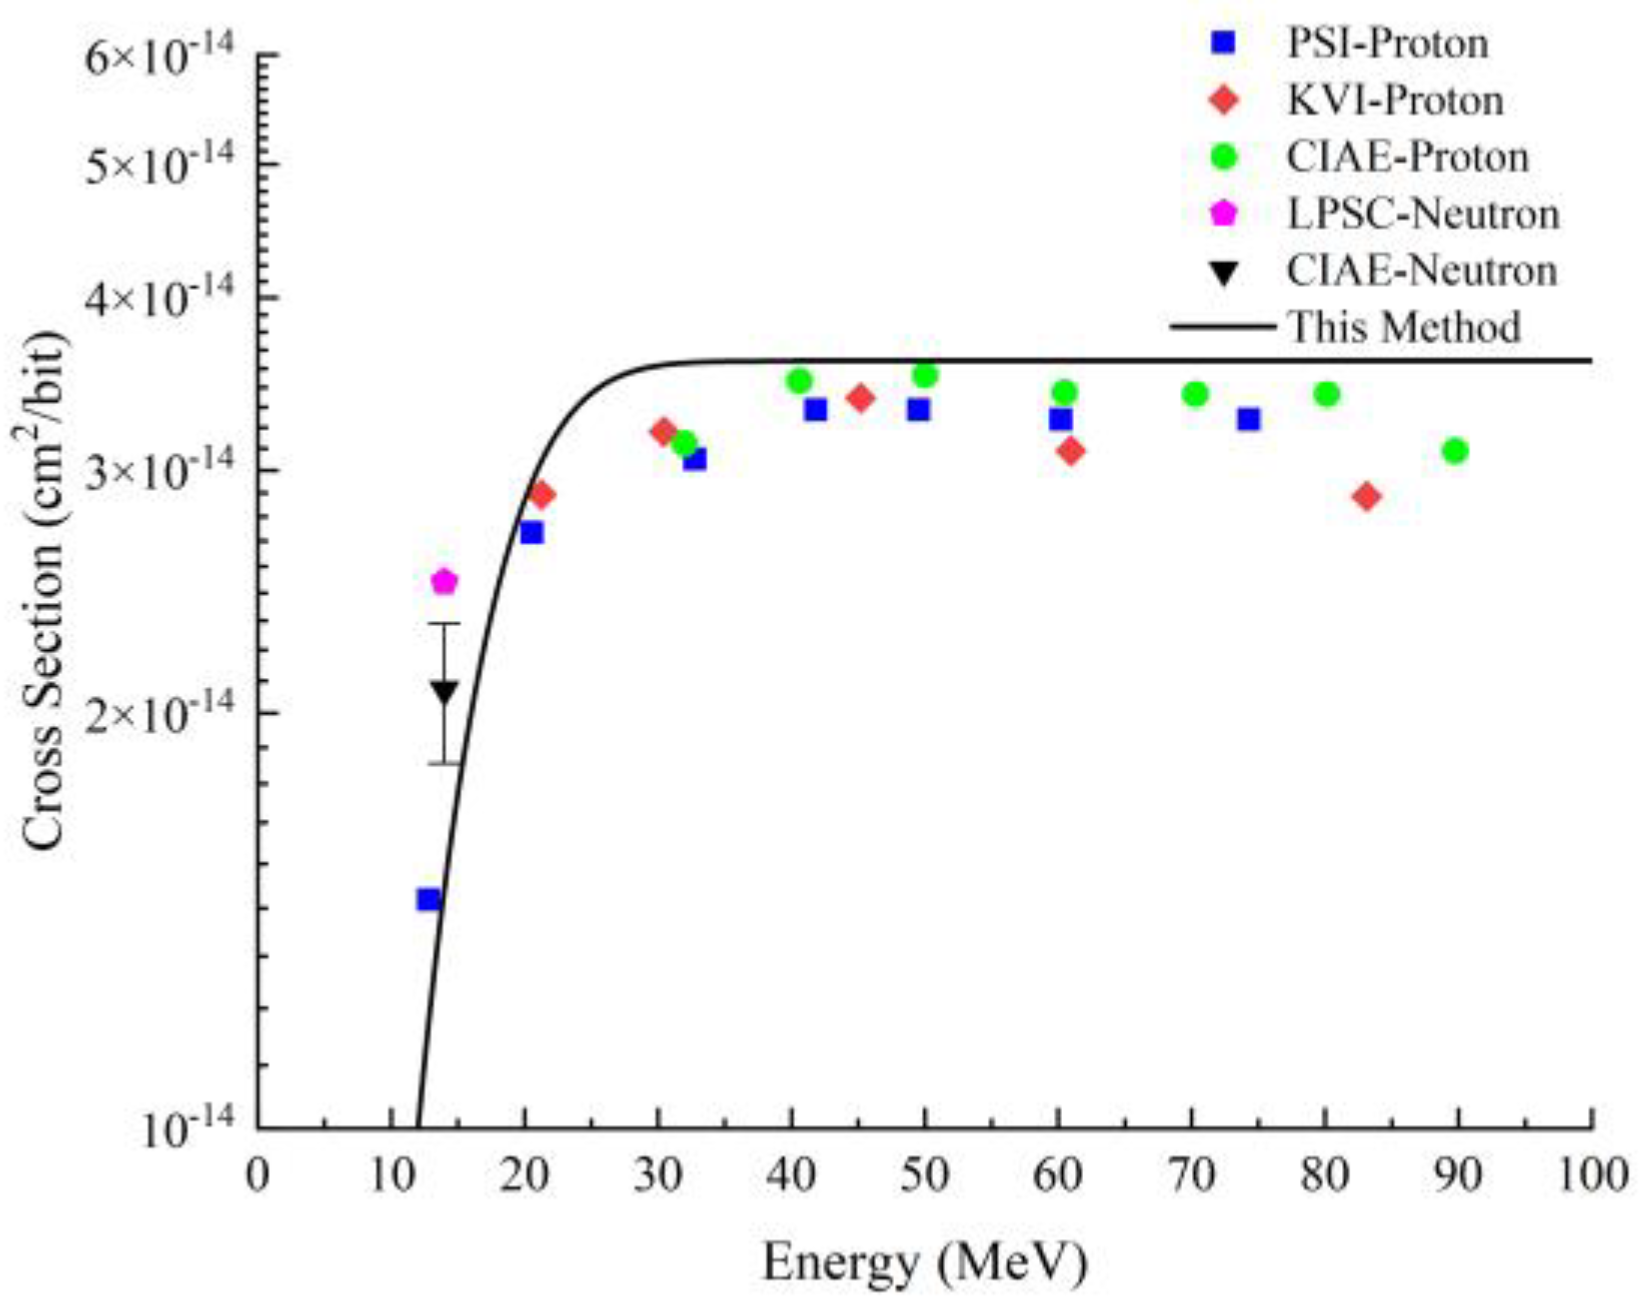
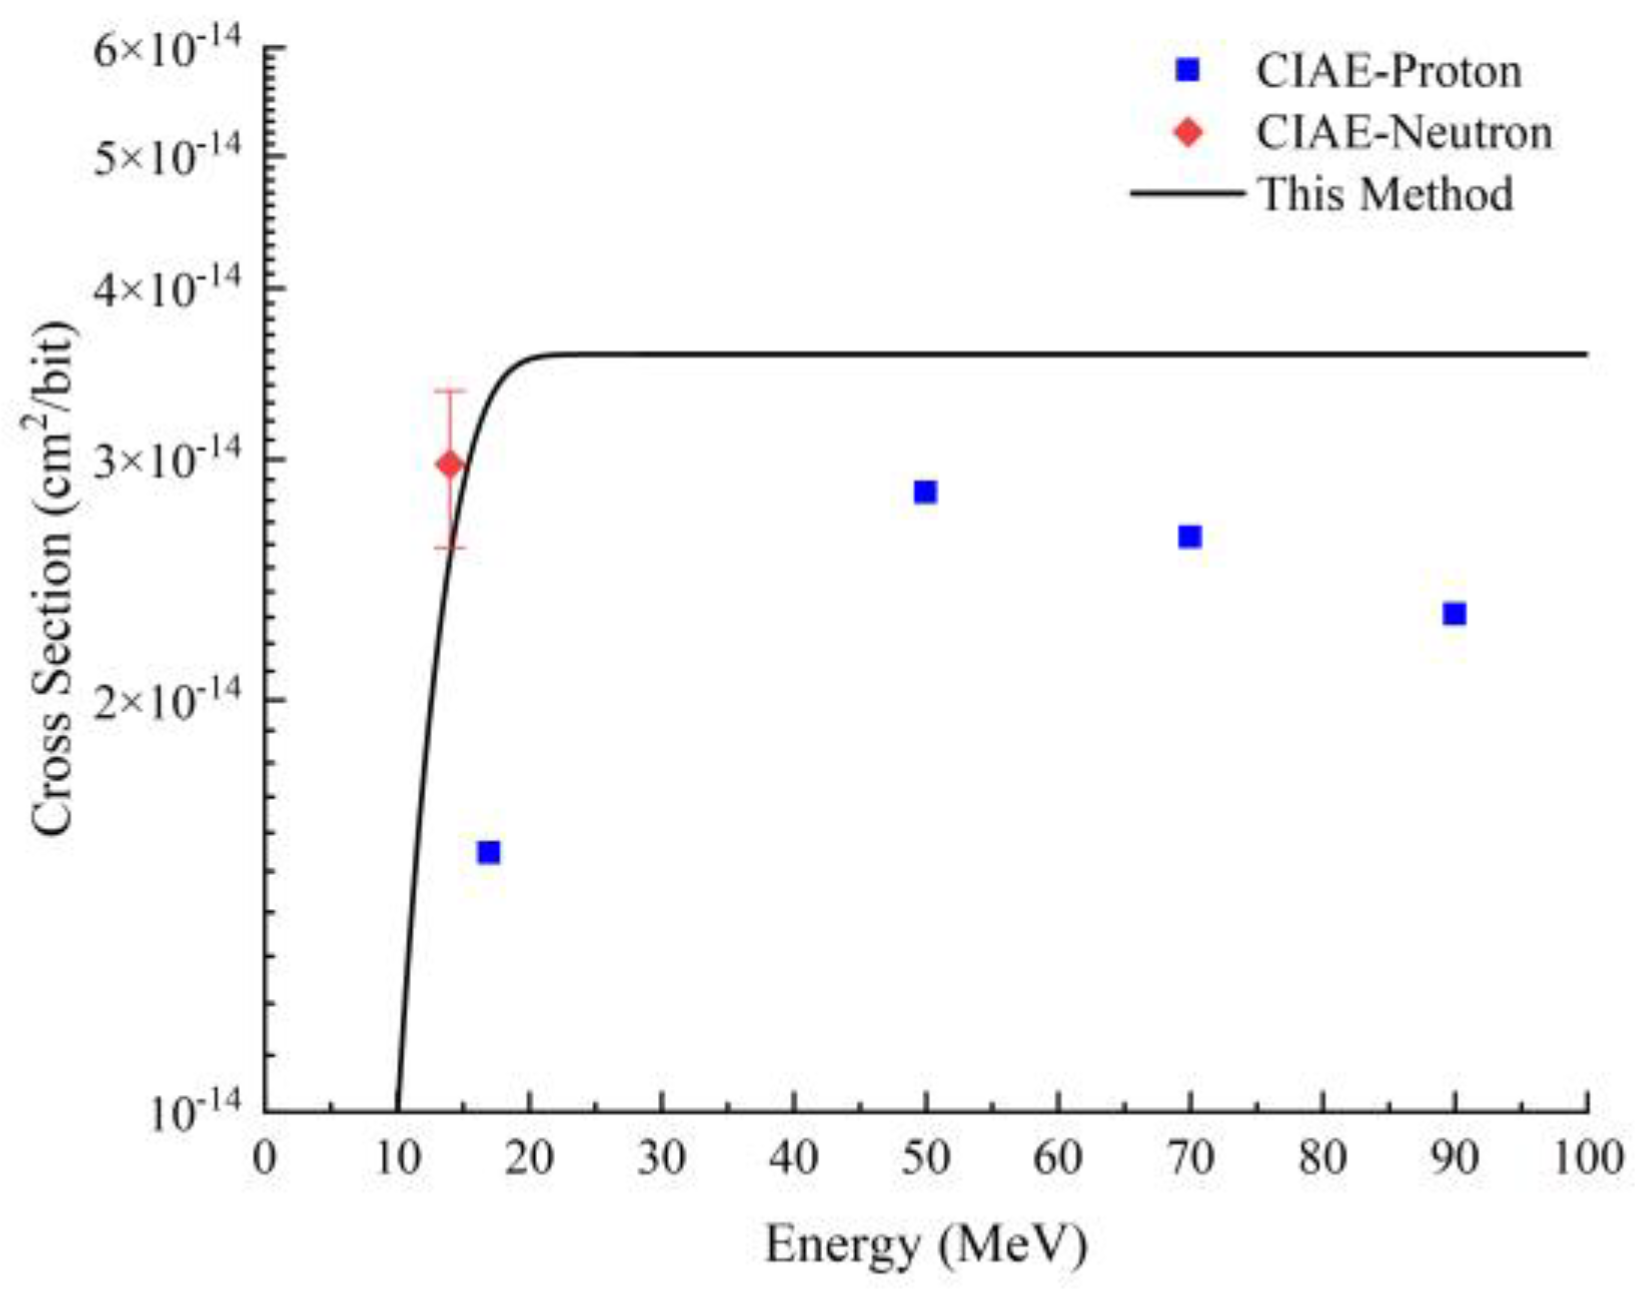
After calculation using the PSO algorithm, the four parameters of the Weibull function are obtained, which can be used to calculate the energy-dependent function of neutron SEE cross-sections. The parameters of the Weibull function calculated by the method of the two SRAMs are listed in Table 3, and the calculated and the experimental results of the SEU cross-sections of the two SRAMs are shown in Figure 2 and Figure 3. Since the cross-sections at high energy approach the saturated cross-section for the Weibull function, and cross-sections of these two SRAMs approach the saturation cross-section before 100 MeV, the upper limit of the x-axis of Figure 2 and Figure 3 is 100 MeV. Based on the equivalence of proton and neutron SEE, it is generally assumed that the SEE cross-sections of proton and neutron above 50 MeV are equal [6]. Due to the lack of neutron SEU cross-sections larger than 20 MeV for the two devices, the proton SEU cross-sections of the two devices are shown here in order to demonstrate the effectiveness of the calculation method [5,17]. As can be seen from Figure 2 and Figure 3, for SRAM A, the calculated neutron SEU cross-sections are in agreement with the experimental neutron and proton SEE cross-sections well; for SRAM B, the calculated neutron SEU cross-sections are in agreement with the experimental ones well, but larger than proton SEE cross-sections. Overall, the calculation method presented in this paper is effective.

5. Discussion

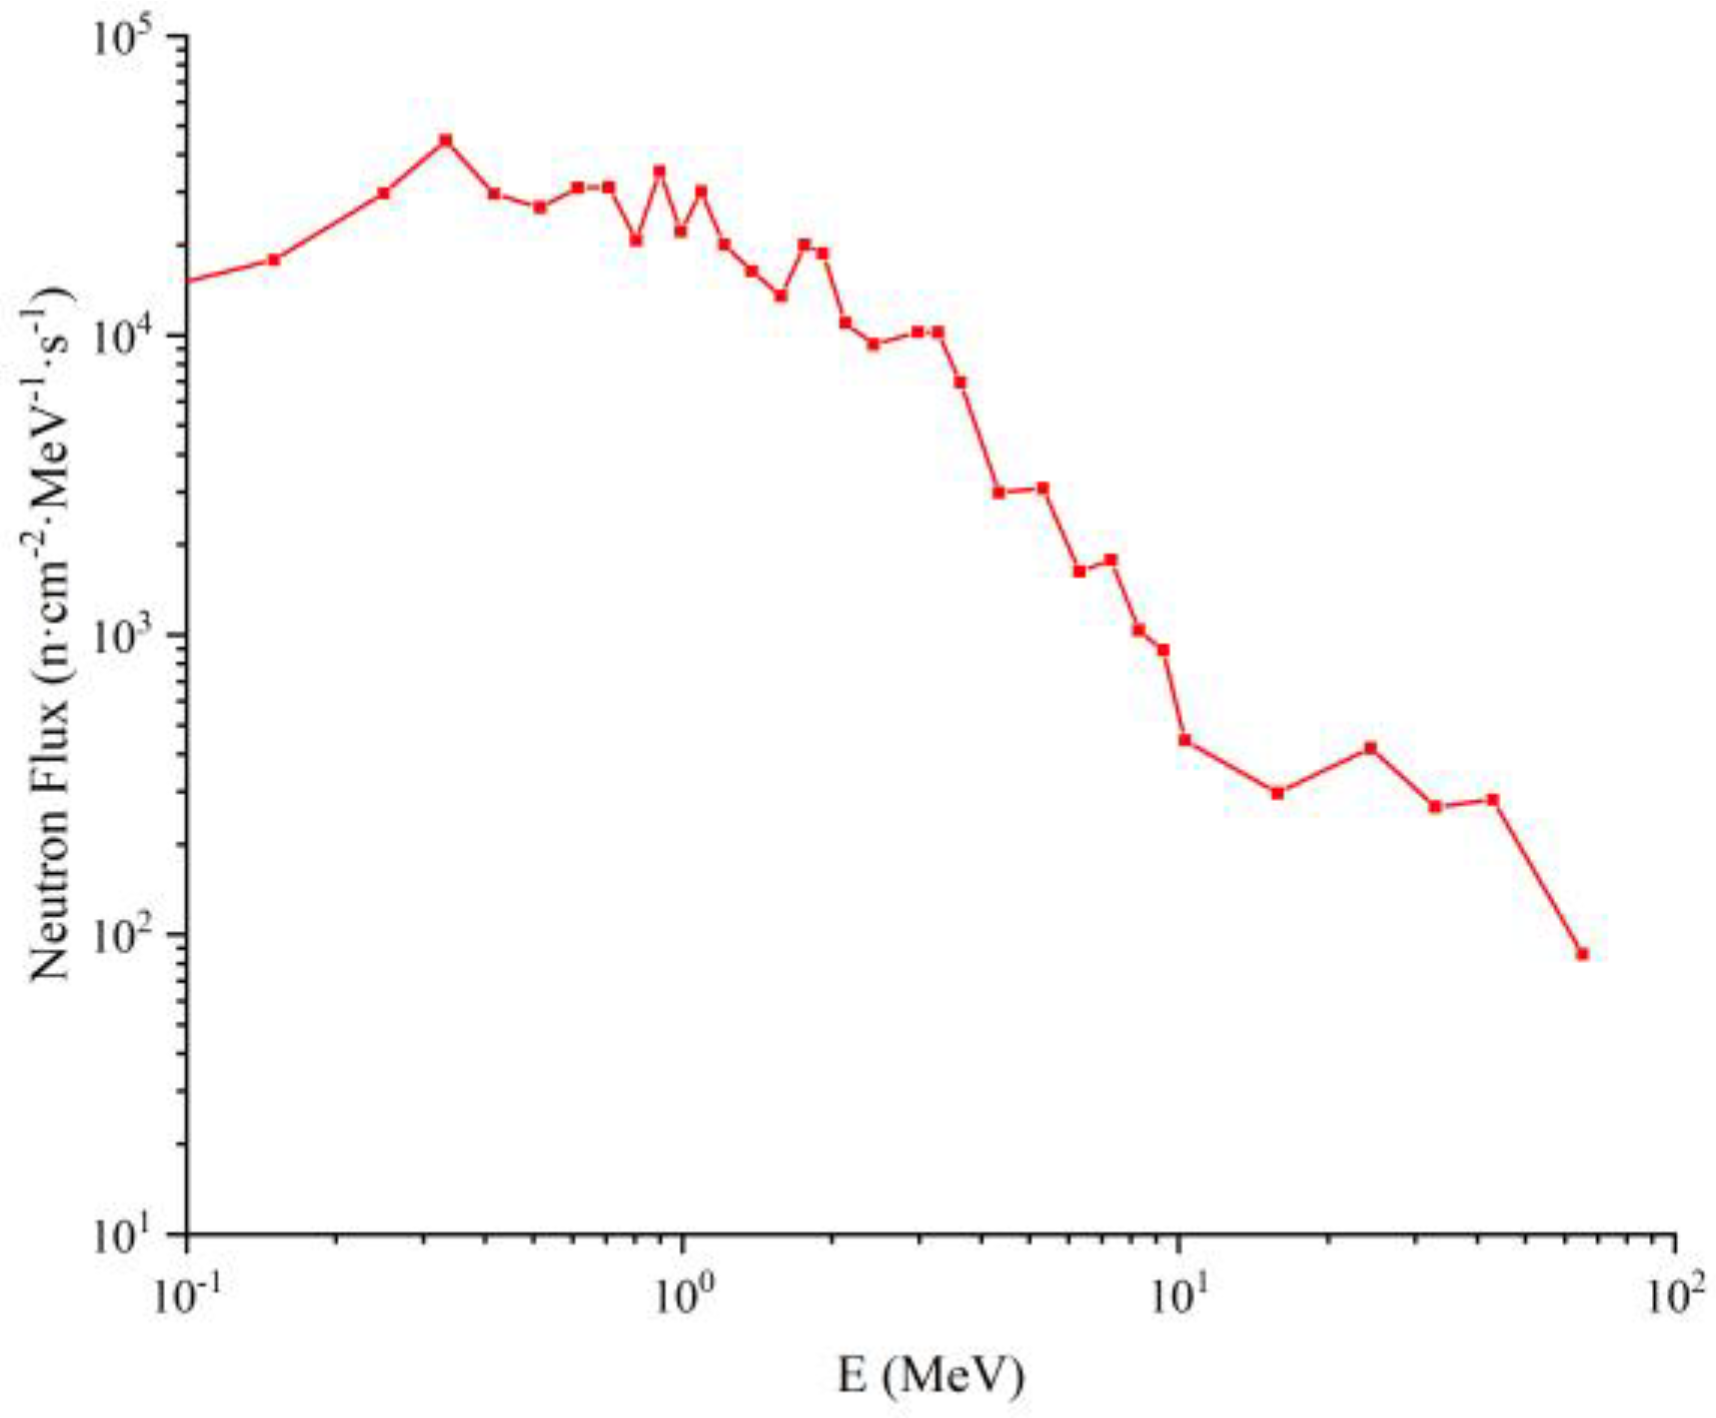
The neutron energy-dependent function of SEE cross-sections of two SRAMs is calculated in Section 4. The accuracy of the calculation results can be verified by using other data from white neutron experiments. We measured the Soft Error Rates (SERs) of these two SRAMs at the CIAE 100 MeV cyclotron-based white neutron source. The neutron spectrum at 1 µA proton current, simulated with Geant4, is shown in Figure 4. Here, SER can be calculated by the following formula:
S E R = C d φ d E σ E d E
where C is the capacity of the device (bits), σ E is the neutron energy-dependent function of SEE cross-sections (cm2/bit), and d φ d E is the time-related neutron spectrum (n∙cm−2∙MeV−1∙s−1). The calculated SER and experimental ones of two SRAMs are listed in Table 4. For SRAM A, the experimental SER and the calculated ones are in good agreement, with a relative error of 7.64%. For SRAM B, the calculated SER deviates from the experimental value by 37%. Although this deviation is larger than that of SRAM A, it remains acceptable for SER estimation purposes. In practice, uncertainties in neutron spectral measurements, beam fluence monitoring, and the intrinsic variability of the atmospheric neutron field often lead to prediction uncertainties of a factor of two or more. Therefore, a 37% discrepancy is still within the generally accepted tolerance for engineering reliability assessments. In summary, the calculation results are accurate, which also proves the validity of the calculation method introduced in Section 2.

6. Conclusions

We conducted the white neutron SEE experiments on two SRAMs at the ANIS of the CSNS, and employed the unfolding technique with PSO algorithm to calculate the neutron energy dependence of SEE cross-sections based on experimental data. The calculation results are in good agreement with the experimental ones, validating the effectiveness of the calculation method. This calculation method effectively broadens the accessibility of neutron energy dependence of SEE cross-sections, particularly for devices for which TOF methods are difficult to implement. In addition, it enhances the scientific value of spallation neutron sources equipped with white-neutron facilities, enabling them to serve not only as radiation test platforms but also as versatile tools for cross-section characterization. The method is general and can be readily extended to other microelectronic devices, thereby supporting more accurate soft error rate predictions in realistic atmospheric neutron environments.

Author Contributions

Conceptualization, G.G.; methodology, X.M. and J.H.; software, X.M.; validation, J.H. and F.Z.; formal analysis, X.M.; investigation, X.M., J.H., J.L., J.T. and Q.C.; resources, G.G.; data curation, X.M. and S.D.; writing—original draft preparation, X.M.; writing—review and editing, J.H., S.D. and Q.C.; visualization, F.Z.; supervision, G.G.; project administration, S.D.; funding acquisition, G.G. All authors have read and agreed to the published version of the manuscript.

Funding

This work was supported in part by the National Natural Science Foundation of China under Grant U2267210 and 12475291, in part by the Industrial Technology Development Program under Grant JCKY2024201B008, and in part by the CNNC Sustained Support Research Program for R&D Platforms under Grants WDZC-2024-055, CNNC-PTWZ-202518, and WDZC-2023-AW-0201.

Data Availability Statement

The data presented in this study are available upon reasonable request from the corresponding authors.

Acknowledgments

The authors would like to thank the Atmospheric Neutron Irradiation Spectrometer (ANIS) at the China Spallation Neutron Source (CSNS) for providing the beamtime and technical support. We are grateful to Lihua Mo, Zhiliang Hu, Quanzhi Yu and all the beamline staff for their invaluable assistance and guidance during our experiments.

Conflicts of Interest

The authors declare that this study received funding support from the China National Nuclear Corporation (CNNC) through the CNNC Sustained Support Research Program for R&D Platforms (Grant Nos. WDZC-2024-055, CNNC-PTWZ-202518, and WDZC-2023-AW-0201). The funder was not involved in the study design, data collection, analysis, or interpretation, the writing of this article, or the decision to submit it for publication. The authors declare no other conflicts of interest.

Abbreviations

The following abbreviations are used in this manuscript:
SRAMStatic random access memory
LETLinear Energy Transfer
SEESingle Event Effect
SEUSingle Event Upset
MBUMult-bit Upset
SERSoft Error Rate
CSNSChina Spallation Neutron Source
ANISAtmospheric Neutron Irradiation Spectrometer
CIAEChina Institute of Atomic Energy
PSOParticle Swarm Optimization

References

  1. Nakamura, T.; Ibe, E.; Baba, M.; Yahagi, Y.; Kameyama, H. Terrestrial Neutron-Induced Soft Errors in Advanced Memory Devices; World Scientific: Singapore, 2008. [Google Scholar]
  2. Tosaka, Y.; Kanata, H.; Itakura, T.; Satoh, S. Simulation technologies for cosmic ray neutron-induced soft errors: Models and simulation systems. IEEE Trans. Nucl. Sci. 1999, 46, 774–780. [Google Scholar] [CrossRef]
  3. Dyer, C.S.; Clucas, S.N.; Sanderson, C.; Frydland, A.D.; Green, R.T. An experimental study of single-event effects induced in commercial SRAMs by neutrons and protons from thermal energies to 500 MeV. IEEE Trans. Nucl. Sci. 2004, 51, 2817–2824. [Google Scholar] [CrossRef]
  4. Watanabe, Y.; Abe, S. Nuclear reaction models responsible for simulation of neutron-induced soft errors in microelectronics. Nucl. Data Sheets 2014, 120, 254–257. [Google Scholar] [CrossRef]
  5. Han, J.; Guo, G.; Liu, J.; Yin, Q.; Zhang, F.; Ma, X. Proof and Modification of the Burst Generation Rate Model. IEEE Electron Device Lett. 2023, 44, 1935–1938. [Google Scholar] [CrossRef]
  6. JEDEC Standard JESD89A; Measurement and Reporting of Alpha Particle and Terrestrial Cosmic Ray Induced Soft Error in Semiconductor Devices. JEDEC: Arlington, VA, USA, 2006.
  7. IEC Standard 62396-2; Process Management for Avionics—Atmospheric Radiation Effects—Part 2: Guidelines for Single Event Effects Testing for Avionics Systems. International Electrotechnical Commission: Geneva, Switzerland, 2008.
  8. Johansson, K.; Dyreklev, P.; Granbom, B.; Olsson, N.; Blomgren, J.; Renberg, P.-U. Energy-resolved neutron SEU measurements from 22 to 160 MeV. IEEE Trans. Nucl. Sci. 1998, 45, 2519–2526. [Google Scholar] [CrossRef]
  9. Lambert, D.; Baggio, J.; Hubert, G.; Paillet, P.; Girard, S.; Ferlet-Cavrois, V.; Flament, O.; Saigné, F.; Boch, J.; Sagnes, B.; et al. Analysis of Quasi-Monoenergetic Neutron and Proton SEU Cross Sections for Terrestrial Applications. IEEE Trans. Nucl. Sci. 2006, 53, 1890–1896. [Google Scholar] [CrossRef]
  10. Olmos, M.; Prokofiev, A.; Gaillard, R. Unfolding procedure for SER measurements using quasi-monoenergetic neutrons. In Proceedings of the IEEE International Reliability Physics Symposium, San Jose, CA, USA, 17–21 April 2005; pp. 696–697. [Google Scholar]
  11. Yahagi, Y.; Ibe, E.; Yamamoto, S.; Yoshino, Y.; Sato, M.; Takahashi, Y.; Kameyama, H.; Saito, A.; Hidaka, M. Versatility of SEU function and its derivation from the irradiation tests with well-defined white neutron beams. IEEE Trans. Nucl. Sci. 2005, 52, 1562–1567. [Google Scholar] [CrossRef]
  12. Iwashita, H.; Kiuchi, R.; Hiroshima, Y.; Okugawa, Y.; Sebe, T.; Takeda, M.; Sato, H.; Kamiyama, T.; Furusaka, M.; Kiyanagi, Y. Energy-Resolved SEU Cross Section From 10-meV to 800-MeV Neutrons by Time-of-Flight Measurement. IEEE Trans. Nucl. Sci. 2023, 70, 216–221. [Google Scholar] [CrossRef]
  13. Akturk, A.; Wilkins, R.; Gunthoti, K.; Wender, S.A.; Goldsman, N. Energy Dependence of Atmospheric Neutron-Induced Failures in Silicon Carbide Power Devices. IEEE Trans. Nucl. Sci. 2022, 69, 900–907. [Google Scholar] [CrossRef]
  14. Yu, Q.; Shen, F.; Yuan, L.; Lin, L.; Hu, Z.; Zhou, B.; Liang, T. Physical design of an Atmospheric Neutron Irradiation Spectrometer at China Spallation Neutron Source. Nucl. Eng. Des. 2022, 386, 111579. [Google Scholar] [CrossRef]
  15. Yu, Q. Evaluating the broad neutron spectrum of ANIS. Appl. Radiat. Isot. 2024, 203, 111075. [Google Scholar] [CrossRef] [PubMed]
  16. Kennedy, J.; Eberhart, R. Particle swarm optimization. Proc. ICNN 1995, 4, 1942–1948. [Google Scholar]
  17. Zhang, Y.; Guo, G.; Liu, J.; Han, J.; Qin, Y.; Yin, Q.; Xiao, S.; Yang, X. The proton irradiation facility for Single-Event effect testing in CIAE. Nucl. Instrum. Methods Phys. Res. B 2022, 517, 43–48. [Google Scholar] [CrossRef]
Figure 1. Neutron energy spectra for different situations when the accelerator is operating at a power of 140 kW.
Electronics 15 03502 g001
Figure 2. The calculated and experimental SEU cross-sections of SRAM A.
Electronics 15 03502 g002
Figure 3. The calculated and experimental SEU cross-sections of SRAM B.
Electronics 15 03502 g003
Figure 4. Neutron energy spectrum of white neutron source at the CIAE.
Electronics 15 03502 g004
Table 1. SRAMs’ information for neutron irradiation experiments.
IDReferenceTechnology NodeCapacity
AESA SEU Monitor250 nm16 Mbit
BCY7C1318KV1865 nm18 Mbit
Table 2. The number of SEEs and neutron fluence during irradiation.
IDNeutron SpectrumNeutron Fluence (n/cm2)Number of SEUs
ANo filter1.88 × 109558
4 cm PE + 2 cm B4C1.15 × 109558
4 cm PE + 2 cm B4C + 5 cm W6.88 × 108398
5 cm W1.14 × 109570
BNo filter1.86 × 109584
4 cm PE + 2 cm B4C4.79 × 108257
4 cm PE + 2 cm B4C + 5 cm W1.30 × 10891
5 cm W2.55 × 108106
Table 3. The parameters of the Weibull function for two SRAMs.
ID σ s a t (cm2/bit) E t h (MeV) W (MeV) s
A3.60 × 10−143.4813.662.38
B3.58 × 10−142.8111.443.38
Table 4. SER of two SRAMs.
IDExperimental SER (Upsets/Hour)Calculated SER (Upsets/Hour)
A31.01 ± 3.0728.64
B54.19 ± 4.4334.14
Disclaimer/Publisher’s Note: The statements, opinions and data contained in all publications are solely those of the individual author(s) and contributor(s) and not of MDPI and/or the editor(s). MDPI and/or the editor(s) disclaim responsibility for any injury to people or property resulting from any ideas, methods, instructions or products referred to in the content.