Review

Multimodal Wearable Biosensing and Edge AI for Personalized Health: A Comprehensive Review


by
Krzysztof Wołk
1,2,3,*,
Jacek Niklewski
4,
Marek S. Tatara
4,5 and
Michał Kopczyński
4,5
1
DAC.next Sp. Z o.o., Al. Grunwaldzka 472, 80-309 Gdansk, Poland
2
Social Academy of Science, ul. Łucka 11, 00-842 Warszawa, Poland
3
Polish Telemedicine and eHealth Society, 03-728 Warszawa, Poland
4
DAC.Digital S.A., Al. Grunwaldzka 472, 80-309 Gdansk, Poland
5
Department of Robotics and Decision Systems, Faculty of Electronics, Telecommunications and Informatics, Gdansk University of Technology, 80-233 Gdansk, Poland
*
Author to whom correspondence should be addressed.
Electronics 2026, 15(14), 3237; https://doi.org/10.3390/electronics15143237
Submission received: 21 May 2026 / Revised: 29 June 2026 / Accepted: 13 July 2026 / Published: 22 July 2026

Abstract

Wearable biosensing is moving beyond single-signal activity tracking toward multimodal, AI-assisted health monitoring that combines biophysical streams with biochemical information from sweat, interstitial fluid, tears, and other accessible biofluids. Recent work has accelerated progress in flexible optical materials, programmable DNA-based sensing architectures, biosafety-aware sweat patches, and edge AI pipelines capable of denoising, calibration, personalization, and low-latency inference. This review synthesizes current advances across general biosensor platforms, vital-sign monitoring, biochemical sweat sensing, motion and biomechanics sensing, and edge AI/data analytics. Particular attention is given to the translational bottlenecks that now dominate the field, including motion artifacts, sensor drift, biofouling, subject-to-subject variability, limited sweat-to-blood equivalence, insufficient external validation, and uneven regulatory readiness. The central argument of this updated review is that the next phase of progress will not be driven by sensitivity alone but by robust multimodal fusion, clinically anchored validation, interoperable data pipelines, and energy-efficient on-device intelligence. By linking materials, electronics, algorithms, and deployment constraints, the review identifies the wearable biosensing strategies most likely to progress from promising laboratory demonstrations to reliable personalized-health tools.

1. General Introduction

Wearable biosensors have evolved from simple body-worn trackers into integrated diagnostic interfaces that can capture cardiovascular, biochemical, biomechanical, and environmental information in near real time. The most important conceptual shift in the recent literature is the move from isolated signals toward multimodal sensing because no single physiological channel remains sufficiently robust across motion, heat, hydration changes, and real-world behavioral variability.
This transition has been enabled by rapid progress in soft materials, flexible optics, microfluidics, smart textiles, and skin-conformal electronics. Recent 2025–2026 reviews emphasize that the field is increasingly defined by mechanically compliant sensor architectures, multimodal body-fluid platforms, and AI-assisted signal processing rather than by isolated gains in raw analytical sensitivity alone.
At the same time, the literature has become more explicit about the barriers to deployment. The dominant limitations are now sensor drift, batch-to-batch reproducibility, motion artifacts, weak analyte equivalence between sweat and blood, long-term biocompatibility, data interoperability, and the need for external validation on heterogeneous populations. In other words, the key question is no longer whether wearable biosensors can work under controlled conditions, but whether they can remain trustworthy during prolonged, unsupervised use.
Artificial intelligence and edge computing have become central to this problem. Instead of serving only as postprocessing tools, modern AI pipelines increasingly perform denoising, multimodal fusion, calibration, uncertainty handling, and privacy-preserving personalization directly on or near the device. This has made latency, explainability, and energy efficiency just as important as predictive accuracy.
Accordingly, this review is organized to connect sensor platforms with translational value. We discuss general biosensor architectures, vital-sign monitoring, biochemical sweat sensing, motion and biomechanics sensing, and edge AI/data analytics, while continuously asking which combinations of materials, sensing strategies, and learning pipelines are most credible for real-world personalized-health deployment.
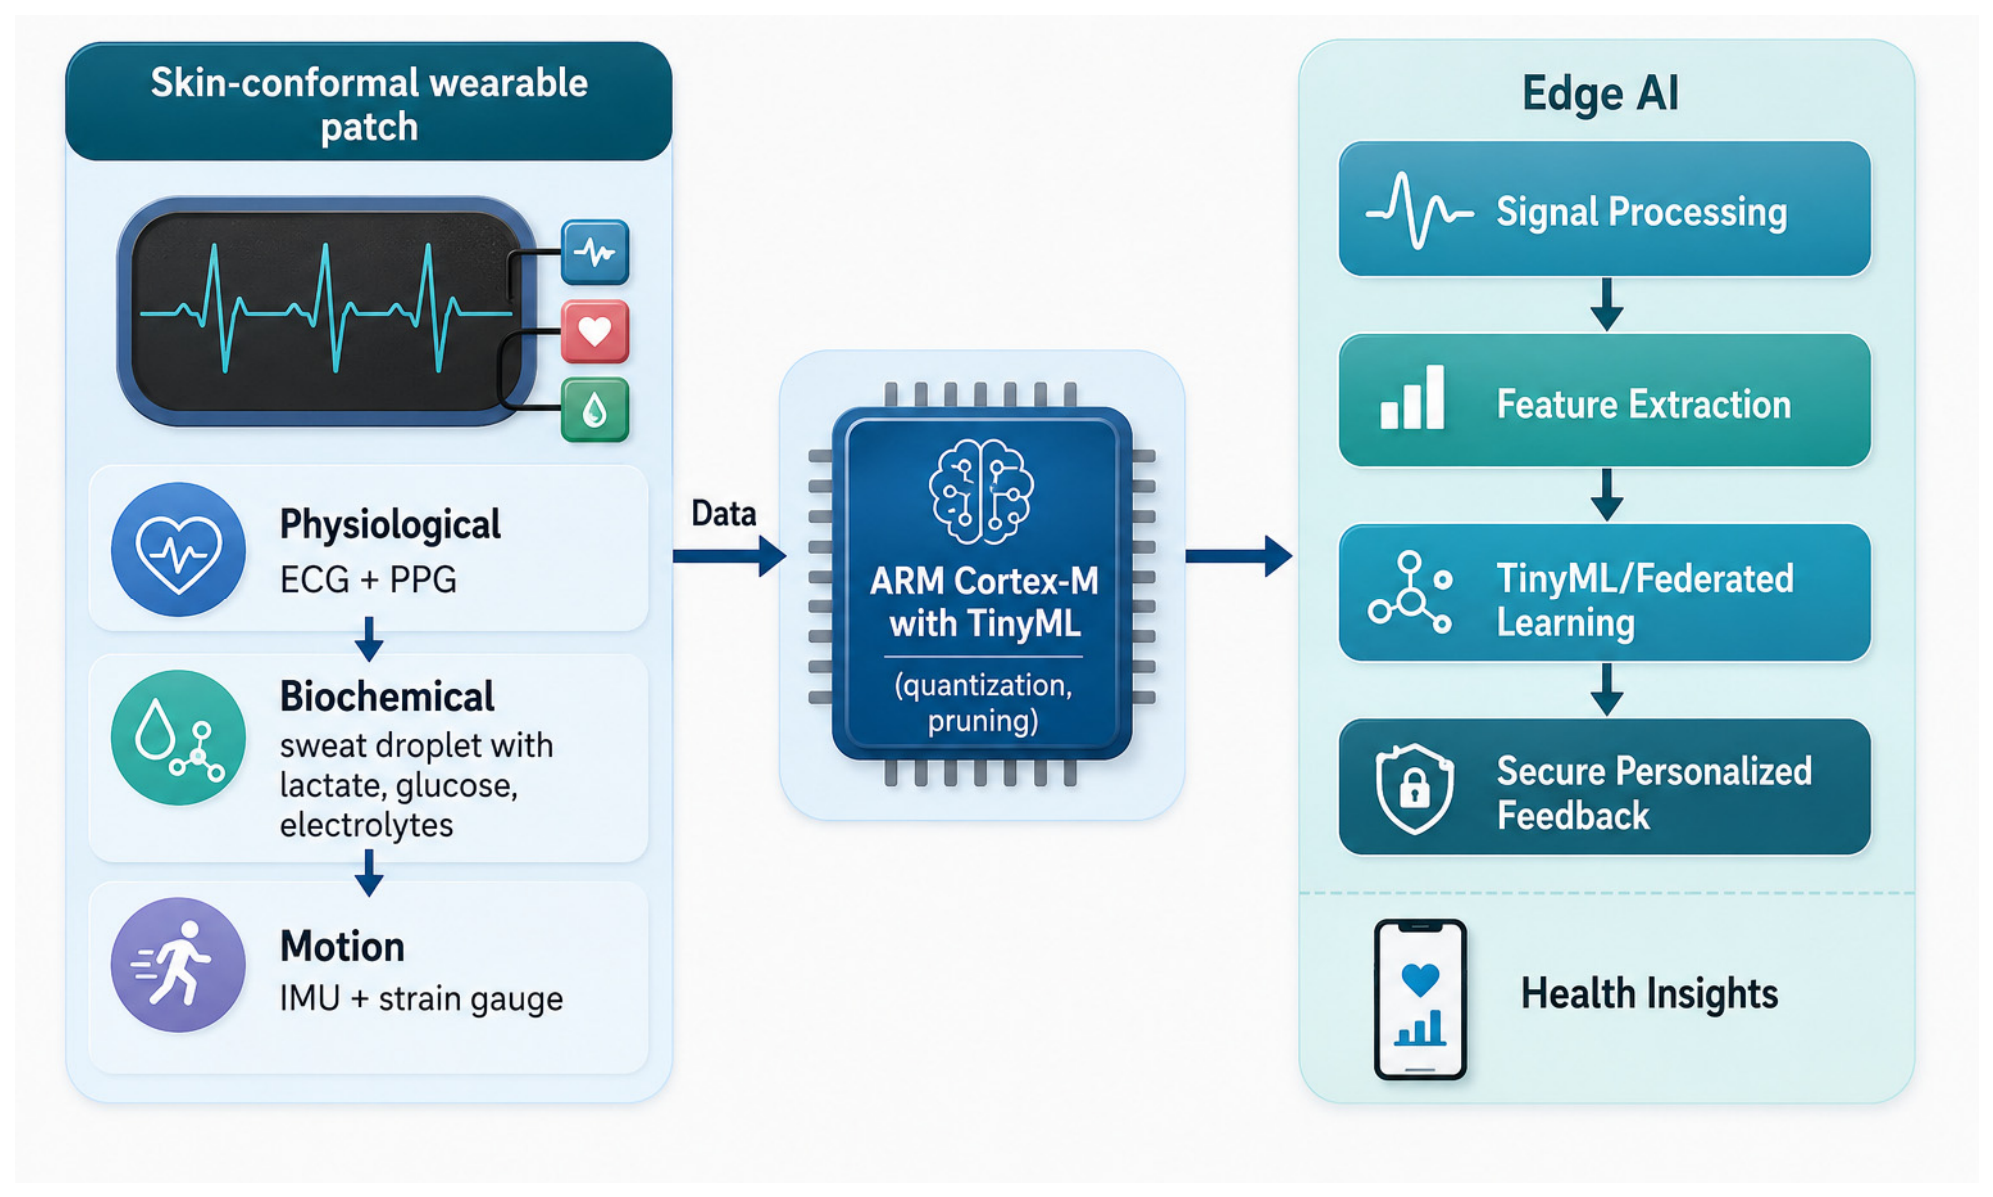
Figure 1 provides a high-level overview of the review scope, linking multimodal sensing, edge AI, and personalized-health feedback.

2. Review Methodology

To provide a structured and unbiased perspective, a formal literature search was carried out in multiple databases (PubMed, IEEE Xplore, Scopus, and Web of Science) covering the period from January 2015 to May 2026. Search terms combined “wearable biosensor” OR “wearable sensor” with multimodal descriptors (e.g., multimodal, hybrid, and multimaterial) and with keywords related to edge-centric artificial intelligence (“edge AI”, “TinyML (tiny machine learning)”, “model compression”, and “federated learning”) and health monitoring (e.g., chronic disease, sports physiology, and stress monitoring). Only peer-reviewed studies describing body-worn devices collecting at least one physiological and one additional (biochemical or biomechanical) modality and deploying machine learning or edge AI techniques were included. Exclusion criteria removed purely theoretical papers, off-body devices, simulation studies without human data, and articles lacking validation results. The initial search yielded 3782 records. After screening titles and abstracts for relevance and removing duplicates, 286 full-text articles were assessed for eligibility; ultimately 203 studies were retained for detailed analysis.
For the studies included in the detailed comparative analysis, we recorded information on the sensor platform, including sensing materials and modalities, dataset size, participant characteristics, machine-learning methods, deployment strategy, reported performance metrics, and validation level. The considered metrics included accuracy, sensitivity, specificity, F1 score, mean absolute error, and correlation, depending on the type of task and the information reported in the original study.
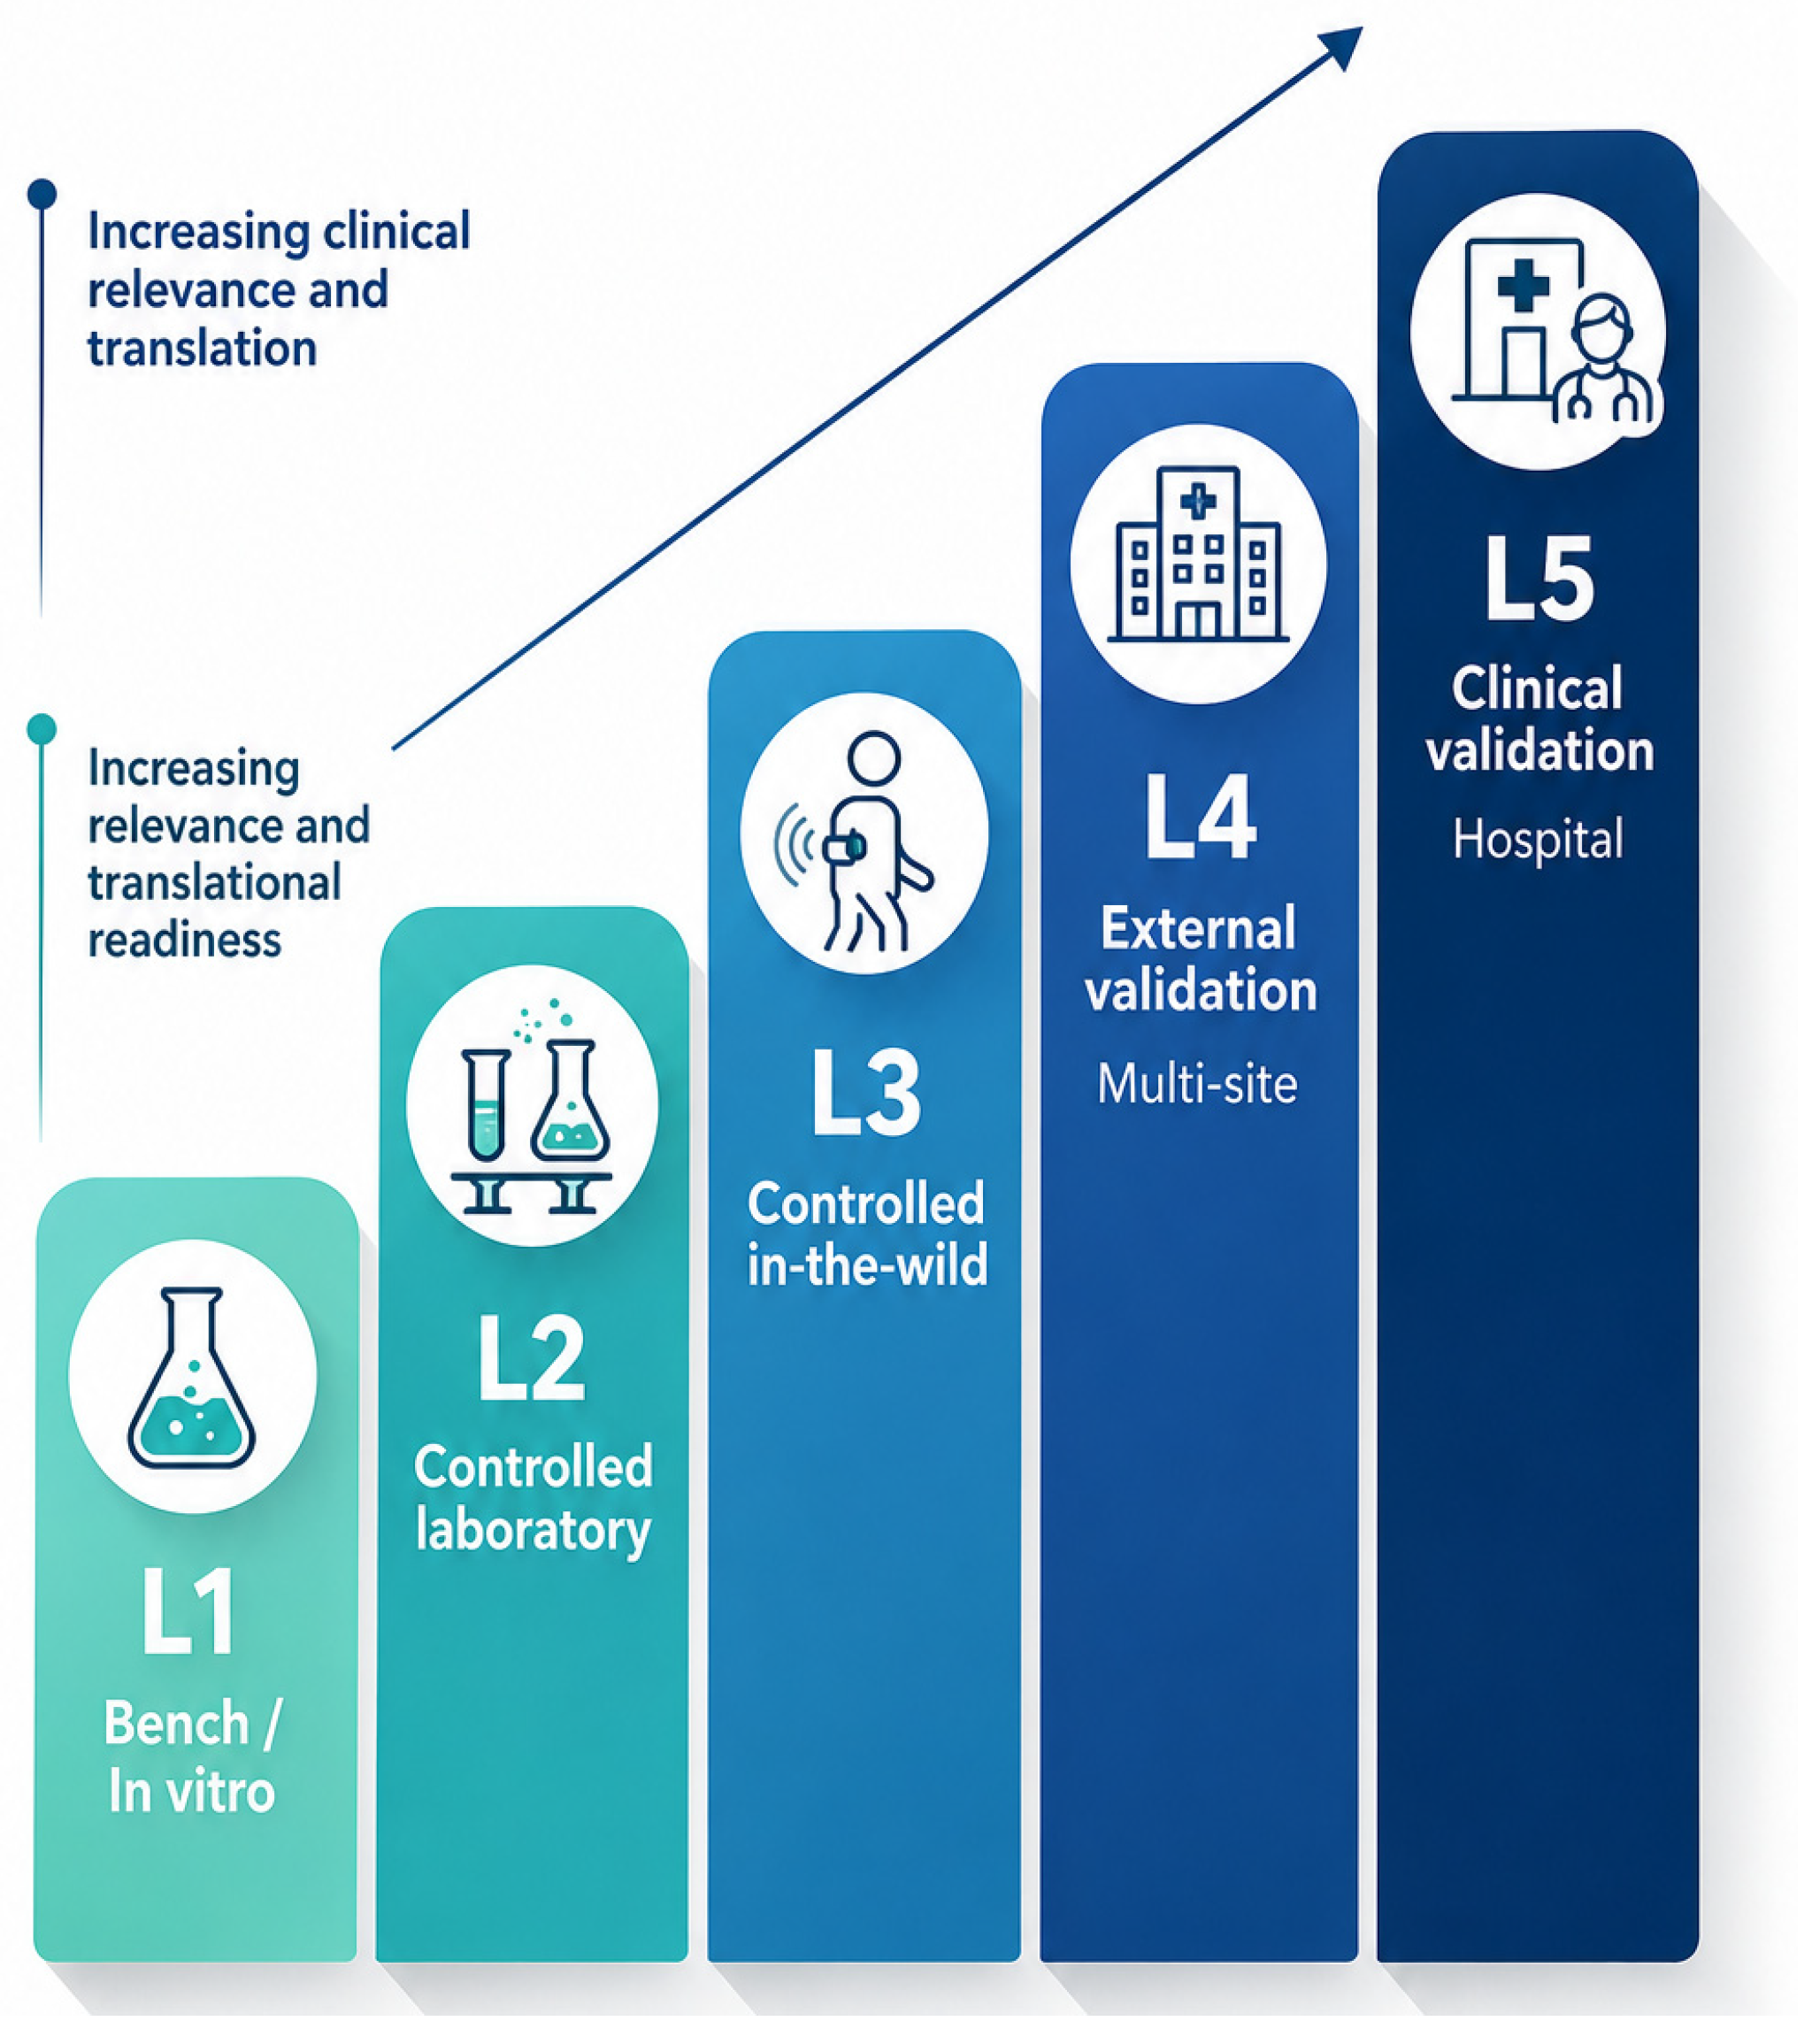
Unique contribution relative to prior reviews. While earlier reviews have primarily focused on individual sensing modalities, advances in sensing materials, or wearable AI in general, the present work offers three distinctive contributions. First, it explicitly connects multimodal physiological, biochemical, and motion-data fusion with on-device edge AI, including TinyML, model compression, federated learning, and privacy-preserving techniques. Second, it introduces a structured five-level validation hierarchy (L1–L5) for assessing the translational maturity of the reviewed studies. Third, it provides visual and tabular syntheses that facilitate direct comparisons across sensing modalities, reported performance, validation quality, and persistent technological and clinical bottlenecks. The positioning of the present review relative to recent reviews on wearable biosensing, AI-assisted sensing, and edge AI is summarized in Table 1.

3. Core Application Descriptions

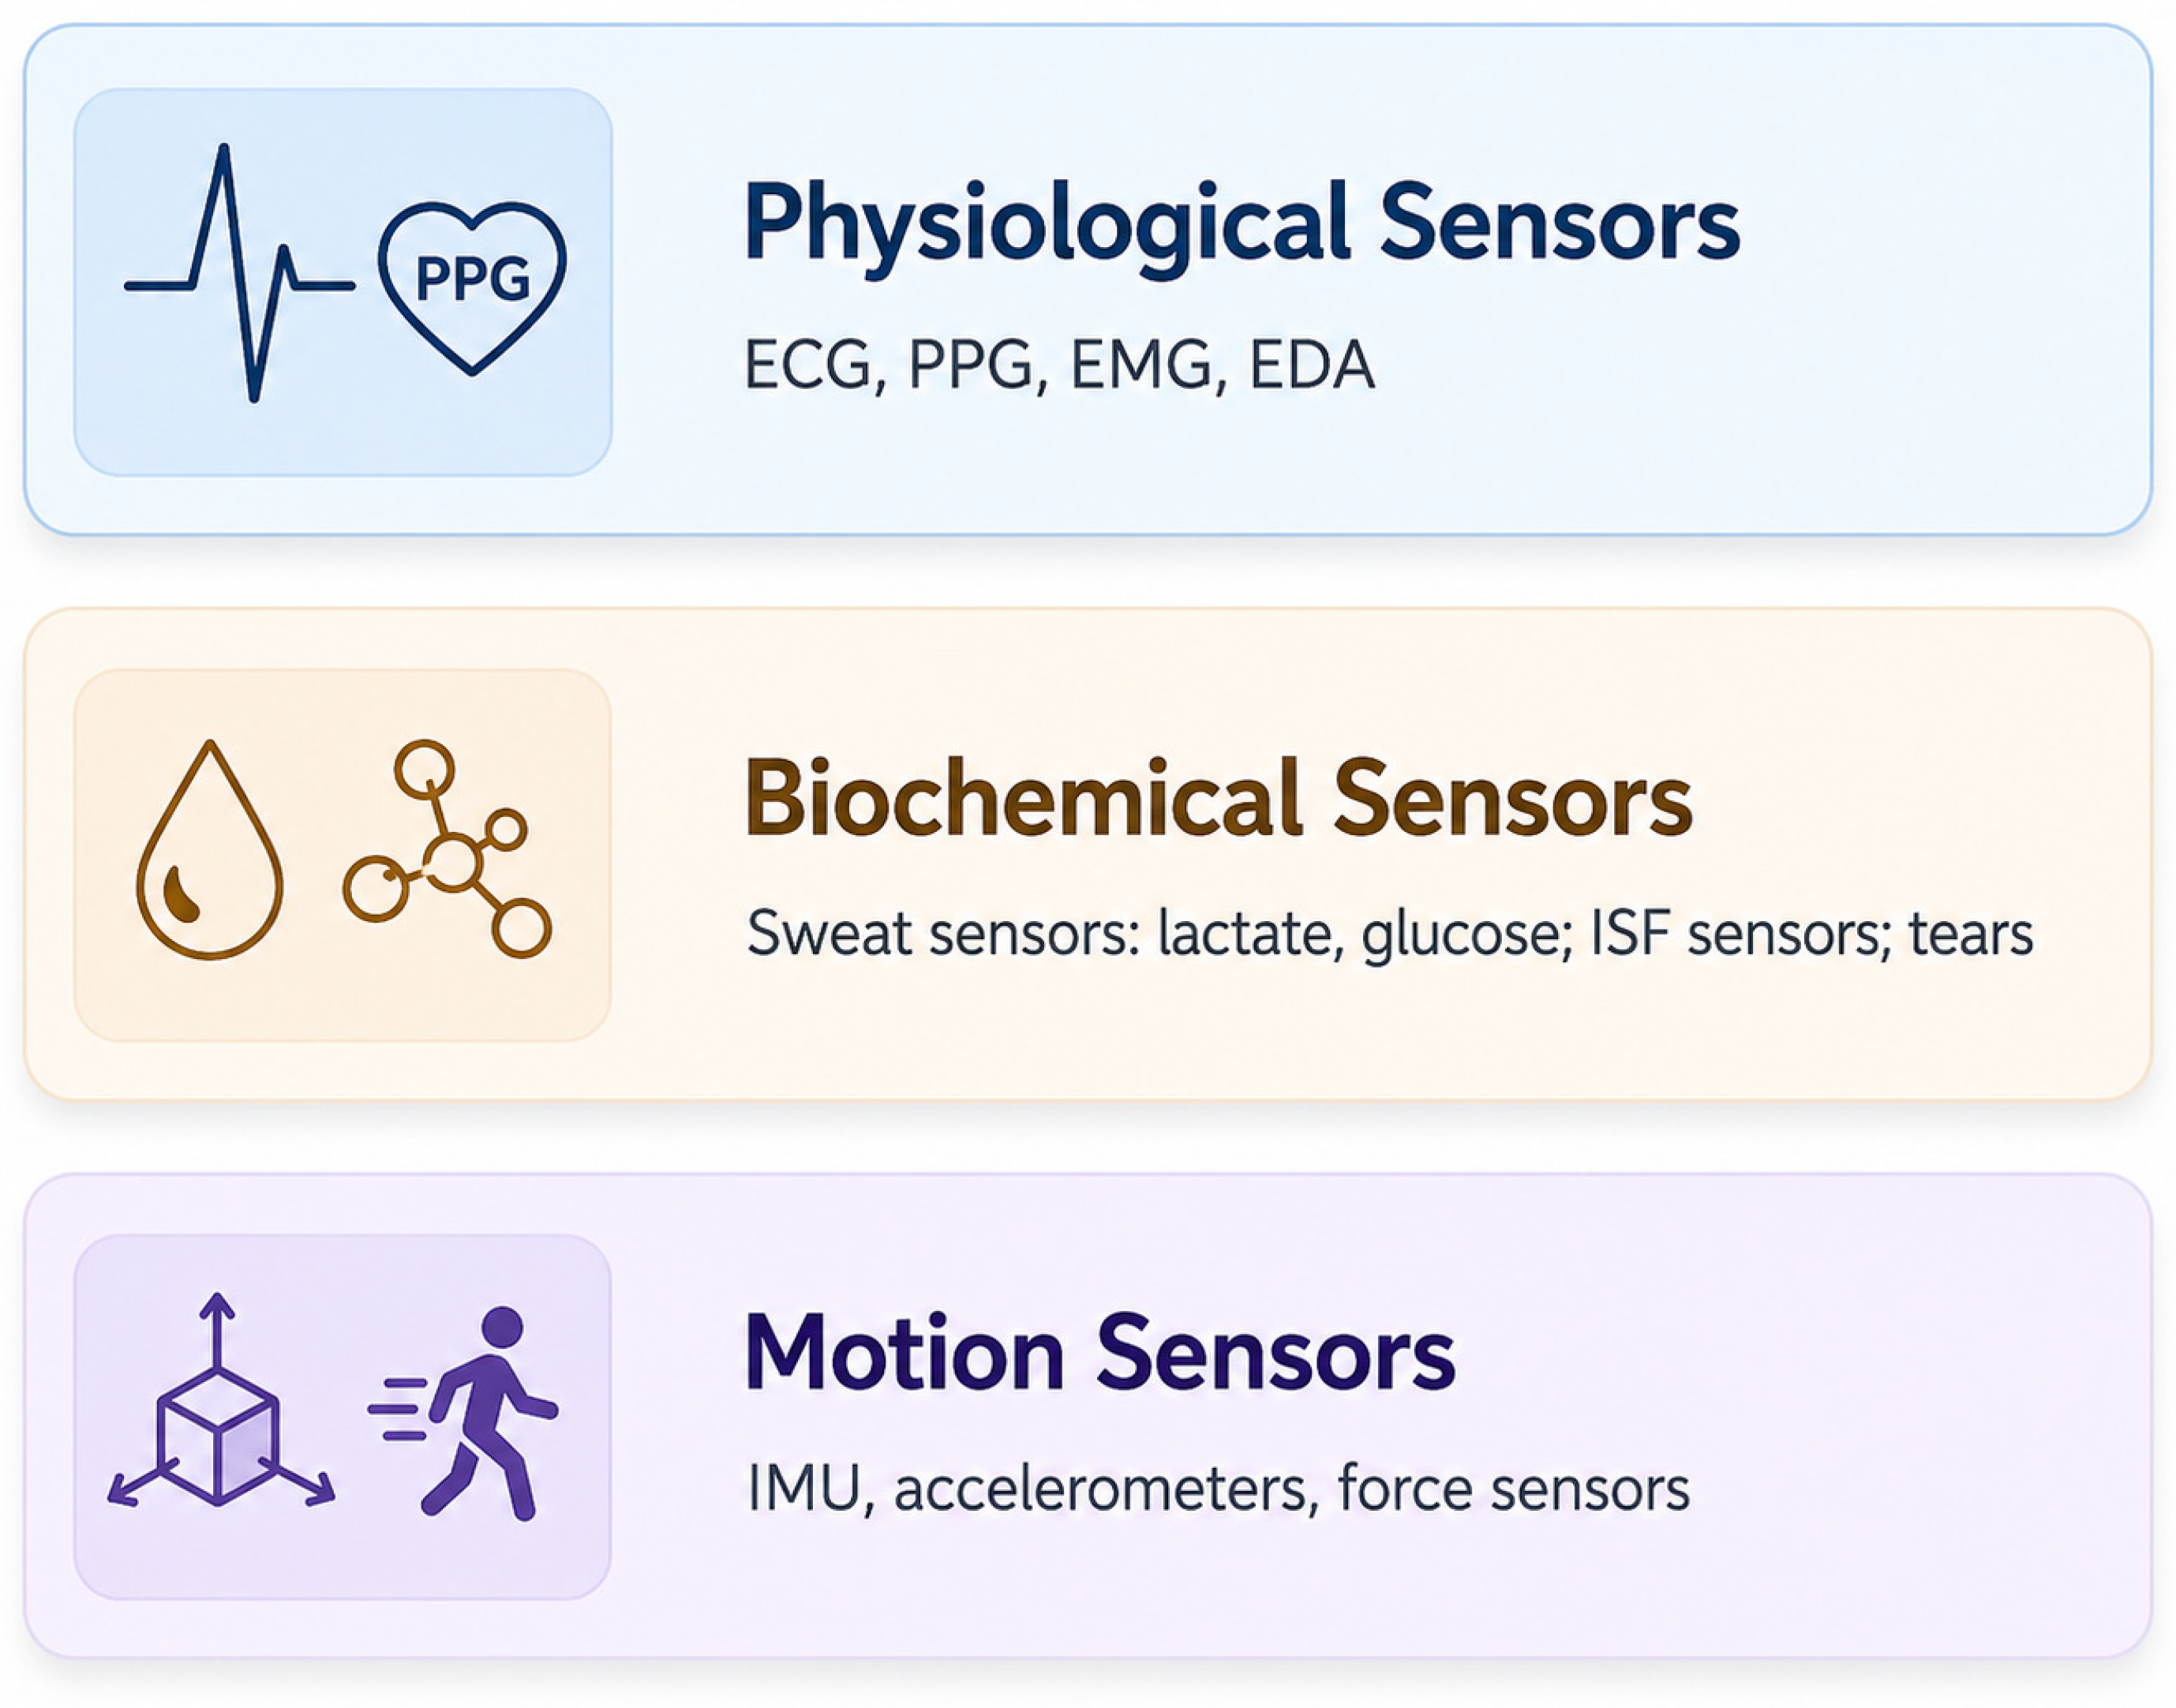
To aid interpretation of the following subsections, Figure 2 summarizes the main categories of wearable sensors (physiological, biochemical, and motion sensors).
To preserve conceptual clarity while reflecting the current state of the field, the literature is grouped into five interconnected application areas. This updated framing emphasizes not only representative sensing modalities but also cross-modal calibration, deployment readiness, and the quality of evidence supporting translation from prototypes to routine monitoring.

3.1. General Biosensor Platforms

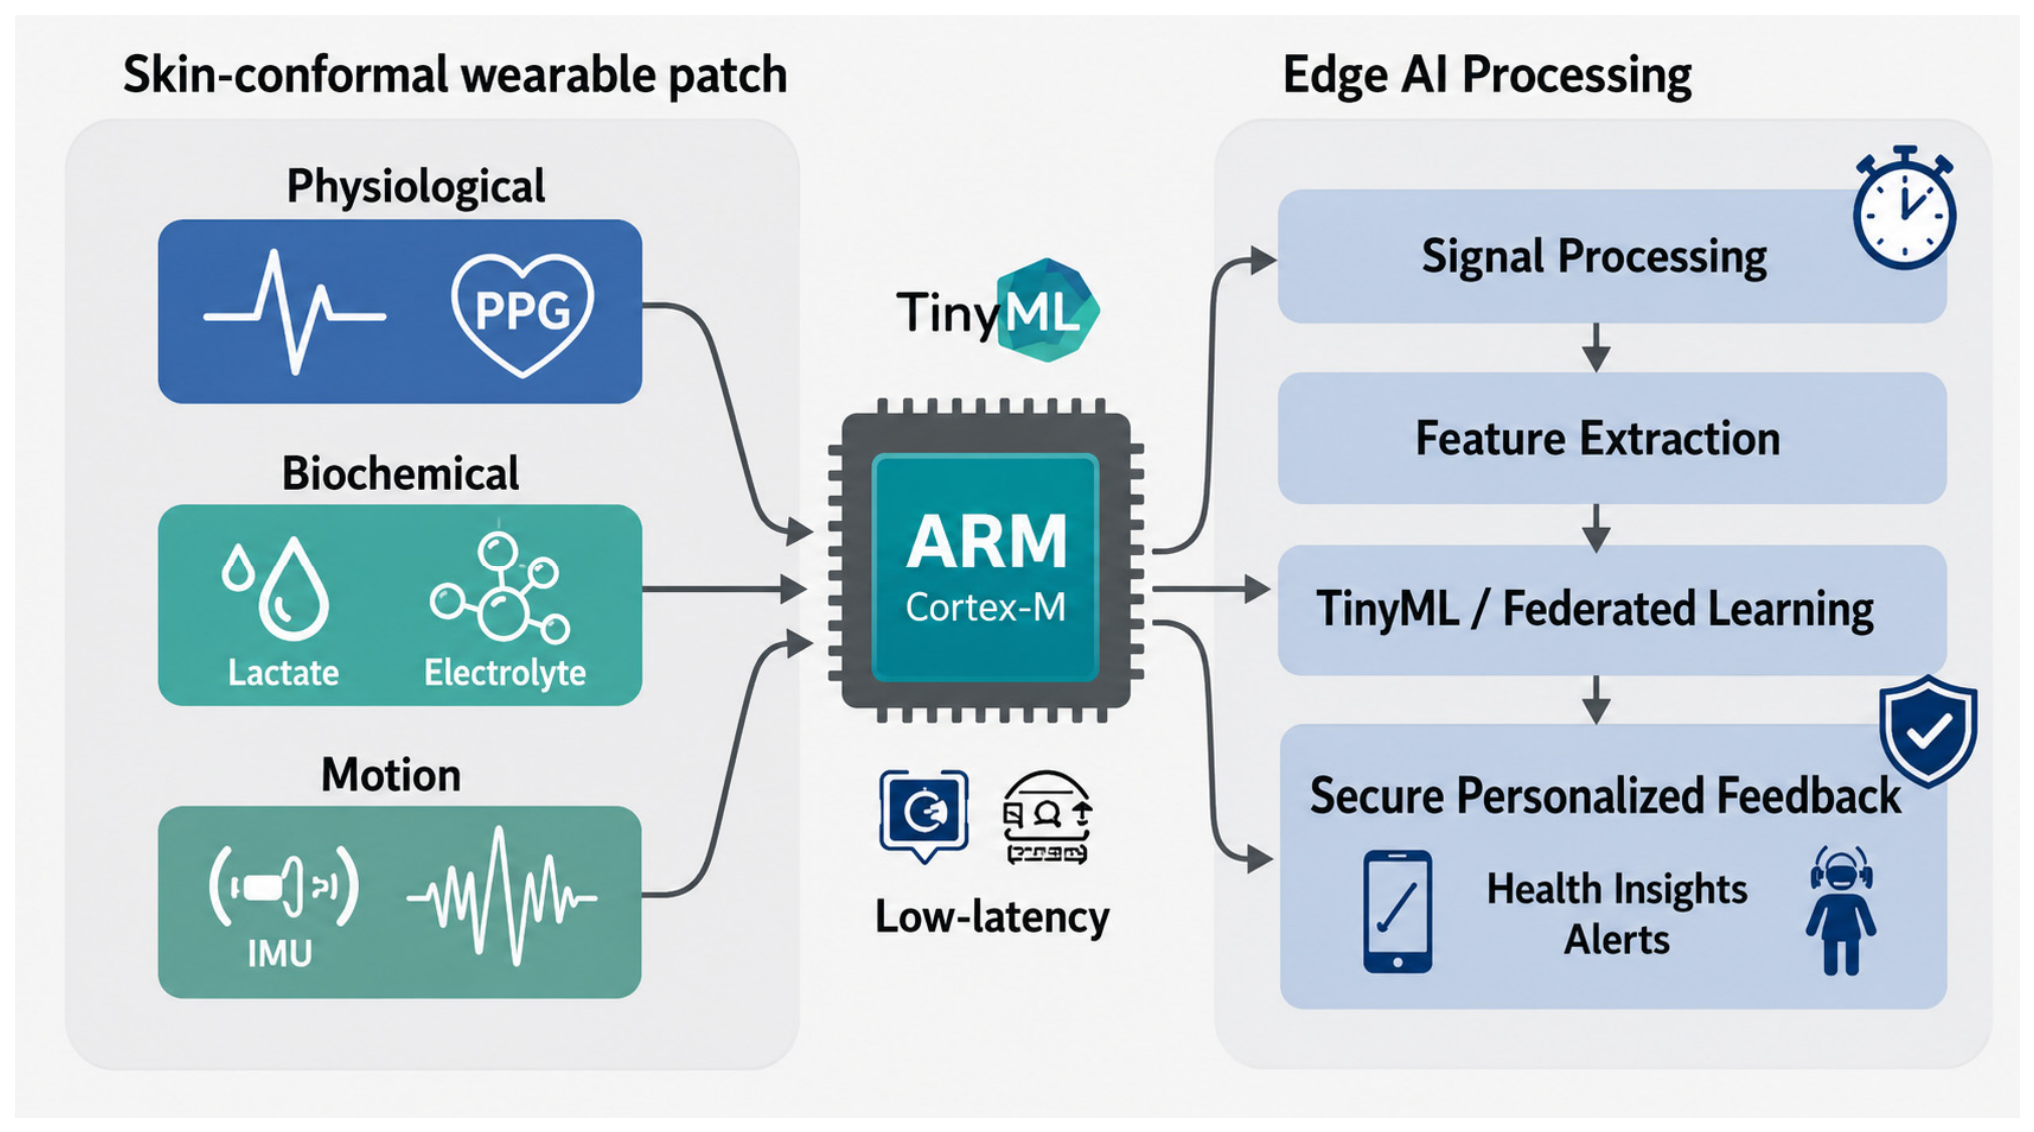
General biosensor platforms now increasingly combine stretchable or self-healing substrates, miniaturized microfluidics, low-power wireless electronics, and AI-ready signal pathways (Figure 3). The most competitive platforms are those that reduce mechanical mismatch at the skin interface, support modular integration of multiple sensor types, and enable reliable calibration under real-world use rather than under ideal benchtop conditions only.

3.2. Vital-Sign Monitoring

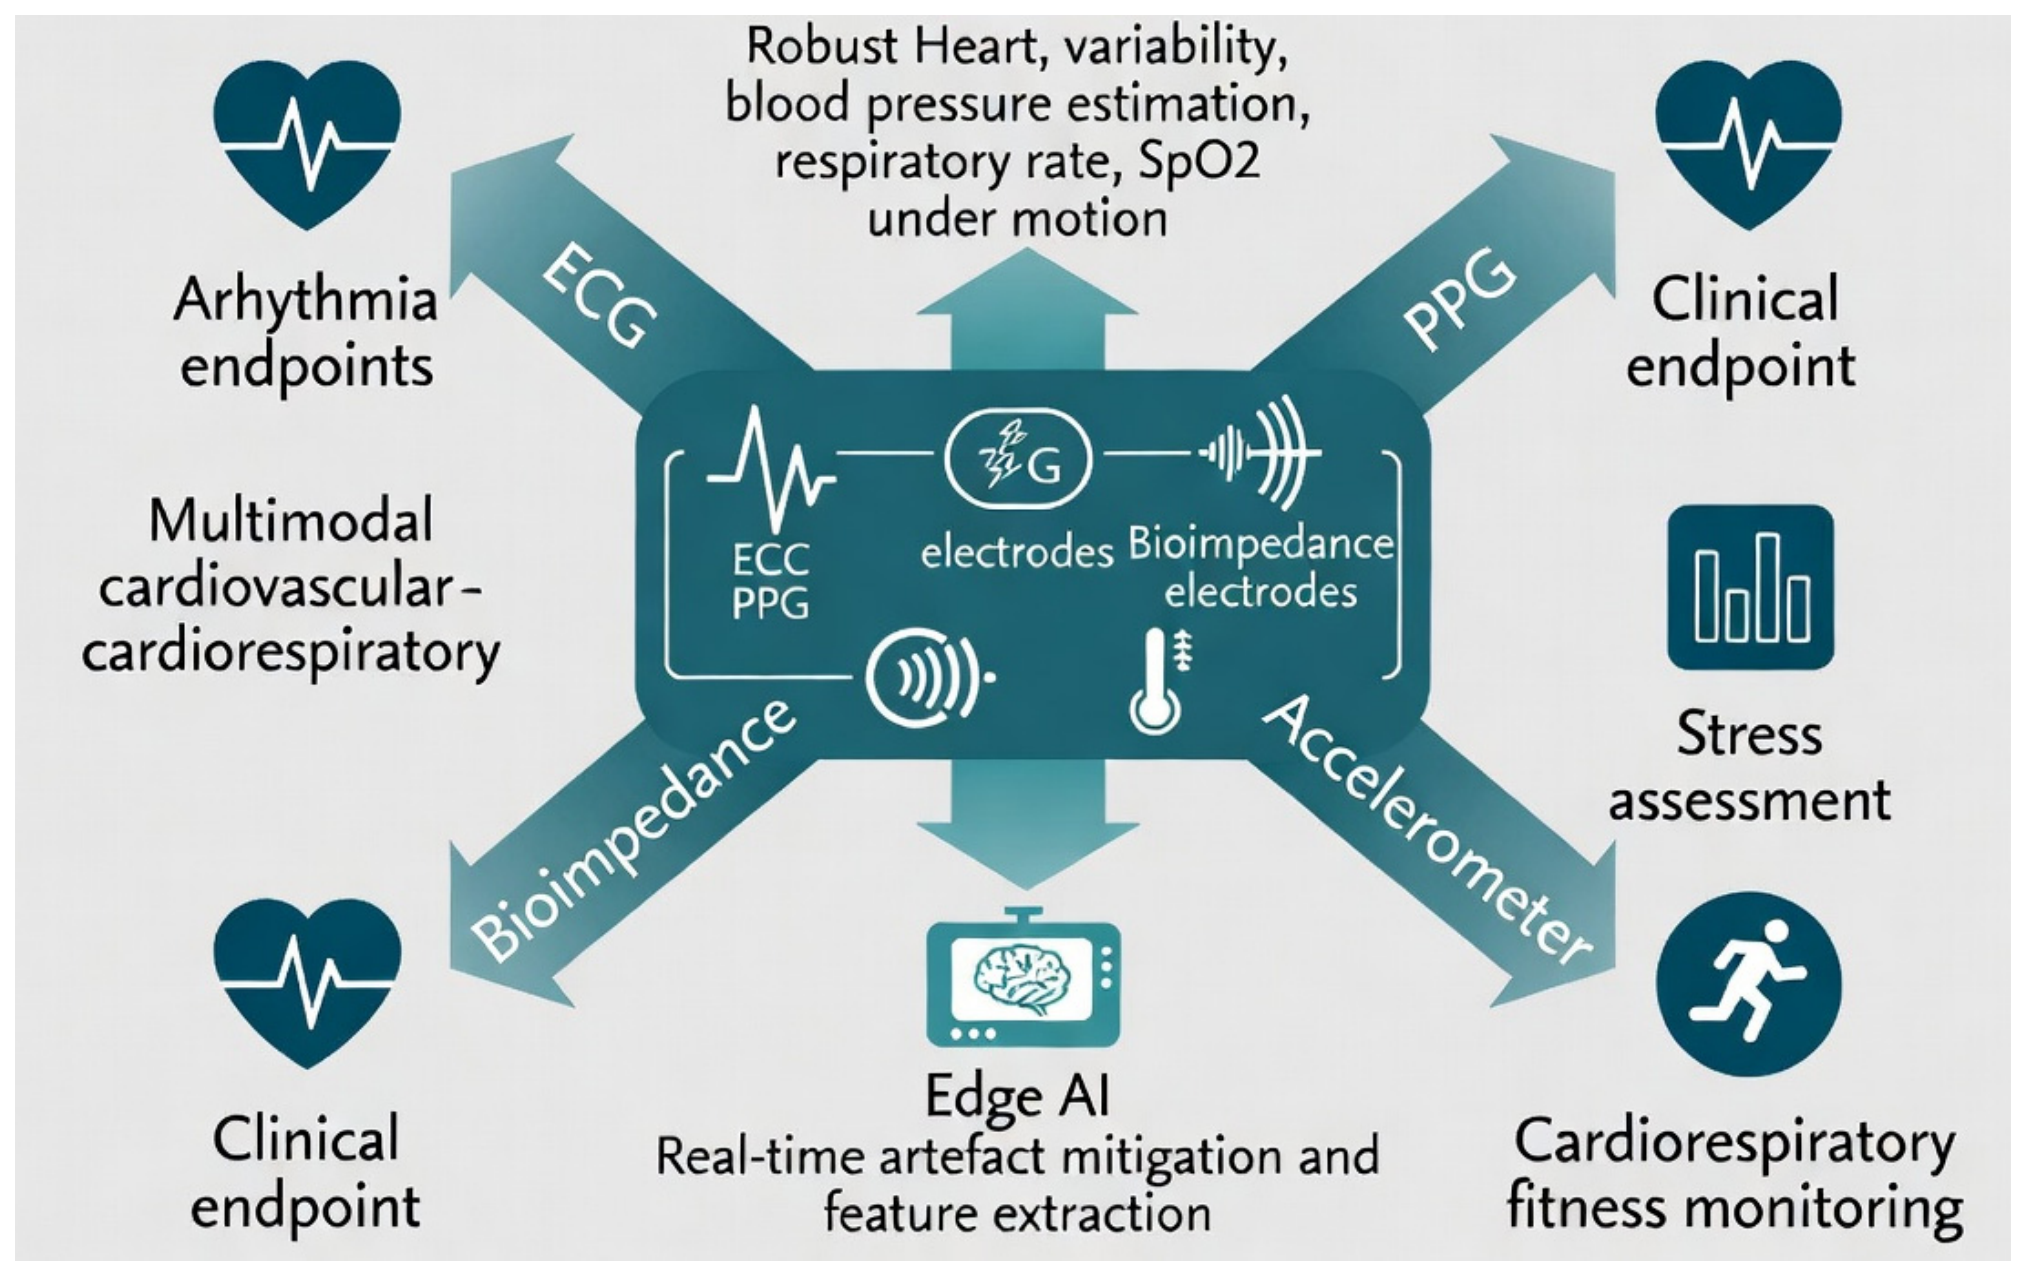
Vital-sign monitoring has expanded from heart rate tracking to richer cardiovascular and cardiorespiratory phenotyping through the joint use of electrocardiography (ECG), photoplethysmography (PPG), accelerometry, bioimpedance, and temperature sensing (Figure 4). The current research emphasis is on artifact-robust estimation, clinically meaningful endpoints, and continuous operation in free-living conditions rather than on short laboratory demonstrations.

3.3. Biochemical Sweat Sensing

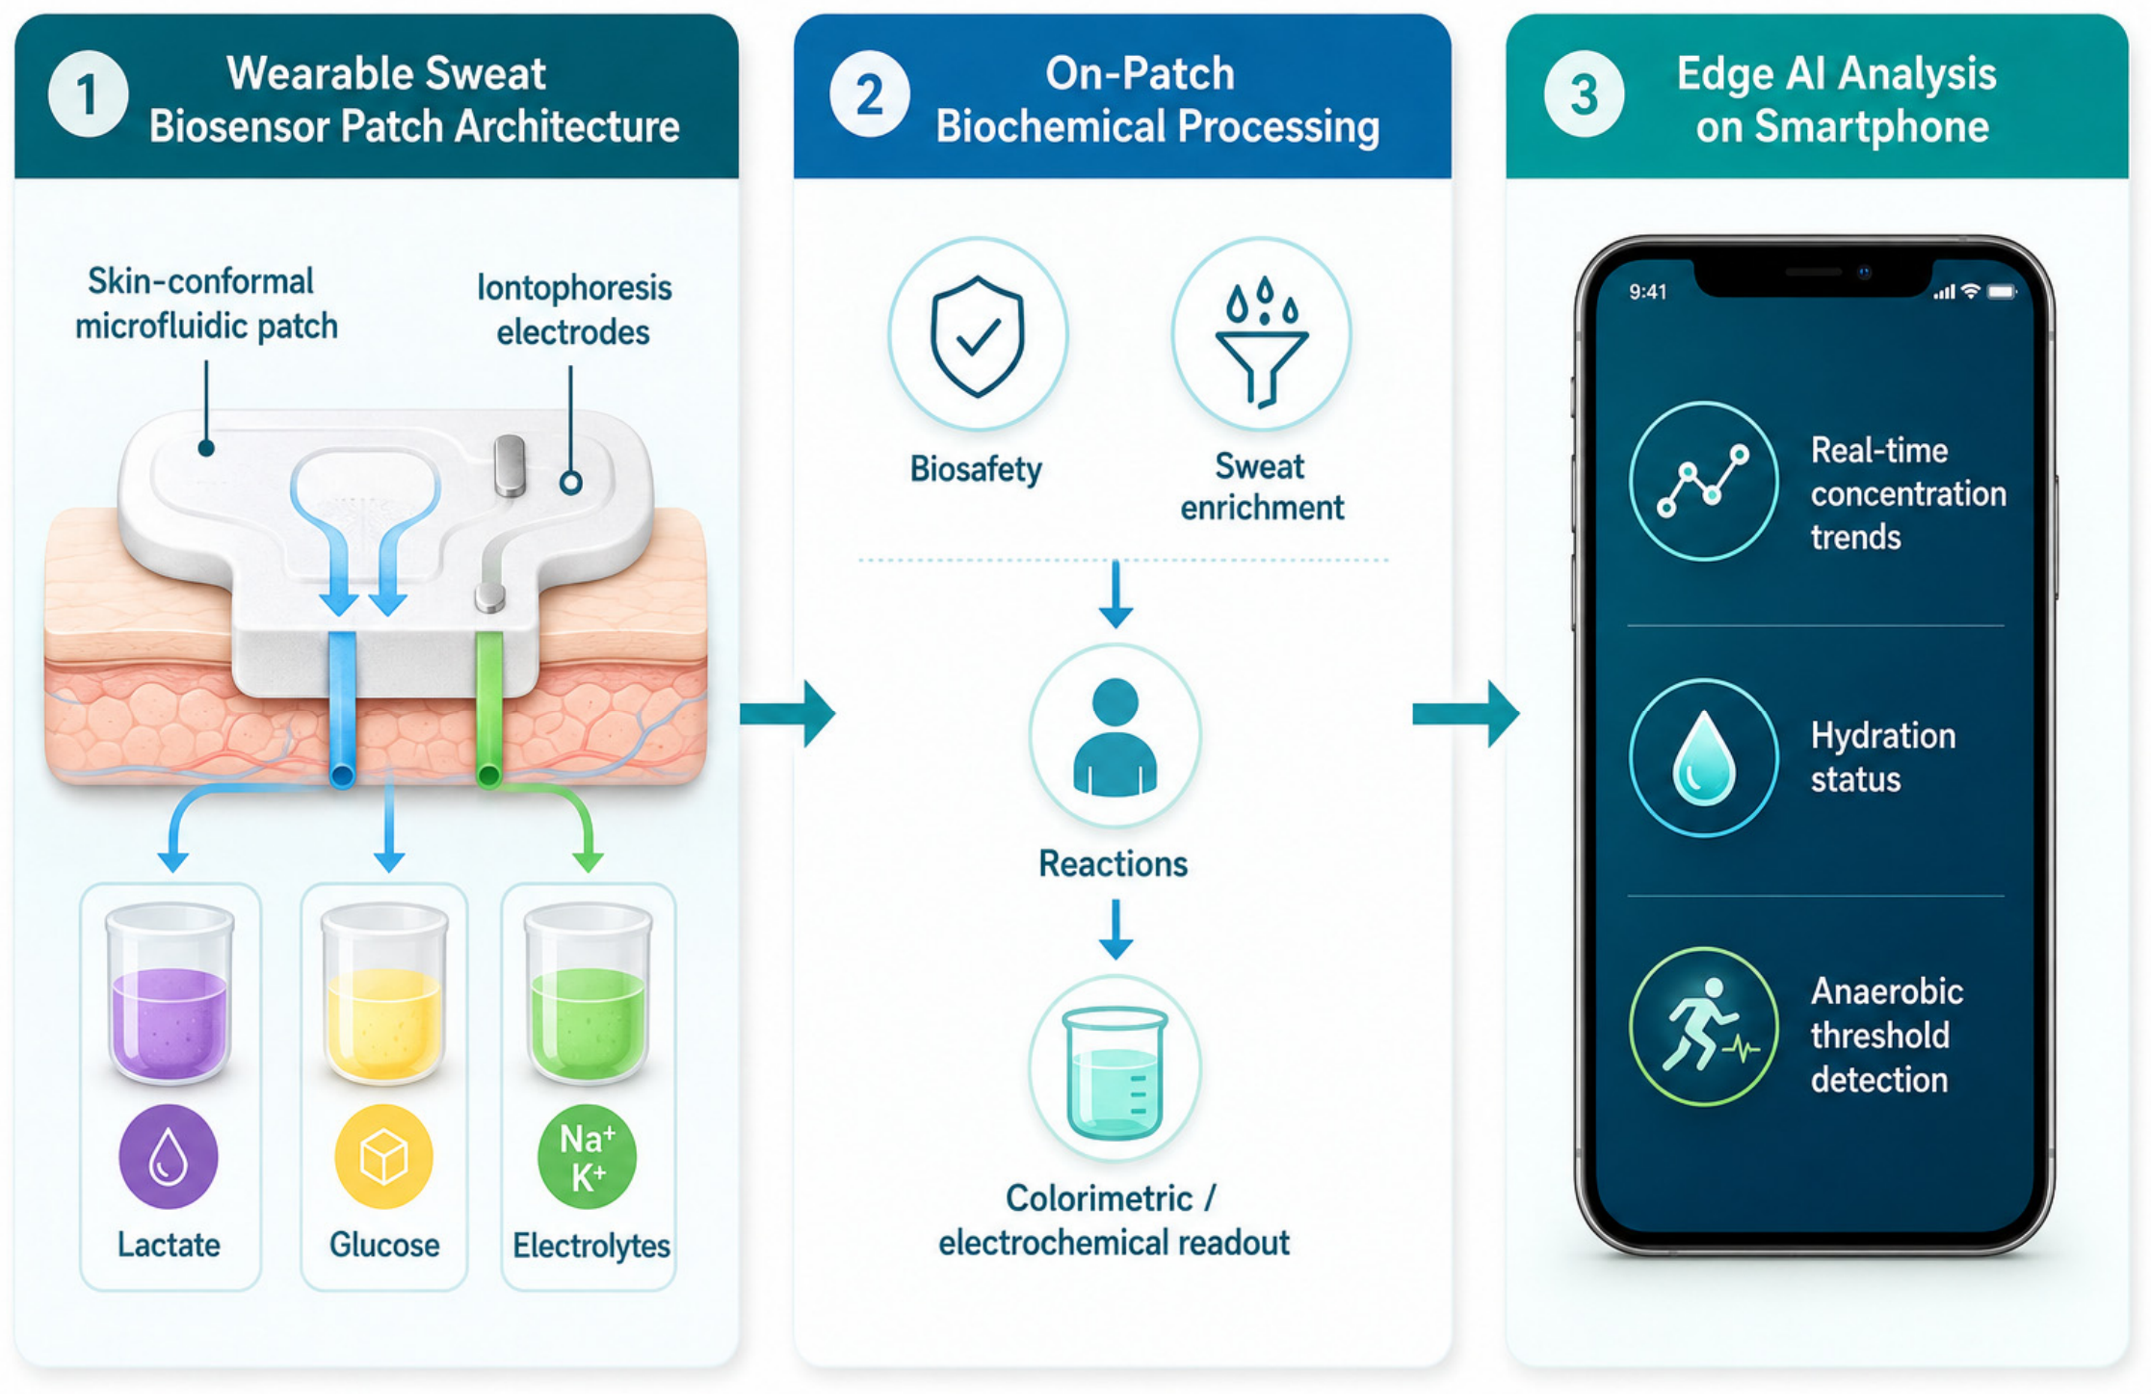
Biochemical sweat sensing remains one of the most attractive non-invasive routes to personalized monitoring, but the strongest 2025–2026 contributions focus on sample handling, biosafety, enrichment, and contextual correction rather than on analyte detection alone (Figure 5). The field is moving toward multi-analyte patches that combine chemistry with sweat-rate, temperature, or optical information to improve interpretability.

3.4. Motion and Biomechanics Sensing

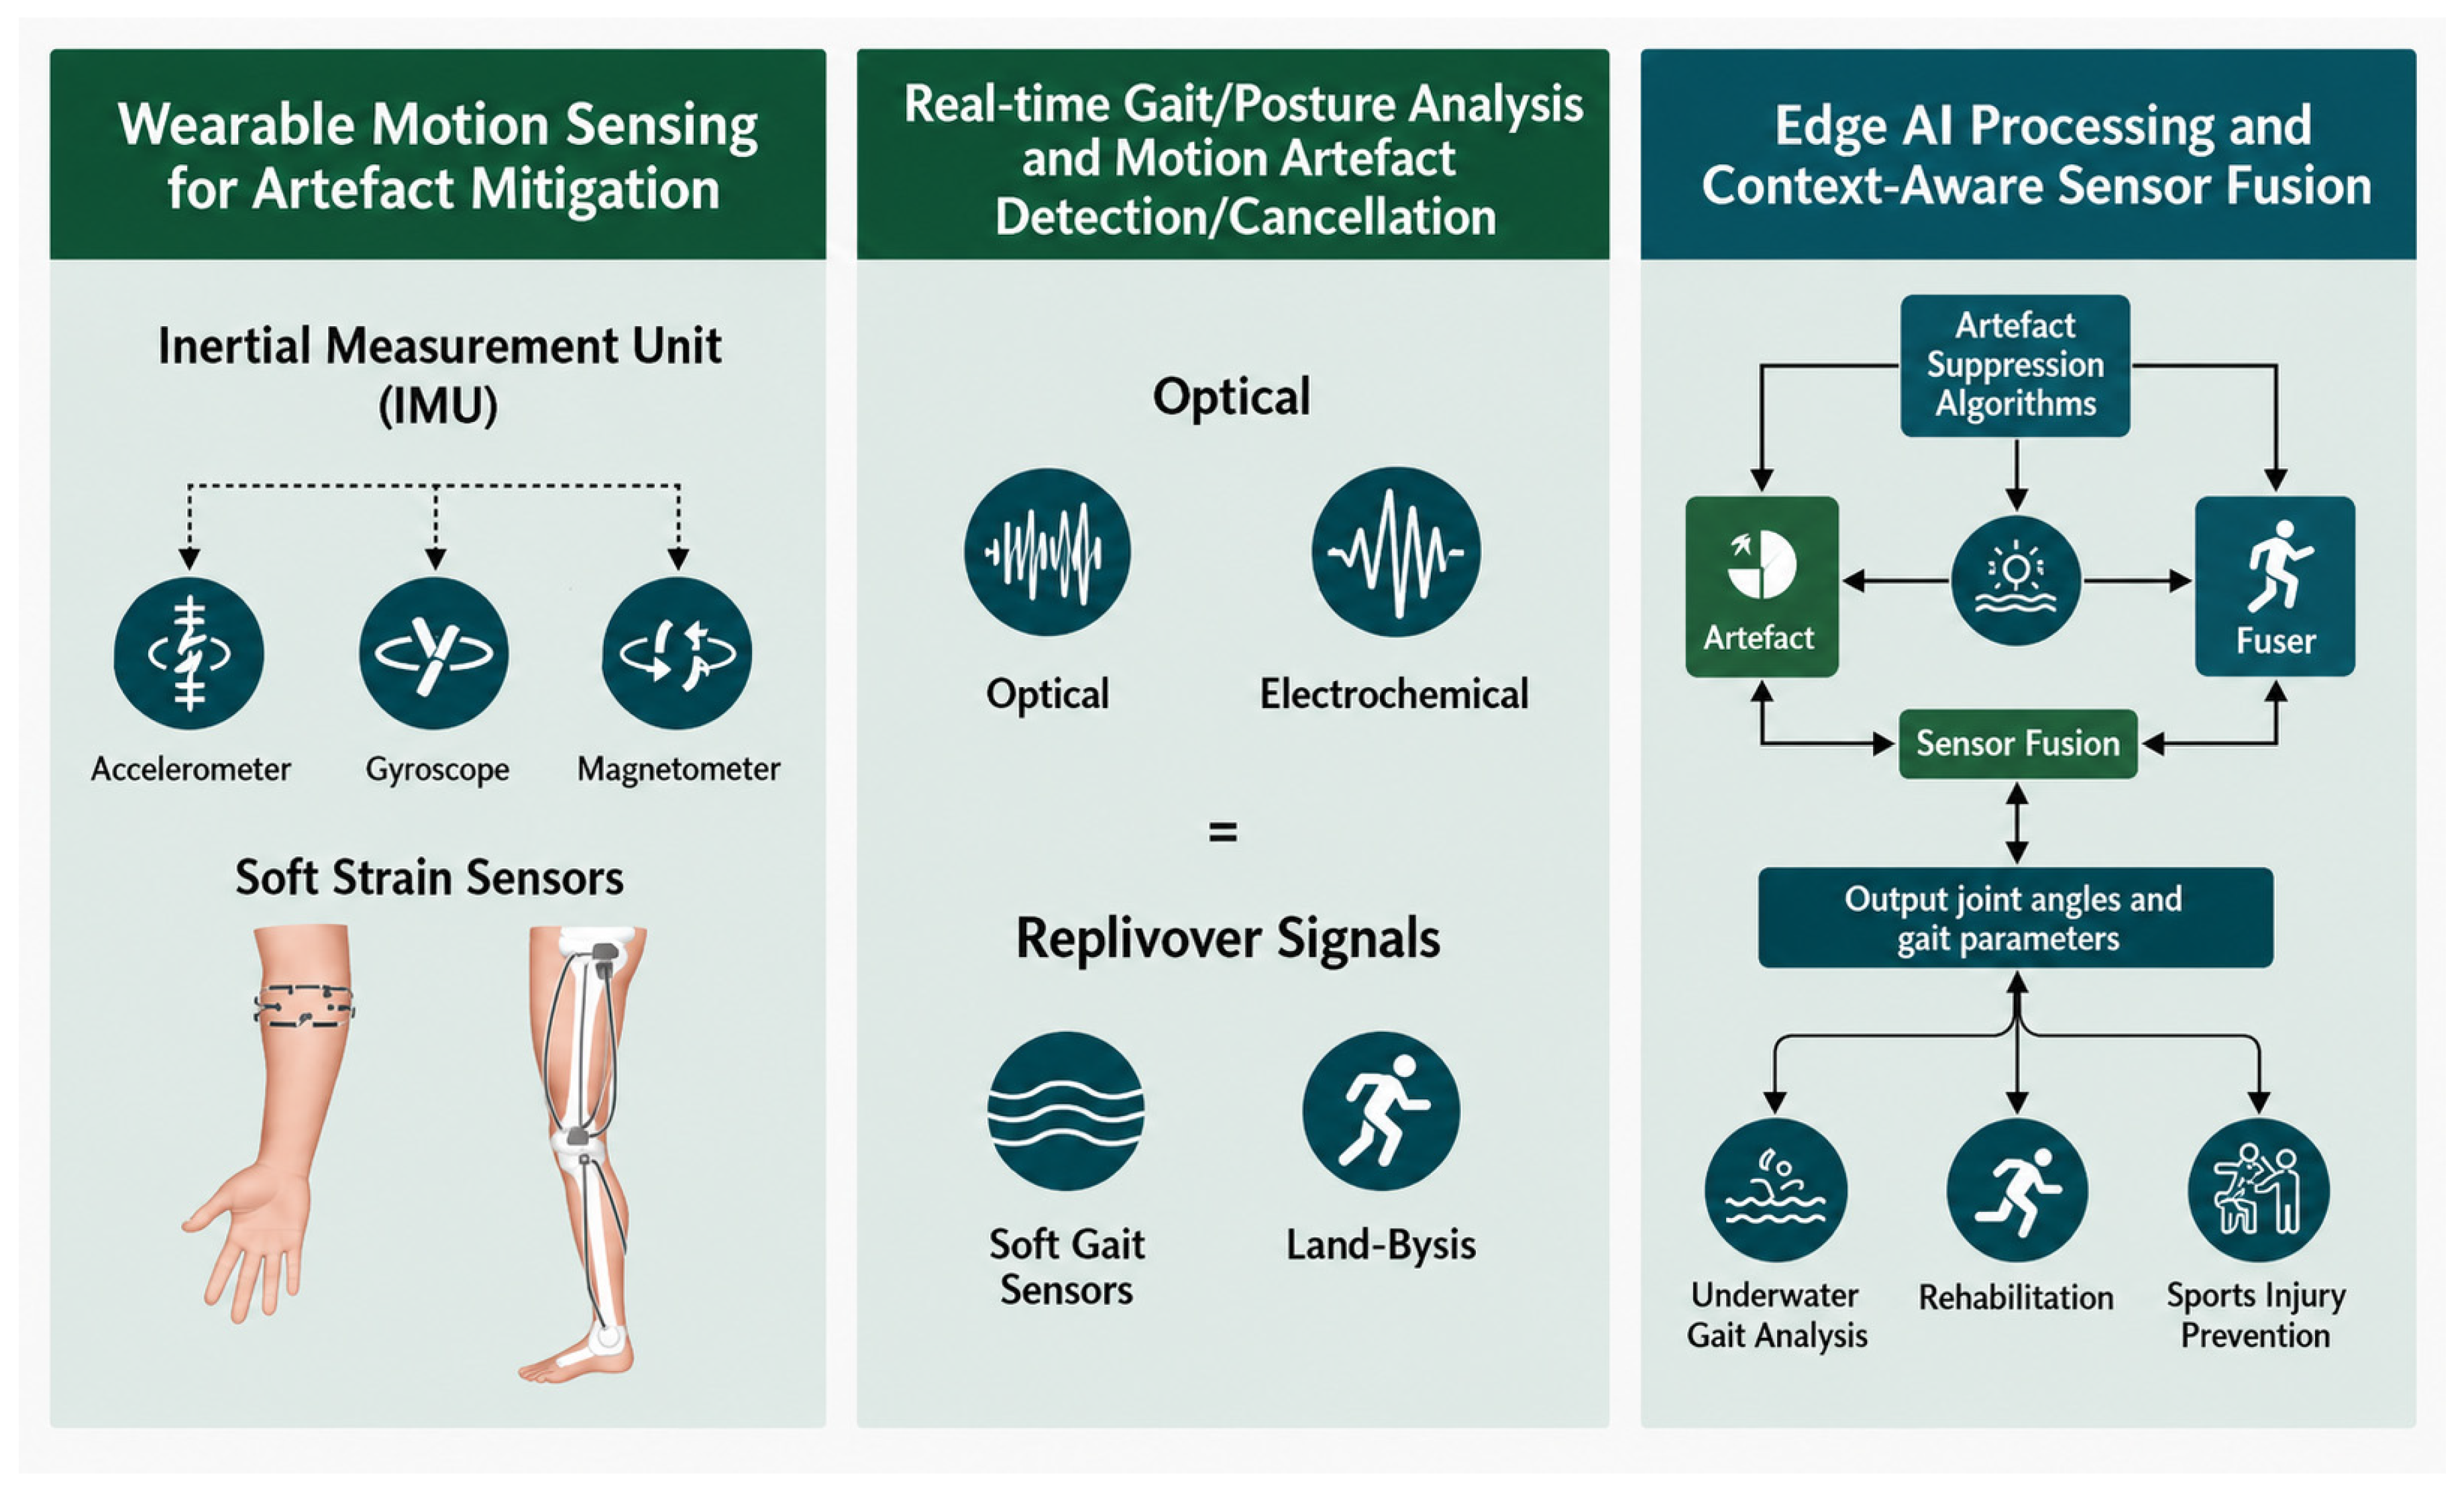
Motion and biomechanics sensing is increasingly treated as both a primary measurement domain and a critical source of context for other bio-signals (Figure 6). In practice, inertial and soft-strain sensors are now used not only for gait or posture analysis but also to suppress artifacts and improve the reliability of optical and electrochemical sensing during normal activity.

3.5. Edge AI and Data Analytics

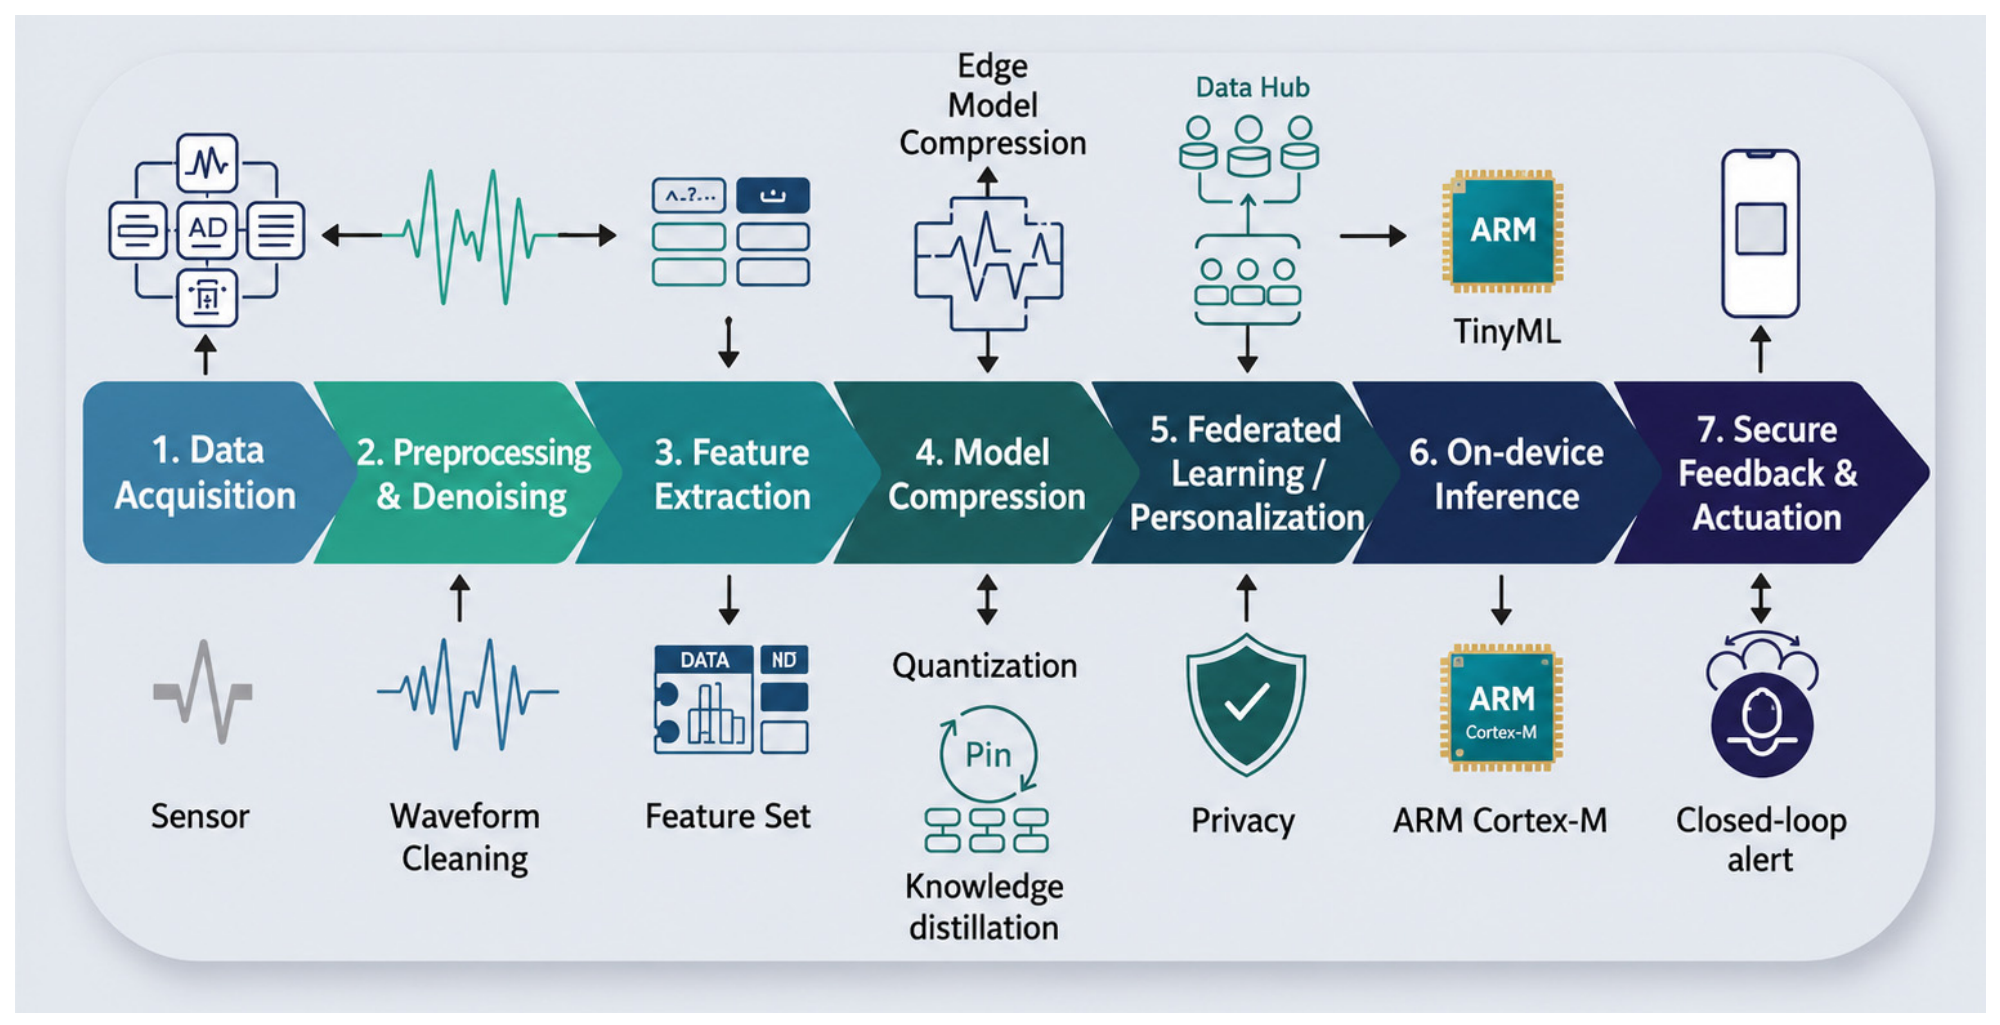
Edge AI and data analytics now define the intelligence layer of wearable biosensing (Figure 7). The strongest systems use compact on-device models, adaptive off-loading, and privacy-aware data handling to convert noisy multi-stream sensor data into actionable, low-latency health information without excessive power or bandwidth costs.

4. State of the Art

4.1. Key Cross-Cutting Trends and Challenges

The recent literature shows convergence toward multimodal biosensing platforms built from soft, stretchable, and textile-integrated substrates. These systems increasingly combine physiological measurements (e.g., PPG/ECG, electromyography (EMG), and electrodermal activity (EDA)), biochemical analytes (e.g., lactate, glucose, and electrolytes), and motion/biomechanics (e.g., inertial measurement units (IMUs) and pressure sensors) into a unified patch or wearable. Advanced microfluidics and flexible electronics enable continuous sampling of sweat, interstitial fluid, and tears, while engineered substrates offer self-healing, reusable, and skin-conformal properties.
Edge AI is maturing rapidly: TinyML and other model compression techniques are now routinely used to embed convolutional and recurrent neural networks on microcontrollers, and federated learning allows collective training without sharing raw data. However, only a minority of studies conduct formal privacy or security analysis. Early deployments exploit microcontrollers such as ARM Cortex-M with tens of kilobytes of memory. Real-time inference is achieved using sensor-fusion features, quantization, pruning, and knowledge distillation.
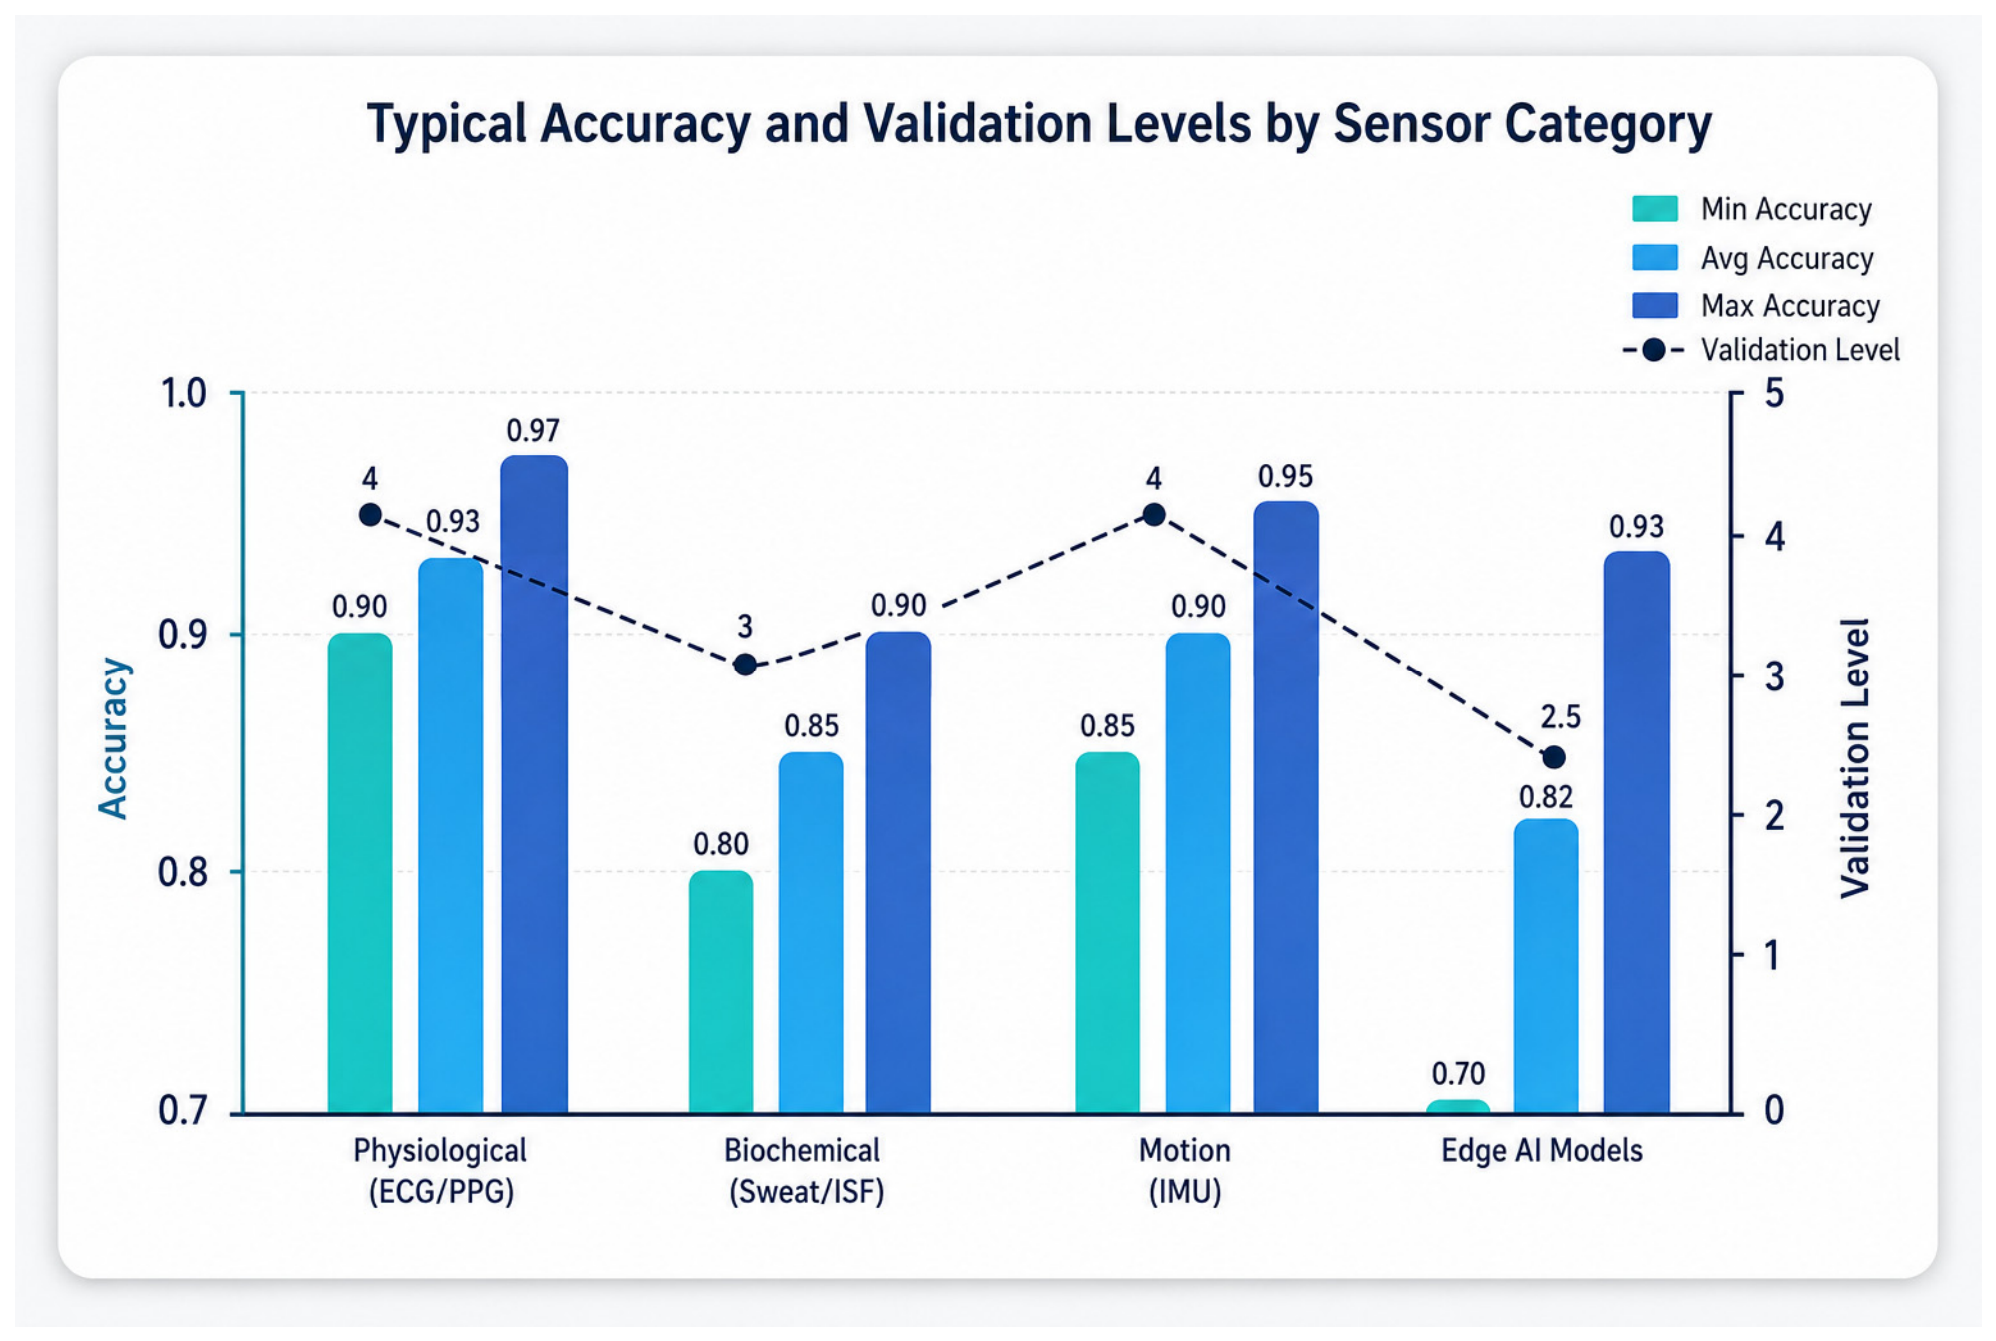
Performance reporting remains heterogeneous (Figure 8): accuracy, F1 score, and area under the curve (AUC) are most common for classification, while mean absolute error (MAE) and correlation are used for regression. Few papers report calibration stability, sensor drift, time-lag, or energy consumption. Validation levels vary widely, from bench-top in vitro testing to small pilot studies and rarely to external or clinical validation. Standardized benchmarking datasets and cross-study comparability are still lacking.
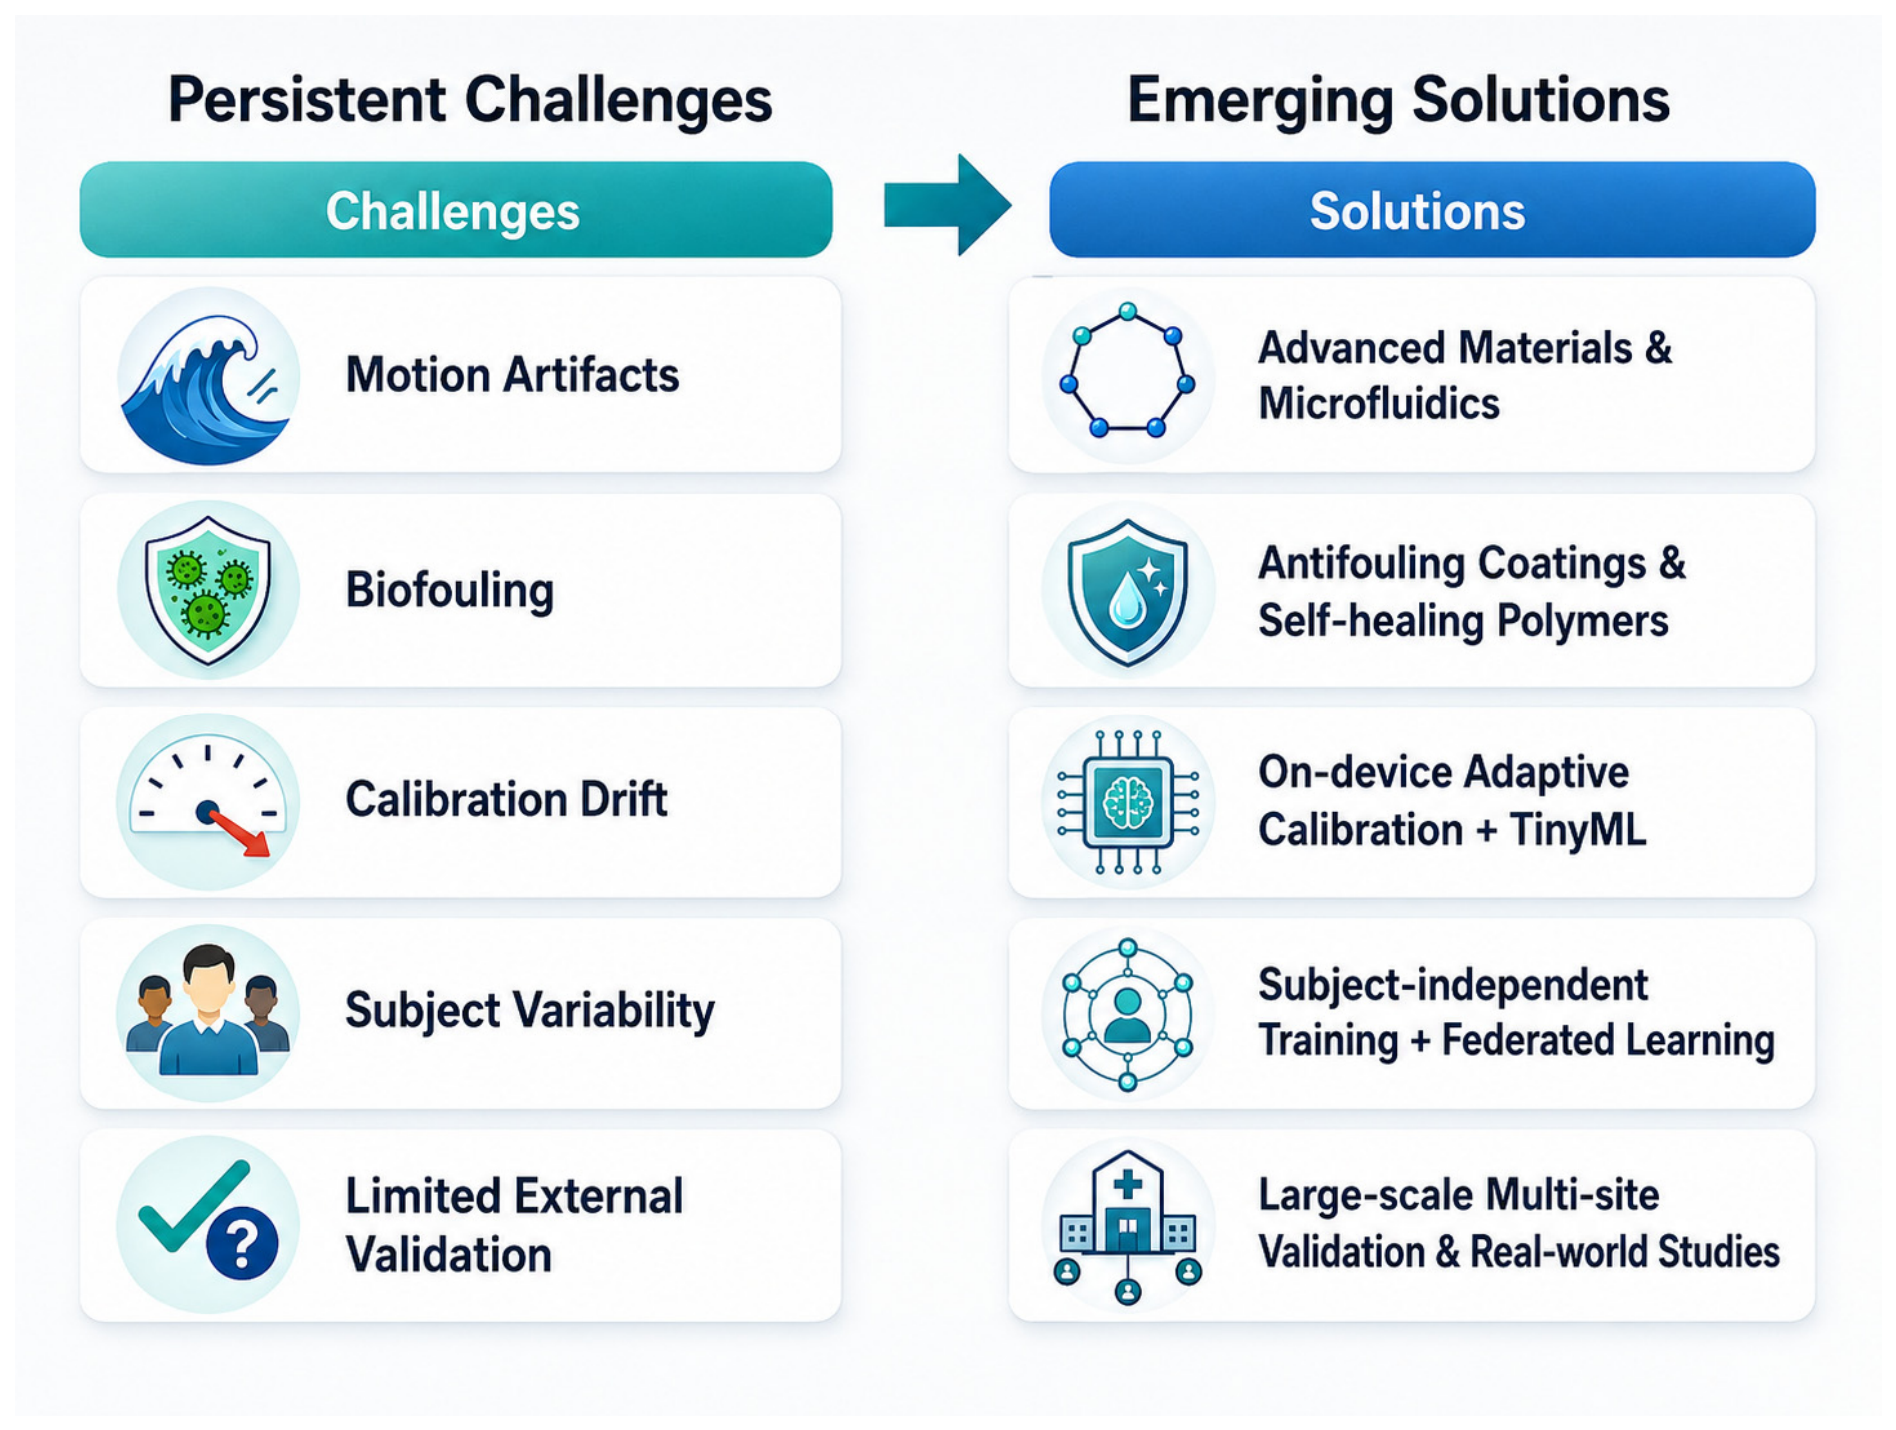
Key challenges that cut across modalities include motion artifacts, biofouling and sensor drift, variability of sweat composition and rate across individuals, limited subject-independent training and evaluation, privacy and security issues, and regulatory and data-protection compliance. Addressing these issues requires interdisciplinary collaboration between materials scientists, hardware engineers, data scientists, clinicians, and ethicists.
A positive methodological trend visible across the corpus is the reuse of validated signal-processing and modeling primitives. Short-window smoothing, baseline drift correction, context-aware calibration, compact feature engineering, and lightweight cross-validated models migrate successfully from colorimetric sweat patches through voltammetric sensors to multi-wavelength PPG pipelines. This portability lowers the barrier to adding new sensing channels and encourages architectures that learn shared latent representations with auditable per-modality contributions.
Nevertheless, rigorous cross-study comparison remains hampered by the absence of large, openly available, temporally synchronized multimodal corpora that span rest, graded exercise, thermal stress, and hypoxic conditions, acquired with participant-independent partitions and accompanied by high-quality reference measurements. The creation of such consortium-grade resources would permit systematic benchmarking of early-fusion versus late-fusion strategies while also requiring authors to report latency, energy consumption and privacy-related metrics alongside conventional accuracy figures.
Three concrete research directions emerge from the present synthesis. First, hardware algorithm co-design—partitioned inference between device and gateway, early-exit networks, and context-aware duty-cycling—can materially reduce energy draw while preserving responsiveness for closed-loop interventions. Second, multimodal explainability (SHAP values, modality ablation, and saliency maps) should become standard so that clinicians can understand which sensor stream drives a given decision under which physiological conditions. Third, edge-side personalization and lightweight digital-twin updating open the possibility of moving from passive monitoring to proactive, individualized “what-if” coaching on hydration, workload, or recovery trajectories.
Figure 9 complements Table 2 by visualizing how typical accuracy ranges relate to the validation level reached by each sensing category.

4.2. General Biosensor Platforms

4.2.1. Platform Architectures and Multimodal Integration

2025–2026 update: The newest platform-level literature shows a clear shift toward architectures that are mechanically soft, biologically compatible, and intrinsically multimodal. Flexible optical materials are improving stability and comfort in wearable photonic sensing [7], AI-driven wearable bioelectronics are redefining how raw signals are converted into clinically useful outputs [8], and programmable DNA hydrogels/origami are opening a new materials pathway for wearable and implantable biosensing with high molecular specificity [9].
The review article titled “The Emergence of AI-Based Wearable Sensors for Digital Health Technology: A Review” [7] is a complete discussion of wearable sensors fueled by AI for disease diagnosis, monitoring, and tailored health. It brings into perspective the development in biosensing technology and how it integrates with machine learning models in providing ongoing monitoring of patients. The study focuses on how AI can be utilized to forecast health anomalies and individualize treatment regimens using real-time sensor data. Microfluidic sweat sensors, PPG sensors, and electrochemical biosensors are highlighted as the principal areas of research. Details in Sensed Data Features vs. Predictions discuss the analysis of raw sensor signals by AI models to provide meaningful health indicators. Chief biochemical markers like glucose, lactate, and hydration level are sensed by these sensors and analyzed to provide health information on metabolic diseases like diabetes, cardiovascular risks, and stress status, or correlating trends in sweat biomarkers with dehydration and electrolyte imbalance. Real-time physiological trends, biochemical dynamics, and AI-driven anomaly detection are among the things covered in the sensed data. The study depicts how machine learning algorithms complement the early diagnosis by correlating such biomarkers with the disease’s progression. The study utilizes both real-time wearable sensor data and massive medical databases. To improve the quality of the signals, preprocessing techniques like feature selection, normalization, and filtering of noise are used. To avoid overfitting and leaking of data, bias correction and cross-validation methods are used. Authors employ IoT-based technologies to monitor in real time and TensorFlow and PyTorch to execute deep learning models as tools and frameworks. SciPy and OpenCV are also employed for signal processing. To examine the validity of AI-based wearable health monitoring, the testing method comprises sensitivity and specificity analysis, ROC curve test, and comparison with clinical diagnostic criteria [1].

4.2.2. AI-Wearable Models, Datasets, and Validation

The study titled “Medical Intelligence Using PPG Signals and Hybrid Learning at the Edge to Detect Fatigue in Physical Activities” by Liu et al. [10] is about detecting fatigue in students engaged in sports activities using photoplethysmography (PPG) signals and some advanced deep learning techniques. The researchers had students wear a PPG sensor to collect PPG signals from twelve physically healthy students in a fatigued state and a non-fatigued state, over ten minutes for each recording. The sensor was a typical, wearable PPG sensor to provide continuous, non-invasive monitoring of physiological signals like heart rate and blood oxygen saturation (SpO2).
The raw signals were processed to remove artifacts using a wavelet-based denoising preprocessing approach before segmenting the processed signal into smaller data windows. This processing and segmentation were performed to add data augmentation to the relatively small dataset. The processed signal features—heart rate, SpO2, along with two fatigue-specific indices—were used in many deep learning architectures, in Liu et al.’s studies [10].
The deep neural network architectures used ResNetCNN and Xception, both containing bidirectional long short-term memory (Bi-LSTM) layers. These hybrid models were effective at capturing spatial patterns and temporal dynamics within the PPG waveforms, outperforming classical traditional single method approaches to a much greater extent. The quality of the models was evaluated through a five-fold cross-validation approach in which the classification quality was determined using metrics for accuracy, F1-score, precision, recall, area under the curve (AUC), etc. This led to a very good performing hybrid, the hybrid Xception-Bi-LSTM, with a high accuracy of approximately 91.8%. As such, meaningful objective classification results were determined to be in good congruence with self-reported results of fatigue, e.g., the Karolinska Sleepiness Scale (KSS) and the Psychomotor Vigilance Test (PVT) [10].
Although high accuracy and reliability were demonstrated, the authors recognized limitations on the generalizability given the relatively small number of participants and the narrow specificity towards running activities that could limit the applicability of this technique to other sports or general populations. Possible future directions for research include expanding the sample size, investigating a variety of exercise modes in sports, and completing a further examination of the reliability of the proposed model. In conclusion, this study clearly suggests the potential of using wearable PPG sensors combined with advanced deep learning modeling approaches (e.g., CNN) to objectively and continuously assess student fatigue during sport, providing the foundation for better health control and performance enhancement in educational sport environments [10].
The article “AI-Reinforced Wearable Sensors and Intelligent Point-of-Care Tests” [11] examined recent developments in wearable biosensors and AI-enabled POCT systems that emphasized their connection with AI methods aimed at improving diagnostic testing accuracy and personalized medicine, mainly through continuous and non-invasive monitoring of physiological parameters with many different biosensors, including electrochemical, optical, piezoelectric, thermal, and field effect transistor-based sensors. Types of biosensors provide excellent capability, although biomarkers measured from body fluids (i.e., continuous sweat samples, tears, blood, urine, and exhaled breath) are most beneficial for addressing disease types with early disease detection and disease progression through real-time monitoring, and improving individualized therapeutic measures [11].
AI methods were also applied in many studies, which included machine learning methods with algorithms, such as support vector machines (SVMs), random forest (RF), principal component analysis (PCA) methods, and least squares support vector machines (LS-SVMs) as well as deep learning models including convolutional neural networks (CNNs), recurrent neural networks (RNNs), and long short-term memory (LSTM) networks. Embedded ML algorithms or models were also used (e.g., TinyML), typically on a low-cost microcontroller. Some studies provided robust and accurate forms of analysis in resource-limited or portable settings [11].
Specific data used in these studies were sourced through the biosensors from biochemical and physiological parameters, medical images, or existing sensor-fusion methods that included information from multiple modalities to deliver better accuracy. The AI models processed these complex, multivariate datasets to provide precise diagnostics and prognostics [11].
Through discussions of evaluations that used rigorous validation procedures and, most often, accuracy, sensitivity, specificity, and area under the curve (AUC) scores against clinical standards, they typically included multiple abilities in line with practical tests that confirmed the potential for meaningful use for these technologies in a medical science context [11].
The best performance was achieved largely by receiving high accuracy rates, as well as performing in accordance with clinical diagnostic methods using correlations, real-time responses, and practicality in healthcare. These evaluations encapsulate the powerful implications of AI-infused biosensing and POCT technologies, which highlight their transformative capacity. Despite the challenges exacerbating their utility in personalized healthcare, such as regulatory concerns, ethical aspects, and data privacy issues, continued development and innovation will allow users to harness the benefits of these technologies [11].
The article “Wearable Artificial Intelligence Biosensor Networks” by Zhang and others [2] outlines several examples of wearable technologies employing artificial intelligence technology hacks in biosensing without specifying specific sensor types. Broadly speaking, Zhang notes several sensors capable of acquiring biochemical and biophysical data, such as electrochemical sensors, optical sensors (holographic, fluorescent, and colorimetric), and multiplexed systems, designed to continuously acquire physiological biomarker data such as glucose, lactate, ions, and other metabolites. Through wearable biosensing, wearable sensors are used for healthcare diagnostics, fatigue management, and chronic conditions such as diabetes.
The authors used data collected through wearable biosensors (biochemical or biophysical signals from biofluids such as tears, sweat, and saliva) that were collected via smartphone-based systems for image processing and subsequently uploaded to the cloud. Preprocessing included Kalman filtering, Savitzky–Golay smoothing, and background subtraction to denoise and improve the signal [2].
Machine learning algorithms included convolutional neural networks (CNNs), support vector machines (SVMs), decision trees (DTs), random forest (RF), k-nearest neighbors (kNNs), and linear discriminant analysis (LDA). They processed the data to provide health insights [2].
The evaluation was carried out through accuracy measurements and comparisons across ML methods. Examples of accuracy percentages reported include eye-movement recognition with 96.3% using WT-SVM (wavelet transform support vector machine), and classification accuracies ranged from 83% to 100% over various applications. The evaluation occurred through evaluation methods of sensitivity, specificity, and prediction accuracy and included multiple tests across several algorithms as opposed to a single measurement [2].
Successful implementation was assessed based on accuracy, reliability of prediction, data processing speed, ability to run in real time, power consumption, latency on response time, and positive comparison with medical diagnostics reference standards [2].

4.2.3. Biochemical and Colorimetric Sensing Examples

A representative sweat-lactate study illustrates the technical progress in anaerobic-threshold detection. In the study “A novel device for detecting anaerobic threshold using sweat lactate during exercise” [12] by Yuta Seki and colleagues, the researchers introduced an innovative, flexible sweat-lactate patch designed for real-time monitoring. This patch features a PET-based printed three-electrode array, which is coated with lactate oxidase, paired with a Prussian-blue transducer and a 15 µm UV-cured hydrogel. It operates with an on-board potentiostat and a Bluetooth-LE system-on-chip, capturing voltage–temperature data every second and streaming it to a smartphone while you exercise [12].
In the study, forty-two patients with cardiovascular disease and twenty-three healthy volunteers took part in incremental RAMP cycling. The patch was placed on the forehead of the patients and on the upper arm of the controls, providing sweat-lactate readings at a frequency of 1 Hz. Meanwhile, finger prick blood samples were taken every two minutes to feed into a Lactate Pro 2 analyzer, and breath-by-breath gas analysis was used to determine the ventilatory threshold (VT1) [12].
The researchers identified the sweat-lactate threshold (sLT) as the first significant increase above baseline using Change Finder’s two-step SDAR outlier-change-point modeling. In contrast, the blood-lactate threshold (bLT) was determined through log–log plotting, and VT1 was assessed based on three standard gas-exchange criteria [12].
Statistical evaluations were conducted in R 3.6.3 and included Pearson correlations, Bland–Altman agreement, least products regression, and univariable logistic modeling for nonresponse cases, focusing on key predictors like NYHA III and low peak VO2. The sLT measurements closely followed the bLT readings (with a correlation of r = 0.92 and a mean bias of −4.5 W) and showed a moderate correlation with VT1 (r = 0.71, bias +2.5 W). Notably, there was no fixed or proportional bias for bLT, which confirms that the patch serves as a reliable real-time indicator of the anaerobic threshold, as long as sufficient sweating occurs. A device run was considered “good” if it produced a detectable sLT that aligned with bLT within ±5 W and demonstrated a correlation greater than 0.9 without bias—this standard was achieved by all participants who were sweating [12].
The article “Explainable Deep-Learning-Assisted Sweat Assessment via a Programmable Colorimetric Chip” by Liu et al. [9] describes the development of an explainable deep learning-assisted, programmable colorimetric sensor chip for non-invasive detection of biomarkers in human sweat—specifically glucose, lactate, and pH levels. The sensor comprised sodium alginate–calcium chloride gel capsules embedding enzymatic and indicator reagents tailored for each analyte. For glucose detection, glucose oxidase and horseradish peroxidase were combined with phenol reagent and 4-aminoantipyrine. Lactate detection relied on lactate oxidase coupled with horseradish peroxidase and tetramethylbenzidine. A multi-indicator system—including methyl orange, bromocresol green, and phenol red—was used for pH analysis [13].
A dataset of 4600 photographic images capturing varying concentrations of glucose and lactate, as well as different pH values, was collected and split into training, validation, and testing subsets. Data processing leveraged a convolutional neural network based on ResNet-18, which demonstrated exceptional efficiency, achieving 100% classification accuracy and quantification precision with R2 > 0.999. To improve the interpretability of the model, Class Activation Maps were implemented to visually highlight critical regions of sensor response that guided network decisions [13].
The evaluation involved comparing CNN performance against other machine learning models—such as artificial neural networks (ANNs), XGBoost, DT, and traditional statistical methods such as LDA. The CNN consistently outperformed these alternative approaches. Further validation using real human sweat samples showed agreement rates between 91.0% and 99.7% when compared to conventional laboratory methods, confirming the system’s robustness and reliability [13].
Overall, this deep learning-assisted programmable colorimetric chip was validated as an effective tool for rapid and precise biomarker analysis, with promising applications in advanced health monitoring and point-of-care diagnostics [13]. The review “Wearable Sensor for Continuous Sweat Biomarker Monitoring” by Qiao and others [14] focuses on wearable electrochemical sensors designed for non-invasive health monitoring through analysis of sweat biomarkers such as glucose, lactic acid, electrolytes, cortisol, vitamins, and ethanol. Although specific sensor models were not mentioned, various technologies were described, including enzyme-based sensors, enzyme-free sensors, molecularly imprinted polymer (MIP) sensors, electrochemical immunosensors, and potentiometric sensors [14].
Data were collected from human sweat using non-invasive sampling methods—pilocarpine iontophoresis, thermal stimulation, physical exercise, and specialized sweat patches. Collected samples underwent advanced analytical processing with liquid chromatography–mass spectrometry (LC-MS), capillary electrophoresis, gas chromatography–mass spectrometry (GC-MS), and nuclear magnetic resonance (NMR) spectroscopy, coupled with electrochemical techniques such as voltammetry, impedance spectroscopy, potentiometry, and colorimetry [14].
Sensor fabrication employed advanced materials including graphene oxide, zinc oxide nanorods, conductive polymers, transition metal oxides, and enzyme-functionalized electrodes. The evaluation of electrochemical performance metrics—sensitivity, linearity, detection limits, specificity, stability, reproducibility, and response time—was carried out under both laboratory-controlled conditions and realistic scenarios such as continuous monitoring during physical activity or dietary intake [14].
Quality was determined by each sensor’s ability to accurately and specifically detect biomarkers within physiologically and clinically relevant ranges, exhibit rapid and stable responses, and maintain performance under various physical stresses and prolonged use. Such rigorous evaluation criteria ensure the suitability of these wearable sensors for practical health-monitoring applications [14].

4.2.4. Disease Diagnostics, Biofluid Handling, and Microfluidics

The article titled “Wearable Biosensors for Disease Diagnostics and Health Monitoring: Recent Progress and Emerging Technologies” by Ren and Cui [15] demonstrates the continuous and real-time monitoring of biochemical and physiological parameters through non-invasive and minimally approaches. Unlike conventional diagnostic workflows that depend on sampling, wearable biosensor technologies allow for longitudinal data acquisition that enables the dynamic tracking of physiological variability and disease progression. This shift is important for monitoring conditions such as cardiovascular disorder and diabetes, given that the temporal fluctuations significantly define clinical outcomes.
One of the most critical advancements in wearable biosensing platforms is the inclusion of microfluidic architectures that enable the systematic management and assessment of biofluids under dynamic conditions. The passive mechanisms such as capillary-driven flow are combined with direct components including micropumps and valves to regulate sample transport from the skin interface to the sensing region. Similarly, the microfluidic architecture allows for the multiplexed detection through a single platform due to spatial separation of analytes. These designs reduce signals variability, evaporation, and contamination which are common challenges encountered in sweat-based sensing [15].
The diverse application of biomarkers signals a careful platform design to ensure stability, operationality, and selectivity. For example, metabolite detection utilizes enzyme-mediated electrochemical transduction, with limited stability due to enzyme degradation. Protein-based sensing relies on specific biorecognition elements such as antibodies or aptamers. This enables selective detection of disease-associated markers, but challenges persist in maintaining efficiency. Nucleic acid detection, while less common, introduces the potential for early-stage disease diagnostics through hybridization-based mechanisms. The selection of materials also defines the sensing performance, mechanical compliance, and biocompatibility. Elastomeric substrates such as PDMS reduce motion-induced artifacts during long-term wear. Hydrogels and textile-based platforms enhance fluid absorption in sweat-based systems. In contrast, nanostructured materials including graphene and conductive polymers are employed to increase signal sensitivity.
Despite technological advancements, several limitations impede the clinical utilization of wearable biosensors. One of the major challenges is the inconsistent correlation between analytes in peripheral biofluids (e.g., sweat or interstitial fluid) and physiological states that can affect diagnostic accuracy. Additionally, prolonged exposure to biofluids can cause signal variability and biofouling, raising questions over long-term reliability of sensors. Combining multiple biomarkers, using robust calibration strategies, and bringing advancements in antifouling materials and multimodal sensing approaches can address these challenges. Future research trajectory might focus on integrating intelligent data processing, long-term reliability, and clinical-grade validation to enable practical and scalable deployment in the health context [15].
The review article “Sense and Learn: Recent Advances in Wearable Sensing and Machine Learning for Blood Glucose Monitoring and Trend-Detection” by Alhaddad and colleagues [16] explores advancements in non-invasive blood glucose monitoring technologies and machine learning algorithms for predicting glucose trends, particularly for hypoglycemia detection. Several types of non-invasive sensors were used, including PPG, electrocardiogram (ECG), electromagnetic sensors, bioimpedance sensors, sweat-based sensors, tear-based sensors, saliva-based sensors, and accelerometers. Specific devices mentioned include the Empatica E4 (PPG-based), the BioHarness (ECG-based), and an electromagnetic glove developed by Hanna et al. [17].
The Empatica E4 provided accurate arrhythmia classification and demonstrated an 82.7% accuracy in predicting hypoglycemia in one participant. The electromagnetic glove showed a high correlation (r > 0.90) with hypoglycemia and hyperglycemia events in experimental settings. Data were collected from wearable devices and continuous glucose monitoring systems such as the FreeStyle Libre, including physiological signals like heart rate, interstitial glucose levels, and sweat rate.
Data preprocessing involved filtering, interpolation, and extrapolation to clean and standardize the signals before input into machine learning models. Algorithms employed included CNN, RNN, SVM, DT, gradient boosting machines (GBMs), and LSTM networks. Frameworks and tools mentioned were TensorFlow, PyTorch, Keras, and scikit-learn.
The model evaluation used metrics such as accuracy, root mean square error (RMSE), sensitivity, specificity, AUC, and the Clarke Error Grid analysis. Time-to-event analysis was also performed to assess predictive performance over time. The electromagnetic glove achieved over 98% accuracy in serum tests compared to reference glucose measurements. The success criteria included strong correlation with true glucose levels and a high proportion of readings in zones A and B of the Clarke Error Grid, indicating clinically acceptable performance.
Overall, the study highlights the promise of integrating wearable sensing technologies with machine learning for improved blood glucose monitoring and hypoglycemia prediction, while noting limitations in sample size, real-world validation, and generalizability [16].

4.2.5. Edge Deployment, Flexible Skin, and Lab-on-Chip Platforms

The study “Edge-AI Enabled Wearable Device for NonInvasive Type 1 Diabetes Detection Using ECG Signals” by Gragnaniello et al. [18] aimed to develop a non-invasive, real-time diabetes detection system using ECG signals analyzed with edge AI. The sensor employed was the MAX30003, a medical-grade ECG sensor designed for single-lead monitoring, offering low noise, advanced filtering, and energy-efficient operation suitable for wearable and embedded devices.
Data originated from the publicly available D1NAMO database, containing ECG recordings from twenty healthy subjects and nine patients with Type 1 diabetes, captured using the Zephyr BioHarness 3 device. The preprocessing included notch filtering at 50 Hz, Butterworth bandpass filtering from 0.5 Hz to 40 Hz, and statistical cleaning based on skewness and kurtosis. ECG segments of 5 s duration with 90% overlap were converted into spectrograms to capture time–frequency features efficiently under computational constraints.
The spectrogram-based features were analyzed using a neural network comprising two 1D convolutional layers (1DCNN) and two dense layers, optimized for microcontroller deployment via quantization with Edge Impulse’s EON compiler. The network achieved 89.52% accuracy, 0.91 average precision, 0.90 recall, and an AUC of 0.90, while consuming only 347 kB of flash and 23 kB of RAM.
Evaluation employed a patient-independent split of training and testing sets to prevent overfitting. Benchmarking across microcontrollers (STM32F4, F7, H7, M33, etc.) identified the STM32F401 (F4 series) as optimal, balancing energy consumption, performance, and latency—approximately 53 ms per inference. Quality criteria included high evaluation metrics, low resource usage, short inference latency, and energy efficiency [18].
In order to improve prosthetics and enable real-time physiological monitoring, the study “Artificial Intelligence-Powered Electronic Skin” by Xu et al. [19] investigates AI-driven flexible electronic skin for medical applications. The study emphasizes sensor fusion methods that enhance biofeedback accuracy by simulating human skin functions. The study uses multi-sensor electronic skin that can monitor pressure, temperature, and moisture. These sensors record physiological signals in real time for robotics and health monitoring applications. Micro-pressure fluctuations, hydration patterns, and AI-based stress response monitoring are examples of sensed data features. Artificial intelligence algorithms forecast changes in skin conditions, hazards of dehydration, and enhancements in prosthetic sensory feedback. Biofeedback investigations, prosthesis user studies, and electronic skin clinical exams are the sources of datasets. Multimodal data fusion, AI-driven noise reduction, and sensor calibration are all part of data processing. Cross-validation guarantees resilience in a variety of sensor scenarios. IoT-connected prosthetic devices, embedded AI for real-time input, and deep learning frameworks like PyTorch are all used in this study. Model accuracy testing for medical diagnostics, real-world prosthesis validation trials, and comparison testing against human tactile response data are some examples of evaluation techniques.
Another example of research that considers physiological signals in healthcare and disease detection is the study presented by Li et al. [20] in the article titled” Heart Rate Variability Measurement through a Smart Wearable Device: Another Breakthrough for Personal Health Monitoring”, published in 2023. This work provides foundational explanations regarding heart rate variability (HRV) and its interpretation. HRV refers to the fluctuations in the intervals between consecutive heartbeats and reflects the activity of the autonomic nervous system. It serves as a crucial indicator of both physical and mental health. In contrast, heart rate denotes the number of heart beats per minute and offers a more general measure of cardiovascular activity. Heart rate is regulated by electrical signals generated by the heart’s natural pacemaker, which stimulate the contraction of heart muscles to pump blood throughout the body.
Modern wearable devices, such as smartwatches, now enable accurate and continuous HRV monitoring. Studies have shown that HRV is associated with various health conditions, including stress, cardiovascular diseases, diabetes, and inflammation. Several factors, including age, sex, fitness level, smoking habits, medication use, and stress levels, can influence both heart rate and HRV, leading to wide variability in normal values across individuals.
To analyze HRV, heart rate data must first be recorded to extract the relevant variability features. Two common technologies employed in wearable devices are electrocardiography (ECG) and photoplethysmography (PPG). ECG measures the heart’s electrical activity with high precision, whereas PPG detects blood volume changes through light-based methods and is more commonly integrated into consumer fitness devices. Signals collected via wearable technologies provide a rich source of physiological data that can be leveraged in machine learning applications for the detection and monitoring of a wide range of health conditions [20].
Heart rate and HRV data extracted from wearable signals have been utilized in applications such as hypoglycemia prediction, heartbeat classification, and even glaucoma detection. The importance of preprocessing steps, including interpolation, extrapolation, and noise filtering, is emphasized, as these are critical before applying any analytical methods. A typical processing pipeline begins with the acquisition of raw signals from wearable sensors, followed by preprocessing to clean and normalize the data. Subsequently, feature extraction is performed either manually or through automated deep learning architectures, after which the extracted features are input into machine learning models for tasks such as classification, prediction, or anomaly detection.
Finally, an especially noteworthy application involves the use of heart rate and HRV data to monitor athletes’ recovery and readiness in preparation for the Tokyo Olympic Games. In this study, titled “Evaluating the Typical Day-to-Day Variability of WHOOP-Derived Heart Rate Variability in Olympic Water Polo Athletes”, data were collected using the WHOOP 3.0 wearable device, illustrating how physiological signals can be utilized to optimize athletic performance at the highest levels of competition [21].
The study written by David and Yizhi Cai, “Integrating synthetic biology and laboratory-on-a-chip technologies for next-generation biosensors” [22], explores the convergence of microfluidic lab-on-chip (LOC) platforms with synthetic biology to develop miniaturized and programmable and miniaturized biosensing systems. The study demonstrates that measuring the biochemical targets selectively requires integrating engineered biological components such as genetically modified microorganisms, CRISPR-based detection systems, and cell-free gene circuits in convergence throughout the process. The microfluidic architectures are combined with biological sensing modules to automate sample processing and enable controlled fluid handling.
The authors explore the microfluidic devices and droplet-based LOC systems that allow for multiplexed detection by spatially separating reactions in microchannels. These platforms enable quick and low-volume analysis of analytes such as nucleic acids, metabolites, and pathogens, which makes them beneficial for resource-limited settings. Data acquisition in such systems is typically achieved through optical or electrochemical readouts, where signal generation is directly linked to biological reactions such as gene expression or enzymatic activity.
The study emphasizes that these integrated systems significantly reduce the need for complex laboratory infrastructure by combining sensing, processing, and analysis within a single platform. However, challenges remain in maintaining biological stability, ensuring reproducibility of synthetic circuits, and scaling these systems for real-world deployment. Overall, the integration of synthetic biology with lab-on-chip technologies represents a promising direction for developing compact, programmable, and highly sensitive biosensing platforms capable of real-time and on-site diagnostics [22].

4.2.6. Machine Learning, Electrochemical AI, and Graphene Wearables

In the review titled “Advancing Biosensors with Machine Learning” [23] by Feiyun Cui, Yun Yue, Yi Zhang, Ziming Zhang, and H. Susan Zhou, the authors bring together a diverse range of machine learning (ML) applications in biosensing. The sensors themselves are quite varied, including custom electrochemical devices like a portable cyclic-voltammetry nitrate probe and an amperometric glucose-oxidase cell, as well as impedance chips, single-molecule nanogap/nanopore junctions, and wearable electronic patches for monitoring strain, ECG, and GSR. They also discuss plasmonic SERS substrates on gold gratings, fluorescence-imaged dPCR chips, and smartphone-readable color strips, each selected or designed for its unique analytical purpose [23].
The datasets are just as diverse, featuring 400 voltammograms, 54 impedance spectra, 1000 Raman traces, 161 nanopore spikes, 548 tactile-glove pressure frames, and 697 color images. These datasets undergo routine cleaning processes like Savitzky–Golay smoothing, background subtraction, and min–max scaling, along with feature engineering techniques such as FFT and binary stochastic filtering, and are typically split into training, validation, and test sets (60/20/20) or through k-fold cross-validation for model development. The predictive capabilities come from a variety of algorithms, including support vector machines, decision trees, k-nearest neighbors, random and rotation forests, gradient-boosted trees, and a range of deep learning networks (1-D and 2-D CNN, ResNet-18, Inception/DeepSpectra, Mask RCNN, and RNN/LSTM), often implemented using open-source frameworks like TensorFlow, PyTorch, Theano, or CNTK. Performance is evaluated using metrics suited to the task: R2 and MSE for regression, and accuracy, precision–recall–F1, ROCAUC, and confusion matrix counts for classification; many studies report accuracy rates exceeding 95% or AUC values greater than 0.9. Significant improvements include increasing true-positive detection in dPCR images from 68% to 98% using Mask R-CNN and enhancing fatigue-state recognition from wearable signals to 89% with a decision-tree model. A model is considered “good” when it can generalize to new, unseen data within practical testing times [23].
In the review titled “Where artificial intelligence stands in the development of electrochemical sensors for healthcare applications” [3], authors Andreea Cernat, Adrian Groza, Mihaela Tertis, Bogdan Feier, Oana Hosu-Stancioiu, and Cecilia Cristea delve into the fascinating world of electrochemical biosensors through the innovative lens of modern AI. They cover a wide array of technologies, from traditional enzyme-amperometric patches on screen-printed electrodes to cutting-edge nanozyme and metal-oxide catalytic films (like NiOOH/NiCo-LDH and MXCeO2), as well as molecularly imprinted polymer layers, peptide-functionalized field-effect transistors, and even textile-integrated microfluidic or microwave-resonant threads. These advancements are being repurposed for a variety of applications, including multiplex urinary-cancer screening, tracking glucose in sweat, detecting neurotransmitters, and identifying pathogens [3].
The literature is structured around four key AI use cases: (i) fingerprinting and classification techniques (such as LDA, SVM, and random forest) achieving impressive accuracy rates of 99–100% on datasets related to medicinal plants, urinary biomarkers, and COVID variants; (ii) resolving matrix interference, where neural networks help untangle overlapping redox peaks of substances like glucose, lactate, dopamine, and serotonin; (iii) optimizing sensor design through methods like sparse-operator SISSO or evolutionary searches; and (iv) making quantitative predictions, ranging from blood-equivalent lactate levels to concentrations of drugs and metal ions. The process typically involves denoising raw voltammograms, correcting baselines, and normalizing impedance spectra or FET currents, which are then divided into training, validation, and testing sets (60/20/20 or k-fold) before being analyzed with chemometric techniques (like PCA, PLS, and Kalman filters) and deep learning models. The authors emphasize the importance of FAIR data publication and the use of domain ontologies such as SOSA or EMMO to ensure that these diverse datasets are machine-readable and reusable [3].
Success is measured by the right metrics for the task at hand: for classifiers, we look for an AUC or accuracy of over 95%, while for regressors, we want root-mean-square or Bland–Altman errors to stay within clinical limits (≤5% for electrolytes and ≤10% for metabolites). Plus, it is crucial that these systems can perform in real-time on edge hardware. For example, there is an artificial neural network (ANN) that can distinguish between glucose, ascorbic, and gluconic acids with an impressive 99% accuracy, and a deep-net fatigue sensor that keeps its RMSE below 10% of the full scale. A system is considered “good” when it meets these standards on new data while also being clear enough to gain regulatory approval [3].
The review titled “Sensing the Future with Graphene-Based Wearable Sensors: A Review” [24] by Md Kamrul Hassan Chowdhury and others explores the incredible journey of graphene and its derivatives. It highlights how these materials have evolved from simple lab flakes to a whole range of skin conforming devices that are as light as fabric but can detect pressures, strains, ions, gases, electrophysiological waves, and even the nuances of spoken words. In just over a decade, more than 250 primary papers have been published on this topic. The authors categorize this extensive research into two main groups: one based on the type of transduction (like pressure/strain, chemical, gas, electrophysiological, and acoustic) and the other based on structural forms (such as textile yarns, porous foams, printable films, and hydrogels) [24].
Throughout these studies, graphene’s remarkable properties—its single-atom thickness, a surface area of 2600 m2 g−1, and a carrier mobility of 106 cm2 V−1 s−1—allow it to pick up signals that previously required bulky metal strain gauges, glass pH electrodes, or rigid CMOS cameras. For instance, a pressure patch can now detect a fingertip pulse at just 20 Pa, while a textile K+ strip can achieve detection limits around 0.4 mM even after five washes at home, all while maintaining a ±3% repeatability target for sports physiology. Additionally, self-locked overlapping sheets create strain gauges with gauge factors exceeding 1000, enduring up to 1500 stretch cycles, and all-graphene gas tags can identify sub-ppm NO2 even when crumpled [24].
While many prototypes are busy streaming raw voltages, the review highlights a shift towards intelligence at the edge. Now, smartphone snapshots of colorimetric sweat pads are analyzed using lightweight LDA or SVM classifiers, boosting accuracy from 75% to an impressive 90–95% for pH or glucose readings. Plus, we are seeing conditional-GAN image repair and 128-cell LSTM activity recognizers already operating on Jetson Nano or Raspberry Pi nodes for applications in ecology and rehabilitation. The fabrication process is keeping up with innovations like mask-less inkjet and laser-induced graphene (a one-step pattern-and-growth method), along with plasma or photolithographic etching when micron-level precision is crucial, and transfer-printing for 3D garments. Together, these techniques significantly reduce costs and position conductive lattices exactly where strain is most concentrated [24].
The authors argue that success is only achieved when device-level metrics align with wearability. In practical terms, this means achieving sensitivities or slopes within 5–10% of established physiological gold standards; response times of under five minutes for biochemical pads and less than 100 ms for motion sensors; mechanical or wash endurance exceeding 100–1000 cycles; and tight error bands (≤10% for metabolites, ≤5% for electrolytes) that can inform real-time coaching or clinical alerts. Designs that meet these criteria while operating for hours on a coin cell—or even passively through triboelectric films—and that can stream uninterrupted Bluetooth Low Energy (BLE) data are considered “good” and ready to step out of the lab [24].

4.3. Vital-Sign Monitoring

4.3.1. Cardiovascular and Cardiorespiratory Monitoring

2025–2026 update: In vital-sign monitoring, the strongest recent trend is toward clinically anchored, multisensory cardiovascular assessment rather than isolated rate estimation. Contemporary reviews now stress continuous home-care relevance, artifact-aware design, and user comfort as equally important to signal fidelity [25,26]. This means that future systems will be judged less by ideal bench accuracy alone and more by stability across motion, perspiration, and long-term wear.
The review article “Heart Rate Variability Measurement through a Smart Wearable Device: Another Breakthrough for Personal Health Monitoring?” [20] investigates the measurement of heart rate variability (HRV) using commercial wearable devices. Two types of sensors were employed: electrocardiographic (ECG) and photoplethysmographic (PPG). ECG sensors were used in devices such as Apple Watch, Samsung Galaxy, and Polar H10 chest straps, which are suitable for accurate long-term HRV tracking. PPG sensors, found in Apple Watch, Fitbit, and Oura Ring, are used for continuous HRV tracking, especially during sleep and daily activities. ECG is considered the gold standard for HRV measurement, but PPG offers greater user convenience.
The data used in this study came from commercially available devices, public health databases, and original research conducted by the authors using Apple Watch and the Welltory app. Data processing involved machine learning and artificial intelligence algorithms, including power spectral density (PSD) analysis and deep learning models. Although specific frameworks were not mentioned, Apple’s ResearchKit and third-party apps (e.g., Welltory) were used for data acquisition and processing. The evaluation was conducted by comparing HRV data from consumer devices with clinical ECG data. The primary metrics used for the evaluation included SDNN (standard deviation of NN intervals), RMSSD (root mean square of successive differences), and low-frequency/high-frequency (LF/HF) ratios. Measurements were taken over different periods, from short-term (30 s) to long-term (24 h). Continuous HRV monitoring provided a more reliable dataset, allowing for detailed insights into autonomic nervous system function.
The effectiveness of the measurement was determined by the consistency of the data, low measurement error, and correlation with clinical HRV benchmarks. The success was established based on the device’s ability to distinguish between physiological states (e.g., stress, cardiovascular health, and arrhythmias) and produce reliable, reproducible data under different conditions [20].

4.3.2. Drowning Prevention and Respiratory Safety

The presented research, “Wearable Pulse Oximeter for Swimming Pool Safety” by Kałamajska et al. [27] is focused on developing an algorithm intended for wearable devices to prevent drowning accidents by detecting pre-drowning symptoms using physiological data analysis. The device incorporated two primary sensors: a low-cost MEMS accelerometer (±6 g range, 0.5% accuracy and nonlinearity) and a reflective optical pulse oximeter (model MAX30102 by Berserg), capable of monitoring heart rate and oxygen saturation (SpO2). The pulse oximeter utilized LEDs at wavelengths of 660 nm (red) and 880 nm (infrared), ensuring accurate and interference-resistant measurement suitable for wrist-based devices.
Data for developing and validating the system were collected during controlled breath-holding experiments performed by the authors themselves, simulating the initial stages of drowning without actual loss of consciousness. Signal processing involved sophisticated techniques to remove noise and motion artifacts, including a 64th-order band-pass filter, Fast Fourier Transform (FFT), polynomial interpolation, and a novel nearest-peak selection method specifically designed to mitigate motion artifacts effectively. Linear regression was employed to detect significant trends indicating decreases in heart rate and SpO2.
The evaluation was performed through multiple dry tests (50 trials), where breath-holding triggered detectable SpO2 declines with 90% accuracy. Performance metrics included variance analysis of heart rate and oxygen saturation data, the frequency of false alarms, and the responsiveness of the algorithm, which triggered alarms within thirty seconds upon detecting dangerous physiological changes.
Effectiveness and reliability were determined by the algorithm’s capacity to accurately and rapidly detect genuine threats (continuous decline in HR and SpO2), its resilience against false positives, and the robustness of its data processing techniques under realistic conditions [27].

4.3.3. Multimodal Patches and Edge Processing

Matsumura et al., in their study “Real-time Personal Healthcare Data Analysis Using Edge Computing for Multimodal Wearable Sensors” [28], present a multimodal flexible sensor patch designed to monitor vital signs in real time using edge computing on a smartphone. The patch integrates several sensors: a gold-based temperature sensor with a sensitivity of approximately 0.12%/°C, a humidity sensor made from ZnIn2S4 nanosheets with high sensitivity to changes in humidity, a strain sensor using laser-induced graphene in polydimethylsiloxane for monitoring respiration, a commercially available gel-based electrocardiogram (ECG) sensor for cardiac activity, and an accelerometer for detecting physical activity and posture. The data are transmitted to a smartphone via Bluetooth Low Energy, where they undergo analog-to-digital conversion, smoothing, normalization, and augmentation with Gaussian noise to improve model accuracy.
Data analysis is performed using an Echo State Network (ESN), a type of reservoir computing framework, which enables fast and efficient processing directly on a smartphone. The ESN was implemented in Python and fine-tuned using the scikit-learn library, while the smartphone application was developed using Dart and the Flutter SDK. Human trials were conducted on three volunteers who wore the patch in different environmental conditions. The ESN achieved an accuracy of 0.966 for arrhythmia detection and an Fβ score of 0.964 for activity detection. The ECG sensor showed a correlation of approximately 0.92 with a commercial oxygen saturation monitor. The system demonstrated stable performance over ten hours of continuous use and a negligible time delay of approximately 3 ms for real-time detection of arrhythmias and activity.
The study confirms that the sensor patch provides accurate and consistent monitoring of cardiac activity, respiration, skin temperature, and physical activity. The combination of flexible sensors and edge computing on a smartphone shows potential for real-time personal healthcare and early-stage disease detection. Further clinical trials are recommended to enhance the system’s capabilities [28].

4.3.4. Clinical Validation Against Bedside Monitoring

The research by Jiang et al., [29] titled as “Validation of Wearable Vital Signs Monitoring: A Comparison with Conventional Bedside Patient Monitors” explores the reliability of wearable mobile devices in accurately monitoring vital signs continuously across the clinical settings by comparing them with conventional bedside monitoring devices.
To achieve this objective, the authors compared the vital signs measurements from a BeneVision N15 traditional bedside monitoring system and also from Mindray’s mWear wearable device. Data was collected from 16 healthy volunteers in a clinical setting through 208 paired datasets including heart rate, blood pressure, respiratory rate, and oxygen saturation from these systems. Bland–Altman was used as an analytical framework to assess the accuracy and reliability of both devices.
The results deduced from the study indicates that measurements recorded through wearable mobile devices were in convergence with hospital’s monitoring systems. The findings indicate data variance points for pulse rate, oxygen saturation, heart rate, and diastolic blood pressure were 94% in agreement with each other. Similarly, data variance points were 94.7% in correspondence for respiratory rate heart rate data. While the data variance points for systolic blood pressure were recorded within the limits of 92.3%. The findings of the study suggest that mWear device and the traditional bedside patient monitoring system showed converging results and points of agreement in vital signs measurements. The trends demonstrate that wearable mobile devices have been shown reliable and accurate to continuously monitor vital signs, encouraging their wider execution across clinical contexts.
However, the study showed several limitations such as the controlled experimental conditions and small sample size, which necessitates the deployment of such devices in large scale and real-world validations. Overall, the study holds strong outcomes by evidencing the clinical reliability of wearable biosensors for continuous monitoring of vital signs and reinforces their potential integration in advance healthcare systems [29].

4.3.5. Hydration, Respiration, and Blood-Pressure Monitoring

The study “Personalized Wearable Electrodermal Sensing Based Human Skin Hydration Level Detection for Sports, Health, and Well-Being” by Liaqat et al. [30] investigates how AI algorithms evaluate sweat gland activity to forecast dehydration hazards in sports, occupational health, and elder care by looking at electrodermal sensors driven by AI for hydration monitoring. In order to monitor skin conductance changes and determine hydration status, the study uses electrodermal activity (EDA), temperature, and sweat conductivity sensors. Trends in electrolyte balance, changes in body temperature, and sweat gland activation levels are examples of sensed data. AI algorithms relate stress levels, environmental factors, and activity intensity to hydration levels. Sports science hydration experiments and occupational heat-stress research are included in the dataset. AI feature extraction, signal segmentation, and baseline drift correction are all part of data preprocessing. Hydration models are guaranteed to be accurate under various physical situations according to K-fold cross-validation. The study makes use of IoT-integrated hydration tracking technologies, Python-based AI models, and cloud AI for predicting hydration trends as a framework. Clinical comparison against blood hydration markers, real-world athlete and worker trials, and assessments of hydration prediction accuracy are some of the evaluation techniques [30].
Respiration rate is one of the key vital signs used in both health assessment and sports performance management. As highlighted in the study titled “Waterproof, stretchable and wearable corrugated conductive carbon fiber strain sensors for underwater respiration monitoring and swimming instruction” by He et al. [31], monitoring respiratory rate can support the development of systems capable of detecting conditions such as apnea, pneumonia, bronchitis, and asthma, and even guiding physical movement or rehabilitation. The respiratory rate is relatively simple to measure and can be derived using several techniques. One common method involves detecting impedance changes between electrodes placed on the skin, which vary as the chest expands and contracts during breathing. This approach, known as impedance pneumography, is widely used in clinical and wearable monitoring systems. In addition to impedance-based methods, respiratory rate can also be calculated from signals such as ECG and PPG. In these cases, subtle modulations caused by respiratory activity—such as respiratory sinus arrhythmia in ECG or amplitude variations in PPG—can be extracted using signal processing techniques. Modern wearable devices like chest straps, smartwatches, fitness trackers, and even smart garments now incorporate sensors that allow for continuous and non-invasive respiratory rate monitoring. These technologies make it possible to integrate respiratory data into broader health monitoring platforms, enabling early detection of respiratory issues and enhancing performance tracking in sports and fitness contexts.
On the other hand, in the paper titled “A Novel Wearable Sensor for Measuring Respiration Continuously and in Real Time” done by Ali et al. [32], the authors present a novel wearable technology designed for continuous respiratory monitoring. The system incorporates specially developed sensors with an electrode ratio of 1:3:1, enabling accurate and consistent measurement of respiration over time. While the paper introduces the concept and demonstrates its practical application, the detailed sensor design and engineering aspects fall outside the primary scope of their study.
In the work done by Takahashi et al., named “Wearable Technology for Monitoring Respiratory Rate and SpO2 of COVID-19 Patients: A Systematic Review” [33], the authors reviewed wearable technologies designed for monitoring the respiratory rate of COVID-19 patients. The paper highlights the prominence of analytical and statistical approaches in such applications. The wearables discussed play a crucial role in early detection, remote monitoring, and preventing sudden health deterioration—particularly valuable for patients in home isolation. The reviewed systems collect physiological data, including respiratory rate, SpO, HRV, body temperature, and activity levels. Some implementations even incorporate GPS data for contact tracing and patient movement analysis. The paper also outlines several IoT-based architectures, particularly three-layered models composed of sensing devices, cloud storage, and communication networks to support real-time data transmission and alerts. To ensure patient data privacy, security measures like Cloudflare and encryption protocols are employed. These wearable systems can identify early signs of deterioration in COVID-19 patients by detecting trends such as decreasing SpO or respiratory rate. However, the paper also notes limitations, such as reduced accuracy in SpO readings due to factors like skin pigmentation, tattoos, or external light conditions. While these technologies offer promise for improving patient care, their overall impact on long-term outcomes remains a subject of ongoing discussion.
Recent advancements in wearable technology have enabled continuous, non-invasive monitoring of blood pressure (BP) by integrating flexible sensors with sophisticated machine learning (ML) algorithms. Traditional cuff-based sphygmomanometers, while accurate, are often impractical for continuous monitoring due to their bulk and intermittent measurement capability. In contrast, wearable devices equipped with flexible sensors can continuously capture physiological signals such as photoplethysmography (PPG) and electrocardiography (ECG), which are then processed to estimate BP values, providing real-time insights into an individual’s cardiovascular health. A comprehensive review by Kireev et al. titled “Continuous cuffless monitoring of arterial blood pressure via graphene bioimpedance tattoos” [34] discusses the integration of flexible electronics and ML algorithms in wearable BP monitoring systems. The study highlights how flexible sensors, when combined with ML techniques, can accurately estimate BP by analyzing features extracted from PPG and ECG signals. This integration facilitates the development of personalized BP monitoring solutions that adapt to individual physiological differences, thereby enhancing measurement accuracy. In practical applications, ML algorithms such as artificial neural networks (ANNs) have been employed to estimate BP from PPG signals. For instance, a study by Lin et al. presents an energy-efficient approach where continuous PPG signals are preprocessed and input into an ANN to predict systolic and diastolic BP values. This method demonstrates the feasibility of implementing ML-based BP monitoring on wearable devices with limited computational resources, which we can get to know from the work done by Lin et al., named “Energy-efficient Blood Pressure Monitoring based on Single-site Photoplethysmogram on Wearable Devices” [35]. Furthermore, deep learning models like ResNet and Transformer have been utilized to analyze wrist-based PPG data for hypertension risk screening. Research by Lin et al. indicates that these models can effectively distinguish between healthy and hypertensive individuals by leveraging longitudinal PPG data collected from smartwatches. This approach underscores the potential of deep learning in enhancing the predictive capabilities of wearable BP monitoring systems. However, challenges remain in ensuring the reliability and clinical validation of these wearable technologies. Factors such as sensor placement, motion artifacts, and individual variability can affect measurement accuracy. Ongoing research aims to address these issues by developing more robust ML models and improving sensor technology.
Oxygenation levels, commonly referred to as blood oxygen saturation, indicate the percentage of hemoglobin in the bloodstream that is bound with oxygen. This metric is vital for assessing how effectively oxygen is being transported from the lungs to the rest of the body. Normal arterial oxygen saturation levels typically range from 96 to 100 percent. Levels below this range may indicate hypoxemia, a condition characterized by insufficient oxygen in the blood, which can adversely affect essential organs such as the brain, heart, and kidneys, as mentioned by the “Mayo Clinic”. Monitoring blood oxygen levels is crucial for detecting and managing various health conditions. For instance, individuals with respiratory diseases such as chronic obstructive pulmonary disease (COPD), asthma, pneumonia, or sleep apnea often experience reduced oxygen saturation based on the information provided by the WHO. Continuous monitoring allows for early detection of hypoxemia, enabling timely medical interventions. Advancements in wearable technology have facilitated non-invasive, continuous monitoring of oxygen saturation using photoplethysmography (PPG) sensors. These sensors detect blood volume changes in the microvascular bed of tissue, providing real-time data on oxygen levels. PPG technology has been widely adopted in consumer health devices, such as smartwatches and fitness trackers, making oxygen monitoring more accessible for both clinical and personal use. The integration of machine learning (ML) algorithms with PPG data enhances the accuracy and reliability of oxygen saturation measurements. For example, deep learning models can analyze PPG waveforms to predict oxygen levels, even in the presence of noise or motion artifacts. Moreover, ML techniques have been applied to develop predictive models for oxygen saturation. In a study focusing on post-activity oxygen levels, various ML models, including support vector machines (SVMs) and artificial neural networks (ANNs), were employed to predict oxygen saturation based on physiological parameters in the paper titled “Machine learning-based respiration rate and blood oxygen saturation estimation using photoplethysmogram signals” [36]. These models demonstrated potential in forecasting oxygenation trends, which is valuable for managing conditions like sleep apnea, for monitoring cardiovascular diseases, or for optimizing athletic performance. Additionally, oxygen saturation data is increasingly used in intensive care units (ICUs) and emergency response systems to support clinical decision-making and risk stratification in critically ill patients. The convergence of biosensing, wearable devices, and AI-based analytics continues to transform oxygen monitoring into a proactive tool for preventive healthcare and real-time intervention.

4.3.6. PPG, Pulse-Wave, and Broader Wearable-Sensor Reviews

In the review titled “Photoplethysmography in Wearable Devices: A Comprehensive Review of Technological Advances, Current Challenges, and Future Directions” [37], authors Kwang Bok Kim and Hyun Jae Baek review the impressive evolution of wrist-worn PPG systems over the past decade. The hardware has transformed from using a single green LED paired with one photodiode to more sophisticated compact analog front-end modules, like Maxim’s MAX30101 and Analog Devices’ ADPD144RI. These advancements feature multi wavelength emitters, multi-pixel photodiode arrays, and barrier ribs that effectively reduce optical crosstalk and heat, all while maintaining a tiny footprint. The review highlights how these sensors are utilized in a variety of studies: for instance, a support vector machine achieves an impressive 94% accuracy in classifying five levels of mental stress based on fingertip PPG from 74 volunteers; a two-layer feed-forward neural network estimates systolic and diastolic pressure on the wrist with mean absolute errors of 3.23 and 2.73 mmHg, respectively, and successfully meets the ESP-IP2 protocol; sleep-stage scoring using a bidirectional LSTM reaches a k value of 0.62 across 292 clinical recordings; extreme-gradient boost regression predicts blood glucose concentration from Empatica-E4 signals with an R2 of 0.995; and a CNN-RNN stack identifies five daily activities from Huawei-Watch-2 data with an F1 score of 0.78 [37].
When it comes to these use cases, we typically work with raw wrist PPG data (ranging from 25 to 100 Hz) and, when necessary, accelerometer streams. These are cleaned up using FIR/IIR or Hampel filters, along with motion-reference adaptive cancelation and Savitzky–Golay smoothing. For ultralow-rate recordings, we apply a three-point parabola interpolation to “re-sharpen” the data, ensuring that inter-beat intervals are preserved down to a sampling rate of 20 Hz. The feature stacks combine time-domain statistics, pulse-wave shapes, frequency-band power, MFCCs, or Teager–Kaiser energy, often mixed with demographic information, before being fed into models like LightGBM, XGBoost, SVM, or both feed-forward and recurrent neural networks. We evaluate performance using task-specific metrics such as accuracy, sensitivity, specificity, F1 score, Cohen’s k, ROC-AUC, or mean and standard error for regression. Additionally, we conduct protocol checks like ESP-IP2. A solution is considered “good” if it maintains an accuracy of 90% or more (or less than 5 mmHg MAE, less than 10 mg dL−1 SEP, etc.) on unseen data, all while operating within the power limits of watch-grade microcontrollers and enduring 24 h free-living tests that include various motion and ambient-light challenges, which is a key expectation highlighted throughout the review [37].
The review titled “Wearable Pressure Sensors for Pulse Wave Monitoring” [30] by Keyu Meng, Xiao Xiao, Wenxin Wei, Guorui Chen, Ardo Nashalian, Sophia Shen, and Jun Chen bring together insights from over 250 primary studies focused on tracking cardiovascular health using skin-friendly pressure sensors. The authors started by discussing arterial biomechanics and then categorized the sensors based on their transduction mechanisms—like piezoresistive, capacitive, optical (FBG), piezoelectric, triboelectric, and the newly introduced soft-matter magnetoelastic generators. They also classified them by their micro-engineering strategies, which include micro pyramids, porous foams, bionic papillae, interlocked ridges, or multilevel nanowires, each chosen to enhance sensitivity, expand the dynamic range, or reduce motion artifacts. The devices mentioned can now detect radial artery pulses as low as 0.5 Pa; respond in less than 4 ms; endure over 10,000 bending cycles; and, when self-powered (using piezo-, tribo-, or magneto-electric methods), transmit data for hours without needing coin cells. This meets the review’s criteria for success, which includes sub-second latency, at least 90% waveform fidelity, and all-day comfort on the skin. Instead of creating new datasets, the authors compiled detection limits, gauge factors, Nernst-like slopes, and drift rates from the studies they reviewed. They also pointed out the early use of edge AI pipelines—like YOLO/OpenPose for artifact rejection, LSTM classifiers for pulse waveforms, and SHAP-ranked feature maps—and suggested that with 5GIoT connections and on-sensor processing, we will soon see quicker response times for stroke or arrhythmia prevention [38].
The study titled “Wearable Sensors for Health Monitoring: Current Applications, Trends, and Future Directions” [39] investigates a comprehensive framework to understand biosensing systems by dividing them into biochemical and physical sensing platforms. The physical sensors target strain, pressure, motion, and temperature. Biochemical sensors measure biofluids such as interstitial fluids, sweats, saliva, and tears in order to detect metabolites and biomarkers. Such categorization reflects the convergence of sensing modalities where a single platform combines biophysical and biochemical measurements to conduct multimodal health monitoring. The study reviews five kinds of sensors such as biochemical biosensors, epidermal-based biochemical sensors, wearable physical sensors, other non-biological signals that reflect their detection principles, and biofluid interfaces.
For instance, tear-based sensors use smart contact lenses to monitor electrolytes and glucose non-invasively. For real-time measurement of metabolites such as lactate, cortisol, and sodium during physical activity, sweat-based systems are used. Similarly, saliva-based wearable sensors provide detect pathogens, hormones, and biomarkers for oral and systemic health monitoring. Non-biological physical sensors monitor pressure, motion, strain, and temperature to evaluate body performance dynamics, while the epidermal sensors involve contact with skin for continuous tracking of physiological signals such as temperature and hydration levels.
Despite improvement in results, such as accuracy and reliability, challenges persist in key areas. Firstly, the standardized on-body testing remains a continuous challenge due to limited success in scalable deployment and variations in clinical datasets. Second, the integration of AI and data analytics is essential for efficient handling of high frequency multimodal data that require fast processing, calibration, and privacy-preserving frameworks. Third, there is a need for energy-efficient and power harvesting management systems, such as triboelectric and piezoelectric systems, to enable long-term or battery-free operation.
Recent advancements in wearable sensors indicate a shift from laboratory-based research to real-world application of wearable technology in clinical context for continuous monitoring of physiological parameters. Future trends indicate a shift towards multimodal skin conformal platforms that combine physical and biochemical platforms, ensured through the inclusion of advanced and flexible materials, printed electronics, microfluidic systems, and breathable textiles [39].

4.3.7. Pregnancy Monitoring and Cross-Context Reuse

The review titled “Wearable Sensors, Data Processing, and Artificial Intelligence in Pregnancy Monitoring: A Review” [40] by Linkun Liu, Yujian Pu, Junzhe Fan, and their colleagues dives into 197 publications and examines 34 key studies to map out the landscape of pregnancy-monitoring wearables. The authors highlight that today’s technology can be categorized into five main types: bio-potential electrodes that capture ECG, EEG, or 16-channel abdominal EHG; inertial and pressure patches or fabrics that track fetal movement and uterine contractions; acoustic phonocardiography microphones or piezo discs for detecting fetal heart sounds; graphene-based electrodermal strips designed for monitoring stress and emotions; and fully integrated soft belts or sensor networks that combine several of these technologies. Each category is linked to a specific obstetric task, all of which are illustrated in the system-level overview found in Figure 2 of the article. Notable examples include dry-textile fECG harnesses, Kirigami liquid–metal electrodes, self-healing ionic hydrogel “skins”, and four-sensor piezo arrays, most of which transmit data via Bluetooth, Wi-Fi, NB-IoT, or LoRa for cloud-based analysis [40].
Since this paper serves as a literature survey, the “data” it discusses come from the datasets highlighted in those 34 focus papers. In the review logs channel, Table 2 outlines the counts, sampling links, and algorithmic choices for sources that cover a range of techniques, including multi-channel accelerometry, EHG grids, combined bio-potential–acoustic traces, and ultrasound recordings. Typically, the analysis starts with filtering methods like finite- or infinite-impulse-response, followed by Kalman or Hampel smoothing, and wavelet denoising. After that, it extracts various features—statistical, morphological, or time-frequency—before passing them to machine learning models such as gradient-boosted decision trees, convolutional neural networks, support-vector machines, random forests, or k-means clustering. LightGBM achieves an impressive 94% accuracy for detecting fetal movements, while CNNs reach an AUC of 0.92 for uterine-contraction EHG. Moreover, mixed ensemble approaches often outperform single-tree baselines. Most implementations are built using Python/TensorFlow or MATLAB, with several running on embedded processors for on-device inference [40].
Performance metrics are reported in terms of accuracy; sensitivity; specificity; precision–recall–F1; ROC-AUC; and, for heart rate tasks, parts-per-million error compared to clinical cardiotocography. Many systems surpass the 90% accuracy mark: ensemble models achieve 93% on ultrasound accelerometer fetal-movement datasets, and QRS-based peak detectors maintain combined maternal and fetal heart rate error below 0.3 ppm. Consequently, the review considers a pipeline “good” if it can provide continuous, non-invasive monitoring, exceed approximately 90% accuracy (or a similarly low error rate) on unseen data, and operate within the power and latency limits of a wearable device, all while addressing the privacy, interpretability, and real-time computing challenges discussed in the conclusion [40].

4.4. Biochemical Sweat Sensing

2025–2026 update: Sweat sensing is undergoing a methodological upgrade. Recent work highlights multimodal body-fluid monitoring and data-fusion strategies as a route to more physiologically meaningful inference [5]. At the device level, biosafety-isolative and enrichment-enabled patches combined with deep learning demonstrate how collection, concentration, and interpretation can now be co-designed instead of treated as separate problems [41].
Childs et al., in their review article “Diving into Sweat: Advances, Challenges, and Future Directions in Wearable Sweat Sensing” [4], focused on wearable sweat sensing. Presently, the majority of wearable sweat sensors use electrochemical sensors as they allow a hassle-free experience for the user. However, those sensors are prone to motion artifacts and electronic noise. Some sweat sensors employ optical sensors, mainly colorimetric sensors, which in turn require the user to take a picture of the sensor to monitor color changes. The concentration of molecules in sweat is much lower than in blood, which is one of the challenges in sweat sensing. However, recent advances in nanotechnology have allowed for the development of next-generation sweat sensors, which are ready to detect low-level analytes in sweat. On the other hand, further developments are needed to make this technology ready for mass deployment. Another important aspect is the correlation between sweat and blood analytes levels. The literature is relatively limited from that perspective. There are several aspects that can impact that correlation, for example, the size of molecules, skin contamination, sweat rate, pH, or temperature. However, this correlation issue can be overcome by employing machine learning or deep learning models. Once those models are trained for a specific user and task, then there is no need to compare the sweat concentration of analytes to the blood concentration. Some diseases do not have a single biomarker that would be an indicator of that disease. To overcome this issue, a multimodal approach is the solution where signals from multiple sensors are used by a machine/deep learning model to predict events or early diagnosis [4].
The review article “Wearable Sensors for Biochemical Sweat Analysis” by Bandodkar et al. [42] focuses on wearable sweat sensors. Sweat is a very rich biofluid that contains a wide variety of molecules such as electrolytes, metabolites, proteins, cytokines, antigens, hormones, and exogenous drugs. Monitoring sweat biomarkers is an important aspect of health monitoring, as different levels of those sweat analytes can indicate dehydration, stress, physical fatigue, and some diseases. The article discusses the advancements in development of the wearable sweat sensors but also presents several challenges related mainly to power supply, stability, biofouling, sensitivity, selectivity, and operation [42].
The review article “Monitor for lactate in perspiration” by Luo et al. [43] focuses mainly on the sweat secreted by the eccrine glands as they spread around the human body. Water is the main component of sweat, but it also contains several different components like lactate, sodium, chloride, and urea. The production mechanism of sweat and its components is complex. Sweat can be collected using textiles or plastic bags. Depending on the location of the human body, the density of eccrine glands varies, so the sweat collection process may vary from minutes to hours. In order to speed up the sweat collection, electrical stimulation can be used. There is no standardized procedure for sweat storage. However, this may lead to changes in sweat composition as the water evaporates from sweat samples. Currently, the two main methods for monitoring sweat lactate level in real-time are dehydrogenase and electrochemical detection methods. Lactate concentration in different body locations may differ but has not been studied. Pathological conditions and muscle fatigue can increase lactate concentration. However, there is no unequivocal answer whether there is a correlation between sweat and blood lactate concentration [43].
Obma et al. [44] in the study “Measurement of sweat lactate levels in exercise and non-exercise activities using capillary electrophoresis system with contactless conductivity detection and cyclodextrin-modified buffer” investigate the changes in lactate levels observed in sweat samples during exercise and non-exercise activities. The lactate in sweat is the product of glucose metabolism. It can be used as an indicator of a person’s health, as abnormal levels of lactate can indicate metabolic disorders. In addition, lactate in sweat can provide information about the athlete’s exertion level, which in turn allows for the identification of optimal training intensities. The capillary electrophoresis (CE) system combined with a contactless conductivity detector C4D was employed in the study to analyze sweat lactate levels in six healthy volunteers (three females and three males). Each individual took part in a 30 min treadmill run and a 30 min sauna session. The validation of the proposed lactate measuring method was performed by following the US-FDA guidelines for the validation of bioanalytical methods. The values obtained during the validation process demonstrate the reliability and accuracy of the method. The mean lactate levels during exercise activity were around four times higher than during the non-exercise activity. This indicates significant improvement in the measurement of the lactate level of the proposed method in comparison to other methods [44].
The paper titled “Multispectral sensor fusion in SmartWatch for in situ continuous monitoring of human skin hydration and body sweat loss” by Elena Volkova and colleagues [45] introduces a unique multi-wavelength photoplethysmography (PPG) module that is integrated into a Samsung Galaxy Watch Active 2. This innovative setup enhances the existing 535/645 nm LED pair by adding 970 nm and 1450 nm infrared LEDs, utilizing 1.5 mm square germanium photodiodes. It features a tailored LED-detector spacing of 3.5–5.5 mm, specifically designed to detect changes in water absorption linked to sweating and skin hydration [45].
The core dataset was gathered from a treadmill study involving 19 participants who completed 103 indoor 5 km runs. This included four-channel PPG data (at 535, 940, 970, and 1450 nm) alongside accelerometer and gyroscope readings, all sampled at 25 Hz. A color-changing paper sticker placed under the watch provided a reliable reference for the initial appearance of sweat. Additional lab work involved collecting reflectance spectra (ranging from 450 to 1750 nm) and ultrasound skin-thickness scans from four volunteers, which helped to parameterize a GPU-accelerated seven-layer Monte-Carlo skin model [45].
The signals were divided into 3.5 min segments, from which 642 time- and frequency-domain features were extracted using Generalized Morse wavelets (via ssqueezepy) and standard statistical measures (like mean, median, skewness, kurtosis, and trend slope). These features were then processed through LightGBM gradient-boosted trees, with SHAP analysis used to rank their importance. A total of twenty-three staggered binary classifiers (comparing start-of-run to end-of-run) were trained using 4-fold cross-validation, with the evaluation focusing on classification accuracy and physical consistency [45].
When the two windows were at least 15 min apart, the models achieved an accuracy greater than 0.70. The most significant predictor was the monotonic slope of the 1450 nm channel, which aligned with Monte-Carlo forecasts and corresponded closely to the sticker-based ground truth within a ±2 min margin. Further validation was provided by the strong overlap between simulated and in vivo reflectance spectra across different subjects. A model was considered “good” if it (i) accurately detected the onset of sweat film with at least 70% cross-validated accuracy, (ii) displayed the expected trend at 1450 nm, and (iii) operated in real-time on a watch or GPU hardware [45].
The pilot study titled “Differential patterns of sweat and blood lactate concentration response during incremental exercise in varied ambient temperatures” [46] by Naoya Takei, Takeru Inaba, Yuki Morita, Katsuyuki Kakinoki, Hideo Hatta, and Yu Kitaoka aimed to investigate whether a real-time sweat lactate patch could accurately reflect traditional blood-lactate behavior. This was tested with six highly trained runners who performed identical step-tests in both 20 °C and 30 °C conditions. Blood samples were collected at the end of every three-minute stage using a hand-held analyzer (Lactate Pro 2, Arkray, Inc., Kyoto, Japan) and were compared with continuous readings from a Bluetooth-enabled microfluidic sweat-lactate sensor (Grace Imaging, Inc., Tokyo, Japan) worn on the upper arm. For, Inc., Kyoto, Japan sweat, the last 30 s of each stage were averaged; the sweat lactate threshold was defined by the first sustained rise above baseline, while the blood lactate threshold was determined from a log–log transformation of the blood curve. Statistics were managed using GraphPad Prism v10.2.2, which included Shapiro–Wilk normality checks, Wilcoxon alternatives, two-way repeated measures ANOVA (velocity × temperature) with Tukey post hoc tests, and Pearson correlations. The heat increased blood lactate levels at speeds of 14–18 km/h but did not change the blood lactate threshold speed. However, it did accelerate sweat-lactate kinetics, reducing the sweat lactate threshold by about 1.7 km/h (p < 0.05). The two fluids showed a correlation in temperate air (r = 0.49, p < 0.001) but diverged at 30 °C, and the two lactate threshold velocities never matched up. The study’s “goodness” was assessed through traditional significance tests and practical interpretability, concluding that while the sweat sensor serves as a reasonable metabolic proxy in cooler environments, it loses accuracy in hotter conditions [46].
A representative sweat-lactate study demonstrates recent progress in the non-invasive identification of the anaerobic threshold. Seki et al. developed a flexible patch for real-time sweat-lactate monitoring, incorporating a PET-based printed three-electrode array coated with lactate oxidase, a Prussian-blue transducer, and a 15 µm UV-cured hydrogel. The device was integrated with an on-board potentiostat and a Bluetooth Low Energy system-on-chip, enabling voltage and temperature data to be recorded at 1 Hz and transmitted continuously to a smartphone during exercise [46].
The system was evaluated in 42 patients with cardiovascular disease and 23 healthy volunteers performing incremental RAMP cycling tests. The patch was positioned on the forehead in the patient group and on the upper arm in the control group. Sweat-lactate measurements were collected continuously, while capillary blood samples were obtained every two minutes and analysed using a Lactate Pro 2 device. Breath-by-breath gas-exchange analysis was additionally performed to determine the first ventilatory threshold (VT1) [46].
The sweat-lactate threshold (sLT) was defined as the first significant increase above baseline and detected using Change Finder, a two-stage SDAR-based outlier and change-point detection method. For comparison, the blood-lactate threshold (bLT) was determined from log–log plots, whereas VT1 was identified using three established gas-exchange criteria [46].
A statistical evaluation was conducted in R 3.6.3 that included Pearson correlations, Bland–Altman agreement, least squares regression, and univariable logistic modeling for nonresponse cases, focusing on key predictors like NYHA III and low peak VO2. The sLT measurements closely followed the bLT readings (with a correlation of r = 0.92 and a mean bias of −4.5 W) and showed a moderate correlation with VT1 (r = 0.71, bias +2.5 W). Notably, there was no fixed or proportional bias for bLT, which confirms that the patch serves as a reliable real-time indicator of the anaerobic threshold, as long as sufficient sweating occurs. A device run was considered “good” if it produced a detectable sLT that aligned with bLT within ±5 W and demonstrated a correlation greater than 0.9 without bias—this standard was achieved by all participants who were sweating [46].
The study by Gao et al., titled “Molecularly Imprinted Polymer-Based Electrochemical Sensors for Amino Acid Detection: Towards Wearable Sensing” [47], explores the application of MIP-based sensors for the detection of amino acids in sweat because sweat is a biofluid that is increasingly valued for its diagnostic capability to measure amino acids, metabolites, hormones, and drugs. The amino acid profiling through sweat offers a non-invasive pathway to detect and monitor diseases through systemic metabolic changes.
Molecularly imprinted polymers were developed to selectively detect amino acids through synthetic recognition material that acts as a natural receptor. They are formed by polymerizing monomers around a template molecule, creating complementary binding cavities after template removal, allowing selective “lock-and-key” rebinding of target analytes. The advancements in MPIs have provided chemical and thermal stability, long term reliability, and low-cost production when compared with enzymes and antibodies. the application needs have also defined the synthesis strategies such as sol–gel processes for surface-imprinted porous structures, precipitation/emulsion methods for uniform particles, and bulk free-radical polymerization for electrode integration. Other advancements include methacrylic acid, vinyl imidazole, and 4-vinylbenzoic acid for selective recognition [47].
Electrochemical MIP-based amino acid sensors rely on a molecular recognition event being converted into an electrical signal through transduction methods. One of these methods is EIS, which enables sensitive detection by measuring changes at the electrode–electrolyte interface to achieve picomolar-level detection in some amino acid sensors. DPV is another widely used method to detect trace analytes in complex biological fluids like urine and serum. Similarly, the SWV technique offers quick data measurements in reversible systems by comparing forward and reverse currents. In contrast, OECTs amplify the ionic signals into strong electronic outputs to enable low-voltage, biocompatible, and highly sensitive detection [47].
Sensor fabrication involves efficient combination of MIPs with electrodes through ex situ methods or in situ polymerization to develop a stable MIP film on the electrode surface. Sensor performance is based on substrate materials such as PDMS, PU, and SEBS, which must match skin mechanics for wearable use. Deployment of nanomaterials such carbon nanotubes, graphene, gold nanoparticles, and MOFs improve conductivity and surface area. For real-world deployment, microfluidic systems and iontophoresis are used to manage and stimulate sweat collection. One of the recent applications of MIP-based monitoring of multiple amino acids is “NutriTrek”, which is a set of LIG-based MIP electrodes that integrate iontophoresis for sweat induction, temperature compensation, onboard electronics, and wireless data transmission in a smartwatch-like device [47].
The central challenge highlighted by the study is the issue of physiological variability that is caused by differing sweat composition and secretion rates across individuals. Additional issues include analyte mixing in sweat, pH and electrolyte interference affecting binding and electrochemical readout, and biofouling or signal drift during prolonged skin contact. Similarly, Amino acid imprinting can produce heterogeneous binding sites, batch-to-batch variability, and potential damage due to challenges on MPI fabrication. However, future advancements are expected in the standardized production approaches, controlled electro-fabrication methods, and computational optimization of polymer design. The field is also experimenting with the integration of AI in MIP sensors to reduce noise and dimensionality in wearable data for successful transition towards multi-analyte physiological signatures [47].
In a notable study titled “Sweat lactate sensor for detecting anaerobic threshold in heart failure: a prospective clinical trial (LacS-001)” [48], researchers Yoshinori Katsumata, Yuki Muramoto, and their team enrolled fifty patients with NYHA I–II heart failure. These patients underwent incremental ergometer tests while wearing a flexible, enzyme amperometric sweat-lactate patch that transmitted data at 1 Hz via Bluetooth. A perspiration-rate meter also tracked local sweat flow. The innovative patch features a three-electrode PET chip coated with lactate-oxidase/Prussian-blue chemistry, connected to an on-board potentiostat. The accompanying mobile app captures signals ranging from 0.1 to 80 µA, applies a 13 s moving average and baseline-zero correction, and displays real-time lactate curves. After a quick 2–3 min saline calibration, the sensor was placed on the forehead (where sweat production is typically higher in heart failure patients), and exercise intensity was gradually increased by 10 or 15 W per minute until the participants reached voluntary fatigue. Breath-by-breath gas analysis was used to determine the ventilatory threshold (VT) reference [48].
The researchers defined the sweat-lactate threshold (sLT) as the first noticeable upward spike in the zero-corrected trace. Three independent raters achieved an inter-class correlation of 0.701 for sLT and 0.838 for clinical VT (VTcp). Among the 32 patients whose VT could be clearly identified, sLT and VT showed a correlation of r = 0.651 (CI 0.39–0.82, p < 0.001), with a Bland–Altman bias of −4.9 ± 15 W—successfully meeting the predefined criteria of SD ≤ 15 W and r ≥ 0.6. Additional analyses confirmed similar correlations with standard clinical VT readings and reported no device-related adverse events; two exercise-induced arrhythmias were determined to be unrelated to the patch. Therefore, a run was considered “good” when the automatically recorded sLT aligned with VT within ±15 W and no safety concerns were noted [48].
The study titled “Anaerobic threshold using sweat lactate sensor under hypoxia” [47] by Hiroki Okawara and colleagues dives into the potential of a flexible sweat-lactate patch to non-invasively monitor the anaerobic (ventilatory) threshold during exercise in simulated high-altitude conditions.
In this research, twenty healthy male participants took on two ramp-cycling tests—one in normal oxygen levels (FiO2 20.9%) and the other in a controlled low-oxygen environment (FiO2 15.5%, roughly equivalent to 2500 m above sea level). While the patch was securely attached to their upper arms, it transmitted data at a rate of 1 Hz via Bluetooth. A nearby perspiration meter recorded sweat rates at the same frequency, an ear-lobe Lactate Pro 2 analyzer provided minute-by-minute blood lactate readings, and a breath-by-breath gas system offered references for the ventilatory threshold (VT) [49].
The disposable PET chip features a three-electrode array coated with lactate oxidase and a Prussian blue transducer. After a quick calibration in saline lasting 2–3 min, it produces outputs ranging from 0.1 to 80 µA with a sub-second response time. The accompanying mobile app processes this data using a 13 s moving average and zero-baseline correction to create real-time lactate traces. The sweat-lactate threshold (sLT) was identified as the first consistent rise in the corrected signal, with three reviewers independently confirming its location; the VT was determined based on three standard gas-exchange criteria [49].
During the hypoxia tests, the sLT demonstrated strong reliability within and between observers (ICC 0.782 and ICC 0.933, respectively), surpassing the repeatability of blood lactate thresholds. There was a significant correlation between sLT and VT (r = 0.70, p < 0.01), and a Bland–Altman analysis indicated a minimal bias (−15.5 s on a 25 Wmin−1 ramp). A test was deemed successful if the sLT and VT were within ±15 W (approximately 30 s) of each other, and if the ICC exceeded 0.6—criteria that all hypoxic trials met. The statistical analysis was conducted using IBM SPSS 27, with no machine learning models involved [49].
The systematic review titled “Recent Studies on Smart Textile-Based Wearable Sweat Sensors for Medical Monitoring” [36] by Asma Akter, Md Mehedi Hasan Apu, Yedukondala Rao Veeranki, Turki Nabieh Baroud, and Hugo F. PosadaQuintero provides a detailed review of 35 primary research papers published between 2014 and 2024, all of which incorporate flexible sweat-sensing elements right into the fabric [50].
Most of the prototypes can be categorized into four main hardware types: electrochemical, biosensor, optical colorimetric, and microfluidic. These are implemented using various methods, such as conductive-thread electrodes, graphene or metal-nanostructured yarns, silk-derived carbon textiles, Janus hydrophilic/hydrophobic fabrics, self-pumping microfluidic patches, or antenna-based microwave resonators [50].
Since this paper serves as a survey, its “dataset” consists of the experimental results from those 35 studies, which include real-time data streams of pH, glucose, lactate, ions, cortisol, and even drug levels, collected at frequencies ranging from 0.1 to 10 Hz through textile microchannels. In Table 1 of the review, the papers are organized by sensor type, transduction mechanism, and target analyte, while Figure 2 illustrates that electrochemical designs are currently leading the research landscape [50].
The authors categorize signal-conditioning strategies into three main types: (i) ion-selective potentiometry, (ii) enzyme amperometric currents, and (iii) optical hue/intensity shifts. To improve fluid handling, they utilize super-hydrophobic stacks, Janus fabrics, and self-healing hydrogels, which help keep sweat flowing while minimizing contamination. The fabrication methods vary, including laser pyrolysis for SilkNCT carbon textiles, screen-printing, and 3-D knitting. Many studies combine their raw signals with on-device machine learning or ensemble models for predictive health assessments, a trend that the review strongly supports for the next generation of smart garments [50].
Throughout the research, a textile patch is considered to perform well if it can provide a response in under a minute, has a broad linear range and high selectivity, and maintains repeatability even after 100 or more wash-and-stretch cycles, all while ensuring wearer comfort. When machine learning is applied, the authors report an accuracy of at least 90% or comparable F1/ROC-AUC scores, along with low inference latency. However, they highlight that reliability and calibration drift during daily use remain significant challenges that need to be addressed [50].
The article titled “Sweat Detection Theory and Fluid-Driven Methods: A Review” [51] by Haixia Yu and Jintao Sun provides a detailed review of three decades of research on how wearable devices gather, transport, and analyze sweat in real time. The authors start by categorizing the sensor landscape into three main types—fluorescent, electrochemical, and colorimetric—each capable of measuring important biomarkers such as chloride, sodium, glucose, or lactate directly on the skin. While electrochemical patches lead the way in commercial prototypes due to their impressive sensitivity, the review highlights that optical methods are rapidly advancing, with ratio metric dyes and integrated phone-camera readouts pushing detection limits down to below 0.1 mmolL−1 [51].
Since raw eccrine sweat only trickles out in nanoliters per minute, fine-tuning the fluid pathway is just as crucial as the chemistry involved. The paper highlights three passive “pumps” that are now the backbone of most epidermal chips. Capillary microchannels, etched in PDMS or paper, draw sweat forward without needing electronics and can be controlled with capillary-bursting valves or swellable SAP plugs to create time-stamped samples for later mass-spectrometry analysis. Hydrogel osmotic disks preload a salt gradient to pull perspiration into the device even when users are at rest, tripling the analyte yield compared to dry pads and serving as a biocompatible interface for in-gel electrochemical sensing. Lastly, evaporation-driven micropumps take inspiration from plant transpiration: a hexagonal array of 250 µm pores significantly increases water loss and maintains flow rates around 0.2 µLmin−1—perfectly aligned with human sweating—while allowing for fine adjustments through pore count, shape, or optional thin-film heaters [51].
The datasets we are talking about are more like design case studies than extensive shared collections. The authors gather information on flow-rate curves, detection limits, linear ranges, and wash-cycle durability from over 35 prototypes they have cited. When it comes to signal processing, it is all about the application: amperometric currents usually get low-pass filtered and temperature-compensated on flexible PCBs, while optical systems depend on smartphone color-space algorithms or mini-spectrometers to adjust for ambient light. Although machine learning has not become standard yet, the review highlights some promising early work on image classifiers for phones and on-device anomaly detection, which could pave the way for “sense-and-decide” garments that operate autonomously [51].
The authors emphasize that evaluation relies equally on chemistry, fluidics, and wearability. Acceptable patches need to keep errors within clinical limits (≤5% for electrolytes, ≤10% for metabolites), maintain continuous flow for at least 1 h during regular activities, endure >100 stretch or wash cycles, and function without the need for external pumps or bulky optics. There are still some persistent challenges, like the longevity of reagents, the stability of stretchable electrodes, and self-powered electronics. While biofuel cells and NFC harvesting are starting to emerge in these areas, they are still in their early stages [51].
The mini-review titled “Recent Status on Lactate Monitoring in Sweat Using Biosensors: Can This Approach Be an Alternative to Blood Detection?” [52] by Leonardo Messina and Maria Teresa Giardi provides a detailed review of 21 publications, with 15 of them focusing on device-centric technologies for sweat-lactate sensing. It highlights four main types of sensors: the classic enzyme-amperometric patches that use lactate oxidase or dehydrogenase on screen-printed or nanoporous electrodes; nanozyme or metal-oxide electrodes (like NiOOH/NiOx, NiCo layered double hydroxides, MXCeO2, and CeO2−MoS2−Au) that directly catalyze lactate; molecularly imprinted polymer (MIP) layers that swap out biorecognition for templated pores; and the innovative optical or microfluidic textile threads that change color or adjust microwave resonance [52].
Since this article is a review, the “data” it presents are the analytical figures from those studies: sensitivities reaching up to 80 µAmM−1 cm−2, linear ranges spanning from 0.1 to 100 mM, and detection limits around 15 µM for Ninanozyme electrodes (as shown in Table 1). The authors categorize signal-conditioning into several methods, including mediator-based amperometry (e.g., Prussian-blue and ferrocene), nanozyme redox pairs, MIP electropolymerization, and diffusion-limiting membranes that help manage pH and temperature fluctuations [52].
When it comes to performance evaluation, we typically look at three key factors: (i) analytical metrics, (ii) how well the material holds up after at least 100 wash-or-stretch cycles, and (iii) its physiological relevance. Interestingly, about two-thirds of the studies still depend on traditional bench chemistry, but a few are making strides in correlating with physiological data. The standout report shows a strong correlation (r ≈ 0.95) between sweat and venous lactate, while others struggle to find any significant connection, highlighting an ongoing debate about bio-equivalence. In this review, we define a sensor as “good” if it stays within clinical error limits (≤5% for electrolytes, ≤10% for metabolites), provides a response in under 1 min, and can withstand daily use. To bridge the gap between sweat and blood analysis, we suggest using AI-assisted postprocessing, as demonstrated by the EU H2TRAIN edge–cloud AI continuum project, which aims to integrate graphene-oxide sensors with cloud-based inference [52].
The article titled “Machine Learning Enables Reliable Colorimetric Detection of pH and Glucose in Wearable Sweat Sensors” [53] by Lijun Zhou, Sidharth S. Menon, Xinqi Li, Miqin Zhang, and Mohammad H. Malakooti discusses innovative cotton-textile patches that change color when they come into contact with sweat. It also introduces a smartphone and machine learning system that translates these color changes into precise measurements of pH (ranging from 4 to 10) and glucose levels (from 0.03 to 1 mM).
To create each patch, the researchers spin-coat indicator chemistries onto 10 mm squares of combed cotton. For pH sensing, they use a mix of bromocresol green and methyl orange, while glucose detection employs two different dye chemistries: TMB (which shows a blue scale) or KI (which appears brown), paired with the classic glucose-oxidase and horseradish-peroxidase enzyme combination. When droplets of artificial sweat are applied, the patches exhibit visible color changes that stabilize in about 5 min for pH, 3 min for TMB-glucose, and 5 min for KI-glucose patches. Impressively, these substrates remain effective even after five wash cycles or three weeks of refrigeration [53].
To ensure consistent photography, a lighting box is used with an iPhone 13. A Python script then crops the images, extracts RGB values, and, importantly, divides each channel into five distinct regions (creating a 15-feature vector) before the learning process begins. The researchers tested three classifiers: LDA, SVM, and a small CNN. With the 15 feature map, LDA boosts pH accuracy from 75% to around 90%, while SVM enhances TMB and KI-glucose detection to approximately 95% and 90%, respectively. The CNN performs well, reaching close to 90% accuracy on the larger TMB dataset but falls short on the others. Five-fold cross-validation confirms mean accuracies between 90% and 95%, with a standard deviation of less than 5%, and the confusion matrix shows very few misclassifications [53].
The authors consider a run to be “good” when the edge-side classifier maintains an accuracy of 90% or higher, the patch color stabilizes within five minutes, and the passive cotton sensor can handle routine use. Following these criteria, the dual biomarker wrist/neck patch accurately indicated a pH of about 7 and glucose levels below 0.2 mM in healthy volunteers. This research highlights the potential of low-cost, battery-free color textiles combined with lightweight machine learning as a promising approach for at-home metabolic screening [53].
The article titled “Wireless wearable wristband for continuous sweat pH monitoring” [52] by Pablo Escobedo and colleagues presents an innovative wristband that is about the size of a watch. This device is built around a microfluidic cloth analytical device (µCAD) that directs sweat through a 2.5 mm cotton strip onto a 3.6 mm sensing disk, which is coated with a covalently bound vinyl-sulfone acidochromic dye (AD-VS1). It features a U-shaped absorbent pad made from Flexicel that acts as a passive pump, enabling a continuous flow for over 1000 min at a rate of 0.01 µLs−1. A 150 mAh Li-ion battery powers a PIC12LF1822 microcontroller, a Hamamatsu S11059-02DT digital color sensor, a synchronized white LED, and a Bluetooth-LE connection, all neatly housed in a 3-Dprinted case [54].
When calibrated with pH buffers ranging from 4 to 10, the hue (H) coordinate in HSV space demonstrated a Boltzmann fit with R2 = 0.996 for the stand-alone µCAD and R2 = 0.997 for the complete wristband. This calibration effectively covers the sweat-relevant pH range of 6.0–8.0, with coefficients of variation between 3.6% and 6%. The device stabilizes its readings in about 90 s, thanks to the absorbent pump. Processed hue values are sent to an Android app once per second, and there is no need for machine learning—just linearization and two-parameter Boltzmann inversion are sufficient for real-time pH retrieval. A treadmill test validated its performance in the field: for the first 10 min, sweat did not wet the µCAD, but as lactic acid concentration decreased, the pH rose, with the wristband accurately tracking the change within ±2% error compared to a laboratory pH meter [54].
The evaluation hinges on three key factors: analytical fidelity, durability, and autonomy. The authors consider a sensor to be “good” if it (i) remains within ±0.2 pH units (about a 2% error) compared to bench instrumentation, (ii) maintains precision below 6% across the 6–8 pH range, (iii) provides a response time of at least 90 s and can handle hours of continuous flow, and (iv) operates for over 48 h between charges. The prototype meets these criteria with an impressive estimated battery life of 2.63 days in non-continuous mode [54].
The review titled “Advancements in Wearable Technology for Monitoring Lactate Levels Using Lactate-Oxidase Enzyme and Free-Enzyme Analytical Approaches” [55] by Sara Moradi, Ali Firoozbakhtian, Morteza Hosseini, and their team explores the evolution of lactate monitoring from traditional invasive blood tests to innovative non-invasive epidermal platforms. It highlights over fifty research devices developed in the past decade, categorizing them first by their signal transducers—colorimetric patches that change color; electromagnetic resonators that adjust permittivity in response to lactate; and electrochemical strips measuring the hydrogen peroxide byproduct of lactate oxidase (LOx)—and then by their substrates: textiles and threads integrated into clothing; ultra-thin PDMS or other polymers applied to the skin; porous membranes; paper microfluidics; and temporary tattoo decals [55].
Since the reviewed article is a literature survey, it does not present new experimental data but synthesizes analytical performance metrics reported for existing wearable lactate-sensing prototypes. These include colorimetric limits of detection as low as 0.07 mM, electrochemical sensitivities of up to 90 nA mM−1 mm−2, and linear detection ranges covering physiologically relevant sweat-lactate concentrations. The reviewed studies also include a molecularly imprinted Ag-nanowire sensor with a detection limit of 0.22 µM and stable electrochemical performance after 200 bending and twisting cycles [55].
Signal conditioning is tailored to specific applications. For instance, color pads utilize smartphone images and, more frequently, lightweight classifiers like LDA or SVM to adjust for ambient light. Impedance tags incorporate resonant circuits that a phone can wirelessly interrogate, while amperometric chips use Nafion or sulfonated copolymer membranes to filter sweat, eliminate motion artifacts through differential referencing, and provide current traces at 1 Hz or faster. Some research teams are now combining lactate readings with sweat rate meters, allowing for the conversion of concentration into flux, while others are sending data to edge microcontrollers for drift correction [55].
The review highlights that authors evaluate success using a mix of analytical and practical metrics: an error margin of ±10% from accepted clinical limits, a response time of under five minutes, stability for at least one hour of continuous flow, and mechanical integrity after at least 100 wash or stretch cycles. A patch is considered “good” if it meets these criteria while being battery-free (colorimetric), self-powered by a biofuel cell, or fitting within the coin-cell budget of a Bluetooth module. The remaining challenges—enzyme shelf life, sensitivity to pH and temperature, and the still-uncertain relationship between sweat and blood lactate—are identified as the next areas for AI-assisted calibration and materials design [55].
The article titled “A wearable sensor for the detection of sodium and potassium in human sweat during exercise” [56] by Paolo Pirovano, Matthew Dorrian, Akshay Shinde, Andrew Donohoe, Aidan J. Brady, Niall M. Moyna, Gordon Wallace, Dermot Diamond, and Margaret McCaul builds on their previous work with the SwEatch watch-type platform, enhancing it to monitor two electrolytes simultaneously. Their innovative redesign features a mirrored dual-macro-duct microfluidic cassette that passively draws sweat through cotton threads, paired with solid-contact ion-selective electrodes—one for sodium (Na+) and the other for potassium (K+)—all housed in a single 3-D-printed unit. Both electrodes utilize screen-printed carbon tracks and drop-cast PVC membranes; the transduction layer can be formed either from electrode-deposited PEDOT or from a solution-processable poly(3-octylthiophene) (POT) mixed directly into the membrane cocktail, eliminating a lengthy plating step. A pipetting robot automates the membrane casting–reducing defect rates by four- to fivefold—while the integrated Shimmer electronics board captures the potentiometric signal, digitizes it at 1 Hz, and transmits the data via Bluetooth to a laptop running Consenys software, version 1.5.10 [56].
Laboratory calibrations in concentrations ranging from 10−4 to 10−1 M for NaCl and KCl show nearly Nernstian slopes—around 56 mV per decade for both ions using the POT formulation. The selectivity coefficients are logKpotNa,K ≈ −2.7 and logKpotK,Na ≈ −2.1, indicating that cross-interference is minimal at physiological levels. During two-hour soaks in three synthetic sweat cocktails, the median drift remains within ±1.5 mVh−1. Neither acidic conditions (pH 4.5) nor divalent ions like Ca2+ and Mg2+ disrupt the baseline. For on-body validation, a trained volunteer undergoes a 90 min cycling session; sweat reaches the electrodes after about 8 min, with Na+ increasing from roughly 1.9 to 3.0 mM before dropping again, while K+ peaks at around 7 mM towards the end of the ride. The pre- and post-exercise four-point calibrations are virtually identical, confirming stability in situ. The team considers the device successful if it maintains Nernst-like sensitivity, drifts less than 2 mVh−1, withstands motion artifacts, and provides continuous data throughout exercise—all of which were achieved in this pilot study [56].
The paper titled “A wearable conductivity sensor for wireless real-time sweat monitoring” [57] by Guangning Liu, Tugrul Kaya, and their team describes the transformation of a standard wristwatch into a compact sweat conductivity meter. The sensing mechanism consists of two silver wires spaced 3 mm apart within a narrow 0.64 mm-ID Teflon micro-duct. A soft PDMS block, shaped to match the watch bezel, sits snugly on the forearm and features a 1.2 mm hole that allows eccrine sweat to flow into the duct and contact the wires. Powered by a 100 kHz, ±1 V relaxation oscillator, the wire pair functions as a two-electrode impedance cell, with conductance indicating ion concentration. This architecture makes the device well-suited for monitoring hydration and electrolyte levels during exercise [57].
To assess performance, the researchers first created artificial sweat with total salt concentrations ranging from 13 to 131 mM (using a mix of NaCl, KCl, urea, and lactic acid in EU-standard ratios). They injected each dilution into the duct and recorded the resulting voltage-divider output using an onboard PIC16F1823 ADC, which streamed the data via Bluetooth to a Windows phone. The conductance values were then correlated to concentration through a linear calibration against a Horiba LaquaTwin reference probe, achieving an impressive R2 = 0.98 and an RMSE of 0.023 mScm−1 after correcting for a cell constant of 40 cm−1. Following this, human trials were conducted: four volunteers cycled for 90 min at about 80% VO2max while wearing the watch. Sweat reached the electrodes within 7 to 20 min, stabilizing at conductance values between 3.6 and 5.6 mScm−1. Notably, a gradual increase in conductance after 10 min reflected progressive dehydration when no fluids were consumed [57].
The evaluation focused on three key checkpoints: (i) electrochemical robustness—EIS showed that operating at 100 kHz effectively reduces double-layer capacitance and electrode polarization; (ii) analytical agreement—the determination coefficient of 0.98 compared to the commercial meter; and (iii) practical usability—the duct was consistently filled, kept a drift of less than 2 mVh−1 during two-hour soaks, and provided uninterrupted 1 Hz telemetry throughout the exercise. A run was considered “good” whenever these three criteria were met, demonstrating that a two-wire impedance cell paired with a Bluetooth microcontroller can reliably offer real-time insights into sweat osmolality during actual workouts [57].
The article titled “Wearable and Flexible Electrochemical Sensors for Sweat Analysis: A Review” [58] by Fupeng Gao, Chunxiu Liu, Lichao Zhang, Tiezhu Liu, Zheng Wang, Zixuan Song, and their colleagues takes us on a journey through the evolution of sweat analysis technology, starting from the first tattoo-lactate patch introduced in 2013 to the advanced multiplexed, self-powered microfluidic platforms we see today. This review serves as a comprehensive survey, cataloging over 250 primary papers that detail various devices, including enzyme-amperometric strips for glucose and lactate; solid contact ion-selective electrodes for sodium, potassium, or pH levels; SWASV bismuth films for detecting heavy metals; and innovative textile threads that integrate impedance, potentiometry, and colorimetry into a single garment. These technologies are now being utilized for hydration coaching, metabolic screening, cystic fibrosis testing, and real-time sports analytics [58].
Rather than presenting new experimental data, the authors focused on gathering performance metrics—like detection limits reaching sub-micromolar levels, Nernstian slopes close to 56 mVdec−1, response times under 5 min, and gauge factors exceeding 1000—from existing studies. They organized this information into categories based on transduction methods, structural forms, and application areas. The review also discusses various signal-processing techniques, ranging from basic moving-average and differential-referencing filters to cutting-edge on-patch machine learning models that help correct drift and analyze multiplex streams. The authors predict that “big-data algorithms based on machine or deep learning” will soon become essential for achieving autonomous and personalized sweat analytics [58].
The evaluation involves multiple metrics: time (latency or response) appears in 31% of reports, system cost in 22%, energy in 14%, accuracy in 17%, and throughput in 7%. Most studies examine at least three of these factors rather than focusing on just one. Success is usually defined by a chemical error within ±5–10% of clinical limits, a response time faster than 5 min for biochemical pads or <100 ms for mechanical gauges, durability exceeding 100–1000 wash-or-stretch cycles, and stable telemetry during hours-long trials. These benchmarks, together with reliable data integrity from microfluidics and on-board calibration, form the criteria by which the review classifies a platform as “good” and mature for large-scale physiological studies [58].
The article titled “Smartphone-Based Wearable SweatGlucose Sensing Device Correlated with Machine Learning for Real-Time Diabetes Screening” [59] by Nadtinan Promphet, Nadnudda Rodthongkum, and their team presents an innovative body-strap platform. This device combines a Prussian-blue/carbon-nanotube-cellulose-nanofiber (PB/CNTCNF) electrochemical strip with a coin-cell-powered Bluetooth potentiostat and an Android app, enabling sweat-glucose monitoring on the abdomen or back. The CNT-CNF nanocomposite enhances conductivity and enzyme loading, while cyclicvoltammetric electrodeposition of Prussian blue on the composite achieves near-Nernstian H2O2 reduction. A chitosan overcoat helps maintain glucose-oxidase (GOx) activity [59].
Using machine learning (specifically, the XGBoost regressor with SHAP interpretation), the researchers analyzed 85 fabrication runs to fine-tune three key variables: the percentages of CNT and CNF, and the number of PB deposition cycles. They identified an optimal composition of 0.4% v/v CNTs, 0.125% w/w CNFs, and 10 PB cycles, which increased the amperometric current by approximately 20% and accounted for 86% of the variance (R2 = 0.86, RMSE = 0.18 µA) in response to 1 mM H2O2 [59].
The calibrated strip can detect glucose levels linearly from 0.1 mM to 1.5 mM (R2 = 0.997) with a limit of detection (LOD) of 0.1 mM—sufficient to identify the 0.3 mM sweat glucose threshold that signals diabetes risk. In on-body trials with three healthy volunteers, post-meal sweat-glucose levels peaked between 0.15 and 0.19 mM, mirroring the increases seen in finger-prick blood-glucose measurements. Remarkably, the chitosan/GOx layer maintained 85% of its signal even after 21 days at 4 °C [59].
A session is considered “good” when (i) the app shows an accuracy of over 90% compared to benchtop calibration, (ii) the 120 s amperometric run finishes without any Bluetooth interruptions, and (iii) the coin-cell board operates for the intended 10 to 15 min needed to saturate the cotton sweat pad. The authors suggest using the strap as a painless screening tool that can help identify users with sweat levels at or above the 0.3 mM threshold, indicating the need for further blood tests [59].
The paper titled “Machine Learning-Powered Wearable Interface for Distinguishable and Predictable Sweat Sensing” [60] by Zhongzeng Zhou, Tailin Xu, Xueji Zhang, and colleagues introduces an innovative laser-induced-graphene (LIG) patch that comfortably adheres to the skin, covered by a soft PDMS microfluidic layer. This patch streams differential-pulse-voltammetry (DPV) data through a coin-cell Bluetooth potentiostat to an Android app. It features two nonenzymatic working electrodes—MWCNT/LIG and carbonblack/LIG—sharing a printed Ag reference. Typically, their overlapping oxidation peaks make it tricky to detect tyrosine and tryptophan directly. However, this study identifies four explainable features (the peak currents and potentials from both electrodes) that feed into a two-stage machine learning pipeline. First, a k-nearest-neighbor classifier organizes each of the 285 samples into nine “mixture × pH” categories with an impressive 99.3% cross-validated accuracy. Then, a backpropagation neural network regressor takes those same features and translates them into continuous estimates for tyrosine, tryptophan, and pH, achieving an R value greater than 0.99 on the validation set, with mean absolute errors of 2.8 µM for tryptophan and 5.4 µM for tyrosine [60].
Bland–Altman plots indicate that there is hardly any bias when the model is tested with new sweat and PBS data, and HPLC backs this up with a strong correlation (r ≈ 0.98) between the measurements taken on the patch and those done at the bench. Mechanical tests involving 100 bend–twist cycles show that the DPV signals remain stable, while the hydrophilic microfluidic system provides a consistent flow ranging from 0.1 to 2 µLmin−1. Additionally, Bluetooth telemetry maintains a steady rate of 1 Hz during hour-long cycling trials. Two volunteers participated in cycling sessions over consecutive weeks, both with and without amino-acid supplementation. The wearable device recorded higher peaks of tyrosine and tryptophan after supplementation, along with a slight drop in pH, and these differences were statistically significant (p < 0.05). A run is considered successful if the classification accuracy stays above 98%, regression errors are within ±10 µM, pH RSD is below 2%, and the strap functions for the 10–15 min required to wet the cotton pad while ensuring uninterrupted wireless transmission—criteria that were all successfully met in this study [60].
The paper titled “Skin-Attachable, Stretchable Electrochemical Sweat Sensor for Glucose and pH Detection” [61] by Seung Yun Oh, Soo Yeong Hong, Yu Ra Jeong, Junyeong Yun, Heun Park, Sang Woo Jin, and others introduce an innovative epidermal patch made entirely of nanomaterials. This patch is capable of measuring sweat glucose and pH levels in real time, all while withstanding up to 30% biaxial strain and countless body movements. At its core, it features a conductive backbone made from a percolated film of 2-D gold nanosheets (AuNS), which is vacuum-filtered through a PDMS stencil and set within an elastomer substrate. To enhance its conductivity and durability, a five-bilayer CNT coating is applied. The device incorporates two different chemistries: a CoWO4/CNT nanocomposite for non-enzymatic glucose oxidation and an electropolymerized polyaniline/CNT layer for pH sensing that responds to protons. Both are referenced to an on-board Ag/AgCl solid reference created from Ag-nanowire ink and a PVB/NaCl buffer. Finally, the entire array is encased in a sticky Silbione material, allowing it to stick securely—even on wet, flexible skin—making it suitable for extended trials without any risk of delamination [61].
In lab tests using phosphate-buffered saline (PBS), the glucose working electrode showed a linear response from 0.05 to 0.30 mM, with a sensitivity of 10.89 µAmM−1 cm−2 and a limit of detection (LOD) of approximately 1.3 µM. Meanwhile, the pH electrode achieved a super-Nernstian slope of 71.44 mVpH−1 across a pH range of 4 to 8. Both channels were resistant to common interferents such as ascorbic acid, uric acid, urea, and acetaminophen, maintaining their performance even after 10 days of storage and 1000 stretch cycles at 30% strain [61].
When worn on the body, the patch filled up with natural sweat in about 8–20 min during a 90 min cycling session. It streamed data at 1 Hz via Bluetooth through a coin-cell potentiostat, tracking post-meal sweat-glucose peaks (0.15–0.19 mM) that closely followed the trends seen in finger-prick blood tests. The pH levels remained stable within ±0.2 units but did dip slightly after intense exercise. After multiple attach–rinse–reattach cycles over 10 h, there was no drift observed; calibration against a commercial kit and pH meter yielded an R2 ≈ 1. A session was considered “good” if it met three key criteria: sensitivity within 10% of bench values, drift < 2 mVh−1, and uninterrupted wireless data transmission for the intended wear period—all of which were achieved in the pilot study [61].
The research titled as “Recent advances in wearable electrochemical sensors for in situ detection of biochemical markers” written by Jiao and Yu [62] explores the guidelines for the integration of core components in wearable electrochemical sensors for biochemical measurements. These systems comprise a flexible substrate made from PDMS, PET, textiles, paper, or hydrogels. Similarly, the sensing module acts as the functional core to recognize the elements that target biomarkers to convert them into measurable electrical signals. The final component is the signal processing unit, which enables amplification, filtering, data interpretation, and wireless transmission, for integration in mobile or cloud-based systems for continuous health monitoring [62].
Sensors analyze a variety of biofluids, including sweat, saliva, tears, and interstitial fluid (ISF). While sweat is the most commonly used fluid due to its easy accessibility, its composition is highly variable and present in low concentrations compared to blood. Along with sweat that offers easy accessibility but high variability, interstitial fluid is also used for biomarker concentrations to measure blood levels for accurate accessible monitoring of biomarkers such as electrolytes, metabolites, amino acids, hormones, and proteins. Saliva and tears provide additional non-invasive alternatives, despite limited use due to sampling challenges. A major scientific challenge in this field is establishing reliable correlations between biomarker levels in these biofluids and their corresponding blood concentrations, as physiological variability and secretion dynamics significantly affect measurement accuracy.
Selectivity in wearable electrochemical sensors is achieved through different recognition strategies. Enzymes are widely used due to their high catalytic specificity, particularly in metabolite detection such as glucose and lactate. However, their stability is limited under varying environmental conditions. Antibody-based immunosensors offer high specificity for proteins and hormones but are often constrained by irreversibility and sensitivity to pH and temperature. Aptamers, which are synthetic nucleic acid sequences, provide improved stability and flexibility in target recognition. Molecularly imprinted polymers (MIPs) serve as synthetic recognition elements that mimic natural antibodies while offering superior chemical stability, low cost, and reusability, making them highly suitable for wearable applications. Additionally, ion-selective membranes enable selective detection of electrolytes by controlling ion transport through polymeric matrices containing ionophores.
Despite significant progress, several challenges still limit the widespread clinical adoption of wearable electrochemical sensors. These include physiological variability in biofluid composition, weak correlation between sweat and blood biomarkers, biofouling of sensor surfaces, signal drift over time, and instability of biological recognition elements. Moreover, inconsistencies in sampling and fabrication processes further affect reproducibility and reliability. Addressing these issues requires improved calibration strategies, antifouling surface engineering, and standardized fabrication techniques.
Overall, wearable electrochemical sensors represent a convergence of materials science, bioengineering, and electronics, enabling continuous and non-invasive health monitoring. The future direction of this field is moving toward integration with artificial intelligence, where multi-analyte signals are analyzed collectively to generate predictive health insights rather than relying on single biomarker thresholds [62].
The article titled “Self-Powered Smart Patch for Sweat Conductivity Monitoring” [63] by Laura Ortega, Anna Llorella, Juan Pablo Esquivel, and Neus Sabate flips the traditional sensor–battery concept on its head: in this case, the paper battery doubles as the sensor. It features two coplanar electrodes—a magnesium foil anode and a screen-printed Ag/AgCl cathode—sandwiching a 0.5 mm glass-fiber wick. When sweat saturates the wick, it acts as the battery’s electrolyte; its ionic conductivity influences the cell’s internal resistance, causing the open-circuit voltage (approximately 1.6 V for 60 mM NaCl) and the power available under a fixed 2 kΩ load to increase steadily with salt concentration [63].
Instead of incorporating external electronics, the authors stack two of these paper cells, channel their DC output directly through an inkjet-printed resistor ladder, and control a single MOSFET. If the gate voltage exceeds 1.2 V—only reached when sweat conductivity surpasses the cystic fibrosis screening threshold of 60 mM NaCl—the MOSFET releases charge into an electrochromic “TEST” icon that changes color with just 40 µC. Additionally, a separate “CONTROL” icon is placed across the battery to confirm that the patch is operational. All tracks are made of inkjet-printed silver on PEN, and the only packaged components are two diodes and the MOSFET, which helps keep costs and electronic waste to a minimum [63].
Datasets include (i) laboratory I–V sweeps of single cells in NaCl standards ranging from 0.5 to 40 mScm−1, which demonstrate a σ−1 relationship with internal resistance, and (ii) 40 completed patches tested with artificial eccrine sweat at concentrations of 48 mM and 60 mM NaCl. The gate-voltage histograms show only a slight overlap; by setting the decision threshold at 1.51 V, we achieve 95% sensitivity and 100% specificity according to the EP12-A2 qualitative-test guideline. Current-interrupt tests reveal a drift of less than 2 mVh−1, and the glass-fiber saturation ensures complete wetting within 10 s of perspiration starting [63].
No machine learning is required—the logic is built-in. A run is considered “good” if (i) the CONTROL icon lights up, indicating battery activation, (ii) the TEST icon changes color only when the gate is at least 1.51 V, and (iii) Bluetooth-free telemetry allows the patch to remain disposable and self-contained. Overall, the entire assay only costs the price of paper, ink, and a coin-sized magnesium stencil [63].
The paper titled “Adhesive RFID Sensor Patch for Monitoring of Sweat Electrolytes” [64] by Daniel P. Rose and colleagues presents an innovative, battery-free RFID patch that adheres to the skin to monitor sweat electrolytes, specifically sodium, along with skin temperature. This data is conveniently read by an Android smartphone using ISO/IEC 15693- compliant near-field communication at 13.56 MHz [65]. The patch features a Melexis MLX90129 RFID/sensing IC mounted on a flexible Cu/polyimide substrate, complete with a tuned loop antenna, an on-board Ag/AgCl reference, and Pd-plated working electrodes that are coated with a Na+-selective PVC membrane. Additionally, optional paper microfluidics help wick sweat through a porous adhesive to the sensors, while Parylene-C encapsulation ensures the electronics are protected for up to a week of wear [64].
In vitro tests with NaCl concentrations ranging from 10 to 90 mM showed a linear calibration on the patch, achieving 96% accuracy at 50 mM, with a response time of about 30 s and stable repeatability across 20–70 mM steps (CV 0.1–0.8%). Stand-alone electrodes demonstrated Nernstian behavior (approximately 57 mV/decade), although the on-patch sensitivity was limited by the ADC capabilities of the RFID chip. The tuning of the antenna (noted by the S11 drop at 13.56 MHz) and energy harvesting were successfully validated, with the smartphone managing configuration and data logging [64].
The evaluation criteria included calibration slope and linearity, accuracy and precision, response time, drift, repeatability, and communication reliability. The platform was rated as “good” when it maintained a Nernst-like response; achieved accuracy within ±5 mM around 50 mM; and had quick response times (30 s), low drift, and dependable RFID communication. Moreover, the architecture is easily adaptable for monitoring other ions such as K+, Cl, Mg2+, NH4+, and Zn2+ [64].

4.5. Motion and Biomechanics Sensing

2025–2026 update: In motion and biomechanics sensing, the field is moving beyond step counting or isolated activity classification toward context-aware movement interpretation that can directly improve other sensing modalities. The most promising direction is the use of biomechanics signals as real-time validity indicators for optical, electrophysiological, and sweat-based readouts, thereby reducing false inference during daily living.
A study, “Development of artificial intelligence edge computing-based wearable device for fall detection and prevention of elderly people” [66], by Paramasivam et al. focuses on detecting falls in elderly people. They collected signals from accelerometers from 120 people, out of which 38 were female and 82 were male. The elderly people were asked to perform different activities such as walking on even and uneven surfaces, lying in bed, falling, and falling from bed. The Finite Impulse Response (FIR) was designed to remove noise from the signals before feeding them into the neural networks. The data were divided into training and testing sets (80/20 split) using stratified sampling to overcome data leaks [66].
Several different deep learning algorithms were employed, such as convolutional neural network (CNN), recurrent neural network (RNN), long short-term memory (LSTM), and gated recurrent unit (GRU). In addition, combined models like CNN-LSTM, RNN-LSTM, and GRU-LSTM were also considered. The model trainings were performed on Google Collab. The trained models were deployed and tested on three different edge devices, namely Raspberry PI 3, Raspberry PI 4, and NVIDIA Jetson Nano [66].
The authors evaluated the performance of different models based on accuracy, recall, precision, F1 score, model training, and testing time in seconds. Their best model, CNN-LSTM with attention layer, exhibited accuracy, recall, precision, and F1 score of 97%, 98%, 98%, and 0.98, respectively [66].
The paper titled “Land and Underwater Gait Analysis Using Wearable IMU” [67] by Cecilia Monoli, Juan Francisco Fuentez-Perez, Nicola Cau, Paolo Capodaglio, Manuela’ Galli, and Jeffrey A. Tuhtan introduces an innovative, cable-free, waterproof inertial measurement unit (IMU) logger. This device features a 9-axis AHRS, built-in flash storage, and a Li ion battery, all neatly packed into a slim epoxy casing. For the study, two of these loggers were securely attached to the thigh and shank to track knee flexion during walking. Thanks to its sealed electronics, this versatile hardware can be used both on a clinic floor and in a therapy pool, making it a great option for orthopedic rehabilitation and aquatic sports biomechanics [67].
The dataset was generated from human trials. In trial 1, which involved three healthy adults walking six times each, the IMU’s performance was compared to a six-camera Vicon460 optoelectronic system and a side-view smartphone video setup on land. Meanwhile, trial 2 included seven adults who walked eleven times each, benchmarking the IMU against a Sony Alpha A5000 motion-capture system, first on land and then underwater in a pool. The raw data from the loggers (timestamp + 3-axis acceleration + quaternion at 100 Hz) was processed in MATLAB to create knee-angle time-series using a four-quadrant arctangent of the thigh and shank frame vectors. Video angles were digitized using Kinovea, and Vicon outputs were exported from Plug-in-Gait. All data streams were resampled to 100 Hz, synchronized, and then analyzed using a 10-fold Matern-5/2 Gaussian Process Regression (GPR) model that was trained on 20,514 paired samples to enhance the IMU’s accuracy [67].
Performance was evaluated against established gold standards using four key statistics: RMSE, Pearson correlation r, Bland–Altman bias/SD, and the coefficient of variation (CV). On land, the raw IMU recorded an RMSE of about 10.1° compared to Vicon, with a correlation of around 0.90. After applying GPR, the RMSE improved to 6.3° and the correlation increased to 0.95. A similar trend was observed with video data (RMSE improved from 6.1° to 5.9°, and r increased from 0.90 to 0.94). Underwater, the IMU–video error decreased even more (from 8.8° raw to 6.6° post-GPR), and an impressive 93% of gaits met the authors’ clinical threshold of r ≥ 0.80 (compared to 83% on land). The Bland–Altman bias improved from 6.6° to 2.8°, and the standard deviation dropped from 7.4° to 5.4° with GPR, while the CV values closely matched the camera reference in each environment [67].
An implementation is deemed “good” when the IMU (after GPR) achieves an RMSE of less than or equal to 7° and a correlation greater than 0.80 against optical systems, shows no systematic bias beyond ±1.96 SD on Bland–Altman plots, and maintains consistent performance both in air and in 1.2 m deep water for the entire 40-lag (approximately 0.4 s) prediction window [67].
The study by Alzahrani et al., titled as the “Real-Time Wearable Biomechanics Framework for Sports Injury Prevention and Rehabilitation Optimization” [68] develops a real-time biomechanical risk assessment framework that integrates wearable IMU and sEMG sensors with machine learning to predict injury-related movement patterns in athletes. The central objective is to transition from lab-based motion capture systems by enabling continuous, field-deployable monitoring of joint loading, muscle activation, and movement asymmetries. A dual-stream sensor fusion architecture combines inertial and electromyographic signals, allowing the system to estimate biomechanical stress in real time and detect unsafe movement patterns before injuries occur. The framework is explicitly designed for athletic populations, with occupational use positioned as a future extension, ensuring a tightly defined experimental scope. A key innovation is the latency-aware processing pipeline, which achieves sub-200 ms feedback, making real-time corrective intervention feasible during movement execution rather than post-analysis.
In terms of methodology, the system integrates high-fidelity wearable sensing (Xsens IMUs and Delsys EMG) combined with advanced signal processing and machine learning. IMU data capture joint angles and angular velocities, while EMG captures muscle activation patterns. Both are synchronized and fused using a structured pipeline that includes filtering, feature extraction, and drift correction. A bidirectional LSTM model trained with optimized hyperparameters predicts biomechanical stress and injury risk indicators, validated against gold-standard motion capture and force-based benchmarks. The framework is statistically grounded through cross-validation, ablation testing, and effect-size analysis, ensuring generalization across subjects.
The results and positioning of the study highlight that the system demonstrates high predictive reliability for joint stress estimation (R2 > 0.85) and significant improvements in injury-risk classification compared to single-sensor approaches. It also shows measurable reductions in asymmetry during feedback-driven rehabilitation, supporting its use as a real-time corrective tool. From a broader validation and application perspective, the findings confirm that wearable biomechanics can function as a unified predictive and rehabilitative system across sports and clinical contexts, though with important methodological constraints. Agreement with physiotherapist evaluation (~87.5%), FMS scoring (~91% risk alignment), and partial clinical imaging correlation (~75% injury detection overlap) supports external validity, while real-time rehabilitation trials show measurable improvements in symmetry (e.g., 21.3% to ~4.2%) and range of motion recovery. However, limitations such as absence of long-term injury outcome tracking, lack of randomized control groups, and sensor drift under high-intensity motion restrict causal inference. Overall, the combined evidence supports the hypotheses at a strong technical level (H1–H2 fully supported, H3 partially supported), positioning the framework as a validated real-time biomechanical risk estimation system with demonstrated translational potential, pending longitudinal and multi-center clinical confirmation.
However, the study carefully frames its contribution as a validated proof-of-concept rather than a fully deployed clinical system, with occupational biomechanics reserved for future Phase 2 expansion. The findings of the study establish a unified wearable biomechanics architecture that bridges sensing, modeling, and real-time intervention, positioning itself at the intersection of sports science, rehabilitation engineering, and applied machine learning [68].
The paper titled “Towards Soft Wearable Strain Sensors for Muscle Activity Monitoring” [69] by Jonathan T. Alvarez and colleagues introduces an innovative SCARS soft-strain sensor patch designed to be placed on muscles to detect tiny surface changes and gauge force. Each patch, measuring 10 mm × 10 mm, consists of a carbon-fiber polymer composite meander that is sandwiched between pre-stretched TPU and silicone adhesive. It operates by drawing a constant current and communicates resistance changes through a PowerLab interface. When arranged in a 2 × 2 grid on the quadriceps, these patches allow for non-invasive tracking of torque during knee extension exercises [69].
In the study, eight healthy participants underwent two protocols using a treadmill-mounted dynamometer: the first involved three ramped isometric maximum voluntary contractions (MVCs) at a 90° knee flexion for calibration, and the second consisted of up to 75 maximal isokinetic contractions (from 110° to 20° at a speed of 30° s−1) until peak torque decreased by 40%. Throughout these tasks, the strain sensors transmitted data at a rate of 1 kHz, alongside measurements of dynamometer torque, limb angle, and tri-muscle sEMG [69].
The signals were low-pass-filtered at 5 Hz, normalized, and fitted with a cubic model to convert sensor voltage into joint torque. Impressively, a single group-level fit (instead of individual subject-specific curves) achieved an r2 of approximately 0.90 and a normalized root mean square error (NRMSE) of 0.09 for isometric ramps (0.07 with individual fits). During the fatigue task, Principal Component Analysis identified the most informative patch, and the cubic transformation resulted in a mean NRMSE of 0.15 ± 0.03, with a repeated-measures correlation of rrm = 0.73 (p < 0.001) between the torques derived from the strain sensors and those from the dynamometer. The data processing was carried out using MATLAB for filtering and PCA, and R (rmcorr) for correlation statistics, without the need for complex machine learning beyond these regressions [69].
A run is considered successful when the patch provides torque estimates with about a 15% error margin and keeps a correlation coefficient (r) above 0.7, even while dealing with placement shifts, sweat, and fabric slipping. The study achieved these goals, showing an isometric r2 of at least 0.90, a fatigue-phase NRMSE of 0.15, and bias-free Bland–Altman plots. The authors suggest that this type of deformation-based sensing, particularly when combined with surface electromyography (sEMG), could pave the way for ongoing monitoring of muscle fatigue, effective load management, and tracking rehabilitation progress [69].
Menaka, Prakash, Neelakandan, and Radhakrishnan, in their paper “A Novel WGF-LN-Based Edge-Driven Intelligence for Wearable Devices in Human Activity Recognition” [70] proposed a model that addresses a key application of health monitoring: human activity recognition (HAR). Their approach is unique in that it incorporates Wavelet-based Graph Filter with Laplacian Normalization (WGF-LN) technology on a wearable device [70].
The authors used five publicly available datasets: w-HAR, mHealth, PAMAP2, WISDM v2, and public HAR. These datasets include data from various sensor types, such as accelerometers, stretch sensors, electrocardiograms, magnetometers, and gyroscopes. To leverage all five datasets, the authors preprocessed and integrated the data. The preprocessing pipeline included data cleaning (Mode-Integrated Binning Algorithm), data integration (peer-to-peer technique), data transformation (Entropy-Candidate k-Partition Discretization algorithm), feature extraction (Haar Wavelet mother and Symlet wavelet coefficient scattering), feature reduction (Binomial Distribution-Integrated Golden Eagle Optimization), and feature normalization (scatter plot to matrix technique) [70].
The proposed WGF-LN model is compared with other existing models, such as LegoNet, convolutional neural network (CNN), and Deep Neural Network (DNN), in terms of convergence, precision, recall, and F-score. In all these metrics, the WGF-LN model demonstrates superior performance. Additionally, the classification performance of the WGF-LN model is further evaluated against other models, including CNN, RNN, and LSTM-CNN, with respect to accuracy. These models achieved accuracy rates of 98.49%, 87.86%, 95.00%, and 92.63%, respectively. This highlights the strong potential of the proposed solution for human activity recognition [70].

4.6. Edge AI and Data Analytics

2025–2026 update: The newest edge AI literature makes it clear that wearable intelligence must now balance four demands simultaneously: predictive accuracy, latency, energy efficiency, and trustworthiness. Compact models, uncertainty-aware inference, selective off-loading, and privacy-preserving personalization are no longer optional extras; they are becoming central design requirements for credible medical wearables [8,26].
The systematic review titled “Edge artificial intelligence for big data: a systematic review” [6] by Atefeh Hemmati, Parisa Raoufi, and Amir Masoud Rahmani dives into 85 papers published between 2018 and 2023. It explores the shift in AI analytics from cloud centers to the network edge, creating three complementary taxonomies—applications, system requirements, and enabling technologies—while also detailing how researchers measure success [6].
Rather than zeroing in on a single biomedical “sensor,” the review considers the edge node itself as the sensing compute unit. This includes devices like Raspberry Pi-class SBCs, FPGA SoCs, custom multi-TOPS AI accelerators, and MEC/fog servers that work alongside cameras, UAVs, meters, or wearables, running pruned or split models right on-site. The authors narrowed down their initial search from 289 hits to 239 screened papers, ultimately retaining 85 studies. The datasets they examined range from CIFAR-10 and MNIST to manufacturing logs, CTU network-attack traces, and real microgrid measurements. Typical data pipelines filter or aggregate information on the device, selectively offload data, and combine simulation tools (like EdgeCloudSim/iFogSim and Python Monte-Carlo) with physical testbeds (such as Raspberry Pi and FPGA) [6].
On the algorithmic front, lightweight CNNs and TinyML variants take the lead in vision and signal tasks. Techniques like federated learning and transfer learning help maintain privacy and reduce training loads, while reinforcement learning and swarm/evolutionary heuristics tackle scheduling and resource allocation. Additionally, split-DNN or early-exit schemes distribute networks across device, edge, and cloud tiers. The supporting stacks feature containerized micro-services, SDN/NFV overlays, differential privacy or blockchain add-ons, and specialized simulators to model placement and latency [6].
The evaluation in these studies takes a multi-faceted approach. Time-related factors like delay and latency account for 31% of all the metrics reported, followed by system cost at 22%; energy at 14%; accuracy at 17%; throughput at 7%; and a mere 2% each for precision, recall, F1, and bandwidth. Most research combines several of these metrics instead of focusing on just one, with experiments ranging from quick latency tests measured in milliseconds to energy assessments that last for hours. A solution is deemed “good” when it maintains low latency while achieving cloud-level accuracy and significantly reduces energy, bandwidth, and costs—criteria that stem from the challenges the authors highlight, such as poor data quality, limited computing resources, and security vulnerabilities [6].
The paper titled “An AI-edge Platform with Multimodal Wearable Physiological Signals Monitoring Sensors for Affective Computing Applications” [71] authored by ChengJie Yang, Nicolas Fahier, Chang-Yuan He, Wei-Chih Li, and Wai-Chi Fang, introduces an innovative wrist-to-laptop system designed to identify three emotional states—happiness, anger, and sadness—by analyzing synchronized EEG, ECG, and PPG data streams. Each wearable device is equipped with either an ADS1299 eight-channel EEG front-end, an ADS1298 twelve-lead ECG front-end, or a MAX30102 pulse-oximeter for PPG. They all connect through a Spartan-6 controller and function as Bluetooth-LE slaves in a 3-to-1 piconet. The master device, a 32-bit RISC-V core on a Kintex-7 FPGA, processes the signals by pre-filtering and extracting features before sending them to FPGA-based CNN accelerators that operate entirely on the edge, providing real-time results to a MATLAB GUI [71].
The research involved twenty high-risk volunteers aged 30 to 50, during which the team recorded four emotional states—neutral, happy, angry, and sad—each for eleven minutes. This resulted in 8-channel EEG data at 250 Hz, 12-lead ECG data at 250 Hz, and single-wavelength PPG data at 200 Hz. EEG segments of four seconds (with a one-second stride) were transformed using STFT and baseline-normalized; only the 8–45 Hz α, β, and γ bands from eight frontal-temporal channels were fed into a 3-layer 2-D CNN. For the ECG/PPG data, thirty-second segments (also with a one-second stride) generated fifty-one features related to R-R intervals, HRV, and pulse transit time, which were then processed by a parallel 1-D CNN with dropout regularization. A fuzzy-logic arbiter combined the outputs from both CNNs to make the final decision displayed on the GUI [71].
To evaluate the model’s performance, the team used leave one-subject-out validation for EEG, achieving a mean accuracy of 76.94% (SD 16.58%), and an 80/20 subject-dependent split for ECG/PPG, which resulted in a mean accuracy of 76.8% after 100 epochs. The authors report this subject-independent EEG accuracy as an acceptable cross-subject performance for their platform [71].
The study titled “Biosensing Technologies for Foodborne Pathogen Detection and Healthcare: Principles, Emerging Materials, And Intelligent Platforms” by Assudani et al., [72] explores the advanced biosensing platforms to detect food borne pathogens for clinical detection electrochemical, optical, and microfluidic sensing modalities. The detection is enabled by advancements in functional nanomaterials, molecular recognition elements (including aptamers and nanozymes), and surface engineering strategies to improve sensor performance.
The study demonstrates that combining these sensors with AI and machine learning approaches has enabled intelligent pattern recognition, real-time analytics, and multiplexing at high speeds, turning conventional detection systems into wearable diagnostic devices. The advancements in biosensors highlight an integrated platform combining biological recognition elements (molecularly imprinted polymers, antibodies, aptamers, and bacteriophages) with diverse transduction techniques (electrochemical, optical, piezoelectric, and colorimetric systems). Advances in nanomaterials, CRISPR-based detection, and enzyme mimics have further enhanced sensitivity, enabling detection at near single-cell levels within minutes.
Findings of this review paper demonstrate that microfluidics and lab-on-a-chip systems are moving into smart and wearable devices that can carry out sampling and detection in one single platform, making them beneficial for ultra-low pathogen detection. Similarly, smartphone and IoT integration has transformed biosensors into “connected diagnostics” that detects pathogens and enable real-time and remote monitoring as a warning system through cloud and app-based infrastructure. Finally, the inclusion of AI/ML approaches solves the challenges associated with biosensors such as noise, variability, matrix effects, and subjective readouts. Deep learning, hyperspectral imaging, Raman analysis, and genomic ML all push biosensing from simple detection toward predictive and decision-support systems [72].
The review titled “At the Confluence of Artificial Intelligence and Edge Computing in IoT-Based Applications: A Review and New Perspectives” [73], authored by Amira Bourechak, Ouarda Zedadra, Mohamed N. Kouahla, Antonio Guerrieri, Hamid Seridi, and Giancarlo Fortino, provides a detailed review of 114 papers published since 2019. It explores how machine learning techniques are transitioning from the cloud to resource-limited nodes at the network edge. The authors examine eight key areas—smart agriculture, environment, grid, healthcare, industry, education, transportation, and security/privacy—and highlight that moving inference closer to the data source can reduce latency, bandwidth usage, and privacy concerns, all while requiring lightweight, energy efficient models [73].
Throughout the studies reviewed, most researchers utilized affordable edge hardware like Raspberry Pi, Jetson Nano, ESP32 modules, or MEC micro-servers, along with software strategies that help manage model size or distribute computation. A quantitative analysis reveals that 37% of the works reviewed employ lightweight networks, 25% make use of transfer learning, 15% implement federated learning, 12% focus on hardware or software optimization, 9% clean data on the node, and a small but increasing 2% are adopting early-exit or DNN-splitting techniques [73].
The range of AI methods is quite extensive: supervised learners such as SVM, KNN, RF, and decision trees are used for tabular or signal tasks; deep learning models—CNN, LSTM, GRU, and hybrid variational or generative AEs—are prevalent in vision and complex time-series analysis; reinforcement learning is applied for scheduling and routing, while bio-inspired algorithms (like PSO, gray-wolf, and ant-bee) are used to fine-tune hyperparameters or balance loads [73].
Edge nodes are tasked with much more than just inference. As shown in Figure 8 of the review, they not only aggregate, filter, impute, or reduce raw data streams before analytics but also host modules for prediction, classification, visualization, and decision-making. They even manage tasks and balance loads among themselves—all under the umbrella of “intelligent sensing” [73].
The supporting toolchains are quite varied as well. TensorFlow (29%) and Keras (8%) are the front-runners among libraries, with MATLAB also at 8%. About 6% of the cases utilize TensorFlow Lite for on-device inference, while bigdata back-ends like Hadoop, Spark, and Kafka come into play when edge clusters cache or replay data. For what-if studies, iFogSim and YAFS continue to be the go-to simulators [73].
Success is often defined by how well an edge-side pipeline maintains high predictive quality—accuracy is the most frequently reported metric (36% of papers)—while also adhering to system-level constraints like low latency (27%), limited training or inference time (17%), and reasonable memory and energy usage. In security-sensitive scenarios, demonstrable privacy protection is crucial. In practice, many authors aim for informal benchmarks of sub-second response times and at least 90% accuracy; designs that meet these criteria, maintain stable performance under varying loads, and scale across different nodes are considered “good.”
The survey titled “Edge AI: A survey” [74] by Raghubir Singh and Sukhpal Singh Gill explores the shift in artificial intelligence workloads from cloud data centers to resource limited nodes right at the edge of the network. The authors review the evolution of concepts like cloudlets, fog computing, mobile/multi-access edge computing (MEC), and micro-data centers, ultimately presenting edge AI as the key layer that enables these frameworks to perform learning and inference just “one wireless hop” away from sensors and users. Throughout the review, eight key application clusters stand out—smart transport, healthcare, grid, agriculture, environment, industry, education, and security/privacy—each selected to showcase a unique blend of latency, bandwidth, privacy, and autonomy requirements [74].
While this paper serves as a literature survey rather than an experimental study, it effectively outlines a standard edge AI pipeline. Raw data streams from cameras, IMUs, meters, or electro-biosensors are processed on-device through filtering, aggregation, or reduction, and then either analyzed locally or selectively sent to a nearby edge node; only the data that truly needs to reach the cloud makes the journey to the core, helping to reduce round-trip delays and network costs. The model zoo is dominated by lightweight CNNs, TinyML variants, transfer learning adapters, and federated updates, while reinforcement learning and evolutionary swarms play roles in scheduling and resource allocation. The enabling stacks consist of containerized microservices, SDN/NFV overlays, information-centric networking, and split-DNN or early-exit execution plans that effectively slice the network across device and edge boundaries [74].
When it comes to performance, we mainly look at latency and accuracy improvements compared to a cloud-only setup, while energy consumption and saved bandwidth serve as additional metrics. The case studies highlighted in the review consistently demonstrate that once inference is positioned at or just one hop away from the radio access network, we can achieve sub-second end-to-end delays. Many of these solutions also manage to cut traffic by 30% to 70% compared to unfiltered cloud uploads. A solution earns the label of “good” if it (i) maintains task-level accuracy similar to the original cloud model, (ii) meets the real-time requirements of the application—usually under 50 ms for AR/VR, and under 200 ms for video analytics or vehicle control—and (iii) operates within the power and memory limits of devices like Raspberry Pi, Jetson, or ESP-class edge nodes without needing forced cooling or a direct power connection [74].
The PhD thesis titled “Wearable Edge AI Towards CyberPhysical Applications” [75] by Mateus Coelho Silva introduces a comprehensive design protocol that integrates wearable sensing, edge computing, and machine learning to create practical cyber–physical systems. This work revolves around a novel co-design triad—hardware, software, and architecture—validated simultaneously and demonstrated through two extensive case studies: one focusing on environmental ecology (including leaf damage assessment, canopy disease mapping, and ant counting) and the other on health-related wearables (covering field physiology, a COVID-19 face shield HUD, and human activity recognition) [75].
On the hardware front, the thesis cleverly repurposes off-the-shelf maker boards as edge nodes. For instance, a smart helmet designed for tree canopy surveys combines a 2-D LiDAR and a camera with a Raspberry Pi Zero W, while an external edge AI server is selected from either Raspberry Pi 3B/3B+ or NVIDIA Jetson Nano modules. Systematic latency tests reveal that the Jetson, operating in 20 W mode, can process a three-stage vision pipeline (involving HSV conversion, pseudospectrum extraction, and MLP prediction) in approximately 9 ms + 12 ms + 11 ms per frame, making it two to three times faster than the Pi variants. In the healthcare sector, a rugged smart vest and face shield incorporate MAX3010x pulse oximeters, temperature sensors, and QR-code cameras, while the activity recognition node captures 6-axis IMU data at a rate of 100 Hz [75].
Machine learning is intentionally kept simple and efficient. A conditional GAN is used to fill in missing leaf areas, allowing a downstream classifier to assess damage percentage from just one image. When it comes to spotting pathogens, the author compares a 1-layer MLP with a 5-layer CNN running on the Jetson. The results show only a slight increase in accuracy of 2–3 percentage points, but a significant drop in throughput by 6 times, leading to the decision to stick with the MLP for real-time applications [75].
For recognizing human activities, a 128-cell LSTM combined with a 256-neuron dense head is utilized and converted to TFLite. On the KU-HAR test set, the edge device achieves an impressive 94.7% global accuracy, with precision and recall around 0.95. It can support up to 71 users per cloudlet with a quick 6.7 ms inference time, or 19 users on the mobile edge with an 18 ms response time [75].
Data flow is always divided: low-power wearables handle sensing and basic pre-filtering, and then pass on compact feature vectors (like HSV pseudospectra or IMU windows) to the edge node for inference and database logging. Comprehensive QoS tests reveal that service quality remains at 95% when the client count is 6 or fewer, and it degrades smoothly as the edge load becomes the limiting factor, rather than network delay. A device or application run is considered “good” if it meets four criteria: (i) edge latency stays below the 0.5 s soft real-time budget, (ii) predictive accuracy is at least 90% or RMSE is within acceptable limits, (iii) power consumption is within the Pi-class envelope or no more than 20 W for the Jetson, and (iv) uninterrupted BLE/WLAN streaming is maintained for the target session length (up to 90 min for cycling or 3 h for canopy surveys) [75].
The conference paper titled “Energy-Efficient AI at the Edge for Biomedical Applications” [76] by Jerald Yoo presents an innovative single-chip platform that operates on ultralow power, designed to record multi-channel scalp EEG and perform seizure detection entirely on the device. The front-end is equipped with standard low-noise amplifiers and 8–16-bit ∆Σ ADCs, while the tightly integrated digital back-end (DBE) incorporates both handcrafted feature logic and a compact convolutional neural network accelerator—all neatly packed into a wearable format powered by a coin-cell battery [76].
The paper discusses two operating modes. In the patient-specific mode, the chip employs traditional SVM and decision tree classifiers, which are effective because they can be trained with just a few seizure instances. However, this method requires designers to create hand-coded features and can lead to varying accuracy among different patients [76].
To overcome these limitations, the authors propose a patient-independent approach that revolves around a Seizure-ClusterInception CNN (SciCNN). This model is initially trained offline using public EEG datasets (CHB-MIT, EU) and is then fine-tuned on the device with zero-shot retraining once it is in use. In leave-one-patient-out tests, it achieves impressive event-level sensitivity and specificity rates of 90.3% and 93.6% on the CHB-MIT dataset and 90.4% and 95.7% on the EU dataset. A preliminary clinical pilot also recorded 83.3% sensitivity and 88.6% specificity with a newly recruited subject, all without the need to store raw data in the cloud [76]. The system on chip (SoC) is deemed “good” when it meets three criteria simultaneously: (i) seizure sensitivity of at least 90% with no more than 10% false positives, (ii) end-to-end latency that is low enough for closed-loop neuromodulation, and (iii) digital power consumption that aligns with the wearable battery budget. The prototype successfully meets these targets, thanks to its feature-sparing CNN blocks and an always-on current draw of just a few hundred microamperes [76].
The review titled “Next-Generation Swimming-Pool Drowning-Prevention Strategy Integrating AI and IoT Technologies” [77] by Wei-Chun Kao, Yi-Ling Fan, FangRong Hsu, Chien-Yu Shen, and Lun-De Liao explores how three key technologies—embedded sensing hardware, computer-vision AI, and IoT/5G connectivity—are coming together to reduce the time it takes for a lifeguard to respond to the first signs of distress. The authors start with some eye-opening statistics that highlight drowning as the third leading cause of accidental injury death worldwide. They have gathered over 120 primary studies and organized them chronologically, showcasing the evolution from early wrist-worn pressure and pulse tags to ultrasonic beacons to poolside embedded boards that set off alarms. They also discuss high-frame-rate cameras, both overhead and underwater, that work with advanced networks like YOLO, Mask R-CNN, or OpenPose. Most recently, they highlight the use of edge AI nodes that combine radar, sonar, or millimeter-wave reflections with real-time 5G alerts sent to parents and staff [77].
Synthesis: Across general biosensor platforms, the most significant recent development is the move from single-purpose devices toward modular, multimodal ecosystems. Platforms are increasingly judged by whether they integrate soft materials, reliable sampling, low-power electronics, and AI-ready signal processing in a way that supports clinical translation rather than only proof-of-concept performance.
The chapter titled “Human-Centered Edge AI and Wearable Technology for Workplace Health and Safety in Industry 5.0” [78] by Tho Nguyen, Dac Hieu Nguyen, Quoc-Thong Nguyen, Kim Duc Tran, and Kim Phuc Tran provides a detailed review of how wearable IIoT devices and edge AI are coming together to keep an eye on workers and their environments in real time, all while respecting privacy. It presents wearables as sensor nodes that can be attached to the body or clothing—think textile electrodes, IMUs, and sensors for temperature, SpO2, and stress—that send locally processed data to nearby edge computers. This setup allows for quick, on-the-spot decisions in fields like manufacturing, construction, healthcare, and emergency services. Instead of creating a new dataset, the chapter pulls together insights from previous studies and real-world applications, showcasing examples like smart garments for assessing workload risks, posture alert systems for nurses, firefighter undergarments designed for extreme conditions, and an edge AI multimodal platform (EEG/ECG/PPG) that can classify emotions with about 76.8% accuracy—demonstrating the potential and current limitations of on-device machine learning. The authors advocate for human-centered AI (HCAI) principles—fairness, accountability, and transparency—applied at the edge to reduce latency, bandwidth usage, and reliance on the cloud. They also discuss challenges like battery life, computing power, memory, and privacy/security, along with solutions such as model compression (pruning/quantization), low-power designs, energy harvesting, and adherence to guidelines like NISTIR 8228 and EU Trustworthy AI. In this literature-driven viewpoint, systems are considered “good” when they maintain accurate inference with minimal delay in real working conditions; keep data local by default; and fulfill safety, privacy, and usability standards that prioritize workers [78].

5. Findings

5.1. General Biosensor Platforms

5.1.1. Overview of Basic Applications in Human Activity Monitoring and Medicine

1. Typical Sensors for Specific Applications: Several types of wearable sensors are used to monitor health and detect diseases. The study by Liu et al. [10] used photoplethysmography (PPG) sensors to measure oxygen saturation and heart rate variability, e.g., fatigue level in athletes. These sensors track blood volume changes that help to conduct non-invasive monitoring continuously through wearable technology. Similarly, Alhaddad et al. [16] extended advancements in non-invasive blood glucose monitoring technologies and machine learning algorithms for predicting glucose trends, especially for detecting hypoglycemia. Several types of non-invasive sensors were used, including photoplethysmography, electrocardiogram, electromagnetic sensors, bioimpedance sensors, sweat-based sensors, tear-based sensors, saliva-based sensors, and acceleration sensors. Specific devices mentioned include the Empatica E4, which is based on photoplethysmography; the Bioharness, which measures electrocardiogram signals; and an electromagnetic glove developed by Hanna and colleagues in 2020. Additionally, Qiao et al. [14] explored electrochemical sensors. Although specific sensor models were not mentioned, various sensor technologies were described, including enzyme-based sensors, enzyme-free sensors, molecularly imprinted polymer sensors, electrochemical immunosensors, and potentiometric sensors. These sensors are applicable for assessing conditions such as fatigue, dehydration, stress levels, nutritional intake, and potential disease diagnosis.
Zhang et al. [2] discussed various AI-assisted wearable biosensing technologies without specifying exact sensor models. They broadly mentioned sensors capable of biochemical and biophysical data acquisition, such as electrochemical sensors, optical sensors (holographic, fluorescent, and colorimetric), and multiplexed systems suitable for continuous monitoring of physiological biomarkers like glucose, lactate, ions, and other metabolites. These sensors are suitable for healthcare diagnostics, monitoring fatigue levels, and chronic conditions such as diabetes. Yammouri and Lahcen [11] extended advancements in wearable biosensors and AI-powered point-of-care testing (POCT) systems, emphasizing their integration with artificial intelligence techniques to enhance personalized medicine and diagnostics. Various biosensors, including electrochemical, optical, piezoelectric, thermal, and field-effect transistor-based sensors were employed for continuous and non-invasive physiological monitoring. Liu et al. [13] developed an explainable deep learning-assisted programmable colorimetric sensor chip designed for the non-invasive detection of biomarkers in human sweat, specifically glucose, lactate, and pH levels. This sensor comprised sodium alginate-calcium chloride gel capsules embedding enzymatic and indicator reagents tailored for each biomarker. For glucose detection, glucose oxidase and horseradish peroxidase with phenol reagent and 4-aminoantipyrine were employed.
2. Insights on Features of Extracted Data vs. Predictions: The efficacy of wearable AI sensors is defined by their ability to provide accurate health predictions from raw biochemical and physiological features. Shajari et al. [1] discussed important biochemical indicators, including glucose, lactate, and hydration levels are recorded by these sensors and examined to provide health insights on metabolic conditions like diabetes, cardiovascular risks, and stress levels, or to correlate sweat biomarker trends with dehydration and electrolyte imbalances. On the other hand, Liu et al. [10] employed several deep neural network architectures, notably ResNetCNN and Xception, both combined with bidirectional long short-term memory (BiLSTM) layers. These hybrid models effectively captured spatial patterns and temporal dynamics inherent in the PPG waveforms, significantly outperforming traditional single-method approaches. The study by Yammouri and Lahcen [11] provided insights on continuous physiological monitoring and detection of biomarkers such as glucose, dopamine, ATP, lysozyme, and cancer markers. The study by Zhang et al. [2] provides insights on features and prediction by reflecting on the pattern recognition, anomaly detection, biomarker quantification, fatigue monitoring, and disease diagnostics. Liu et al. [13] utilize convolutional neural networks based on ResNet18, to provide insights on the features of data extraction and generate predictions from AI models. The insights exhibited exceptional efficiency, achieving 100 percent classification accuracy and excellent quantification precision (R2 exceeding 0.999). To enhance the interpretability of CNN predictions, Class Activation Maps were implemented, elucidating the network’s decision-making by visually mapping critical regions of sensor responses. Alhadad et al. [16] employ convolutional neural networks, recurrent neural networks, support vector machines, decision trees, gradient boosting, long-short term memory, and ARIMA to monitor physiological signals like heart rate, interstitial glucose levels, and sweat levels.
3. Typical Tools/Frameworks and Algorithms: Among all studies, a combination of edge computing frameworks, deep learning, and machine learning models is employed. Shajari et al. [1] used IoT-based technologies for real-time health tracking and TensorFlow and PyTorch for deep learning models as tools and frameworks, but in combination with SciPy and OpenCV for signal processing. Xu et al. [19] utilized a similar deep learning framework like PyTorch, but with IoT-connected prosthetic devices, embedded AI for real-time input for AI-driven skin feedback, and prosthetic enhancements. Alhaddad et al. [16] employed various machine learning algorithms with convolutional neural networks, recurrent neural networks, support vector machines, decision trees, gradient boosting, and long-short term memory networks. Tools and frameworks mentioned in the study included TensorFlow, PyTorch, Keras, and Scikit-learn. Gragnaniello et al. [18] analyzed the spectrogram-based features using a neural network composed of two 1D convolutional layers (1D-CNN) and two dense layers, optimized for microcontroller deployment via quantization using Edge Impulse’s EON compiler. The neural network achieved 89.52% accuracy, 0.91 average precision, 0.90 recall, and an AUC of 0.90, consuming only 347 kB flash and 23 kB RAM, and Edge Impulse, MATLAB R2023a, to enable real-time health tracking through wearable devices. Whereas machine learning algorithms, including convolutional neural networks, support vector machines, decision trees, random forests, k-nearest neighbors, and linear discriminant analysis, were implemented by Zhang et al. [2] to process data and extract health insights, Liu et al. [11] conducted data processing using a convolutional neural network based on ResNet-18, which exhibited exceptional efficiency, achieving 100 percent classification accuracy and excellent quantification precision (R2 exceeding 0.999). Evaluation involved multiple approaches, comparing CNN results against other machine learning models such as ANN, XGBoost, decision trees, and traditional statistical methods like linear discriminant analysis. CNN consistently outperformed alternative approaches.
4. Evaluation Strategy: Xu et al. [14] used evaluation techniques to track model accuracy testing for medical diagnostics, real-world prosthesis validation trials, and comparison testing against human tactile response data through tactile accuracy testing and clinical validation. To verify the efficacy of AI-driven wearable health monitoring, the evaluation technique includes sensitivity and specificity analysis, ROC curve assessment, and comparison with clinical diagnostic criteria. Qiao et al. [2] performed a sensor evaluation employing electrochemical performance metrics such as sensitivity, linearity, detection limits, specificity, stability, reproducibility, and response time. Assessments included both laboratory-controlled conditions and realistic scenarios such as continuous monitoring during physical activity or dietary intake. The quality of the sensors was determined by their ability to accurately and specifically detect biomarkers within physiologically and clinically relevant ranges, exhibit rapid and stable responses, and maintain performance under various physical stresses and prolonged use. Such rigorous evaluation criteria ensured the suitability of these wearable sensors for practical health monitoring applications.
Liu et al. [8] employed a five-fold cross-validation strategy, with classification quality assessed through metrics such as accuracy, F1 score, precision, recall, and area under the curve. The best-performing model, the hybrid Xception-BiLSTM network, achieved a notable accuracy of approximately 91.8%. Additionally, the objective classification outcomes aligned closely with subjective measures of fatigue, specifically the Karolinska Sleepiness Scale (KSS) and Psychomotor Vigilance Test (PVT). On the other hand, Yammouri and Lahcen [9] conducted evaluations through rigorous validation methods, typically involving accuracy, sensitivity, specificity, and AUC scores compared against clinical standards. These measures often involved multiple assessments over practical testing scenarios, confirming the reliability of these technologies in real world medical environments. Gragnaniello et al. [13] used the evaluation methodology that involved a patient-independent split of training and testing sets to avoid overfitting. Benchmark tests compared various microcontrollers (STM32F4, F7, H7, M33, etc.), with the STM32F401 (F4 series) identified as optimal, balancing energy consumption, performance, and latency (approximately fifty-three milliseconds per inference). Good quality was defined by high evaluation metrics, low computational resources, short inference latency, and energy efficiency.
Zhang et al. [2] performed accuracy measurements and comparative analysis of various machine learning methods. For example, accuracy percentages such as 96.3% for eye movement recognition (using WT-SVM) and classification accuracies ranging from 83% to 100% for various ML applications were noted. Evaluation included multiple tests using different ML algorithms to determine the optimal solution. This evaluation approach was guided by metrics like sensitivity, specificity, and prediction accuracy across several measurements and tests rather than a single measurement. Alhaddad et al. [16] used entirely different evaluation methods based on several metrics, including accuracy, root mean square error, sensitivity, specificity, the Clarke Error Grid, and area under the curve. Time-to-event analysis was also used to assess performance over time. The Empatica E4 demonstrated promising accuracy in predicting hypoglycemia, while the electromagnetic glove achieved over 98% accuracy in serum tests against reference glucose levels. Success was determined by the degree of correlation with actual blood glucose levels and performance on the Clarke Error Grid, where a high proportion of measurements fell within the clinically acceptable A and B zones.

5.1.2. Datasets and Data Processing Approaches

Liu et al. [13] conducted data processing using a total of four thousand six hundred photographic images capturing different concentrations of glucose and lactate, along with varying pH values, forming the dataset, split into training, validation, and testing subsets. Xu et al. [19] utilized biofeedback investigations, prosthesis user studies, and electronic skin clinical exams as sources of datasets. Multimodal data fusion, AI-driven noise reduction, and sensor calibration are all part of data processing. On the other hand, Shajari et al. [1] improved signal quality by preprocessing methods like feature selection, normalization, and noise filtering. To stop overfitting and data leaking, techniques for bias correction and cross-validation were employed. Additionally, Yammouri and Lahcen [11] used data directly from biosensors capturing biochemical and physiological parameters, medical images, and sensor fusion approaches combining multiple data modalities for enhanced accuracy. The AI models processed these complex, multivariate datasets to provide precise diagnostics and prognostics. However, Qiao et al. [14] gathered data from human sweat through non-invasive sampling methods like pilocarpine iontophoresis, thermal stimulation, physical exercise, and specialized sweat patches. Collected sweat underwent advanced analytical processing using techniques like liquid chromatography-mass spectrometry (LC-MS), capillary electrophoresis, gas chromatography mass spectrometry (GC-MS), and nuclear magnetic resonance spectroscopy (NMR), coupled with electrochemical methods such as voltammetry, impedance spectroscopy, potentiometry, and colorimetry.
Similarly, Liu [10] and researchers collected PPG data from twelve physically fit students under two conditions—fatigued and non-fatigued—with each recording lasting approximately ten minutes: wavelet-based denoising for noise removal; windowing-based segmentation for data augmentation; extraction of relevant physiological features, including HR and SpO2, from the processed signals. Shajari et al. [1] used real-time physiological trends, biochemical variations, and AI-driven anomaly identification among the features of the sensed data. The study demonstrates how machine learning models enhance early diagnosis by correlating these biomarkers with the course of the disease. In order to conduct noise filtering and cross-validation as data processing approaches, Zhang et al. [2] utilized data collected by wearable biosensors, specifically biochemical or biophysical data from biofluids such as tears, sweat, and saliva. This data was often processed using smartphone-based systems for preliminary image processing and subsequently uploaded to cloud platforms. Preprocessing techniques such as Kalman filtering, SavitskyGolay smoothing, and background subtraction were employed for data denoising and enhancement.
1. Data Leakage Prevention: Most of the studies apply cross-validation techniques to prevent leakage of data and ensure higher generalization ratios. Shajari et al. [1], in order to stop overfitting and data leaking, employed techniques for bias correction and cross-validation. In a similar vein, Zhang et al. [2] highlight the challenges associated with processing high-dimensional data and managing irregular signal noises, which are critical for ensuring accurate and reliable health assessments. Liu et al. [13], in their study, emphasize the importance of model interpretability and validation in AI-assisted biosensing applications. To improve the resilience of the model, cross-validation and dropout approaches are employed. To control data leakage, Gragnaniello et al. [18] used a patient-independent split of training and testing sets to avoid overfitting. Through cross-validation, Alhaddad et al. [12] guarantees the generalizability of the model. Xu et al. [19] guarantee resilience in a variety of sensor scenarios for the detection of Type 1 diabetes through robust detection across several subjects, which is ensured by cross-validation approaches. On the other hand, Yammouri and Lahcen [11] used randomized holdout sets and cross-validation to prevent data leaks. Similarly, Zhang et al. [2] utilized techniques like cross-validation and federated learning, which aid in lowering bias and overfitting.

5.1.3. Similarities Between These Applications and Reuse of Data Processing

Data processing techniques and AI model applications significantly overlap in studies on wearable sensors with AI integrated for health monitoring. Many researchers apply the same wearable biosensors, including electrochemical, photoplethysmography (PPG), and microfluidic sensors, for gathering physiological and metabolic data [1]. Prior to AI model training, the real-time data collected by these sensors is preprocessed using methods including distortion filtering, normalization, and selection of features to improve signal quality [1,12]. Convolutional neural networks (CNNs), recurrent neural networks (RNNs), and hybrid models with bidirectional long short-term memory (BiLSTM) layers are examples of machine learning and deep learning architectures that are commonly used to extract meaningful health insights, ranging from fatigue detection to disease onset prediction [10,11]. Furthermore, to overcome dataset constraints and enhance model generalizability, data augmentation techniques like windowing and synthetic data generation are frequently used [2]. The evaluation techniques used in these studies also show consistency, with area under the curve (AUC) measurements, sensitivity analysis, and cross-validation guaranteeing the robustness and dependability of the model [2,8]. The similarities in AI-based processing techniques are further supported by frameworks and tools like TensorFlow, PyTorch, and Scikit-learn, which highlight a common strategy for improving wearable health monitoring devices [10,14]. These approaches’ convergence across investigations demonstrates how AI-driven processing pipelines can be reused, enabling improvements in individualized healthcare monitoring. The main findings concerning general biosensor platforms are summarized in Table 3.

5.2. Vital-Sign Monitoring

5.2.1. Clinical Use Cases and Sensor Modalities

Wearable physiological monitoring plays an essential role in both clinical and daily health applications. The reviewed studies emphasize its significance in HRV analysis, drowning prevention, and hydration monitoring, all of which rely on AI-driven data interpretation to enhance health outcomes.
1. Typical Sensors for Specific Applications: HRV monitoring makes use of ECG and PPG sensors built into popular wearable technology, including the Fitbit, Samsung Galaxy, and Apple Watch, which enable ongoing evaluation of autonomic nervous system activity [20]. Though PPG sensors within the Apple Watch and Fitbit allow constant HRV monitoring, particularly while sleeping and during daily activities, ECG-based devices such as the Polar H10 chest strap offer precise long-term HRV tracking. By monitoring variations in heart rate and SpO levels, optical pulse oximeters and MEMS accelerometers are utilized to identify pre-drowning symptoms in order to avoid drowning [27]. LEDs at 660 nm (red) and 880 nm (infrared) are used in devices such as the MAX30102 optical pulse oximeter to provide accurate and interference resistant SpO monitoring, which makes them perfect for wrist-worn applications.
Electrodermal sensors and skin conductance sensors are used in hydration monitoring to assess electrolyte balance and sweat gland activity [30]. Sweat conductivity sensors identify changes in electrolyte concentration, while electrodermal activity (EDA) sensors gauge changes in skin conductance. These sensors aid in determining the level of hydration in athletes, employees in hot conditions, and senior citizens who are susceptible to dehydration. A multimodal flexible sensor patch comprising an accelerometer, laser-induced graphene strain sensor, ZnIn2S4 humidity sensor, gold-based temperature sensor, and ECG sensor was created by Matsumura [28]. This patch makes it possible to use edge computing capabilities for real-time physiological monitoring.

5.2.2. Feature Extraction and Predictive Targets

AI models analyze the massive statistics produced by physiological sensors to extract valuable health insights. AI algorithms evaluate the LF/HF ratio, RMSSD (root mean square of successive variations), and SDNN (standard deviation of NN intervals) in HRV analysis to identify autonomic abnormalities, cardiovascular disorders, and stress levels [20]. A thorough evaluation of nervous system function is made possible by the analysis of HRV patterns across both temporary (30 s) and permanent (24 h) time periods. AI-driven regression algorithms monitor irregular heart rate fluctuations and falling SpO2 trends to identify early distress signals in drowning prevention [27]. These models are validated by breath-holding trials, which show a 90% accuracy rate in identifying possible drowning situations. The system detects notable drops in heart rate variation and SpO2, setting off alarms before unconsciousness.
In order to forecast the risk of dehydration, hydration monitoring involves comparing sweat conductivity, temperature variations, and EDA signals with hydration levels [30]. To estimate hydration levels and provide prompt interventions in sports, safety at work, and elder care settings, artificial intelligence (AI) models examine changes in electrolyte balance, sweat rate, and ambient parameters. Matsumura et al. [28] classified anomalies from multimodal sensor patch data in real time using an Echo State Network (ESN). The system’s 96.6% arrhythmia detection accuracy demonstrated how reliable AI is in processing physiological signals.

5.2.3. Algorithms, Tools, and Deployment Patterns

Popular frameworks like Python, TensorFlow, MATLAB, and Scikitlearn facilitate AI model development and signal processing tasks. The study by Li et al. [20] used wearable devices with ECG and PPG sensors to assess HRV. It evaluated autonomic nervous system activity using deep learning methods and power spectral density analysis. TensorFlow and MATLAB were used to train the AI models, and Apple’s Research Kit and third-party apps were used to collect data for the study. Kałamajska et al. [27] used a MEMS accelerometer and an optical pulse oximeter to create a drowning prevention system. They used polynomial interpolation, the Fast Fourier Transform (FFT), and a 64th-order band-pass filter to eliminate motion distortions and noise. The algorithm was developed using MATLAB, and the real-time drowning detection implementation was done on STM32 ARM microcontrollers.
Similarly, Liaqat et al. [30] researched sweat conductivity analysis and electrodermal sensors for hydration monitoring. Datasets on hydration states were used to train AI algorithms, such as CNN and hybrid Bi-LSTM models. Data was collected using the BITalino toolkit, and Python-based frameworks like TensorFlow and Scikit-learn were used for AI model training and validation. For smartphone-based edge computing, Matsumura et al. [28] used an Echo State Network (ESN) for real-time identification of anomalies, which was developed using Python, Scikit-learn, and Flutter SDK.

5.2.4. Evaluation Strategy

Strict evaluation techniques are used to ensure the success of AI-driven physiological monitoring. Li et al. [20] tested HRV monitoring by contrasting clinical ECG data with readings from consumer wearable devices. SDNN, RMSSD, and LF/HF ratios were the primary measures utilized for validation, guaranteeing accuracy in monitoring autonomic nervous system performance. Deep learning frameworks and power spectral density analysis were used to evaluate the models, and ongoing monitoring offered insightful information about physiological conditions. In order to test their drowning avoidance algorithm, Kałamajska et al. [27] conducted breath-holding trials in a controlled setting that replicated actual drowning conditions. Their model, which used MEMS accelerometers and pulse oximeter data, showed a 90% accuracy rate in detecting notable drops in heart rate and SpO2 prior to the onset of distress. To ensure prompt detection, performance was evaluated using variance analysis, false alarm rates, and alarm response times.
Liaqat et al. [30] used real-world experiments to evaluate their hydration monitoring model against clinical hydration markers. The study contrasted laboratory data with AI-driven estimates of hydration levels and used k-fold cross-validation. The precision as well as recall metrics of the Bi-LSTM model ensured durability across various physical settings, and it was able to distinguish between hydration states with 97% accuracy. To add further, the multimodal sensor patch was evaluated by Matsumura et al. [28] on three volunteers under various environmental circumstances. After ten hours of continuous monitoring, the ESN model showed consistent performance with an accuracy of 96.6% in detecting arrhythmias.

5.2.5. Datasets, Data Processing, and Leakage Prevention

The studies reviewed utilize extensive datasets collected from wearable sensors in real-world trials. Preprocessing techniques such as normalization, filtering, and artifact removal improve signal clarity and ensure data integrity.
1. Data Leakage Prevention: To ensure the reliability and generalizability of AI models, cross-validation techniques such as k-fold cross-validation are implemented. By maintaining the independence of the training and testing datasets, Li et al. [20] used cross-validation techniques to stop data leaking in HRV monitoring models. The robustness of the model was increased by applying bias correction techniques to account for individual physiological variations. In order to avoid overfitting, Kałamajska et al. [27] employed a patient independent validation strategy in their drowning detection models, keeping data from various participants apart. Multiple test iterations were used in the evaluation to guarantee the accuracy of the forecasts of heart rate trend and SpO2.
K-fold cross-validation was used by Liaqat et al. [30] to improve the precision of hydration monitoring programs. In order to improve generalizability and avoid over-representation of any particular condition, data augmentation techniques were employed to equalize hydration states across many participants. To enhance model generalization, multimodal sensor patch analysis [28] used Gaussian noise injection and data augmentation. Data leakage prevention strategies, including patient-independent validation, help ensure that AI models do not memorize patterns specific to training data, thereby enhancing real-world applicability.

5.2.6. Similarities and Reusable Processing Patterns

These studies share important similarities even if they concentrate on distinct physiological markers. Machine learning models are regularly employed to identify health anomalies, demonstrating the recurrent theme of AI driven pattern identification [20,27,28,30]. To reduce noise and retrieve pertinent physiological data, signal processing methods such as band-pass filtering, polynomial interpolation, and FFT are used in all studies. All of the studies also stress the importance of real-time health monitoring, which allows for continuous vital sign assessment and lessens the need for therapeutic interventions. These overlapping approaches show how AI-based data processing techniques may be applied across many domains, enabling developments in one domain to be applied to others. The main findings related to vital-sign monitoring are summarized in Table 4.

5.3. Biochemical Sweat Sensing

5.3.1. Physiological Targets and Sampling Constraints

Biochemical analysis of sweat provides a non-invasive window on hydration, metabolism, stress, and disease, since this biofluid carries electrolytes, metabolites, proteins, cytokines, hormones, and even drugs [4]. Electrochemical sensors dominate current wearables for their sensitivity and ease of use, while colorimetric optics offer battery-free options; both face challenges from motion artifacts, electronic noise, and the low concentration of analytes in sweat compared with blood [4,42,43]. Correlations between sweat and blood can be confounded by molecule size, skin contamination, sweat rate, pH, and temperature, motivating data-driven calibration; once machine/deep learning models are trained for a user and task, strict sweat-to-blood mapping becomes unnecessary, and multimodal fusion of several signals can support early diagnosis where no single biomarker suffices [4].

5.3.2. Sensor Classes and Use Cases

Electrochemical, enzyme-amperometric patches for lactate have been applied to exercise testing and clinical monitoring, detecting sweat-lactate thresholds that track ventilatory or blood lactate thresholds in many settings, including cardiovascular disease and hypoxia studies [46,48,49]. Solid-contact ion-selective electrodes in microfluidic cassettes measure sodium and potassium for hydration assessment, achieving near Nernstian behavior with low drift during cycling trials [56]. Optical colorimetry on textiles quantifies pH and glucose by hue/intensity changes captured with a smartphone or onboard color sensor; recent cotton patches with lightweight ML classify pH and glucose with ~90–95% accuracy, and a wristband µCAD system retrieves pH in real time via a Boltzmann calibration [53,54]. Self-powered concepts include a paper battery conductivity patch that flips an electrochromic indicator when sweat salt exceeds a diagnostic threshold, eliminating external electronics [63]. Battery-free RFID patches integrate Na potentiometry and temperature sensing, harvesting power from an NFC phone for multi-day wear [64]. Across these platforms, nanomaterial electrodes (CNTs, nanowires, and Prussian Blue), stretchable substrates, and epidermal microfluidics are combined, with optional iontophoresis for on-demand sweat [4,58].

5.3.3. Feature Extraction and AI Interpretation

Feature design is central to turning raw signals into predictions. In multispectral smartwatch PPG, water-absorption dynamics linked to sweat were captured by extracting 642 time/frequency features; the monotonic slope at 1450 nm emerged as the strongest predictor of sweat-film onset, matching sticker ground truth within ±2 min when windows were 15 min apart [45]. For overlapping voltammetric peaks of amino acids, four explainable DPV features (two peak currents and two peak potentials across electrodes) enabled a k-NN classifier to reach 99.3% accuracy on mixture × pH categories, followed by a neural regressor with R2 > 0.99 for tyrosine/tryptophan concentrations against HPLC [60]. In colorimetric sensing, partitioning patch images into sub-regions to build a 15-feature RGB vector allowed LDA/SVM classifiers to achieve ~90% pH and ~95% glucose accuracy, outperforming raw-hue thresholding [53]. For lactate thresholding, automated change-point logic on the time-series identifies the first sustained rise above baseline and aligns with ventilatory/blood thresholds in cooler air, while divergence appears in heat, underlining the role of context features such as temperature and sweat-rate kinetics [46].

5.3.4. Tools, Frameworks, and Algorithms

Wearable stacks typically stream 1–25 Hz data via Bluetooth LE or NFC to smartphones for real-time visualization and logging; examples span amperometric strips, color sensors, and DPV interfaces in coin-cell or phone-powered formats [52,57,59,60,64]. Calibration frameworks convert raw observables into concentrations using linear/Nernstian slopes for ions or Boltzmann fits for colorimetric pH; temperature, pH, and flow-rate compensation are common to stabilize enzymatic and potentiometric outputs [4,54,56,64]. On the algorithmic side, lightweight models dominate for on-edge inference: gradient-boosted trees with SHAP for feature attribution in optical hydration, LDA/SVM for colorimetric textiles, and k-NN plus shallow neural regressors for multianalyte voltammetry [45,53,60]. Fabrication and deployment emphasize scalable printing/laser processes, smartphone/IoT telemetry, and bias-aware ML pipelines that account for intersubject variability and avoid optimistic validation [34,58].

5.3.5. Evaluation and Translational Risks

Evaluation spans benchtop characterization, on-body trials, and comparisons to gold standards. In vitro, devices establish linear ranges, sensitivities, and limits of detection, e.g., Na patches with 10–90 mM calibration and near-Nernstian slope, or conductivity watches with R2 ≈ 0.98 to commercial probes and <2 mV h−1 drift [45,51]. Field tests stress continuous flow, adhesion, and telemetry over tens to hundreds of minutes; treadmill/cycling studies confirm expected dynamics such as dehydration-driven conductivity increases and post-meal glucose peaks [57,64]. Clinical/physiological alignment is assessed via correlations and Bland–Altman analyses between sweat thresholds and ventilatory/blood references, with predefined acceptance such as ≥70% cross-validated accuracy for sweat-onset detection, ≥90% classifier accuracy for colorimetric patches, or ±15 W agreement for sLT vs. VT in hypoxia/clinical studies [45,48,49,53]. Reviews converge on criteria of ±5–10% chemical error, sub-5 min response, mechanical durability over 100–1000 cycles, hours-long stability, and robust on-body performance beyond bench tests [52,58].

5.3.6. Datasets and Data Processing Approaches

Sweat sensing datasets are typically bespoke and modest in scale, assembled per study rather than as shared repositories. Examples include a treadmill corpus of 19 participants over 103 runs with four-channel PPG plus motion for sweat-onset modeling, and 285 DPV samples spanning mixtures × pH for amino-acid sensing [45,60]. Surveys of smart textiles and fluidics synthesize experimental streams across 35+ prototypes, covering pH, glucose, lactate, ions, cortisol, and drugs at 0.1–10 Hz, effectively forming design-case datasets rather than large public collections [50,51]. Signal conditioning is ubiquitous: moving-average smoothing and zero-baseline correction, low-pass filtering of amperometric currents, temperature and pH compensation, and flow-aware dilution correction using microfluidics or explicit sweat-rate sensing to convert concentration to flux [4,49,55]. Image-based pipelines standardize lighting, crop regions of interest, and extract color-space features for calibration or classification, while time/frequency features from optical or electrochemical streams capture monotonic trends and spectral content for ML models [45,53].
1. Data Leakage Prevention: Given small datasets and strong subject effects, studies enforce strict partitions to avoid optimistic metrics. In multispectral hydration modeling, classifiers were trained and tested on windows at least 15 min apart with 4-fold cross-validation to prevent short-term autocorrelation leakage; accuracy > 0.70 emerged only under such separation, highlighting the need for temporally disjoint evaluation [36]. Bias-aware pipelines and leave-one-subject-out designs are emphasized to ensure generalization beyond individual baselines, alongside transparent reporting when deterministic logic (no ML) is used, which eliminates training/test contamination by design [4].

5.3.7. Similarities and Cross-Application Reuse

Across glucose, lactate, electrolytes, and amino acids, shared constraints drive convergent solutions. Microfluidic capture, evaporation control, and continuous flow designs recur to stabilize sampling at nanoliter-per-minute sweat rates; these fluidic primitives, including capillary channels, osmotic hydrogels, and evaporation-driven micropumps, transfer readily between applications [57]. Baseline drift removal, temperature normalization, and simple calibration curves are reused across enzyme, potentiometric, and colorimetric modalities, while common feature-extraction templates—wavelet/statistical descriptors, peak-based DPV features, and region-wise color vectors—translate between optical and electrochemical systems [45,53,60]. Multiplexed patches unify channels for Na+/K+/pH/glucose/lactate under one telemetry stack, enabling multimodal ML that reuses preprocessing and model architectures across analytes and supports higher-level state inference [52,58]. Evaluation benchmarks are likewise shared—accuracy bands (±5–10%), response latency, stability, durability, and telemetry continuity—so advances that meet these thresholds in one device class often generalize to others [52,58]. Looking ahead, edge–cloud frameworks and “big-data” ML are positioned as reusable infrastructure for autonomous, personalized sweat analytics, with projects explicitly targeting cloud-assisted inference for wearable biochemical sensing [52,58]. The main findings concerning biochemical sweat sensing are summarized in Table 5.
Synthesis: In biochemical sweat sensing, recent work confirms that raw sensitivity is no longer the only meaningful benchmark. Sample enrichment, biosafety isolation, environmental correction, and multi-analyte interpretation are emerging as equally important determinants of practical value, especially when sweat chemistry is used to support metabolic or diagnostic decision-making.
Synthesis: Motion and biomechanics sensing has matured into a contextual intelligence layer for wearable health systems. Its value now extends beyond activity recognition to the interpretation of signal quality, mechanical loading, rehabilitation status, and the suppression of artifacts in other sensor streams.

5.4. Motion and Biomechanics Sensing

5.4.1. Overview of Basic Applications in Human Activity Monitoring and Medicine

This section surveys the principal application areas in which motion and biomechanics sensing delivers value in human activity monitoring and medicine. Across the literature, two complementary objectives recur: the discrete recognition of activities and events, and the continuous estimation of biomechanical states such as joint kinematics and muscle-derived torque. Representative studies illustrate this spectrum, from accelerometer-based fall detection optimized for edge deployment in older adults [66], through dual-IMU knee-angle tracking validated against optical motion capture on land and underwater and refined via Gaussian Process Regression [67], to soft strain patches that map surface deformation to joint torque using simple cubic calibration with reliability during fatigue [69], and multi-sensor human activity recognition pipelines employing wavelet–graph filtering to enhance generalization across public datasets [70]. Across these use cases, a common workflow emerges: careful signal acquisition, denoising and synchronization, physically or statistically informed feature construction, and model training with subject-aware validation and clinically interpretable metrics, enabling translation from laboratory settings to resource-constrained wearables [66,67,69,70].
1. Typical Sensors for Specific Applications: Motion and biomechanics sensing applications employ a range of sensor types depending on the targeted activity or health metric. In wearable systems for human activity monitoring, inertial sensors such as accelerometers and gyroscopes are most common—for example, tri-axial accelerometers were used to capture body motion in a fall detection study involving 120 elderly participants [66]. For gait analysis and rehabilitation, researchers often utilize wearable inertial measurement units (IMUs) attached to the limbs, which can operate both in traditional clinical settings and in unusual environments like underwater therapy pools [67]. Novel soft and flexible sensors have also emerged for biomechanics: one approach uses small strain-sensitive patches placed on muscles to non-invasively measure muscle activity and estimate joint force output during exercise [69]. In addition, multimodal setups can incorporate biomedical signals (e.g., electrocardiograms) and other wearable transducers (such as stretch or magnetic sensors) alongside accelerometers and gyros, to provide comprehensive data for complex activity recognition tasks [70].
2. Insights on Features of Extracted Data vs. Predictions: After data collection, effective signal processing and feature extraction are critical for translating raw sensor outputs into meaningful predictions or classifications. In many cases, minimal preprocessing is applied to inertial data (for instance, a Finite Impulse Response filter can be used to denoise accelerometer signals [66]) before feeding the time-series into learning algorithms that automatically infer high-level features (as seen with deep CNN-LSTM models for fall detection on wearable accelerometers [52]). In other scenarios, researchers derive explicit biomechanical features from the sensor readings based on physical models—for example, converting raw IMU measurements into joint kinematic signals (such as knee angles computed via quaternion-based formulas), which can then be calibrated against reference motion-capture measurements [67]. Notably, simple statistical or regression techniques can suffice for certain predictions: a low-pass filtered muscle strain signal, when normalized and fit with a subject-independent cubic regression model, yielded torque estimates highly correlated with dynamometer readings (r2 0.90) without requiring complex machine learning [67]. At the other end of the spectrum, comprehensive activity recognition frameworks perform multi-stage feature engineering (e.g., wavelet transform-based feature scattering and optimized feature selection) to distill rich information from multi-sensor inputs, thereby improving classification accuracy in diverse movement datasets [69].
3. Typical Tools/Frameworks and Algorithms: Implementing motion-sensing applications requires both appropriate hardware platforms for data collection and software frameworks for data analysis. On the hardware side, studies utilize both custom and off-the-shelf devices: for example, compact battery-powered IMU loggers can record 9-axis movement data in the field [67], and standard microcontroller-based platforms (like Raspberry Pi or NVIDIA Jetson Nano boards) have been used to deploy trained models for real-time fall detection at the edge of the network [66]. Data processing and model development commonly rely on scientific computing environments such as MATLAB for signal processing, sensor calibration, and visualization [67,69] or on Python-based machine learning libraries executed in cloud platforms (Google Collaboratory was used to train deep neural networks on the accelerometer dataset efficiently [66]). The choice of algorithms ranges from classical to cutting-edge. Simple calibration models (e.g., polynomial regression or Gaussian Process Regression) have proven effective for mapping sensor readings to continuous biomechanical variables with high accuracy [67,69]. In contrast, human activity classification tasks typically leverage advanced machine learning techniques—including deep convolutional and recurrent neural networks to automatically recognize patterns in sensor time-series [66]—or even specialized graph-based filters that exploit spectral signal representations (the WGF-LN algorithm) to achieve higher accuracy on multi-sensor datasets [70].
4. Evaluation Strategy: Rigorous evaluation strategies are essential to ensure that motion-sensing systems are accurate and reliable for real-world health and activity monitoring. For human activity recognition and fall-detection models, performance is primarily assessed using standard classification metrics such as accuracy, precision, recall, and F1-score [52,55]. Researchers also pay close attention to validation protocols; for instance, an 80/20 train–test split with stratified sampling (to prevent any data leakage between subjects) was used to obtain reliable performance estimates in the elderly fall detection study [66]. In biomechanical sensing applications, evaluations are often grounded in direct comparisons with gold-standard instruments: a wearable system’s outputs (e.g., joint angles or estimated forces) are quantitatively compared to reference measurements from optical motion-capture systems or force-measurement devices like dynamometers [67,70]. Accordingly, error metrics such as root-mean-square error (RMSE) and correlation coefficients (e.g., Pearson’s r) are reported to summarize the agreement between the sensor-based estimates and the ground truth signals [67,69]. In addition, studies frequently include Bland–Altman analysis to check for any systematic bias and to establish the limits of agreement between the new sensor and the established standard method [67,69]. Specific domain-related success criteria may be defined as well—for example, requiring that a wearable IMU system achieves an angle measurement error below about 7◦ and r > 0.80 against an optical motion reference for gait tracking [64] or that a muscle sensor patch maintains <15% normalized error with r ≥ 0.7 when estimating torque against a dynamometer benchmark [69]. These multifaceted evaluation approaches ensure that motion and biomechanics sensing techniques meet the accuracy and reliability thresholds needed for healthcare and activity monitoring applications.

5.4.2. Datasets and Data Processing Approaches

Datasets in motion and biomechanics sensing vary from purpose-built experimental collections to widely used public repositories. Purpose-built datasets often capture specific activities under controlled conditions, such as elderly subjects performing fall-related motions [66], or gait trials on land and underwater with simultaneous optical motion capture [67]. Public datasets—such as w-HAR, mHealth, PAMAP2, WISDM, and public HAR—are frequently employed for human activity recognition, offering multi-sensor data from accelerometers, gyroscopes, magnetometers, and other modalities [70]. Data processing pipelines are application-dependent but share common elements: cleaning (e.g., Mode-Integrated Binning Algorithm), integration of heterogeneous sensor data, transformation via discretization or wavelet-based decomposition, feature extraction using wavelet scattering or autoencoders, feature selection with optimization algorithms, and final normalization [70]. In biomechanical contexts, raw sensor readings are converted into biomechanical parameters via model-based computations (such as quaternion to joint-angle conversion [67]) or empirical calibration models [69]. In activity recognition, multi-stage processing maximizes separability between activity classes, and the combination of optimized features and advanced classification algorithms yields performance improvements over baseline models [70].
Synthesis: Edge AI is becoming the operational core of wearable biosensing rather than a downstream analytical add-on. The highest-impact studies are those that jointly optimize model size, inference latency, data locality, and interpretability while preserving sufficient analytical performance for real-world deployment.

5.4.3. Similarities Between These Applications and Reuse of Data Processing

Across motion and biomechanics sensing applications, a number of methodological parallels emerge. Regardless of whether the focus is on classification or continuous estimation, success hinges on robust signal acquisition, domain-informed preprocessing, and careful evaluation. Noise filtering, normalization, and feature extraction—whether through physical models or statistical transformations—are universal steps that can be adapted across tasks. Calibration strategies such as regression mapping between sensor outputs and gold-standard references in biomechanics [67,69] parallel feature optimization processes in activity recognition [70], highlighting the shared importance of aligning raw sensor space with a more informative, task-specific feature space. Furthermore, many tools and frameworks—MATLAB for signal processing, Python for model training, edge devices for deployment—are consistently employed, underscoring the potential for cross-domain reuse of both computational methods and hardware infrastructures. This methodological convergence suggests that improvements in one application, such as enhanced noise-robust feature extraction or more efficient edge deployment strategies, could be rapidly translated to others, accelerating innovation and deployment in diverse health and activity monitoring scenarios. The main findings concerning motion and biomechanics sensing are summarized in Table 6.

5.5. Edge AI and Data Analytics

5.5.1. Overview of Basic Applications in Human Activity Monitoring and Medicine

1. Typical Sensors for Specific Applications: Edge AI systems in human activity monitoring and medical analytics commonly integrate diverse sensors to capture relevant data at the source. For instance, wearable platforms for affective computing combine neurological and cardiovascular sensors—a wrist-worn system can include an 8-channel EEG, a 12-lead ECG, and a PPG optical sensor to simultaneously record brain, heart, and pulse signals [71]. Human activity recognition (HAR) applications often rely on inertial measurement units (IMUs) (e.g., 6-axis accelerometers/gyroscopes) embedded in smartphones, smartwatches, or specialized wearables, sometimes augmented by cameras or LiDAR for visual context [74,75]. In medical monitoring, specialized biosensors like multichannel scalp EEG electrodes, pulse oximeters, and ECG leads are employed for detecting events such as epileptic seizures or stress levels, with data acquired at high sampling rates (e.g., EEG at 250 Hz) [71,76]. These sensor setups are typically connected to nearby edge devices (often using Bluetooth Low Energy or similar wireless links) and interfaced via resource-friendly hardware such as microcontroller boards, Raspberry Pis, or Jetson modules that serve as local gateways for data processing [73,75].
2. Insights on Features of Extracted Data vs. Predictions: A hallmark of edge AI applications is the extraction of informative features from raw sensor streams before or during inference, balancing data reduction with predictive fidelity. Many systems perform on-device preprocessing like filtering, normalization, and segmentation of signals into temporal windows to derive feature vectors relevant to the prediction task [71,74]. For example, an emotion recognition framework partitions EEG data into 4 s segments and applies a short-time Fourier transform (STFT) to isolate power in specific frequency bands (α, β, and γ in frontal–temporal channels), which serve as features for a lightweight 2-D CNN classifier [72]. In parallel, the system computes statistical features from 30 s ECG and PPG windows (including R-R intervals, heart rate variability, and pulse transit time) and feeds them into a 1-D CNN; a fuzzy logic module then fuses the CNN outputs to predict emotional states (happiness, anger, and sadness) in real time [71]. Likewise, wearable HAR solutions slide a window over IMU sensor streams (e.g., a few seconds of 6-axis data) and either hand-engineered features or input the raw sequence into temporal models (such as a 128-cell LSTM network) to classify activities on-device [75]. In a biomedical edge application, two feature paradigms were explored for seizure detection: a patient-specific mode that relies on handcrafted EEG features for traditional classifiers (SVMs and decision trees) and a patient-independent mode that employs a compact CNN (the Seizure-Cluster-Inception network) to automatically learn discriminative patterns from raw multichannel EEG data [76]. The CNN-based approach, pre-trained on public epilepsy databases and fine-tuned per user, achieved high event-level sensitivity (~90%) and specificity (~93–95%) in leave-one-patient-out tests, demonstrating that learned feature representations can generalize across individuals more effectively than manually coded features [76]. These examples illustrate how carefully chosen features—whether domain-engineered (frequency bands and physiological indices) or learned by deep networks—directly enable accurate edge predictions from sensor data.
3. Typical Tools/Frameworks and Algorithms: Across human activity and medical edge applications, researchers favor efficient algorithms and frameworks that can run on limited hardware while maintaining predictive performance. Lightweight deep learning models dominate, with small convolutional neural networks (CNNs) and recurrent networks (LSTMs/GRUs) commonly used for image and time-series sensor analysis on the edge [6,73]. Classical machine learning methods like support vector machines (SVMs), k-nearest neighbors, random forests, and decision trees are also employed, particularly for simpler tabular or physiological signal features, due to their low computational cost [6]. To address privacy and bandwidth constraints, federated learning and transfer learning techniques are increasingly adopted—about 25% of recent works use pre-trained models or on-device transfer learning, and 15% implement federated learning to train collaboratively without centralized raw data [73]. Resource management and optimization problems (e.g., task offloading or scheduling between device, edge, and cloud) are often handled with reinforcement learning agents or bio-inspired heuristics (particle swarm and genetic algorithms), underlining the diversity of AI methods at the edge [6,73]. In terms of implementation frameworks and toolchains, developers frequently leverage popular deep learning libraries and optimize them for edge deployment. TensorFlow is the most prominent platform (used in ~29% of reported cases), with others like Keras (~8%) and MATLAB (~8%) also appearing for model development [73]. For on-device inference, TensorFlow Lite is a common choice (used in ~6% of the projects) to compress and run models on microcontrollers and smartphones [73]. Edge applications in the literature often run on affordable hardware such as Raspberry Pi boards, NVIDIA Jetson Nano/TX modules, or ESP32 microcontrollers, sometimes coupled with FPGA-based accelerators for specialized tasks [71,73]. For example, one wearable emotion detection system uses a Kintex-7 FPGA with a RISC-V core and dedicated CNN accelerator to process EEG/ECG/PPG signals entirely on the edge in real time [69]. Another study introduces a single-chip solution with an analog front-end and digital CNN accelerator integrated for ultra-low-power EEG analysis, highlighting the trend towards custom System-on-Chip designs in biomedical edge AI [76]. Alongside real hardware, researchers utilize network simulators and IoT frameworks (EdgeCloudSim, iFogSim, YAFS) to model edge–cloud deployments and evaluate performance under various scenarios [71,73]. The software stack in many edge setups is modular: containerized microservices and virtualization (SDN/NFV) are used to deploy analytics components, and techniques like model splitting or early-exit DNNs partition the inference workload between the device and edge server to optimize latency and energy use [6,74]. This rich ecosystem of tools and algorithms enables practitioners to tailor edge AI solutions for both activity monitoring and medical analytics, meeting the dual demands of computational efficiency and predictive accuracy.
4. Evaluation Strategy: Edge AI applications in these domains are evaluated through a multi-faceted lens, encompassing both learning accuracy and system-level performance. Surveys report that timing metrics are paramount—delay and latency constitute about 31% of metrics tracked—followed by considerations of cost (22%); accuracy (17%); energy consumption (14%); and, to a lesser extent, throughput (7%) and network bandwidth usage (2%). Rather than optimizing a single metric, studies typically assess trade-offs among these factors. A solution is generally deemed “good” if it can maintain model accuracy close to cloud-based levels while significantly reducing inference latency, energy usage, and data transmission requirements in the edge setting. Many authors aim for informal benchmarks such as achieving at least ~90% predictive accuracy and sub-second (often sub-100 ms) response times, all within the power and memory limits of edge devices [73,74]. For example, once inference is moved “one wireless hop” away from data sources, case studies consistently demonstrate end-to-end delays under 0.2–0.5 s, depending on the application, along with 30–70% reductions in network traffic compared to cloud-only processing. In addition to these general goals, specific application scenarios impose their own success criteria. In human activity recognition wearables, one design protocol defines a successful run as meeting four criteria: (i) edge inference latency below a 0.5 s real-time threshold, (ii) classification accuracy above 90% (comparable to cloud models), (iii) energy consumption within the budget of a battery-powered Pi-class device (or under 20 W more powerful edge boards), and (iv) reliable wireless streaming throughout the required monitoring session (potentially several hours) [6]. An achieved example is an LSTM-based HAR edge node reaching ~94.7% accuracy on the KU-HAR dataset with inference times on the order of milliseconds, well within these limits [6]. In the medical domain, performance standards can be even more stringent: a wearable seizure detection platform considers itself “good” only if it exceeds 90% sensitivity in detecting seizure events while keeping false positive rates under 10%, and simultaneously maintains a low end-to-end latency sufficient for closed-loop intervention (neural stimulation) and operates within the power constraints of a coin-cell battery [71]. Similarly, an edge-based emotion monitoring system reported mean accuracies around 76–77% for subject-independent mood classification, which the authors deemed acceptable given the complexity of EEG signals, but they emphasize the need to improve this further for real-world reliability [71,78]. Broadly, the evaluation methodologies stress consistent performance under realistic conditions—for instance, sustaining accuracy under varying user loads or environmental noise—as well as compliance with safety, privacy, and usability requirements relevant to the deployment context [75,78]. Systems that meet their application-specific accuracy targets and latency budgets, while efficiently managing resource constraints and preserving data privacy (e.g., keeping personal data local by default), are held up as the state of the art in edge AI for both activity monitoring and medical analytics [74,78].

5.5.2. Datasets and Data Processing Approaches

Edge AI research in human activity and healthcare draws on a mix of public datasets and custom-collected data, accompanied by rigorous processing pipelines to ensure data quality and relevance. For HAR, common benchmarks like the KU-HAR dataset have been used to evaluate edge models—one reported an accuracy of 94.7% on the KU-HAR test split using an on-device LSTM model, demonstrating that edge-deployed classifiers can match cloud accuracy on standard activities data. In healthcare and affective computing, many studies rely on domain-specific data gathered from volunteers or patients. For example, an emotion monitoring platform recorded synchronized EEG, ECG, and PPG from 20 subjects under induced emotional states to build its training set [57]. In another case, a biomedical edge AI system leveraged large open datasets of EEG recordings (the CHB-MIT Scalp EEG database and a European epilepsy dataset) to pre-train a seizure detection model, which was later fine-tuned with individual patient data on the device [76]. Regardless of the source, raw sensor data typically undergoes substantial preprocessing at or near the edge. Signals are filtered to remove noise (e.g., EEG baseline drift removal [69]), normalized, and then divided into time windows or frames that capture the temporal patterns needed for recognition [71,74]. Edge nodes may perform feature extraction steps like computing frequency transforms or statistical measures locally, thereby compressing the data volume—only the distilled feature vectors or relevant events are transmitted to a server or cloud if necessary. This approach of on-node data reduction (seen in roughly 9% of edge studies focusing on cleaning data at the source [73]) conserves bandwidth and enhances privacy by ensuring that high-dimensional raw data (video streams and bio-signals) need not leave the immediate device unless absolutely required [73,74]. By carefully selecting datasets and processing methods, researchers aim to create robust edge AI models that generalize well while operating within the practical limits of sensor quality and edge computing power.
1. Data Leakage Prevention: To prevent inadvertent data leakage and overfitting in model evaluation, researchers employ strict validation strategies that segregate training and testing data by subject or cohort. A prominent technique is leave-one-subject-out cross-validation, wherein data from each individual is completely held out as a test set in turn. This was used in the wearable EEG-based emotion classification study: the model was trained on nineteen subjects and tested on the one left-out subject, cycling through all volunteers, which yielded a mean accuracy of about 76.9% for unseen individuals [57]. The use of a subject-independent test ensures that person-specific patterns (e.g., unique EEG or ECG characteristics) do not leak into the training data, thereby providing a more realistic measure of how the system would perform on new users. Similarly, in an edge AI seizure detection system, the authors applied a leave-one-patient-out evaluation using multi-patient EEG datasets—training on all but one patient and testing on the excluded patient—achieving approximately 90% sensitivity and 94% specificity on completely held-out patients. This rigorous approach confirms that the CNN can generalize to patients it was not trained on, an important indicator that the model is not simply memorizing individual-specific features [76]. By partitioning data along subject lines (or time lines, in some cases) and avoiding any overlap between training and test sets, these studies mitigate data leakage. This yields more trustworthy performance estimates and guards against overly optimistic results that could occur if, for example, sensor data from the same person or session were unintentionally used in both model training and validation.

5.5.3. Similarities Between These Applications and Reuse of Data Processing

Although human activity monitoring and medical analytics target different end goals, edge AI implementations in these areas share strikingly similar architectures and can often reuse data processing techniques. Both rely on collecting time-series or imaging data from distributed sensors (wearable or ambient) and performing as much preprocessing and inference as possible on local devices near the data source [74,75]. In practice, an edge node in a fitness tracking scenario and one in a health monitoring scenario will each filter and aggregate raw signals on-device, run lightweight prediction models, and only send concise results or alerts upstream, thus following a common pipeline template. They also tend to employ analogous machine learning models—for instance, compact CNNs, LSTMs, or hybrid networks are prevalent for both inertial sensor data and biosignals—reflecting a convergence on efficient deep learning solutions for edge classification tasks [73,75]. This convergence means that innovations in one domain can be transferred to another. A clear example is the co-design methodology described in a recent PhD thesis, which was validated on two vastly different case studies (forest ecology sensing vs. wearable human activity recognition) using the same integrated edge AI pipeline and achieving success in both contexts [75]. Likewise, a multimodal emotion detection pipeline that fuses EEG, ECG, and PPG data on the edge shares core principles (sensor synchronization, feature fusion, and real-time CNN inference) with other health and activity monitoring systems, suggesting that its data processing approach could be adapted to related applications [41,72]. Common objectives—such as minimizing latency by processing data “one wireless hop” away, preserving user privacy by keeping raw data local, and maintaining high accuracy with resource-constrained models—drive both application types and lead them to adopt similar solutions [74]. As a result, best practices in edge data handling (noise filtering, windowing, and feature extraction), model optimization (quantization and early exit strategies), and even pre-trained models or transfer learning techniques can often be reused across human activity and medical AI deployments. In summary, the synergy between these domains allows advances in edge AI—whether in algorithms, hardware, or data processing—to mutually reinforce improvements in monitoring human activities and delivering medical insights at the network edge.
Cross-sectional conclusion: General biosensor platforms are becoming more clinically credible when they are designed as integrated systems that align mechanics, chemistry, electronics, and AI. The field is moving away from isolated feature demonstrations toward reusable architectures that can support multimodal monitoring and rigorous validation. A brief synthesis of the main findings related to edge AI and data analytics is provided in Table 7.
Cross-sectional conclusion: Vital-sign monitoring is entering a stage in which robustness matters more than novelty. Wearables that combine several physiological channels and explicitly account for motion, skin contact quality, and environmental interference are more likely to deliver durable clinical or consumer value.

5.6. Cautionary Notes and Future Directions

Figure 10 summarizes the most important translational challenges and corresponding solution directions discussed in this conclusion.
While the reviewed studies showcase impressive accuracy and technical innovation, many models are trained on small, homogeneous datasets. Overfitting and data leakage can lead to inflated performance numbers; few papers employ subject-independent splits or external validation. We caution readers that near-perfect accuracy on limited datasets does not guarantee generalizability in diverse real-world populations.
Sensor calibration drift, biofouling, sweat rate variability, and motion artifacts remain persistent challenges. Novel materials (e.g., antifouling coatings and self-healing polymers), integrated microfluidics, and improved signal processing are needed to enhance long-term stability and reliability. Regulatory compliance and data privacy must be considered from the outset, particularly when deploying federated learning or cloud-connected platforms.
Looking forward, interdisciplinary collaboration will be essential: materials scientists, to engineer skin-conformal sensors; hardware designers, to optimize energy efficiency; data scientists, to develop robust AI models; clinicians, to guide meaningful endpoints; and ethicists, to address privacy and equity. Standardized benchmarking datasets and public challenges could accelerate progress. We encourage the community to share open data and code, perform rigorous validation. and consider socio-economic factors when translating wearable technologies into practice.

6. Conclusions

Cross-sectional conclusion: Biochemical sweat sensing has become substantially more sophisticated, but its translational future depends on solving sampling realism, biosafety, calibration drift, and cross-subject variability. The strongest recent studies succeed because they co-design collection, sensing, and AI interpretation rather than optimize only the sensing chemistry.

6.1. General Biosensor Platforms

The reviewed studies demonstrate that recent advances in general biosensing platforms indicates a transition toward more integrated and intelligent diagnostic systems. Wearable biosensors have demonstrated a shift from episodic testing toward continuous, real-time monitoring through non-invasive and microfluidics-enabled sampling strategies. The incorporation of dynamic fluid handling, multiplexed detection, and flexible material systems underscores the importance of platform stability, signal consistency, and user adaptability in next-generation biosensing design. At the same time, the convergence of synthetic biology with lab-on-a-chip technologies introduces a new level of programmability and specificity through engineered biological circuits, including CRISPR-based and cell-free systems. These platforms enable automated, low-volume, and multiplexed analysis within compact devices, significantly reducing reliance on centralized laboratory infrastructure. Similarly, integration of artificial intelligence with wearable sensor technologies has significantly enhanced healthcare monitoring, disease detection, and personalized health management. The ability to continuously collect and analyze physiological and biochemical data from wearable devices has transformed health monitoring from reactive to proactive care. Through the application of machine learning models, deep learning architectures, and advanced data processing strategies, researchers have achieved improved accuracy in predicting health abnormalities, monitoring fatigue, and analyzing biomarker trends. The studies highlight the growing sophistication of wearable sensors, ranging from electrochemical and optical sensors to complex biosensing systems embedded with microfluidic and enzyme-based technologies. These sensors are capable of capturing real-time physiological data, including heart rate, blood oxygen saturation, glucose levels, and hydration status. The incorporation of AI models, including convolutional neural networks, and recurrent neural networks, provides actionable insights for early diagnosis and intervention. The studies also emphasize the importance of rigorous validation techniques, such as cross-validation, sensitivity and specificity analysis, and comparison with clinical standards, to ensure the reliability and accuracy of AI-driven wearable technologies in practical applications. Despite these advancements, challenges remain in terms of biological stability, signal reliability, scalability, data privacy, sensor calibration, and the generalizability of AI models across diverse populations and medical conditions. Future research directions should focus not only on expanding sensor performance but also in bringing improvements in designing robust, adaptive, and integrated systems capable of sustained operation, automated analysis, along with refining AI algorithms for improved interpretability, and addressing regulatory and ethical concerns related to data security and patient privacy. The promising results across the reviewed studies confirm the transformative potential of AI-enhanced wearable sensors in healthcare, paving the way for more personalized, accurate, and accessible health monitoring solutions.

6.2. Vital Sign Monitoring

Personal health tracking has greatly improved with the combination of wearable physiological monitoring and artificial intelligence. Recent developments in wearable and multimodal biosensing systems highlight the transition from experimental prototypes to clinically validated and system-integrated technologies. Given that wearable biosensors can achieve a high level of agreement with conventional bedside monitoring systems, they reflect confirming increased reliability for continuous physiological tracking under controlled clinical conditions. Such findings are critical in establishing confidence in wearable platforms as viable alternatives to traditional instrumentation, particularly for real-time and decentralized monitoring. Additionally, broader system-level analyses of wearable sensing technologies emphasize the emergence of multimodal platforms that integrate both biochemical and physical sensing capabilities within a single device architecture. The research evaluated shows how electrodermal sensors, ECG, and PPG help to improve hydration monitoring, drowning prevention, and HRV analysis [20,27,28,30]. The accuracy and efficacy of these technologies have been improved by deep learning architectures, AI models, and advanced data preprocessing techniques. But, issues like model generalization, standardized on-body testing protocols, sustainable energy solutions, data privacy, and sensor calibration still exist. Strengthening model interpretability, increasing datasets by covering a variety of demographics, and guaranteeing regulatory compliance ought to be the main objectives of future studies. AI-driven physiological tracking systems have the potential to alter healthcare by tackling these issues and improving the accessibility, accuracy, and personalization of health evaluations.

6.3. Biochemical Sweat Sensing

In summary, the last decade has seen substantial technical progress in biochemical sweat sensing: electrochemical enzyme- and ion-selective platforms remain the workhorse for real-time biochemical readouts, while optical/colorimetric approaches and integrated microfluidics enable low-power, textile, and watch-class form factors. Advances in materials, integration of stable synthetic recognition elements, flexible electrochemical platforms, and nanofabrication have pushed detection limits into physiologically relevant ranges and made flexible, wearable implementations feasible for continuous monitoring in both sport and clinical settings [50,52,55,73].
Cross-sectional conclusion: Motion and biomechanics sensing is now indispensable both as a primary measurement modality and as contextual support for multimodal health inference. Its future impact will be largest in rehabilitation, workload monitoring, and artifact-aware fusion systems.
Similarly, molecularly imprinted polymer (MIP)-based sensors provide a robust alternative to conventional biorecognition elements, offering enhanced chemical stability, cost-effectiveness, and long-term usability. Coupled with electrochemical transduction techniques and nanomaterial-enhanced electrodes, these platforms achieve high sensitivity while remaining compatible with wearable formats.
Progress in data processing has been equally important: careful segmentation and feature engineering, combined with lightweight and explainable machine learning models (e.g., gradient boosting, SVM/LDA, small CNNs, and targeted regressors), routinely transform noisy electrical or image signals into robust estimates of analytes, event onsets, or thresholds. Representative studies demonstrate that physically interpretable features (for example, IR absorption slopes, DPV peak metrics, or segmented RGB maps) yield high cross-validated accuracy and permit model explainability that supports deployment on phones or edge devices [57,71,74,75].
At the same time, evaluation studies and clinical pilots highlight both promise and limits. Several lactate and glucose patch trials report strong agreement with established physiological references under controlled conditions, and prospective clinical work shows feasibility in patient populations, but sweat–blood relationships and sensor responsivity remain condition-dependent (e.g., affected by sweat rate, temperature, and skin contamination), and practical issues such as drift, biofouling, power, and long-term durability must be solved for reliable mass deployment [53,57,58,60,61]. Rigorous validation using standardized metrics (accuracy, response time, drift, mechanical endurance, and agreement with gold standards) is therefore essential before broader clinical adoption [64,70,73].
Looking forward, the field is well-positioned to translate into impactful applications. Multimodal fusion (combining electrochemical, optical, and sweat-rate signals), on-device or federated learning for personalization, and harmonized data collection protocols promise to close remaining gaps in generalizability and privacy-preserving model training. With coordinated efforts to scale datasets, standardize evaluation, and integrate drift-correction and calibration practices, biochemical sweat sensing can become a practical, non-invasive complement to blood-based assays for sports monitoring, screening, and ambulatory healthcare—a promising trajectory supported by current, encouraging evidence across prototypes and early clinical studies [50,52,55].

6.4. Motion and Biomechanics Sensing

Throughout the updated literature, one message becomes unmistakable: the next leap in wearable biosensing will not come from adding more isolated sensors but from integrating heterogeneous signals into systems that remain interpretable and reliable during real use. Multimodal fusion is now the dominant direction because it can compensate for the weaknesses of individual sensing channels.
Biochemical sensing illustrates this particularly well. Recent sweat platforms show that successful monitoring depends on sample transport, enrichment, biosafety isolation, temperature and sweat-rate correction, and learned contextual interpretation. This is a major conceptual shift away from the older assumption that a single raw sweat biomarker can be read as a direct surrogate for systemic physiology without additional modeling.
Emerging advances in intelligent and predictive biosensing frameworks are successfully enabling a shift from passive detection toward practical decision-support systems. This is enabled by the integration of machine learning approaches in wearable sensors that offer continuous monitoring and real-time risk assessment that combines inertial and electromyographic signals to predict biomechanical stress accurately. Such systems reflect the ability of biosensing platforms in moving beyond measurement into actionable feedback mechanisms, for immediate intervention and adaptive response in clinical environments.
At the algorithmic level, the field is maturing from cloud-dependent classification toward edge-resident decision support. The literature now increasingly values compact models, subject-aware personalization, calibrated uncertainty, and privacy-preserving inference. In practical terms, a wearable model that is slightly less accurate but stable, efficient, and explainable may be more valuable than a larger black-box model that cannot be maintained under deployment constraints.
The main translational bottlenecks are also clearer than before. Recent reviews repeatedly identify sensor drift, batch variability, insufficient external validation, incomplete interoperability, and uneven regulatory evidence as the reasons why promising prototypes fail to become trusted products. These problems are scientific rather than cosmetic: they affect reproducibility, clinical comparability, and user safety.
Materials science remains central, but the target has changed. Instead of searching only for higher sensitivity, recent work prioritizes mechanical resilience, long-term adhesion, biocompatibility, and architectures that support multi-analyte or multimodal sensing. Flexible optical materials, programmable DNA structures, and hybrid enrichment patches are good examples of this shift.
A credible next-stage research agenda should therefore include prospective multi-site validation, harmonized benchmark datasets, explicit reporting of calibration and drift behavior, and stronger coupling between sensing performance and clinically relevant endpoints. Without these elements, even technically impressive devices will remain difficult to compare and difficult to trust.
In summary, the field is now technologically rich enough to support truly personalized monitoring, but only if future studies treat sensing, AI, and validation as one integrated problem. The most impactful work over the coming years will likely be the work that proves not only that a wearable can detect a signal but that it can do so repeatably, safely, and meaningfully in the messy conditions of everyday life.
Notably, the successful adoption of subject-independent evaluation protocols, privacy-preserving data handling techniques, and modular data processing pipelines reveals the high degree of methodological maturity in this field [71,75,76,78]. Many of these pipelines and model optimization strategies—such as quantization, federated learning, and early exit architectures—have demonstrated adaptability across distinct application contexts, underscoring the potential for cross domain reuse [6,73,74]. Furthermore, the emphasis on human-centered design principles, real-world operational testing, and alignment with established safety and security guidelines signals a shift toward practical, trustworthy, and sustainable deployment strategies [78].
Overall, this updated review shows a field that is rapidly consolidating around multimodal, AI-assisted, and deployment-oriented wearable biosensing. The most persuasive recent studies no longer present sensing materials or machine learning models in isolation; instead, they demonstrate end-to-end systems in which materials, signal pathways, and inference logic are co-designed.
The strongest progress is visible in three areas. First, material platforms are becoming softer, more biocompatible, and more functionally diverse. Second, sweat and other biofluid sensors are moving toward safer sampling and richer interpretation. Third, edge AI is making personalized, low-latency, privacy-aware analytics more realistic for continuous monitoring.
At the same time, the evidence base also makes the remaining weaknesses unmistakable: drift, calibration burden, subject heterogeneity, biosample instability, and insufficient external validation still limit generalization. These issues should now be treated as first-order design criteria rather than as downstream implementation details.
For that reason, the most credible future systems will be those that combine physiological, biochemical, and biomechanical information; report uncertainty as well as accuracy; and validate performance under realistic motion, heat, hydration, and long-duration wear conditions.
In practical terms, wearable biosensing is ready to transition from a prototype-driven discipline to a standards-driven one. Progress will increasingly depend on reproducible architectures, transparent benchmarking, interoperable data structures, and clinically meaningful evaluation endpoints.
Taken together, the literature now supports a clear conclusion: multimodal wearable biosensing coupled with well-designed edge intelligence is one of the most promising routes toward personalized and preventive healthcare, but its full impact will depend on whether future studies prioritize trustworthiness and translational rigor as strongly as they prioritize innovation.
A second heartening trend is reuse: between platforms, pipelines have reusable building blocks—short-window smoothing, baseline correction and calibration, compact feature sets, cross-validated light models, and standardized agreement testing. This portability, visible from colorimetry through voltammetry to multi-wavelength PPG, reduces the friction of adding new channels and prefers architectures that learn shared representations across modalities with clear, auditable benefits over their single-channel baselines.
These observations offer several specific research opportunities. First, a strong need exists for highly synchronized, open, or consortium-based multimodal datasets covering rest, exercise, heat, and hypoxia with participant-independent splits and well-defined reference measures. These corpora need to facilitate apples-to-apples comparison of fusion at the data, feature, and decision levels and report not only accuracy but also latency, energy, and privacy footprints to capture real deployment requirements. Second, representation learning needs concentrated investment: self-supervised and contrastive losses can pre-train a common latent space for PPG, ECG, IMU, and sweat streams, upon which minimal task heads can be fine-tuned in-device. Embedding calibrated uncertainty will enable adaptive weighting of modalities, such that temporarily noisy channels are automatically down-weighted without brittle rules. Third, co-design of hardware and algorithms specifically for fusion can unlock significant efficiency improvements: partitioned inference among device and edge gateway, early-exit policies, and context-aware scheduling of sensors can save energy while maintaining responsiveness to critical events, such as the low-latency requirements of closed loop interventions. Fourth, explainability needs to become multimodal by design. Techniques like SHAP, saliency, and ablation analyses should be required to detail each channel’s contribution in certain conditions, bolstering clinical confidence and informing future sensor selection and placement. This existing literature on interpretability and leakage-resistant validation provides a solid methodological foundation for the next step. Last but not least, the area is poised to venture into digital-twin-type personalization, with physiological models refreshed by edge-side learning and updated in real time to forecast “what-if” situations regarding hydration, workload, or recovery and to convert fused sensing into timely, personalized guidance instead of merely passive monitoring.
In conclusion, the proof indicates that the time for multimodal fusion is now. The sensors are sophisticated, the validation protocols are rigorous, and the edge analytics are competent enough to move beyond an innovative prototype to systems in everyday use that are more accurate, more robust, and more humane. If we think holistically—if we see chemical, physiological, and biomechanical streams as complementary evidence streams rather than foes—we can create wearables that understand context, reason under uncertainty, and act in real time. That ambition is bold, but it is true, and it offers a very interesting next step for biosensing research.

Author Contributions

Conceptualization, M.K.; methodology, M.K.; validation, M.S.T.; formal analysis, M.S.T.; investigation, K.W. and M.S.T.; resources, K.W. and M.S.T.; data curation, K.W. and M.S.T.; writing—original draft preparation, K.W. and J.N.; writing—review and editing, K.W. and J.N.; visualization, K.W. and M.K.; supervision, M.K. All authors have read and agreed to the published version of the manuscript.

Funding

This research was carried out as a part of the EU-TRAINS Project under grant agreement No. 101130495. The project was supported by the European Health and Digital Executive Agency (HADEA) as well as the National Centre for Research and Development of Poland.

Data Availability Statement

The data is contained within the article.

Conflicts of Interest

Author K.W. was employed by the company DAC.next Sp. Z o.o. Authors J.N., M.S.T. and M.K. were employed by the company DAC.Digital S.A. The remaining authors declare that the research was conducted in the absence of any commercial or financial relationships that could be construed as a potential conflict of interest.

References

  1. Shajari, S.; Kuruvinashetti, K.; Komeili, A.; Sundararaj, U. The emergence of AI-based wearable sensors for digital health technology: A review. Sensors 2023, 23, 9498. [Google Scholar] [CrossRef] [Scilit] [PubMed]
  2. Zhang, Y.; Hu, Y.; Jiang, N.; Yetisen, A.K. Wearable artificial intelligence biosensor networks. Biosens. Bioelectron. 2023, 219, 114825. [Google Scholar] [CrossRef] [Scilit] [PubMed]
  3. Cernat, A.; Groza, A.; Tertis, M.; Feier, B.; Hosu-Stancioiu, O.; Cristea, C. Where artificial intelligence stands in the development of electrochemical sensors for healthcare applications: A review. TrAC Trends Anal. Chem. 2024, 181, 117999. [Google Scholar] [CrossRef] [Scilit]
  4. Childs, A.; Mayol, B.; Lasalde-Ramírez, J.A.; Song, Y.; Sempionatto, J.R.; Gao, W. Diving into sweat: Advances, challenges, and future directions in wearable sweat sensing. ACS Nano 2024, 18, 24605–24616. [Google Scholar] [CrossRef] [Scilit] [PubMed]
  5. Peng, M.; Ning, Y.; Zhang, J.; He, Y.; Xu, Z.; Li, D.; Yang, Y.; Ren, T.-L. Wearable sensing systems for multi-modal body fluid monitoring: Sensing-combination strategy, platform-integration mechanism, and data-processing pattern. Biosensors 2026, 16, 46. [Google Scholar] [CrossRef] [Scilit] [PubMed]
  6. Hemmati, A.; Raoufi, P.; Rahmani, A.M. Edge artificial intelligence for big data: A systematic review. Neural Comput. Appl. 2024, 36, 11461–11494. [Google Scholar] [CrossRef] [Scilit]
  7. Xie, L.; Yang, K.; Wang, M.; Hou, W.; Ren, Q. Recent advances in flexible materials for wearable optical biosensors. Biosensors 2025, 15, 611. [Google Scholar] [CrossRef] [Scilit] [PubMed]
  8. Huang, G.; Chen, X.; Liao, C. AI-driven wearable bioelectronics in digital healthcare. Biosensors 2025, 15, 410. [Google Scholar] [CrossRef] [Scilit] [PubMed]
  9. Li, M.; Bae, J. Comprehensive review on DNA hydrogels and DNA origami-enabled wearable and implantable biosensors. Biosensors 2025, 15, 819. [Google Scholar] [CrossRef] [Scilit] [PubMed]
  10. Liu, P.; Song, Y.; Yang, X.; Li, D.; Khosravi, M. Medical intelligence using PPG signals and hybrid learning at the edge to detect fatigue in physical activities. Sci. Rep. 2024, 14, 16149. [Google Scholar] [CrossRef] [Scilit] [PubMed]
  11. Yammouri, G.; Ait Lahcen, A. AI-reinforced wearable sensors and intelligent point-of-care tests. J. Pers. Med. 2024, 14, 1088. [Google Scholar] [CrossRef] [Scilit] [PubMed]
  12. Seki, Y.; Nakashima, D.; Shiraishi, Y.; Ryuzaki, T.; Ikura, H.; Miura, K.; Suzuki, M.; Watanabe, T.; Nagura, T.; Matsumato, M.; et al. A novel device for detecting anaerobic threshold using sweat lactate during exercise. Sci. Rep. 2021, 11, 4929. [Google Scholar] [CrossRef] [Scilit] [PubMed]
  13. Liu, Z.; Li, J.; Li, J.; Yang, T.; Zhang, Z.; Wu, H.; Xu, H.; Meng, J.; Li, F. Explainable deep-learning-assisted sweat assessment via a programmable colorimetric chip. Anal. Chem. 2022, 94, 15864–15872. [Google Scholar] [CrossRef] [Scilit] [PubMed]
  14. Qiao, Y.; Qiao, L.; Chen, Z.; Liu, B.; Gao, L.; Zhang, L. Wearable sensor for continuous sweat biomarker monitoring. Chemosensors 2022, 10, 273. [Google Scholar] [CrossRef] [Scilit]
  15. Ren, Z.; Cui, Y. Wearable biosensors for disease diagnostics and health monitoring: Recent progress and emerging technologies. Lab Chip 2026, 26, 1444–1470. [Google Scholar] [CrossRef] [Scilit] [PubMed]
  16. Alhaddad, A.Y.; Aly, H.; Gad, H.; Al-Ali, A.; Sadasivuni, K.K.; Cabibihan, J.J.; Malik, R.A. Sense and learn: Recent advances in wearable sensing and machine learning for blood glucose monitoring and trend-detection. Front. Bioeng. Biotechnol. 2022, 10, 876672. [Google Scholar] [CrossRef] [Scilit] [PubMed]
  17. Hanna, J.; Bteich, M.; Tawk, Y.; Ramadan, A.H.; Dia, B.; Asadallah, F.A.; Eid, A.; Kanj, R.; Costantine, J.; Eid, A.A. Noninvasive, Wearable, and Tunable Electromagnetic Multisensing System for Continuous Glucose Monitoring, Mimicking Vasculature Anatomy. Sci. Adv. 2020, 6, eaba5320. [Google Scholar] [CrossRef] [Scilit] [PubMed]
  18. Gragnaniello, M.; Marrazzo, V.R.; Borghese, A.; Maresca, L.; Breglio, G.; Riccio, M. Edge-AI enabled wearable device for non-invasive type 1 diabetes detection using ECG signals. Bioengineering 2025, 12, 4. [Google Scholar]
  19. Xu, C.; Solomon, S.A.; Gao, W. Artificial intelligence-powered electronic skin. Nat. Mach. Intell. 2023, 5, 1344–1355. [Google Scholar] [CrossRef] [Scilit] [PubMed]
  20. Li, K.; Cardoso, C.; Moctezuma-Ramirez, A.; Elgalad, A.; Perin, E. Heart rate variability measurement through a smart wearable device: Another breakthrough for personal health monitoring? Int. J. Environ. Res. Public Health 2023, 20, 7146. [Google Scholar] [CrossRef] [Scilit] [PubMed]
  21. Bellenger, C.R.; Miller, D.; Halson, S.L.; Roach, G.D.; Maclennan, M.; Sargent, C. Evaluating the typical day-to-day variability of Whoop-derived heart rate variability in Olympic water polo athletes. Sensors 2022, 22, 6723. [Google Scholar] [CrossRef] [Scilit] [PubMed]
  22. David, G.C.; Cai, Y. Integrating synthetic biology and lab-on-a-chip technologies for next-generation biosensors. Front. Lab A Chip Technol. 2025, 4, 1716737. [Google Scholar]
  23. Cui, F.; Yue, Y.; Zhang, Y.; Zhang, Z.; Zhou, H.S. Advancing biosensors with machine learning. ACS Sens. 2020, 5, 3346–3364. [Google Scholar] [CrossRef] [Scilit] [PubMed]
  24. Chowdhury, M.K.H.; Anik, H.R.; Akter, M.; Hasan, S.M.M.; Tushar, S.I.; Mahmud, S.; Nahar, N.; Tania, I.S. Sensing the future with graphene-based wearable sensors: A review. Results Mater. 2025, 25, 100646. [Google Scholar] [CrossRef] [Scilit]
  25. Xian, X. Recent advances in wearable biosensors for human health monitoring. Biosensors 2026, 16, 27. [Google Scholar] [CrossRef] [Scilit] [PubMed]
  26. Tarasov, S.; Plekhanova, Y.; Reshetilov, A.; Melenkov, S.; Saltanov, I. Challenges of wearable biosensors and ways to overcome them. Biosensors 2026, 16, 159. [Google Scholar] [CrossRef] [Scilit] [PubMed]
  27. Kałamajska, E.; Misiurewicz, J.; Weremczuk, J. Wearable pulse oximeter for swimming pool safety. Sensors 2022, 22, 3823. [Google Scholar] [CrossRef] [Scilit] [PubMed]
  28. Matsumura, G.; Honda, S.; Kikuchi, T.; Mizuno, Y.; Hara, H.; Kondo, Y.; Nakamura, H.; Watanabe, S.; Hayakawa, K.; Nakajima, K.; et al. Real-time personal healthcare data analysis using edge computing for multimodal wearable sensors. Device 2025, 3, 100597. [Google Scholar] [CrossRef] [Scilit]
  29. Jiang, W.; Zhang, W.; Li, H.; Ngoie, J.; Li, W.; Huang, Z. Validation of wearable vital signs monitoring: A comparison with conventional bedside patient monitors. Digit. Health 2025, 11, 20552076251377934. [Google Scholar] [CrossRef] [Scilit] [PubMed]
  30. Liaqat, S.; Dashtipour, K.; Rizwan, A.; Usman, M.; Shah, S.A.; Arshad, K.; Assaleh, K.; Ramzan, N. Personalized wearable electrodermal sensing-based human skin hydration level detection for sports, health and wellbeing. Sci. Rep. 2022, 12, 3715. [Google Scholar] [CrossRef] [Scilit] [PubMed]
  31. He, J.; Li, Y.; Yang, F.; Gan, Z.; Lu, K.; Deng, Z.; Zhang, K.; Chen, Z.; Liu, X.; Huang, A.; et al. Waterproof, stretchable and wearable corrugated conductive carbon fiber strain sensors for underwater respiration monitoring and swimming instruction. Appl. Mater. Today 2024, 38, 102165. [Google Scholar] [CrossRef] [Scilit]
  32. Ali, A.; Wei, Y.; Elsaboni, Y.; Tyson, J.; Akerman, H.; Jackson, A.I.; Lane, R.; Spencer, D.; White, N.M. A novel wearable sensor for measuring respiration continuously and in real time. Sensors 2024, 24, 6513. [Google Scholar] [CrossRef] [Scilit] [PubMed]
  33. Takahashi, S.; Nakazawa, E.; Ichinohe, S.; Akabayashi, A.; Akabayashi, A. Wearable technology for monitoring respiratory rate and SpO2 of COVID-19 patients: A systematic review. Diagnostics 2022, 12, 2563. [Google Scholar] [CrossRef] [Scilit] [PubMed]
  34. Kireev, D.; Sel, K.; Ibrahim, B.; Kumar, N.; Akbari, A.; Jafari, R.; Akinwande, D. Continuous cuffless monitoring of arterial blood pressure via graphene bioimpedance tattoos. Nat. Nanotechnol. 2022, 17, 864–870. [Google Scholar] [CrossRef] [Scilit] [PubMed]
  35. Lin, W.; Demirel, B.U.; Al Faruque, M.A.; Li, G. Energy-efficient blood pressure monitoring based on single-site photoplethysmogram on wearable devices. In Proceedings of the 2021 43rd Annual International Conference of the IEEE Engineering in Medicine & Biology Society (EMBC); IEEE: New York, NY, USA, 2021; pp. 504–507. [Google Scholar]
  36. Shuzan, M.N.I.; Chowdhury, M.H.; Chowdhury, M.E.; Murugappan, M.; Hoque Bhuiyan, E.; Arslane Ayari, M.; Khandakar, A. Machine learning-based respiration rate and blood oxygen saturation estimation using photoplethysmogram signals. Bioengineering 2023, 10, 167. [Google Scholar] [CrossRef] [Scilit] [PubMed]
  37. Kim, K.B.; Baek, H.J. Photoplethysmography in wearable devices: A comprehensive review of technological advances, current challenges, and future directions. Electronics 2023, 12, 2923. [Google Scholar] [CrossRef] [Scilit] [PubMed]
  38. Meng, K.; Xiao, X.; Wei, W.; Chen, G.; Nashalian, A.; Shen, S.; Xiao, X.; Chen, J. Wearable pressure sensors for pulse wave monitoring. Adv. Mater. 2022, 34, 2109357. [Google Scholar] [CrossRef] [Scilit]
  39. Kurul, F.; Aydoğan, D.; Janat, S.; Kırlangıc, I.A.; Kaya, H.O.; Topkaya, S.N. Wearable sensors for health monitoring: Current applications, trends, and future directions. Biosens. Bioelectron. X 2025, 28, 100727. [Google Scholar] [CrossRef] [Scilit]
  40. Liu, L.; Pu, Y.; Fan, J.; Yan, Y.; Liu, W.; Luo, K.; Wang, Y.; Zhao, G.; Chen, T.; Puiu, P.D.; et al. Wearable sensors, data processing, and artificial intelligence in pregnancy monitoring: A review. Sensors 2024, 24, 6426. [Google Scholar] [CrossRef] [Scilit] [PubMed]
  41. Yan, Y.; Xiao, T.; Lin, M.; Yue, W.; Qu, J.; Chen, Y.; Zhang, Z.; Meng, J.; Pan, D.; Li, F.; et al. Deep learning-assisted cactus-inspired osmosis-enrichment patch for biosafety-isolative wearable sweat metabolism assessment. Biosensors 2025, 15, 790. [Google Scholar] [CrossRef] [Scilit] [PubMed]
  42. Bandodkar, A.J.; Jeang, W.J.; Ghaffari, R.; Rogers, J.A. Wearable sensors for biochemical sweat analysis. Annu. Rev. Anal. Chem. 2019, 12, 1–22. [Google Scholar] [CrossRef] [Scilit]
  43. Luo, T.-T.; Sun, Z.-H.; Li, C.-X.; Feng, J.-L.; Xiao, Z.-X.; Li, W.-D. Monitor for lactate in perspiration. J. Physiol. Sci. 2021, 71, 26. [Google Scholar] [CrossRef] [Scilit] [PubMed]
  44. Obma, A.; Nookaew, K.; Songsaeng, R.; Phonchai, A.; Hauser, P.C.; Wilairat, P.; Chantiwas, R. Measurement of sweat lactate levels in exercise and non-exercise activities using capillary electrophoresis system with contactless conductivity detection and cyclodextrin-modified buffer. Arab. J. Chem. 2023, 16, 105255. [Google Scholar] [CrossRef] [Scilit]
  45. Volkova, E.; Perchik, A.; Pavlov, K.; Nikolaev, E.; Ayuev, A.; Park, J.; Chang, N.; Lee, W.; Kim, J.Y.; Doronin, A.; et al. Multispectral sensor fusion in smartwatch for in situ continuous monitoring of human skin hydration and body sweat loss. Sci. Rep. 2023, 13, 13371. [Google Scholar] [CrossRef] [Scilit] [PubMed]
  46. Takei, N.; Inaba, T.; Morita, Y.; Kakinoki, K.; Hatta, H.; Kitaoka, Y. Differential patterns of sweat and blood lactate concentration response during incremental exercise in varied ambient temperatures: A pilot study. Temperature 2024, 11, 247–253. [Google Scholar] [CrossRef] [Scilit]
  47. Gao, R.; Khatib, M.; Bao, Z. Molecularly imprinted polymer-based electrochemical sensors for amino acid detection: Towards wearable sensing. npj Biosens. 2026, 3, 1. [Google Scholar] [CrossRef] [Scilit]
  48. Katsumata, Y.; Muramoto, Y.; Ishida, N.; Takemura, R.; Nagashima, K.; Ikoma, T.; Kawamatsu, N.; Araki, M.; Goda, A.; Okawara, H.; et al. Sweat lactate sensor for detecting anaerobic threshold in heart failure: A prospective clinical trial (LACS-001). Sci. Rep. 2024, 14, 18985. [Google Scholar] [CrossRef] [Scilit] [PubMed]
  49. Okawara, H.; Iwasawa, Y.; Sawada, T.; Sugai, K.; Daigo, K.; Seki, Y.; Ichihara, G.; Nakashima, D.; Sano, M.; Nakamura, M.; et al. Anaerobic threshold using sweat lactate sensor under hypoxia. Sci. Rep. 2023, 13, 22865. [Google Scholar] [CrossRef] [Scilit] [PubMed]
  50. Akter, A.; Apu, M.M.H.; Veeranki, Y.R.; Baroud, T.N.; Posada-Quintero, H.F. Recent studies on smart textile-based wearable sweat sensors for medical monitoring: A systematic review. J. Sens. Actuator Netw. 2024, 13, 40. [Google Scholar] [CrossRef] [Scilit]
  51. Yu, H.; Sun, J. Sweat detection theory and fluid driven methods: A review. Nanotechnol. Precis. Eng. 2020, 3, 126–140. [Google Scholar] [CrossRef] [Scilit]
  52. Messina, L.; Giardi, M.T. Recent status on lactate monitoring in sweat using biosensors: Can this approach be an alternative to blood detection? Biosensors 2025, 15, 3. [Google Scholar]
  53. Zhou, L.; Menon, S.S.; Li, X.; Zhang, M.; Malakooti, M.H. Machine learning enables reliable colorimetric detection of pH and glucose in wearable sweat sensors. Adv. Mater. Technol. 2025, 10, 2401121. [Google Scholar] [CrossRef] [Scilit]
  54. Escobedo, P.; Ramos-Lorente, C.E.; Martínez-Olmos, A.; Carvajal, M.A.; Ortega-Muñoz, M.; de Orbe-Payá, I.; Hernández-Mateo, F.; Santoyo-González, F.; Capitán-Vallvey, L.F.; Palma, A.J.; et al. Wireless wearable wristband for continuous sweat pH monitoring. Sens. Actuators B Chem. 2021, 327, 128948. [Google Scholar] [CrossRef] [Scilit]
  55. Moradi, S.; Firoozbakhtian, A.; Hosseini, M.; Karaman, O.; Kalikeri, S.; Raja, G.G.; Karimi-Maleh, H. Advancements in wearable technology for monitoring lactate levels using lactate oxidase enzyme and free enzyme as analytical approaches: A review. Int. J. Biol. Macromol. 2024, 254, 127577. [Google Scholar] [CrossRef] [Scilit] [PubMed]
  56. Pirovano, P.; Dorrian, M.; Shinde, A.; Donohoe, A.; Brady, A.J.; Moyna, N.M.; Wallace, G.; Diamond, D.; McCaul, M. A wearable sensor for the detection of sodium and potassium in human sweat during exercise. Talanta 2020, 219, 121145. [Google Scholar] [CrossRef] [Scilit] [PubMed]
  57. Liu, G.; Ho, C.; Slappey, N.; Zhou, Z.; Snelgrove, S.; Brown, M.; Grabinski, A.; Guo, X.; Chen, Y.; Miller, K.; et al. A wearable conductivity sensor for wireless real-time sweat monitoring. Sens. Actuators B Chem. 2016, 227, 35–42. [Google Scholar] [CrossRef] [Scilit]
  58. Gao, F.; Liu, C.; Zhang, L.; Liu, T.; Wang, Z.; Song, Z.; Cai, H.; Fang, Z.; Chen, J.; Wang, J.; et al. Wearable and flexible electrochemical sensors for sweat analysis: A review. Microsyst. Nanoeng. 2023, 9, 1. [Google Scholar] [CrossRef] [Scilit] [PubMed]
  59. Promphet, N.; Thanawattano, C.; Buekban, C.; Laochai, T.; Lormaneenopparat, P.; Sukmas, W.; Rattanawaleedirojn, P.; Puthongkham, P.; Potiyaraj, P.; Leewattanakit, W.; et al. Smartphone-based wearable sweat glucose sensing device correlated with machine learning for real-time diabetes screening. Anal. Chim. Acta 2024, 1312, 342761. [Google Scholar] [CrossRef] [Scilit] [PubMed]
  60. Zhou, Z.; He, X.; Xiao, J.; Pan, J.; Li, M.; Xu, T.; Zhang, X. Machine learning-powered wearable interface for distinguishable and predictable sweat sensing. Biosens. Bioelectron. 2024, 265, 116712. [Google Scholar] [CrossRef] [Scilit] [PubMed]
  61. Oh, S.Y.; Hong, S.Y.; Jeong, Y.R.; Yun, J.; Park, H.; Jin, S.W.; Lee, G.; Oh, J.H.; Lee, H.; Lee, S.-S.; et al. Skin-attachable, stretchable electrochemical sweat sensor for glucose and pH detection. ACS Appl. Mater. Interfaces 2018, 10, 13729–13740. [Google Scholar] [CrossRef] [Scilit] [PubMed]
  62. Jiao, Y.; Yu, X. Recent advances in wearable electrochemical sensors for in situ detection of biochemical markers. Sci. China Mater. 2025, 68, 755–774. [Google Scholar] [CrossRef] [Scilit]
  63. Ortega, L.; Llorella, A.; Esquivel, J.P.; Sabaté, N. Self-powered smart patch for sweat conductivity monitoring. Microsyst. Nanoeng. 2019, 5, 3. [Google Scholar] [CrossRef] [Scilit] [PubMed]
  64. Rose, D.P.; Ratterman, M.E.; Griffin, D.K.; Hou, L.; Kelley-Loughnane, N.; Naik, R.R.; Hagen, J.A.; Papautsky, I.; Heikenfeld, J.C. Adhesive RFID sensor patch for monitoring of sweat electrolytes. IEEE Trans. Biomed. Eng. 2015, 62, 1457–1465. [Google Scholar] [CrossRef] [Scilit] [PubMed]
  65. ISO/IEC 15693-2:2019; Cards and Security Devices for Personal Identification—Contactless Vicinity Objects—Part 2: Air Interface and Initialization. International Organization for Standardization: Geneva, Switzerland, 2019.
  66. Paramasivam, A.; Shahila, D.F.D.; Jenath, M.; Sivakumaran, T.; Sankaran, S.; Pittu, P.S.K.R.; Vijayalakshmi, S. Development of artificial intelligence edge computing based wearable device for fall detection and prevention of elderly people. Heliyon 2024, 10, e28688. [Google Scholar] [CrossRef] [Scilit]
  67. Monoli, C.; Fuentez-Perez, J.F.; Cau, N.; Capodaglio, P.; Galli, M.; Tuhtan, J.A. Land and underwater gait analysis using wearable IMU. IEEE Sens. J. 2021, 21, 11192–11202. [Google Scholar] [CrossRef] [Scilit]
  68. Alzahrani, A.; Aljohany, M.; Alsirhani, H. Real-time wearable biomechanics framework for sports injury prevention and rehabilitation optimization. Sci. Rep. 2026, 16, 4436. [Google Scholar] [CrossRef] [Scilit] [PubMed]
  69. Alvarez, J.T.; Gerez, L.F.; Araromi, O.A.; Hunter, J.G.; Choe, D.K.; Payne, C.J.; Wood, R.J.; Walsh, C.J. Towards soft wearable strain sensors for muscle activity monitoring. IEEE Trans. Neural Syst. Rehabil. Eng. 2022, 30, 2198–2206. [Google Scholar] [CrossRef] [Scilit] [PubMed]
  70. Menaka, S.; Prakash, M.; Neelakandan, S.; Radhakrishnan, A. A novel WGF-LN based edge driven intelligence for wearable devices in human activity recognition. Sci. Rep. 2023, 13, 17822. [Google Scholar] [CrossRef] [Scilit] [PubMed]
  71. Yang, C.-J.; Fahier, N.; He, C.-Y.; Li, W.-C.; Fang, W.-C. An AI-edge platform with multimodal wearable physiological signals monitoring sensors for affective computing applications. In Proceedings of the 2020 IEEE International Symposium on Circuits and Systems (ISCAS); IEEE: New York, NY, USA, 2020; pp. 1–5. [Google Scholar]
  72. Assudani, P.J.; George, G.; Avthankar, A.; Tiwari, A.; Bhaiyya, M.; Kulkarni, M.B. Biosensing technologies for foodborne pathogen detection and healthcare: Principles, emerging materials, and intelligent platforms. Microchim. Acta 2026, 193, 231. [Google Scholar] [CrossRef] [Scilit]
  73. Bourechak, A.; Zedadra, O.; Kouahla, M.N.; Guerrieri, A.; Seridi, H.; Fortino, G. At the confluence of artificial intelligence and edge computing in IoT-based applications: A review and new perspectives. Sensors 2023, 23, 1639. [Google Scholar] [CrossRef] [Scilit] [PubMed]
  74. Singh, R.; Gill, S.S. Edge AI: A survey. Internet Things Cyber-Phys. Syst. 2023, 3, 71–92. [Google Scholar] [CrossRef] [Scilit]
  75. Silva, M.C. Wearable Edge AI Towards Cyber-Physical Applications. Ph.D. Thesis, Federal University of Ouro Preto, Ouro Preto, Brazil, 2023. [Google Scholar]
  76. Yoo, J. Energy-efficient AI at the edge for biomedical applications. In Proceedings of the 2023 20th International SoC Design Conference (ISOCC); IEEE: New York, NY, USA, 2023; p. 202. [Google Scholar]
  77. Kao, W.-C.; Fan, Y.-L.; Hsu, F.-R.; Shen, C.-Y.; Liao, L.-D. Next-generation swimming pool drowning prevention strategy integrating AI and IoT technologies. Heliyon 2024, 10, 18. [Google Scholar] [CrossRef] [Scilit]
  78. Nguyen, T.; Nguyen, D.H.; Nguyen, Q.-T.; Tran, K.D.; Tran, K.P. Human-centered edge AI and wearable technology for workplace health and safety in Industry 5.0. In Artificial Intelligence for Safety and Reliability Engineering: Methods, Applications, and Challenges; Springer: Cham, Switzerland, 2024; pp. 171–183. [Google Scholar]
Figure 1. Overview of multimodal wearable biosensing and edge AI for personalized health. The diagram illustrates the complete pipeline from physiological, biochemical, and motion sensors through on-device AI processing, secure connectivity, and personalized health feedback.
Electronics 15 03237 g001
Figure 2. Categories of wearable sensors used in multimodal biosensing, including physiological, biochemical, and motion sensing modalities.
Electronics 15 03237 g002
Figure 3. Conceptual diagram of a multimodal wearable biosensing system with edge AI processing. Skin-conformal sensing modules feed physiological, biochemical, and motion signals to an embedded edge AI unit for signal processing, feature extraction, model compression, and secure feedback.
Electronics 15 03237 g003
Figure 4. Multimodal vital-sign monitoring architecture. Integration of ECG, PPG, bioimpedance, accelerometer, and temperature sensing with edge AI supports more robust estimation of heart rate, HRV, blood pressure, stress, and cardiorespiratory status.
Electronics 15 03237 g004
Figure 5. Wearable sweat biosensor patch architecture and workflow. Skin-conformal microfluidics, multi-analyte sensing, and smartphone/edge analysis support real-time monitoring of lactate, glucose, electrolytes, pH, and hydration-related status.
Electronics 15 03237 g005
Figure 6. Wearable motion and biomechanics sensing for artifact mitigation and context-aware analysis. IMU and soft-strain sensors are coupled with edge AI to support real-time gait, posture, and motion analysis while improving the reliability of other biosignals.
Electronics 15 03237 g006
Figure 7. Detailed edge AI pipeline for wearable multimodal biosensors, from data acquisition, preprocessing and feature extraction to model compression, federated/personalized learning, inference, and feedback.
Electronics 15 03237 g007
Figure 8. Hierarchical validation levels (L1–L5) for wearable health studies, ranging from bench/in vitro testing to controlled laboratory assessment, pilot/in-the-wild validation, external validation, and clinical/regulatory validation.
Electronics 15 03237 g008
Figure 9. Typical accuracy ranges and validation levels by sensor category. Bars represent minimum, average, and maximum reported accuracies, while the dashed line indicates the typical validation level reached by each category.
Electronics 15 03237 g009
Figure 10. Persistent challenges in multimodal wearable biosensing and emerging solutions. The infographic maps translational barriers such as motion artifacts, biofouling, calibration drift, subject variability, and limited external validation to mitigation strategies including antifouling materials, adaptive calibration, subject-independent training, and federated learning.
Electronics 15 03237 g010
Table 1. Positioning of the present review relative to recent reviews on wearable biosensing, AI-assisted sensing, and edge AI.
Recent ReviewPrimary EmphasisRemaining GapAdded Value of the Present Review
Shajari et al. [1]AI wearables for digital health and personalized monitoring.Broad AI overview; limited biochemical–physiological–motion fusion and validation maturity.Integrates multimodal biosensing with edge AI, TinyML, privacy-aware learning, and L1–L5 validation.
Zhang et al. [2]Wearable AI biosensor networks; biochemical/biophysical examples.Less focus on deployment evidence, subject-independent validation, energy, and regulation.Treats sensing, model design, validation, latency, energy, and privacy as one pipeline.
Cernat et al. [3]AI in electrochemical healthcare sensors.Electrochemical focus; limited integration with vital signs, biomechanics, and body-fluid multimodality.Places electrochemical sensing within a multimodal architecture spanning optical, motion, and physiological channels.
Childs et al. [4]Wearable sweat-sensing advances, challenges, and future directions.Excellent sweat-specific coverage; less emphasis on edge AI, TinyML, and cross-modal inference.Adds sweat interpretation with physiological and motion context, including calibration, drift, and privacy-aware analytics.
Peng et al. [5]Multimodal body-fluid monitoring and data-processing patterns.Body-fluid focus; less coverage of vital signs, biomechanics, and system-level edge deployment.Extends body-fluid monitoring toward full personalized-health systems combining biofluids, physiology, biomechanics, and on-device intelligence.
Hemmati et al. [6]edge AI architectures, metrics, and enabling technologies.General edge AI scope; limited biosensor-specific discussion of sweat, PPG/ECG, materials, and clinical validation.Translates edge AI concepts into wearable-biosensing requirements: fusion, robustness, explainability, and regulatory readiness.
Table 2. Summary of common evaluation metrics, typical validation levels, and key challenges across sensing modalities.
ModalityTypical MetricsValidation LevelKey Challenges
Physiological signals (PPG/ECG/EDA)Accuracy, F1 score, AUC; HRV, blood pressure estimationOften pilot or controlled laboratory; rarely external/clinicalMotion artifacts, sensor placement, signal noise, subject-dependent models
Biochemical (sweat/ISF/tear)Limit of detection, response time, linear range, correlation with blood levelsMostly bench/in vitro; few human pilotsSweat rate variability, calibration drift, selectivity, biofouling
Motion and biomechanics (IMU/pressure)Accuracy, precision, recall, joint angle error, gait parametersPilot studies; wearable prototypes; limited external validationMotion artifacts, placement variability, inertial drift, environmental noise
Edge AI and analyticsModel size, latency, energy consumption, on-device accuracyBench deployment; limited field trialsResource constraints, privacy preservation, federated learning efficiency
Table 3. Brief summary of findings: general biosensor platforms.
StudySensors UsedAI InsightsData ProcessingTools and FrameworksEvaluation Methods
The emergence of AI-Based Wearable Sensors for Digital Health Technology: A Review [1]Electro-chemical, PPG, microfluidic sensorsPredicts disease onset and health trendsNoise filtering, cross-validationTensorFlow, IoT platformsROC analysis, clinical validation
Medical Intelligence Using PPG Signals and Hybrid Learning at the Edge to Detect Fatigue in Physical Activities [10]Photoplethysmographic
(PPG) sensor for measuring physiological signals such as heart rate (HR) and oxygen saturation (SpO2); wearable (non-invasive).
Hybrid deep learning architectures combining Convolutional Neural Networks (CNNs) such as ResNetCNN and Xception, with Bidirectional Long Short-Term Memory (BiLSTM) to effectively detect fatigue from physiological signals.Wavelet-based denoising for noise removal; windowing-based segmentation for data augmentation; extraction of relevant physiological features including HR and SpO2 from the processed signals.Deep Learning
architectures explicitly mentioned: ResNetCNN, Xception, BiLSTM; frameworks not explicitly named but likely included standard platforms (e.g., TensorFlow or PyTorch).
Fivefold cross validation; accuracy, F1-score, precision, recall, Area Under the Curve (AUC); comparison with subjective scales (Karolinska Sleepiness Scale-KSS, Psychomotor Vigilance Test-PVT).
AI-Reinforced
Wearable Sensors and Point-of-Care
Tests [11]
Electrochemical,
optical, piezoelectric, thermal, and FET-
based biosensors
Continuous physiological monitoring; Detection of biomarkers like glucose, dopamine, ATP, lysozyme,
cancer markers
ML (SVM, RF, PCA,
LS-SVM); DL (CNN, RNN, LSTM); NLP;
Computer Vision;
Embedded ML
(TinyML)
Deep learning frameworks (implicit); TinyML embedded systemsAccuracy, sensitivity, specificity, AUC, real-time validation, correlation with
clinical standards
Wearable Artificial Intelligence Biosensor Networks [2]Multimodal biosensorsSensor fusion for disease detectionFeature engineering, federated learningScikit-learn, IoT networksComparative accuracy, patient
trials
Explainable Deep-
Learning-Assisted
Sweat Assessment via a Programmable
Colorimetric Chip [13]
Programmable colorimetric sensor chip (SA/CaCl2 gel capsules, e zymes GOx, LOx, HRP, Indicators 4-AAP, TMB, MO, BCG, PR)CNN (ResNet-18),
Class Activation Maps (CAM) for
model explainability
4600 photographic images (split 80/10/10), CNN-based feature extraction, nonlinear multidimensional analysisCNN (ResNet-18),
ANN, XGBoost, Decision Trees,
KNN, Logistic
Regression, Naive Bayes, Random Forest, SVM, Linear Discriminant Analysis (LDA)
Confusion matrices, accuracy, R2, MSE,
RMSE, MAE; multiple comparative analyses; real sample validation against laboratory measurements
Wearable Sensor for Continuous Sweat Biomarker Monitoring [14]Wearable
Electrochemical sensors (enzyme based, enzyme-free, immunosensors, MIP-based, potentiometric)
Health condition analysis (stress, fatigue, disease,
dehydration, nutritional intake) based on biomarker
concentrations
Sweat collection
(pilocarpine iontophoresis, exercise-induced), analytical processing (LCMS, GC-MS, CE, NMR, electrochemical techniques like voltammetry, impedance
spectroscopy, colorimetry)
Graphene-based
materials, conductive polymers (PEDOT, polyaniline), metal oxides (ZnO, CoWO4), carbon
nanomaterials, nanoparticles
Sensitivity, specificity, linearity, detection limit, stability,
reproducibility,
response time, repeated performance testing
Diagnostics and Health Monitoring: Recent Progress and Emerging Technologies [15]Wearable biosensors (electrochemical sensors for metabolites), antibody/aptamer-based protein sensors, nucleic acid biosensors, sweat and interstitial fluid sensors, microfluidic-integrated sensing platformsAI-driven data analysis, integration with cloud-based healthcare systems, intelligent multimodal sensing, emerging use in predictive diagnostics and telemedicineContinuous real-time longitudinal data acquisition, microfluidic-controlled sample handling (capillary flow, micropumps, valves), multiplexed analyte separation, signal stabilization (reduction in noise, evaporation, contamination)Microfluidic wearable platforms, lab-on-skin systems, flexible substrates (PDMS, hydrogels, textiles, paper), fabrication methods (3D printing, photolithography, screen/inkjet printing), hybrid electrical–optical sensing systemsSensitivity and specificity of biomarker detection, stability under on-body conditions (biofouling, drift), correlation of biofluids (sweat/ISF) with blood biomarkers, long-term wear reliability, multimodal validation approaches
Sense and Learn:
Recent Advances
In Wearable Sensing and Machine Learning for Blood Glucose Monitoring and Trend-Detection [16]
Photoplethysmography (PPG), Electrocardiogram (ECG),
Electromagnetic
(EM), Bioimpedance, Sweat-based sensors, Tear-based sensors, Saliva-based sensors,
Acceleration
sensors
Convolutional Neural Networks (CNNs),
Recurrent Neural
Networks (RNNs),
Support Vector
Machines (SVMs),
Decision Trees (DTs),
Gradient Boosting,
Long-Short Term
Memory (LSTM),
ARIMA
Collected from wearable devices (Empatica E4, FreeStyle Libre), processed physiological data (heart rate, ECG, sweat levels, bioimpedance, etc.), and continuous glucose monitoring (CGM) data. Preprocessing included filtering, interpolation, and extrapolation.TensorFlow, PyTorch, Keras, Scikit-learnAccuracy, RMSE
(Root Mean Square
Error), Sensitivity,
Specificity, Clarke
Error Grid, AUC
(Area Under Curve), time-to-event analysis
Edge-AI Enabled
Wearable Device for Non-Invasive Type 1 Diabetes Detection Using ECG Signals [18]
MAX30003
(Medical-grade
ECG sensor, Analog
Devices)
Edge AI:
Spectrogram analysis, 1D-CNN, optimized via quantization (EON Compiler).
ECG signals (D1NAMO database), Notch and Butterworth filtering, Spectrogram generation
(FFT length two hundred fifty-six), Statistical cleaning
(skewness, kurtosis)
Edge Impulse, MAT-
LAB R2023a, EON
Compiler
Accuracy, Precision, Recall, AUC,
Confusion Matrix,
Benchmarking
(Latency, RAM and flash usage), Patient-independent validation
Artificial
Intelligence-Powered Electronic
Skin [19]
Electro-chemical, PPG, microfluidic
Sensors
Predicts disease onset and health trendsNoise filtering, cross validationTensorFlow, IoT platformsROC analysis, clinical validation
Heart Rate Variability Measurement through a Smart Wearable Device: Another Breakthrough for Personal Health Monitoring [20]ECG/PPG wearables: smartwatches (e.g., Apple Watch, Fitbit), rings (Oura), chest straps/patches (Polar H10). Beat-to-beat (NN) intervals form the core dataset.ML models (predictive risk, stress scoring) applied to HRV features; relationship between data quality/length and predictive accuracy emphasized.Peak detection → NN series →
time/frequency/nonlinear
metrics (SDNN, RMSSD, pNN50;
LF, HF, LF/HF; chaotic/fractal indices); artifact removal and PSD.
Consumer devices + apps (e.g., Welltory, HRV4 Training);
spectral/chaos analysis toolkits; AI pipelines for classification/regression.
Agreement vs. clinical ECG (Bland–Altman, error rates, metanalyses); analyses of ultra-short vs. 24 h recordings; modality comparisons (ECG vs. PPG).
Evaluating the
Typical Day-to-
Day Variability of
WHOOP-Derived
Heart Rate Variability in Olympic Water Polo Athletes [21]
WHOOP 3.0 wrist worn PPG strap measuring HR and HRV during overnight sleep-in elite athletes over 16 weeks.None used; the study focuses on reliability rather than prediction.HRV as lnRMSSD
(log-transform); weekly 7-day CV% (≥3 nights valid); weeks also binned by WHOOP Strain (% of each athlete’s 16-week mean).
Data extracted to custom Excel sheet; descriptive stats and 95% CIs; literature comparisons for context.Primary outcomes: mean weekly CV% for lnRMSSD (5.4 ± 0.7%) and HR (7.6 ± 1.3%); weekly ranges; comparison to known lnRMSSD (3–13%) and HR (~10–11%)
variability; interpretation: WHOOP reliability comparable to established methods.
Integrating Synthetic Biology and Laboratory-on-a-Chip Technologies for Next-Generation Biosensors [22]Engineered biological sensing elements (proteins, aptamers, genetic circuits), cell-free systems, whole-cell biosensors, CRISPR-based detection modules, enzyme-based biosensors, microfluidic lab-on-a-chip platformsMachine learning-assisted design of biosensing circuits, emerging use of computational optimization for genetic circuit performance, potential for AI-driven automation in DBTL (Design–Build–Test–Learn) workflowsMicrofluidic-controlled sample handling, compartmentalized reaction environments, real-time optical/electrochemical signal conversion, multiplexed analyte detection, integrated signal amplification and transduction within chip architectureLab-on-a-chip (LoC) microfluidic systems, genetic circuit engineering platforms, synthetic biology DBTL pipeline, SBOL (Synthetic Biology Open Language) standards, on-chip optical/electrochemical transducers, portable biosensing devicesAnalytical comparison across biosensor architectures (whole-cell vs. cell-free vs. LoC-integrated systems), sensitivity and specificity assessment, multiplexing capability, portability and biocontainment evaluation, response time and sample efficiency benchmarking
Advancing
Biosensors with
Machine Learning [23]
Portable cyclic voltammetry nitrate probe; amperometric glucose-oxidase cell; EIS chips; nanogap/nanopore single-molecule
devices; wearable EES (strain + ECG
+ GSR); gold-grating SERS substrates;
fluorescence
dPCR microreactor; smartphone colorimetric strips
SVM regression extended sensor lifetimeprecision (nitrate, glucose); Mask RCNN lifted dPCR well detection to 97.6% TPR; CNN + BSF recognized DNA damage at ≈98% accuracy; decision tree reached 89% fatigue state accuracy; rotation forest distinguished bacteria > 90%; NN/GBT hit 100% in protein “chemical-nose” arraySavitzky–Golay smoothing, background subtraction, min-max scaling (Raman); FFT feature vectors (nanopore); binary stochastic filtering
(SERS); image thresholding vs. Mask
R-CNN (dPCR); 60
/20/20 splits or 5-fold CV; k-means or t-SNE for clustering/visualization
TensorFlow, PyTorch,
Theano, CNTK;
ResNet-18, Inceptionv1 (DeepSpectra), Mask R-CNN;
SVM (RBF/poly),
Random-/Rotation-
Forest, GBT (XGBoost/LightGBM),
NN, Feed-forward and LSTM RNN
and Accuracy,
precision/recall/F1,
confusion matrix;
ROC-AUC; R2, MSE, RMSD, REP for regression; k-fold CV, hold-out test set; reporting of TPR/FPR and measurement time (seconds–hours) as practical success criteria
Where artificial intelligence stands in the development of electrochemical sensors for healthcare applications-A review [3]Enzyme amperometric patches onscreen-printed C/Au; NiOOH, NiCo-LDH or MXCeO nanozyme electrodes; MIP-templated films; peptide FET multimarket chips; impedance PET electrodes for bacteria; textile microfluidic or microwave threads for sweat/urineLDA/NLSVM classify plant fingerprints at 99–100%; Random-Forest + NN hit 100% on a four-marker urinary prostate-cancer set; ANN disentangles glucose + ascorbate + gluconic acid (99%); BPNN lifts nonenzymatic glucose lactate detection (R2 ≈ 1); DNN resolves dopamine + ions in
vivo
Baseline correction, Savitzky–Golay smoothing, CV peak finding; PCA/PLS for dimensionality reduction; 60 /20/20 or k-fold splits; FAIR metadata and chemical ontologies (SOSA, EMMO) for
interoperability
Chemometrics suite, Kalman filters for data fusion; ML algorithms (LDA, SVM, KNN, RF, GBT, ANN, DNN, SISSO); TensorFlow/PyTorch for deep nets; Explainable-AI add-ons, continual learning loopsAccuracy/AUC for classifiers (95% typical); RMSE, NRMSE,
Bland–Altman bias for regression (<10% FS or ±5 W); interrater ICC; latency and power budgets for edge deployment; “pass” if clinical error bounds met and model explainable
Sensing the future with graphene-based wearable sensors: A review [24]Graphene in five guises: laser-induced patterns on PI or Kevlar, inkjet-printed films, porous foams, hydrogel or textile yarn composites; devices span capacitive or piezoresistive pressure patches (20 Pa–700 kPa), strain gauges (GF > 1000), ion-selective
Or enzyme amperometric strips for Na+, K+, lactate and glucose, all-graphene gas tags (ppm NO2, acetone) and epidermal
EEG/ECG “tattoos”
Emerging edge ML: LDA/SVM lift hue-based sweat pH/glucose accuracy to ≈90%; CNN and LSTM models on
Jetson/Nano or Pi decode strain spectra, leaf damage and human activity; conditional GAN fills canopy images before MLP analysis
On-patch filtering (moving averages, differential referencing), impedance spectra or RGB segmentation → 15-feature maps; sliding-window IMU or pulse stacks; 4-point Nernstian calibration for ion strips; 5-fold or leave-one-subject-out validation for AI pipelinesFabrication suite: photolithography,
O2-plasma or LIG for sub-µm patterning; inkjet and transfer print for textiles;
CVD for large films; Raspberry Pi, Jetson Nano, BLE piconets, smartphone apps; EdgeCloudSim for latency/QoS tests
Multi-metric pass-fail: sensitivity within 5–10% clinical bounds, response < 5 min
(chemical) or <100 ms
(mechanical), durability 100–1000 cycles/washes,
RSD < 5%; specific exemplars include 0.4 mM lactate LOD with 3% RSD and strain sensors retaining GF24–1000 after 1500 cycles
Table 4. Brief summary of findings: vital-sign monitoring.
StudySensors UsedAI InsightsData ProcessingTools and FrameworksEvaluation Methods
Heart Rate Variability Measurement through a Smart Wearable Device: Another Breakthrough for Personal Health Monitoring? [20]ECG (Apple Watch, Samsung Galaxy, Polar H10), PPG (Apple Watch, Fitbit, Oura Ring)Machine learning,
Deep learning, Power
Spectral Density (PSD) analysis
Data from consumer devices, public databases, and original researchResearchKit,
Welltory, third-party apps
SDNN, RMSSD,
LF/HF ratios, short-term and long-term
recordings
Wearable Pulse Oximeter for Swimming pool Safety [27]MEMS accelerometer (±6 g), MAX30102 optical pulse oximeter (660 nm, 880 nm
LEDs)
Decision algorithm for drowning detection (linear regression, nearest-peak selection); Artifact-resistant
algorithms (FFT, digital filtering)
Digital filtering (64th order band-pass); FFT spectrum analysis; Zero-padding and Hamming window; Polynomial interpolation; Linear regression for trend analysisMATLAB (algorithm development); STM32 ARM
microcontroller (implementation)
Variance analysis
(HR & SpO2); False alarm rate (motion artifact tests); Breath-holding experiments (50 trials, 90% detection rate); Alarm response time (≤30 s)
Real-time personal healthcare data analysis using edge computing for multimodal wearable sensors [28]Temperature,
humidity (ZIS nanosheets), strain (LIG/PDMS), ECG, ACC
Real-time anomaly detection (arrhythmia, cough, falls, activity classification) via
ESN
Analog-to-digital conversion, smoothing, normalization, augmentation (Gaussian noise, data up-sampling)Reservoir Computing (ESN), Python, Dart, Flutter SDK, ScikitlearnAccuracy, F-beta score, correlation
coefficients, hyperparameter
optimization,
continuous multi-hour monitoring
Personalized wearable electrodermal sensing-based human skin hydration level detection for sports, health and well-being [30]GSR sensor, electrodermal activity
(EDA) sensor
Hybrid Bi-LSTM achieved 97%
accuracy
Data collected across 3 hydration states, preprocessed, and segmentedBITalino toolkit,
1D-CNN, 2D-CNN,
LSTM, Bi-LSTM
Accuracy, precision, recall, F1 score
Waterproof,
stretchable and wearable corrugated conductive carbon fiber strain sensors for underwater respiration
monitoring and
swimming instruction [11]
Corrugated conductive carbon fiber strain sensors integrated into a flexible waterproof wearable platformNot specified in the article; potential for future integration of AI for advanced data
analysis
Real-time signal acquisition and processing of strain data to monitor respiratory patterns during underwater activitiesCustom-designed
wearable sensor system; specific software tools not
detailed in the article
Performance evaluated through underwater experiments assessing sensor sensitivity, linearity, durability, and responsiveness to respiratory movements
A Novel Wearable
Sensor for Measuring Respiration
Continuously and in Real Time [32]
Flexible, waterproof, and stretchable strain sensors integrated into a wearable platform for underwater
respiration
monitoring and
swimming instruction
The study does not specify the use of AI; however, future integration of AI for advanced data analysis is suggestedReal-time signal acquisition and processing of strain data to monitor respiratory patterns during underwater activitiesCustom-designed
wearable sensor system; specific software tools not
detailed in the article
Performance evaluated through underwater experiments assessing sensor sensitivity, linearity, durability, and responsiveness to respiratory movements
Wearable Technology for Monitoring
Respiratory Rate and SpO2 of COVID-19 Patients: A Systematic Review [33]
Various wearable devices including pulse oximeters, chest bands, and smartwatches
equipped with sensors to monitor respiratory rate and oxygen saturation
Some studies incorporated AI algorithms for data analysis, such as machine learning models to predict patient deteriorationReal-time data acquisition and processing to monitor respiratory parameters, with some studies utilizing cloud-based platforms for data
storage and analysis
Diverse tools and frameworks were employed across studies, including proprietary software and cloud services; specific tools varied depending on the device and study
design
Evaluation methods varied among studies, including clinical trials, pilot studies, and comparisons with standard medical equipment to assess accuracy
and reliability
Continuous cuffless monitoring of arterial blood pressure via graphene bioimpedance tattoos [34]Graphene-based electronic tattoos functioning as bioimpedance sensors for continuous, cuffless arterial blood pressure monitoringThe study does not specify the use of AI; however, future integration of AI for advanced data analysis is suggestedReal-time signal acquisition and processing of bioimpedance data to monitor arterial blood pressure continuouslyCustom-designed
wearable sensor system; specific software tools not
detailed in the article
Performance evaluated through experiments assessing sensor accuracy, sensitivity, linearity, durability, and responsiveness to arterial blood pressure changes
Energy-efficient
Blood Pressure Monitoring based on Single-site Photoplethysmogram on Wearable Devices [35]
Flexible strain sensors integrated into a wearable platform for continuous respiration monitoringThe study does not specify the use of AI; however, future integration of AI for advanced data analysis is suggestedReal-time signal acquisition and processing of bioimpedance data to monitor arterial blood pressure continuouslyCustom-designed
wearable sensor system; specific software tools not
detailed in the article
Performance evaluated through experiments assessing sensor accuracy, sensitivity, linearity, durability, and responsiveness to arterial blood pressure changes
Machine learning based respiration rate and blood oxygen saturation estimation using photoplethysmogram
Signal [36]
Reflectance PPG (125 Hz) from BIDMC/MIMIC-II ICU cohort; ECG and impedance pneumography present for references.GPR outperformed SVR, ensembles, trees, and linear models; FITRGP picked 8 RR features; ReliefF picked 11 SpO2 features; separate models for RR vs. SpO2 improved accuracy.32 s windows (50% overlap) → 6th-order zero-phase Butterworth
(25 Hz) → VMD motion-artifact removal → extract 107 features → feature selection
(FITRGP/ReliefF).
MATLAB with FSLib for feature ranking; five regressor families (19 variants) under 5-fold CV; classical signal-processing plus ML (no deep nets).Metrics: MAE, RMSE, R, 2SD,
Bland–Altman LOA.
Best results: RR MAE 0.89 bpm,
RMSE 1.41 bpm (R = 0.876; LOA ≈ ±2.80); SpO2 MAE 0.57%, RMSE 0.98% (R = 0.951; LOA ≈ ±2.03). “Good” if RR < 2 bpm error and SpO2 within clinical MAE/RMSE limits.
Photoplethysmography in wearable devices: a comprehensive review of
technological
advances, current challenges, and future directions [37]
Integrated LED–PD AFE modules (e.g., MAX30101, ADPD144RI) and recent split-LED/multi-PD arrays; multi-wavelength
(green, red, IR, blue, yellow) emitters; barrier-rib packaging to curb crosstalk; wrist reflectance geometry with 25–100 Hz sampling
SVM (5-class stress, 94% accuracy); feedforward NN for cuffless BP (MAE 3 mmHg); bidirectional LSTM for four-stage sleep (K 0.62); XGBoost for glucose (R2 0.995); CNN + RNN for activity (F1 0.78)FIR/IIR, Hampel,
Savitzky–Golay; adaptive motion-artifact cancelation; three-point parabola interpolation for low-rate IBI recovery; extraction of time, frequency, morphological, MFCC,
TK energy and demographic features; 60/20/20 splits or k-fold CV
SVM, LightGBM, XGBoost, feedforward NN, LSTM, CNN–RNN; typical implementation in Python/TensorFlow or MATLAB (as reported in source
studies)
Accuracy, sensitivity, specificity, F1, ROC-AUC; Cohen K; MAE/SDE for BP; SEP for glucose; ESP-IP2 compliance; pre/post-stress timing error; k-fold or holdout validation over lab and free-living cohorts
Wearable Pressure Sensors for Pulse Wave Monitoring [38]Piezoresistive
foams, pyramids, ridges; capacitive micropyramids, porous textiles, skin-inspired interlocked ridges; optical fiber-Bragg gratings (FBG); piezoelectric PZT/PVDF thin films and nanofibers;
triboelectric PTFE-Cu/PDMS nanowire pairs, multilevel hexagonal-groove TENGs; soft
magnetoelastic silicone–micromagnet films and fibers (MEG) for waterproof, self-powered pulse capture.
Review cites YOLO/Faster-R-CNN
and OpenPose to suppress motion artifacts in vision-tracked cuffs, LSTM/RNN for waveform segmentation,
XGBoost–SHAP to rank microstructure variables; forecasts federated learning on Jetson Nano/Raspberry edges for privacy-preserving cardiovascular analytics.
Micropatterning (lithography, silicon-mold pyramids), porous
templating, laser-induced graphene; signals smoothed (moving average/Kalman), peak-picked (P1–P3), and mapped to pulse-wave-velocity or augmentation-index; 5-fold CV or Pileave-one-subject-out in AI demos.
Fabrication:
vacuum filtration Au-nanosheet/CNT hybrids, electrospun BaTiO-PVDF fibers, inkjet Ag/PEN; instrument stacks: Ivium CompactStat, LMP91000 BLE boards, Jetson Nano CUDA, MAT-
LAB/TensorFlow;
IoT back-hauls via MQTT over Wi-Fi/5G.
Bench metrics pooled from 250 papers: detection limit (≤0.5 Pa), sensitivity (up to 4016 kPa−1
piezoresistive; 44.5 kPa−1 capacitive), response < 4 ms (triboelectric), stability ≥ 10,000 cycles; pulse-wave validation vs. PPG/tonometry, heart rate error < 2 bpm; “good” when latency < 1 s, SNR 20 dB and all-day wear comfort.
Machine learning-based respiration rate and blood oxygen saturation estimation using photoplethysmogram
Signal [36]
Body/garment
wearables for workplace safety: IMUs and posture sensors, textile electrodes (ECG/EMG), temperature/SpO2 and stress proxies, camera/voice
interfaces; used in manufacturing, construction and firefighting scenarios.
Human-centered AI at the edge for low-latency decisions; example multimodal edge platform (EEG/ECG/PPG) for affective states (~76.8% accuracy) shows feasibility and limits; recommendations include pruning/quantization
and energy-aware design.
On-device filtering/feature extraction with selective off-load to a nearby node; continuous monitoring for risk (posture, workload, vitals) with real-time alerts; privacy by-design to keep raw data local.IIoT + edge stack (BLE/Wi-Fi/5G),
Raspberry Pi/Jetson-
class nodes, HCAI principles, NISTIR 8228 privacy/security guidance, EU Trustworthy-A guidelines; energy harvesting for longer wear.
Multi-metric focus: task accuracy under field conditions, latency (edge vs. cloud), battery
life/energy,
bandwidth saved, robustness and
privacy/security
compliance; a system is “good” when it maintains high accuracy with sub second responses and protects worker data.
Wearable Sensors,
Data Processing, and Artificial Intelligence in Pregnancy Monitoring: A Review [40]
Dry-textile and liquid metal ECG/fECG
harnesses; 16 electrode EHG grids; ionic-hydrogel or convex-microarray pressure patches; 3 axis IMU pods; piezo fPCG microphones; graphene e-tattoo EDA strips; soft multimodal belts with Bluetooth, Wi-Fi, NB-IoT or LoRa links
LightGBM pushes fetal-movement accuracy to 94%; CNN on 16-electrode EHG delivers AUC 0.92; neural networks and SVMs clear 90% on multiple FM datasets; ensemble trees outperform single-tree baselines, while QRS-based peak detectors cut heart rate error below 0.3 ppmFIR/IIR, Kalman smoothing, Hampel filters, CWT/DWT and Savitzky–Golay steps precede statistical, morphological or TFwavelet feature sets; dimensionality reduction and 60/20/20 or k-fold splits are standardPython/TensorFlow, MATLAB; LightGBM, CNN, SVM, k-means, orthogonal matching pursuit; on-device inference via embedded processorsAccuracy, sensitivity, specificity, precision, recall, F1, ROCAUC; ppm error against CTG;
ensemble-vs-single comparisons; emphasis on real-time operation and ≥90% accuracy as practical success markers
Validation of Wearable Vital Signs Monitoring: A Comparison with Conventional Bedside Patient Monitors [29]Wearable multi-parameter biosensor system (Mindray mWear), bedside clinical monitor (BeneVision N15), ECG-derived heart rate sensors, PPG-based SpO2 sensors, respiratory rate sensors, non-invasive blood pressure (NIBP) modulesNo direct AI/ML models used; statistical validation approach based on Bland–Altman agreement analysis for device comparability208 paired datasets from 16 volunteers, real-time synchronized measurements, signal preprocessing (artifact removal), comparative statistical analysis of wearable vs. clinical monitor outputsMindray mWear wearable monitoring system, BeneVision N15 bedside monitoring system, ProSim 8 simulator (pre-validation tool), Bland–Altman statistical framework for agreement analysisBland–Altman agreement testing, clinical validation in controlled hospital setting, percentage agreement: HR/RR (94.7%), SpO2/DBP/pulse (94.2%), systolic BP (92.3%), comparison against gold-standard bedside monitoring system
Wearable Sensors for Health Monitoring: Current Applications, Trends, and Future Directions [39]Wearable biochemical sensors (sweat, saliva, tears, interstitial fluid), epidermal biosensors, physical sensors (strain, pressure, motion, temperature), non-invasive optical and electrochemical sensorsAI-assisted health monitoring, machine learning for multimodal data interpretation, predictive analytics for early disease detection, cloud-integrated and privacy-aware AI frameworks for wearable health systemsContinuous real-time physiological and biochemical signal acquisition, microfluidic-assisted biofluid handling, multiplexed sensing of multi-analyte data streams, signal filtering and drift correction, embedded data preprocessing for high-frequency wearable outputsFlexible wearable platforms (textiles, hydrogels, PDMS substrates), microfluidic lab-on-skin systems, printed electronics, wireless communication modules, IoT-enabled health monitoring platforms, smartphone/cloud integration systemsOn-body validation of sensor performance, comparison with clinical reference methods, sensitivity and specificity of biomarker detection, long-term stability testing (biofouling, signal drift), multimodal performance benchmarking across biofluids and physical signals
Table 5. Brief summary of findings: biochemical sweat sensing.
StudySensors UsedAI InsightsData ProcessingTools and FrameworksEvaluation Methods
Multispectral sensor fusion in SmartWatch for in situ continuous monitoring of human skin hydration and body sweat loss [45]Multi-wavelength PPG module (535, 645, 970, 1450 nm) with germanium PDs, 3.5–5.5 mm LED–PD spacing, integrated into Galaxy Watch Active 2; IMU triad; color-change sticker as sweat referenceLightGBM ranked the 1450 nm slope as the key marker of sweat-film formation; SHAP revealed heart rate-linked 970 nm features as secondary cues25 Hz streams segmented into 3.5 min windows; 642 statswavelet features per window; Monte-
Carlo-derived
synthetic spectra augment modeling; smoothing 2–5 min
for trend detection
CUDA-based Monte Carlo skin model on dual RTX 2080 Ti
GPUs; ssqueezepy for wavelets; LightGBM for GBDT; SHAP for explainability and 4-fold CV accuracy (>0.70), comparison to sticker ground truth (±2 min), fit to Monte-Carlo reflectance curves; spectra and ultrasound cross-checks for hardware realism
Differential patterns of sweat and blood lactate concentration response during incremental exercise in varied ambient temperatures: A pilot study [46]Wearable microfluidic sweat-lactate patch (Grace Imaging) streaming 1 Hz via Bluetooth; portable finger-prick blood analyzer (Lactate Pro 2) during 3 min
treadmill stages
No machine learning; insights come from significant
temperature-
dependent shifts earlier Sweat LT and higher blood lactate in the heat; loss of sweat-to-blood correlation at 30 °C
Sweat samples averaged over last 30 s of each stage; Sweat LT = first sustained rise; Blood LT from log-log curve; datasets partitioned by ambient temperature for paired analysisGraphPad Prism 10.2 for stats; G*Power 3.1 for post hoc power; Bluetooth data logger supplied with sensor; randomized cross-over treadmill protocolShapiro–Wilk,
Wilcoxon, two-way
repeated-measures
ANOVA with Tukey post hoc, Pearson r; thresholds compared via paired t/Wilcoxon; significance at p < 0.05, effect size d = 2.74 noted in power analysis
A novel device for detecting anaerobic threshold using sweat lactate during exercise [12]Flexible PET printed-electrode sweat-lactate patch (LOx-Prussian-blue amperometry, 0.16 V vs. Ag/AgCl) plus Bluetooth-LE logger; finger-prick Lactate Pro 2 blood analyzer; breath-by-breath gas analyzer (AEROMONITOR)Change-Finder SDAR algorithm isolates sLT; univariable logistic regression identifies NYHA III and low peak VO2 as predictors of sensor non-response1 Hz sweat signals averaged per second; bLT from log-log curve; VT by multi-criterion gas analysis; sLT extracted from change-point scores and visual consensus; work-rate alignment across modalitiesCustom mobile app; on-board flash logging; R 3.6.3 for statistics; Sequentially Discounting AR (Change Finder) library; GraphPad
Prism for plots
Pearson r (sLT-bLT = 0.92; sLT-VT1 = 0.71); Bland–Altman bias −4.5 W/+2.5 W; least-products regression (no bias vs. bLT); p < 0.05 significance; logistic ORs for nonresponse
Sweat lactate sensor for detecting anaerobic threshold in heart failure: a prospective clinical trial (LacS-001) [48]Flexible PET three-electrode sweat lactate patch with
lactate-oxidase/ Prussian-blue transducer; Bluetooth LE logger; 1 Hz
perspiration-rate
meter; breath-by-breath gas analyzer for VT reference
No machine learning; sLT chosen as first visible inflection; Pearson r = 0.651 vs. VT; ICC 0.701 (sLT) and 0.838 (VTcp) show rater
consistency
1 Hz current stream → 13 s moving average
→ zero-baseline; visual inflection search; workloads aligned to ergometer ramp; sweat-rate tertile analysis for sensor responsiveness
Custom Android app; SAS 9.4 for stats; Aeromonitor® for respiratory gas;
Strength Ergo 8 ergometers
Pearson correlation, Bland–Altman bias/SD (4.9 ±
15 W), ICC for interrater reliability, safety audit of adverse events; “success” if SD ≤ 15 W and r ≥ 0.6 with no
device-related harm
Anaerobic threshold using sweat lactate sensor under hypoxia [49]Flexible enzyme amperometric sweat lactate patch (Grace Imaging) with lactate oxidase/Prussian blue electrodes; Bluetooth 1 Hz stream; SKN2000M perspiration meter 1 Hz; earlobe Lactate Pro 2 blood analyzer; Aeromonitor® breath-by-breath gas systemNo ML; key findings are high ICC (0.782 intra, 0.933 inter) and Pearson r = 0.70 between sLT and VT under hypoxia; sLT demonstrated lower observer bias than blood-lactate threshold1 Hz current → 13 s moving average → zero-baseline; first major inflection tagged as sLT; VT from V-slope, ventilatory equivalent and excessCO2 methods; paired normoxic–hypoxic comparisonCustom Android app for live display; IBM SPSS Statistics 27 for ICC, Pearson and Bland–Altman; laboratory hypoxic booth (Hypoxico
Everest Summit II)
ICC for reliability (≥0.782), Pearson correlation (r ≥ 0.70), Bland–Altman bias
15.5 s, predefined success if SD ≤ 15 W and r ≥ 0.6; safety audit reported no device-related events
Recent Studies on
Smart Textile-Based Wearable Sweat
Sensors for Medical
Monitoring: A Systematic Review [50]
Conductive-thread and Ag/Au-nanowire electrodes; graphene or CNT-coated fabrics; silk-derived nitrogen doped
carbon textile (SilkNCT); Janus hydrophilic/super-hydrophobic collection fabrics; microfluidic yarn/fabric channels; microwave monopole antenna-sensors
Early adoption of ensemble and deep learning models for adherence or health-status prediction; calls for on-garment inference and federated updates to cut latency and
protect privacy
Self-pumping or capillary microchannels, super-hydrophobic
vents, 13 s moving average or Kalman filtering, single-point or in situ two-point calibration; multiplex potentiometry + amperometry in the same patch
Laser carbonization of silk yarn, screen printing, embroidery; smartphone/BLE telemetry; MATLAB and early Tenso Flow/Keras
stacks for signal analytics; standard PRISMA workflow
for paper selection
Analytical figures of merit (sensitivity,
LOD, linearity, response time), wash-/stretch-cycle durability, breathability
and comfort questionnaires; where ML used: accuracy, F1, ROC-AUC; success declared when accuracy ≥ 90% or chemical error within clinical limits and patch survives daily wear
Sweat detection theory and fluid driven methods: A review [51]Optical fluorescent patches for Cl/Na+ and ratiometric MOF-based films; enzyme amperometric
electrodes for
glucose/lactate/ions; colorimetric paper or textile strips for pH and thresholds
ML still rare; review notes pilot studies using smartphone CNNs for color correction and on-patch anomaly flags for sensor driftLow-pass or Kalman filtering of amperometric currents; temperature and volume compensation; RGB/HSV extraction and ratiometric normalization for optics; time-stamped aliquots via CBVs or SAP gatesFlexible PCBs, NFC power harvesters,
mini-spectrometers;
PDMS, PET, or paper microchannels; salt-loaded agarose or PAAm hydrogels; laser-cut PMMA
micropore lids
Limit-of-detection, linear range, response-time (<40 s for Cl band-aid), flow-rate match to skin (0.05–0.25 µL min−1), stretch/wash cycling ≥100×, correlation vs. blood or gas-exchange gold standards; success if error ≤ 5–10% and uninterrupted flow ≥1 h
Recent Status on Lactate Monitoring in Sweat Using
Biosensors: Can This Approach Be an Alternative to Blood Detection? [52]
Enzyme amperometric patches (LOx/LDH on SPCE, nanoporous Au, textile threads); NiOOH/NiOx
and NiCo LDH nanozyme electrodes; MXCeO2, CeO2-
MoS2–Au catalysts; lactate-templated
MIP films on Ag nanowires or Pt NPs; optical/microwave textile yarns
Review argues that edge–cloud AI (e.g., H2TRAIN) could learn sweat–blood translation and flag sensor drift; prior work shows 0.3 mM blood-lactate error after algorithmic correction and suggests federated updates on-wearableMediator (Prussian blue, ferrocene) amperometry, nanozyme redox cycles, MIP electropolymerization; membranes or Janus fabrics to stabilize pH/flow; ambient electrospray or GLAD for enzyme/nanozyme deposition; 13 s moving averages and zero-baseline correction in wrist prototypesScreen-printed carbon or Au electrodes, nanoporous PC membranes, GLAD NiO columns, ambient electrospray LOx immobilization; smartphone/BLE telemetry; proposed edge–cloud pipeline for real-time analyticsSensitivity (up to 80 µA mM−1 cm−2), linear range (0.1–100 mM), and LoD (≈15 µM); correlation vs. blood (r 0.73–0.95) or Bland–Altman bias ±5 W where exercise thresholds used; wash/stretch endurance ≥ 100 cycles; “pass” if error ≤ 5–10% or ≥90% ML accuracy plus sub-minute response
Machine Learning Enables Reliable Colorimetric Detection of pH and Glucose in Wearable Sweat Sensors [53]Cotton squares carrying MO + BCG pH dye; enzyme-TMB (blue) and enzyme-KI (brown) glucose chemistries; response
3–5 min; reusable 5×; storage stable ≥3 weeks
LDA pushes pH accuracy to ~90%; SVM reaches 95% (TMB) and 90%
(KI); CNN hits
90% on largest set; explicit 15-feature segmentation boosts all models by ≈5–20 pp
iPhone photos in fixed light → crop → RGB extraction → 15-segment feature map; datasets: pH ≈ 450, TMB ≈ 630, KI ≈ 420 images; 9:1 train: test, 5-fold CVPython 3.9 scripts, ImageJ for ROI checks, scikit-learn LDA/SVM, Keras-CNN, lighting box, color-bar calibration for field useTraining/test
accuracy, 5-fold
CV (pH 90.5%,
TMB95.1%, KI90%); confusion matrix; stabilization time ≤ 5 min; wash-cycle durability; “pass” if ≥90% accuracy and quick convergence
Wireless wearable wristband for continuous sweat pH monitoring [54]CAD cotton strip with vinyl-sulfone dye (AD-VS-1) colorimetric pH patch; passive Flexicel absorbent pump; S11059-
02DT digital color sensor + white LED; PIC12LF1822 MCU; Bluetooth LE; 150 mAh Li-ion cell in wristwatch-sized housing
No machine learning; pH extracted by Boltzmann inversion of Hue; proposal to add on-device ML left for future work1 Hz color readings → 13-bit Hue → Boltzmann fit (R2 = 0.997) → pH; 90 s time-to-steady; app displays real-time plot and stores CSVCustom PCB with PIC MCU;
Hamamatsu color ASIC; Android Bluetooth app; syringe-pump rig (0.01 µL s−1) for bench tests; 3-D-printed enclosure
Precision (CV 3.6–6%), Boltzmann R2, limit of detection pH 6.0, battery-life simulation 2.63 days, continuous-flow endurance > 1000 min; field validation against pH-meter within ±2%
Advancements in wearable technology for monitoring lactate levels using lactate oxidase enzyme and free enzyme as analytical approaches: A review [55]Color-changing cotton or paper pads with bromocresol-green /methyl-orange or TMB/KI enzyme chemistries; electromagnetic resonator tags on polyimide; LOx-based electrochemical strips on gold fibers, Ag-nanowires, CNT paper, Prussian blue nanozyme membranes; textile threads, PDMS microfluidics and tattoo electrodes integrated into garments or directly on skin.Emerging
smartphone-side classifiers (LDA, SVM, small CNN) compensate lighting in colorimetric images and predict concentration; edge microcontrollers run drift-correction for amperometric sensors; review urges federated learning to link sweat and blood lactate profiles.
RGB extraction and 15-segment feature maps for hue sensors; impedance or S-parameter tracking for resonant tags; amperometric filtering, baseline zeroing, 13 s moving averages and Nafion or sulfonated-copolymer
membranes for noise rejection; 9:1 train: test or 5-fold CV when ML is applied.
Smartphone cameras with fixed-light boxes, scikit-learn
/Keras for image classifiers; EdgeCloudSim and biofuel-cell modeling for power studies; screen-printing,
electrospinning,
laser-patterning and wet spinning for fabricating textile and membrane electrodes.
Limit of detection
(0.07 mM color; ≤0.22 µM electrochem.), linear range (up to 30 mM), sensitivity (≤90 nA mM1 mm2), response time (<5 min), wash-or-bend cycling (≥100×), Pearson r to blood lactate where available; “good” if analytical error ≤ 10%, mechanics intact and continuous flow ≥1 h.
A wearable sensor for the detection of sodium and potassium in human sweat during exercise [56]SwEatch wrist pod with mirrored dual-macro-duct
fluidics; solid-contact
Na and K ISEs on screen-printed carbon, either PEDOT or one-step POT hybrid membranes;
cotton-thread
wicking; Shimmer PCB, 155 mAh Li-ion battery and Bluetooth telemetry
No machine learning; process “intelligence” lies in automating membrane drop-casting with an Opentrons robot, which quadruples yield and shortens fabrication timeOne-hertz potentiometric stream; four-point calibration (10−4–10−1 M) before and after trials; linear drift model corrects baseline; on-body conversion to mM via calibration curve; humidity, power output and heart rate metadata logged in parallelOpentrons Python API for automated casting; Lawson Labs multichannel
potentiometer; Consenys1.5.10 for data capture; 3-D printing in VeroBlackPlus/TangoBlack; MATLAB for plotting and drift correction
Slope (≈ 56 mV dec−1), selectivity (log K ≈ −2.7/−2.1), drift (≤1.5 mV h−1); on-body cycling test (90 min) with real-time Na+ and K+ profiles; “good” if Nernst-like response, stable calibration pre–post-trial and uninterrupted Bluetooth stream
A wearable conductivity sensor for wireless real-time sweat monitoring [57]PDMS wrist-patch with 1.2 mm intake; 35 mm Teflon micro-duct (0.64 mmID); dual Ag wires as 2-electrode cell; 100 kHz
relaxation-oscillator; packaged in commercial watch
bezel
No ML—core insight is selecting 100 kHz (from EIS) to null double-layer and polarization artifacts; linear calibration translates ADC counts to mScm−1 with R2 ≈ 0.98PIC16F1823 samples divider peak every 10 µs; rolling 3-sample mean for noise; cell-constant (40 cm−1) applied; Bluetooth HC-06 streams 1 Hz to Windows-phone where CSV logged and plottedRelaxation-oscillator
on discrete op-amp;
ADC @0.5 MHz;
Horiba LaquaTwin for reference; Agilent4294A for EIS; Windows-phone app in C for real-time display
EIS Bode/Nyquist to pick 100 kHz; linearity vs. Horiba (slope 0.064 mS cm−1 mM−1, R2 0.98, RMSE 0.023 mScm−1); drift < 2 mVh−1; field test: latency 7–20 min, stable 3.6–5.6 mScm−1 during 90 min ride; success = meets all three checkpoints
Wearable and flexible electrochemical sensors for sweat analysis: a review [58]Tattoo or textile enzyme-amperometric strips (LOx/GOx); solid-contact ISEs for Na+, K+, pH; bismuth-film SWASV for Zn2+/Cd2+/Pb2+; laser-engraved graphene color pads; microfluidic PDMS, hydrogel-osmotic or evaporation-pump channels; self-powered bio fuel-cell and
NFC patches
Review foresees edge-side ML for drift correction, sweat rate compensation and multiplex inference; cites first demonstrations of smartphone LDA/SVM lifting hue-based pH/glucose accuracy to ≈90% and Jetson Nano LSTM recognizers for multimodal health dataMoving-average or Kalman filters on amperometric currents; baseline zeroing for potentiometry; RGB segmentation → 15-feature maps for color pads; dataset-level taxonomy by analyte and substrate; historical timeline charts highlight milestone
devices
Screen/silk printing, roll-to-roll gravure, CO2-laser engraving, inkjet and transfer printing; integrated FPCB or RFID/BLE telemetry; microfluidic CAD; battery-free NFC links and biofuel-cell power harvestersComposite metric sets: latency (31%), cost (22%),
energy (14%),
accuracy (17%),
throughput (7%); pass if error ≤ 5–10%, response ≤ 5 min (chemical) or ≤100 ms (mechanical), durability ≥ 100–1000 cycles and uninterrupted wireless logging during hour-scale sessions
Molecularly Imprinted Polymer-Based Electrochemical Sensors for Amino Acid Detection: Towards Wearable Sensing [47]Molecularly imprinted polymer (MIP)-based electrochemical sensors, wearable sweat sensors, enzymatic and non-enzymatic biosensors, nanomaterial-enhanced electrodes (graphene, CNTs, gold nanoparticles, MOFs), microfluidic-integrated wearable biosensing platformsEmerging integration with AI/ML for wearable health analytics, data-driven interpretation of multi-analyte sweat profiles, future direction toward AI-assisted personalized metabolic and disease prediction systemsReal-time sweat sampling and microfluidic transport, electrochemical signal conversion (EIS, DPV, SWV, CV), multiplexed amino acid detection, signal filtering and drift correction, integration with wearable data acquisition systemsMIP synthesis frameworks (bulk polymerization, precipitation, electro polymerization), lab-on-skin wearable platforms, laser-induced graphene (LIG) electrodes, microfluidic sweat collection systems, iontophoresis-based sweat stimulation devices (e.g., wearable patches), flexible substrates (PDMS, hydrogels, textiles)Analytical performance metrics (LOD, selectivity, sensitivity), electrochemical characterization (EIS, DPV, SWV), stability testing (biofouling resistance, signal drift), physiological variability assessment (intra/inter-subject sweat differences), wearable validation under real-time conditions, multiplex amino acid detection performance
Recent advances in wearable electrochemical sensors for in situ detection of biochemical markers [62]Wearable electrochemical biosensors, flexible electrodes, enzymatic sensors, immunosensors (antibody-based), aptamer-based sensors, molecularly imprinted polymer (MIP) sensors, ion-selective electrodes, nanomaterial-enhanced sensors (graphene, CNTs, conductive polymers), sweat-based and interstitial fluid biosensorsEmerging integration of AI/ML for wearable health data interpretation, intelligent signal analysis for multimodal biochemical monitoring, early-stage use of cloud-based and AI-assisted diagnostic frameworks for wearable biosensorsReal-time electrochemical signal conversion (amperometry, potentiometry, impedance spectroscopy), continuous biofluid sampling (sweat, ISF), signal filtering and drift correction, multiplexed biomarker detection, integration of on-body data acquisition and wireless transmission systemsFlexible wearable platforms (PDMS, hydrogels, textiles, paper-based substrates), microfluidic integration for sweat/ISF transport, printed electronics, nanomaterial-modified electrodes, wireless communication modules, smartphone/cloud connectivity systems, miniaturized potentiostatsAnalytical performance metrics (sensitivity, selectivity, limit of detection), stability testing (biofouling resistance, signal drift over time), on-body validation, comparison with conventional laboratory methods, correlation between biofluids (sweat/ISF) and physiological biomarkers, long-term wearable performance assessment
Smartphone based wearable sweat glucose sensing device correlated with machine learning for real-time diabetes screening [59]Flexible screen-printed carbon strip modified with CNT-CNF nanocomposite → 10-cycle Prussian
Blue layer → chitosan + GOx; cotton sweat-pad; coin-cell Bluetooth potentiostat in ABS body strap
XGBoost regressor (R2 0.86) + SHAP ranks CNF > PB cycles > CNT for H2O2 current; ML optimization boosts signal ≈ 20% and guides strip recipe250 Hz amperometry at0.216 V for 120 s; 9:1 train:test split; 5-fold CV; linear regression in app converts final current to glucose
(0.1–1.5 mM)
Portable PCB with LMP91000 AFE, PIC16F1823 MCU,
CR2032 cell, HC-05 BLE; Android app in Flutter/Dart; XGBoost, SHAP via Scikit-learn; Horiba LaquaTwin reference meter
Calibration slope
R2 0.997, LOD 0.1 mM; ML metrics
R2 0.86, RMSE
0.18 µA; stability
85% signal at
21 days/4 °C; on-body test mirrors blood glucose; success if accuracy ≥ 90%,
Bluetooth stable, drift < 1.5 mVh−1
Machine learning-powered wearable interface for distinguishable and predictable sweat sensing [60]Dual working electrodes on
laser-induced graphene:
MWCNT/LIG and carbon-black/LIG,
plus Ag reference on PI; PDMS microfluidic with cotton intake; coin-cell Bluetooth potentiostat (MS-02 front-end, LMP91000 AFE) in body strap
KNN sorts 285
DPV records into nine mixture × pH classes at 99.3% accuracy; 4-13-3 BPNN regresses Tyr, Trp and pH with R > 0.99, MAE ≈ 3 µM (Trp) and 5µM (Tyr); SHAP shows CNF > PB cycles > CNT loading dominates sensor gain
Four DPV features (Ip, Ep from both electrodes) extracted every 120 s; 57 design points × 5 repeats → 285 samples; 5-fold CV for KNN, 80/20 split for BPNN; normalization, leave-one-subject-out tests; streaming at 1 Hz via BLEMATLAB R2021b for KNN/BPNN; XGBoost and SHAP for material optimization; custom Android app in Flutter/Dart; microfluidic soft lithography; HPLC (Agilent 1260) for validationCross-validated
accuracy (99.3%), regression R an RMSE,
Bland–Altman bias, Pearson r ≈ 0.98 vs. HPLC; mechanical
RSD < 1% after
100 bends; flow-rate stability, on-body cycling with/without amino-acid supplements, p < 0.05 for group differences; success criteria: ≥98% class accuracy, ≤10 µM error, pH RSD < 2%, stable 1 Hz BLE
Skin-Attachable, Stretchable Electrochemical Sweat Sensor for Glucose and pH Detection [61]Percolated AuNS traces on PDMS; 5-bilayer CNT overcoat; CoWO4/CNT
non-enzymatic
glucose pad; polyaniline/CNT pH pad; Ag-nanowire/PVB-buffer solid Ag/AgCl reference; Silbione encapsulation; tolerant to 30% strain and 1000 cycles
None—signal conversion is direct electrochemistry; no ML requiredChrono-amperometry at 0.2 V (250 Hz sampling, 120 s) for glucose; open-circuit potential for pH; 5-fold calibration, temperature correction to 30 °C; 1 Hz BLE streamingIvium CompactStat;
LMP91000 AFE + PIC16F MCU coin-cell board; Android app (Flutter/Dart);
Vacuum filtration, layer-by-layer CNT, hydrothermal CoWO4 synthesis,
electropolymerization
of PANI
Sensitivity 10.89 µA mM−1 cm−2
(glucose)/71.44 mV pH−1; LOD 1.3 µM; selectivity vs. AA, UA, urea, acetaminophen; mechanical drift < 11% at 50% strain, none after 1000 cycles; storage stability 10 days; on-body R2 ≈ 1 vs. commercial assays; “pass” if sensitivity within spec, drift < 2 mV h−1, stable BLE for >90 min exercise
Self-powered smart patch for sweat conductivity monitoring [63]Two paper-based Mg/AgCl
liquid-activated batteries (0.5 mm glass fiber core, 2.5 × 5 mm electrodes) stacked under a PDMS adhesive; load resistor ladder, single MOSFET, dual electrochromic icons on PEN; patch sticks to forearm and activates with ~30 µL sweat
None—decision is a fixed 1.51 V threshold at MOSFET gate; design prioritizes zero-false-negative screening over analyticsLinear-sweep polarization curves to map rint vs. σ; voltage-time traces at 2 kΩ load; gate voltage logged, charge to TEST icon integrated; Gaussian fit to set cut-off (5% tail of 60 mM distribution)Gamry Reference3000 potentiostat; Metrohm 914
pH/conductometer; inkjet silver (DuPontPE-410), screen-printed Ag; inkjet PEN substrate; electrochromic displays by Ynvisible; EP12-A2 CLSI
protocol
95% sensitivity, 100% specificity on 40-device cohort; <2 mVh−1 drift; CV ≤ 3.5% for single-cell resistance, 30–42% for full-patch charge (threshold region); artificial sweat matrix shows no added variance; “pass” if
TEST icon only colors at ≥60 mM NaCl and run lasts ≥90 min exercise
Diving into Sweat: Advances, Challenges, and Future Directions in Wearable Sweat Sensing [4]Skin-interfaced Electrochemical sensors (enzymes, aptamers, MIPs) and optical colorimetric pads on stretchable
substrates (PDMS, SEBS) with nanomaterial electrodes (CNTs, nanowires, Prussian Blue) and microfluidic sampling; optional iontophoresis (pilocarpine/carbachol) to stimulate sweat for 1–24 h.
Lightweight ML maps hue or voltammetry to
concentrations;
multimodal ML fuses sweat analytes with physiological signals to recognize states (e.g., stress) and can personalize sweat health inference beyond strict blood correlation.
Baseline/pH/temperature compensation, flow-rate awareness and dilution correction; microfluidics to curb evaporation/contamination;
calibration with auxiliary sensors; feature extraction from amperometric/voltammetric or color data.
Stretchable electronics, epidermal microfluidics, iontophoresis modules; smartphone/IoT links for telemetry; scalable printing (screen, inkjet, roll-to-roll) and laser engraving for low-cost fabrication; bias-aware ML pipelines.Analytical accuracy within ~5–10%; hours-long stability
(up to 100 h reported); adhesion during motion; and where applicable, blood–sweat correlation (table of r values across targets) or validated multimodal predictions. Success requires continuous flow, low drift, and performance on real users beyond bench tests.
Measurement of sweat lactate levels in exercise and nonexercise activities using capillary
electrophoresis
system with contactless conductivity detection and cyclodextrin-modified buffer [44]
The capillary electrophoresis (CE) system combined with a contactless conductivity detector C4DThe mean lactate values were 94 ± 48 mM during exercise and 24 ± 7 mM during non-exercise activities, respectively.Before each activity, the participants were instructed to clean their skin using soap. The collected sweat samples were stored at 4 °C. Each sweat sample was dilute with ultrapure
water
The E-corder was used to record signal from detector. The eDAQ Chart software to analyze recorded
signal
The US-FDA guide-
lines.
Adhesive RFID Sensor Patch for Monitoring of Sweat Elec-
Trolytes [64]
Skin-adhesive RFID patch (ISO-15693, 13.56 MHz [78]) using MLX90129 with Cu/polyimide loop antenna; Pd/Ag → Ag/AgCl electrodes with Na+ ionophore-PVC membrane; optional paper microfluidics; Parylene-C encapsulation; on patch temperature sensor; Android phone reader.No ML; sensing is potentiometric and temperature via on-chip sensor; intelligence resides in RFID IC configuration and smartphone appIn vitro NaCl 10–90 mM calibration; step tests 20–70 mM with ~30 s response; on patch linear fit (ADC limited slope) vs. stand-alone Nernstian behavior; smartphone acquisition/averaging; antenna S11 tuning.MLX90129 RFID/sensor,
Cu/Kapton Pyralux flex; electroplating Pd/Ag, Ag
chlorination; PVC/ionophore casting; Android app; VNA loop-probe for S-parameters; Parylene-C coating; 3 M medical
adhesives; laser cut integration.
Linearity and sensitivity (on patch vs. stand-alone), accuracy 96% at 50 mM, precision, response time (~30 s), drift, repeatability (CV ≤ 0.8%), RFID power/comm reliability; wear up to 7 days; criterion for “good”: accurate, low-drift, fast, and robust wireless readout.
Table 6. Brief summary of findings: motion and biomechanics sensing.
StudySensors UsedAI InsightsData ProcessingTools and FrameworksEvaluation Methods
Development of artificial intelligence edge computing based wearable device for fall detection and prevention of elderly people [66]A triple-axis accelerometer sensor (MPU6050)CNN-LSTM with attention layer, exhibited accuracy, recall, precision, and F1 score of 97%, 98%, 98%, and 0.98, respectivelyRaw sensor data is segmented (80% for training, 20% for testing). Data preprocessing includes noise reduction through Fast Fourier Transform
(FFT) analysis and
Finite Impulse Response (FIR) filtering, with a hamming window applied to optimize
frequency–time localization.
Google Collaboratory; AI edge computing devices—namely Raspberry Pi 3, Raspberry Pi 4, and NVIDIA Jetson Nano.Accuracy, precision, recall, F1 score
Land and Underwater Gait Analysis Using Wearable IMU [67]Dual, self-contained waterproof IMU loggers (9-axis AHRS, on-board flash, Li-ion), taped to thigh and shank for knee-angle capture on land or in pool; comparison gear: Vicon-460 IR camera array; ASUS ZenFone 3 and Sony
A5000 video rigs
Single Matern 5/2 Gaussian Process Regression trained on 20 k+ paired samples lifts raw IMU accuracy; retains sub millisecond inference and runs offline in MATLAB (future edge deployment suggested)IMU ASCII → knee angle via 4-quadrant arctan; video digitization in Kinovea; Vicon Plug-in-Gait export; streams resampled 100 Hz, normalized, 40-lag predictor matrix built before GPRMATLAB R2018a, XLSTAT 2019, Kinovea 0.8.26, MATLAB Camera Calibration Toolbox; Sony A5000/ASUS ZenFone capture; custom epoxy-sealed logger hardwareRMSE (raw
10.1° → 6.3° land; 8.8° → 6.6° water), Pearson r (0.90 → 0.95 land; ≥0.80 for 93% water gaits), Bland–Altman bias 2.8° and SD 5.4° post-GPR, CV tracked optical references; success if r > 0.80, bias within ±1.96 SD and RMSE < 7°
Towards soft wearable strain sensors for muscle activity monitoring [69]Four SCARS soft strain patches (CFPC meander + TPU) on quadriceps; 1 kHz logging; paired isokinetic dynamometer and
tri-channel sEMG
Simple cubic regression maps
strain→ torque
(r2 0.90); PCA picks best patch;
Repeated measures correlation rrm 0.73 confirms consistency; concept of combining with sEMG for
electromechanical delay highlighted
5 Hz Butterworth filter, normalization, cubic fit (group vs. subject specific), PCA variance ranking, 1 Hz window peaks, Bland–Altman bias/SDMATLAB R2018a for filtering, PCA, plotting; R (rmcorr) for repeated-measures stats; PowerLab 8/35 DAQ; HUMAC-
Norm dynamometer; Noraxon TELEmyo
EMG
NRMSE (isometric 0.09; fatigue 0.15), r2 (0.90 group, 0.93 personal), rrm 0.73, Bland–Altman bias ≈ 0, CV tracking; “good” if NRMSE ≤ 0.15 and r ≥ 0.7 vs. dynamometer
A novel WGF-LN based edge driven intelligence for wearable devices in human activity
Recognition [70]
The combined dataset used in the paper consists of several different sensors:
accelerometer, stretch sensor, electrocardiogram, magnetometer, gyroscope
The proposed WGFLN model offers superior performance for human activity recognition (HAR).Data preprocessing: 1. Data cleaning based on Mode-Integrated Binning Algorithm (MIBA); 2. Data integration using peer to peer technique; 3. Data transformation involves an automatic selection algorithm called Entropy-
Candidate k partition Discretization (E-C-D); 4. Feature extraction based on Haar Wavelet mother-Symlet wavelet coefficient scattering feature extraction (HS-
WSFE); 5. Feature reduction using
Binomial Distribution integrated-Golden Eagle Optimization (BD-GEO). 6. Feature normalization involves a scatter plot to matrix technique.
Data cleaning methods: MIBA, binning algorithms, EFB, and EWB;
Feature extraction models: HS-WSFE, AutoEncoder (AE), Deep Neural
Networks (DNNs), and
Wavelet Scattering (WS); Feature reduction techniques: BD-GEO, Golden
Eagle Optimizer (GEO), Gray Wolf Optimizer (GWO), Genetic Algorithm (GA), and Particle
Swarm Optimization (PSO); Classification models: Wavelet-based Graph Filter with Laplacian Normalization
(WGF-LN), LegoNet,
Convolutional Neural
Network (CNN), and Deep Neural Network (DNN).
Real-Time Wearable Biomechanics Framework for Sports Injury Prevention and Rehabilitation Optimization [68]IMUs (knee, hip, shoulder joints), sEMG (biceps, triceps, quadriceps, hamstrings), optional force-based biomechanical estimatesMachine learning (LSTM-based predictive modeling), biomechanical stress prediction, injury-risk classification, real-time feedback for movement correction, asymmetry detection (>10° joint deviation, >15% muscle imbalance), rehabilitation optimizationSignal filtering (Butterworth low-pass 6 Hz), EMG preprocessing (rectification + RMS smoothing), sensor fusion (IMU + sEMG), feature extraction (joint angles, muscle activation), real-time streaming pipeline, calibration correction, latency-aware processingXsens IMUs, Delsys EMG system, TensorFlow Lite deployment, Python-based ML pipeline, Madgwick filter for orientation estimation, bidirectional LSTM architectureAccuracy (92.3%), Recall (90.5%), Precision (88.1%), AUC-ROC (0.93), latency (188 ± 15 ms), R2 > 0.85 biomechanical prediction fit, cross-validation, ablation testing, clinical agreement with physiotherapists (~87.5%), FMS correlation (~91%)
Table 7. Brief summary of findings: edge AI and data analytics.
StudySensors UsedAI InsightsData ProcessingTools and FrameworksEvaluation Methods
Edge artificial intelligence for big data: a systematic review [6]Edge nodes instead of single probes: Raspberry Pi 3 boards, FPGA SoCs, custom multi-TOPS AI cores, MEC/fog servers, and microgrid controllers hosting split/quantized models; co-located with cameras, UAVs, valves, etc.Dominant strategies: light weight CNN/TinyDL, RL for scheduling, FL for privacy, transfer learning, and model splitting/early exit; success hinges on shaving latency without losing accuracy.Corpus filtered from 289 → 239 → 85
papers; edge-side
aggregation/filtering, selective off-load; datasets include CIFAR-10, MNIST, CTU, manufacturing and microgrid traces; both simulation and real testbeds.
Python/Monte-Carlo, Stackelberg/ADMM game models, EdgeCloudSim,
YAFS/iFogSim (per cited works), FPGA too chains; FL frameworks, differential privacy, blockchain for security.
Multi-metric focus:
Latency/time (31%),
System cost (22%),
Energy (14%),
Accuracy (17%),
Throughput (7%),
Precision/recall/F1 and bandwidth (2% each), Bland–Altman not typical—most rely on % gains vs. cloud baselines.
An AI-Edge Platform with Multimodal Wearable Physiological Signals Monitoring Sensors for Affective Computing
Applications [71]
ADS1299 8-channel EEG headset, ADS1298 12-lead ECG board, MAX30102 660 nm PPG finger clip; all on Spartan-6 with Bluetooth; Kintex-7 RISC-V edge hubDual CNNs: 2-D
STFT-spectrogram CNN
(subject-independent) and 1-D HRV-feature CNN (subject-dependent); fuzzy-logic fusion raises confidence
EEG: 4 s STFT, baseline normalization, 8–45 Hz bands; ECG/PPG: 30 s windows, RRI, HRV, PTT, SDNN, LF/HF; 1 s stride synchronizes modalitiesRISC-V MCU + FPGA CNN accelerators; Spartan-6 sensor boards; Kintex-7 edge node; MATLAB GUI; Bluetooth piconet for 3-stream uplinkLeave-one-subject-out EEG accuracy 76.94% ± 16.6%; ECG/PPG 80/20 split accuracy 76.8%; real-time edge latency; success when accuracy ≥ 75% and streaming uninterrupted
At the Confluence of Artificial Intelligence and Edge Computing in IoT-Based Applications: A Review and
New Perspectives [73]
Edge hardware rather than physical probes: Raspberry Pi 3/4, NVIDIA
Jetson, ESP32, ARM-based MEC micro-servers, fog gateways; enabling tactics include lightweight model pruning/quantization, transfer learning initialization, federated gradients, post-training quantization, early exit or split-DNN deployment; 37% lightweight, 25% TL, 15% FL, 12% HW/SW optimization, 9% on node preprocessing, 2% early exit
Dominant families: SVM, KNN, RF, DT for structured data; CNN, LSTM/GRU,
DNN, and VAE/GAN for images, audio, and multivariate streams; RL (Q-learning, deep-RL) for resource scheduling; swarm and evolutionary optimizers (PSO, GA, ant-bee, Grey wolf) for feature or hyperparameter search
Edge nodes aggregate, filter, impute, and reduce raw sensor traffic and then run prediction,
classification,
visualization, and rule-based decisions; they also handle task scheduling and load balancing to neighboring nodes—collectively labeled “intelligent sensing” in the review’s taxonomy
29% TensorFlow,
8% Keras,
6% TensorFlow Lite for on-device inference;
8% MATLAB; bigdata stacks (Hadoop
HDFS, Spark,
Kafka); simulators iFogSim, YAFS; ancillary libraries Caffe, OpenCV, and JavaScript toolkits for browser-side ML
Metric mix led by accuracy (36%) and
latency (27%),
followed by training/inference time (17%), data-reduction
and throughput ratios, energy or memory use, plus
security/privacy
audits; acceptable solutions typically keep latency below sub-second thresholds while sustaining ≈90% accuracy on unseen data
Edge AI: A survey [74]Edge-side hardware rather than single probes: Raspberry
Pi/Jetson Nano boxes, Wi-Fi/5G access points, base-station MEC blades and rugged micro-DC racks; any device “with compute, storage and connectivity” can host a node, from traffic lights to factory robots
Lightweight CNN/TinyML,
transfer learning and federated updates keep models small; RL and swarm metaheuristics optimize task scheduling; split-DNN and early-exit architectures spread a network across device → edge → cloud
On-device aggregation, filtering, imputation, reduction; adaptive offloading, edge caching, SDN-steered routing; containers for hot-swap micro-services; privacy preserved by keeping raw data localOpenFog and ETSI MEC reference stacks; Open Edge Computing cloudlet
APIs; SDN/NFV, ICN, virtualization and edge simulators (iFogSim, YAFS);
TensorFlow Lite/PyTorch Mobile for inference on ARM cores
Latency vs. cloud, accuracy/F1 vs. cloud model; bandwidth saved; energy per inference; qualitative QoE gains; “success” thresholds: ≤50–200 ms round-trip, ≥90% of cloud accuracy, and demonstrable
traffic/energy cuts
Wearable edge AI towards cyber-physical applications [75]Smart-helmet with LiDAR, RGB camera and PiZeroW; edge AI nodes: Pi3B/3B+/Jetson Nano; wearable vest with
MAX3010x SpO, temp, IMU; COVID face-shield HUD; leaf-imaging rig for GAN; ant-counting camera.
Conditional GAN rebuilds leaf masks; MLP vs. CNN for leaf health; LSTM-based HAR hits 94.7% accuracy; QoS-aware resource scheduling.On-device capture
→ RGB-to-HSV and pseudospectrum or 2 s IMU windows → edge batch inference → SQLite/CSV logging; sliding-window or 1 Hz telemetry; tflite conversion for micro-controllers.
TensorFlow/TFLite,
Keras, OpenCV;
Python/NumPy on Jetson; RISC-V MCU for future work; COTS Pi/Jetson boards; WLAN/BLE mesh; custom C display for Windows-phone legacy watch.
Latency per pipeline stage, RMSE and accuracy, precision–recall–F1, confusion matrices; hardware bench across Pi/Jetson power modes; QoS factor vs. client count; soft real-time limit 0.5 s; success = latency < φ, accuracy ≥ 90% and stable stream.
Energy-Efficient AI at the edge for Biomedical Applications [76]On-chip low-noise EEG front-end (8–16 channels); ADC; coin-cell-class SoC; no external sensors neededClassical SVM/DT for patient-specific mode; SciCNN for
patient-independent mode with on-device zero-shot fine-tuning; hardware-friendly
feature blocks minimize DBE
energy
Continuous EEG streamed at 256 Hz into sliding windows; auto feature extraction inside SciCNN; online tuning refines weights after deployment without cloud accessEdge-in-silicon CNN accelerator; pre-training on
CHB-MIT and EU EEG sets; on-chip SRAM buffers; coin-cell supply; no external OS or OS-less firmware
Leave-one-patient-out sensitivity/specificity 90%/94% (CHB-MIT, EU); clinical pilot 83%/89%; success if sensitivity ≥ 90%, FP ≤ 10%, latency < closed-loop budget and power ≤ wearable envelope
Next-Generation swimming pool drowning prevention strategy integrating AI and IoT technologies [77]Overhead and underwater RGB/IR cameras; mm wave or FMCW radar; ultrasonic and acoustic sonar arrays; wrist-worn accelerometers,
IMUs, pulse-ox, pressure and heart rate tags; Bluetooth beacons; pool-wall LiDAR; smart nets and
inflatable airbags
YOLOv4/v5,
Tiny-YOLO, Faster and MaskR-CNN, OpenPose, KNN,
SVM, LSTM, DCNN, Kalman, and HMM trackers; SHAP for feature ranking; transfer learning from ImageNet/COCO; federated updates for privacy
Background subtraction, optical-flow, dense pose,
HSV/ripple masks,
Gaussian-mixture and ViBe, robust Bayes and Markov smoothing; sliding-window time-under-water counters; edge compression and 5G MQTT push
ArduinoUno/Nano, Raspberry Pi3/4, PiZeroW, Jetson Nano, Pixy Cam, HC-05 BLE; OpenCV, TensorFlow, PyTorch, EdgeAI CUDA; MQTT, HTTP/REST, cloud MapReduce; 5G and Wi-Fi meshAccuracy/ precision recall (≥90%), mAP and AUC for vision nets; detection latency < 1 s; RMSE for radar range; false-alarm rate < 5%; submerged-time threshold (5–10 s) tests; field pilots in commercial pools and open beaches
Human-Centered Edge AI and Wearable Technology for Workplace Health and Safety in Industry 5.0 [78]Body/garment
wearables for workplace safety: IMUs and posture sensors, textile electrodes (ECG/EMG), temperature/SpO2 and stress proxies, camera/voice
interfaces; used in manufacturing, construction and firefighting scenarios.
Human-centered AI at the edge for low latency decisions; example multimodal edge platform
(EEG/ECG/PPG) for affective states (~76.8% accuracy) shows feasibility and limits; recommendations include pruning/quantization
and energy-aware design.
On-device filtering/feature extraction with selective off-load to a nearby node; continuous monitoring for risk (posture, workload, vitals) with real-time alerts; privacy by-design to keep raw data local.IIoT + edge stack (BLE/Wi-Fi/5G), Raspberry Pi/Jetson-class nodes, HCAI principles, NISTIR 8228 privacy/security guidance, EU Trustworthy-AI guidelines; energy harvesting for longer wear.Multi-metric focus: task accuracy under field conditions, latency (edge vs. cloud), battery life/energy, bandwidth saved, robustness and privacy/security compliance; a system is “good when it maintains high accuracy with sub second responses and protects worker data”.
Biosensing Technologies for Foodborne Pathogen Detection and Healthcare: Principles, Emerging Materials, And Intelligent Platforms [72]Electrochemical biosensors, optical biosensors, piezoelectric sensors, microfluidic biosensors, CRISPR-based sensors, aptamer-based sensors, bacteriophage-based sensors, nanozyme-enhanced sensorsIntegration of AI/ML for pattern recognition, signal classification, noise reduction, multiplex pathogen detection, predictive analytics for food safety monitoringReal-time signal processing, electrochemical/optical signal conversion, microfluidic sample pre-treatment, IoT/cloud-based data transmission, multimodal data fusion across sensor typesLab-on-chip systems, microfluidic platforms, smartphone-enabled biosensors, IoT-connected diagnostic systems, nanomaterials (AuNPs, graphene, MXenes), AI-assisted biosensing pipelinesLimit of detection (LOD) benchmarking, sensitivity and specificity analysis, response time testing, multiplex detection efficiency, validation in complex food matrices, real-world applicability (food supply chain testing)
Disclaimer/Publisher’s Note: The statements, opinions and data contained in all publications are solely those of the individual author(s) and contributor(s) and not of MDPI and/or the editor(s). MDPI and/or the editor(s) disclaim responsibility for any injury to people or property resulting from any ideas, methods, instructions or products referred to in the content.