Review

Explainable AI for Deep Visual Recognition: Evaluation, Methods, and Open Challenges

by
Khalid Nawaf Alharbi
Department of Computer Science, College of Science, Northern Border University, Arar 91431, Saudi Arabia
Electronics 2026, 15(14), 3222; https://doi.org/10.3390/electronics15143222
Submission received: 5 July 2026 / Revised: 15 July 2026 / Accepted: 20 July 2026 / Published: 22 July 2026

Abstract

Deep visual recognition has achieved remarkable success across various domains, including medical imaging, autonomous vehicles, and security systems. However, the black-box nature of deep learning models poses challenges in terms of transparency and trust, especially in critical applications where human understanding is essential. Explainable AI (XAI) seeks to address these concerns by providing human-interpretable explanations for model predictions. This review explores the key techniques for explainability in deep visual recognition, including model-agnostic methods such as LIME and SHAP, model-specific approaches like saliency maps and feature visualization, and intrinsically interpretable models like decision trees and rule-based systems. We also discuss the evaluation of explainability through metrics like fidelity, consistency, and stability, and explore the challenges of balancing model performance with interpretability. Furthermore, we examine applications of XAI in medical imaging, autonomous driving, security and surveillance, agriculture, satellite imagery and remote sensing, industrial inspection, and visual forensics, highlighting how domain-specific data and operational constraints affect the required form and validation of explanations. Finally, we address current research gaps and propose future directions for enhancing the robustness and human–AI interaction in explainable visual recognition systems. As AI continues to be integrated into safety-critical domains, the development of explainable, transparent, and trustworthy AI systems will be crucial for their widespread adoption and ethical use.

1. Introduction

The rapid advancement of deep learning techniques has revolutionized the field of computer vision, enabling machines to achieve unprecedented accuracy in tasks such as object detection, image classification, and facial recognition [1]. However, the growing complexity of deep learning models, especially deep neural networks, has raised significant concerns regarding their interpretability [2]. These models, often described as “black boxes,” are capable of producing high-performance results but offer little insight into how they arrive at their decisions [3]. This lack of transparency is particularly problematic in domains where understanding the reasoning behind model predictions is crucial, such as healthcare, autonomous driving, and law enforcement. Explainable AI (XAI) aims to bridge this gap by making AI systems more interpretable and providing human-readable explanations for their decisions [3,4,5].
In deep visual recognition, XAI is not limited to general model transparency; it is concerned with identifying the visual evidence that supports a prediction. Existing XAI approaches aim to make model behavior more understandable and interpretable for users [6,7], while also supporting trust, accountability, and fairness in AI-assisted decision-making [8]. In image- and video-based tasks, this means examining the features, patterns, and regions of interest that influence the model output [9]. Such explanations are especially important in safety-critical settings, where incorrect or poorly justified predictions may affect clinical diagnosis, autonomous navigation, or other high-risk decisions [10].
Deep visual recognition models, such as convolutional neural networks (CNNs), have achieved state-of-the-art performance in many visual tasks, but their internal reasoning often remains difficult to interpret [11]. In healthcare, where AI systems are increasingly used to support diagnosis and treatment decisions, explanations are needed to help clinicians examine whether model predictions are based on clinically relevant visual evidence [12]. This interpretability is important for user trust and for the practical adoption of AI-assisted decision-support systems [13]. Explainability can also support bias detection by revealing whether models rely on inappropriate or spurious cues that may lead to unfair outcomes across different user groups or deployment settings [14].
Although several broad surveys have reviewed explainability from a general machine-learning perspective, visual recognition presents distinctive explanation requirements that cannot be fully addressed by generic XAI taxonomies alone. Throughout this review, the term visual recognition is used as the preferred scope-specific term for the computer-vision tasks considered here, including image classification, object detection, segmentation, facial recognition, medical-image analysis, surveillance, agricultural monitoring, and visual forensics. The broader term computer vision is used only when referring to the wider research field, search terminology, or source titles. In computer vision, explanations are often expected to identify image regions, object parts, pixels, patches, concepts, prototypes, or attention pathways that directly support a prediction [11,15,16,17,18,19,20,21,22,23]. Therefore, this review gives particular attention to pivotal visual-XAI methods introduced in the computer-vision and machine-learning literature, including class activation mapping [15], gradient-based localization [11,16], perturbation-based visual explanations [18,24], concept-based explanations [19,25], prototype-based interpretable networks [20], and attention-based explanations for Vision Transformers [21,22,23]. This vision-oriented perspective is important because explanation quality in visual recognition depends not only on model transparency but also on spatial localization, object-boundary ambiguity, background bias, multi-object scenes, patch-token interactions, and the faithfulness of visual heatmaps to the model’s actual decision process [22,23,26].
This review aims to provide a comprehensive overview of XAI techniques for deep visual recognition, with particular emphasis on their methods, evaluation, limitations, and open challenges. The review also examines how explanation requirements differ across medical imaging, autonomous driving, security and surveillance, agriculture, satellite imagery and remote sensing, industrial inspection, retail recognition, and visual forensics, thereby avoiding a scope limited primarily to healthcare and transportation. We will explore the various techniques that have been proposed to explain the decisions of deep learning models in visual recognition tasks, including model-agnostic approaches like LIME and SHAP, as well as model-specific methods such as saliency maps and feature visualization. Additionally, we will delve into the challenges and limitations of current explainability techniques, particularly in terms of their applicability to complex real-world datasets and their trade-offs with model performance.
Despite significant progress in XAI, several research gaps remain, particularly in understanding the relationship between model performance, explanation faithfulness, and interpretability. One key challenge in deep visual recognition is to provide explanations for complex models without reducing predictive performance or producing misleading post hoc interpretations. Another challenge is the lack of universally accepted metrics for evaluating the quality of explanations. Furthermore, the human–AI interaction aspect of explainability has yet to be fully explored, particularly in terms of how users perceive and trust AI explanations. The objectives of this review are to: (1) evaluate existing XAI techniques in deep visual recognition, (2) identify the limitations of current methods, (3) compare explanation requirements and validation practices across a broad range of high-impact visual domains, including remote sensing and industrial inspection, (4) highlight open challenges in the field and (5) propose future research directions for improving explainability in deep learning-based visual-recognition systems.

2. Review Methodology and Literature Selection

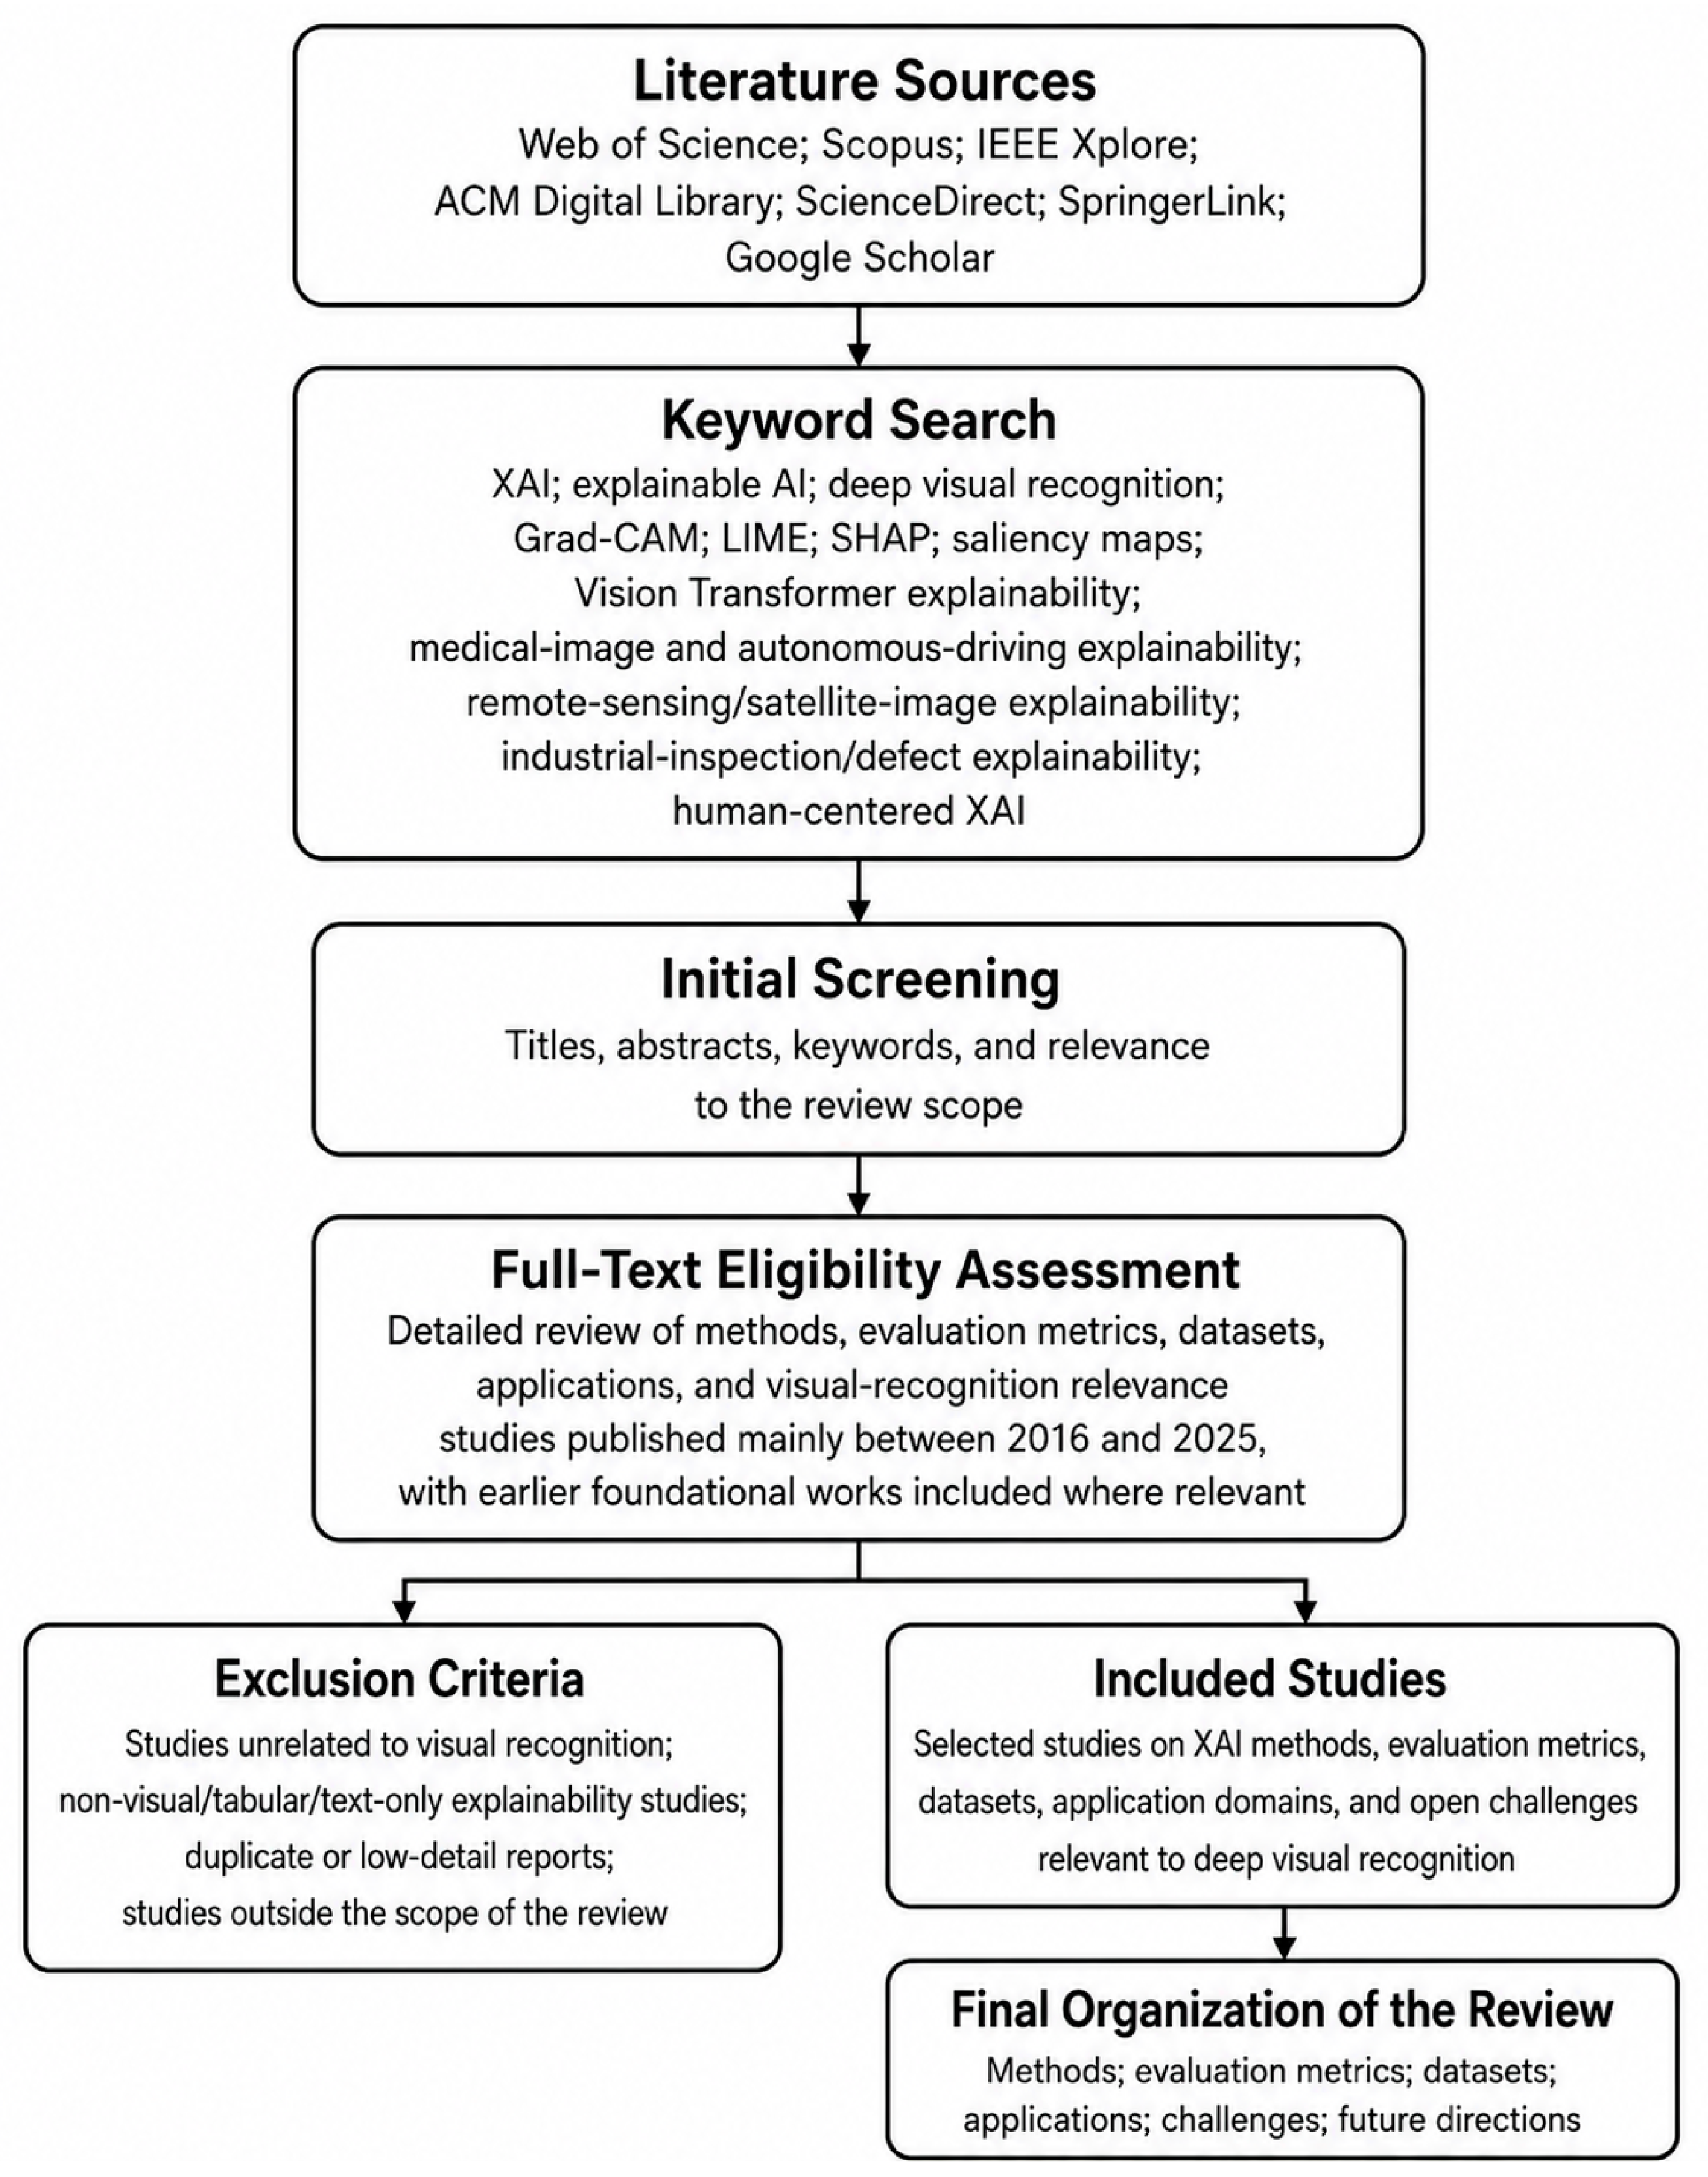
This review was conducted using a structured literature-search and selection strategy to identify relevant studies on explainable artificial intelligence for deep visual recognition. The literature search considered major scientific databases, including IEEE Xplore, ACM Digital Library, ScienceDirect, SpringerLink, Web of Science, Scopus, and Google Scholar. The main review period focused on studies published between 2016 and 2025, while earlier foundational works and relevant domain-specific studies were also included when they introduced widely used XAI methods, benchmark datasets, or important contextual evidence. The main search terms included “explainable artificial intelligence,” “XAI,” “deep visual recognition,” “computer vision explainability,” “saliency maps,” “Grad-CAM,” “LIME,” “SHAP,” “visual explanation,” “interpretable deep learning,” “Vision Transformer explainability,” “medical image explainability,” “autonomous driving explainability,” “remote-sensing explainability,” “satellite-image explainability,” “GeoAI explainability,” “industrial visual inspection explainability,” “manufacturing defect explainability,” “explainable quality inspection,” and “human-centered XAI.”
The inclusion criteria were: (1) studies focused on explainability or interpretability in machine learning, deep learning, or computer vision; (2) papers proposing, evaluating, or applying XAI methods to visual-recognition tasks such as image classification, object detection, segmentation, medical imaging, autonomous driving, surveillance, agriculture, satellite and remote-sensing analysis, industrial inspection, manufacturing quality control, retail recognition, or visual forensics; (3) peer-reviewed journal or conference papers, along with highly relevant preprints when they introduced influential methods; and (4) studies written in English with sufficient methodological detail. The exclusion criteria were: (1) papers unrelated to visual recognition or explainability; (2) studies focused only on non-visual, tabular, or text-based tasks; (3) duplicate records, editorials, or short opinion pieces without technical discussion; and (4) works with insufficient information about the model, explanation method, or evaluation approach.
After screening the literature, the selected studies were organized into five principal groups: XAI methods, evaluation metrics, benchmark datasets, application domains, and open challenges. The application-domain group was further examined across medical imaging, autonomous driving, security and surveillance, agriculture, satellite imagery and remote sensing, industrial inspection and smart manufacturing, retail recognition, and visual forensics. The review emphasizes not only descriptive coverage but also critical comparison of methods in terms of explanation type, interpretability level, computational cost, faithfulness, stability, usability, and suitability for real-world visual-recognition applications. The overall literature-search and selection process, including database sources, keyword retrieval, initial screening, full-text eligibility assessment, exclusion criteria, included studies, and thematic organization, is summarized in Figure 1.

3. Fundamental Concepts of Deep Visual Recognition

Deep visual recognition refers to the use of deep learning algorithms, particularly deep neural networks (DNNs), to interpret and classify visual data such as images and videos. At the core of deep visual recognition is the convolutional neural network (CNN), a type of deep learning architecture that has proven to be highly effective in tasks such as image classification, object detection, and segmentation [27]. CNNs are designed to automatically detect and learn hierarchical features from raw input images through layers of convolutions, pooling, and activation functions [28]. These networks excel in capturing spatial patterns in data, making them ideal for visual tasks. A CNN typically comprises several layers: an input layer for receiving image data, convolutional layers that apply filters to detect local patterns (edges, textures, etc.), pooling layers that downsample feature maps to reduce dimensionality, and fully connected layers that perform classification based on learned features [29]. The success of CNNs in visual recognition tasks has led to their widespread use in various domains, including facial recognition, medical imaging, autonomous vehicles, and security systems. More advanced models, such as ResNet, DenseNet, and EfficientNet, have further improved performance by introducing techniques like residual connections, dense connections, and efficient layer designs to reduce training time and improve accuracy [30].

4. Challenges in Deep Learning Models for Visual Tasks

While deep learning models have revolutionized visual recognition tasks, several challenges remain that hinder their practical application and reliability [31]. One major challenge is the black-box nature of deep learning models. Despite their ability to achieve impressive performance, understanding how these models arrive at specific decisions remains difficult [14]. This lack of transparency makes it challenging to diagnose errors, identify biases, and trust model predictions in critical applications. For instance, a CNN used in medical imaging might misclassify a tumor as benign due to certain image features that are not immediately obvious to the human eye [32]. Another challenge is the data dependency of deep learning models. These models require vast amounts of labeled training data to generalize well to new, unseen data. In many real-world applications, however, obtaining large, high-quality labeled datasets is difficult and costly [33]. Additionally, deep learning models are often prone to overfitting, especially when the available training data is limited or unrepresentative of real-world conditions. This overfitting can lead to poor performance when the model is applied to new data, reducing its effectiveness in practical use [34,35].
Moreover, adversarial attacks are another concern in deep learning-based visual recognition systems. These attacks involve small, imperceptible perturbations to the input data that can cause the model to make incorrect predictions [36]. For example, slight changes to an image, undetectable to the human eye, can lead a model to misclassify objects with high confidence. This vulnerability raises significant concerns about the robustness and security of deep learning systems in high-stakes applications [37,38].

5. Role of Explainability in AI Models

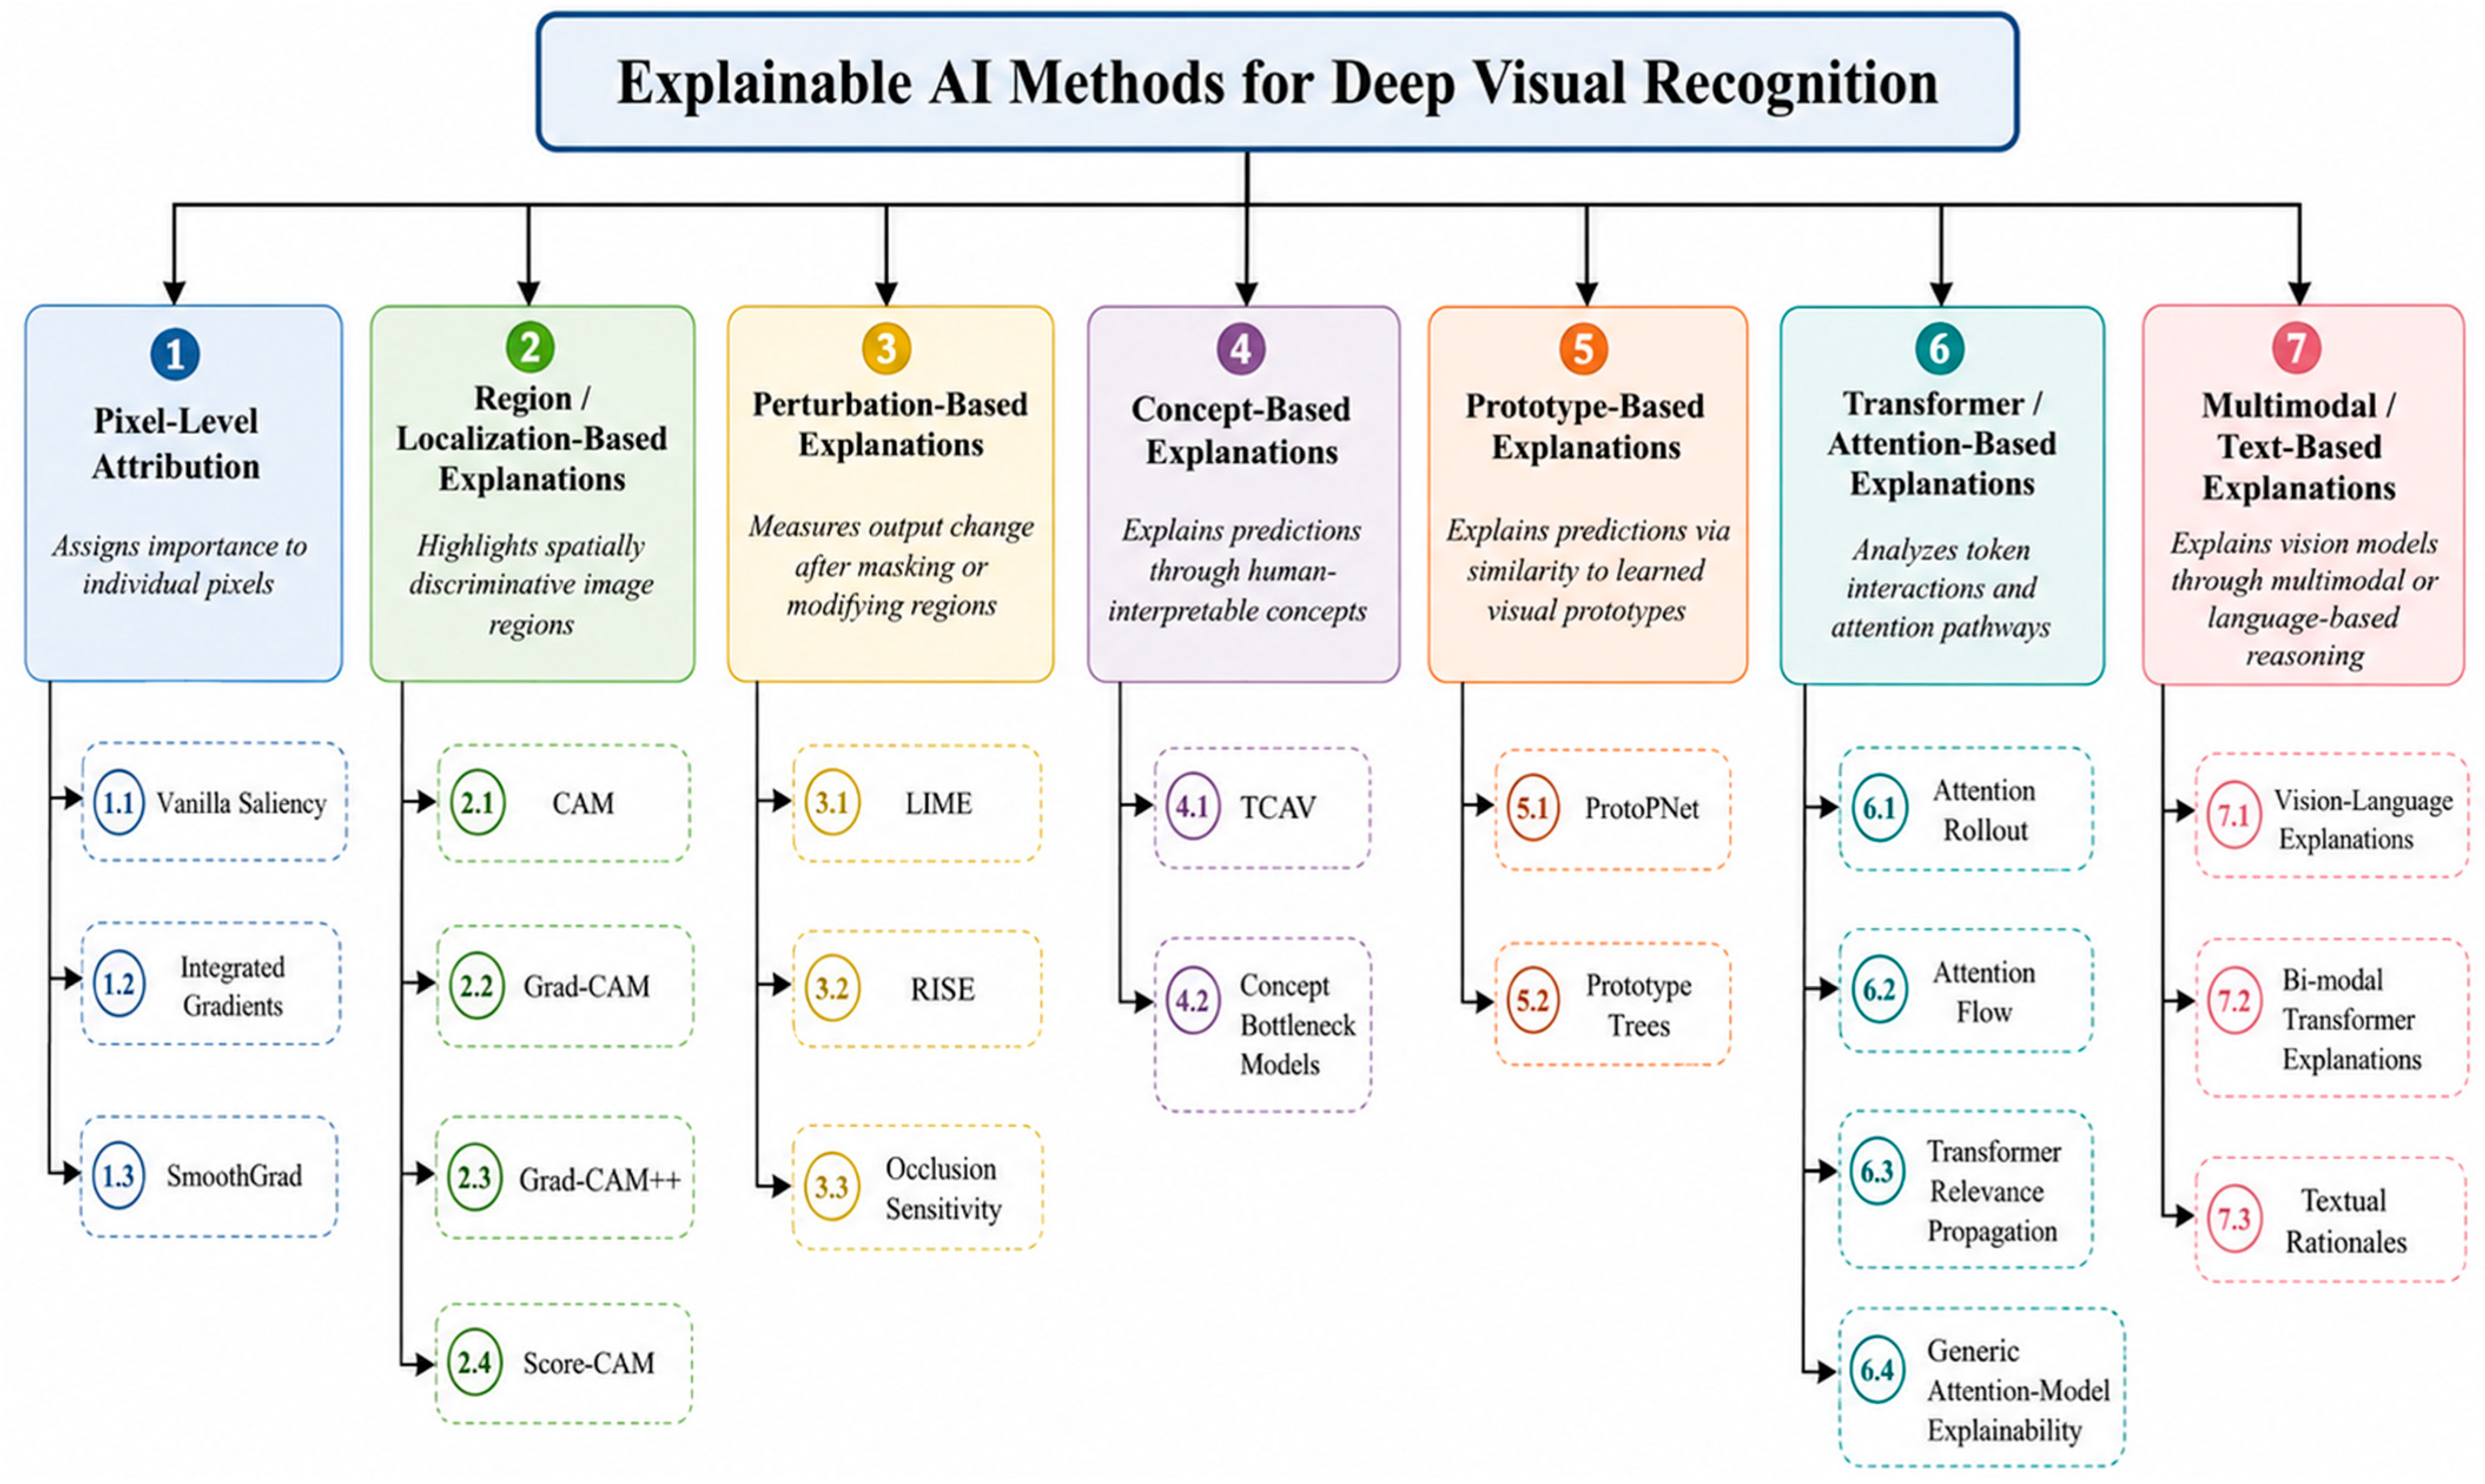
In visual recognition, explainability contributes not only to general model transparency but also to the operational assessment of model behavior. Explanations can be used to audit whether a prediction is supported by spatially meaningful image evidence, to diagnose shortcut learning or background bias, and to compare how different explanation families expose model behavior [11]. Beyond improving user confidence, explanations should help determine whether the highlighted evidence is relevant to the task, consistent with expert expectations, and useful for model debugging or decision review [39]. In clinically oriented visual tasks, for example, the value of an explanation depends on whether it points to meaningful anatomical or pathological evidence rather than irrelevant image artifacts [12]. Similarly, in fairness-sensitive visual-recognition settings, explanations may help reveal whether predictions rely on inappropriate or spurious cues, although such findings should be interpreted together with quantitative bias and performance evaluation [14]. Because visual-recognition models make decisions from spatial, semantic, and sometimes multimodal evidence, a generic division into model-agnostic, model-specific, and intrinsically interpretable approaches is not sufficient. Figure 2 therefore organizes visual-XAI methods according to the kind of evidence they expose, ranging from low-level attribution and localization to higher-level concepts, prototypes, transformer attention, and multimodal explanations. This organization clarifies which explanation families are most suitable for different visual-recognition tasks and evaluation needs.
Within this visual-evidence taxonomy, different XAI techniques serve different practical roles. Post hoc visual explanations include model-specific heatmaps, such as saliency maps, and model-agnostic local surrogate approaches, such as LIME, which can help identify the image regions or features that influence a prediction [40,41]. However, their usefulness in visual recognition depends on the explanation unit being used, such as pixels, superpixels, patches, regions, or extracted visual features, and on whether the explanation remains stable and meaningful for the target task [42]. The demand for trustworthy visual-recognition systems therefore requires not only understandable explanations, but also careful comparison of explanation methods in terms of localization quality, faithfulness, usability, and computational cost [11,43]. Because the field is still evolving, these techniques should be selected according to the application context and evaluated with respect to both interpretability and reliability rather than visual appeal alone [43,44].
Table 1 critically compares major model-agnostic XAI techniques in terms of their visual explanation outputs, model-access requirements, strengths, limitations and assumptions, computational cost, robustness to adversarial perturbations, scalability to large datasets, and suitability for visual-recognition applications. These practical considerations are particularly important for high-resolution imagery and large-scale visual-recognition datasets, where the computational requirements of LIME and SHAP increase with the number of perturbations, model queries, or feature coalitions. Exact Shapley-value computation is combinatorial and infeasible for high-dimensional images; consequently, practical SHAP implementations depend on approximation strategies, feature grouping, and baseline selection [45,46]. LIME similarly perturbs image superpixels and fits a local surrogate model, making its computational cost and explanation variability sensitive to segmentation complexity, perturbation sampling, and dataset scale [24,47,48]. PDP and ICE are more computationally practical when applied to a limited number of engineered or semantically meaningful features, but they are poorly suited to dense pixel-level or feature-map representations [49,50]. Anchors can produce concise rule-based explanations, although adaptive sampling and rule-search procedures may still require numerous model queries [51]. Moreover, none of these techniques provides an inherent guarantee of robustness to adversarial or prediction-preserving perturbations, which may alter superpixel boundaries, sampled neighborhoods, attribution values, conditional-response curves, or extracted rules [52,53]. Therefore, selecting an appropriate method requires balancing explanation faithfulness, computational resources, perturbation sensitivity, feature dimensionality, and dataset size.

6. Methods for Explainable AI in Visual Recognition

Before discussing XAI methods under the broad categories of model-agnostic, model-specific, and intrinsically interpretable approaches, it is useful to distinguish the major families of methods that have shaped visual explainability research. Early visual explanation work focused on sensitivity maps and gradient-based attribution, where the importance of pixels is estimated from the gradient of the output score with respect to the input image [54,55]. Class Activation Mapping (CAM) introduced a spatially meaningful way of localizing discriminative image regions in CNNs by using global average pooling and class-specific weights [15]. Grad-CAM generalized this idea by using gradients flowing into the final convolutional layer to generate class-discriminative localization maps without requiring architectural changes [11]. Later extensions, including Grad-CAM++ [16], Score-CAM [17], and SmoothGrad [55], attempted to improve object localization, reduce noise, or avoid direct dependence on raw gradients.
Perturbation-based visual explanations form another important family. Instead of relying only on internal gradients, these methods modify or mask image regions and observe changes in the model output. LIME explains image predictions by perturbing superpixels and fitting a local surrogate model [24], whereas RISE estimates saliency by randomly masking the input and measuring the effect of each region on the prediction score [18]. These methods are useful for black-box models, but their explanations may depend strongly on segmentation quality, masking strategy, sampling density, and computational cost [18,24].
Beyond pixel- and region-level heatmaps, concept-based and prototype-based methods aim to produce explanations closer to human reasoning. TCAV measures the influence of user-defined concepts on model predictions by using concept activation vectors in the internal representation space [19]. Concept bottleneck models make predictions through intermediate human-interpretable concepts, enabling users to inspect and sometimes intervene on concept predictions [25]. Prototype-based networks, such as ProtoPNet, explain image classification through similarity between image parts and learned prototypical parts [20]. These approaches are especially relevant in fine-grained recognition, medical imaging, and other domains where users often reason through visual patterns, attributes, or representative examples [19,20,25].
More recently, Vision Transformers have created new challenges for visual explanation. Unlike CNNs, which preserve local spatial structure through convolutional feature maps, Vision Transformers process images as patch tokens and mix information through multi-head self-attention. As a result, directly applying CNN-based methods such as Grad-CAM may not fully capture how token interactions contribute to the final prediction [21,22,23]. Attention Rollout and Attention Flow attempt to trace how information is propagated through attention layers [21], while transformer-specific relevance propagation methods integrate attention weights, gradients, and residual connections to estimate class-specific token relevance [22]. Generic attention-model explainability further extends transformer interpretation to bi-modal and encoder–decoder transformer architectures, which is important for modern vision-language and multimodal recognition systems [23].
Unlike CNN-based explanation methods, transformer explanations require different interpretation mechanisms because the decision process is based on token-to-token interactions rather than spatial convolutional feature maps. Vision Transformers divide an image into patch tokens and model long-range dependencies through multi-head self-attention, whereas Grad-CAM and related CNN-based methods typically use the gradient of a class score with respect to convolutional feature maps to identify discriminative spatial regions [56]. Therefore, raw attention maps should not be directly interpreted as faithful explanations, because attention weights indicate token interaction strength but may not fully represent class-specific decision relevance [57]. Recent ViT-specific explanation methods address this limitation by considering information flow, patch-token relevance, causal effects of patch embeddings, and token-transformation effects rather than relying only on raw attention weights [21,22,58,59]. This distinction shows that explaining attention mechanisms in Vision Transformers is fundamentally different from applying CNN-gradient-based methods such as Grad-CAM.

7. XAI Techniques for Vision Transformers

XAI techniques for Vision Transformers can be broadly grouped into attention-propagation methods, relevance-propagation methods, perturbation-based token analysis, and causal or token-transformation-based approaches. Attention Rollout and Attention Flow aggregate attention matrices across transformer layers to estimate how information propagates from input patch tokens to the classification token [21]. Transformer-specific relevance propagation extends this idea by combining attention weights, gradients, and residual connections to compute class-specific token relevance rather than relying only on raw attention maps [22,23]. Perturbation-based ViT explanations evaluate the contribution of individual image patches by masking, removing, or modifying patch tokens and observing changes in the prediction score. More recent methods further examine causal effects of patch embeddings and token-transformation processes to improve the faithfulness of ViT explanations [57,58,59]. These approaches are particularly important because Vision Transformers do not preserve image evidence in the same way as CNN feature maps; therefore, ViT explanations should be evaluated at the patch-token level using faithfulness, stability, perturbation, and localization-based tests.
Following the vision-specific taxonomy presented in Figure 2, the subsequent discussion groups XAI methods according to their practical role in visual recognition while retaining broader categories such as model-agnostic, model-specific, and intrinsically interpretable methods for organizational clarity. In this review, these broad labels are not treated as the complete taxonomy; instead, the main emphasis is placed on the type of visual evidence each method provides, such as pixel attribution, region-level localization, perturbation-based saliency, concept-level reasoning, prototype-based comparison, transformer attention pathways, and multimodal or text-based explanations.
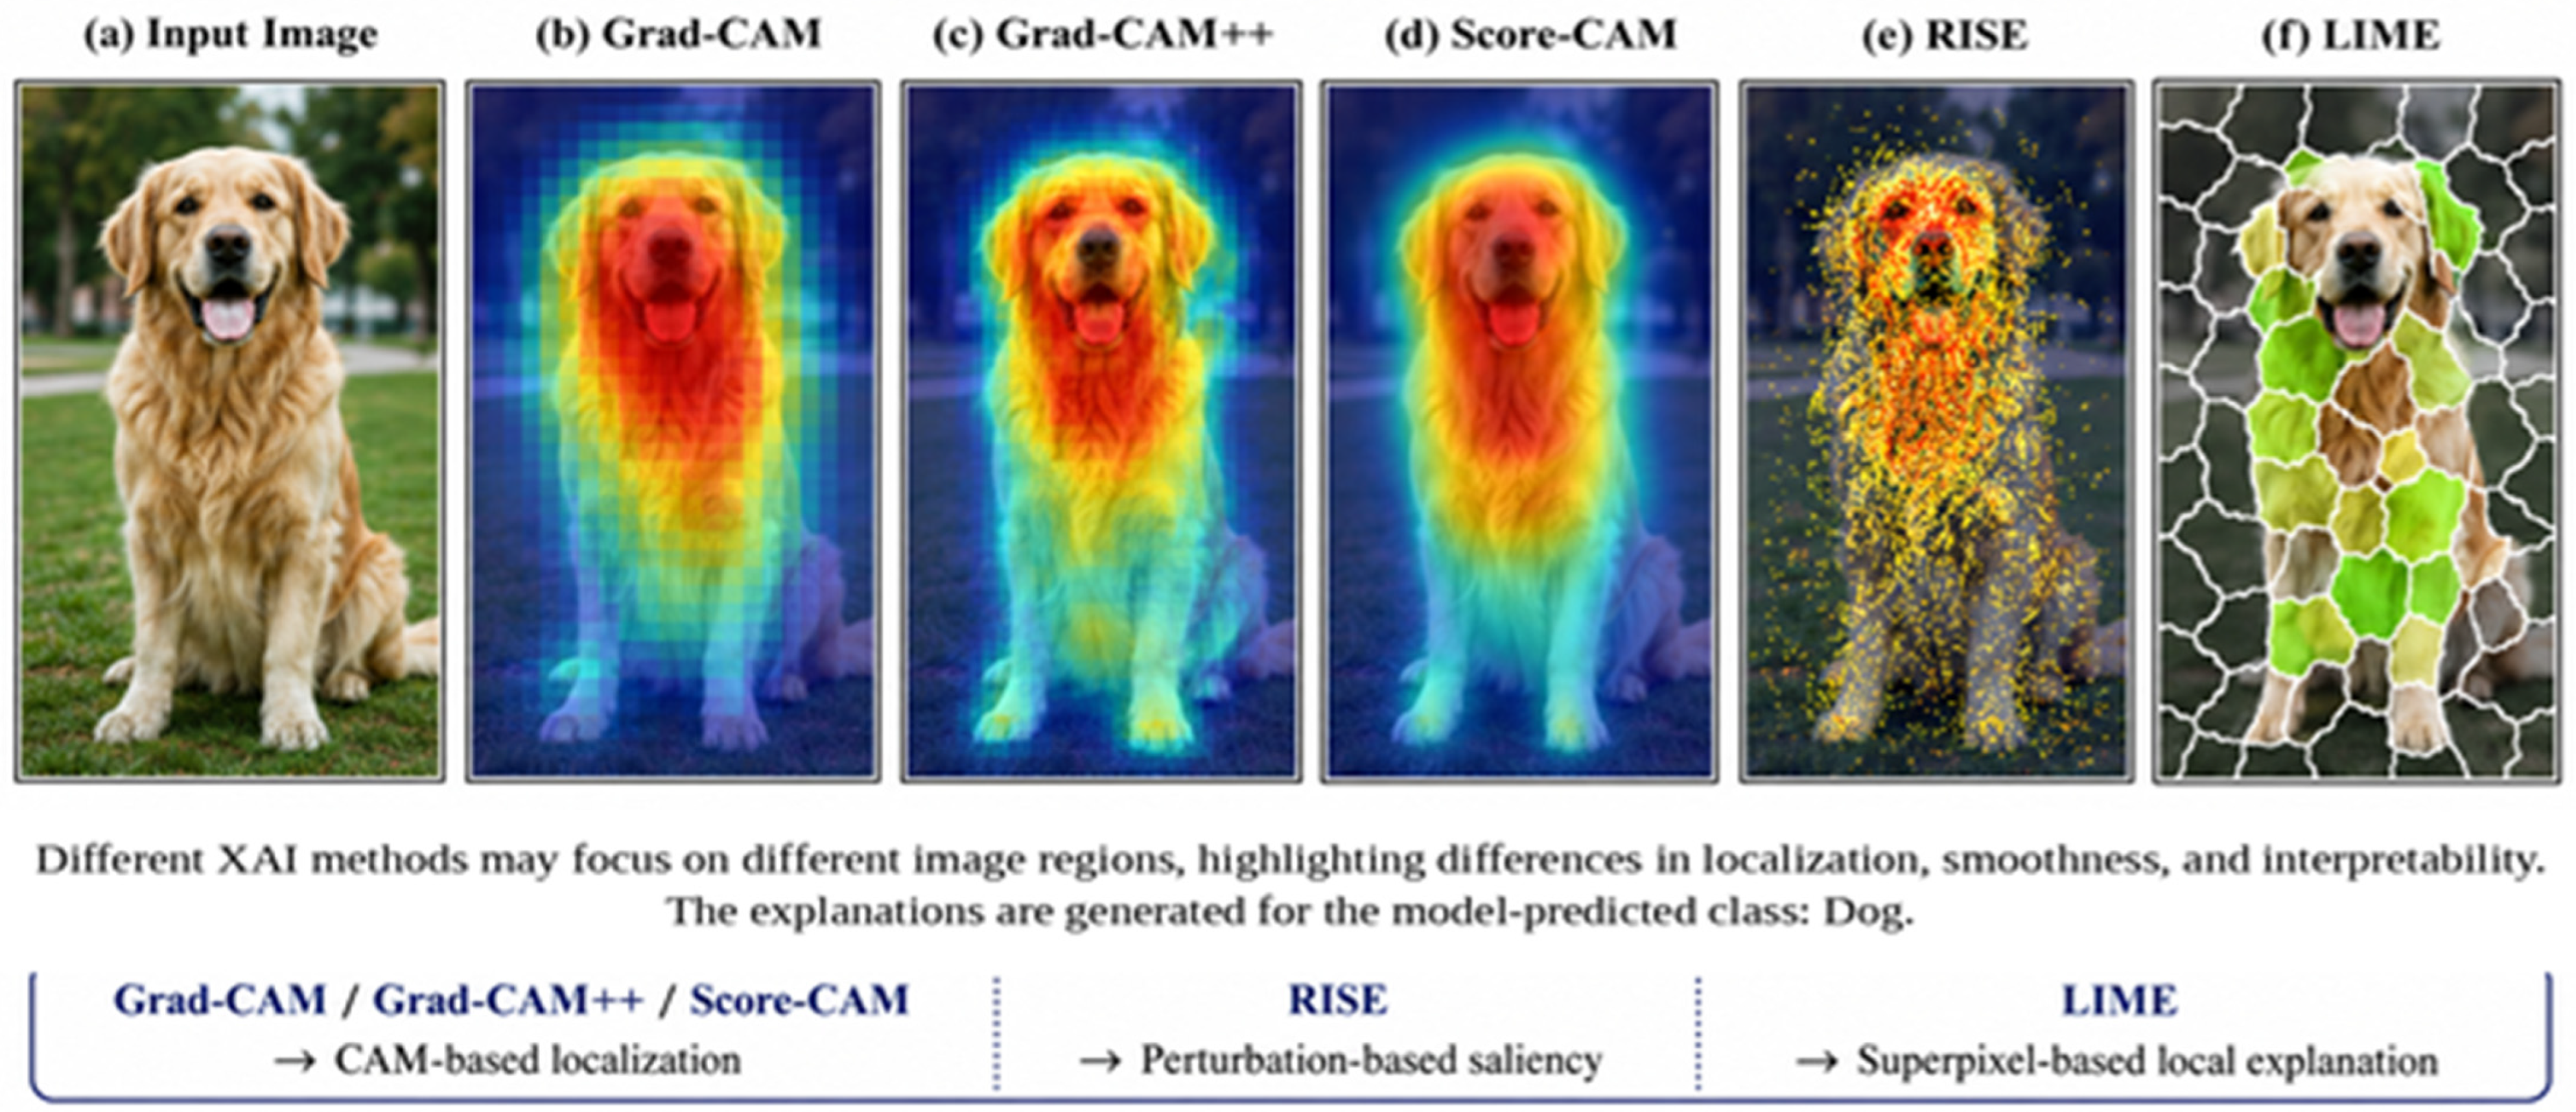
To illustrate why explanation evaluation is necessary, Figure 3 compares representative visual-XAI outputs for the same prediction. The comparison shows that different methods may highlight different regions or produce explanations with different levels of smoothness, localization, and spatial specificity. Therefore, visual appeal alone is insufficient; explanations should also be assessed for faithfulness, stability, and task relevance. These variations arise from the distinct mathematical mechanisms used by each method to assign importance to visual evidence. Grad-CAM computes channel weights by spatially averaging the gradients of the target-class score with respect to the final convolutional feature maps and then combines these weighted feature maps to produce a class-discriminative localization map [11]. Because the final convolutional layer usually has a relatively coarse spatial resolution, Grad-CAM often highlights broad object-level regions rather than precise object boundaries. Its dependence on gradients can also make the resulting explanation sensitive to weak, noisy, or saturated gradient signals [11,17]. Grad-CAM++ extends this approach by assigning spatially varying weights to the gradients using higher-order derivative information, which can improve localization when multiple instances of the same class are present or when the relevant evidence occupies a relatively small region. Nevertheless, it remains dependent on gradient quality [16]. Score-CAM avoids direct gradient weighting by using activation maps to mask the input image and measuring the resulting change in the target-class score. Because it does not use gradients to determine channel importance, Score-CAM avoids the gradient-saturation problem associated with gradient-based weighting; however, it requires repeated forward passes and remains dependent on the selected convolutional layer, activation-map resolution, and masking procedure [17].
In contrast, RISE and LIME estimate importance through input perturbation rather than convolutional gradients. RISE generates randomized binary masks and estimates the importance of each image location from the expected prediction score when that location remains visible. Its saliency map is therefore a Monte Carlo estimate, and an insufficient number of masks, unsuitable mask resolution, or stochastic sampling variability may produce noisy or spatially diffuse explanations. Increasing the number of masks can improve convergence but substantially increases the number of model queries [18]. LIME first divides the image into superpixels, randomly activates or deactivates these regions, and fits a sparse local surrogate model around the selected image [24]. Its explanation is consequently constrained by superpixel boundaries and may vary with the segmentation algorithm, number of superpixels, masking baseline, locality kernel, and perturbation sample [24,48]. Therefore, disagreement among the methods is not merely a visualization artifact; it reflects their different attribution mechanisms, including gradient-based weighting, activation-based contribution, perturbation-based influence, and local surrogate coefficients. These differences affect spatial resolution, stability, computational cost, and faithfulness, thereby motivating multi-method and multi-metric evaluation rather than selecting an explanation solely because it appears visually smoother or more intuitive.
Table 2 summarizes representative intrinsically interpretable models used in visual recognition and highlights their core ideas, interpretability levels, and typical trade-offs compared with standard deep learning models.

8. Model-Agnostic Techniques

Model-agnostic explanation techniques are post hoc approaches designed to explain the predictions of a trained machine learning model without depending on its internal architecture [65]. These methods generate explanations without requiring access to the model’s internal workings, making them particularly useful for black-box models like deep neural networks (DNNs) [65]. Two widely used model-agnostic methods in visual recognition are LIME and SHAP [66].
  • LIME (Local Interpretable Model-agnostic Explanations)
LIME is a local post hoc explanation method that approximates the behavior of a complex prediction model around a specific input by fitting a simpler interpretable surrogate model within that input’s local neighborhood [24]. Formally, the local explanation generated by LIME can be written as Equation (1).
ξ ( x ) = a r g m i n g G L ( f , g , π x ) + Ω ( g )
where f denotes the original black-box model, g is an interpretable surrogate model selected from the class of interpretable models G, π_x is a locality-weighting function that assigns higher weights to perturbed samples closer to the original input x, L(f, g, π_x) measures how well the surrogate model approximates the black-box model in the local neighborhood of x, and Ω(g) penalizes the complexity of the explanation.
In visual recognition, LIME is usually implemented by segmenting an image into superpixels, perturbing these regions, and fitting a local surrogate model to estimate which regions support the prediction. This makes LIME useful for explaining individual image-level decisions, especially when the original model is inaccessible or difficult to inspect [48]. However, its explanation quality depends strongly on the segmentation algorithm, perturbation strategy, masking baseline, number of sampled perturbations, and choice of local surrogate model. As a result, two visually similar images, or even two different segmentations of the same image, may produce noticeably different explanations. Therefore, LIME explanations in visual recognition should be interpreted as approximate local evidence rather than definitive proof of the model’s true reasoning [67].
  • SHAP (Shapley Additive Explanations)
SHAP values, based on cooperative game theory, provide a principled attribution framework for explaining model predictions [68]. The central idea is to assign each feature a Shapley value, which represents its contribution to the prediction. Formally, for a model f and an input represented by a feature set N = {1, …, M}, the Shapley value of feature i can be written as Equation (2).
φi(f, x) = ∑_{S ⊆ N∖{i}} [|S|!(M − |S| − 1)!/M!] [fx(S ∪ {i}) − fx(S)]
where S denotes a subset of features excluding feature i, M is the total number of features, and f_x(S) represents the model output when only the feature subset S is observed or retained. In visual recognition, these features may correspond to pixels, superpixels, patches, or image regions. This formulation estimates the average marginal contribution of each visual feature over all possible feature coalitions, which provides a principled explanation framework but also makes exact SHAP computation expensive for high-dimensional image data.
In visual recognition, SHAP explanations are commonly approximated over pixels, superpixels, patches, or intermediate feature maps rather than computed exactly over all raw pixels, because exhaustive Shapley-value estimation is computationally infeasible for high-dimensional images [46]. This gives SHAP a stronger theoretical foundation than many heuristic attribution methods, but its practical reliability depends on how visual features are grouped, how missing regions are replaced, and whether feature dependence is handled appropriately [45]. For CNN-based visual recognition, SHAP-style methods can provide useful local or global attribution patterns, but they may become computationally expensive and can be sensitive to background artifacts, correlated visual regions, and the choice of image baseline [69]. Therefore, SHAP should be used as a principled attribution framework whose outputs still require task-specific validation through faithfulness, stability, and localization-based evaluation.

9. Model-Specific Techniques

Unlike model-agnostic methods, model-specific techniques are tailored to specific types of models and exploit their internal structures to generate explanations [70]. In deep visual recognition, several model-specific techniques have been developed to provide insights into how a neural network processes visual data [16].
  • Feature Visualization
Feature visualization aims to understand what a neural network has learned by visualizing the features that are activated during the model’s forward pass. In deep visual recognition, feature visualization typically involves generating images that maximize the activation of a particular filter or layer in a convolutional neural network (CNN) [71]. This can reveal the kinds of patterns the network is sensitive to, such as edges, textures, or object parts. For example, by visualizing the first convolutional layer, one might observe low-level features like edges, while deeper layers may reveal more abstract patterns such as shapes or specific objects [72]. Feature visualization is useful for understanding the internal representations learned by the model and can help identify whether the model is focusing on relevant image features [73].
  • Saliency Maps
Saliency maps are another widely used method for visualizing the importance of specific image regions in a model’s decision-making process [74]. These maps highlight areas of an image that most influence the model’s output, helping users understand which parts of the image are contributing to the model’s predictions [26]. The most common approach to generating saliency maps is to compute the gradient of the model’s output with respect to the input image, which indicates how sensitive the model is to changes in each pixel. A high gradient value indicates that the model’s prediction is highly sensitive to that pixel, suggesting it plays an important role in the decision [75]. While saliency maps are easy to compute and visually intuitive, they can sometimes highlight noisy or irrelevant features, making them less reliable in some cases [26].
  • Activation Maximization
Activation maximization is a technique used to visualize the inputs that most activate a specific neuron or filter in a neural network [76]. The idea is to generate an image that maximally activates a given neuron by performing gradient ascent on the input image with respect to the neuron’s activation [77]. This process results in images that emphasize the features that the network has learned to detect. For visual recognition tasks, activation maximization can be used to gain insights into what specific neurons in the network are detecting [78]. While activation maximization provides highly interpretable results, the generated images may not always correspond to realistic or meaningful visual patterns, particularly for deeper layers of the network [79].

10. Intrinsically Interpretable Models

Intrinsically interpretable models are designed with interpretability built into the architecture, offering explanations without the need for additional post-processing methods like saliency maps or LIME. These models are inherently simpler than deep neural networks and can offer greater transparency in their decision-making processes [80,81].
  • Decision Trees
Decision trees are a type of machine learning model that makes decisions by recursively splitting the feature space based on simple thresholds [82]. Each internal node represents a decision based on a feature, and the leaf nodes represent the final prediction. Decision trees are highly interpretable because their decision-making process can be easily visualized as a flowchart [83]. In visual recognition tasks, decision trees can be used to classify images based on high-level features. However, decision trees often struggle with complex data and may require further optimization, such as ensemble methods like random forests, to improve accuracy [84].
  • Rule-Based Systems
Rule-based systems are another class of interpretable models that use a set of human-readable if-then rules to make predictions. In visual recognition, these systems could use rules like “If the object is red and round, classify it as an apple.” Rule-based systems are transparent by design, making them easy to understand and audit [85]. However, they are generally less effective for complex tasks like deep visual recognition, where the relationships between features are highly nonlinear and difficult to express with simple rules [86].
  • Transparent Neural Networks
Transparent neural networks refer to simplified neural network architectures designed to be more interpretable than traditional deep networks [87]. These networks aim to balance performance with transparency by limiting the complexity of the model while maintaining sufficient accuracy for the task [88]. For instance, a transparent neural network might reduce the number of layers or neurons, use simpler activation functions, or employ attention mechanisms to highlight important features. While these models are more interpretable, they often face a trade-off with performance, as more complex models tend to yield higher accuracy for tasks like visual recognition [89].
Although intrinsically interpretable models provide built-in transparency, they often face limitations in complex visual-recognition tasks. Simple models such as decision trees and rule-based systems may not capture high-dimensional spatial patterns, fine-grained textures, occlusion, and background variation [64,83,86]. More advanced interpretable models, such as concept bottleneck and prototype-based networks, can improve transparency but may require concept annotations, prototype validation, or architectural constraints [20,25]. Therefore, intrinsically interpretable models are preferable when transparency, auditability, or expert intervention is required from the beginning, whereas post hoc methods are more practical when high-performing black-box models are already available or concept-level annotations are limited.

11. Evaluation of Explainability in Deep Visual Recognition

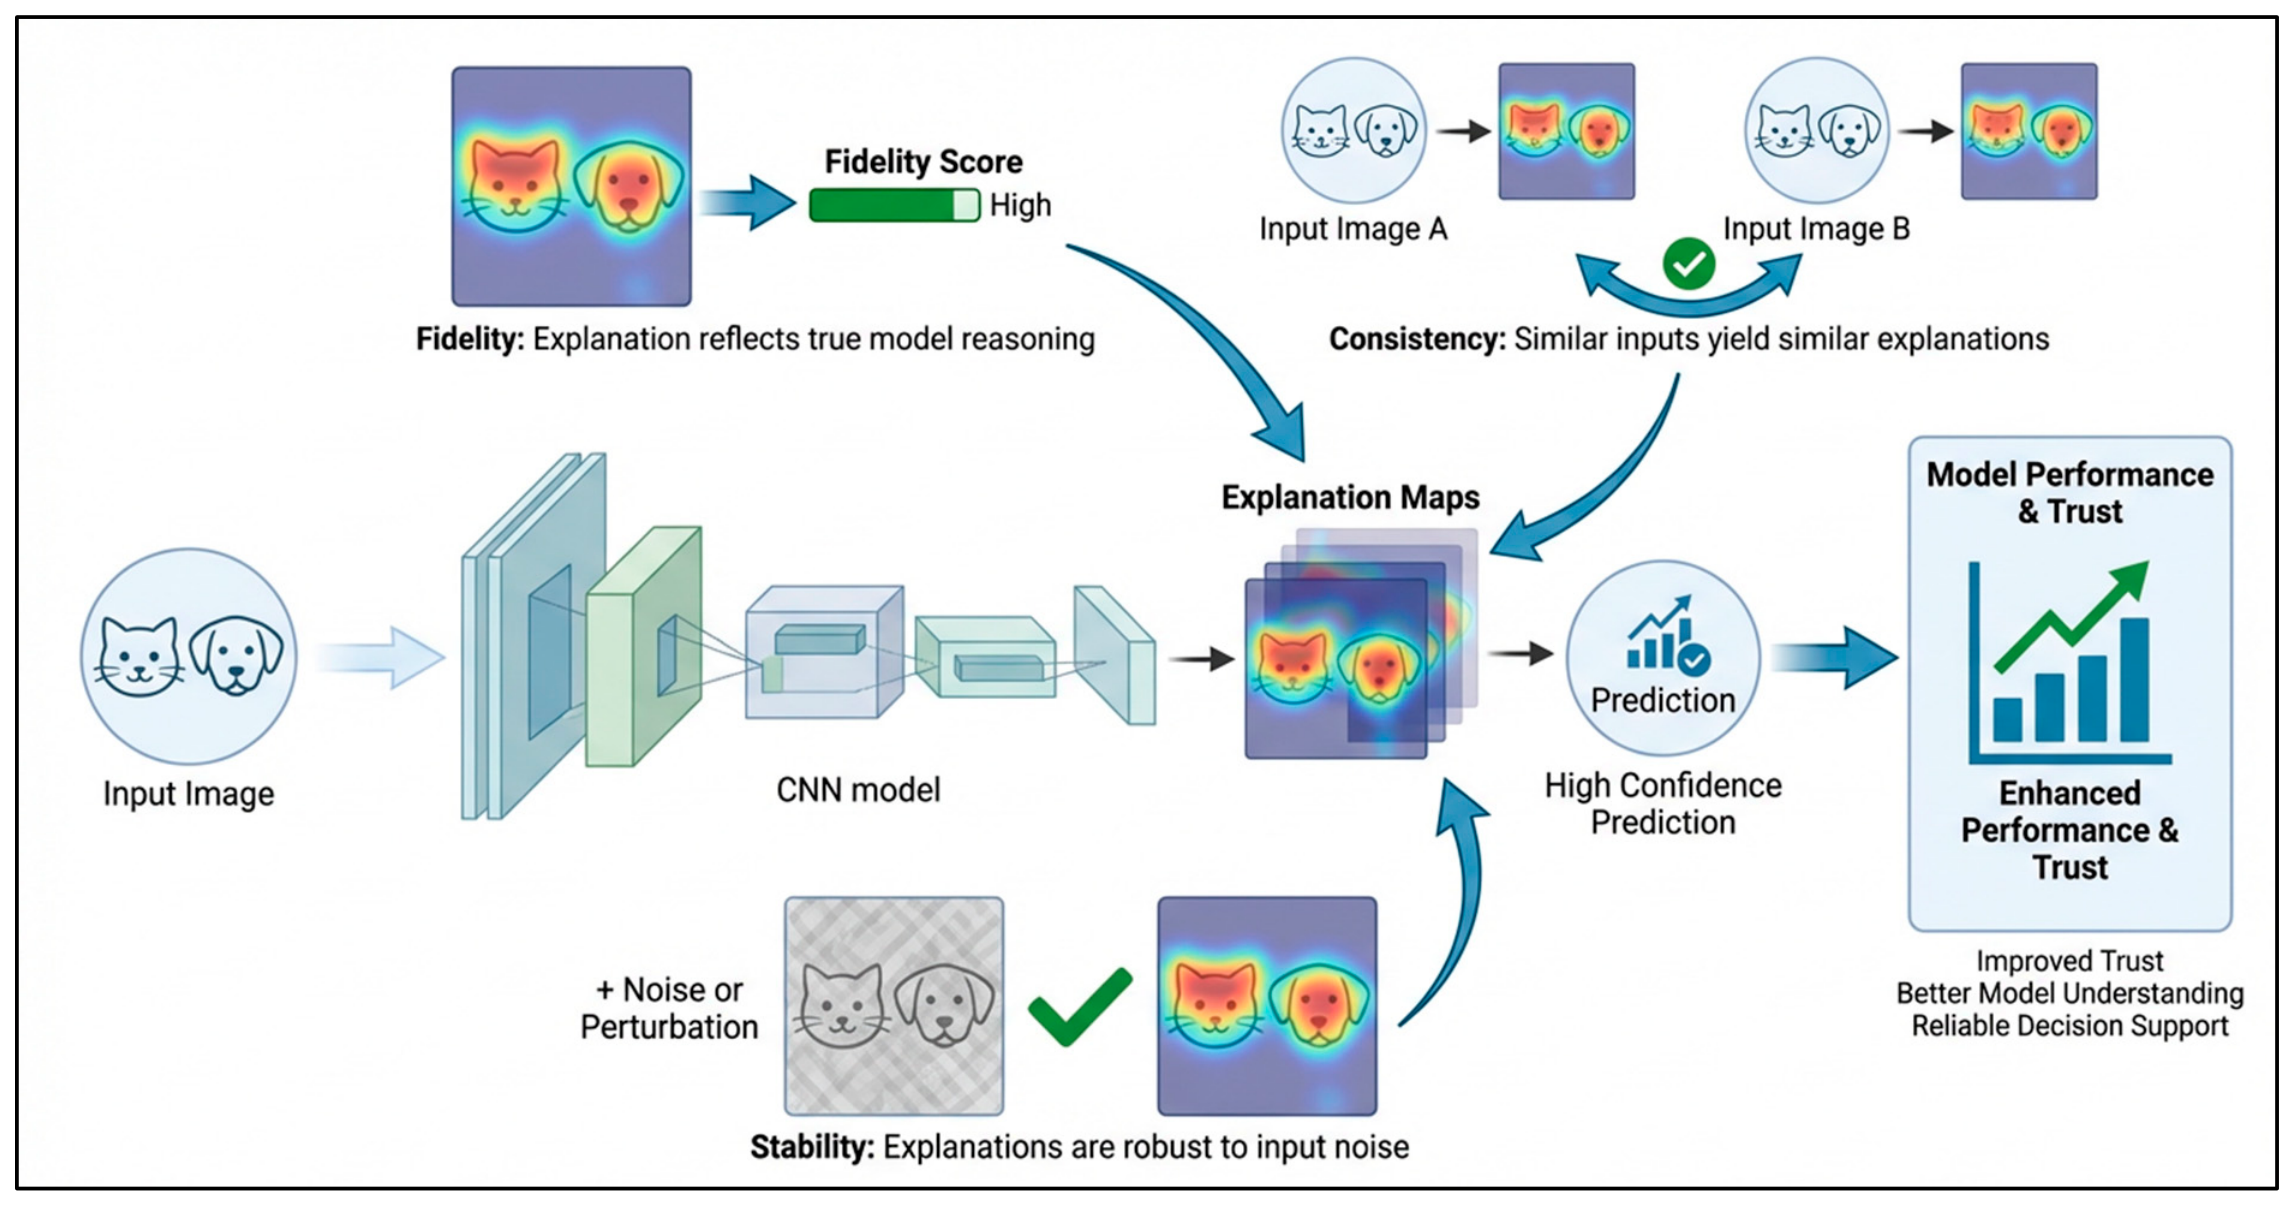
The evaluation of explainability in deep visual recognition models is essential for understanding how and why a model produces a particular prediction. Although many XAI techniques can generate visual explanations, their usefulness depends on whether the explanations are faithful, stable, consistent, and relevant to the task. Effective evaluation ensures that explanations are not only visually interpretable but also reliable and meaningful for model analysis [90]. In this section, we discuss key metrics for evaluating explainability in visual recognition models, commonly used benchmark datasets, and case studies demonstrating the application of explainable AI (XAI) in object detection and classification. Figure 4 summarizes the main evaluation metrics used to assess explanation quality, including fidelity, consistency, and stability.

12. Distinguishing Faithfulness and Interpretability

Although the terms faithfulness and interpretability are sometimes used interchangeably, they describe different properties of an explanation. Faithfulness refers to the extent to which an explanation accurately represents the evidence, features, or internal dependencies that the underlying model actually uses to generate a prediction. Interpretability, in contrast, refers to the ease with which an intended human user can understand and make use of the explanation. An explanation may therefore be highly interpretable yet weakly faithful if it presents a simple and plausible rationale that does not reflect the model’s true decision process. Conversely, a highly faithful explanation may remain difficult for non-experts to understand because it exposes complex gradients, feature interactions, or distributed representations. Consequently, faithfulness and interpretability should be evaluated independently and treated as complementary rather than interchangeable properties of visual-XAI methods [91,92].
Table 3 summarizes the principal evaluation metrics used to assess explainable AI methods in visual recognition, including faithfulness, stability, consistency, insertion/deletion, localization, and sanity checks.
Therefore, evaluation studies should assess both faithfulness and interpretability rather than assuming that an improvement in one property automatically implies an improvement in the other.

13. Metrics for Evaluating Explainability

Evaluating the effectiveness of explanations generated by XAI techniques is challenging. Several metrics are proposed to assess the quality of explanations, focusing on different aspects of their performance [90]. The most widely used metrics for evaluating explainability include fidelity, consistency, and stability [98]. These metrics help ensure that the explanations accurately reflect the model’s behavior, are consistent across similar predictions, and are robust to perturbations.
In addition to automatic metrics, user-centered evaluation is essential for assessing whether explanations are understandable, useful, and trustworthy for real users. Metrics such as fidelity, consistency, and stability can measure technical properties of explanations, but they do not fully capture whether clinicians, engineers, domain experts, or general users can correctly interpret and act on those explanations. User studies can evaluate explanation clarity, perceived trust, decision support, cognitive load, task performance, and agreement between model explanations and expert reasoning [42,99,100,101]. Therefore, a comprehensive evaluation of XAI in visual recognition should combine automatic explanation-quality metrics with human-centered assessment, especially in high-stakes applications such as medical imaging, autonomous driving, surveillance, and agricultural decision support.
Evaluation metrics for XAI are complementary rather than interchangeable, and each metric involves mathematical and practical trade-offs [102,103]. Faithfulness refers to whether an explanation reflects the model’s actual decision process, whereas fidelity-based tests provide operational or quantitative measures of this alignment. However, a highly faithful explanation may still be visually noisy or difficult for humans to interpret [103,104]. Stability evaluates whether explanations remain similar under small input perturbations, but excessive emphasis on stability may penalize explanations that correctly change when a semantically important image region is modified [105]. Localization-based metrics, such as pointing-game or overlap-based evaluation, are useful when object masks or bounding boxes are available, but they may reward explanations that overlap with the object region even if those regions are not truly causal for the model’s prediction [103,106]. Insertion and deletion metrics provide a more causal form of evaluation by measuring how the prediction score changes when salient regions are added or removed; however, they are sensitive to perturbation strategy, baseline choice, masking artifacts, and computational cost [104,106]. Therefore, XAI methods in visual recognition should not be ranked using a single metric alone. A more reliable evaluation should combine fidelity, localization, stability, robustness, computational efficiency, and user-centered usefulness according to the target task and deployment context [102,103].
  • Fidelity as a Measure of Faithfulness
Fidelity provides an operational measure of how closely an explanation aligns with the model’s actual decision process [107]. It is operationalized through quantitative tests that examine whether the features or regions identified by the explanation correspond to evidence that actually influences the model’s output. An explanation is considered high in fidelity if it accurately reflects the regions or features in the input that are responsible for the model’s prediction [108]. For example, a saliency map would provide stronger evidence of fidelity if removing or masking its highlighted regions substantially changed the model’s target prediction; overlap with a tumor annotation alone primarily indicates localization or plausibility. Fidelity is crucial because if an explanation does not align with the model’s true behavior, it could mislead users into trusting incorrect information [109]. Techniques like LIME and SHAP are often evaluated based on their fidelity to the model’s predictions [110]. Table 4 summarizes common procedures used to evaluate faithfulness and localization in visual XAI, including deletion/insertion tests, deletion/insertion curves, pointing-game evaluation, and localization-overlap measures.
  • Consistency
Consistency measures the reliability of explanations when the model is exposed to similar inputs [52]. If a model makes similar predictions for similar inputs, the explanations should also be similar. For instance, if a model correctly identifies a car in an image and explains its decision by highlighting the car’s wheels, consistency would require that a similar explanation be provided when another car image is presented, assuming the same visual features are involved [111]. Consistency ensures that the explanation method is stable and not overly sensitive to slight variations in the input data. It is especially important for applications where model behavior should remain predictable and reliable, such as in autonomous vehicles or medical diagnostics [112].
  • Stability
Stability evaluates how the explanations change when the input data is slightly modified or perturbed. A stable explanation should not vary drastically with minor changes in the input, as this could indicate that the explanation is unreliable or based on noise [113]. For instance, if a saliency map for an object detection task highlights specific regions of an image as important, those highlighted regions should remain largely consistent even if the image is rotated or slightly altered [75]. Stability is essential for ensuring that explanations are robust and not overly sensitive to irrelevant factors that might not significantly impact the model’s decision [114].

14. Benchmark Datasets for Visual Recognition Models

Benchmark datasets play a vital role in evaluating explainable AI techniques for deep visual recognition. These datasets provide standardized tasks for model evaluation and help compare the effectiveness of different XAI methods [115]. Common benchmark datasets in visual recognition include large-scale image classification datasets, object detection datasets, and specialized datasets for more domain-specific applications like medical imaging [116].
  • ImageNet
ImageNet is one of the most widely used datasets for evaluating image classification models [117]. It consists of over 14 million labeled images across 21,000 categories, with 1000 object classes commonly used for benchmark evaluations [118]. Researchers often use ImageNet to assess the performance and explainability of models like CNNs. For example, explainable AI techniques can be applied to identify which parts of an image (e.g., texture, color, or shapes) contribute to the model’s decision, helping to understand the model’s interpretability in a complex multi-class classification setting [119].
  • COCO (Common Objects in Context)
The COCO dataset is widely used for object detection, segmentation, and captioning tasks. It contains over 330,000 images with 80 object categories, each annotated with segmentation masks, keypoints, and object boundaries [120]. COCO is particularly valuable for evaluating XAI techniques in object detection, where explanations need to highlight regions or bounding boxes that the model uses for identifying objects. XAI methods can be evaluated on COCO by measuring whether generated saliency maps overlap with human-annotated object regions, for example, using localization, pointing-game, and deletion/insertion-based evaluation metrics [18].
  • ADE20K
ADE20K is another popular dataset for semantic segmentation tasks, where the goal is to classify each pixel in an image into one of 150 object categories [121]. The dataset provides pixel-level annotations across a wide variety of scenes, from indoor rooms to outdoor landscapes [121]. This dataset is useful for evaluating explainability techniques that aim to identify the most important regions for pixel-wise decisions. Techniques like feature visualization and saliency maps can be tested on this dataset to highlight the relevant parts of the image that influence segmentation decisions [122].
  • ISIC (International Skin Imaging Collaboration)
The ISIC dataset focuses on skin cancer classification, containing a large set of labeled dermoscopic images used for training and evaluating machine learning models in medical imaging. It is especially useful for evaluating explainable AI methods in a domain where interpretability is crucial for medical professionals [123]. Techniques such as saliency maps or heatmaps can be used to highlight the regions of a skin lesion that contribute to the model’s diagnosis, assisting in the validation of AI-driven tools for clinical use [124].

15. Illustrative Application Examples of XAI in Visual Recognition

The following examples are presented as illustrative application cases rather than a direct empirical benchmark. They show how XAI is used across representative visual-recognition settings and highlight the task type, commonly used model families, explanation methods, and evaluation concerns. In medical imaging, XAI is mainly used to verify whether diagnostic models focus on clinically meaningful regions [125,126,127]. In autonomous driving, explanations help assess whether perception models attend to relevant objects and scene cues [128,129]. In retail/product recognition, XAI supports error analysis by identifying product regions or visual attributes that influence category predictions [130,131]. In satellite imagery and remote sensing, XAI supports interpretable geospatial decision-making across spatial and spectral data [18,132]. In industrial inspection and smart manufacturing, XAI supports the transparent and accountable deployment of automated quality-control systems [133,134]. These examples also show that explanation quality should be assessed not only visually but also through fidelity, localization, robustness, and domain-expert validation [90,93,94,97,99].
  • Example 1: XAI in Medical Imaging (Tumor Detection)
In a medical imaging context, XAI techniques like saliency maps and SHAP have been applied to improve the interpretability of deep learning models used in tumor detection from medical scans (e.g., X-rays and MRIs) [135]. These models can detect subtle patterns in medical images that may be invisible to the human eye [135]. However, doctors need to trust the model’s decisions and understand the reasoning behind them. Saliency maps, for example, can highlight the exact regions of a medical image (such as a tumor in an MRI scan) that the model considered when making its prediction [136]. These visual explanations allow healthcare professionals to verify the model’s predictions and ensure that the AI system does not overlook critical details.
  • Example 2: XAI in Autonomous Vehicles (Pedestrian Detection)
Autonomous vehicles rely on deep visual recognition models for real-time pedestrian detection. These models must make quick, accurate decisions to avoid accidents [137]. Explainable AI techniques, such as saliency maps and LIME, have been applied to highlight the features that contribute to pedestrian detection, such as the shape, size, and location of pedestrians in the environment [138]. These explanations help engineers and safety regulators verify that the model is focusing on the right visual cues and not making decisions based on irrelevant or misleading features (e.g., the background or road markings). This transparency is essential for ensuring the safety and reliability of autonomous vehicles in diverse driving conditions [139].
  • Example 3: XAI in Retail (Product Categorization)
In retail, deep visual recognition models are used for automatic product categorization in e-commerce platforms [130,131]. XAI methods like feature visualization and saliency maps can be applied to understand why the model categorizes a product as, for example, “electronics” rather than “home appliances.” Feature visualization can reveal which parts of the product image (e.g., buttons, screens, or logos) contributed most to the model’s decision [130,131]. This transparency allows retailers to identify potential errors in the model, such as misclassifications due to ambiguous product features, and improve the overall accuracy and trustworthiness of their systems [131].
  • Example 4: XAI in Satellite Imagery and Remote Sensing (Land-Cover and Disaster Mapping)
Satellite and aerial-image models are used for land-cover classification, disaster mapping, deforestation monitoring, crop assessment, and urban-change detection. XAI methods can help analysts identify the spatial or spectral evidence contributing to these predictions and determine whether the model is focusing on geographically meaningful regions [18,132].
  • Example 5: XAI in Industrial Inspection and Smart Manufacturing (Visual Defect Detection)
Industrial visual inspection models are used to detect defects such as scratches, cracks, missing components, soldering faults, and surface irregularities. XAI methods can help engineers localize the evidence supporting a defect prediction and compare it with expected defect patterns, thereby supporting inspection review and model debugging [133,134].

16. Open Challenges and Research Directions

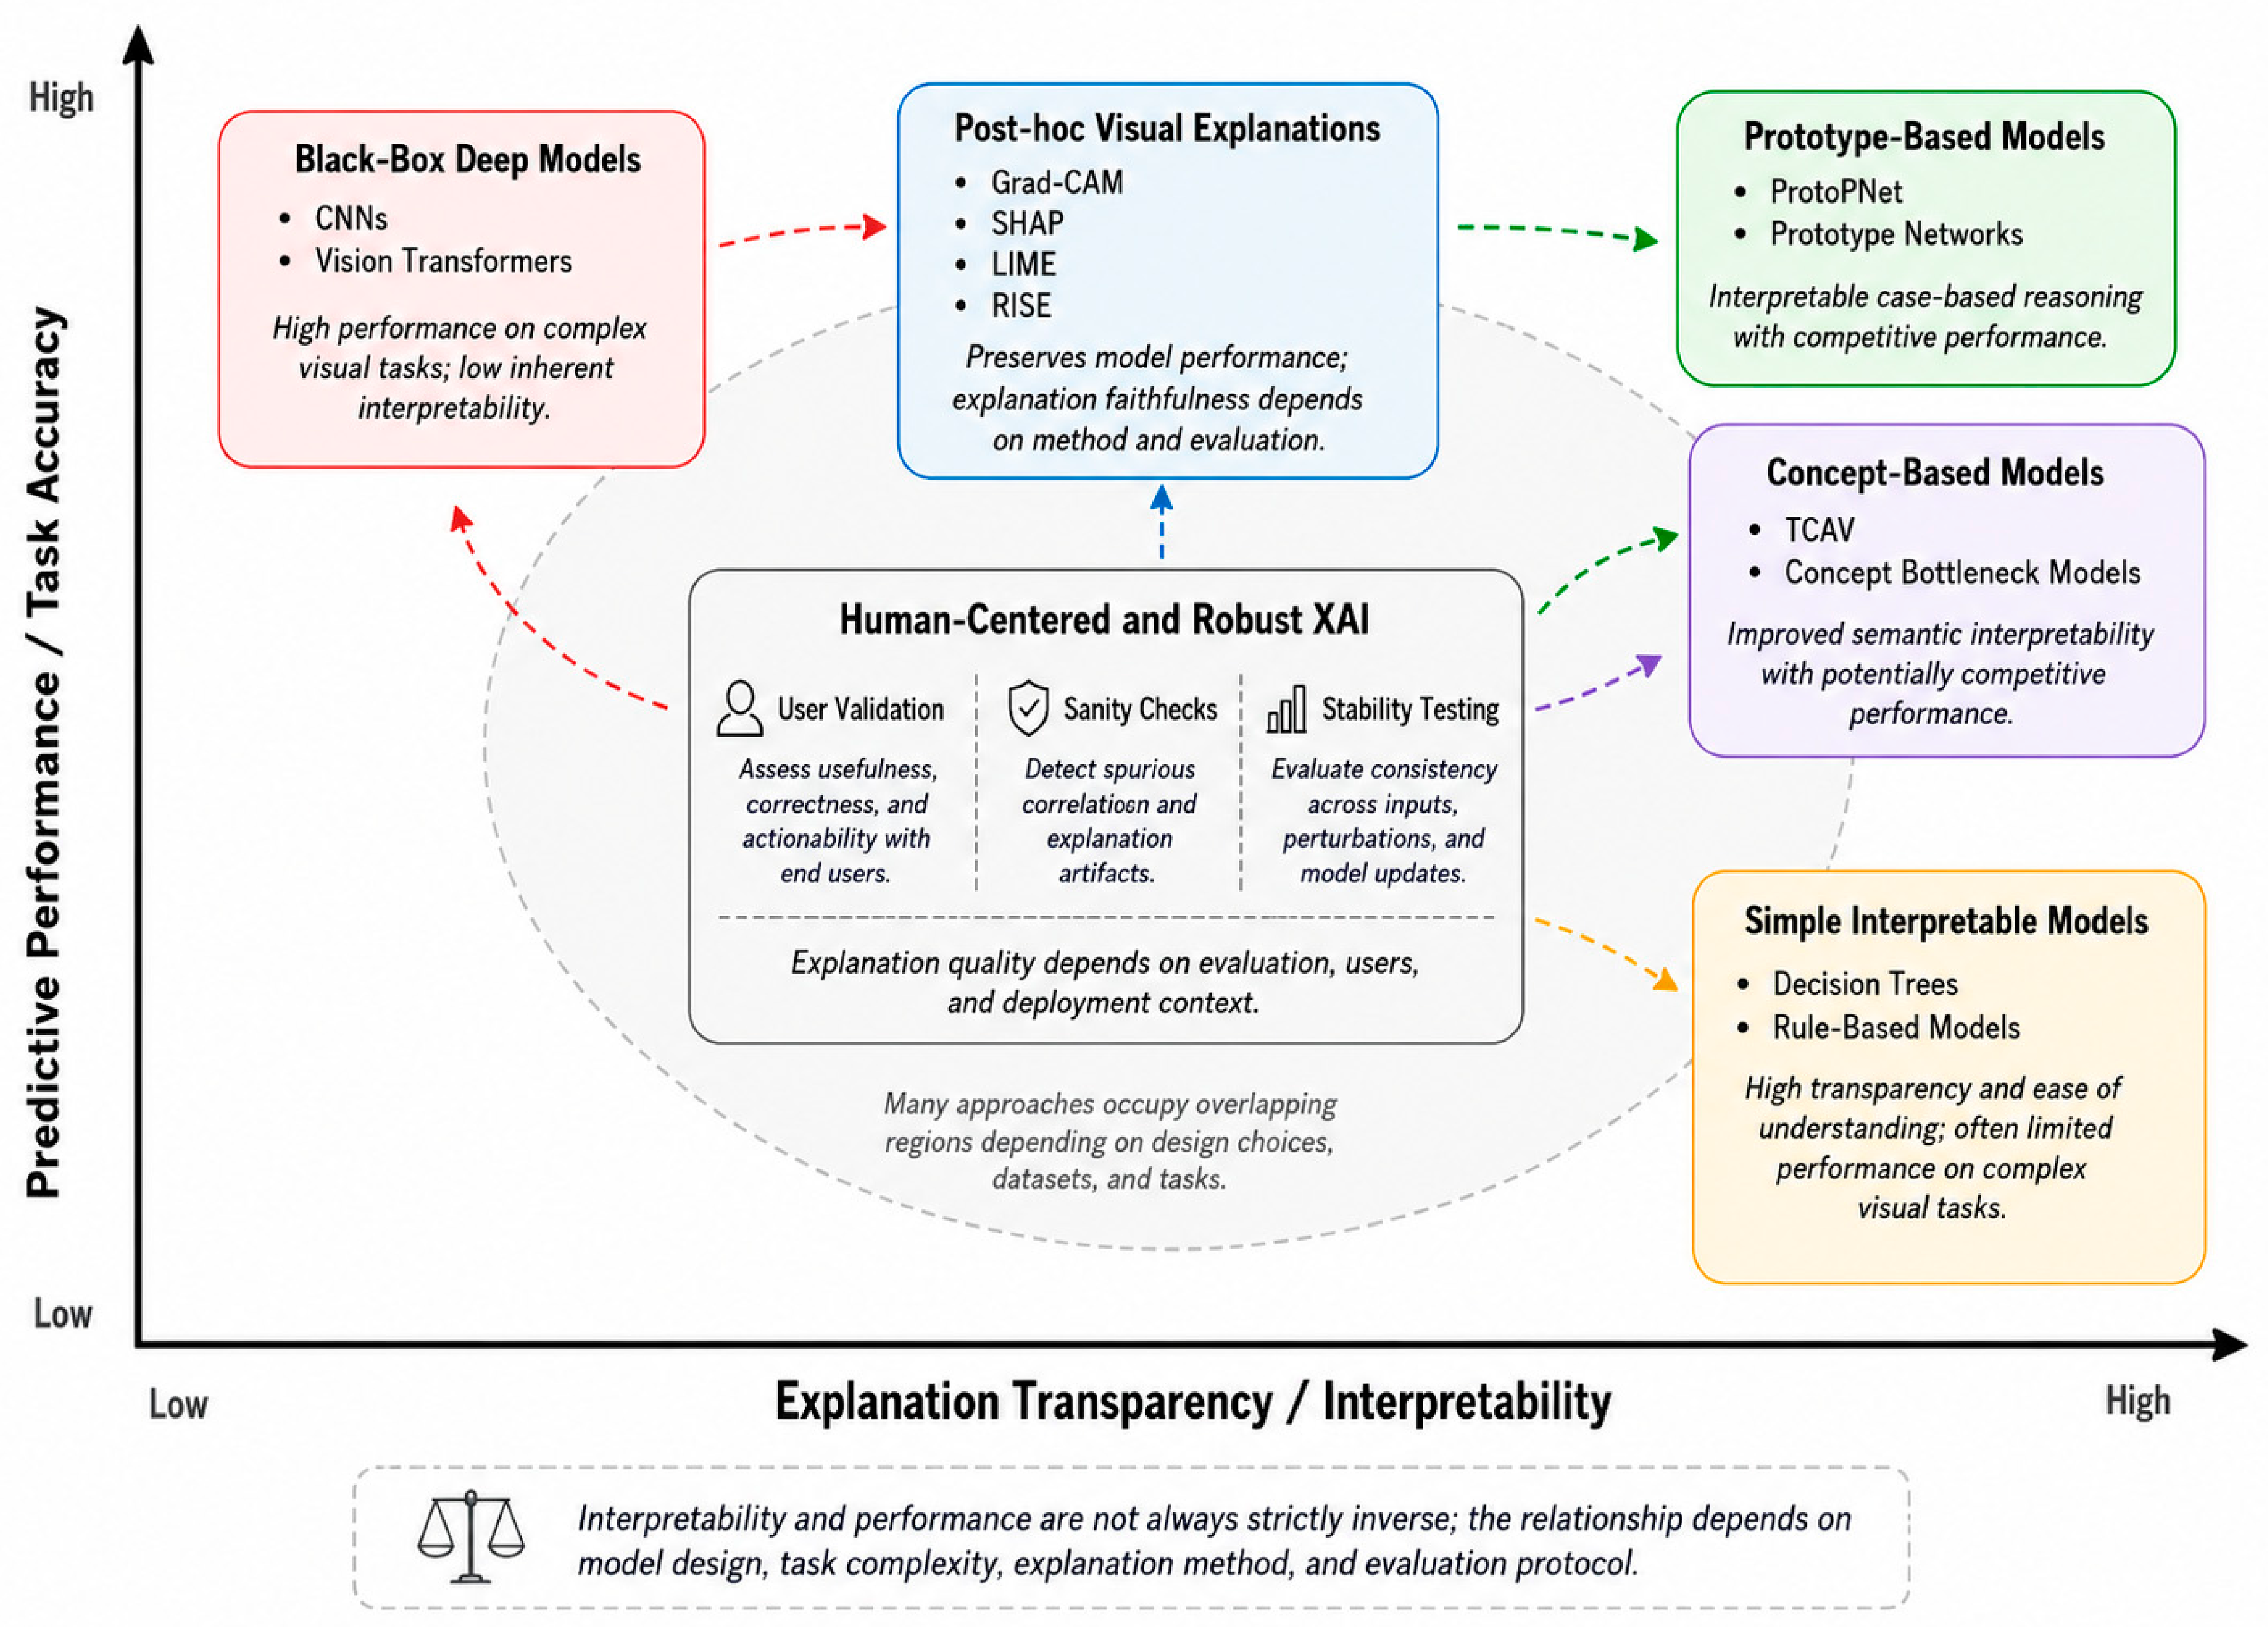
Explainable AI (XAI) is a rapidly evolving field, particularly in the domain of deep visual recognition [11]. While significant advancements have been made, several open challenges remain that hinder the widespread adoption and effectiveness of XAI techniques [9]. These challenges include the trade-offs between explainability and model performance, the lack of ground truth for evaluating explanations, the role of human–AI interaction, and ensuring the robustness and trustworthiness of the explanations provided by AI systems. Addressing these issues is critical for advancing the field and making deep visual recognition models more interpretable and reliable in real-world applications [42]. Figure 5 presents a nuanced view of the relationship between predictive performance and explainability in visual recognition. Although classical discussions often describe interpretability and accuracy as competing objectives, this relationship is not always strictly inverse. Post hoc XAI methods can explain high-performing black-box models after training, while concept-based and prototype-based models aim to integrate interpretability into the model design itself. Therefore, the performance–explainability relationship should be evaluated with respect to the task, model architecture, explanation faithfulness, and end-user requirements.
This relationship can be analyzed through the specific constraints imposed by different interpretable model families. First, capacity constraints reduce the number or complexity of functions that a model can represent. Shallow decision trees, sparse rule lists, and simplified transparent networks may therefore fail to capture the high-dimensional textures, shape variations, occlusions, and long-range dependencies available to deep CNNs and Vision Transformers. Second, sparsity and monotonicity constraints restrict the number, sign, or form of feature interactions so that the decision can be inspected, but these restrictions can exclude predictive interactions that improve peak accuracy. Third, concept-bottleneck models force the prediction through a limited set of human-defined concepts. Accuracy can decrease when the concept vocabulary is incomplete, concept labels are noisy or expensive to obtain, or the concept predictor discards residual information that is useful for the final classification decision [25].
Fourth, prototype-based networks constrain decisions to similarity with a finite set of learned prototypes or prototypical image parts. This supports case-based reasoning, but accuracy may decrease when the prototype set does not represent intra-class variability, when prototypes capture non-causal textures, or when projection to real training patches limits optimization flexibility [20,140]. Fifth, spatial or part-alignment constraints require the model to place evidence in coherent or semantically meaningful regions. Such constraints improve auditability but may suppress distributed evidence or contextual cues that an unconstrained classifier can exploit. Sixth, discretization and rule-extraction constraints convert continuous representations into thresholds, symbolic rules, or short decision paths and can introduce approximation error. These constraints explain why an intrinsically interpretable architecture may not always match the peak accuracy of an unconstrained model trained with the same data and backbone capacity.
These constraints do not imply that interpretable models must always be less accurate. Concept, prototype, sparsity, or localization supervision may act as useful regularization when the imposed structure matches the target domain. The relevant comparison is therefore constrained versus unconstrained representation under the same data, optimization budget, and evaluation protocol. Accordingly, the performance–explainability landscape is better represented by overlapping regions than by a strict inverse curve: post hoc methods can preserve the performance of a black-box model but may provide explanations with uncertain faithfulness, whereas intrinsically interpretable models can provide more direct reasoning at the possible cost of representational freedom, additional annotation, or peak accuracy [80].
The major open challenges in explainable AI for deep visual recognition are summarized in Table 5, including the performance–explainability balance, lack of ground truth for explanations, inconsistent evaluation metrics, limited human-centered validation, deployment issues, and vision- and transformer-specific explanation challenges.

17. Vision-Specific and Transformer-Specific Explanation Challenges

Open challenges in visual XAI differ from generic explainability challenges because image-based explanations must account for spatial localization, object boundaries, multi-object scenes, occlusion, background bias, and task-specific evidence. In classification, an explanation may highlight only the most discriminative region rather than the complete object. In detection and segmentation, explanations should ideally align with bounding boxes, masks, or object regions, but this becomes difficult when objects are small, overlapping, partially occluded, or weakly annotated. Therefore, visual explanations should be evaluated not only for visual plausibility but also for localization quality, faithfulness, robustness, and consistency across similar inputs [90,93,142].
Vision Transformers introduce additional explanation challenges because image evidence is represented as patch tokens rather than convolutional feature maps. Raw attention weights should not automatically be interpreted as faithful explanations of model decisions, since token mixing, residual connections, and multi-head attention can make the decision pathway difficult to trace. Methods such as Attention Rollout, Attention Flow, and transformer-specific relevance propagation attempt to estimate how information flows through attention layers, but these explanations still require careful validation using perturbation tests, sanity checks, and task-specific evaluation protocols [21,22,23].

18. Trade-Offs Between Explainability and Model Performance

Rather than treating predictive performance and explainability as universally opposing objectives, comparisons should account for task complexity, dataset characteristics, model architecture, explanation method, and evaluation protocol. Concept-based and prototype-based approaches demonstrate that interpretability can be incorporated into model design while maintaining competitive performance in some visual-recognition tasks [20,25]. Post hoc methods such as LIME, SHAP, Grad-CAM, Score-CAM, and RISE can explain high-performing black-box models without modifying the original architecture [11,17,18,24,46], although their faithfulness, stability, and localization accuracy may vary across datasets and tasks [90,93,142]. Conversely, intrinsically interpretable approaches can provide more transparent reasoning but may require concept annotations, prototype constraints, or architectural modifications [20,25,63]. Future studies should therefore compare predictive performance and explanation quality under matched experimental conditions rather than rank models along a single accuracy–interpretability axis.

19. Addressing the Lack of Ground Truth for Evaluating Explanations

A significant challenge in the evaluation of XAI techniques is the lack of ground truth for explanations. Unlike traditional machine learning models, where evaluation metrics like accuracy or F1-score can be directly computed based on labeled data, the evaluation of explanations is subjective and lacks a universally accepted standard [7]. The concept of “ground truth” in the context of explainability is problematic because there is no definitive or objective way to measure whether an explanation is accurate, as human interpretations of model decisions can vary [90,92]. For instance, when explaining an image classification model, saliency maps might highlight different regions of the image for different users, depending on their understanding and perspective. This subjectivity makes it difficult to benchmark explainability techniques across models and datasets [90,141,142].
To address this challenge, researchers have proposed using human evaluation in the form of user studies, where participants are asked to assess the quality and usefulness of explanations. However, these studies are often time-consuming, limited in scale, and may not provide a comprehensive evaluation [92]. Furthermore, even when human evaluations are used, they are prone to biases and inconsistencies, which can make it difficult to draw generalizable conclusions. An alternative approach is to develop automatic evaluation metrics that can quantify the quality of explanations in a more objective manner [92]. These metrics could measure aspects such as fidelity (how well the explanation matches the model’s true behavior), consistency (whether the explanation is stable across similar inputs), and stability (how much the explanation changes with minor perturbations to the input). However, these metrics also face challenges due to the lack of a clear, universally accepted definition of what constitutes a “good” explanation [90]. Developing more reliable and objective methods for evaluating explainability is an ongoing area of research in XAI.

20. Human–AI Interaction in Explainability

Human–AI interaction plays a crucial role in the success of explainable AI, as the ultimate goal of XAI is to help users understand and trust AI decisions [99,101]. In many real-world applications, such as healthcare and autonomous vehicles, the users (e.g., doctors, engineers, or drivers) need to interact with AI systems to make informed decisions based on the model’s output [99]. For AI systems to be adopted in these domains, the explanations provided by the model must be understandable, actionable, and aligned with human reasoning. A major challenge in this area is the complexity of the explanations. While many XAI techniques can generate high-fidelity explanations, they may not always be presented in a form that is easily interpretable by non-experts [145]. For example, a saliency map that highlights regions of an image may be useful for a visual-recognition expert, but it may not be as clear to a medical professional who needs to make a clinical decision based on the model’s output [146]. To improve human–AI interaction, future research should focus on creating user-centric explanations that are tailored to the needs and cognitive abilities of different user groups. This also highlights the importance of user training and educational support, since users with different technical backgrounds may face different levels of difficulty in understanding computational concepts and model-based decision support [147]. This involves not only providing clear visual explanations but also considering factors such as the user’s level of expertise, the context in which the model is being used, and the decision-making process [99]. Furthermore, human-in-the-loop systems, where users can interact with and refine the explanations provided by the model, could enhance the effectiveness of XAI techniques by allowing users to correct, modify, or validate the model’s decisions [148].
Another aspect of human–AI interaction is trust and acceptance. The effectiveness of an explanation depends not only on its clarity but also on the user’s trust in the AI system [149]. Research has shown that users are more likely to trust AI systems that provide transparent and understandable explanations [149]. Therefore, the design of XAI systems must incorporate elements that foster trust, such as providing explanations that are consistent with human expectations and addressing potential biases in the model’s predictions [7].

21. Robustness and Trustworthiness of Explanations

A critical challenge in XAI is ensuring the robustness and trustworthiness of the explanations provided by AI models [150]. Explanations must not only be consistent and interpretable but also resistant to manipulation and errors, particularly in adversarial settings. Deep learning models are known to be vulnerable to adversarial attacks, where small, imperceptible changes to the input data can lead to drastically incorrect predictions [53]. Similarly, explanations themselves can be subject to adversarial manipulation, where attackers attempt to modify the explanation to make the model appear more trustworthy than it actually is. For example, an adversarial attack might change an image slightly, causing the model to misclassify the object [151]. A saliency map for the perturbed image could still highlight the same regions of the image, even though the model’s decision is incorrect. Ensuring that explanations are resilient to such attacks is crucial for maintaining the trustworthiness of AI systems, especially in critical applications where adversarial manipulation could have severe consequences [152].
Importantly, explanation robustness should be evaluated separately from prediction robustness. In some cases, an adversarial or manipulated input may preserve the predicted class while substantially changing the saliency map or forcing the explanation to highlight irrelevant regions. Such explanation-targeted attacks are problematic because they can make an unreliable model appear trustworthy to users [53,151,152]. Therefore, visual XAI methods should be tested using perturbation analysis, insertion/deletion evaluation, sanity checks, and stability assessment under transformations such as noise, blur, compression, cropping, occlusion, and adversarial perturbations [26,90,93,96,113,142]. These tests help determine whether an explanation reflects the model’s true decision process or only provides a visually plausible but fragile justification.
In addition to adversarial robustness, the trustworthiness of explanations depends on the reliability of the XAI techniques themselves. If an explanation method produces inconsistent or misleading explanations, it could undermine the user’s confidence in the AI system [139]. For instance, explanations that only highlight irrelevant features or fail to capture the model’s true decision-making process can lead to misinterpretation and errors [153]. To address this issue, ongoing research focuses on developing robust explanation methods that are less susceptible to adversarial attacks and produce trustworthy insights into the model’s decision-making process.

22. Applications of Explainable AI in Visual Recognition

XAI requirements vary substantially across visual-recognition domains because the relevant evidence, failure modes, validation criteria, and end users differ. Medical imaging may require clinically meaningful and volumetrically consistent localization, autonomous driving requires temporal and perception-to-action explanations, remote sensing requires spatial and spectral validation, and industrial inspection requires precise defect localization under operational constraints. Security, surveillance, agriculture, biometrics, and visual forensics introduce additional concerns related to bias, shortcut learning, background artifacts, and domain-specific reliability. Accordingly, XAI methods should be evaluated not only for visual clarity but also for faithfulness, localization accuracy, robustness, domain relevance, and usefulness to the intended expert user [127,128,129,132,133,134,143,154,155]. Table 6 summarizes representative use cases of explainable AI in major visual-recognition application domains, including medical imaging, autonomous driving, agricultural monitoring, satellite imagery and remote sensing, industrial inspection and smart manufacturing, biometrics/face recognition, and deepfake or visual forensics.

23. Medical Imaging

In medical imaging, XAI methods can succeed when they highlight clinically meaningful regions that influence diagnostic predictions, such as lesions, tumors, or abnormal tissue patterns [125,127]. However, this domain also exposes important limitations of common visual-explanation methods. Many saliency and CAM-based approaches were originally developed for 2D natural images, where the model prediction is usually explained using evidence from a single image plane. In contrast, MRI and CT data are often volumetric, and clinically meaningful evidence may depend on inter-slice anatomical continuity, lesion volume, anatomical context, contrast variation, or multi-sequence information. A 2D saliency map applied slice by slice may therefore highlight locally discriminative pixels while missing the broader 3D structure that supports diagnosis. In addition, saliency maps may focus on scanner artifacts, image borders, acquisition markers, or dataset-specific shortcuts rather than pathology-related regions [153]. Recent medical-imaging studies have also shown that visually plausible saliency maps may fail to reliably localize clinically relevant abnormalities when compared with expert annotations [156,157]. Therefore, XAI in medical imaging should be evaluated using not only visual plausibility but also lesion-level localization, volumetric consistency, robustness across scanners and acquisition protocols, and expert validation.
Image-based explanations should also be interpreted as one component of broader clinical reasoning rather than as a complete causal account of a patient’s condition. Relevant clinical outcomes may depend on physiological, behavioral, and lifestyle variables that are not visible in medical images. For example, an observational study of patients with ischemic stroke reported an association between daily garlic intake and endothelial function [159]. Although this study is not an investigation of XAI, it illustrates why image-derived explanations should be considered alongside clinical history, lifestyle factors, laboratory findings, and other non-imaging evidence when evaluating AI-assisted medical decisions.

24. Autonomous Vehicles

In autonomous driving, XAI can succeed when explanations identify decision-relevant objects and scene cues, such as pedestrians, vehicles, traffic lights, lane markings, road boundaries, and obstacles [126,128,129]. However, autonomous-driving scenes expose limitations that are not fully captured by standard image-level heatmaps. A heatmap may highlight a pedestrian or traffic sign, but it may not explain whether the model understood object distance, motion direction, occlusion, interaction with nearby vehicles, weather-related visibility, or the reason for a braking or steering decision. This is especially important because driving decisions are temporal and action-oriented rather than based only on a single static image. Frame-level saliency maps may therefore fail when the relevant evidence depends on object trajectories, sudden scene changes, multi-object interactions, or the connection between perception and planning. Recent autonomous-driving XAI studies have therefore emphasized object-level, temporal, and multimodal explanation strategies, including planning transformers that identify decision-relevant objects and language-based driving models that connect object-level visual information with interpretable textual explanations [160,161]. A dedicated review of deep vision-based autonomous-driving systems further shows that explanation requirements extend beyond static object localization to the interpretation of learned driving policies, temporal context, scene interactions, and the relationship between perceived evidence and vehicle actions [126]. Therefore, XAI for autonomous vehicles should be evaluated not only by whether it highlights visually relevant objects, but also by temporal consistency, robustness under adverse conditions, usefulness for failure analysis, and ability to explain perception-to-action decisions.

25. Security and Surveillance

In security and surveillance, XAI can succeed when it helps identify visual cues used for face recognition, anomaly detection, violence detection, and forensic analysis. For example, explanations may show whether a face-recognition model relies on facial regions such as the eyes, nose, mouth, or periocular area, or whether a forensic model focuses on manipulation-related artifacts. However, this domain also shows why visually convincing explanations can be misleading. A saliency map may highlight plausible facial regions, but this does not prove that the model is fair, robust, or using identity-relevant evidence. The model may still rely on demographic shortcuts, illumination patterns, camera-specific artifacts, compression traces, background cues, or correlations that are not obvious from the explanation. Prior studies on facial-analysis systems have shown that demographic performance disparities and insufficient auditing can affect fairness and accountability [162,163]. In addition, explainable face-verification studies show that saliency-based explanations require careful interpretation because face-recognition decisions depend on similarity learning, identity-specific cues, and robustness across realistic conditions [164]. For example, a face-recognition model may highlight facial regions, but this does not ensure robustness across lighting, pose, occlusion, or demographic groups [155]. Therefore, XAI in surveillance should be combined with demographic bias auditing, cross-camera validation, privacy-aware deployment, and human-centered evaluation rather than being used only to increase apparent trust.

26. Agricultural and Environmental Monitoring

In agriculture and environmental monitoring, XAI can succeed when it highlights visual, spatial, or spectral evidence that corresponds to plant disease symptoms, crop stress, pest damage, or environmental change [72,122,154]. However, this domain also exposes important limitations of standard heatmap-based explanations. In plant disease detection, saliency maps may appear to highlight diseased leaf regions, but they may also focus on soil, shadows, camera angle, lighting conditions, leaf boundaries, or background texture instead of disease-specific symptoms. This problem is more serious in field images than in controlled laboratory images because field data often contain class imbalance, overlapping leaves, uncontrolled illumination, seasonal variation, and heterogeneous backgrounds. In hyperspectral and remote-sensing tasks, explanation is even more complex because model decisions may depend on spectral bands, spatial resolution, mixed pixels, sensor calibration, and landscape context rather than only visible image regions [132,165,166]. Therefore, XAI in agriculture and environmental monitoring should be evaluated using disease-region annotations where available, external field datasets, spectral or spatial relevance checks, and robustness tests against background, sensor, and acquisition changes. Recent plant-disease studies using explainable deep learning, such as potato leaf disease classification with Grad-CAM-based interpretation, further show that agricultural XAI should connect high classification performance with biologically meaningful symptom localization rather than relying only on image-level accuracy [167].

27. XAI in Satellite Imagery and Remote Sensing

Satellite imagery and remote-sensing analysis pose distinctive explainability challenges because predictions are often made over large geographic regions and may be influenced by spatial context, image tiling, and geographic leakage between training and test data. XAI can help analysts determine whether a model relies on meaningful structures—such as vegetation patterns, built-up areas, or disaster-affected regions—rather than on cloud cover, sensor artifacts, or location-specific shortcuts. For multispectral and hyperspectral imagery, spatial explanations may also be complemented by band-level attribution to identify which wavelength ranges contribute to the prediction [132].
Validation should therefore use geospatially appropriate procedures rather than rely only on visually plausible heatmaps. Explanation maps can be compared with land-cover polygons, disaster masks, or expert-annotated geographic features, while stability should be tested across seasons, atmospheric conditions, sensor platforms, and spatial resolutions. Spatially separated training and test sets are also important for assessing whether explanations remain reliable outside the locations used for model development. These requirements distinguish explainable GeoAI from conventional natural-image explanation and justify its treatment as a separate high-impact application domain [132].

28. XAI in Industrial Inspection and Smart Manufacturing

Industrial visual inspection poses distinctive explainability challenges because quality-control decisions often depend on subtle visual evidence that must be localized and interpreted reliably. In these settings, a high classification score is insufficient: engineers and operators need to verify that the model is responding to the actual defect rather than to background texture, lighting, fixture position, production-batch artifacts, or camera-specific cues. Region-based methods such as Grad-CAM and Score-CAM can support rapid operator review by localizing discriminative areas, while prototype- and concept-based methods can express decisions through representative defect patterns or predefined quality concepts. Explainability can also support model debugging, root-cause analysis, regulatory documentation, and human acceptance of automated quality-control systems [133,134].
Industrial inspection creates demanding operational constraints for XAI. Defects may be small, low-contrast, or rare; false negatives can be costly; and production systems often require real-time or edge-device inference. Explanation methods should therefore be evaluated not only for visual clarity but also for fine-grained localization, faithfulness, latency, memory use, and stability under illumination changes, vibration, camera replacement, and domain shift between production batches. Perturbation methods requiring thousands of forward passes may be unsuitable for online inspection, whereas coarse heatmaps may be too imprecise for micro-defect verification. A practical industrial-XAI system should combine efficient localization with quantitative defect overlap, perturbation-based faithfulness testing, and operator-centered validation [133,134].

29. Conclusions

This review has explored the growing field of Explainable AI (XAI) in deep visual recognition, emphasizing its importance in enhancing the transparency and trustworthiness of AI systems. We discussed various methods for achieving explainability, including model-agnostic techniques like LIME and SHAP, model-specific approaches such as saliency maps and feature visualization, and intrinsically interpretable models like decision trees and rule-based systems. As XAI is increasingly deployed in high-impact visual-recognition settings—including medical imaging, autonomous driving, security and surveillance, agriculture, satellite and remote-sensing analysis, industrial inspection and smart manufacturing, retail recognition, and visual forensics—future systems must combine predictive performance with faithful explanations, domain-appropriate validation, robustness, and effective human oversight. The evaluation of explainability through metrics such as fidelity, consistency, and stability was also covered, illustrating the need for robust standards in assessing the quality of explanations.
Despite the progress made in XAI, several challenges remain that need to be addressed. One key issue is the complex relationship between model performance and explainability, which depends on the model architecture, task complexity, explanation method, and evaluation protocol. The lack of ground truth for evaluating explanations is another significant obstacle, as traditional evaluation metrics used for model performance do not easily apply to the subjective nature of explainability. Furthermore, the role of human–AI interaction remains underexplored, particularly in tailoring explanations to meet the needs of different users and fostering trust in AI systems. Ensuring the robustness and trustworthiness of explanations is also critical, especially in environments where adversarial attacks or model misbehavior can have serious consequences.
Looking ahead, the future prospects for Explainable AI in visual recognition are promising. As AI systems become more integrated into real-world applications, the demand for interpretable models will continue to grow. Research will likely focus on developing techniques that strike a better balance between explainability and performance, ensuring that models remain both accurate and understandable. Additionally, there is potential for the creation of more standardized evaluation frameworks, allowing for the objective assessment of XAI methods across various domains. With continued advancements in human–AI interaction, XAI will increasingly focus on providing explanations that are not only accurate but also actionable and user-centric. The development of robust, transparent, and trustworthy AI systems will ultimately foster greater adoption of AI technologies in safety-critical areas, paving the way for a future where explainability is an integral part of every AI model.

Funding

This work was supported by the Deanship of Scientific Research at Northern Border University, Arar, KSA through the project number “NBU-FFR-2026-131-02”.

Data Availability Statement

No new data were created or analyzed in this study. Data sharing is not applicable to this article.

Acknowledgments

The author extends his appreciation to the Deanship of Scientific Research at Northern Border University, Arar, KSA for funding this research work through the project number “NBU-FFR-2026-131-02”. The authors acknowledge AI tools for assistance with language polishing and manuscript organization, and FigureLab for support in figure preparation. The authors are solely responsible for the scientific content of this review.

Conflicts of Interest

The author declares no conflicts of interest.

References

  1. Voulodimos, A.; Doulamis, N.; Doulamis, A.; Protopapadakis, E. Deep learning for computer vision: A brief review. Comput. Intell. Neurosci. 2018, 2018, 7068349. [Google Scholar] [CrossRef] [PubMed]
  2. Fan, F.-L.; Xiong, J.; Li, M.; Wang, G. On interpretability of artificial neural networks: A survey. IEEE Trans. Radiat. Plasma Med. Sci. 2021, 5, 741–760. [Google Scholar] [CrossRef] [PubMed]
  3. Jospin, L.V.; Laga, H.; Boussaid, F.; Buntine, W.; Bennamoun, M. Hands-on Bayesian neural networks—A tutorial for deep learning users. IEEE Comput. Intell. Mag. 2022, 17, 29–48. [Google Scholar] [CrossRef]
  4. Buntine, W. Theory refinement on Bayesian networks. In Uncertainty in Artificial Intelligence; Elsevier: Amsterdam, The Netherlands, 1991. [Google Scholar]
  5. Buntine, W. A guide to the literature on learning probabilistic networks from data. IEEE Trans. Knowl. Data Eng. 2002, 8, 195–210. [Google Scholar]
  6. Kalasampath, K.; Spoorthi, K.N.; Sajeev, S.; Kuppa, S.S.; Ajay, K.; Maruthamuthu, A. A literature review on applications of explainable artificial intelligence (XAI). IEEE Access 2025, 13, 41111–41140. [Google Scholar] [CrossRef]
  7. Ali, S.; Abuhmed, T.; El-Sappagh, S.; Muhammad, K.; Alonso-Moral, J.M.; Confalonieri, R.; Guidotti, R.; Del Ser, J.; Díaz-Rodríguez, N.; Herrera, F. Explainable Artificial Intelligence (XAI): What we know and what is left to attain Trustworthy Artificial Intelligence. Inf. Fusion 2023, 99, 101805. [Google Scholar] [CrossRef]
  8. Mersha, M.; Lam, K.; Wood, J.; AlShami, A.K.; Kalita, J. Explainable artificial intelligence: A survey of needs, techniques, applications, and future direction. Neurocomputing 2024, 599, 128111. [Google Scholar] [CrossRef]
  9. Alicioglu, G.; Sun, B. A survey of visual analytics for explainable artificial intelligence methods. Comput. Graph. 2022, 102, 502–520. [Google Scholar] [CrossRef]
  10. Sadeghi, Z.; Alizadehsani, R.; Cifci, M.A.; Kausar, S.; Rehman, R.; Mahanta, P.; Bora, P.K.; Almasri, A.; Alkhawaldeh, R.S.; Hussain, S. A review of explainable artificial intelligence in healthcare. Comput. Electr. Eng. 2024, 118, 109370. [Google Scholar] [CrossRef]
  11. Selvaraju, R.R.; Cogswell, M.; Das, A.; Vedantam, R.; Parikh, D.; Batra, D. Grad-CAM: Visual explanations from deep networks via gradient-based localization. Int. J. Comput. Vis. 2020, 128, 336–359. [Google Scholar]
  12. Chaddad, A.; Lu, Q.; Li, J.; Peng, Y.; Tanougast, C.; Bouridane, A.; Pagniez, F.; Rathore, S. Survey of explainable AI techniques in healthcare. Sensors 2023, 23, 634. [Google Scholar] [CrossRef] [PubMed]
  13. Ali, S.; Abuhmed, T.; El-Sappagh, S.; Muhammad, K.; Alonso-Moral, J.M.; Confalonieri, R.; Guidotti, R.; Del Ser, J.; Díaz-Rodríguez, N.; Herrera, F. The enlightening role of explainable artificial intelligence in medical & healthcare domains: A systematic literature review. Comput. Biol. Med. 2023, 166, 107555. [Google Scholar] [CrossRef] [PubMed]
  14. Şahin, E.; Arslan, N.N.; Özdemir, D. Unlocking the black box: An in-depth review on interpretability, explainability, and reliability in deep learning. Neural Comput. Appl. 2025, 37, 859–965. [Google Scholar]
  15. Zhou, B.; Khosla, A.; Lapedriza, A.; Oliva, A.; Torralba, A. Learning deep features for discriminative localization. In Proceedings of the IEEE Conference on Computer Vision and Pattern Recognition, Las Vegas, NV, USA, 27–30 June 2016. [Google Scholar]
  16. Chattopadhay, A.; Sarkar, A.; Howlader, P.; Balasubramanian, V.N. Grad-cam++: Generalized gradient-based visual explanations for deep convolutional networks. In 2018 IEEE Winter Conference on Applications of Computer Vision (WACV); IEEE: New York, NY, USA, 2018. [Google Scholar]
  17. Wang, H.; Wang, Z.; Du, M.; Yang, F.; Zhang, Z.; Ding, S.; Mardziel, P.; Hu, X. Score-CAM: Score-weighted visual explanations for convolutional neural networks. In Proceedings of the IEEE/CVF Conference on Computer Vision and Pattern Recognition Workshops; IEEE: New York, NY, USA, 2020. [Google Scholar]
  18. Petsiuk, V.; Das, A.; Saenko, K. Rise: Randomized input sampling for explanation of black-box models. arXiv 2018, arXiv:1806.07421. [Google Scholar]
  19. Kim, B.; Wattenberg, M.; Gilmer, J.; Cai, C.; Wexler, J.; Viegas, F. Interpretability beyond feature attribution: Quantitative testing with concept activation vectors (tcav). In International Conference on Machine Learning; PMLR: Norfolk, MA, USA, 2018. [Google Scholar]
  20. Chen, C.; Li, O.; Tao, C.; Saunders, A.; Rudin, C.; Lo, C.-R. This looks like that: Deep learning for interpretable image recognition. Adv. Neural Inf. Process. Syst. 2019, 32, 8928–8939. [Google Scholar]
  21. Abnar, S.; Zuidema, W. Quantifying attention flow in transformers. In Proceedings of the 58th Annual Meeting of the Association for Computational Linguistics; ACL: Stroudsburg, PA, USA, 2020. [Google Scholar]
  22. Chefer, H.; Gur, S.; Wolf, L. Transformer interpretability beyond attention visualization. In Proceedings of the IEEE/CVF Conference on Computer Vision and Pattern Recognition; IEEE: New York, NY, USA, 2021. [Google Scholar]
  23. Chefer, H.; Gur, S.; Wolf, L. Generic attention-model explainability for interpreting bi-modal and encoder-decoder transformers. In Proceedings of the IEEE/CVF International Conference on Computer Vision; IEEE: New York, NY, USA, 2021. [Google Scholar]
  24. Ribeiro, M.T.; Singh, S.; Guestrin, C. “Why should i trust you?” Explaining the predictions of any classifier. In Proceedings of the 22nd ACM SIGKDD International Conference on Knowledge Discovery and Data Mining; ACM: New York, NY, USA, 2016. [Google Scholar]
  25. Koh, P.W.; Nguyen, T.; Tang, Y.S.; Mussmann, S.; Pierson, E.; Kim, B.; Liang, P. Concept bottleneck models. In International Conference on Machine Learning; PMLR: Norfolk, MA, USA, 2020. [Google Scholar]
  26. Adebayo, J.; Gilmer, J.; Muelly, M.; Goodfellow, I.; Hardt, M.; Kim, B. Sanity checks for saliency maps. Adv. Neural Inf. Process. Syst. 2018, 31, 9505–9515. [Google Scholar]
  27. Archana, R.; Jeevaraj, P.E. Deep learning models for digital image processing: A review. Artif. Intell. Rev. 2024, 57, 11. [Google Scholar] [CrossRef]
  28. Khan, A.; Sohail, A.; Zahoora, U.; Qureshi, A.S. A survey of the recent architectures of deep convolutional neural networks. Artif. Intell. Rev. 2020, 53, 5455–5516. [Google Scholar] [CrossRef]
  29. Albawi, S.; Mohammed, T.A.; Al-Zawi, S. Social touch gesture recognition using convolutional neural network. Comput. Intell. Neurosci. 2018, 2018, 6973103. [Google Scholar] [CrossRef] [PubMed]
  30. Kiranyaz, S.; Avci, O.; Abdeljaber, O.; Ince, T.; Gabbouj, M.; Inman, D.J. 1D convolutional neural networks and applications: A survey. Mech. Syst. Signal Process. 2021, 151, 107398. [Google Scholar] [CrossRef]
  31. Zhang, Y.; Kang, B.; Hooi, B.; Yan, S.; Ji, X. Deep long-tailed learning: A survey. IEEE Trans. Pattern Anal. Mach. Intell. 2023, 45, 10795–10816. [Google Scholar] [CrossRef] [PubMed]
  32. Chen, C.; Isa, N.A.M.; Liu, X. A review of convolutional neural network based methods for medical image classification. Comput. Biol. Med. 2025, 185, 109507. [Google Scholar] [CrossRef] [PubMed]
  33. Shlezinger, N.; Eldar, Y.C. Model-based deep learning. Found. Trends Signal Process. 2023, 17, 291–416. [Google Scholar] [CrossRef]
  34. Alzubaidi, L.; Zhang, J.; Humaidi, A.J.; Al-Dujaili, A.; Duan, Y.; Al-Shamma, O.; Santamaría, J.; Fadhel, M.A.; Al-Amidie, M.; Farhan, L. A survey on deep learning tools dealing with data scarcity: Definitions, challenges, solutions, tips, and applications. J. Big Data 2023, 10, 46. [Google Scholar] [CrossRef]
  35. Rice, L.; Wong, E.; Kolter, Z. Overfitting in adversarially robust deep learning. In International Conference on Machine Learning; PMLR: Norfolk, MA, USA, 2020. [Google Scholar]
  36. Costa, J.C.; Aler, R.; Galvan, I.M. How deep learning sees the world: A survey on adversarial attacks & defenses. IEEE Access 2024, 12, 61113–61136. [Google Scholar] [CrossRef]
  37. Madry, A.; Makelov, A.; Schmidt, L.; Tsipras, D.; Vladu, A. Towards deep learning models resistant to adversarial attacks. arXiv 2017, arXiv:1706.06083. [Google Scholar]
  38. Qayyum, A.; Qadir, J.; Bilal, M.; Al-Fuqaha, A. Secure and robust machine learning for healthcare: A survey. IEEE Rev. Biomed. Eng. 2020, 14, 156–180. [Google Scholar] [CrossRef]
  39. Ayodeji, A.; Liu, Y.-k.; Chao, N.; Li, L. Deep learning for safety assessment of nuclear power reactors: Reliability, explainability, and research opportunities. Prog. Nucl. Energy 2022, 151, 104339. [Google Scholar] [CrossRef]
  40. Mey, O.; Neufeld, D. Explainable AI algorithms for vibration data-based fault detection: Use case-adadpted methods and critical evaluation. Sensors 2022, 22, 9037. [Google Scholar] [CrossRef] [PubMed]
  41. Salih, A.; Rashed, M.; Al-Mallah, M.H. Explainable artificial intelligence and cardiac imaging: Toward more interpretable models. Circ. Cardiovasc. Imaging 2023, 16, e014519. [Google Scholar] [CrossRef] [PubMed]
  42. Herm, L.-V.; Janiesch, C.; Helm, A.; Imhof, C.; Hofmann, A. Stop ordering machine learning algorithms by their explainability! A user-centered investigation of performance and explainability. Int. J. Inf. Manag. 2023, 69, 102538. [Google Scholar] [CrossRef]
  43. Zhou, B.; Sun, Y.; Bau, D.; Torralba, A. Interpretable basis decomposition for visual explanation. In Proceedings of the European Conference on Computer Vision (ECCV); Springer: Berlin/Heidelberg, Germany, 2018. [Google Scholar]
  44. Dwivedi, R.; Dave, D.; Naik, H.; Singhal, S.; Omer, R.; Patel, P.; Shah, B.; Zaveri, T. Explainable AI (XAI): Core ideas, techniques, and solutions. ACM Comput. Surv. 2023, 55, 194. [Google Scholar] [CrossRef]
  45. Zheng, Q.; Wang, M.; Zhou, S. Shap-CAM: Visual explanations for convolutional neural networks based on Shapley value. In European Conference on Computer Vision; Springer: Cham, Switzerland, 2022. [Google Scholar]
  46. Lundberg, S.M.; Lee, S.-I. A unified approach to interpreting model predictions. Adv. Neural Inf. Process. Syst. 2017, 30, 4765–4774. [Google Scholar]
  47. del Castillo Torres, G.; Vélaz, R.; Martínez-Rodrigo, A.; Pastor, J.M.; Fernández-Caballero, A. Understanding how CNNs recognize facial expressions: A case study with LIME and CEM. Sensors 2022, 23, 131. [Google Scholar] [CrossRef] [PubMed]
  48. Garreau, D.; Mardaoui, D. What does lime really see in images? In International Conference on Machine Learning; PMLR: Norfolk, MA, USA, 2021. [Google Scholar]
  49. Friedman, J.H. Greedy function approximation: A gradient boosting machine. Ann. Stat. 2001, 29, 1189–1232. [Google Scholar] [CrossRef]
  50. Goldstein, A.; Kapelner, A.; Bleich, J.; Pitkin, E. Peeking inside the black box: Visualizing statistical learning with plots of individual conditional expectation. J. Comput. Graph. Stat. 2015, 24, 44–65. [Google Scholar] [CrossRef]
  51. Ribeiro, M.T.; Singh, S.; Guestrin, C. Anchors: High-precision model-agnostic explanations. In Proceedings of the AAAI Conference on Artificial Intelligence; AAAI Press: Washington, DC, USA, 2018. [Google Scholar]
  52. Alvarez-Melis, D.; Jaakkola, T.S. On the robustness of interpretability methods. arXiv 2018, arXiv:1806.08049. [Google Scholar]
  53. Baniecki, H.; Biecek, P. Adversarial attacks and defenses in explainable artificial intelligence: A survey. Inf. Fusion 2024, 107, 102303. [Google Scholar] [CrossRef]
  54. Sundararajan, M.; Taly, A.; Yan, Q. Axiomatic attribution for deep networks. In International Conference on Machine Learning; PMLR: Norfolk, MA, USA, 2017. [Google Scholar]
  55. Smilkov, D.; Thorat, N.; Kim, B.; Viégas, F.; Wattenberg, M. Smoothgrad: Removing noise by adding noise. arXiv 2017, arXiv:1706.03825. [Google Scholar]
  56. Dosovitskiy, A.; Beyer, L.; Kolesnikov, A.; Weissenborn, D.; Zhai, X.; Unterthiner, T.; Dehghani, M.; Minderer, M.; Heigold, G.; Gelly, S. An image is worth 16x16 words: Transformers for image recognition at scale. arXiv 2010, arXiv:2010.11929. [Google Scholar]
  57. Wu, J.; Kang, W.; Tang, H.; Hong, Y.; Yan, Y. On the Faithfulness of Vision Transformer Explanations. In CVF Conference on Computer Vision and Pattern Recognition (CVPR); IEEE: New York, NY, USA, 2024. [Google Scholar]
  58. Xie, W.; Zhou, P.; Wang, X.; Du, M. ViT-CX: Causal explanation of vision transformers. arXiv 2022, arXiv:2211.03064. [Google Scholar]
  59. Wu, J.; Wang, X.; Wang, F.; Li, Y.; Liu, D.; Wu, S. Token transformation matters: Towards faithful post-hoc explanation for vision transformer. In Proceedings of the IEEE/CVF Conference on Computer Vision and Pattern Recognition; IEEE: New York, NY, USA, 2024. [Google Scholar]
  60. Gunning, D.; Vorm, E.; Wang, J.Y.; Turek, M. DARPA’s explainable AI (XAI) program: A retrospective. Authorea 2021. [Google Scholar] [CrossRef] [PubMed]
  61. Streeb, D.; Metz, Y.; Buchmüller, J.; Keim, D.A. Task-based visual interactive modeling: Decision trees and rule-based classifiers. IEEE Trans. Vis. Comput. Graph. 2021, 28, 3307–3323. [Google Scholar]
  62. Nauta, M.; Seifert, C. The co-12 recipe for evaluating interpretable part-prototype image classifiers. In World Conference on Explainable Artificial Intelligence; Springer: Berlin/Heidelberg, Germany, 2023. [Google Scholar]
  63. Ji, Y.; Wan, Q.; Liu, X.; Isa, N.A.M. A comprehensive survey on self-interpretable neural networks. Proc. IEEE 2025, 113, 783–813. [Google Scholar] [CrossRef]
  64. Wan, Q.; Ji, Y.; Liu, X.; Isa, N.A.M. A survey on interpretability in visual recognition. arXiv 2025, arXiv:2507.11099. [Google Scholar]
  65. Guidotti, R.; Monreale, A.; Ruggieri, S.; Turini, F.; Giannotti, F.; Pedreschi, D. A survey of methods for explaining black box models. ACM Comput. Surv. 2018, 51, 93. [Google Scholar] [CrossRef]
  66. Narkhede, J. Comparative evaluation of post-hoc explainability methods in AI: LIME, SHAP, and Grad-CAM. In 2024 4th International Conference on Sustainable Expert Systems (ICSES); IEEE: New York, NY, USA, 2024. [Google Scholar]
  67. Gaspar, D.; Silva, P.; Silva, C. Explainable AI for intrusion detection systems: LIME and SHAP applicability on multi-layer perceptron. IEEE Access 2024, 12, 30164–30175. [Google Scholar] [CrossRef]
  68. Aas, K.; Jullum, M.; Løland, A. Explaining individual predictions when features are dependent: More accurate approximations to Shapley values. Artif. Intell. 2021, 298, 103502. [Google Scholar] [CrossRef]
  69. Yang, J. Fast treeshap: Accelerating shap value computation for trees. arXiv 2021, arXiv:2109.09847. [Google Scholar]
  70. Biecek, P. DALEX: Explainers for complex predictive models in R. J. Mach. Learn. Res. 2018, 19, 1–5. [Google Scholar]
  71. Donahue, J.; Jia, Y.; Vinyals, O.; Hoffman, J.; Zhang, N.; Tzeng, E.; Darrell, T. Decaf: A deep convolutional activation feature for generic visual recognition. In International Conference on Machine Learning; PMLR: Norfolk, MA, USA, 2014. [Google Scholar]
  72. Toda, Y.; Okura, F. How convolutional neural networks diagnose plant disease. Plant Phenomics 2019, 2019, 9237136. [Google Scholar] [CrossRef] [PubMed]
  73. Zhang, J.; Wang, X.; Wang, X.; Zhang, M. Manifold: A model-agnostic framework for interpretation and diagnosis of machine learning models. IEEE Trans. Vis. Comput. Graph. 2018, 25, 364–373. [Google Scholar] [CrossRef] [PubMed]
  74. Dabkowski, P.; Gal, Y. Real time image saliency for black box classifiers. Adv. Neural Inf. Process. Syst. 2017, 30, 6967–6976. [Google Scholar]
  75. Amorim, J.P.; Silva, P.; Silva, C. Evaluating the faithfulness of saliency maps in explaining deep learning models using realistic perturbations. Inf. Process. Manag. 2023, 60, 103225. [Google Scholar] [CrossRef]
  76. Nguyen, A.; Yosinski, J.; Clune, J. Understanding neural networks via feature visualization: A survey. In Explainable AI: Interpreting, Explaining and Visualizing Deep Learning; Springer: Berlin/Heidelberg, Germany, 2019; pp. 55–76. [Google Scholar]
  77. Nguyen, A.; Dosovitskiy, A.; Yosinski, J.; Brox, T.; Clune, J. Synthesizing the preferred inputs for neurons in neural networks via deep generator networks. Adv. Neural Inf. Process. Syst. 2016, 29, 3387–3395. [Google Scholar]
  78. Ma, N.; Zhang, X.; Sun, J. Funnel activation for visual recognition. In European Conference on Computer Vision; Springer: Berlin/Heidelberg, Germany, 2020. [Google Scholar]
  79. Yoshimura, N.; Maekawa, T.; Hara, T. Toward understanding acceleration-based activity recognition neural networks with activation maximization. In 2021 International Joint Conference on Neural Networks (IJCNN); IEEE: New York, NY, USA, 2021. [Google Scholar]
  80. Rudin, C. Stop explaining black box machine learning models for high stakes decisions and use interpretable models instead. Nat. Mach. Intell. 2019, 1, 206–215. [Google Scholar] [CrossRef] [PubMed]
  81. Allen, A.E.; Tkatchenko, A. Machine learning of material properties: Predictive and interpretable multilinear models. Sci. Adv. 2022, 8, eabm7185. [Google Scholar] [CrossRef] [PubMed]
  82. Meng, Y. Decision tree model in supervised learning. In 2nd International Conference on Applied Mathematics, Modelling, and Intelligent Computing (CAMMIC 2022); SPIE: Bellingham, WA, USA, 2022. [Google Scholar]
  83. Costa, V.G.; Pedreira, C.E. Recent advances in decision trees: An updated survey. Artif. Intell. Rev. 2023, 56, 4765–4800. [Google Scholar]
  84. Charbuty, B.; Abdulazeez, A. Classification based on decision tree algorithm for machine learning. J. Appl. Sci. Technol. Trends 2021, 2, 20–28. [Google Scholar] [CrossRef]
  85. Jabari, S.; Zhang, Y. Very high resolution satellite image classification using fuzzy rule-based systems. Algorithms 2013, 6, 762–781. [Google Scholar] [CrossRef]
  86. Shivakumara, P.; Rajan, D.; Sadananthan, S.A. Image classification: Are rule-based systems effective when classes are fixed and known? In 2008 19th International Conference on Pattern Recognition; IEEE: New York, NY, USA, 2008. [Google Scholar]
  87. Zhang, Y.; Tiňo, P.; Leonardis, A.; Tang, K. A survey on neural network interpretability. IEEE Trans. Emerg. Top. Comput. Intell. 2021, 5, 726–742. [Google Scholar] [CrossRef]
  88. Ashtiani, F.; Geers, A.J.; Aflatouni, F. An on-chip photonic deep neural network for image classification. Nature 2022, 606, 501–506. [Google Scholar] [CrossRef] [PubMed]
  89. Salahuddin, Z.; Woodruff, H.C.; Chatterjee, A.; Lambin, P. Transparency of deep neural networks for medical image analysis: A review of interpretability methods. Comput. Biol. Med. 2022, 140, 105111. [Google Scholar] [CrossRef] [PubMed]
  90. Nauta, M.; Trienes, J.; Pathak, S.; Nguyen, E.; Peters, M.; Schmitt, Y.; Schlötterer, J.; van Keulen, M.; Seifert, C. From anecdotal evidence to quantitative evaluation methods: A systematic review on evaluating explainable ai. ACM Comput. Surv. 2023, 55, 295. [Google Scholar] [CrossRef]
  91. Jacovi, A.; Goldberg, Y. Towards faithfully interpretable NLP systems: How should we define and evaluate faithfulness? In Proceedings of the 58th Annual Meeting of the Association for Computational Linguistics; ACL: Stroudsburg, PA, USA, 2020. [Google Scholar]
  92. Vilone, G.; Longo, L. Notions of explainability and evaluation approaches for explainable artificial intelligence. Inf. Fusion 2021, 76, 89–106. [Google Scholar] [CrossRef]
  93. Yeh, C.-K.; Hsieh, C.-Y.; Suggala, A.; Inouye, D.I.; Ravikumar, P.K. On the (in) fidelity and sensitivity of explanations. Adv. Neural Inf. Process. Syst. 2019, 32, 10967–10978. [Google Scholar]
  94. Xu-Darme, R.; Deza, M.B.; Plyer, A.; Courty, N. On the stability, correctness and plausibility of visual explanation methods based on feature importance. In Proceedings of the 20th International Conference on Content-based Multimedia Indexing; IEEE: New York, NY, USA, 2023. [Google Scholar]
  95. Pillai, V.; Pirsiavash, H. Explainable models with consistent interpretations. In Proceedings of the AAAI Conference on Artificial Intelligence; AAAI Press: Washington, DC, USA, 2021. [Google Scholar]
  96. Gomez, T.; Fréour, T.; Mouchère, H. Metrics for saliency map evaluation of deep learning explanation methods. In International Conference on Pattern Recognition and Artificial Intelligence; Springer: Berlin/Heidelberg, Germany, 2022. [Google Scholar]
  97. Zhang, J.; Lin, Z.; Brandt, J.; Shen, X.; Sclaroff, S. Top-down neural attention by excitation backprop. Int. J. Comput. Vis. 2018, 126, 1084–1102. [Google Scholar]
  98. Rosenfeld, A. Better metrics for evaluating explainable artificial intelligence. In Proceedings of the 20th International Conference on Autonomous Agents and Multiagent Systems; IFAAMAS: Richland County, SC, USA, 2021. [Google Scholar]
  99. Rong, Y.; Leemann, T.; Nguyen, T.-T.; Sessler, L.; Gärtner, T.; Seidel, H.-P.; Kasneci, G.; Kasneci, E. Towards human-centered explainable ai: A survey of user studies for model explanations. IEEE Trans. Pattern Anal. Mach. Intell. 2023, 46, 2104–2122. [Google Scholar] [CrossRef]
  100. Morrison, K.; Doshi-Velez, F. Eye into AI: Evaluating the Interpretability of Explainable AI Techniques through a Game with a Purpose. Proc. ACM Hum.-Comput. Interact. 2023, 7, 273. [Google Scholar] [CrossRef]
  101. Kim, S.S.; Choi, J.H.; Kim, J.W.; Park, S. “help me help the ai”: Understanding how explainability can support human-ai interaction. In Proceedings of the 2023 CHI Conference on Human Factors in Computing Systems; ACM: New York, NY, USA, 2023. [Google Scholar]
  102. Hedström, A.; Weber, L.; Krakowczyk, D.; Bareeva, D.; Motzkus, F.; Wiegand, M.; Samek, W.; Lapuschkin, S. Quantus: An explainable ai toolkit for responsible evaluation of neural network explanations and beyond. J. Mach. Learn. Res. 2023, 24, 1–11. [Google Scholar]
  103. Tomsett, R.; Harborne, D.; Chakraborty, S.; Gurram, P.; Preece, A. Sanity checks for saliency metrics. In Proceedings of the AAAI Conference on Artificial Intelligence; AAAI Press: Washington, DC, USA, 2020. [Google Scholar]
  104. Samek, W.; Binder, A.; Montavon, G.; Lapuschkin, S.; Müller, K.-R. Evaluating the visualization of what a deep neural network has learned. IEEE Trans. Neural Netw. Learn. Syst. 2016, 28, 2660–2673. [Google Scholar] [CrossRef]
  105. Kindermans, P.-J.; Hooker, S.; Adebayo, J.; Alber, M.; Schütt, K.T.; Dähne, S.; Erhan, D.; Kim, B. The (Un) reliability of saliency methods. arXiv 2017, arXiv:1711.00867. [Google Scholar]
  106. Hooker, S.; Erhan, D.; Kindermans, P.-J.; Been, K. A benchmark for interpretability methods in deep neural networks. Adv. Neural Inf. Process. Syst. 2019, 32, 9742–9753. [Google Scholar]
  107. Guidotti, R.; Monreale, A.; Ruggieri, S.; Giannotti, F.; Pedreschi, D. Factual and counterfactual explanations for black box decision making. IEEE Intell. Syst. 2019, 34, 14–23. [Google Scholar] [CrossRef]
  108. Zhou, J.; Gandomi, A.H.; Chen, F. Evaluating the quality of machine learning explanations: A survey on methods and metrics. Electronics 2021, 10, 593. [Google Scholar] [CrossRef]
  109. Xu, H.; Zhang, H.; Ma, J. Classification saliency-based rule for visible and infrared image fusion. IEEE Trans. Comput. Imaging 2021, 7, 824–836. [Google Scholar] [CrossRef]
  110. Vimbi, V.; Shaffi, N.; Mahmud, M. Interpreting artificial intelligence models: A systematic review on the application of LIME and SHAP in Alzheimer’s disease detection. Brain Inform. 2024, 11, 10. [Google Scholar] [CrossRef] [PubMed]
  111. Elazar, Y.; Kassner, N.; Ravfogel, S.; Federmann, L.; Abavi, E.; Hinrichs, D.; Aharoni, R.; Schütze, H.; Goldberg, Y. Measuring and improving consistency in pretrained language models. Trans. Assoc. Comput. Linguist. 2021, 9, 1012–1031. [Google Scholar] [CrossRef]
  112. Javed, H.; El-Sappagh, S.; Abuhmed, T. Robustness in deep learning models for medical diagnostics: Security and adversarial challenges towards robust AI applications. Artif. Intell. Rev. 2024, 58, 12. [Google Scholar] [CrossRef]
  113. Agarwal, C.; Queen, O.; Lakkaraju, H.; Marathe, A. Rethinking stability for attribution-based explanations. arXiv 2022, arXiv:2203.06877. [Google Scholar]
  114. Hancox-Li, L. Robustness in machine learning explanations: Does it matter? In Proceedings of the 2020 Conference on Fairness, Accountability, and Transparency; ACM: New York, NY, USA, 2020. [Google Scholar]
  115. Arras, L.; Osman, A.; Samek, W. CLEVR-XAI: A benchmark dataset for the ground truth evaluation of neural network explanations. Inf. Fusion 2022, 81, 14–40. [Google Scholar] [CrossRef]
  116. Yang, J.; Shi, R.; Wei, D.; Liu, Z.; Zhao, L.; Ke, B.; Pfister, H.; Ni, B. Medmnist v2-a large-scale lightweight benchmark for 2d and 3d biomedical image classification. Sci. Data 2023, 10, 41. [Google Scholar] [CrossRef] [PubMed]
  117. Russakovsky, O.; Deng, J.; Su, H.; Krause, J.; Satheesh, S.; Ma, S.; Huang, Z.; Karpathy, A.; Khosla, A.; Bernstein, M. Imagenet large scale visual recognition challenge. Int. J. Comput. Vis. 2015, 115, 211–252. [Google Scholar] [CrossRef]
  118. Krizhevsky, A.; Sutskever, I.; Hinton, G.E. ImageNet classification with deep convolutional neural networks. Commun. ACM 2017, 60, 84–90. [Google Scholar] [CrossRef]
  119. Tavanaei, A. Embedded encoder-decoder in convolutional networks towards explainable AI. arXiv 2007, arXiv:2007.06712. [Google Scholar]
  120. Lin, T.-Y.; Maire, M.; Belongie, S.; Hays, J.; Perona, P.; Ramanan, D.; Dollár, P.; Zitnick, C.L. Microsoft coco: Common objects in context. In European Conference on Computer Vision; Springer: Berlin/Heidelberg, Germany, 2014. [Google Scholar]
  121. Zhou, B.; Zhao, H.; Puig, X.; Xiao, T.; Fidler, S.; Barriuso, A.; Torralba, A. Semantic understanding of scenes through the ade20k dataset. Int. J. Comput. Vis. 2019, 127, 302–321. [Google Scholar]
  122. Zeng, X.; Zhang, X.; Zhang, J.; Wang, C. Superpixel consistency saliency map generation for weakly supervised semantic segmentation of remote sensing images. IEEE Trans. Geosci. Remote Sens. 2023, 61, 5606016. [Google Scholar] [CrossRef]
  123. Qasim Gilani, S.; Khan, M.A.; Alhaisoni, M.; Alsubhi, K. Skin cancer classification using deep spiking neural network. J. Digit. Imaging 2023, 36, 1137–1147. [Google Scholar] [CrossRef] [PubMed]
  124. Khan, M.A.; Zhang, Y.-D.; Khan, S.A.; Attique, M.; Rehman, A.; Seo, S. Skin lesion segmentation and multiclass classification using deep learning features and improved moth flame optimization. Diagnostics 2021, 11, 811. [Google Scholar] [CrossRef] [PubMed]
  125. Patrício, C.; Neves, C.O.; Teixeira, L.F. Explainable deep learning methods in medical image classification: A survey. ACM Comput. Surv. 2023, 56, 85. [Google Scholar] [CrossRef]
  126. Zablocki, É.; Ben-Younes, H.; Cord, O.; Pérez, P.; Matthieu, C. Explainability of deep vision-based autonomous driving systems: Review and challenges. Int. J. Comput. Vis. 2022, 130, 2425–2452. [Google Scholar] [CrossRef]
  127. Gipiškis, R.; Tsai, C.-W.; Kurasova, O. Explainable AI (XAI) in image segmentation in medicine, industry, and beyond: A survey. ICT Express 2024, 10, 1331–1354. [Google Scholar] [CrossRef]
  128. Omeiza, D.; Skrypchuk, L.; Russell, C.; Subagdja, B.; Tan, A.-H.; Ramamoorthy, S. Explanations in autonomous driving: A survey. IEEE Trans. Intell. Transp. Syst. 2021, 23, 10142–10162. [Google Scholar] [CrossRef]
  129. Atakishiyev, S.; Salameh, M.; Yao, H.; Goebel, R. Explainable artificial intelligence for autonomous driving: A comprehensive overview and field guide for future research directions. IEEE Access 2024, 12, 101603–101625. [Google Scholar] [CrossRef]
  130. Rui, C. Research on classification of cross-border E-commerce products based on image recognition and deep learning. IEEE Access 2020, 9, 108083–108090. [Google Scholar]
  131. Cevahir, A.; Murakami, K. Large-scale Multi-class and Hierarchical Product Categorization for an E-commerce Giant. In Proceedings of COLING 2016, the 26th International Conference on Computational Linguistics: Technical Papers; ACL: Stroudsburg, PA, USA, 2016. [Google Scholar]
  132. Höhl, A.; Bruzzone, L.; Bovolo, F. Opening the black box: A systematic review on explainable artificial intelligence in remote sensing. IEEE Geosci. Remote Sens. Mag. 2024, 12, 261–304. [Google Scholar] [CrossRef]
  133. Nguyen, H.T.T.; Nguyen, L.P.T.; Cao, H. XEdgeAI: A human-centered industrial inspection framework with data-centric Explainable Edge AI approach. Inf. Fusion 2025, 116, 102782. [Google Scholar] [CrossRef]
  134. Rožanec, J.M.; Novalija, I.; Mladenić, D.; Fortuna, B. Adaptive explainable artificial intelligence for visual defect inspection. Procedia Comput. Sci. 2024, 232, 3034–3043. [Google Scholar] [CrossRef]
  135. Ariful Islam, M.; Islam, M.R.; Al-Fuqaha, A. Revolutionizing brain tumor detection using explainable AI in MRI images. NMR Biomed. 2025, 38, e70001. [Google Scholar] [CrossRef] [PubMed]
  136. Khan, M.A.; Alhaisoni, M.; Tariq, U.; Seo, S. Multimodal brain tumor detection and classification using deep saliency map and improved dragonfly optimization algorithm. Int. J. Imaging Syst. Technol. 2023, 33, 572–587. [Google Scholar]
  137. Galvao, L.G.; Moncayo, L.Y.; Silva, L.A.; Souza, L.S.; Santos, L.T.; Rocha, L.F.; Costa, L.G.; Oliveira, L.M.; Silva, L.R.; Santos, L.M.; et al. Pedestrian and vehicle detection in autonomous vehicle perception systems—A review. Sensors 2021, 21, 7267. [Google Scholar] [CrossRef] [PubMed]
  138. Li, Y.; Wang, H.; Wang, X.; Zhang, H. A deep learning-based hybrid framework for object detection and recognition in autonomous driving. IEEE Access 2020, 8, 194228–194239. [Google Scholar] [CrossRef]
  139. Chamola, V.; Hassija, V.; Sulthana, A.R.; Buyya, R. A review of trustworthy and explainable artificial intelligence (XAI). IEEE Access 2023, 11, 78994–79015. [Google Scholar] [CrossRef]
  140. Nauta, M.; Van Bree, R.; Seifert, C. Neural prototype trees for interpretable fine-grained image recognition. In Proceedings of the IEEE/CVF Conference on Computer Vision and Pattern Recognition; IEEE: New York, NY, USA, 2021. [Google Scholar]
  141. Akhtar, N. A survey of explainable ai in deep visual modeling: Methods and metrics. arXiv 2023, arXiv:2301.13445. [Google Scholar]
  142. Gevaert, A.; Pozzolo, A.D.; Dejori, M. Evaluating feature attribution methods in the image domain (2022). arXiv 2022, arXiv:2202.12270. [Google Scholar]
  143. Franco, D.; Mandreoli, F.; Martoglia, R.; Pecorari, M. Deep fair models for complex data: Graphs labeling and explainable face recognition. Neurocomputing 2022, 470, 318–334. [Google Scholar] [CrossRef]
  144. Kong, X.; Yang, X.; Wang, X.; Zhang, X.; Li, X.; Liu, X.; Chen, X.; Zhao, X.; Zhou, X.; Sun, X.; et al. Explainable interface for human-autonomy teaming: A survey. arXiv 2024, arXiv:2405.02583. [Google Scholar]
  145. Hassija, V.; Chamola, V.; Mahapatra, A.; Chang, V. Interpreting black-box models: A review on explainable artificial intelligence. Cogn. Comput. 2024, 16, 45–74. [Google Scholar] [CrossRef]
  146. Arrieta, A.B.; Díaz-Rodríguez, N.; Del Ser, J.; Bennetot, A.; Tabik, S.; Barbado, A.; Garcia, S.; Gil-Lopez, S.; Molina, D.; Benjamins, R. Explainable Artificial Intelligence (XAI): Concepts, taxonomies, opportunities and challenges toward responsible AI. Inf. Fusion 2020, 58, 82–115. [Google Scholar] [CrossRef]
  147. Gomes, A.; Mendes, A.J.; Marcelino, M.J. A teacher’s view about introductory programming teaching and learning—Portuguese and Macanese perspectives. In 2017 IEEE Frontiers in Education Conference (FIE); IEEE: New York, NY, USA, 2017. [Google Scholar]
  148. Retzlaff, C.O.; Das, S.; Wayllace, C.; Mousavi, P.; Afshari, M.; Yang, T.; Saranti, A.; Angerschmid, A.; Taylor, M.E.; Holzinger, A. Human-in-the-loop reinforcement learning: A survey and position on requirements, challenges, and opportunities. J. Artif. Intell. Res. 2024, 79, 359–415. [Google Scholar] [CrossRef]
  149. Kaur, D.; Uslu, S.; Rittichier, K.J.; Durresi, A. Trustworthy artificial intelligence: A review. ACM Comput. Surv. 2022, 55, 39. [Google Scholar] [CrossRef]
  150. Chander, B.; Srinivasan, K.; Ramachandran, K. Toward trustworthy artificial intelligence (TAI) in the context of explainability and robustness. ACM Comput. Surv. 2025, 57, 144. [Google Scholar] [CrossRef]
  151. Kuppa, A.; Le-Khac, N.-A. Adversarial XAI methods in cybersecurity. IEEE Trans. Inf. Forensics Secur. 2021, 16, 4924–4938. [Google Scholar] [CrossRef]
  152. Etmann, C.; Lunz, S.; Maass, P.; Schönlieb, C.-B. On the connection between adversarial robustness and saliency map interpretability. arXiv 2019, arXiv:1905.04172. [Google Scholar]
  153. Ghassemi, M.; Oakden-Rayner, L.; Beam, A.L. The false hope of current approaches to explainable artificial intelligence in health care. Lancet Digit. Health 2021, 3, e745–e750. [Google Scholar] [CrossRef] [PubMed]
  154. Sagar, S.; Javed, M.; Doermann, D.S. Leaf-based plant disease detection and explainable ai. arXiv 2024, arXiv:2404.16833. [Google Scholar]
  155. John, T.A.; Balasubramanian, V.N.; Jawahar, C.V. Canonical saliency maps: Decoding deep face models. IEEE Trans. Biom. Behav. Identity Sci. 2021, 3, 561–572. [Google Scholar] [CrossRef]
  156. Arun, N.; Gaw, N.; Singh, P.; Chang, K.; Aggarwal, M.; Chen, B.; Hoebel, K.; Gupta, S.; Patel, J.; Gidwani, M.; et al. Assessing the trustworthiness of saliency maps for localizing abnormalities in medical imaging. Radiol. Artif. Intell. 2021, 3, e200267. [Google Scholar] [CrossRef] [PubMed]
  157. Saporta, A.; Gui, X.; Agrawal, A.; Pareek, A.; Truong, S.Q.H.; Nguyen, C.D.T.; Ngo, V.-D.; Seekins, J.; Blankenberg, F.G.; Ng, A.Y.; et al. Benchmarking saliency methods for chest X-ray interpretation. Nat. Mach. Intell. 2022, 4, 867–878. [Google Scholar] [CrossRef]
  158. Yang, Y.; Joukovsky, B.; Mogrovejo, J.O.; Tuytelaars, T.; Deligiannis, N. Snippet: A framework for subjective evaluation of visual explanations applied to deepfake detection. ACM Trans. Multimed. Comput. Commun. Appl. 2024, 20, 253. [Google Scholar] [CrossRef]
  159. Lau, K.K.; Chan, Y.H.; Wong, Y.K.; Teo, K.C.; Yiu, K.H.; Liu, S.; Li, L.W.; Shu, X.O.; Ho, S.L.; Chan, K.H. Garlic intake is an independent predictor of endothelial function in patients with ischemic stroke. J. Nutr. Health Aging 2013, 17, 600–604. [Google Scholar] [CrossRef] [PubMed]
  160. Renz, K.; Chitta, K.; Mercea, O.B.; Koepke, A.; Akata, Z.; Geiger, A. Plant: Explainable planning transformers via object-level representations. arXiv 2022, arXiv:2210.14222. [Google Scholar]
  161. Chen, L.; Sinavski, O.; Hünermann, J.; Karnsund, A.; Willmott, A.J.; Birch, D.; Maund, D.; Shotton, J. Driving with llms: Fusing object-level vector modality for explainable autonomous driving. In 2024 IEEE International Conference on Robotics and Automation (ICRA); IEEE: New York, NY, USA, 2024. [Google Scholar]
  162. Buolamwini, J.; Gebru, T. Gender shades: Intersectional accuracy disparities in commercial gender classification. In Conference on Fairness, Accountability and Transparency; PMLR: Norfolk, MA, USA, 2018. [Google Scholar]
  163. Raji, I.D.; Buolamwini, J. Actionable auditing: Investigating the impact of publicly naming biased performance results of commercial ai products. In Proceedings of the 2019 AAAI/ACM Conference on AI, Ethics, and Society; ACM: New York, NY, USA, 2019. [Google Scholar]
  164. Lu, Y.; Xu, Z.; Ebrahimi, T. Towards visual saliency explanations of face verification. In Proceedings of the IEEE/CVF Winter Conference on Applications of Computer Vision; IEEE: New York, NY, USA, 2024. [Google Scholar]
  165. Nagasubramanian, K.; Jones, S.; Singh, A.K.; Sarkar, S.; Singh, A.; Ganapathysubramanian, B. Plant disease identification using explainable 3D deep learning on hyperspectral images. Plant Methods 2019, 15, 98. [Google Scholar] [CrossRef] [PubMed]
  166. Hsu, C.-Y.; Li, W. Explainable GeoAI: Can saliency maps help interpret artificial intelligence’s learning process? An empirical study on natural feature detection. Int. J. Geogr. Inf. Sci. 2023, 37, 963–987. [Google Scholar] [CrossRef]
  167. Alhammad, S.M.; Khafaga, D.S.; El-Hady, W.M.; Samy, F.M.; Hosny, K.M. Deep learning and explainable AI for classification of potato leaf diseases. Front. Artif. Intell. 2025, 7, 1449329. [Google Scholar] [CrossRef] [PubMed]
Figure 1. Structured literature-search and selection workflow used in this review. The workflow summarizes the database sources, keyword-based retrieval, initial screening, full-text eligibility assessment, exclusion criteria, included studies, and final thematic organization. The search strategy covered general visual-XAI terms as well as application-specific terms related to medical imaging, autonomous driving, remote sensing and satellite imagery, industrial inspection and manufacturing defect detection, and human-centered XAI. The main review period focused on studies published mainly between 2016 and 2025, with earlier foundational or domain-specific works included where relevant.
Electronics 15 03222 g001
Figure 2. Vision-specific taxonomy of explainable AI methods for deep visual recognition. The taxonomy is organized according to the type of explanation output provided in visual recognition, including pixel-level attribution, region/localization-based explanations, perturbation-based explanations, concept-based reasoning, prototype-based interpretation, transformer/attention-based explanations, and multimodal or text-based explanations.
Electronics 15 03222 g002
Figure 3. Illustrative comparison of representative visual-XAI methods for the same image-classification prediction. The figure compares an input image with typical explanation patterns produced by Grad-CAM, Grad-CAM++, Score-CAM, RISE, and LIME. CAM-based methods provide class-discriminative localization maps, RISE estimates saliency through perturbation-based masking, and LIME highlights influential superpixel regions. The comparison shows that different XAI methods may emphasize different regions, motivating careful evaluation of localization, smoothness, faithfulness, and interpretability.
Electronics 15 03222 g003
Figure 4. Evaluation Metrics for Explainable AI.
Electronics 15 03222 g004
Figure 5. Nuanced relationship between predictive performance and explainability in visual recognition. Rather than presenting interpretability and performance as a strict inverse trade-off, the figure illustrates how different XAI families occupy different regions of the performance–transparency space. Black-box CNNs and Vision Transformers often achieve strong predictive performance but have low inherent interpretability, whereas post hoc methods provide explanations after training. Concept-based and prototype-based models can provide more transparent reasoning while maintaining competitive performance depending on the task, model design, and evaluation protocol.
Electronics 15 03222 g005
Table 1. Critical Comparison of Model-Agnostic XAI Techniques for Deep Visual Recognition.
TechniqueVisual Explanation Unit/OutputModel Access RequirementMain Strengths in Visual RecognitionKey Limitations and AssumptionsComputational CostRobustness to Adversarial PerturbationsScalability to Large DatasetsMost Suitable Use CasesReferences
LIMESuperpixels or image regions with local importance weightsPrediction-output access onlyIntuitive local explanation; useful when the model architecture is unavailableSensitive to superpixel segmentation, perturbation sampling, masking baseline, and surrogate-model choiceHigh: approximately Q black-box model evaluations for Q perturbations per image, followed by fitting a local surrogate modelLow: small input changes can alter superpixel boundaries, sampled neighborhoods, and surrogate coefficientsModerate: cost rises rapidly with image resolution, number of superpixels, and dataset sizeExplaining individual image-classification predictions and local error cases[24,47,48]
SHAPPixels, superpixels, patches, or feature-map attributionsPrediction-output access; approximations often requiredTheoretically grounded additive attribution; can support local and global interpretationExact computation is infeasible for high-dimensional images; sensitive to feature grouping, background baseline, and correlated visual regionsVery high: exact model-agnostic Shapley computation may require evaluation of up to 2M feature coalitions; approximate variants use Q sampled coalitionsLow–moderate: attributions can change under adversarial perturbations, baseline manipulation, or correlated-feature effectsLow–moderate: direct raw-pixel application is impractical without grouping or specialized approximationsLocal/global attribution analysis of CNN-based visual-recognition models[45,46]
PDPAverage response curves for selected image-derived or engineered featuresRepeated model-query accessSimple global view of how selected features affect predictionsCan be misleading when visual features are correlated; weak for raw-pixel explanationsModerate: approximately n × g model predictions for one examined feature, where n is the number of observations and g is the number of grid pointsLow: adversarial, unrealistic, or off-distribution feature perturbations can distort the estimated partial-dependence relationships, particularly when visual features are correlatedHigh: for a small set of engineered features; poor for dense pixel or feature-map representationsGlobal analysis of interpretable image-derived features or metadata-assisted vision tasks[49]
ICEIndividual response curves for selected image-derived or engineered featuresRepeated model-query accessShows sample-level variation hidden by PDPCan become cluttered for many samples; affected by unrealistic feature perturbations and feature correlationModerate–high: approximately n × g model predictions and n individual response curves for one examined featureLow: individual curves may be unstable under small or adversarial feature changesModerate: with subsampling; visualization and computation become difficult for large datasetsStudying heterogeneous model behavior across image-derived feature values[50]
AnchorsIf–then rules based on visual attributes, superpixels, or hybrid featuresPrediction-output access onlyProduces high-precision rule-based local explanations that are easy to inspectCoverage may be limited; less suitable for dense raw-pixel reasoning without meaningful visual attributesModerate–high: requires an adaptive, data-dependent number of model queries (Q) during rule search and precision estimationModerate: local rules may be stable within a narrow region but can fail when adversarial changes invalidate anchor conditionsModerate: for structured or attribute-based inputs; weak for dense pixel-level representationsHybrid vision-plus-tabular settings or attribute-based visual-recognition tasks[51]
Note: Computational cost is expressed as an approximate analytical estimate based primarily on the number of black-box model evaluations required by each method. Here, Q denotes the number of perturbations or adaptive queries, M the number of interpretable features or image regions, n the number of observations, and g the number of evaluated grid points. Robustness and scalability are reported comparatively because published results vary across models, datasets, perturbation settings, image resolutions, and hardware platforms.
Table 2. Summary of Intrinsically Interpretable Models in Visual Recognition.
Model TypeCore IdeaInterpretabilityTypical Trade-Off vs. Standard Deep ModelsReferences
Decision treesPredict through human-readable split rulesHighVery interpretable, but usually weaker on complex image recognition tasks[60]
Rule-based modelsUse explicit if–then rules for classificationHighEasy to inspect, but limited expressiveness for high-dimensional visual data[61]
Prototype-based networksClassify by comparing image parts to learned prototypesHighMore interpretable than CNNs, often with some loss in flexibility or peak accuracy[62]
Prototype trees/neural treesCombine prototypes with tree-like decision pathsHighBetter balance of interpretability and accuracy than plain trees, but still simpler than full black-box models[63]
Self-interpretable neural networksBuild explanations directly into network structureMedium–HighMore faithful explanations than post hoc methods, but often require architectural constraints[63]
Traditional deep CNNsLearn hierarchical visual features end-to-endLowUsually strongest raw accuracy, but poor transparency without extra XAI methods[64]
Table 3. Evaluation Metrics for XAI in Visual Recognition.
MetricWhat It AssessesWhy It Matters in Visual RecognitionReferences
Faithfulness/Fidelity-based evaluationWhether the explanation truly reflects the model’s decisionEnsures highlighted regions are actually used by the model[93]
Stability/SensitivityWhether explanations remain similar under small perturbationsImportant for robustness and trust in similar images[94]
ConsistencyWhether explanations agree across similar inputs or modelsSupports reliability and reproducibility[95]
Insertion/DeletionEffect of adding or removing salient regions on prediction scoreTests causal importance of highlighted areas[96]
Localization/Pointing GameWhether the explanation overlaps with the correct object regionUseful for object recognition and weakly supervised localization[97]
Sanity ChecksWhether explanations depend on learned model parametersPrevents misleading but visually plausible explanations[26]
Table 4. Common procedures for evaluating faithfulness and localization in visual XAI.
Evaluation ProcedureHow It Is QuantifiedInterpretationMain Limitation
Deletion testProgressively remove or mask the most salient pixels, superpixels, patches, or regions and measure the decrease in the target-class score.A faster decrease indicates that the explanation identified regions important to the model prediction.Sensitive to masking strategy, baseline choice, and out-of-distribution artifacts.
Insertion testProgressively add the most salient regions back to a blurred or baseline image and measure the increase in the target-class score.A faster increase indicates that the highlighted regions contain strong predictive evidence.Depends on baseline image construction and region insertion order.
Deletion/insertion curvesPlot prediction-score changes as salient regions are removed or inserted; summarize using area-under-the-curve values.Provides a quantitative comparison between explanation methods.Curves may vary depending on perturbation design and image preprocessing.
Pointing gameCheck whether the most salient point falls inside the ground-truth object bounding box or segmentation mask.Measures whether the explanation points to the correct object region.Measures localization agreement, not necessarily causal importance.
Localization overlapCompare saliency maps with bounding boxes, masks, or annotated regions using overlap-based scores.Useful when ground-truth object or lesion annotations are available.Requires annotations and may reward spatial overlap even when the region is not causally used by the model.
Table 5. Open challenges in explainable AI for deep visual recognition.
Open ChallengeBrief NoteReferences
Performance–explainability balanceAccuracy and interpretability are task-, model-, and evaluation-dependent rather than strictly inverse.[42]
No ground truth for explanationsMost visual explanations lack a clear gold standard.[141]
Inconsistent evaluation metricsDifferent metrics often rank XAI methods differently.[142]
Human–AI interaction complexityDifferent users need different types of explanations.[99]
Limited human-centered validationMany studies evaluate explanations algorithmically, not with users.[100]
Bias and spurious correlationsModels may rely on shortcuts that explanations do not fully reveal.[143]
Lack of standard benchmarksResults are hard to compare across datasets and tasks.[90,141,142]
Deployment and usability issuesExplanations may be too slow or too technical for practice.[144]
Vision- and transformer-specific explanation challengesVisual explanations must handle localization, object boundaries, background bias, multi-object scenes, and patch-token interactions in Vision Transformers.[21,22,23]
Table 6. Use Cases for Explainable AI in Visual Recognition Applications.
Application AreaTypical Visual TaskWhy XAI Is UsedReferences
Medical imagingDisease classification, lesion localization, image segmentationTo highlight image regions supporting diagnosis and improve clinical trust[125,127,156,157]
Autonomous drivingScene understanding, perception, planningTo explain what the vehicle detected and why a driving action was taken[128,129]
Agricultural monitoringPlant disease recognition from leaf imagesTo show symptom regions and support farmer-facing decision tools[154]
Biometrics/face recognitionIdentity verification and facial analysisTo improve transparency, audit bias, and support accountable deployment[143,155]
Deepfake/visual forensicsFake-image or fake-face detectionTo help users understand forensic cues and compare explanation quality[158]
Satellite imagery and remote sensingLand-cover classification, change detection, disaster mapping, crop and environmental monitoringTo verify spatial and spectral evidence and detect reliance on clouds, sensor artifacts, or spatial leakage[18,132]
Industrial inspection and smart manufacturingSurface-defect detection, PCB inspection, component verification, and quality controlTo confirm that predictions rely on true defects and to support operator review and root-cause analysis[133,134]
Disclaimer/Publisher’s Note: The statements, opinions and data contained in all publications are solely those of the individual author(s) and contributor(s) and not of MDPI and/or the editor(s). MDPI and/or the editor(s) disclaim responsibility for any injury to people or property resulting from any ideas, methods, instructions or products referred to in the content.