Article

Optimal Scheduling Model for Renewable Energy Electrothermal Coupling System Considering Market Clearing Mechanism of Thermal Storage Power Plant


1
Key Laboratory of Regional Multi-energy System Integration and Control of Liaoning Province, Shenyang Institute of Engineering, Shenyang 110136, China
2
Key Laboratory of Modern Power System Simulation and Control & Renewable Energy Technology, Ministry of Education, Northeast Electric Power University, Jilin 132012, China
3
State Grid Liaoning Electric Power Co., Ltd. Fushun Power Supply Company, Fushun 113006, China
*
Author to whom correspondence should be addressed.
Electronics 2026, 15(11), 2371; https://doi.org/10.3390/electronics15112371
Submission received: 26 April 2026 / Revised: 22 May 2026 / Accepted: 28 May 2026 / Published: 31 May 2026
(This article belongs to the Special Issue Design and Control of Renewable Energy Systems in Smart Cities)

Abstract

In the context of spot electricity markets, the fluctuation characteristics of node electricity prices play a crucial role in guiding the operational strategies of thermal power plants. However, constrained by the inelastic demand for heat, the strong coupling between electricity and heat in combined heat and power (CHP) units limits their ability to regulate electricity generation. These conditions present considerable difficulties for the economic feasibility and carbon reduction performance of these units, especially with high levels of renewable energy integration and during intensive peak-load shaving operations. In response to these challenges, this paper introduces an optimized dispatch method for renewable energy–electricity–heat coupled systems in thermal power plants with thermal storage, which incorporates the coordinated clearing of nodal electricity prices. First, a spot market clearing mechanism is established based on a DC optimal power flow model, and node electricity price signals reflecting network congestion characteristics are endogenously generated through the Lagrange multiplier of the node power balance constraint. Next, by introducing node injection power as a coupling variable between the grid clearing model and the CHP plant scheduling model, a co-optimization framework with bidirectional feedback between electricity prices and unit output is constructed. In conclusion, the integration of node electricity prices, deep peak-shaving costs, and carbon emission costs into a unified optimization objective leads to the development of a scheduling model for the renewable energy–electricity–heat coupled system, which includes CHP units, thermal storage, and grid interactions. The simulation results show that the proposed method can effectively improve the performance of the electric–thermal coupling system under the condition of a high proportion of renewable energy access. Under the typical daily load and new energy output conditions, the total cost of the system is reduced by about 9.7%, the carbon emission is reduced by about 18.3%, and the peak shaving capacity is increased from 25 MW to 58 MW, thus enhancing the flexible scheduling ability and market adaptability of the heat storage thermal power plant.

1. Introduction

With the development of the electricity market and the increasing proportion of renewable energy, the coordinated interaction of source–grid–load–storage in the power system has become a clear development direction. In this context, the electricity spot market is the core platform for the optimal allocation of resources, and its node price signal can accurately reflect the supply and demand relationship and network congestion cost of different nodes, which provides an important reference for market players including thermal power plants to formulate operation strategies [1,2,3,4].
In terms of renewable energy and electrothermal coupling systems, cogeneration units play a dual role in energy supply as a key unit that provides both electricity and heat energy. However, its strong coupling characteristics of “determining electricity by heat” seriously limit the flexible adjustment ability of power output under the constraint of rigid heating demand. References [5,6] analyzed the unit constraint mechanism of this problem and pointed out that this will make it difficult for the unit to effectively respond to the spatial and temporal fluctuations of the spot market node price, and at the same time affect the deep peak shaving task under the high proportion of renewable energy grid connection [7]. Based on this, References [8,9] proposed to transfer heat energy across time through heat storage equipment to alleviate the rigid constraint of electro-thermal coupling, so as to improve the adjustment ability of the unit and the flexibility of market participation.
In terms of heat storage capacity optimization and low-carbon scheduling, Reference [10] improved the peak regulation ability through a centralized optimization model, and Reference [11] further incorporated carbon emission constraints into the optimization framework. The comparison shows that multi-objective coordination is the key to improving system economy and low-carbon performance. Nevertheless, these studies are mostly one-way optimization or fixed node price assumptions and do not fully consider the feedback effect of unit output on the node price, which may reduce the feasibility and economy of the scheduling strategy under actual network congestion conditions.
At the level of power grid and market mechanism, References [12,13,14] proposed a multi-step ultra-short-term prediction method, which improves the prediction accuracy of wind power and photovoltaic through a multivariate time series relationship and graph structure learning and provides real-time data support for power grid dispatching. Additionally, References [15,16,17] analyzed the impact of distributed energy access on the operation of the distribution network and proposed a reactive power optimization strategy under the multi-access structure, which helps to reduce system losses and improve operating performance. At the same time, Reference [18] proposed a hierarchical optimal scheduling method for microgrid based on multi-energy complementarity, which provides a theoretical basis for cross-energy coordination and multi-objective optimization. It can be seen that at the market clearing level, the optimization of the joint spot market and ancillary service market, as well as the combination of demand response resources to guide end-users to adjust their electricity consumption behavior, is crucial to alleviating source-load fluctuations and improving system regulation capabilities.
At the technical level, in addition to the configuration of heat storage equipment, the optimization of unit structure, integrated power-to-gas technology and multi-energy complementary network can also improve the system regulation ability. References [19,20] pointed out that multi-energy complementarity and electricity-to-heat technology can weaken the rigidity of electro-thermal coupling, while Reference [21] shows how the joint clearing mechanism can achieve cost synergy in multi-objective economic–low–carbon optimization. On the whole, the optimization model gradually develops from single economy to economic–low–carbon–safety multi-objective coordination and introduces factors such as carbon trading price, grid security constraints and source-load uncertainty to improve the practicability and robustness of the scheduling scheme.
Although the existing research has made progress, most scholars still regard the nodal price as a fixed exogenous parameter, ignoring the feedback effect of the output of the thermal power plant on the power flow of the power grid and the nodal price [22]. One-way optimization is difficult to truly reflect the two-way game characteristics of market clearing, which may reduce the scheduling economy and even feasibility. Reference [23] further pointed out that the composition of nodal price and its complex two-way interaction with electro-thermal coupling and grid congestion have not been fully studied. At the same time, how to coordinate the deep peak shaving cost, carbon emission cost and nodal price signal to build a unified economic–low–carbon optimization goal is still a research challenge. In order to make up for the lack of existing research, there have been a variety of double-layer or iterative market clearing methods in recent years. Reference [24] proposed a double-layer collaborative optimization scheduling method for medium and low voltage AC/DC hybrid distribution networks. The upper layer is based on DC-OPF for market clearing, and the lower layer is based on unit output and energy storage scheduling. Partial coordination is achieved through iteration between the upper and lower layers; in Reference [25], a two-layer game optimization scheduling method is proposed for the integrated energy system. The upper layer considers the uncertainty of carbon trading and green certificates, and the lower layer performs unit scheduling to iteratively achieve price and output coordination. However, these methods still have shortcomings: most of them still assume that the upper market is the standard DC-OPF and do not fully consider the feedback effect of unit response on the nodal price; the iterative method may have slow convergence speed or rely on heuristic adjustment. Most of them deal with the scheduling problem with single-objective or fixed-node electricity price and do not consider the multi-objective coordination of electricity market revenue, heat storage adjustment cost and carbon emission cost in the model.
In view of the above problems, this paper focuses on the flexible scheduling problem of thermal power plants in the electricity spot market environment and constructs a collaborative optimization framework for two-way feedback of node electricity price and thermal power plant output. The upper layer carries out market clearing based on the DC optimal power flow model and endogenously generates the node price reflecting the marginal power supply cost of the system and the network congestion characteristics. The lower layer establishes an electro-thermal coupling scheduling model, including cogeneration units, heat storage devices and power grid interaction links, and optimizes the unit output and heat storage charging and discharging strategies with the goal of minimizing the comprehensive operating cost. At the same time, this paper introduces the injection power of the access node of the thermal power plant as the key coupling variable between the grid side and the thermal power plant side. Through the alternating update of the price signal and the injection power, the market clearing result is consistent with the scheduling decision of the thermal power plant. This method can more truly describe the dynamic coupling relationship between electricity price formation and unit response and provide theoretical support for the economic and low-carbon operation of thermal power plants in the spot market. Compared with References [10,11,22,23], the proposed method realizes the two-way feedback between the nodal price and the unit output for the first time and considers the electricity market revenue, deep peak regulation cost and carbon emission cost simultaneously in the scheduling model, which breaks through the limitations of one-way optimization or fixed electricity price hypothesis.
In view of the above research gap, the innovation of this paper mainly has the following two aspects:
  • Existing studies, such as References [10,22], primarily employ unidirectional optimization or assume fixed node prices, which fail to fully capture the feedback effect of unit output on nodal prices. This limitation can reduce the feasibility and economic efficiency of dispatch strategies under actual network congestion conditions. Although References [24,25] implement two-level or iterative market clearing methods, the upper level still relies on standard DC-OPF or fixed nodal prices, while the lower-level iterative optimization achieves only partial coordination. To overcome these shortcomings, this paper proposes a collaborative clearing framework that establishes bidirectional coupling between nodal prices and CHP plant output. By using the power injected at the CHP plant’s grid connection point as the coupling variable, the framework enables real-time dynamic feedback between the grid-side market clearing model and the CHP-side dispatch model, allowing nodal prices to be adaptively updated according to unit output and facilitating real-time optimization of plant operation strategies.
  • In multi-objective optimization, References [11,23] typically treat electricity market revenues, deep peak-shaving costs, and carbon emission costs using fixed weighting schemes, which are subjective and cannot achieve coordinated trade-offs through price signals. References [15,16,17,18] consider distributed energy integration, multi-energy complementarity, and hierarchical scheduling; however, they still do not achieve true multi-objective coordination of electricity market revenues, thermal storage regulation costs, and carbon emission costs via nodal price signals. This paper proposes a dispatch model for renewable energy–electricity–heat coupled systems that integrates node-level electricity price signals. The model incorporates electricity market revenues, deep peak-shaving operational costs, and carbon emission costs into a unified objective function. By leveraging node-level price signals, the framework achieves a coordinated trade-off among multiple cost factors, enabling the optimization results to directly reflect optimal operational strategies for CHP units under market conditions and realize genuine multi-objective coordination.

2. Methodology and Analysis

In this section, we construct an optimal scheduling model of an electricity–heat coupling system considering the coordinated clearing of nodal price. Before modeling, in order to ensure the solvability of the model and approximate the behavior of real market participants under the DC power flow framework, this paper makes the following assumptions:
  • The node price is generated by the DC optimal power flow, which can approximately reflect the marginal cost of the system and the state of network congestion but does not directly consider the complex game strategy of the participants.
  • The output strategy of the thermal power plant is optimized according to the node price, and the closed-loop iterative coordination is formed by injecting power feedback to the grid side.
  • All simplification and equivalence processes are carried out within the above assumptions to retain the main market signal characteristics and to simulate the improvement of bidding and scheduling behavior.
Under the premise of the above assumptions, this paper first establishes the node price clearing model of the electricity spot market and combines the thermal power plant-side scheduling model to realize the collaborative optimization of the market clearing results and the unit operation strategy through the price–power alternating iteration. By introducing the node injection power as the coupling variable, the electricity price signal can dynamically reflect the marginal cost of the system and the network congestion state after the participation of the thermal power plant, thereby improving the economic rationality and market consistency of the scheduling results.

2.1. Node Price Clearing Model of Spot Electricity Market

2.1.1. Market Clearing Mechanism Based on DC Optimal Power Flow

The primary goal of electricity spot market clearing is to optimize the allocation of power resources while ensuring adherence to the security constraints of the power grid and the operational requirements of power supply. The DC optimal power flow model has emerged as a widely adopted method for both day-ahead and real-time market clearing, due to its computational efficiency and strong engineering applicability. This section first addresses the uncertainty between the source and load through a data-driven model, followed by the development of a DC optimal power flow clearing model that incorporates CHP unit characteristics. The objective is to minimize power generation costs, while considering grid topology and operational constraints of equipment.
  • Objective function construction
Considering the time-varying and uncertain nature of load and renewable energy output, this paper utilizes the day-ahead forecast data as input for the market clearing model. The forecast data includes the system load curve, as well as wind power and photovoltaic output curves. Based on this data, a market clearing model is developed that accounts for network constraints and unit operation boundaries to determine the node price signal for each time period during typical days.
The market clearing model, leveraging the forecasted system load and renewable energy output, is designed to minimize the total power purchase cost of the system, with the objective function formulated as
min t = 1 T i = 1 N G C i ( P i , t ) + j = 1 N R C j r e s ( P j , t r e s )
where N G denotes the total number of conventional units; N R refers to the total number of new energy units; and P i , t is the active power output of the conventional unit i in the period t. C i represents its corresponding operating cost function. P j , t r e s indicates the active power output of the new energy unit j in the time period t, while C j r e s represents the cost associated with new energy generation.
2.
Expert system
The market clearing model operates under three primary sets of constraints: system balance constraints, operational constraints for units, and network security constraints.
  • (1)
    Power balance constraints of the system
i = 1 N G P i , t + j = 1 N R P j , t r e s = D t
where D t is the forecasted total load of the system for period t.
  • (2)
    Constraint of unit output
P i min P i , t P i max 0 P j , t r e s P j , t r e s , f o r e
  • (3)
    Ramp rate constraints
R i d o w n P i , t P i , t 1 R i u p
Among them, R i u p and R i d o w n are the up and down climbing rates of unit i , respectively.
  • (4)
    Network security constraints
According to the DC power flow model, the line power flow can be represented as a linear combination of the node injection powers.
F l max i = 1 N G G l i P i , t + j = 1 N R G l j P j , t r e s k = 1 N D G l k D k , t F l max
In this equation, F l max represents the maximum transmission capacity of line l , G l i indicates the power transfer distribution factor (PTDF) for unit i to line l , and D k , t is the load prediction value of the node k . N D is the total number of load nodes.

2.1.2. Generation of Node Marginal Price

The node marginal price refers to the minimum power generation cost added by the system when the new unit load demand is satisfied, and its generation is deeply coupled with the Lagrangian dual variable of market clearing. This section relies on the KKT conditions of the DC optimal power flow market clearing model.
For the market clearing optimization model constructed in Figure 1, its Lagrangian function can be constructed. According to the KKT optimality condition, the marginal price at node k during time period t can be expressed as
ρ k , t = λ t l = 1 N L ( μ l , t + μ l , t ) G l k
This expression outlines the breakdown of the node price: The first component corresponds to the energy portion of the system, indicating the marginal cost of power generation throughout the system. The second term represents the blocking component, whose value depends on the shadow price ( μ l , t + μ l , t ) of the blocking line and the power transfer distribution factor G l k from the node to the line, which is used to reflect the cost correction caused by the network transmission constraints.
The temporal and spatial distribution of electricity prices is influenced by the power structure, load distribution, grid topology, and unit operational characteristics, which directly inform the operation strategy of the thermal power plant. Specifically:
  • Energy price component
It is determined by the marginal cost of the marginal unit of the system. In scenarios with a high proportion of renewable energy, the component experiences significant fluctuations. For the centralized access area of cogeneration units studied in this paper, the strong coupling constraint of heat-determined power forced the units to be unable to participate in the power side regulation, and its higher marginal cost of power generation easily became the regional marginal cost, resulting in the continuous high energy price component in this area, which directly affected the electric energy income of the thermal power plant.
2.
Blocking price component
Caused by the network transmission limit. Due to the lack of regulation ability, thermal power plants will profoundly affect the formation and evolution of congestion. When the heating demand locks the power output of the CHP unit and makes it unable to respond to the grid dispatching command, the adjustment pressure brought by the source-load fluctuation will be transferred to other units, which will aggravate the line power flow fluctuation and congestion risk. Once the congestion occurs, the blocking component will further push up the electricity price of the node where the thermal power plant is located and deteriorate its economy.
The calculation of the congestion component of the nodal price depends on two key factors: the shadow price μ l of the blocked line and the sensitivity G l k of the node to the blocked line. In the DC power flow model, G l k represents the power transfer distribution factor, which signifies the change in power flow resulting from the unit injection power of node k onto line l.
When multiple lines are blocked at the same time, the blocking component of the node price is the superposition of the contribution of each blocked line:
ρ k c o n g = l L c o n g μ l G l k
where L c o n g is the set of blocked lines.
In the electricity–heat coupling system, the node price is not only affected by the supply and demand of the power system and the network constraints, but also deeply restricted by the scheduling strategy of the combined heat and power (CHP) unit. In this paper, by introducing the node injection power P n , t C H P of the thermal power plant as the coupling variable between the power grid and the unit, the blocking component in the node price can truly reflect the adjustment ability of the thermal power unit and its influence on the line power flow. The marginal price of node k in time period t can be expressed as
λ k , t = λ t energy + l L cong μ l , t P T D F k , l
where λ t energy is the overall energy price component of the system, which is determined by the marginal power generation cost of each unit; μ l , t is the shadow price of blocking line l, which reflects the economic value of transmission constraints of power grid; P T D F k , l is the power transfer distribution factor of node k to line l. Considering the electro-thermal coupling constraint of the thermoelectric unit, its electric output P i , t C H P satisfies
P _ i C H P ( H i , t ) P i , t C H P P ¯ i C H P ( H i , t )
where P _ i C H P ( H i , t ) and P ¯ i C H P ( H i , t ) are the upper and lower limits of the power output of the unit under the thermal output H i , t , respectively. If the rigid constraint of heat load is tight, the power output of CHP unit is limited, which makes it unable to contribute additional adjustment ability during high load period, thus increasing the burden of other units on blocking lines, and then pushing up the blocking component l L cong μ l , t P T D F k , l . In order to quantify the impact of unit scheduling on the blocking component, the node injection power P n , t C H P can be included in the blocking price expression:
μ l , t = f l i G P T D F i , l P i , t G + n N C H P P T D F n , l P n , t C H P D l
where f l ( ) is the Lagrange multiplier mapping function of line constraints, G is the traditional power supply set, N C H P is the thermal power plant access node set, and D l is the line load projection. The expression shows that when the thermal power plant changes P n , t C H P through heat storage or adjustment strategy, it can effectively change the line power flow distribution, thus affecting the blocking shadow price μ l , t , and then dynamically adjusting the node price λ k , t . At the same time, the charging and discharging behavior of the heat storage device provides cross-time flexibility, so that the thermoelectric unit can optimize the power output under different electricity price signals, thereby reducing the risk of critical line congestion and smoothing the electricity price fluctuation. In summary, by incorporating the power output of the thermoelectric unit and the node injection power into the market clearing model, the node price generation process can truly reflect the feedback effect of the thermal power plant scheduling on the system marginal cost and network constraints and realize the fine modeling and price–power two-way coordination of the electric–thermal coupling system.

2.1.3. Coordinated Clearing Mechanism of Power Grid-Thermal Power Plant Based on Node Injection Power Coupling

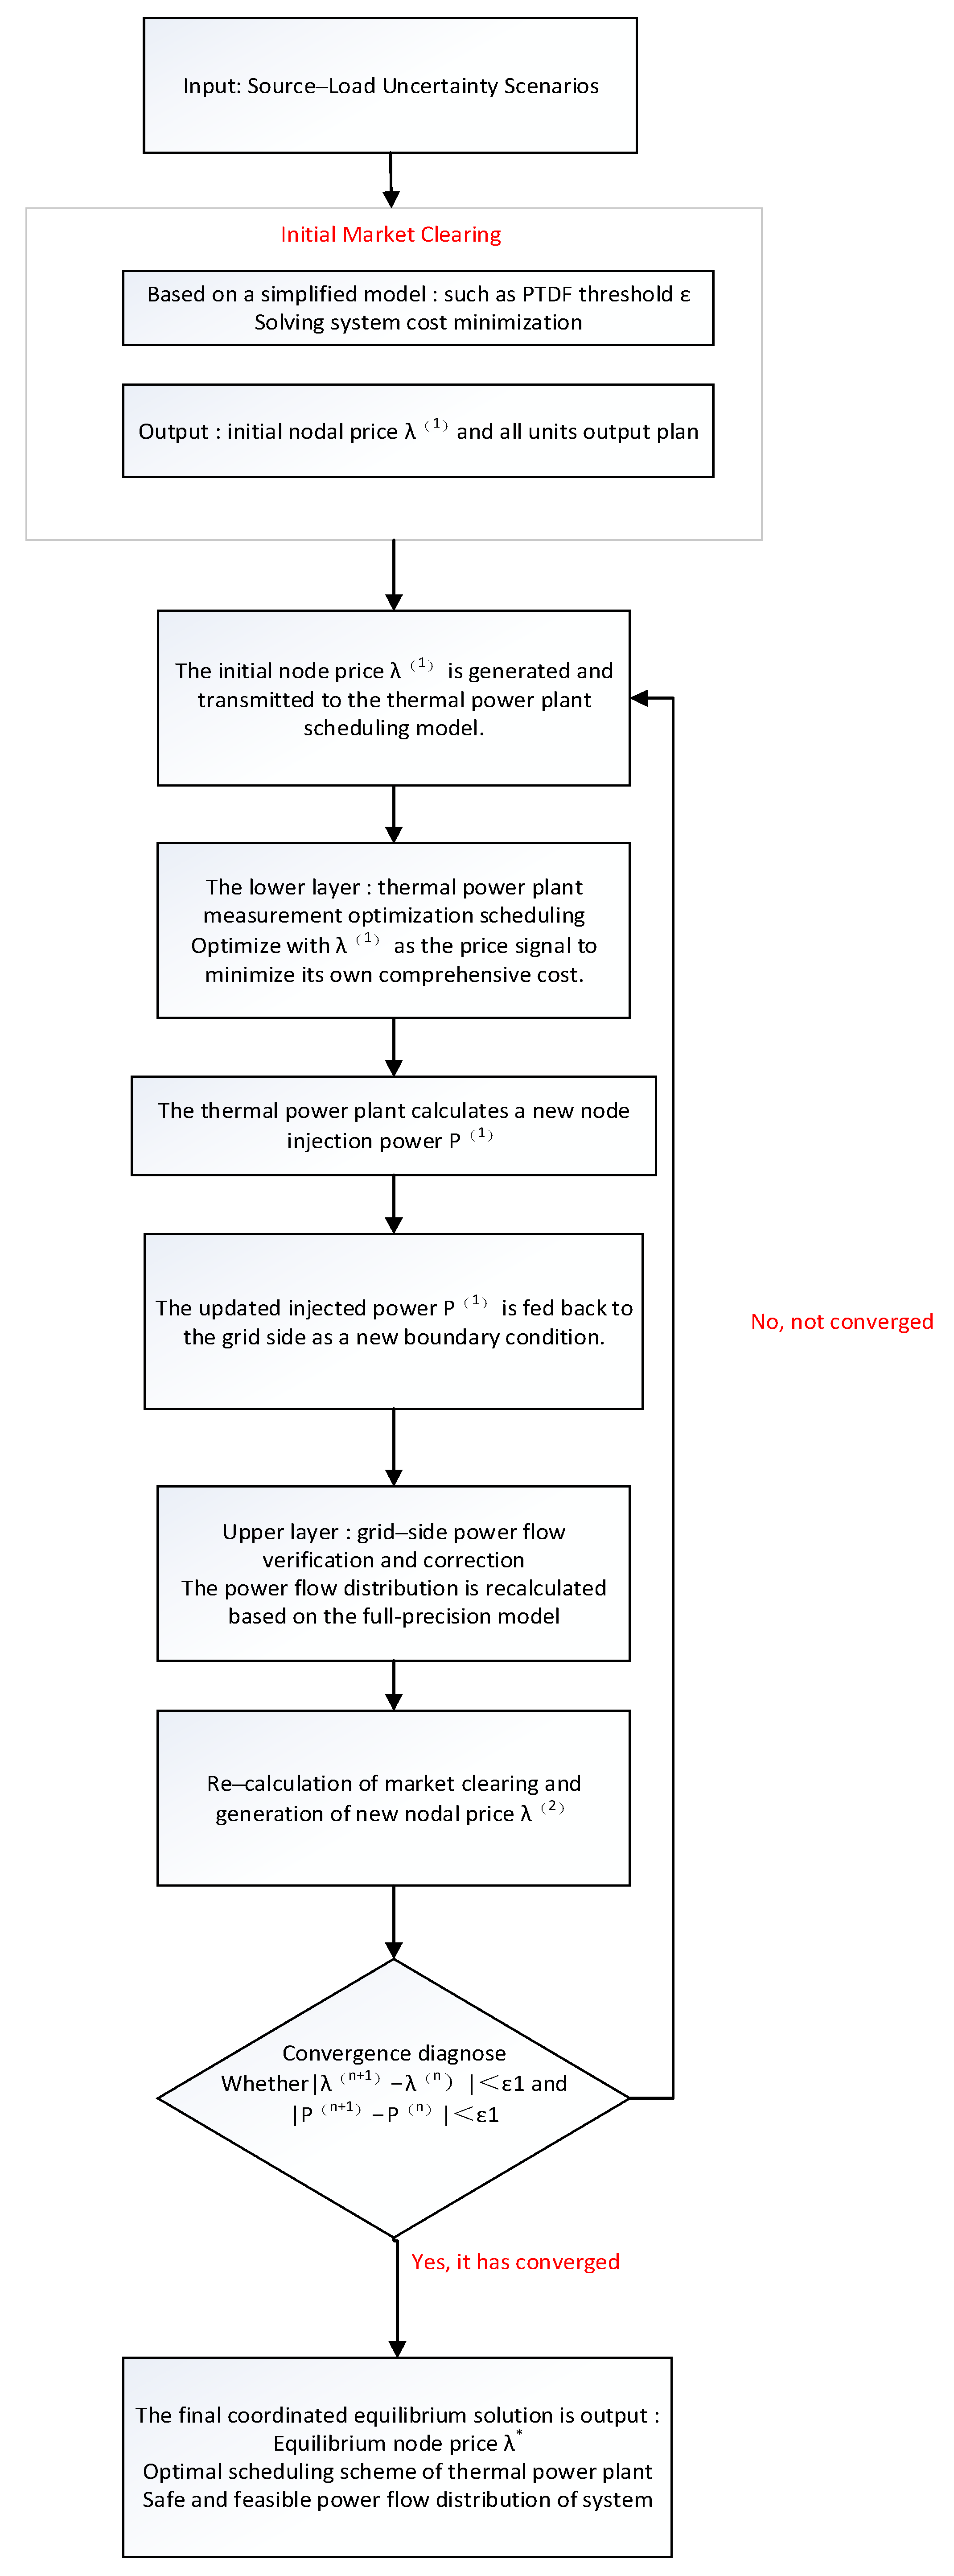
The traditional nodal price calculation regards the output of market players as a fixed parameter, while the heat storage thermal power plant studied in this paper will dynamically optimize its output strategy with the change in electricity price and, at the same time, change the power grid power flow and nodal price. Therefore, a dynamic collaborative correction and feedback mechanism is needed. The iterative framework constructed in this section is shown in Figure 2 below. The core is to use the node injection power of the thermal power plant as a key coupling variable to realize the two-way interaction between the grid-side clearing and the thermal power plant-side scheduling until equilibrium.
The iterative feedback mechanism shown above contains the following key steps:
  • Initial clearing and price signal generation
Based on the forecast data, the power grid dispatching center uses the simplified model to carry out the first market clearing and obtains the initial node price λ ( 1 ) of the whole network.
2.
Optimization decision-making of thermal power plant side
After receiving the initial electricity price signal λ ( 1 ) , the thermal power plant starts internal optimization. Utilizing the current electricity price, this model recalculates the optimal operational strategy, ensuring the fulfillment of the physical constraints related to electricity generation, heat load, and heat storage devices. The purpose is to minimize its own comprehensive cost and then calculate a set of new and most economical node injection power P ( 1 ) .
3.
Flow recalculation and grid-side correction
The thermal power plant feeds back the updated injection power P ( 1 ) to the grid side. The grid model takes this as a new boundary condition and uses a more accurate full-sensitivity model to recalculate the power flow distribution. This step is to verify and correct the power flow limit problem that may be caused by the initial simplified calculation and the change of the thermal power plant strategy.
4.
Re-clearing and iteration
Based on the revised grid security constraints, the market clearing model runs again, resulting in a new round of node price λ ( 2 ) . The new electricity price λ ( 2 ) reflects the actual congestion conditions and the marginal cost of the power grid following the thermal power plant’s adjustment.
5.
Convergence and equilibrium
The above steps are repeated to form closed-loop feedback of electricity price guiding thermal power plant decision-making → decision-making changing power-grid power flow → power flow updating reacting to electricity price. The variation in the nodal electricity price and the injection power of the thermal power plant node calculated by the iteration continues to the adjacent two times less than the preset convergence tolerance. At this time, the market clearing results on the grid side and the economic dispatching decisions on the thermal power plant side have reached a coordinated equilibrium. The final equilibrium price λ * represents the market signal that fully incorporates the flexible response behavior of the thermal power plant, while the scheduling strategy of the thermal power plant constitutes the globally optimal economic decision based on the equilibrium price.

2.2. Modeling and Low-Carbon Optimal Scheduling of Electro-Thermal Integrated Energy System

2.2.1. Key Unit Modeling of Electro-Thermal Integrated Energy System

  • Electro-thermal coupling modeling of cogeneration unit
Traditional extraction condensing or back-pressure cogeneration units face constraints due to the fixed demand for heating and exhibit a strong interdependence between electric and thermal outputs. The range of adjustable electric output is severely restricted, and there is minimal independent peak regulation capability in deep peak regulation scenarios. This limitation significantly hinders the unit’s ability to participate in spot market bidding and restricts the flexible adjustment of the power grid.
The linearized electro-thermal feasible region is used to describe the operation constraints of the CHP unit:
P e , min ( P h ) P e , t P e , max ( P h )
P h , min P h , t P h , max
In the formula, P e , t and P h , t represent the electrical and thermal outputs of the unit at time t, respectively. P e , max ( P h )   and P e , min ( P h ) denote the upper and lower bounds of electrical output for a specified thermal output, while P h , m i n and P h , m a x define the constraints related to heating load.
In the absence of heat storage configuration, the CHP unit is constrained by both the minimum technical output and the heating demand curve, which significantly restricts its down-regulation capacity on the power side.
P e , t P e , base + κ P h , t
In the formula, P e , base is the minimum output of pure condensation; κ is the electro-thermal coupling coefficient.
The unit operating cost and carbon emissions are expressed as
C t C H P = a P e , t 2 + b P e , t + c + d P h , t
E t C H P = μ f F fuel ( P e , t , P h , t )
In the equation, a, b, c, and d represent the cost coefficients, while μ f denotes the carbon emission factor.
2.
Heat storage device model
The integration of heat storage devices is essential for decoupling the interdependence between heat and electricity. This study considers a heat storage tank capable of both storing and releasing heat. Its mathematical model is composed of an energy conservation equation and equipment operation constraints.
The following equation represents the time-dependent state of the heat storage tank:
E t T E S = E t 1 T E S + ( η c h H t c h Q t d i s η d i s ) Δ t
In this context, E t T E S refers to the heat storage capacity at the end of period t.  H t c h and Q t d i s represent the charging and heat release power during the specified period, respectively. The parameters η c h and η d i s correspond to the charging and heat release efficiencies, respectively, while Δ t denotes the duration of the scheduling period.
The operation of the heat storage device must satisfy the following physical constraints:
  • (1)
    Capacity constraints
Heat storage should be kept within the allowable range to prevent overflow or excessive emptying.
E min T E S E t T E S E max T E S
  • (2)
    Power constraint:
The charging and discharging power shall not exceed its rated capacity and usually cannot be carried out at the same time.
0 Q t c h Q max c h . u t c h
0 Q t d i s Q max d i s . u t d i s
u t c h + u t d i s 1 ,   u t c h , u t d i s { 0 , 1 }
Among them, Q max c h and Q max d i s represent the maximum charging and discharging powers; u t c h and u t d i s denote the state of charge and discharge.
  • (3)
    Cycle balance constraint
To maintain the sustainability of the heat storage device’s daily adjustment capability, it is generally stipulated that the heat storage at the start and end of the scheduling period should be identical.
E 0 T E S = E T T E S
By optimizing the charging and discharging processes of the heat storage device, heat energy can be shifted over time. When both the power load and electricity price are high, the CHP unit prioritizes meeting power generation demands while minimizing heating output. In cases of insufficient heat load, the heat storage device compensates for the deficit; conversely, when electricity prices are low, the CHP unit can generate additional heat and store surplus energy. This process effectively extends the CHP unit’s capacity for regulating electric power.
3.
Power grid interaction constraint modeling
The thermal power plant interacts with the main power grid through the public connection point, which is a physical interface for responding to LMP signals and participating in market transactions.
  • (1)
    Electric power balance
P t C H P + P t r e s + P t g r i d = P t l o a d
Among them, P t g r i d represents the net power exchange between the plant and the power grid during the t period. P t r e s denotes the predicted output from wind, photovoltaic, and other renewable energy sources at the plant during the same period. Meanwhile, P t l o a d refers to the electrical demand of the factory during the t period.
  • (2)
    Thermal power balance
Q t C H P + Q t d i s Q t c h = Q t l o a d
Among them, Q t l o a d is the external heating load demand that must be met during the t period.
  • (3)
    Tie-line transmission capacity constraints
0 P g r i d P max g r i d
Among them, P max g r i d is the maximum transmitted power, and this constraint ensures that the interaction process meets the grid security requirements.

2.2.2. Low-Carbon Optimal Scheduling Model Considering Node Price Coordination

In this paper, under the collaborative optimization framework established in the first chapter, the above equipment model is integrated to construct a specific optimization model of the lower thermal power plant scheduling layer. The model aims to coordinate the interaction among CHP units, heat storage devices, and the power grid, guided by dynamic LMP signals, with the objective of minimizing the overall daily operational costs of thermal power plants.
  • Construct the objective function
In this section, the function is constructed with the objective of minimizing the comprehensive cost, considering factors such as electricity market revenue, unit operation cost, deep peak shaving cost, and carbon emission cost in an integrated manner, aiming to achieve the coordinated optimization of economy and low carbon. The objective function can be expressed as
min F = C o p + C d e e p + C c a r b o n R e n e r g y
Among them, C o p represents the conventional operating cost of the system, C d e e p denotes the deep peak shaving cost, C c a r b o n refers to the carbon emission cost, and R e n e r g y is the electricity market revenue.
  • (1)
    Electricity energy gain
Under the nodal price system, the profit depends on the actual network power P i , n g r i d ( t ) of the unit at node n and the marginal price λ L M P , n ( t ) of the node at the time period t of the node. It is composed of components such as the system power price and the congestion price and is deeply affected by the shadow price of various constraints, including the operation constraints of the CHP unit.
R e n e r g y = t = 1 T i Ω C H P λ L M P , n ( t ) P i , n g r i d ( t ) Δ t
Among them, T represents the total number of scheduling periods, Ω C H P denotes the set of CHP units within the thermal power plant, and Δ t is the length of the period.
  • (2)
    System operation cost
The operating cost of the system is primarily composed of the CHP unit’s operating cost, heat replenishment expenses, penalties for curtailing wind and solar power, and the costs associated with the heat storage cycle, as represented by the following expression:
C op = C CHP + C heat + C curt + C storage
  • (3)
    Deep peak regulation cost
When the CHP unit operates below the conventional minimum stable output in order to meet the demand of new energy consumption or system peak shaving, but it is still within the allowable deep peak shaving range, additional operating losses and efficiency degradation costs will be generated.
C d e e p = t = 1 T i Ω C H P c i d e e p max ( 0 , P i m i n P i e l e ( t ) )
In the formula, P i e l e ( t ) is the actual power output of CHP unit i in t period, P i m i n is its technical minimum power output, and c i d e e p is the deep peaking cost coefficient of unit i.
  • (4)
    Carbon emissions cost
To facilitate low-carbon operation, the carbon emission cost is integrated into the objective function. Carbon emissions are mainly derived from fossil fuels consumed by CHP unit power generation. The cost can be calculated as
C c a r b o n = t = 1 i Ω C H P τ ( e i e l e P i e l e ( t ) + e i h e a t H i C H P ( t ) ) Δ t
where τ is the price of unit carbon emissions; e i e l e and e i h e a t are the standard coal consumption carbon emission intensity of unit i for power generation and heating respectively; and H i C H P ( t ) is the thermal output of unit i in t period.
2.
System operation constraints
The optimization model’s constraints encompass equipment operation constraints, along with the following critical constraints related to market interactions and system operation:
  • (1)
    Interactive power constraint between thermal power plant and power grid
P i , n g r i d ( t ) = P i e l e ( t ) P i a u x ( t )
Among them, P i a u x ( t ) is the auxiliary power consumption in the factory, which is regarded as a fixed value or a small proportional coefficient.
  • (2)
    Node price endogenous decision constraint
The nodal price λ L M P , n ( t ) is not an exogenous parameter but is calculated by the equilibrium constraint multiplier and the network constraint multiplier in the KKT condition after the system-level optimal power flow model, including all unit outputs, is cleared:
λ L M P , n ( t ) = λ t e n e r g y + L c o n g μ l , t P T D F l , n
In the formula, λ L M P , n ( t ) is the marginal price of the node n at time t; λ t e n e r g y is the system energy component price; μ l , t is the blocking shadow price of line l; and P T D F l , n is the power transfer distribution factor of node n to line l.
  • (3)
    Power Balance Constraints of the System
The system must ensure a balance between power supply and demand during each scheduling interval. The total output from all power sources within the thermal power plant should meet its internal power load demand, with any surplus power transmitted to the main power grid, regardless of the power purchase mode from the grid.
P t C H P + P t w i n d + P t s o l a r = P t l o a d + P i , n g r i d ( t )
In the formula, P t C H P represents the power output of the cogeneration unit; P t w i n d and P t s o l a r denote the predicted power outputs of wind and photovoltaic energy within the plant; P t l o a d is the electrical load demand of the system; and P i , n g r i d ( t ) indicates the interactive power with the power grid.
  • (4)
    System thermal power balance constraint
The thermal power system must maintain supply and demand balance. The heat load requirement is fulfilled by the cogeneration unit’s heat output and the charging and discharging operations of the heat storage device, while accounting for heat losses during the transmission in the heat network.
Q t C H P + Q t d i s Q t c h Q t l o s s = Q t l o a d
In the formula, Q t C H P is the heat supply of the cogeneration unit; Q t c h and Q t d i s are the heat charging and discharging power of the heat storage device respectively; Q t l o a d is the heat load demand of the system; and Q t l o s s is the heat loss of heat network transmission.
  • (5)
    The mutual exclusion constraint of heat storage and heat release
To ensure the physical operation logic of the heat storage device is valid, only one operation—either charging or discharging—can occur at any given time, and both processes cannot be performed simultaneously.
Q t c h Q t d i s = 0
  • (6)
    Upper and lower limit constraints of CHP unit output
The power and heat output of the cogeneration unit must be within the rated operating range of the equipment and must not exceed the minimum technical output and maximum capacity limit.
P min C H P P t C H P P max C H P Q min C H P Q t C H P Q max C H P
  • (7)
    Climbing rate constraint of unit
To ensure the stable operation of the unit and the safety of the power grid, the variation in the unit’s power output between adjacent periods must not exceed the allowable ramp-up and ramp-down rate limits.
r d P t C H P P t 1 C H P r u
In the formula, r u and r d are the limit values of the upward climbing and downward landslide rate of the cogeneration unit, respectively.
  • (8)
    Operation constraints of heat storage device
The thermal storage device must satisfy the heat storage capacity limits, maintain the dynamic balance between heat charging and discharging, and ensure consistency between the initial and final heat storage levels within a scheduling cycle to enable the smooth operation of the daily cycle.
0 Q t c h Q max c h 0 Q t d i s Q max d i s E min E t E max E t = E t 1 + η ch Q t c h Δ t Q t d i s Δ t η dis E 0 = E 24
In the formula, E t is the heat storage capacity of the heat storage device; η ch and η dis are the efficiency of heat charging and heat releasing respectively; and E 0 and E 24 are the heat storage at the beginning and end of the scheduling period.
  • (9)
    Transmission capacity constraint of power grid tie line
The power exchange between the thermal power plant and the main power grid must adhere to the transmission capacity limits of the tie line to avoid overloading, thereby safeguarding the secure operation of the power grid.
P min g r i d P i , n g r i d ( t ) P max g r i d
In the formula, P min g r i d and P max g r i d denote the minimum and maximum permissible transmission power of the tie line, respectively.
3.
Collaborative optimization solution framework
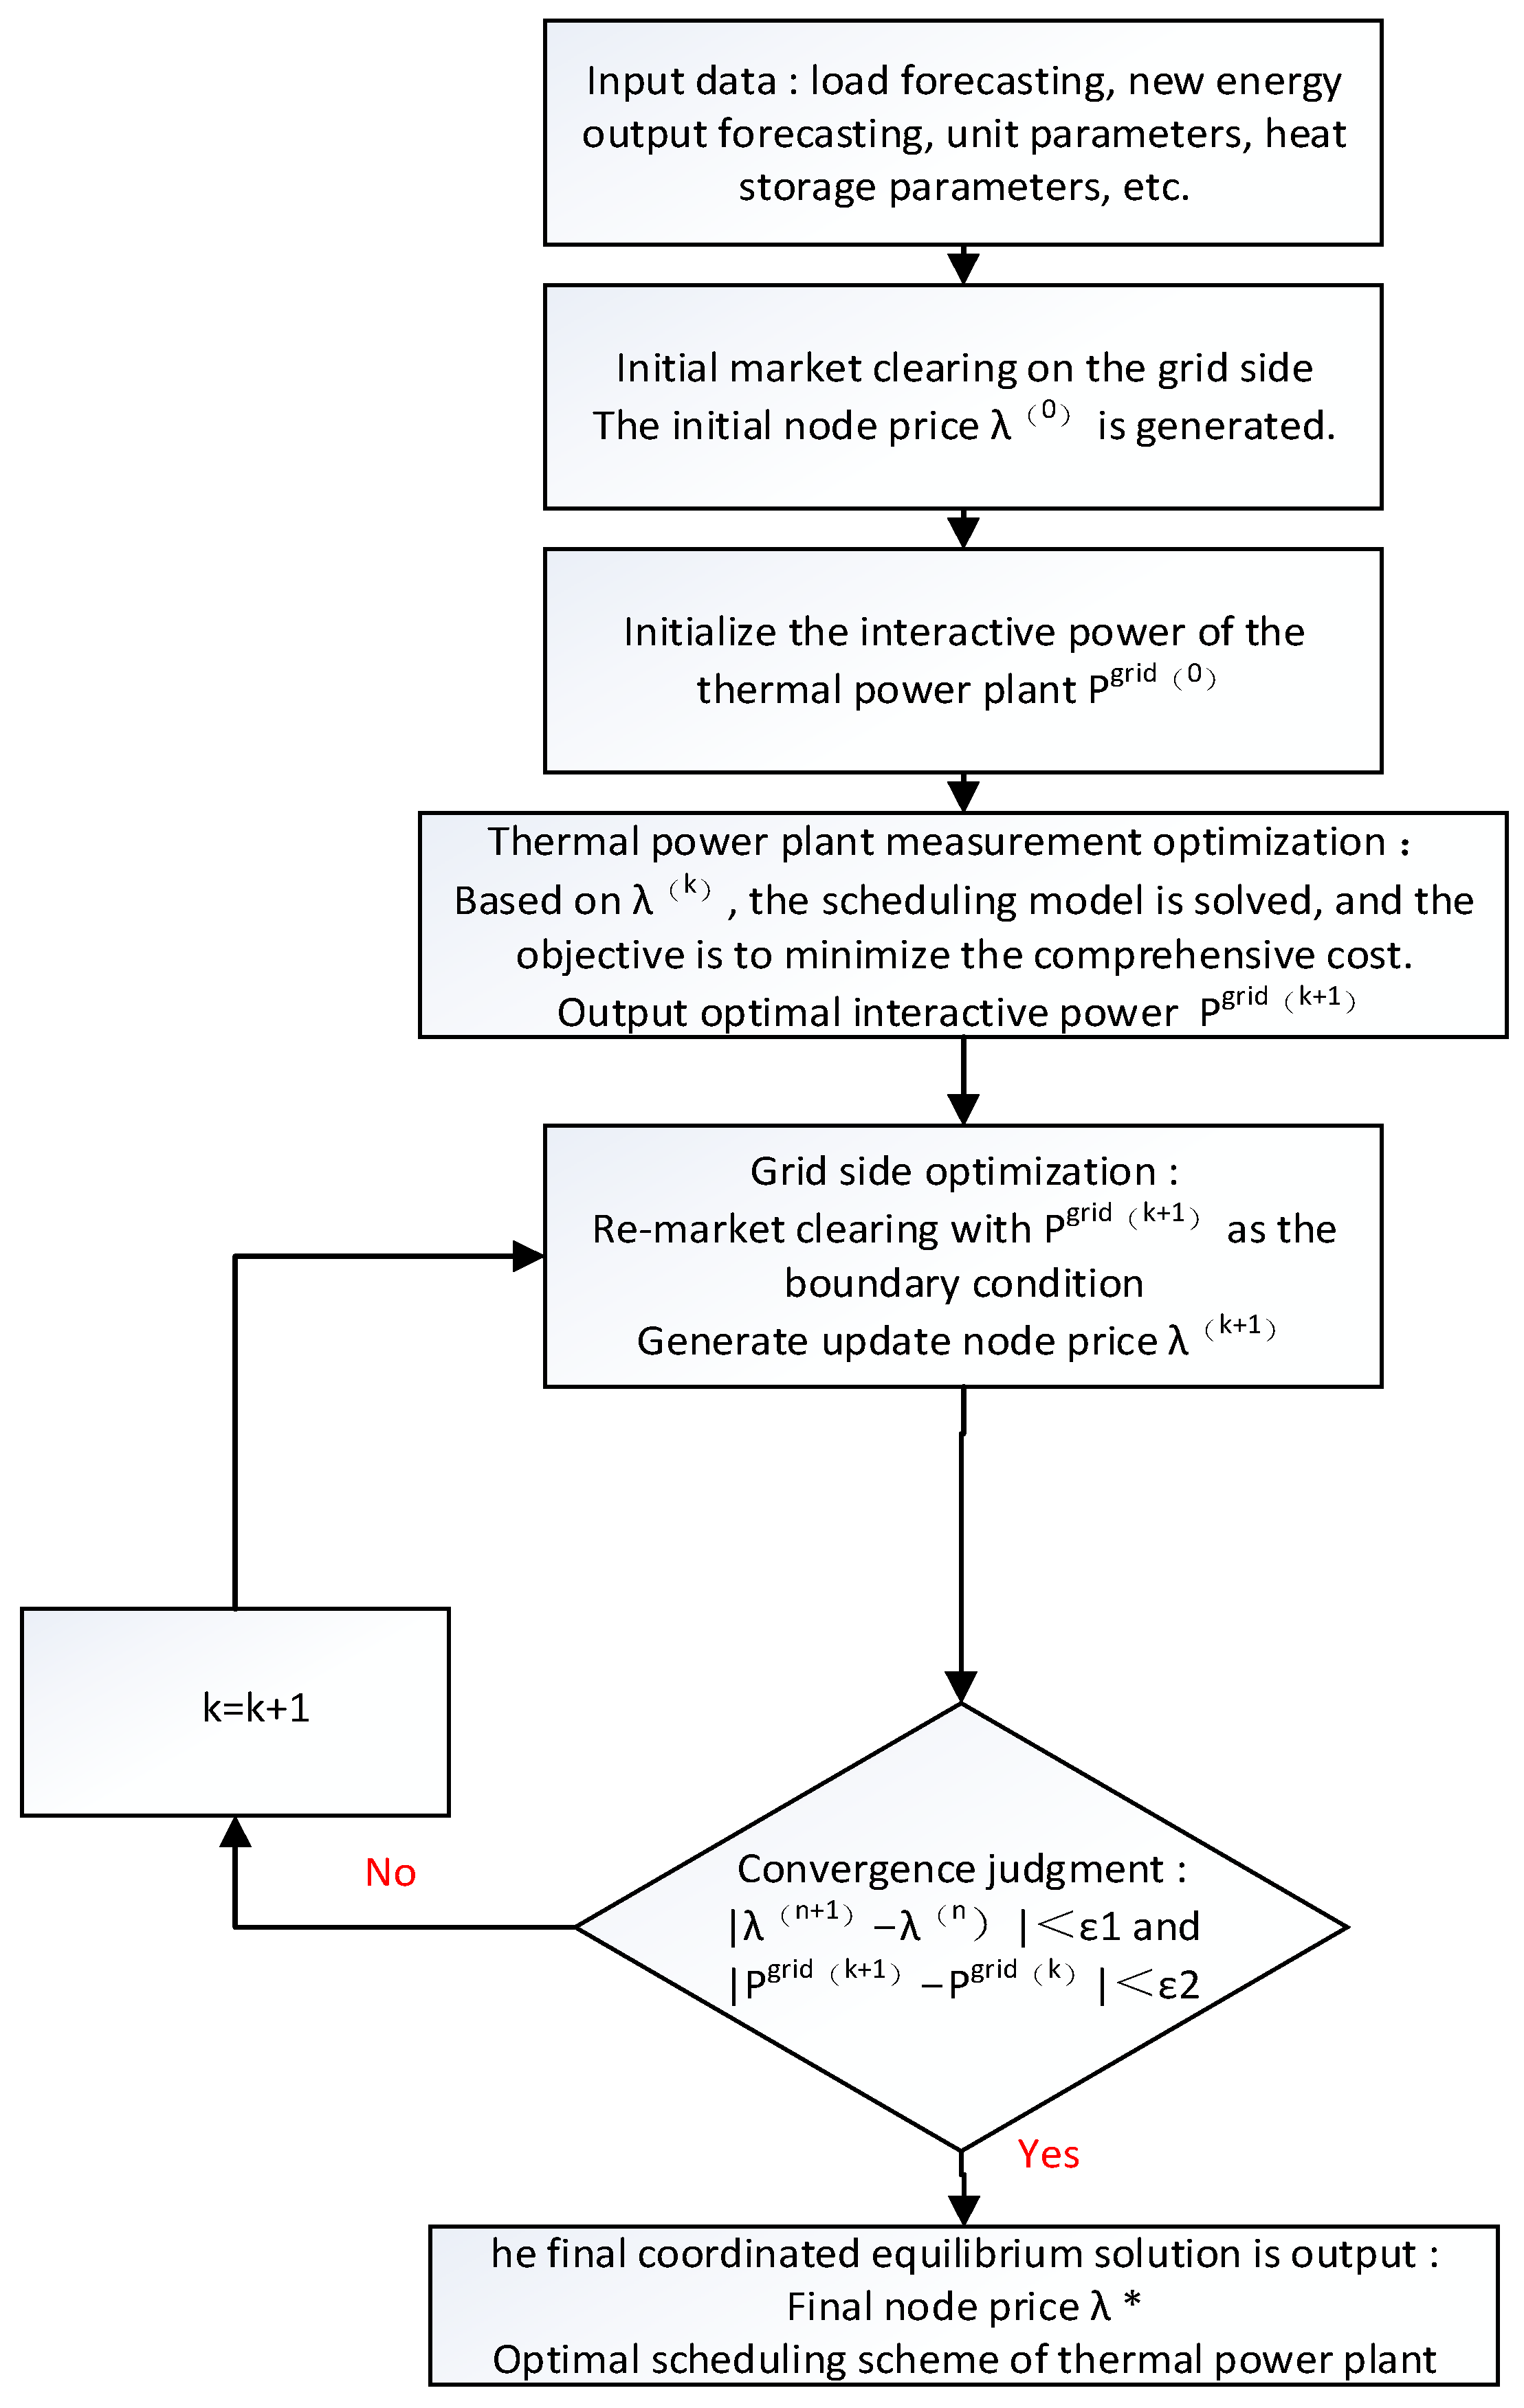
The core innovation of the method proposed in this paper is to break through the limitation that the nodal price is regarded as a fixed parameter in traditional research and to construct a closed-loop optimization framework of two-way interaction and co-evolution between the grid side and the thermal power plant side. The framework aims to simulate the real dynamic process in which price and power decisions interact with each other and eventually reach equilibrium in the electricity spot market. The logic and process of the whole framework are shown in Figure 3.
The upper layer of the model represents the market clearing model on the grid side, aiming to minimize the system’s power purchase cost while being subject to system power balance and network security constraints, which are necessary to derive the node marginal price. The lower layer corresponds to the scheduling model of the thermal power plant side. In this layer, unit output and heat storage charging/discharging strategies are optimized to minimize overall operating costs, subject to the constraints of thermoelectric coupling and heat storage operations. The upper and lower layers are linked via the injection power from the thermal power plant’s access node: the upper layer price signal directs decisions in the lower layer, while the injection power from the lower layer influences the upper layer price.
To address the coupling issue between the grid-side market clearing and the thermal power plant-side scheduling, this paper presents a collaborative iterative solution framework that alternates between price and power updates. This framework enables the gradual coordination of the two subproblems by transmitting the node price and the injection power from the access node between the grid side and the thermal power plant side, achieving coordinated equilibrium. The detailed solution process is as follows:
Step 1: Initialize the iteration count k = 0 and determine the initial node price λ ( 0 ) by performing the initial market clearing based on forecasted data from the grid side. Additionally, initialize the interactive power P g r i d ( 0 ) of the thermal power plant.
Step 2: The thermal power plant receives the node price λ ( k ) transmitted by the grid side, solves the lower-level scheduling model, and obtains the optimal interactive power P g r i d ( k + 1 ) and internal operation plan.
Step 3: Taking the updated interactive power P g r i d ( k + 1 ) of the thermal power plant as the boundary condition, the grid side re-clears the market and generates a new nodal price λ ( k + 1 ) .
Step 4: Check whether the node price and interactive power changes of the two adjacent iterations meet the convergence conditions:
λ ( k + 1 ) λ ( k ) ε 1
P grid ( k + 1 ) P grid ( k ) ε 2
ε 1 and ε 2 are preset convergence tolerances. If the condition is met, the iteration is stopped, and the cooperative equalization result is produced. Otherwise, let k = k + 1, then return to continue the iteration.

3. Results

3.1. Test System and Parameter Setting

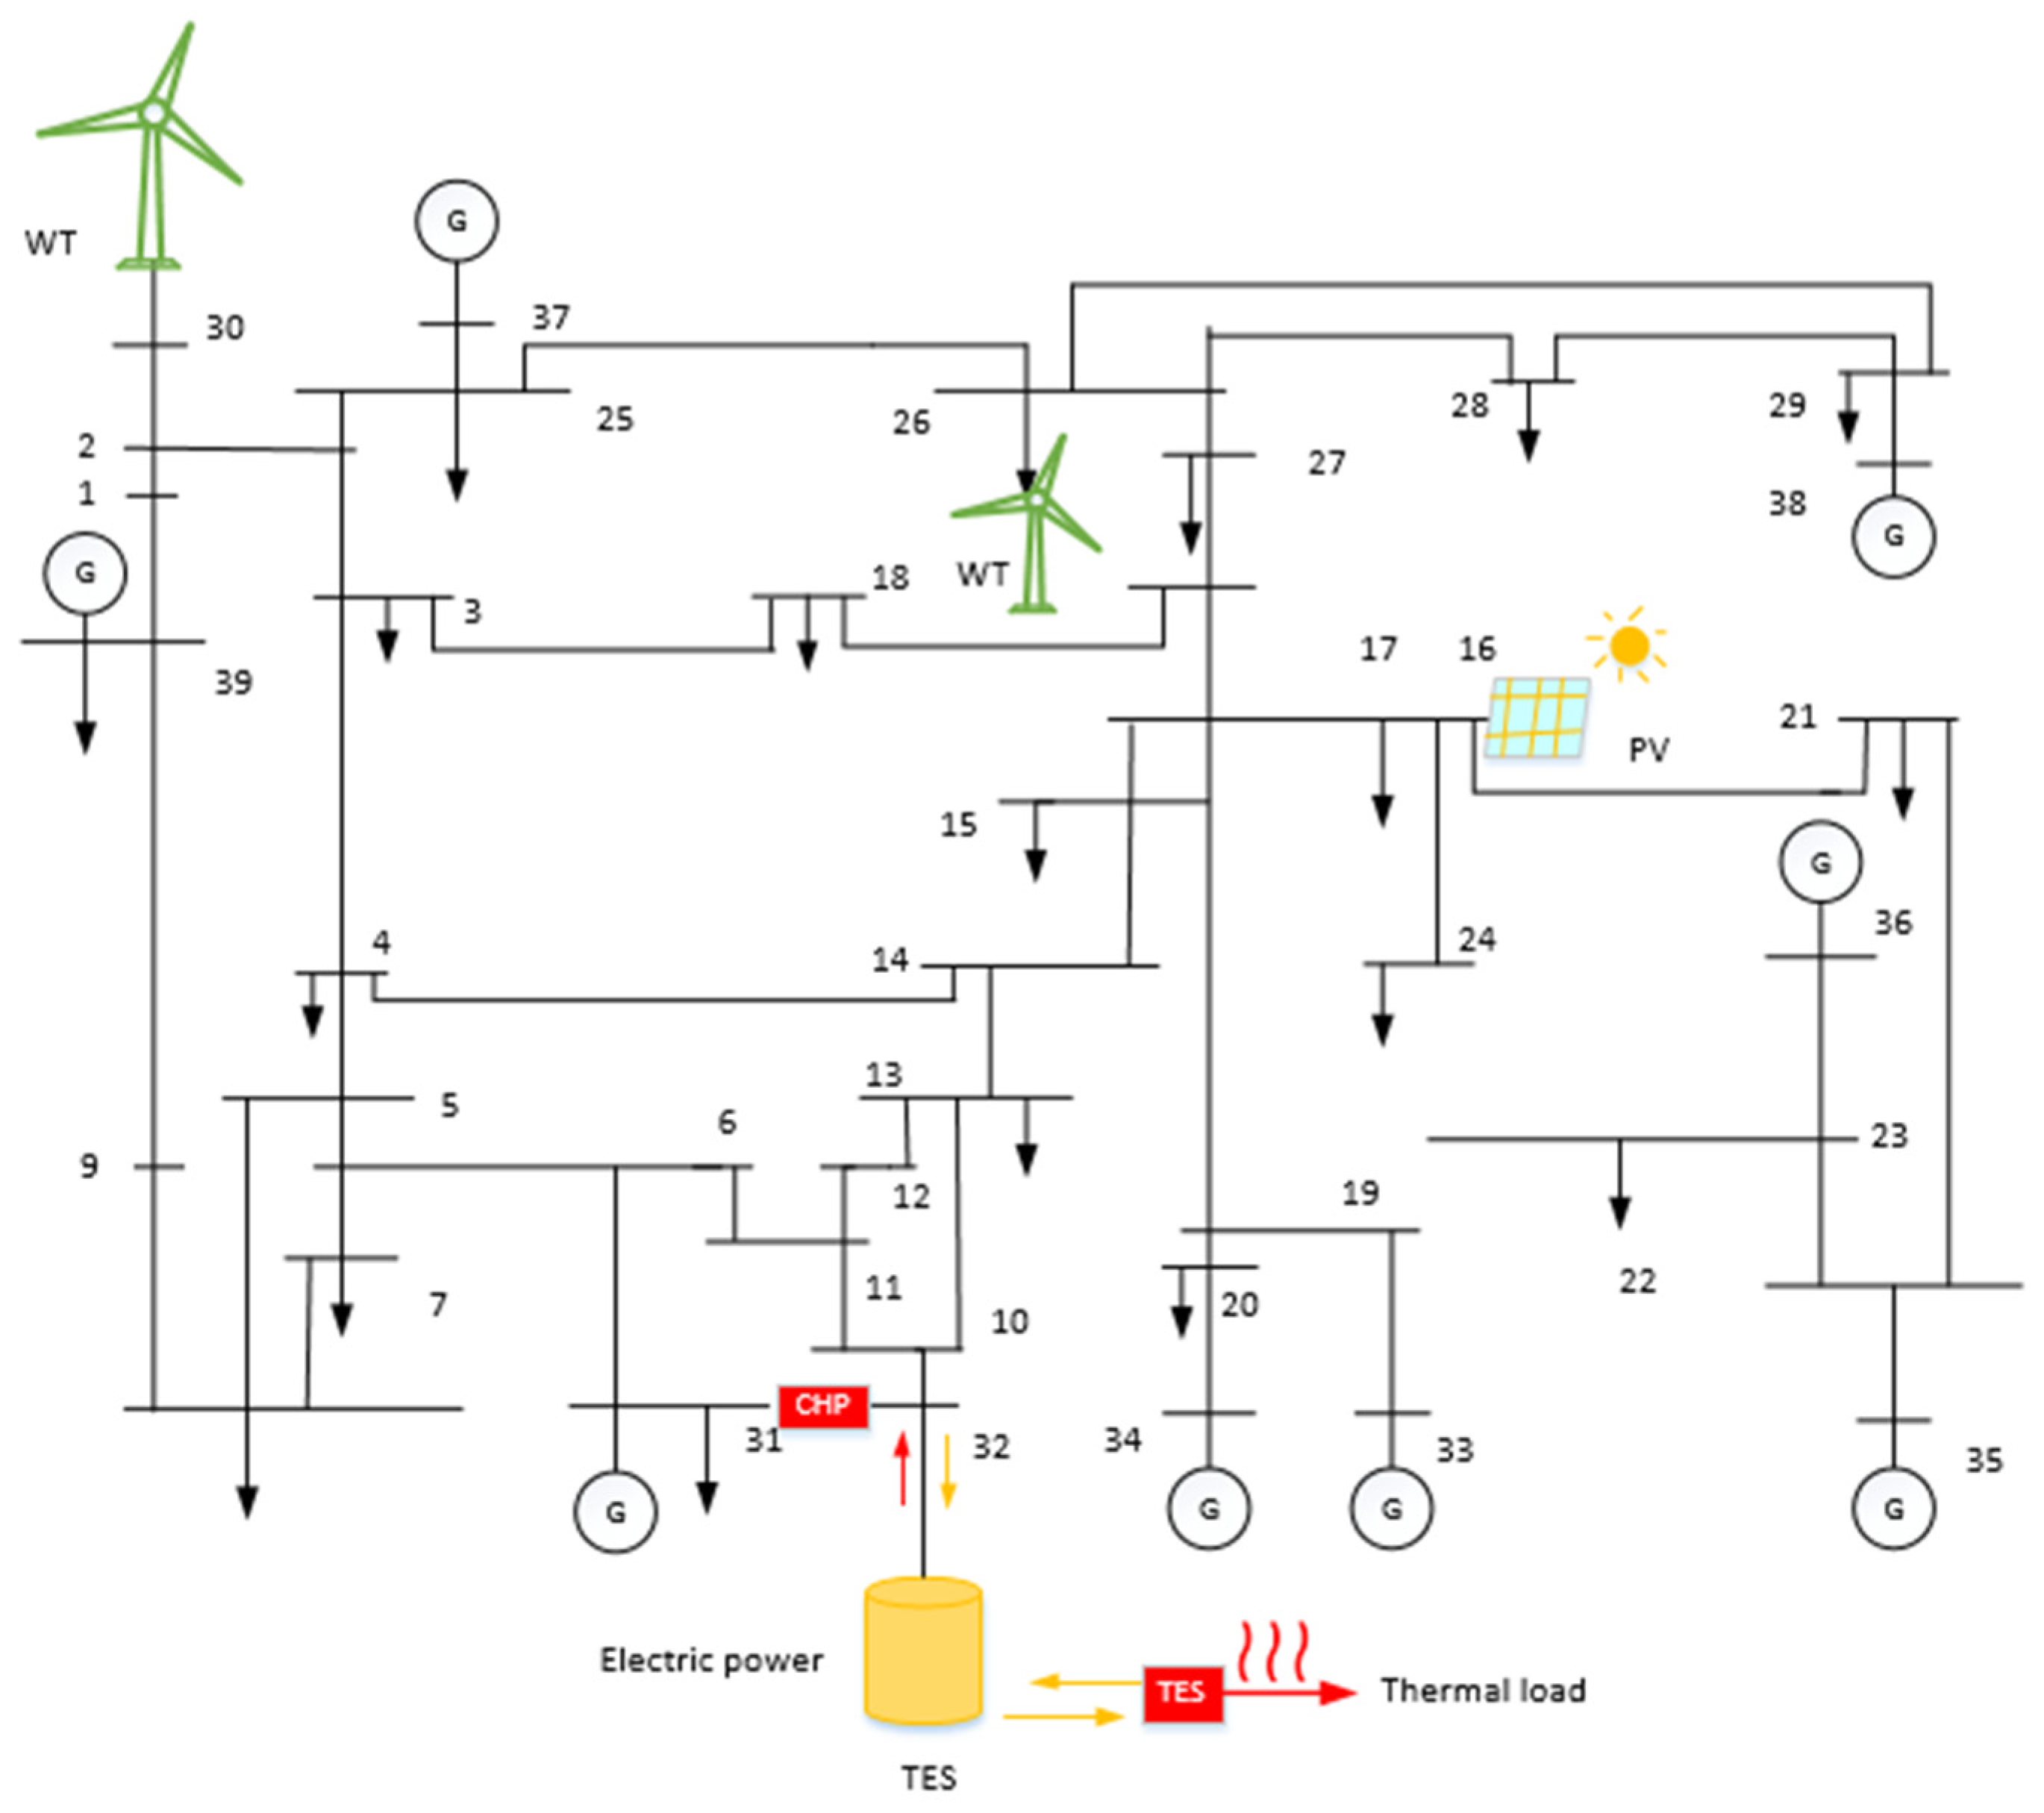
To verify the effectiveness and advanced nature of the low-carbon optimization scheduling method for integrated electricity–heat energy systems with thermal power plant thermal storage–which considers coordinated clearing of node electricity prices–proposed in this paper, this study introduces cogeneration units and thermal storage devices into the standard IEEE 39–node system to construct an electricity–heat coupled integrated energy system (as shown in Figure 4). Node 32 is selected as the connection point for the thermal power plant. By coupling the power injected at the node with the grid-side optimal power flow model, the study achieves coordinated optimization of node electricity prices and unit output. The main equipment and system parameters used in this study are shown in Table 1, while typical daily load and renewable energy output data are presented in Table 2. Additionally, photovoltaic and wind power sources are connected at some nodes to simulate scenarios with high renewable energy penetration, thereby verifying the effectiveness of the proposed method under complex operating conditions.

3.2. Scene Setting

To evaluate the effectiveness of the low-carbon optimal scheduling method for the electric–thermal integrated energy system of heat storage-based thermal power plants, considering the coordinated clearing of node electricity prices, three comparison scenarios are defined based on the model’s characteristics.

3.2.1. Scenario 1: Baseline Scenario Without Heat Storage and Coordination

In this scenario, the thermal power plant lacks a heat storage device, and the node price is introduced as an exogenous parameter in the lower-level scheduling model. The cogeneration unit solely carries out conventional output scheduling while ensuring the heating load constraint is met, without incorporating the feedback adjustment of the thermal power plant’s output to the node price. This scenario aims to characterize the fundamental operating characteristics of the system under the conventional ‘heat-determined power’ operating mode.

3.2.2. Scenario 2: Configure Heat Storage, but Do Not Consider the Coordinated Correction Scenario of Node Price

In this scenario, the heat storage device is incorporated to assist in maintaining the thermal power balance, with the electro-thermal coupling constraint of the cogeneration unit being alleviated through heat storage and heat release, thereby enhancing the unit’s regulation capacity. However, the nodal electricity price is treated as an exogenous parameter, and the feedback influence of changes in the thermal power plant’s nodal injection power on the market clearing outcome is not taken into account. This scenario is primarily employed to examine the effect of the heat storage device on improving electro-thermal decoupling and operational flexibility.

3.2.3. Scenario 3: Configure Heat Storage and Consider the Coordinated Clearing Scenario of Node Price

This scenario describes the approach presented in this paper, where the upper grid side employs the DC optimal power flow method to clear the market and establish the node price. On the thermal power plant side, the CHP unit, heat storage device, and grid interaction power are optimized according to the node price. The thermal power plant’s node injection power is fed back into the upper clearing model, with the node price being adjusted iteratively until the price and injection power from two consecutive iterations converge. This scenario is used to evaluate the proposed method’s effectiveness in terms of economic efficiency, flexibility, and carbon reduction.

3.3. Analysis of Simulation Results

3.3.1. Analysis of Node Price Collaborative Correction Results

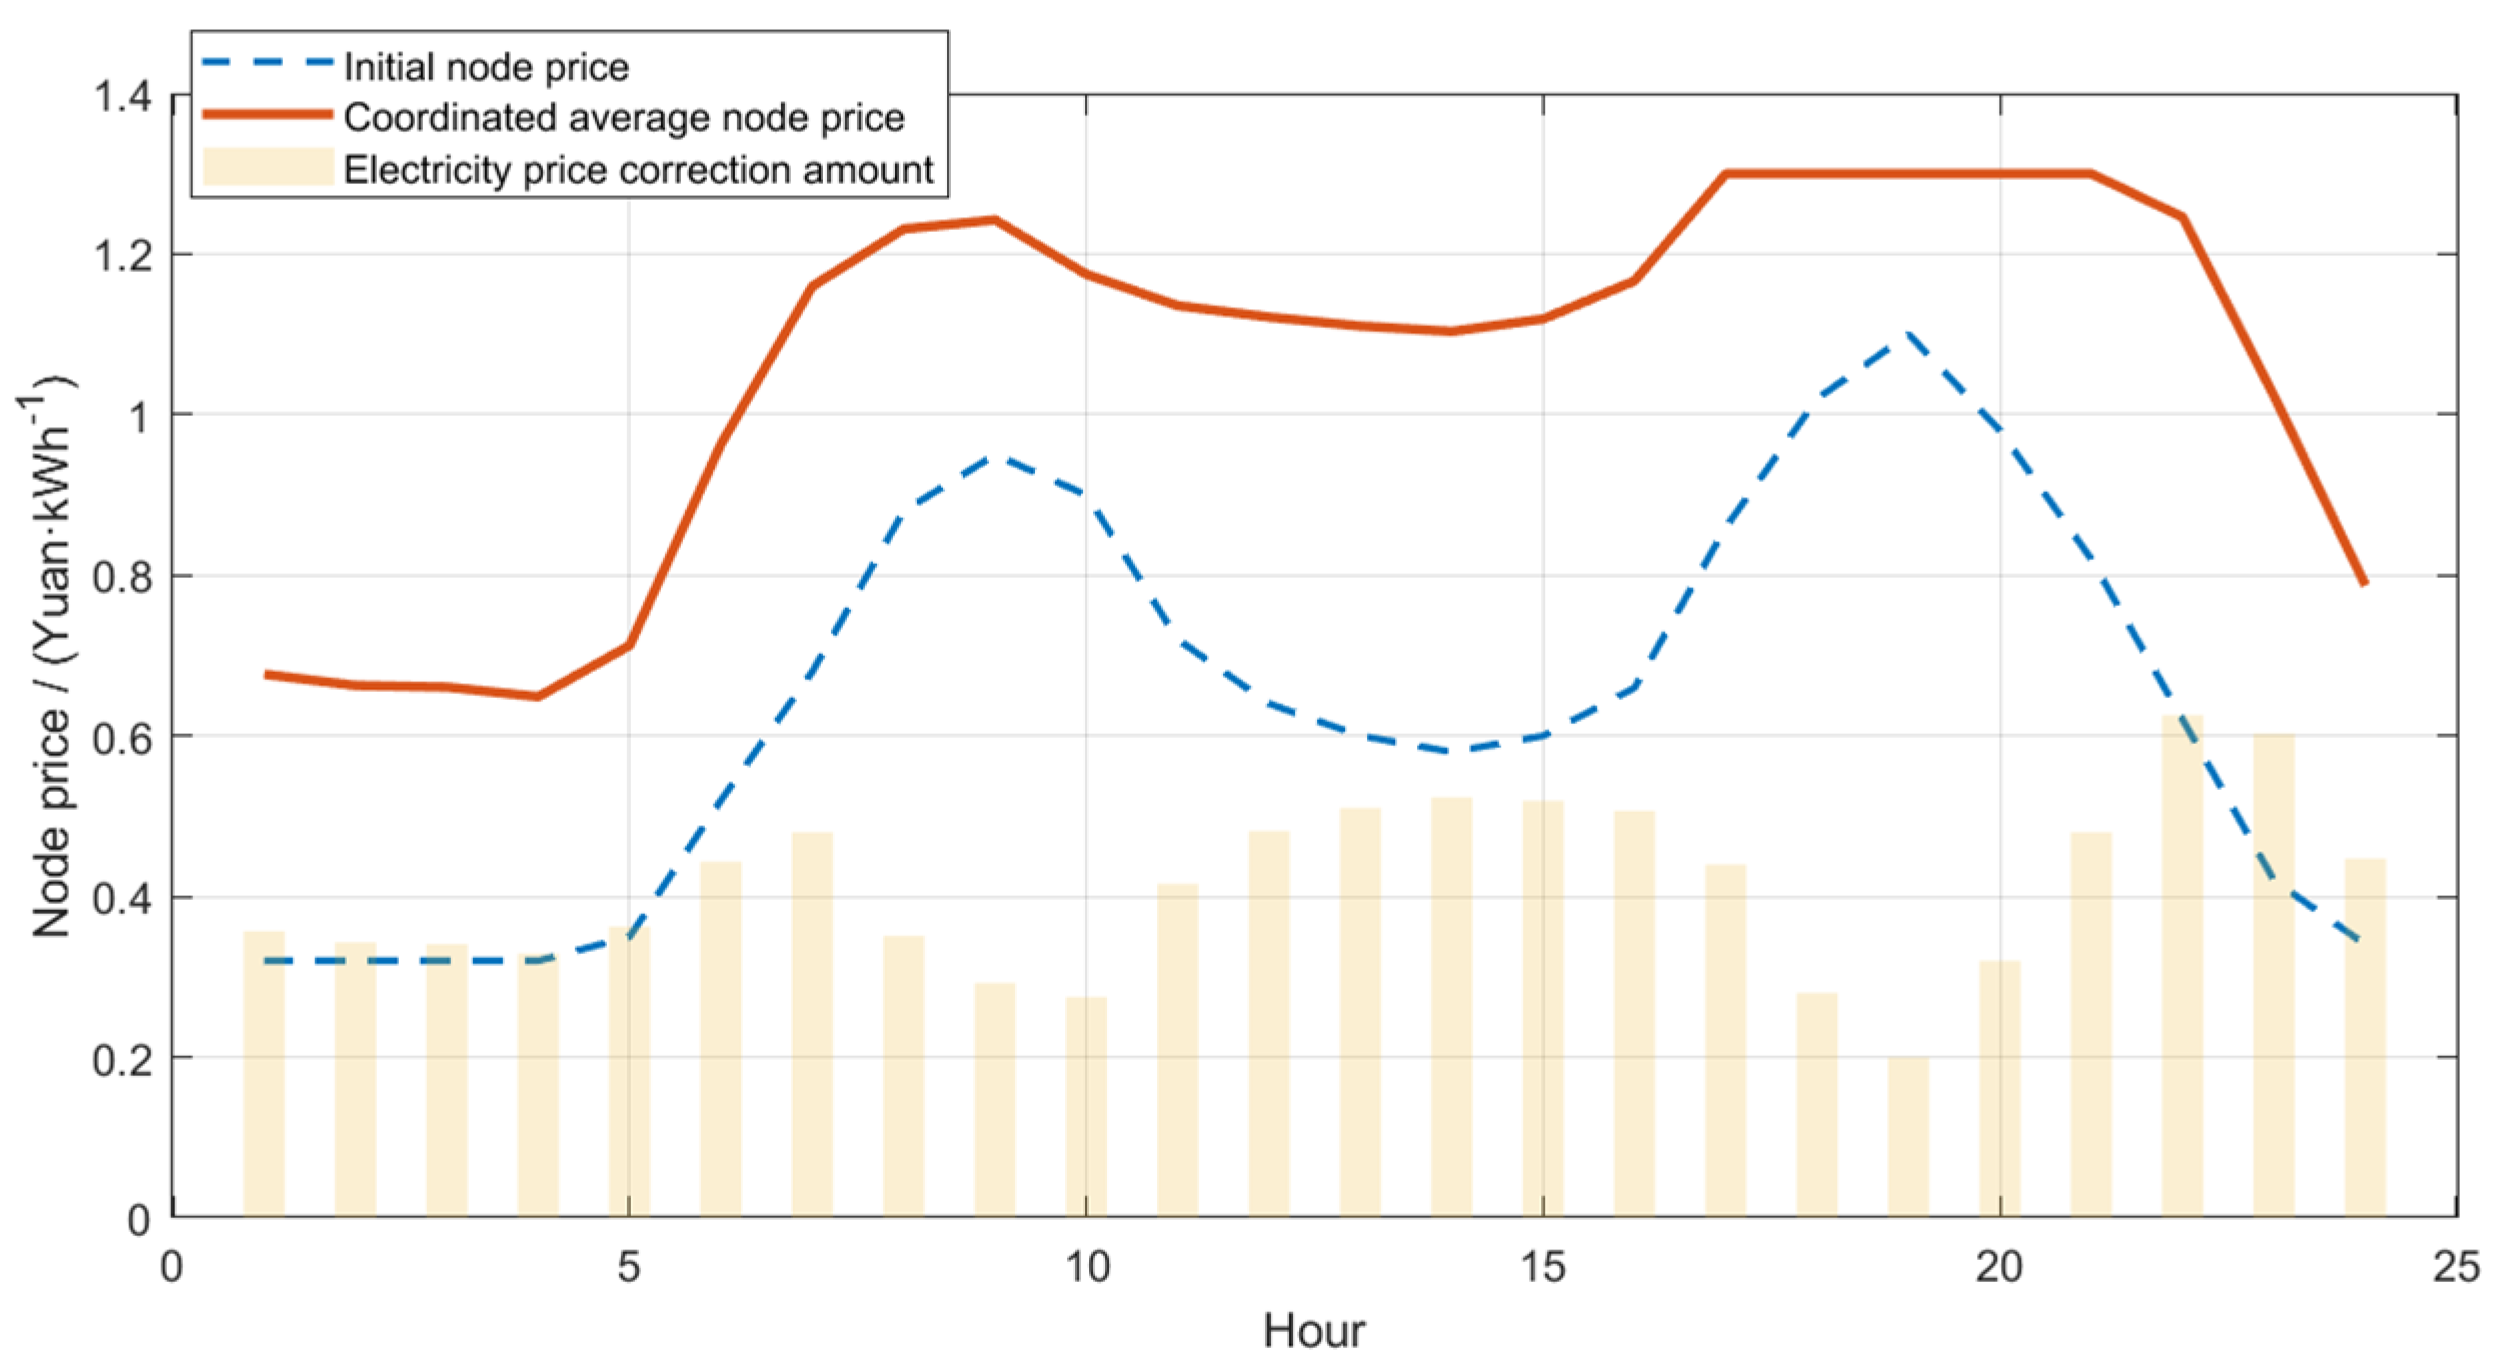
In order to fully describe the formation mechanism and correction effect of the nodal price in the electric–thermal coupling system, Figure 5 and Figure 6 jointly analyze the nodal price from the perspectives of spatial and temporal distribution characteristics and collaborative optimization comparison results.
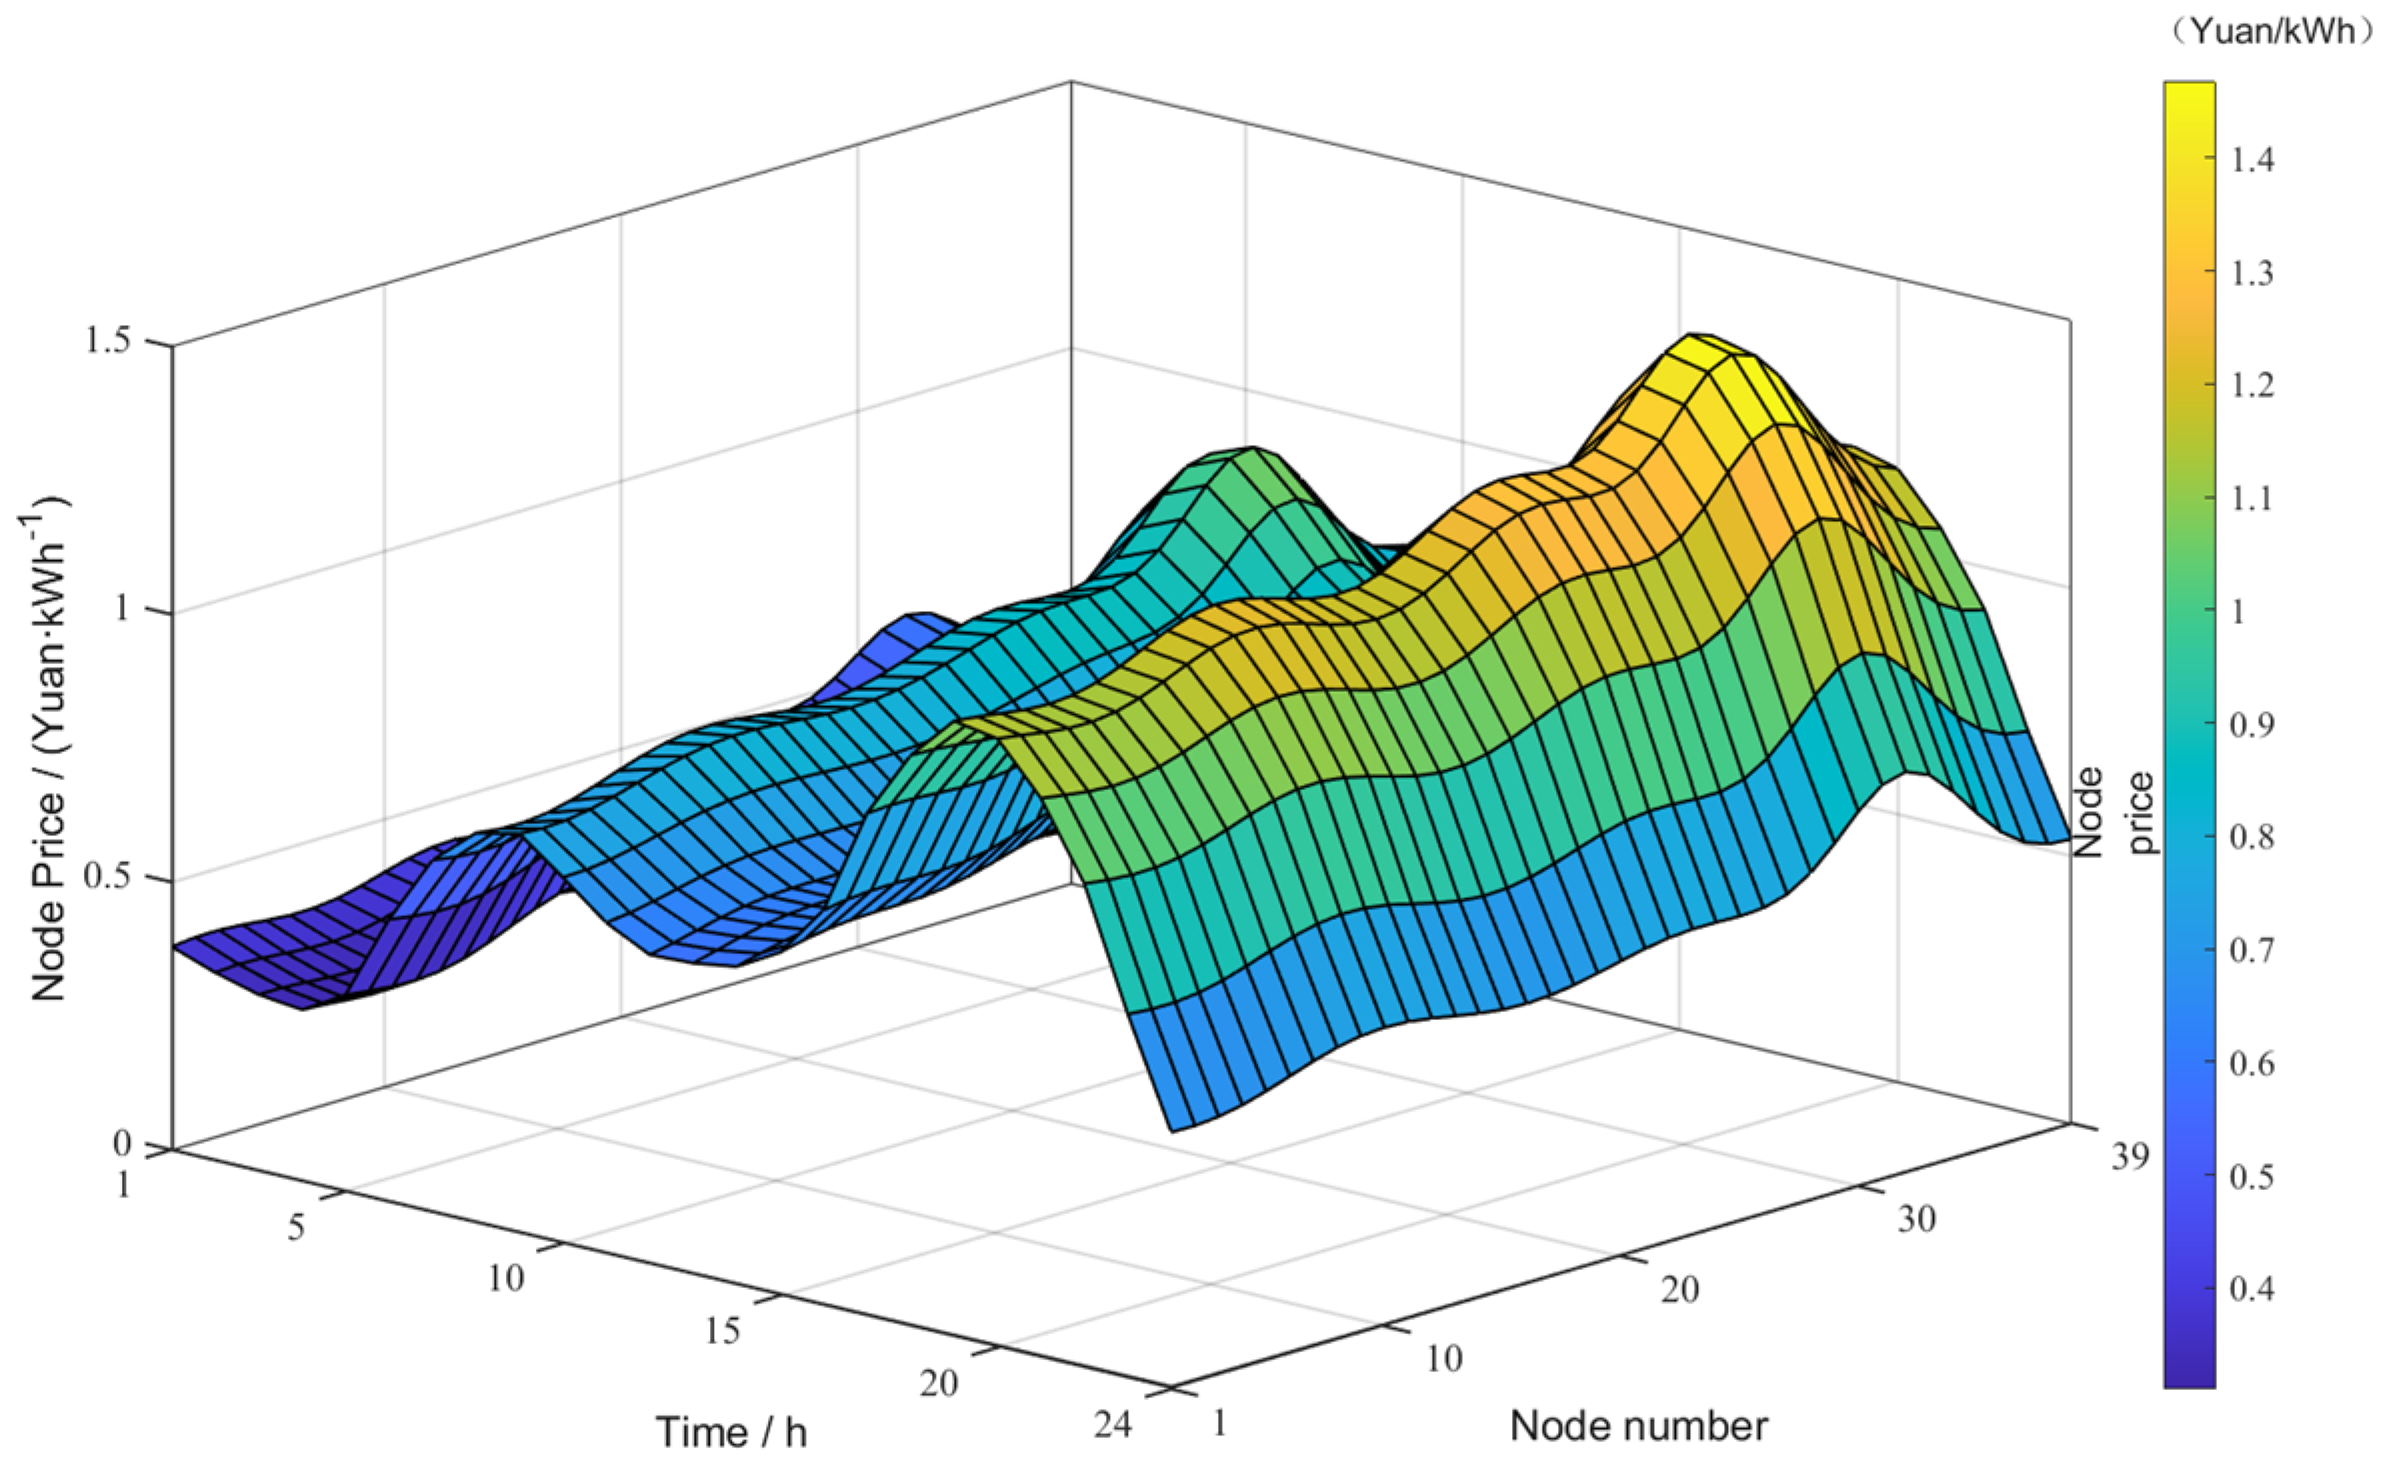
From Figure 5, it is observed that the typical intraday nodal electricity price exhibits a distinct bimodal distribution, with higher levels observed during the periods of 7–10 AM and 5–10 PM. Conversely, the electricity price tends to be lower during the nighttime low-load period. This pattern is strongly influenced by the system load curve and the output characteristics of renewable energy. During peak load periods and when photovoltaic output decreases, the system’s marginal power supply cost rises, which in turn increases the node price. Conversely, during low-load periods, the system has more operational flexibility, leading to a decrease in the node price.
From the spatial dimension, the node price shows a significant uneven distribution. In node 32 and its adjacent areas, the electricity price is significantly higher than that of other nodes, forming a local high price area. This phenomenon shows that after the thermal power plant is connected, its electric power injection changes the power flow distribution of the network, making some key lines gradually close to the transmission constraints, thus introducing significant blocking components and raising the relevant node electricity price. At the same time, some nodes with high sensitivity to blocked lines show a local sudden rise in electricity price, which reflects that the response of node electricity price to network constraints has obvious spatial selectivity.
On the basis of the above-mentioned node price distribution characteristics, further combined with Figure 6, it can be found that after collaborative optimization, the node price of some key nodes and high load periods has been adjusted more obviously than the initial clearing results, especially in the access nodes of thermal power plants and their adjacent areas, where the price correction range is relatively larger. This shows that when the injected power of the thermal power plant is fed back to the grid side, the node price can more fully reflect the combined effect of the thermoelectric coupling constraint and the network congestion state. This indicates that the traditional nodal price, based solely on power side clearing, does not fully account for the influence of thermoelectric coupling and heat storage regulation on the system’s marginal cost, leading to an underestimation of the true power supply cost for critical periods and nodes. By incorporating the power–heat coupling constraint of the thermal power plant and node injection power feedback, the collaborative optimization model can transfer heat-side regulation behavior into the electricity price formation process via the electric power coupling mechanism. As a result, the node price can more accurately reflect the supply–demand imbalance and network constraint conditions of the system.
Further comparison shows that the high electricity price regions presented in Figure 5 are further strengthened in Figure 6, that is, the electricity price increases in these regions are more obvious after collaborative optimization. This shows that the two-way feedback mechanism of node price-unit output constructed in this paper can amplify the price signal of key nodes in space and strengthen the price response in peak hours in time, so as to enhance the sensitivity and indication of node price to the system operation state.
In summary, Figure 5 reveals the spatial and temporal distribution mechanism of the nodal price in the electricity–heat coupling system, while Figure 6 verifies the effective correction ability of the proposed collaborative optimization method to the nodal price. The joint analysis of the two shows that the method in this paper can not only describe the comprehensive influence of grid congestion and thermoelectric coupling on the formation of electricity price, but also provide a more realistic and reasonable decision-making basis for the lower-level scheduling through the dynamic correction of price signal, so as to realize the coordinated improvement of system economy and operation safety.

3.3.2. Analysis of Power Balance Results

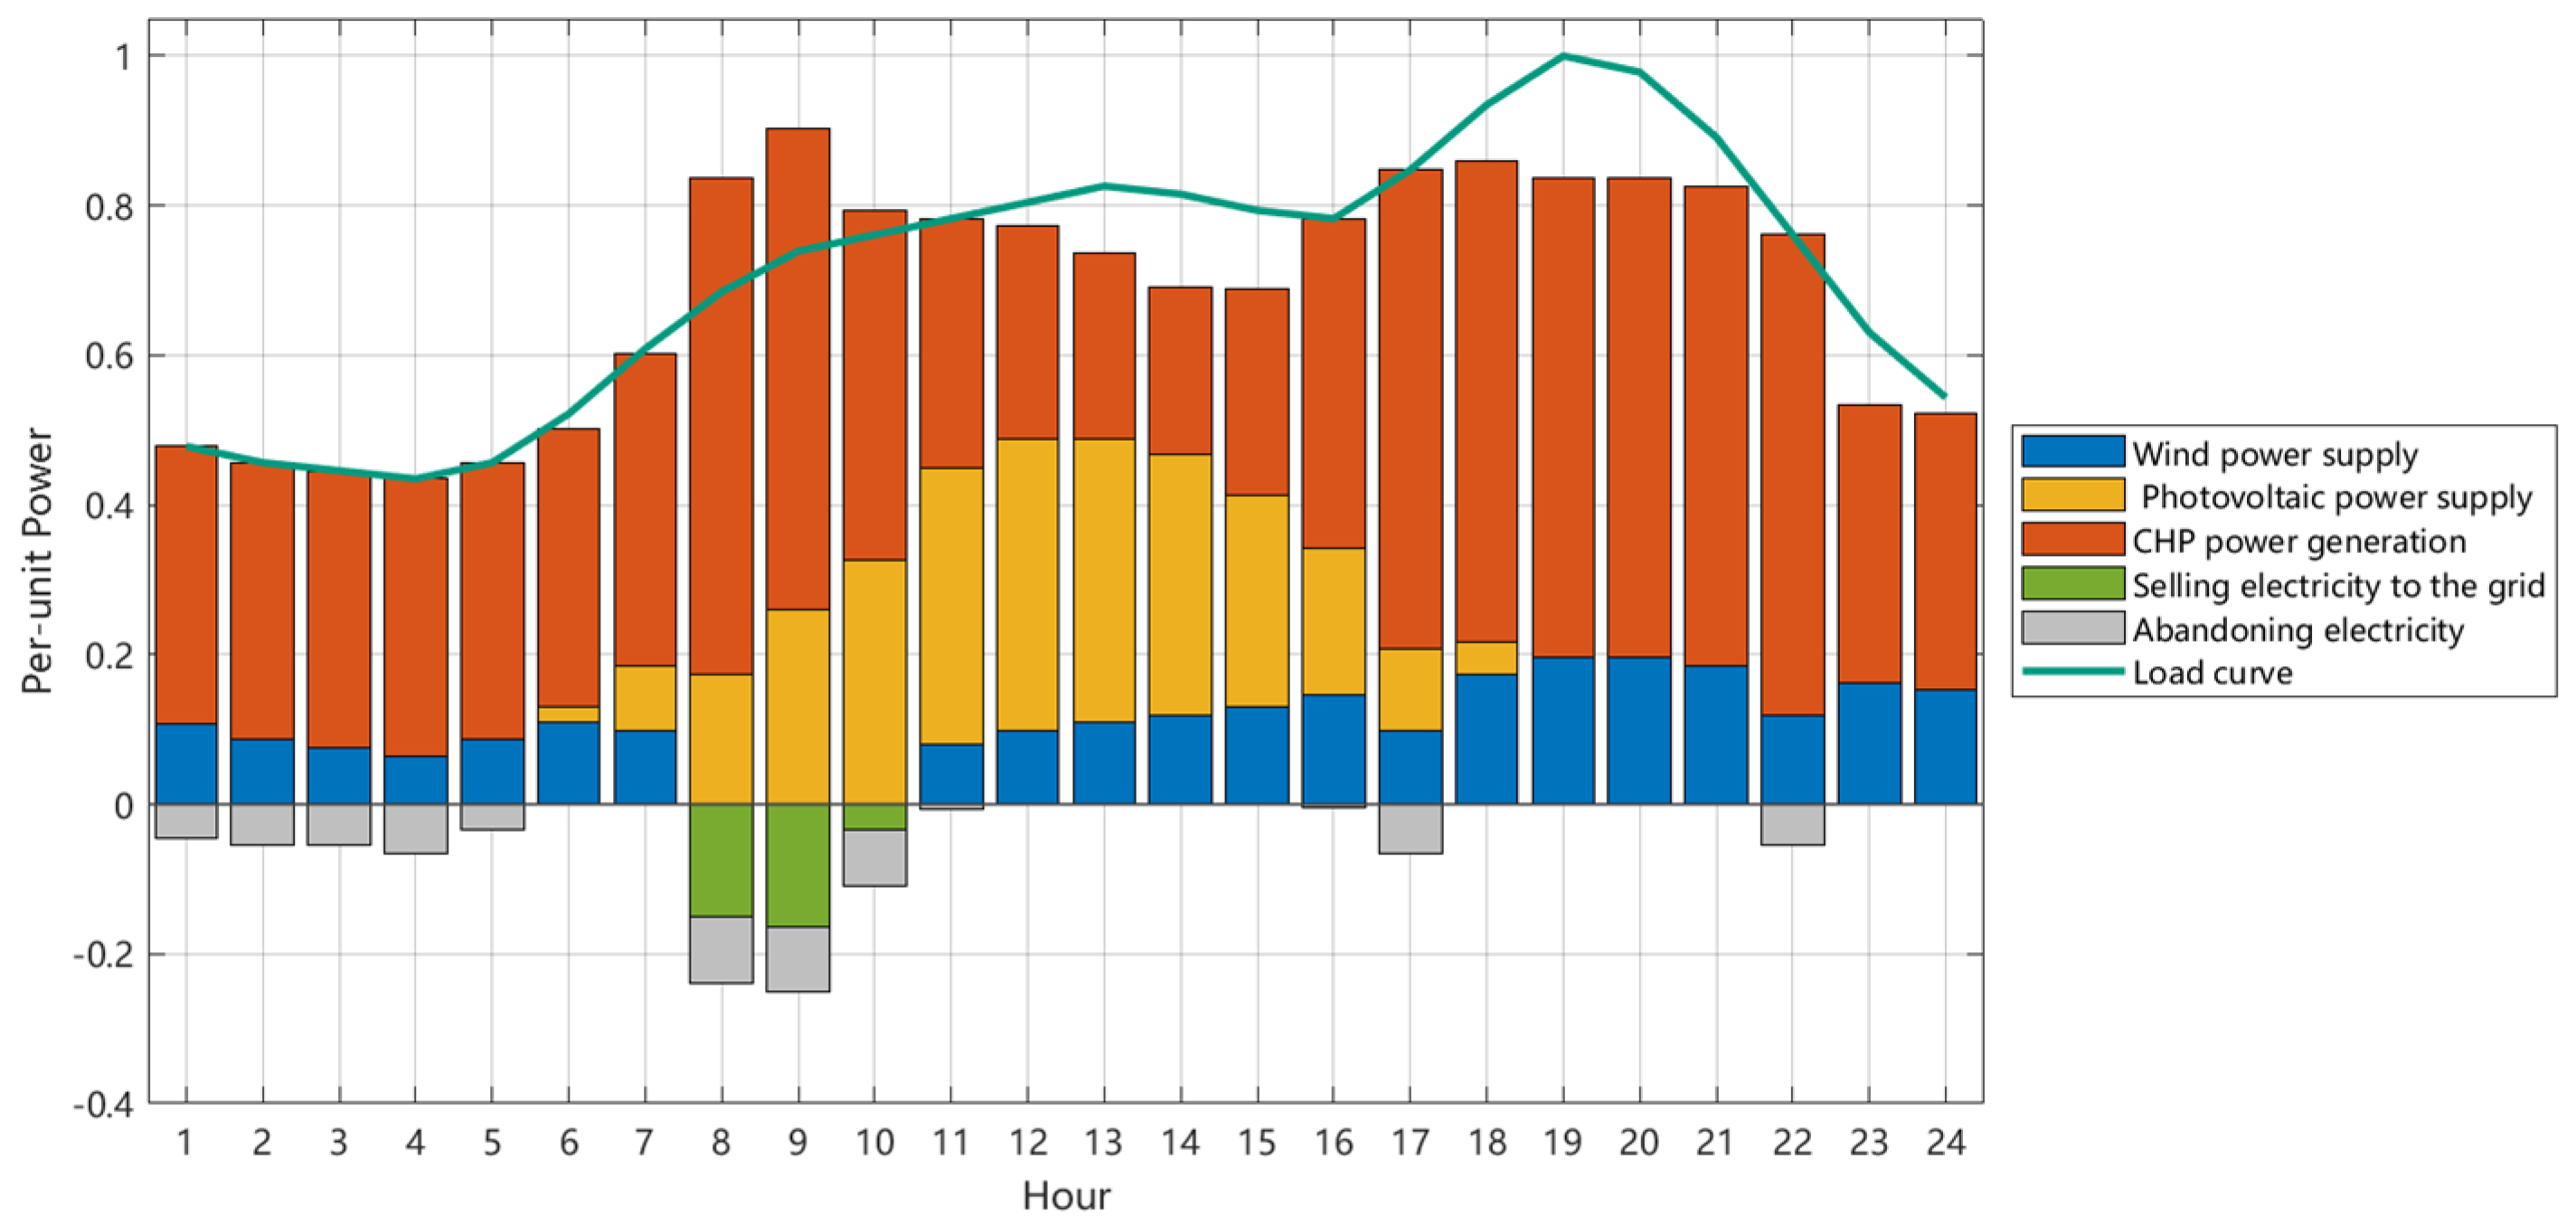
As illustrated in Figure 7, the system successfully maintains the electric power balance throughout the day. Wind power, photovoltaic energy, and CHP units function as the main sources of energy supply for the system. Wind power output remains relatively constant, providing foundational support, while photovoltaic output increases during the daytime, peaking around noon and demonstrating typical daily fluctuations. The CHP unit adjusts its power output in response to varying load levels and new energy production to address the supply–demand gaps caused by renewable energy fluctuations.
During the 8th–10th period, the system’s total generation surpasses the power demand, with excess power transmitted to the main grid via the tie line, as shown by the power sold to the grid in the figure. This scenario highlights that, through the combined effect of the node price signal and scheduling optimization, the system can effectively capitalize on the high share of renewable energy production and export surplus power, thus improving both operational efficiency and the level of new energy consumption.
During the 18th–21st period, the photovoltaic output decreases, while the wind power output remains relatively steady. At this time, the electrical output of the CHP unit increases substantially, with the assumption that it will fulfill the system’s electricity load demand. As illustrated in Figure 7, according to the defined parameters and scenario settings in this study, there is no instance of electricity being purchased from the main power grid in the typical daily optimal scheduling results. The high load period is primarily compensated by an increase in CHP unit output, while during periods of high renewable energy generation, surplus electricity is exported to the main power grid.
On the whole, the results shown in Figure 7 fully reflect the coordinated scheduling characteristics between wind power, photovoltaic and CHP units under the coordinated clearing mechanism of node price, including new energy priority consumption, flexible adjustment of CHP and interaction of power grid, so that the system can achieve the goal of power balance and economic operation without relying on external power purchase. Simultaneously, the system achieves external power sales when renewable energy output is adequate and depends on unit regulation to meet peak load demand. This demonstrates the effectiveness and rationality of the proposed optimal scheduling method under conditions of high renewable energy penetration.

3.3.3. Analysis of Thermal Equilibrium Results

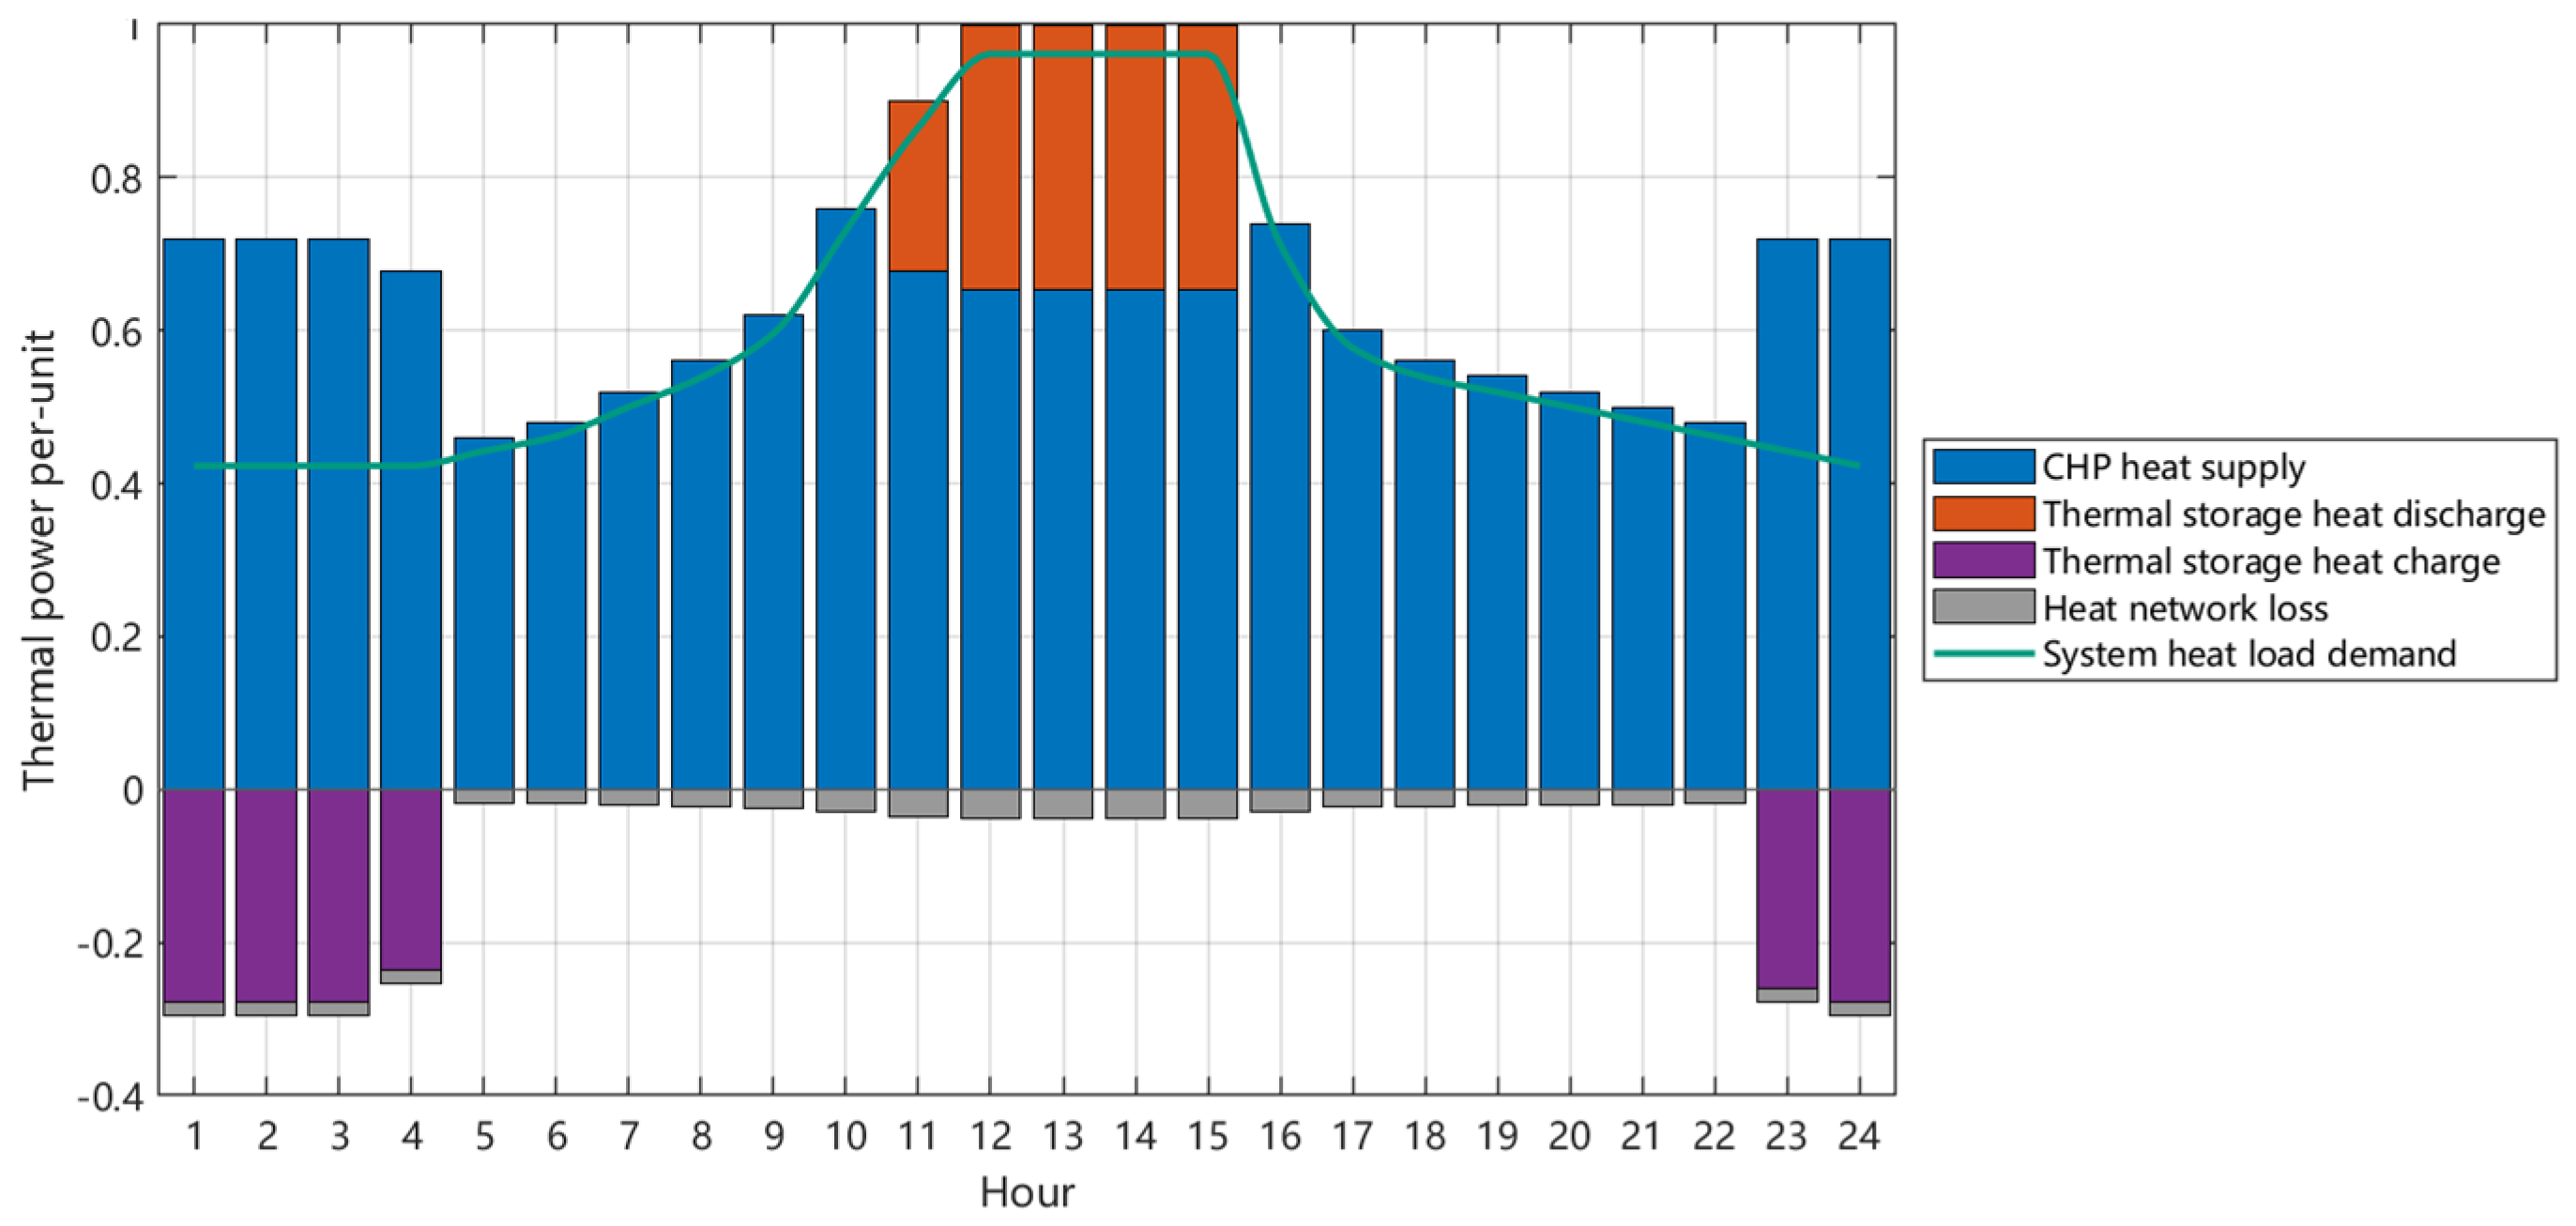
Figure 8 illustrates the thermal power balance of the system over a typical day. As shown in the figure, the thermal power conservation relationship holds throughout the entire scheduling cycle. Specifically, the heat supply from the cogeneration unit and the heat release from the heat storage device collectively meet the system’s heat load demand and compensate for heat network losses. Additionally, a dynamic balance is maintained between the heat storage and charging processes, which validates the model’s feasibility under the heat-side constraint.
From the perspective of the overall heating composition, the cogeneration unit provides fundamental heating throughout the day, serving as the primary stable heat source for the system. The heat released by the heat storage device is predominantly concentrated during the 11th–15th period, offering additional heating support during the high load phase of the system. This effectively reduces the heating pressure on the cogeneration unit and demonstrates the regulation effect of heat storage during peak demand periods.
From the perspective of negative power component, the charging of the heat storage device mainly occurs in low-load periods such as 1–4 o’clock and 23–24 o’clock. At this time, the system stores heat by absorbing excess heating capacity, providing energy reserve for subsequent high-load periods. At the same time, the heat network loss is basically stable throughout the day, accounting for a relatively small proportion, which is in line with the actual operation characteristics of the heat network.
By analyzing the system’s heat load curve, it is evident that during periods of low heat load, the heat storage device facilitates energy transfer through charging. During high-heat load periods, the device releases stored heat to contribute to heating, thereby enabling thermal energy adjustment over time. This process effectively mitigates fluctuations in the heating pressure of the cogeneration unit and enhances the system’s thermal side regulation capability.
To summarize, the heat storage device facilitates the transfer of heat energy over time by charging heat during low-load periods and discharging heat during high-load periods. This process significantly improves the system’s heat load tracking capability and offers increased flexibility for power side scheduling. Consequently, it highlights the crucial role of the heat storage configuration in mitigating electro-thermal coupling constraints and enhancing the operational flexibility of the system.

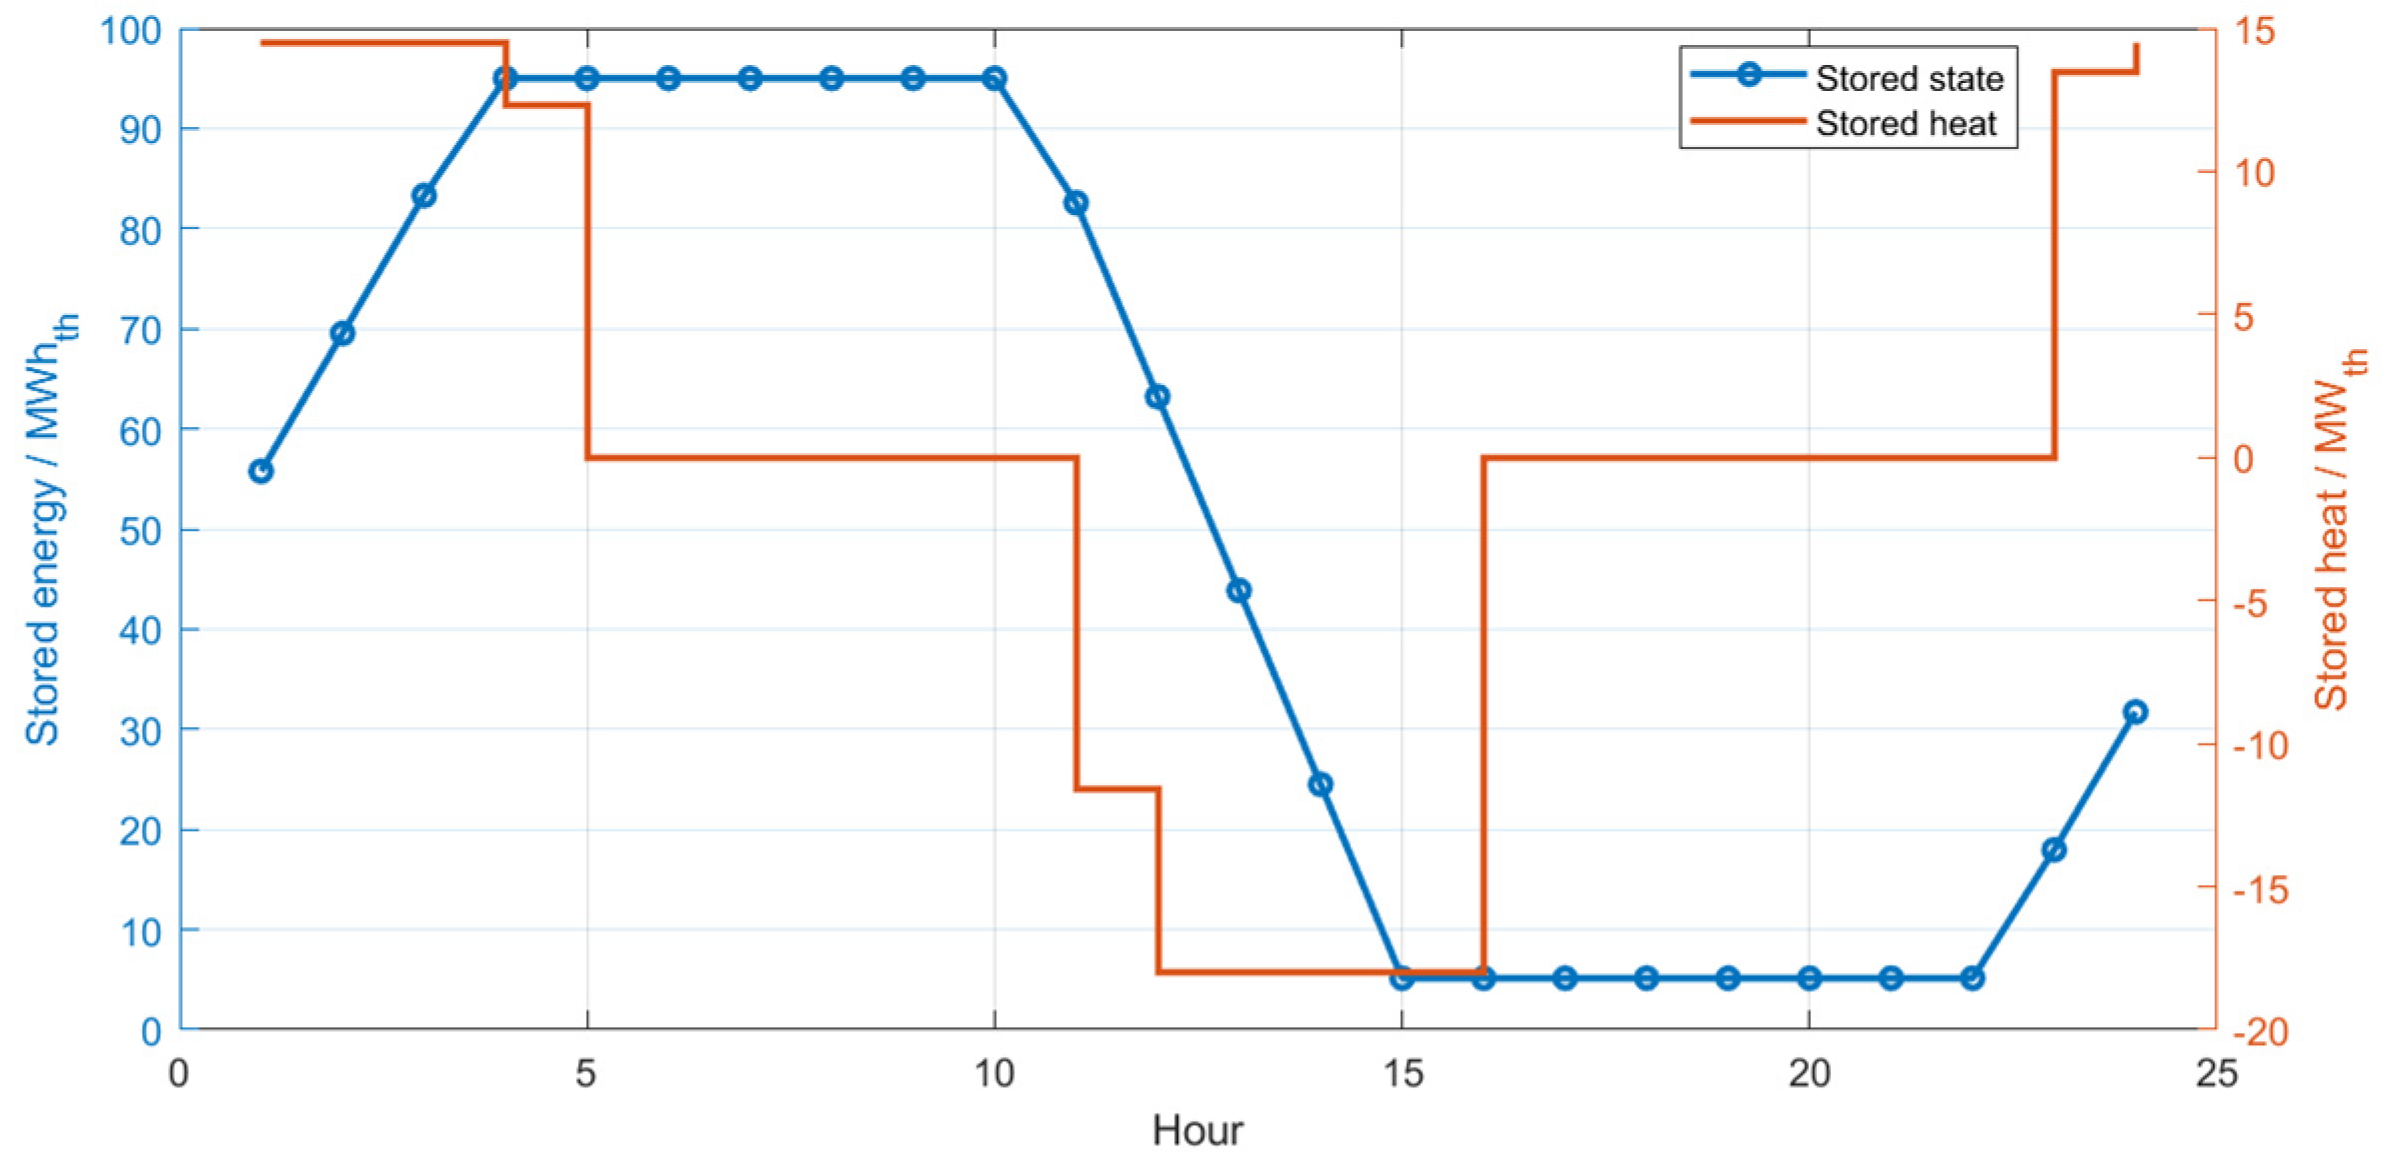
3.3.4. Evolution Analysis of Heat Storage State

Figure 9 illustrates the dynamic variations in the heat storage state and net charge/discharge power. Initially, the heat storage device operates at a medium storage level during the early stages of scheduling, gradually heating up from periods 1 to 4. The heat storage capacity continues to increase and remains high during periods 5 to 10. From periods 11 to 15, the device starts concentrating and releasing heat, causing the heat storage to decrease rapidly, reaching its lowest point around 15:00. During the period from 16 to 22, the heat storage device basically maintains a low heat storage state to match the heat load response of the system; during the period from 23 to 24, the charging process occurs again, which makes the heat storage state rise again and prepares for the next scheduling cycle.
This change law clearly reflects the operation strategy of low-cost heat storage, high-cost heat release and peak load heat replenishment of the heat storage device. Particularly from noon to evening, when the node electricity price is elevated and system load increases, the heat storage device preemptively releases heat energy. On the one hand, it reduces the supply pressure on the hot side of the CHP unit and the auxiliary heat source. On the other hand, it indirectly relaxes the adjustment range of the unit’s electric side, so that the system can respond more flexibly to changes in electricity prices. It can be seen that heat storage is not simply responsible for heat transfer function but becomes an important hub connecting the optimal scheduling of both sides of electricity and heat under the electricity price coordination mechanism.

3.3.5. Convergence Analysis of Collaborative Clearing

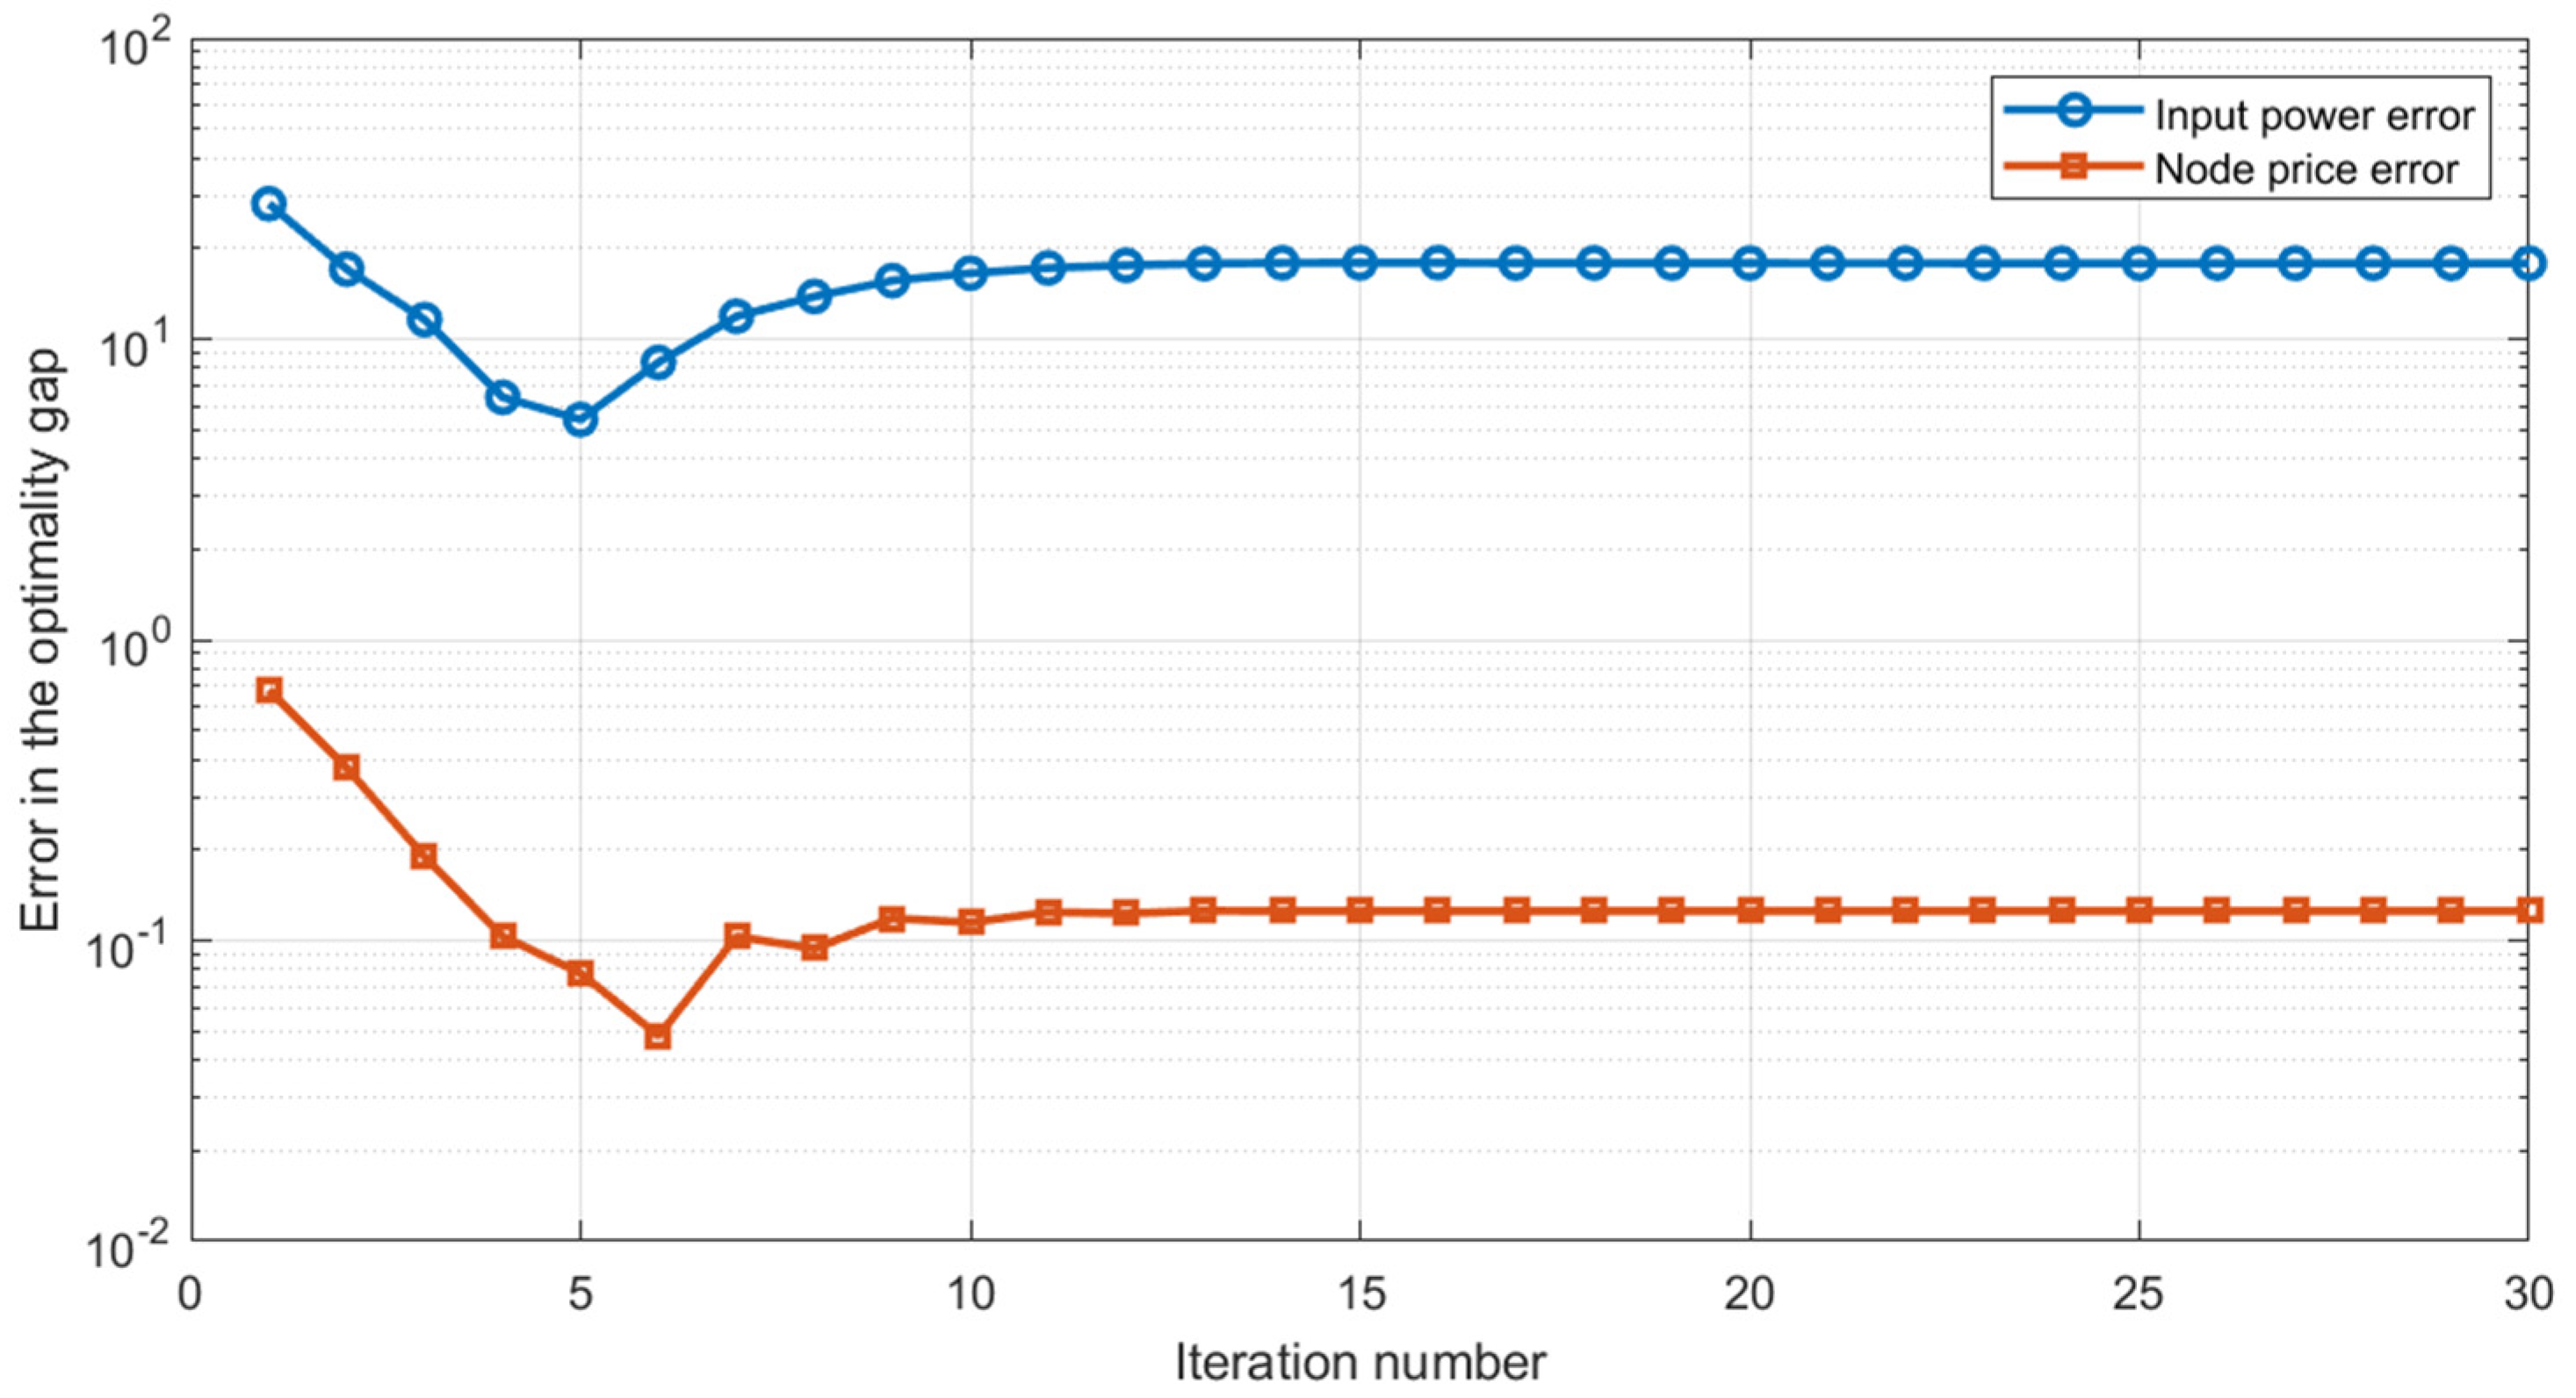
Figure 10 reflects the convergence characteristics of the collaborative clearing iterative process constructed in this paper. It can be seen from the results that the node price error and the injection power error decrease rapidly in the previous iterations, indicating that the grid-side price signal and the thermal power plant-side operation decision can be effectively coordinated through limited information interaction. Although the error changes tend to be gentle in the middle and late stages, the overall level remains at a low level and finally stabilizes, indicating that the proposed two-layer collaborative solution framework has good numerical stability and engineering feasibility.
The convergence rate of injection power error is slower than that of the nodal electricity price error. This is mainly because the lower-level scheduling of the thermal power plant is impacted not only by electricity prices but also by heat load, heat storage conditions, and equipment operation limits. Consequently, the power correction process demonstrates greater coupling and hysteresis. As shown in Figure 10, the proposed method successfully achieves a coordinated equilibrium state after a limited number of iterations, thus validating the effectiveness of the proposed bidirectional feedback solution framework for the integration of the power grid and thermal power plant.

3.3.6. Analysis of Cost Decomposition Results

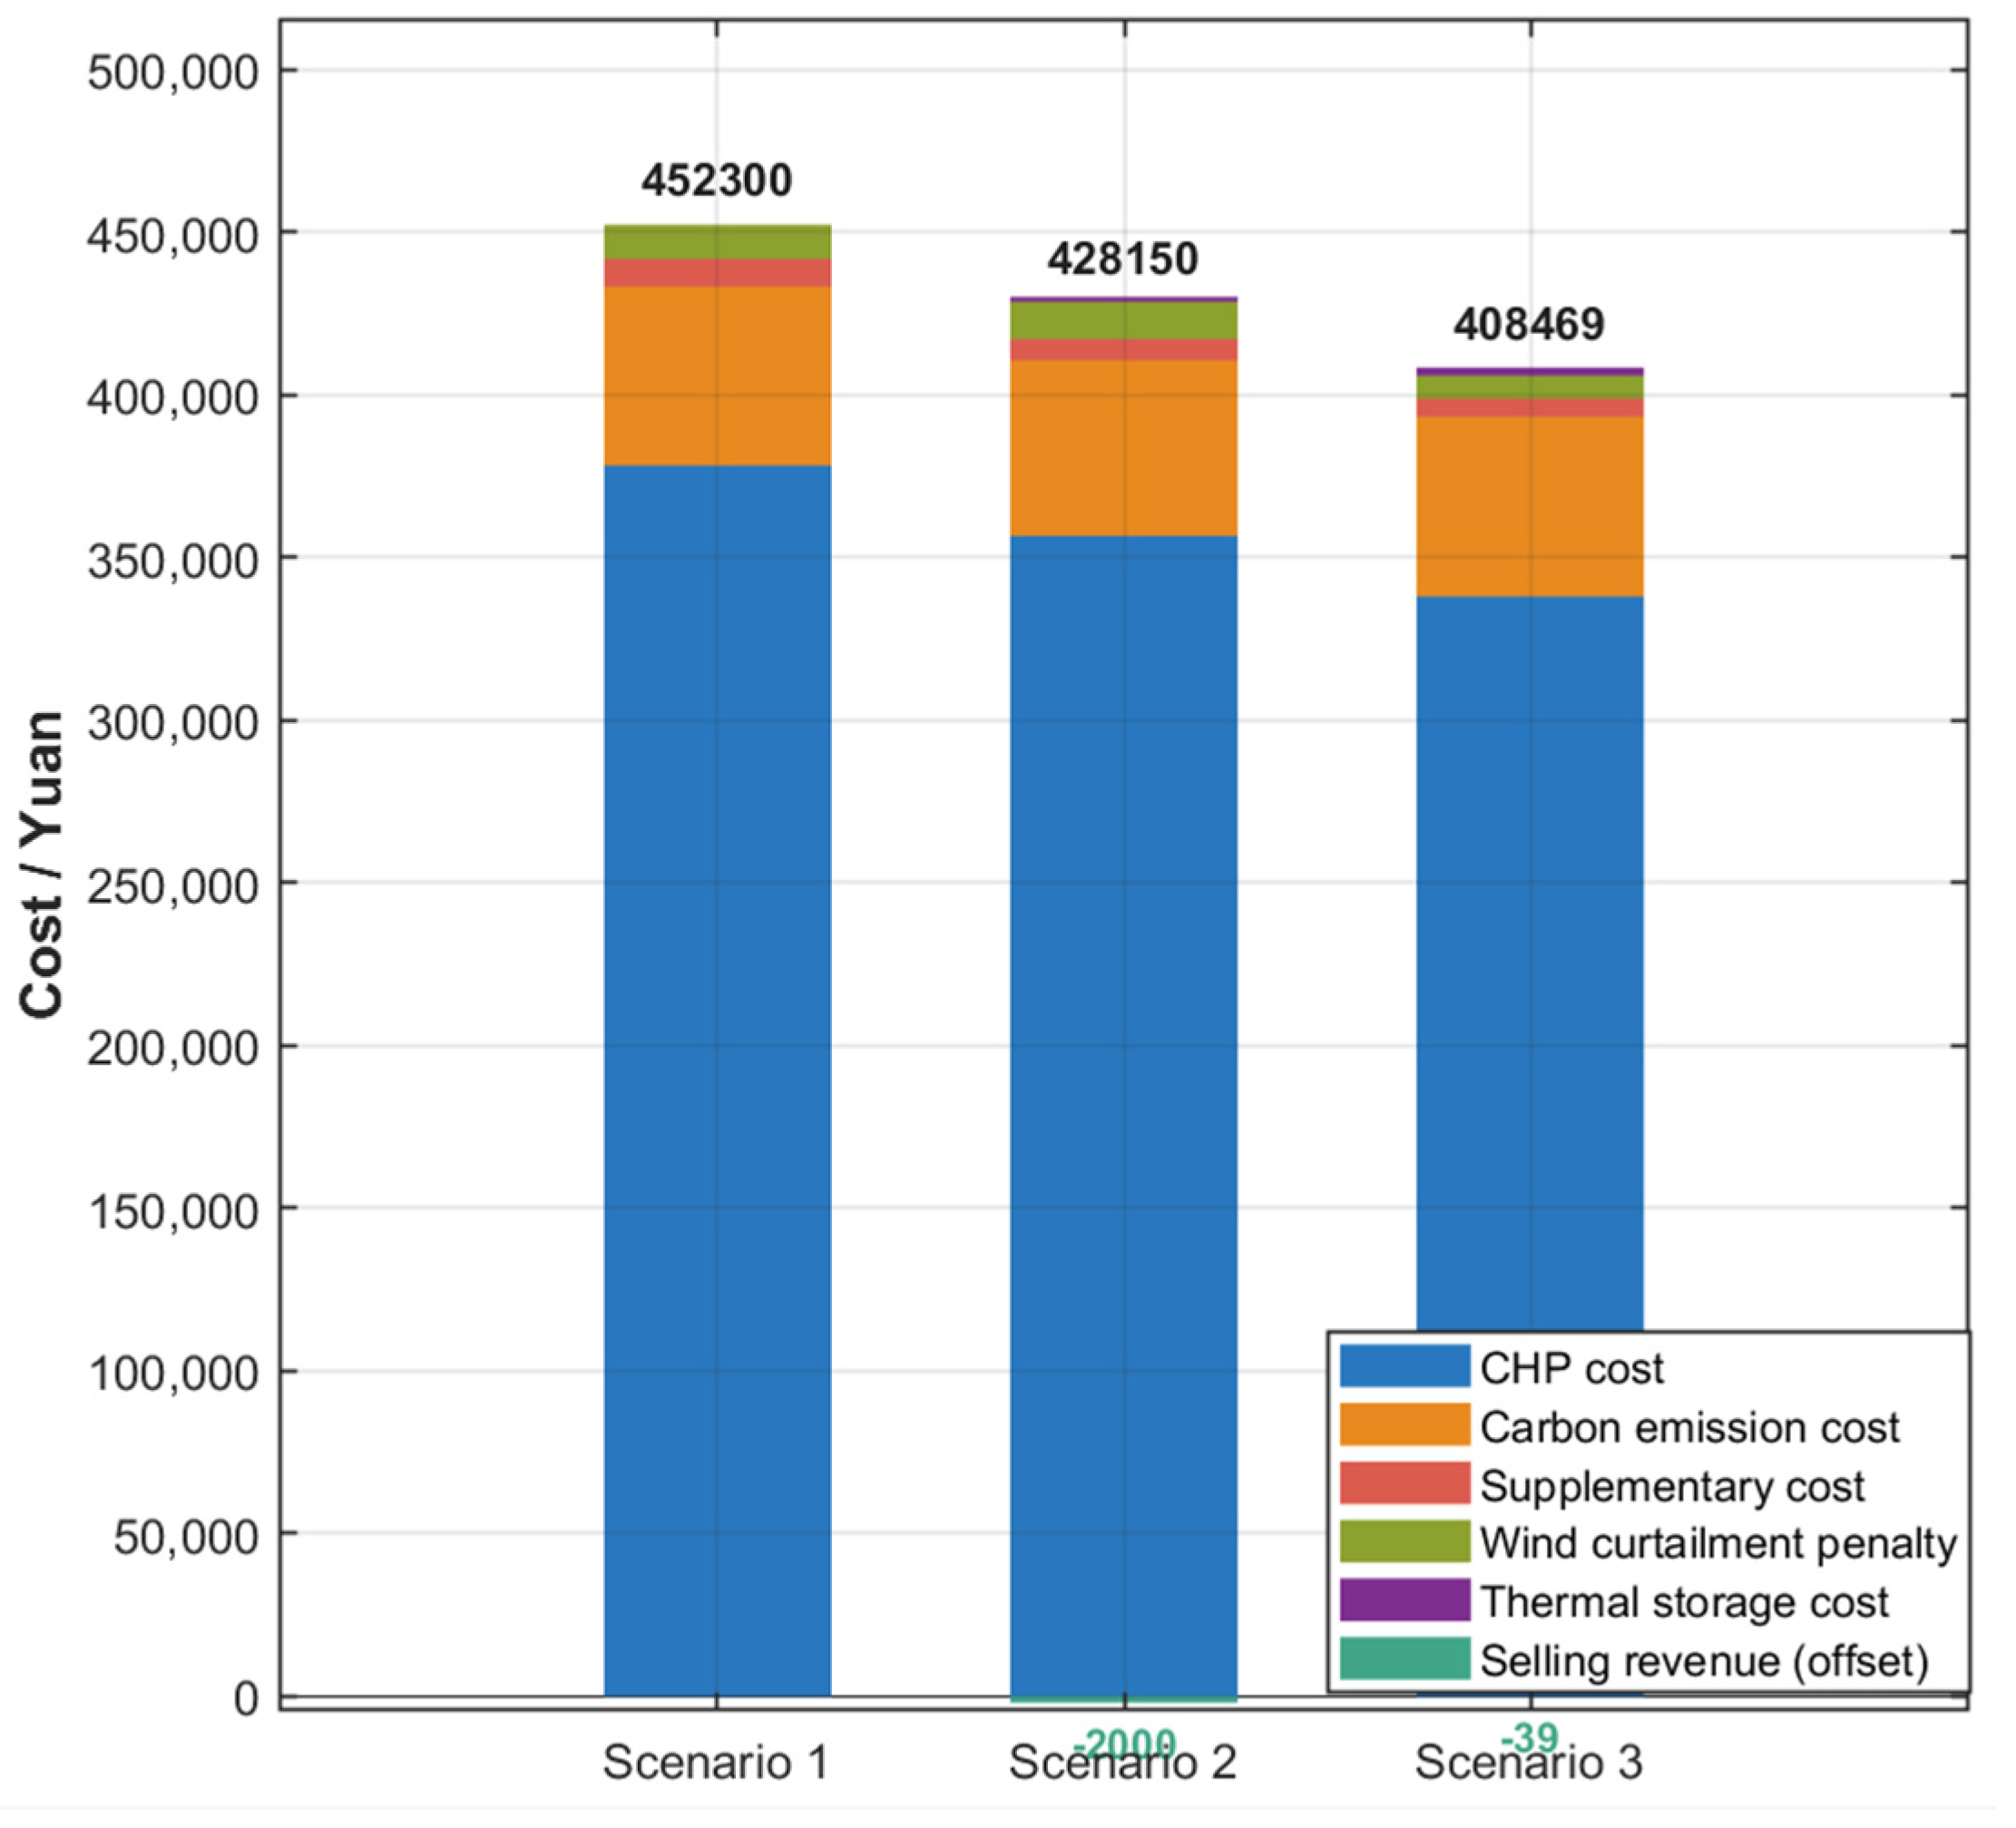
From Table 3 and Figure 11, it can be seen that the total cost of system operation is 408,468.60 yuan, and its cost composition shows obvious hierarchical characteristics. Among them, the operating cost of CHP is 338,468.60 yuan, accounting for 82.87%, which is the dominant cost of the system. It shows that in the electric–thermal coupling integrated energy system, the CHP unit still bears the basic energy supply unit, and its output level has a decisive impact on the economy of the system.
The carbon emission cost amounts to 55,000 yuan, representing 13.47%, making it the second most influential factor after CHP costs. This highlights that, under low carbon constraints, the carbon cost significantly guides the system’s operational strategy. Simultaneously, the penalty for curtailing wind and solar energy is 7500 yuan, or 1.84%, indicating that the system still faces consumption pressures due to the high proportion of renewable energy integration.
The costs for heat replenishment and the heat storage cycle are relatively low, at 1.47% and 0.37%, respectively. However, by offering flexible adjustment capabilities, these costs effectively mitigate thermal load fluctuations and electro-thermal coupling constraints, enhancing the system’s scheduling flexibility. Additionally, the system generates 3000 yuan in electricity sales revenue through participation in the electricity market, offsetting its total cost. In summary, the system’s cost structure reflects the dominance of CHP, carbon constraint regulation, and flexible resource support, demonstrating that the proposed model effectively balances economic efficiency with low carbon emissions while ensuring energy supply reliability. This approach validates the model’s rationality and effectiveness in optimizing the integrated energy system.
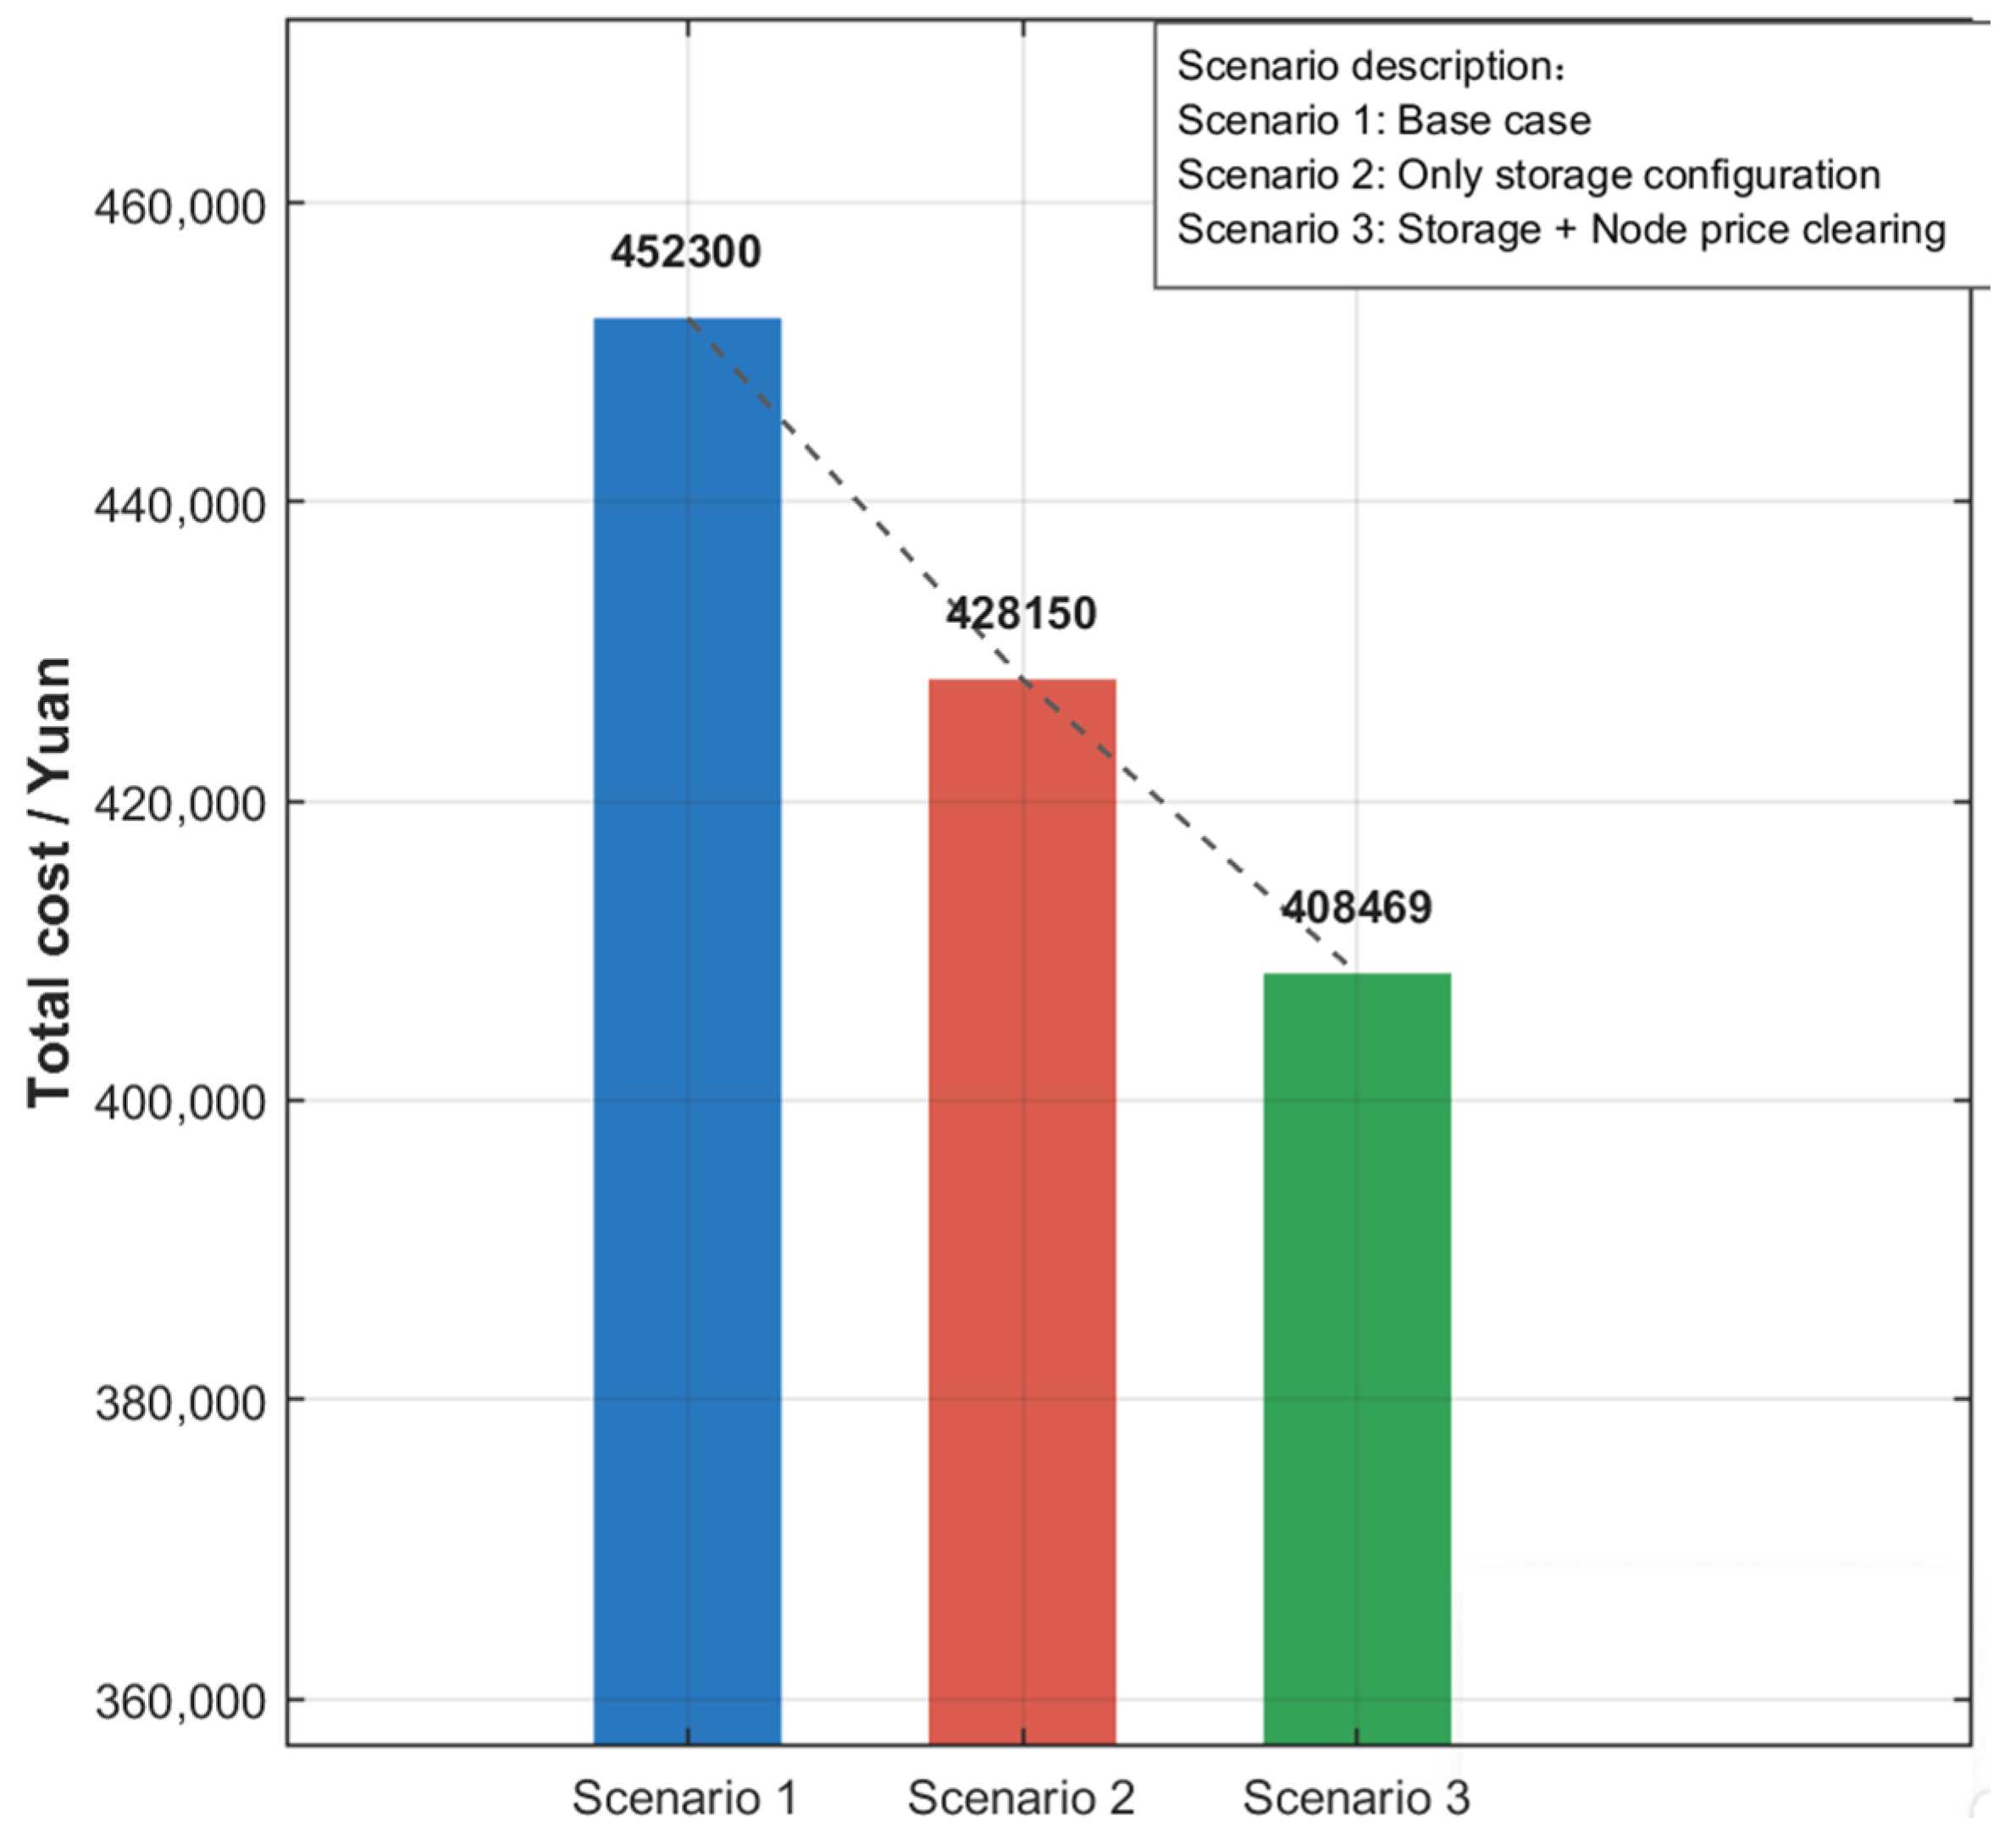
As shown in Table 4 and Figure 12, compared to Scenario 1, the total system cost, carbon emission level and wind and light abandonment rate of Scenario 2 have decreased to varying degrees after configuring the heat storage device, indicating that the heat storage configuration can effectively alleviate the rigid constraint of the cogeneration unit to heat the electricity and improve the system operation flexibility and new energy consumption capacity. After the introduction of the coordinated clearing mechanism of nodal electricity price in scenario 3, the total cost continues to decline, the carbon emission and the rate of wind and light curtailment are further reduced, and the peak shaving capacity is significantly improved. It should be noted that the peak regulation in this paper is used to characterize the equivalent electric power regulation ability of the system in the scheduling period, which is expressed as the maximum adjustable electric output amplitude of the cogeneration unit relative to the reference operating state. With the introduction of the heat storage device, the thermoelectric coupling constraint is weakened, so that the unit has a larger electric side adjustment space; under the synergistic mechanism of node electricity price, the unit regulation behavior is further matched with the system load change and electricity price signal, so that the peak regulation capacity is increased from 25 MW in scenario 1 to 58 MW in scenario 3, which significantly enhances the system’s adaptability to new energy fluctuations.
While relying solely on the heat storage device can enhance the thermoelectric coupling operation state, treating the node price as an exogenous parameter still creates information separation between the thermal power plant scheduling and grid clearing, preventing effective global coordination. In contrast, the method proposed in this paper adjusts the node price through node injection power feedback, allowing the price signal to more accurately reflect the marginal cost and blocking state of the system after the thermal power plant’s participation. This approach guides the unit and heat storage device to establish a more effective joint operation strategy, ultimately yielding improved outcomes in terms of economy, flexibility, and low carbon.

3.3.7. Validation of the Model Under Typical Source-Load Power

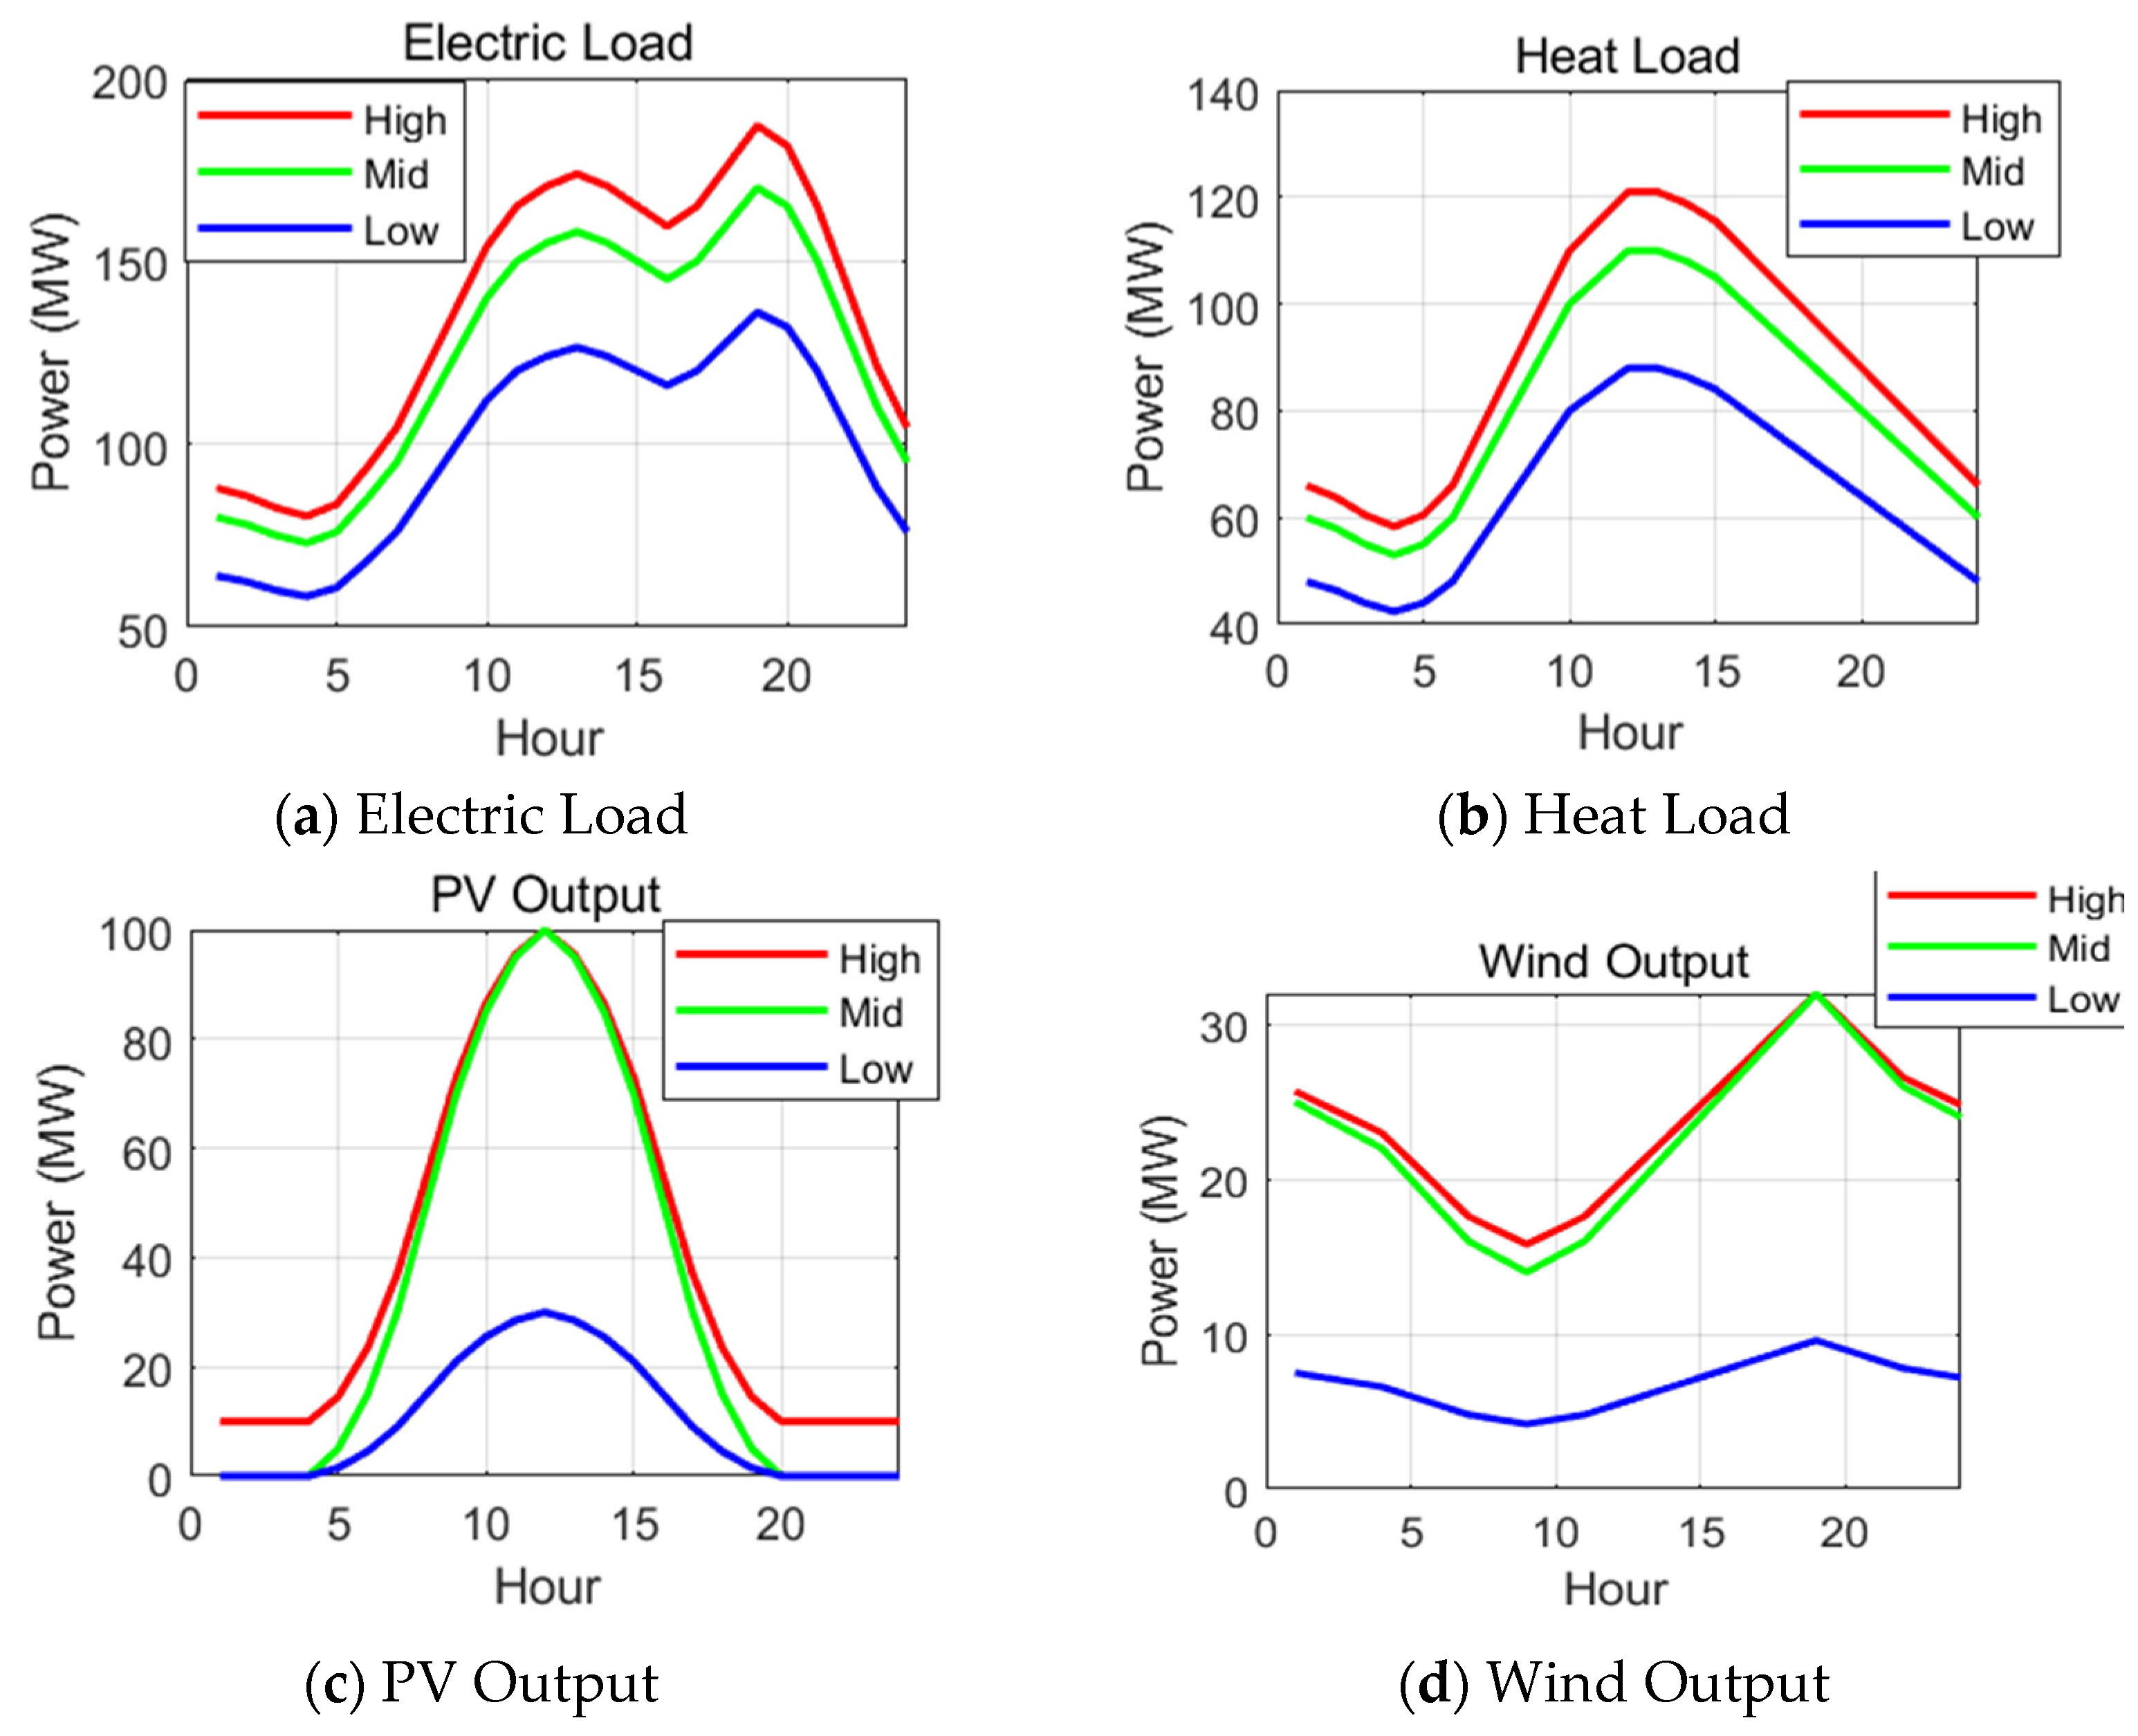
In order to further verify the effectiveness of the proposed optimal scheduling model of the electricity–heat coupling system of the heat storage thermal power plant considering the coordinated clearing of the nodal price under typical source-load conditions, this paper selects typical daily load and new energy output data as model input to carry out simulation analysis. Figure 13 shows the high, medium and low power scenarios of electricity load, heat load, photovoltaic and wind power in typical days, which can fully reflect the operating characteristics of the system under different source-load fluctuations.
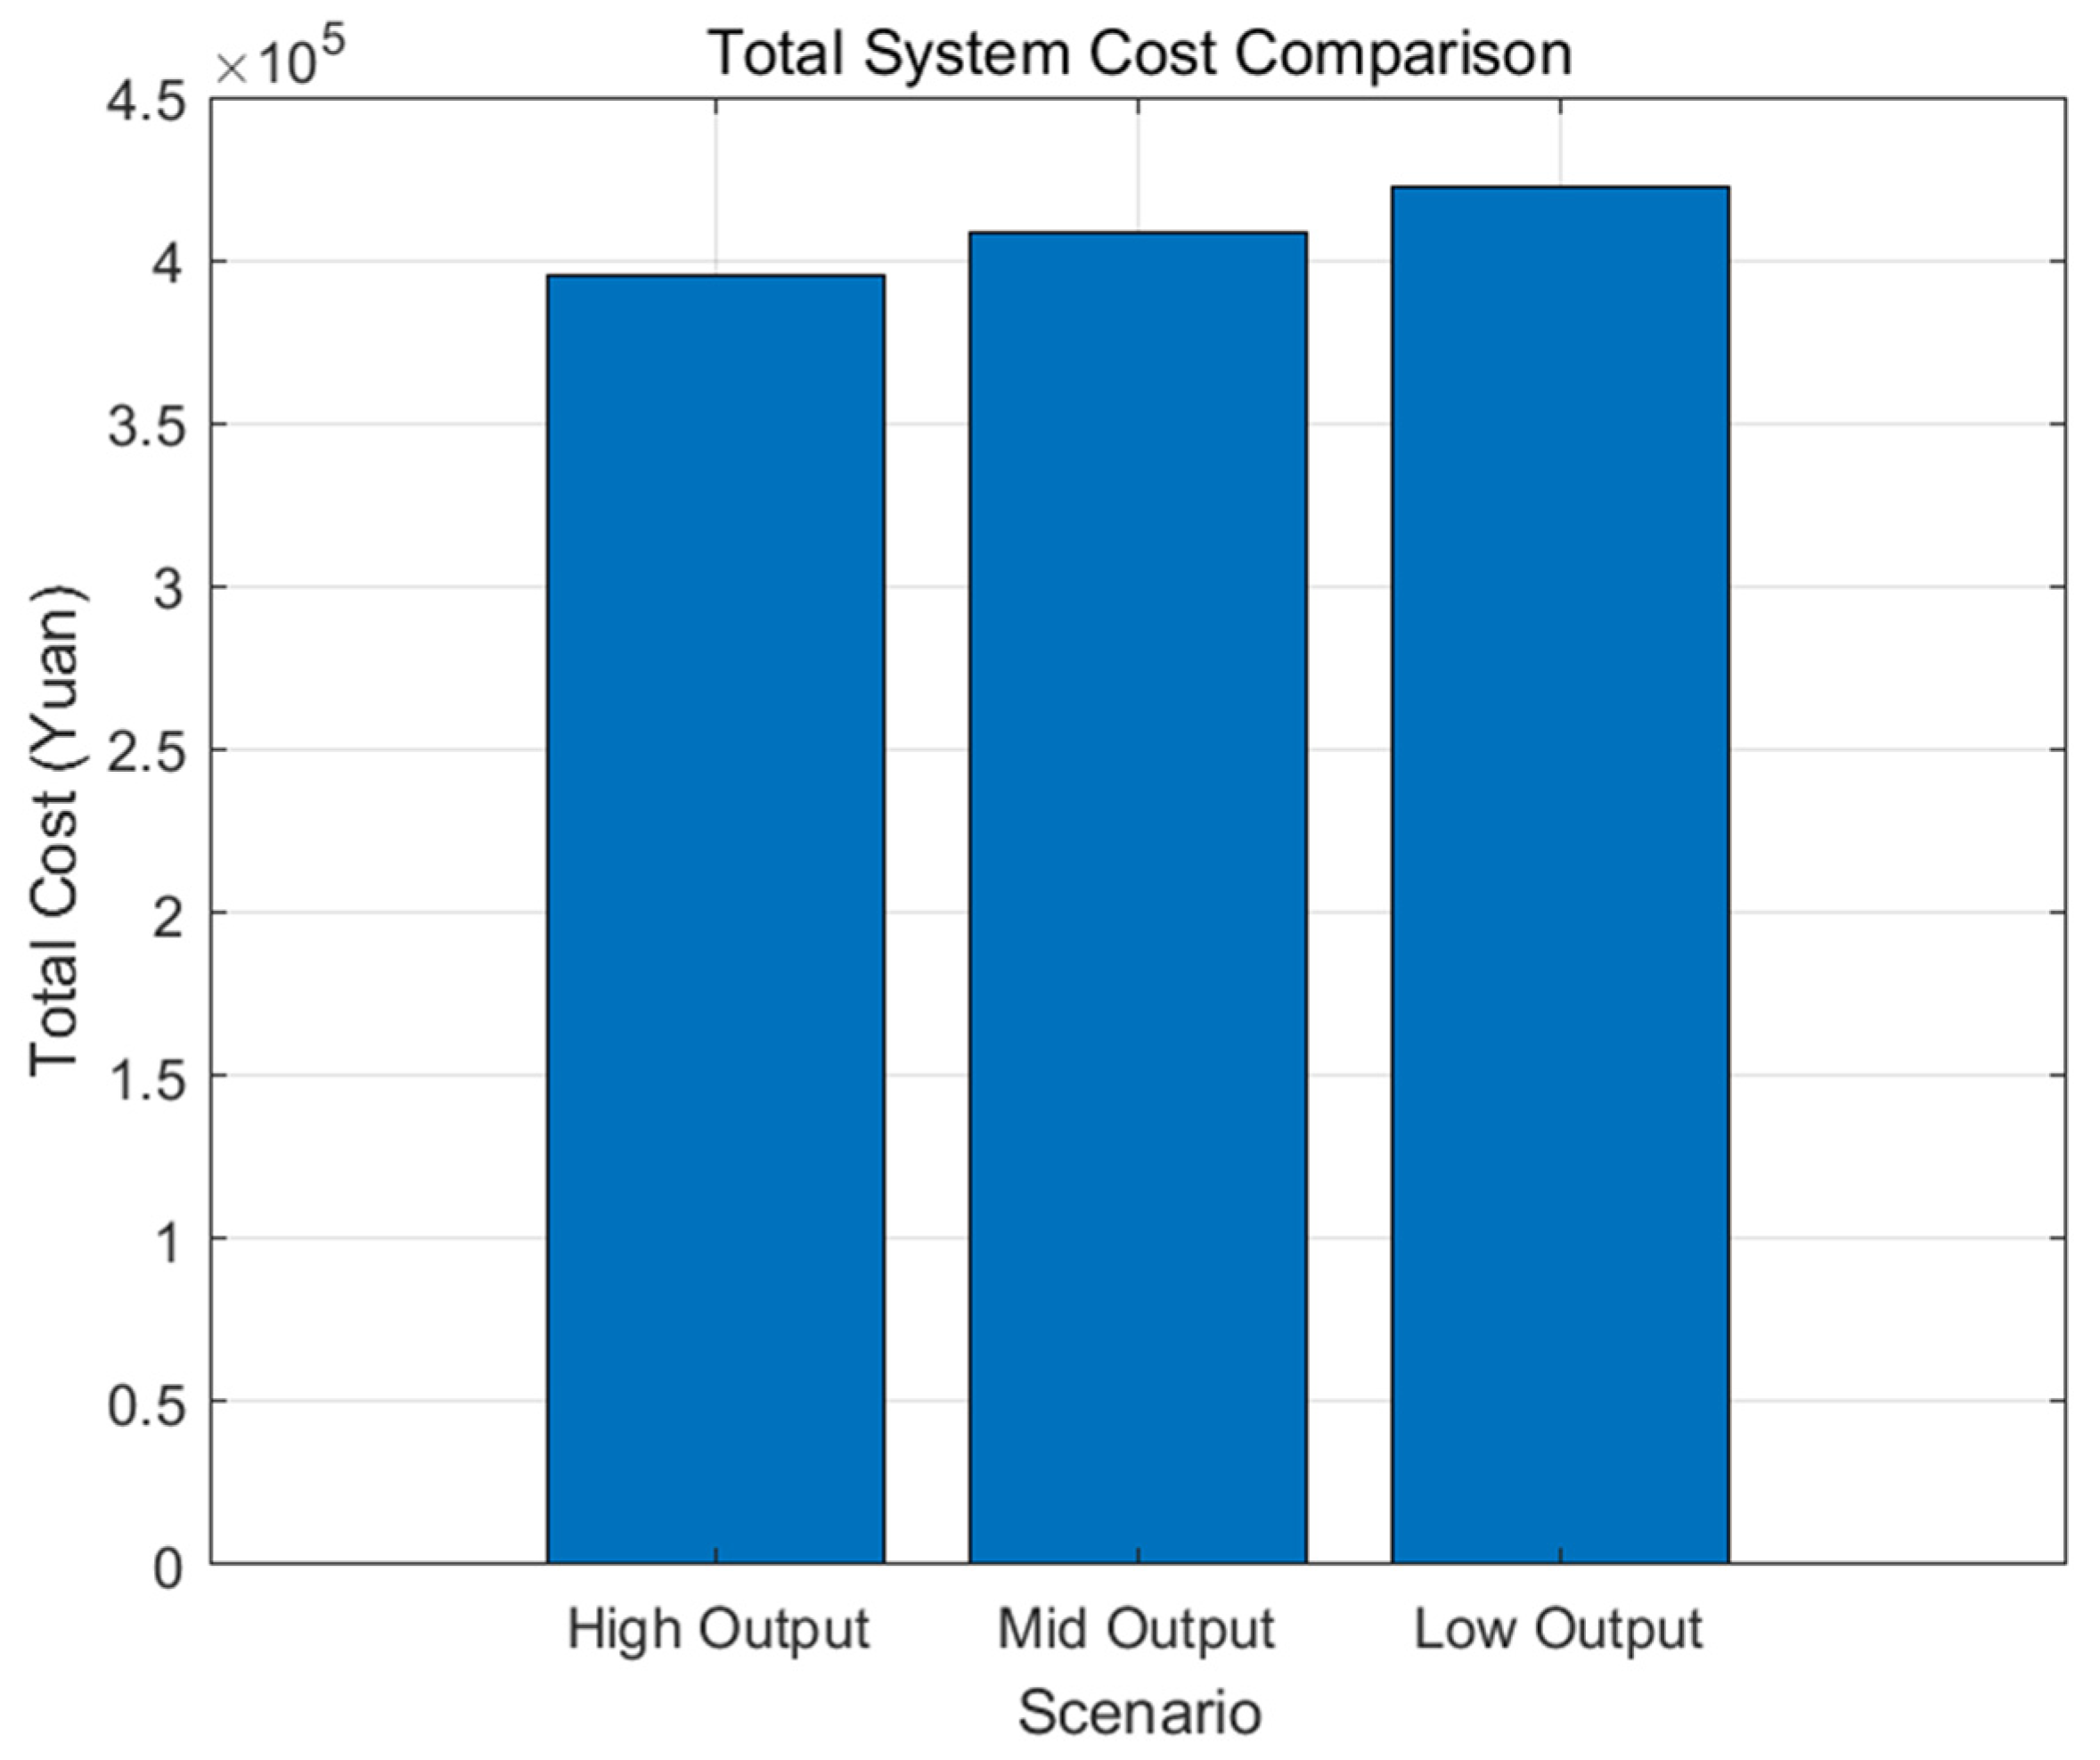
Table 5 shows that in the high, medium and low power output scenarios, the total system cost, carbon emissions and the rate of abandoned wind and light show a reasonable change trend corresponding to the power level:
Figure 13 shows that the heat storage device is charged during the low electricity price period, and the heat is released during the high electricity price period, which effectively smooths the output fluctuation of the CHP unit and alleviates the rigid constraint of the electro-thermal coupling. The unit output optimization under the guidance of the node price coordination mechanism makes the power interaction between the power grid and the thermal power plant more matched and further reduces the total system cost and carbon emissions. Figure 14 shows the comparison results of the total system cost under different power scenarios, which intuitively reflects the effectiveness of the model in economic optimization.
The comprehensive analysis shows that the simulation results under high, medium and low power scenarios are in line with the expected rules, which verifies the feasibility and robustness of the proposed model under typical source-load conditions. Especially in the period of high load and large fluctuation of new energy, the model can give full play to the synergistic regulation of heat storage and node electricity price and realize the unified optimization of system economy, low carbon and flexibility. The heat storage device mainly improves the system regulation ability from the physical level, while the coordinated clearing mechanism of the node price optimizes the resource allocation from the market signal level. The synergistic effect of the two realizes the comprehensive improvement of the operation performance of the electric–thermal integrated energy system.

4. Discussion

In this paper, the two-way coupling clearing framework and the coordinated scheduling model of electricity and heat are proposed. From the two dimensions of price-output two-way feedback and multi-objective collaborative optimization, the operation rules of heat storage thermal power plants in the electricity spot market are revealed, and the boundary and synergy potential of the existing technology system are also reflected.
In terms of technical limitations, the closed-loop interaction between nodal price and unit output breaks through the information fragmentation problem of traditional one-way scheduling, but the mechanism is still affected by factors such as linear approximation of DC power flow, source-load prediction error and calculation iteration accuracy. Under the condition of AC grid refinement and strong uncertainty, there is still room for optimization in the calculation accuracy and iterative convergence speed of the blocking component, which is also the common technical bottleneck of the market-oriented operation of the combined heat and power production infrastructure.
In terms of renewable energy synergy, the output characteristics of different energy sources form a hierarchical synergistic effect with the heat storage device and CHP unit: the peak output of photovoltaic in the daytime can match the peak heat load, and the heat storage device can stabilize the heating fluctuation. The stable output of wind power at night and the heat storage during the low electricity price period can maximize the release of the power side adjustment space of the CHP unit. This multi-technology collaboration reflects the technological symbiosis of electric–thermal energy infrastructure. The heat storage device is the core of physical regulation, and the node price is the core of market signal. The two together transform the three constraints of new energy fluctuation, heating rigidity and grid congestion into schedulable resources. However, when the proportion of single new energy is too high or the rigidity of heat load is too strong, the symbiotic relationship may be weakened, and the system regulation redundancy decreases rapidly.
The simulation results show that the superposition of the heat storage configuration and the nodal price coordination mechanism can significantly improve the system performance: the total cost of the system is reduced from 452,300 yuan to 408,468.60 yuan, the carbon emission is reduced from 3820 t to 3120 t, the peak shaving capacity is increased from 25 MW to 58 MW, and the wind and light abandonment rate is reduced from 12.5% to 4.2%. These trends verify that the heat storage device stores heat in the low-price period, releases heat in the high-price period, and the node electricity price mechanism effectively guides the optimal scheduling of the unit, which further reflects the unified optimization effect of economy, low carbon and scheduling flexibility.
From the perspective of infrastructure and market synergy, thermal power plants, heat storage devices and power grids form a close coupling system. The thermal energy storage provides the ability of thermal energy regulation across time periods, and the node price signal guides the unit to optimize the output, so as to realize the electric–thermal two-way closed-loop feedback. The symbiotic mechanism not only optimizes the economy and low carbon of the unit but also strengthens the pivotal role of the heat storage device in the system, providing systematic support for the flexible scheduling of the electric–heat integrated energy system under the condition of high proportion of renewable energy.
Facing the large-scale application of thermal energy storage power stations in the future, three challenges still need to be paid attention to: First, the whole life cycle quantification problem of the coupling of thermal fatigue loss and deep peak shaving cost under extreme conditions. Secondly, the impact of inter-regional grid congestion and heating network transmission delay on price–power iteration synchronization. Third, the potential impact of the price linkage between the carbon market and the electricity spot market on the optimization of target weights. In engineering practice, both modeling complexity and computational efficiency should be taken into account. In the future, reinforcement learning, distributed optimization and collaborative optimization of planning-level parameters can be combined to improve the robustness and adaptability of the system.

5. Conclusions

In this paper, a scheduling model of a renewable energy–electricity–heat coupling system considering the coordinated clearing of nodal price is constructed to realize the economic, low-carbon and flexible collaborative optimization of heat storage thermal power plants in the electricity spot market environment. The main conclusions are as follows:
  • The two-way coupling framework realizes closed-loop feedback: taking the node injection power as the coupling variable, the upper grid market clearing and the lower thermal power plant scheduling form a closed loop, and the node price can dynamically reflect the marginal cost and congestion state of the system and improve the market consistency of the scheduling results.
  • Cooperative optimization of heat storage and nodal price: The heat storage device and the nodal price mechanism work together to break the rigid constraint of “determining electricity by heat,” expand the adjustment space of the unit’s electrical output, and optimize the source-load matching and new energy consumption.
  • Unified optimization of economy, low carbon and flexibility: The model realizes multi-objective collaborative optimization, which is significantly improved in economy, low carbon and peak shaving flexibility and has engineering application value.
In summary, the heat storage device improves the system regulation ability at the physical layer, and the node price coordination clearing mechanism optimizes the resource allocation at the market layer. The two cooperate to achieve the performance improvement of the electric–heat integrated energy system. The collaborative optimization model constructed in this paper can truly describe the dynamic coupling between electricity price and unit scheduling, which is of great significance to the operation efficiency and market adaptability of the integrated energy system under the condition of a high proportion of new energy and has certain engineering application value.

Author Contributions

Conceptualization and writing—original draft preparation, H.J. and S.Z.; methodology, data curation and software, S.Z.; validation, D.Z., P.S. and D.L. All authors have read and agreed to the published version of the manuscript.

Funding

This research was funded by Liaoning Provincial Science and Technology Plan Joint Program, grant number 2024-BSLH-159.

Data Availability Statement

The raw data supporting the conclusions of this article will be made available by the authors, without undue reservation.

Conflicts of Interest

Author Dongyang Li was employed by the company State Grid Liaoning Electric Power Co., Ltd. The remaining authors declare that the research was conducted in the absence of any commercial or financial relationships that could be construed as a potential conflict of interest.

Nomenclature

SymbolDescriptionUnit
P max C H P Maximum electrical output of CHP unitMW
P min C H P Minimum electrical output of CHP unitMW
Q max C H P Maximum thermal output of CHP unitMW
α Electrical-thermal coupling factor
R Ramp rate constraintsMW/h
E max T E S Heat storage capacityMWh
E min T E S Minimum heat storageMWh
η c h Charging efficiency
η d i s Heat release efficiency
P max T E S Maximum charging and discharging powerMW
P max g r i d Connecting line capacityMW
P min g r i d Minimum output powerMW
λ C O 2 Carbon emission priceYuan/t
T Dispatching cycleh

References

  1. Vaskovskaya, T. Locational Marginal Pricing in Multi-Period Power Markets. Energy Syst. Res. 2019, 2, 28–40. [Google Scholar] [CrossRef]
  2. Nemati, N.; Ahmadi Kasani, A. Analysis of Wind Power Integration in Electricity Markets LMP Pricing. arXiv 2024, arXiv:2410.11139. [Google Scholar] [CrossRef]
  3. Zhang, W.; Tominac, P.A.; Zavala, V.M. Pricing and Remunerating Electricity Storage Flexibility Using Virtual Links. Comput. Chem. Eng. 2022, 168, 108019. [Google Scholar] [CrossRef]
  4. Chen, L.; Suzuki, H.; Wachi, T.; Shimura, Y. Components of Nodal Prices for Electric Power Systems. IEEE Trans. Power Syst. 2002, 17, 41–49. [Google Scholar] [CrossRef]
  5. Chen, C.; Du, X.; Yang, L.; Romagnoli, A. Flexibility Enhancement of Combined Heat and Power Unit Integrated with Source and Grid-Side Thermal Energy Storage. Energy 2024, 312, 133568. [Google Scholar] [CrossRef]
  6. Beiron, J.; Göransson, L.; Normann, F.; Johnsson, F. Flexibility Provision by Combined Heat and Power Plants—An Evaluation of Benefits from a Plant and System Perspective. Energy Convers. Manag. X 2022, 16, 100318. [Google Scholar] [CrossRef]
  7. Tan, J.; Wu, Q.; Zhang, M. Strategic Investment for District Heating Systems Participating in Energy and Reserve Markets Using Heat Flexibility. Int. J. Electr. Power Energy Syst. 2022, 137, 107819. [Google Scholar] [CrossRef]
  8. Sihvonen, V.; Ollila, I.; Jaanto, J.; Grönman, A.; Honkapuro, S.; Riikonen, J.; Price, A. Power-to-Heat and Thermal Storage: A Review of Technologies and Applications. Energy 2024, 305, 132372. [Google Scholar] [CrossRef]
  9. Wang, Z.; Shi, L. Day-Ahead Optimal Scheduling for a Full-Scale PV–Energy Storage Microgrid: From Simulation to Experimental Validation. Electronics 2025, 14, 1509. [Google Scholar] [CrossRef]
  10. Borge-Diez, D.; Rosales-Asensio, E.; Palmero-Marrero, A.I.; Acikkalp, E. Optimization of CSP Plants with Thermal Energy Storage for Electricity Price Stability in Spot Markets. Energies 2022, 15, 1672. [Google Scholar] [CrossRef]
  11. Yan, N.; Ma, G.; Li, X.; Guerrero, J.M. Low-Carbon Economic Dispatch Method for Integrated Energy System Considering Seasonal Carbon Flow Dynamic Balance. IEEE Trans. Sustain. Energy 2023, 14, 576–586. [Google Scholar] [CrossRef]
  12. Yang, M.; Li, X.; Han, Z.; Sun, Y.; Chang, X. Ultra-short-term multi-step prediction of wind power fusing multivariate time-series relationships and multi-task correction. IEEE Trans. Ind. Appl. 2026, 62, 4286–4296. [Google Scholar] [CrossRef]
  13. Yang, M.; Guo, Y.; Fan, F. Ultra-Short-Term Prediction of Wind Farm Cluster Power Based on Embedded Graph Structure Learning With Spatiotemporal Information Gain. IEEE Trans. Sustain. Energy 2025, 16, 308–322. [Google Scholar] [CrossRef]
  14. Yang, M.; Jiang, Y.; Xu, C.; Wang, B.; Wang, Z.; Su, X. Day-ahead wind farm cluster power prediction based on trend categorization and spatial information integration model. Appl. Energy 2025, 388, 125580. [Google Scholar] [CrossRef]
  15. Oladeji, I.; Makolo, P.; Abdillah, M.; Shi, J.; Zamora, R. Security Impacts Assessment of Active Distribution Network on the Modern Grid Operation—A Review. Electronics 2021, 10, 2040. [Google Scholar] [CrossRef]
  16. Yoo, D.; Kang, S.; Jang, G.; Jung, S. Development of Reactive Power Allocation Method for Radial Structure Wind Farm Considering Multiple Connections. Electronics 2022, 11, 2176. [Google Scholar] [CrossRef]
  17. Zhu, J.-H.; He, Y.; Gu, J.; Zhang, X.; Zhang, J.; Ge, Y.; Luo, K.; Zhu, J. Capacity Configuration and Scheduling Optimization on Wind–Photovoltaic–Storage System Considering Variable Reservoir–Irrigation Load. Electronics 2026, 15, 454. [Google Scholar] [CrossRef]
  18. Zhang, L.; Ma, Z.; Jia, C.; Zhang, T.; Zhang, H. A Novel Hierarchical Optimal Scheduling and Coordination Control Method for Microgrid Based on Multi-Energy Complementarity. Electronics 2025, 14, 1829. [Google Scholar] [CrossRef]
  19. Zheng, W.; Xu, S.; Liu, J.; Zhu, J.; Luo, Q. Participation of Strategic District Heating Networks in Electricity Markets: An Arbitrage Mechanism and Its Equilibrium Analysis. Appl. Energy 2023, 335, 121732. [Google Scholar] [CrossRef]
  20. Lepiksaar, K.; Mašatin, V.; Latõšov, E.; Siirde, A.; Volkova, A. Improving CHP Flexibility by Integrating Thermal Energy Storage and Power-to-Heat Technologies into the Energy System. Smart Energy 2021, 2, 100022. [Google Scholar] [CrossRef]
  21. Mo, D.; Chen, M.; Li, Q.; Yang, Y.; Wang, Z.; Zhu, D. Research on Joint Clearing of Energy and Ancillary Service in the Day-Ahead Market Considering the Weights of Ancillary Services. Front. Energy Res. 2025, 13, 1583300. [Google Scholar] [CrossRef]
  22. Wang, Q.; Zhang, C.; Ding, Y.; Xydis, G.; Wang, J.; Østergaard, J. Review of Real-Time Electricity Markets for Integrating Distributed Energy Resources and Demand Response. Appl. Energy 2015, 138, 695–706. [Google Scholar] [CrossRef]
  23. Diaz C., J.L.; Ocampo-Martinez, C.; Panten, N.; Weber, T.; Abele, E. Optimal Operation of Combined Heat and Power Systems: An Optimization-Based Control Strategy. Energy Convers. Manag. 2019, 199, 111957. [Google Scholar] [CrossRef]
  24. Liu, K.; Sheng, W.; Zhan, H.; Tong, B.; Zhang, L.; Tang, W. Bi-level optimization scheduling of mid-low-voltage AC/DC hybrid distribution network considering interconnection between networks. Electr. Power Constr. 2024, 45, 33–44. Available online: https://www.cepc.com.cn/CN/10.12204/j.issn.1000-7229.2024.01.004 (accessed on 27 May 2026).
  25. Gong, Y.; Zeng, L.; Chen, J.; Yan, Q.; Li, Y.; Xu, J. Bi-Level Game Optimal Operation of Integrated Energy System Considering Carbon Trading and Green Certificates Uncertainty. Electr. Power Constr. 2025, 46, 119–130. Available online: https://www.cepc.com.cn/CN/10.12204/j.issn.1000-7229.2025.12.011 (accessed on 27 May 2026).
Figure 1. Schematic diagram of market clearing mechanism based on DC optimal power flow.
Electronics 15 02371 g001
Figure 2. Collaborative optimization scheduling solution flow chart of electric–heat integrated energy system.
Electronics 15 02371 g002
Figure 3. A collaborative solution framework for low-carbon optimal scheduling considering coordinated clearing of node price.
Electronics 15 02371 g003
Figure 4. Improved IEEE 39-bus electric-thermal integrated energy system structure diagram.
Electronics 15 02371 g004
Figure 5. A three-dimensional map of the spatial and temporal distribution of nodal electricity prices.
Electronics 15 02371 g005
Figure 6. Comparison of node price before and after coordinated clearing.
Electronics 15 02371 g006
Figure 7. Power balance histogram.
Electronics 15 02371 g007
Figure 8. Thermal equilibrium histogram.
Electronics 15 02371 g008
Figure 9. Evolution curve of heat storage state.
Electronics 15 02371 g009
Figure 10. Cooperative clearing iterative convergence process.
Electronics 15 02371 g010
Figure 11. The system cost composition stack comparison diagram in each scheduling scenario.
Electronics 15 02371 g011
Figure 12. The total cost comparison diagram of the system under different scheduling scenarios.
Electronics 15 02371 g012
Figure 13. Typical daily source-load power and new energy output curve.
Electronics 15 02371 g013
Figure 14. Comparison of total system cost in high/medium/low power scenarios.
Electronics 15 02371 g014
Table 1. Main equipment and system parameter settings.
CategoryParameter NameSignValueUnit
CHP unitMaximum electricity output P max C H P 100MW
Minimum electricity output P min C H P 30MW
Maximum heat output Q max C H P 120MW
Electrical-thermal coupling factor α 0.8
Ramp rate constraints R 20MW/h
Heat storage deviceHeat storage capacity E max T E S 200MWh
Minimum heat storage E min T E S 20MWh
Charging efficiency η c h 0.9
Heat release efficiency η d i s 0.9
Maximum charging and discharging power P max T E S 50MW
Grid interactionConnecting line capacity P max g r i d 150MW
Minimum output power P min g r i d 0MW
Carbon costCarbon emission price λ C O 2 80Yuan/t
Time-scaleDispatching cycle T 24h
Table 3. System operating cost structure.
Cost ItemAmount (Yuan)Proportion (%)
Electricity revenue−3000−0.73%
CHP cost338,468.6082.87%
Heat supplement cost60001.47%
Carbon emission cost55,00013.47%
Wind and solar penalty75001.84%
Energy storage system cost15000.37%
Total cost408,468.60100%
Table 5. System operation results under high/medium/low power scenarios.
ScenarioTotal Cost (Yuan)Carbon Emissions (t)Wind and Solar Adjustment Rate (%)Peak Adjustment (MW)
High power output396,50030503.858
Medium power output407,80032104.554
Low power output423,20034105.250
Table 2. Typical daily load and new energy output data.
HourElectric Load (MW)Thermal Load (MW)Solar Power Output (MW)Wind Power Output (MW)
18060025
27858024
37555023
47353022
57655520
685601518
795703016
8110805015
9125907014
101401008515
111501059516
1215511010018
131581109520
141551088522
151501057024
161451005026
17150953028
18160901530
1917085532
2016580030
2115075028
2213070026
2311065025
249560024
Table 4. Comparison of system operation results under different scheduling strategies.
Scenario Total Cost (Yuan) Carbon Emissions (t) Wind and Solar Adjustment Rate (%) Peak Adjustment (MW)
Scenario 1452,300382012.525
Scenario 2428,15034508.640
Scenario 3408,468.6031204.258
Disclaimer/Publisher’s Note: The statements, opinions and data contained in all publications are solely those of the individual author(s) and contributor(s) and not of MDPI and/or the editor(s). MDPI and/or the editor(s) disclaim responsibility for any injury to people or property resulting from any ideas, methods, instructions or products referred to in the content.