1. Introduction
RF sensing technology has developed rapidly in recent years, with microstrip-based sensing designs employing various techniques [
1,
2,
3,
4], including surface plasmon polaritons (SPPs). SPPs were originally unique electromagnetic modes formed by the interaction between free electrons and light waves in the optical band [
5,
6,
7]. To replicate these properties in the microwave frequency band, an SPP structure was proposed by etching artificial periodic structures on metal surfaces [
8,
9]. The short-circuited stubs transmission line laid a crucial foundation for the expansion of SPPs in planar circuits [
10]. Benefiting from their unique localized field enhancement, low-pass and slow wave dispersion characteristics, SPPs have been widely used in the design of dispersive antennas [
11,
12,
13,
14,
15,
16,
17] and high-performance low-pass filters [
18,
19].
Furthermore, microwave sensing applications based on SPPs have also been proposed [
20,
21]. Previous planar microwave sensing technologies, particularly conventional microstrip and spoof surface plasmon polariton-based structures, have demonstrated excellent performance in electromagnetic sensing applications due to their strong field confinement and high sensitivity. Existing spoof SPP sensing structures have been widely investigated for applications including skin abnormality detection [
22], dielectric material characterization [
23], and other microwave material sensing tasks. In parallel, RF-based interactive sensing approaches, such as gesture recognition using e-textile transmission lines [
24] and touch localization based on semi-conductive surfaces [
25], have also attracted increasing attention for human–computer interaction applications. Although these studies demonstrate promising sensing capability, most reported spoof SPP and planar microwave sensors primarily focus on single-function sensing tasks or localized detection scenarios. In addition, many existing RF sensing systems are not designed to simultaneously maintain RF signal transmission and continuous spatial localization capabilities, which limits their applicability in integrated sensing and communication (ISAC)-oriented interactive systems. Meanwhile, integrated sensing and communication concepts have been widely explored in large-scale wireless systems. At the signal processing level, approaches like Modulated Wideband Converter (MWC) networks have been proposed for spectrum sensing [
26]. At the hardware architecture level, ISAC is implemented in macro-scale systems such as millimeter-wave radar and large intelligent surfaces (LISs) [
27]. While these systems enable simultaneous sensing and communication through shared hardware and spectrum resources, their implementations generally rely on large-scale infrastructures and complex setups, making them unsuitable for compact planar microwave sensing platforms.
This paper proposes a touch localization method based on the spectral-position relationship using S-parameter measurements with a microstrip sensing structure. To address the functional limitations of existing planar sensors focused on materials, spatial touch perturbations are uniquely mapped to specific resonant frequency shifts in this framework. This structure consists of a microstrip and a parallel SPPs sensing area. When a finger-like object touches different parts of the sensing area, the induced spectral variations in the S-parameters are processed by a physics-informed framework that couples frequency alignment with GPR to accurately reconstruct the object’s spatial position. Since SPPs transmit electromagnetic waves in the lower frequency band while maintaining a stopband for electromagnetic signals in the higher frequency band, by introducing this structure as a parallel branch of the microstrip transmission line, the compatibility of the RF signal transmission and sensing functions can be realized. This integrated design features low cost, compactness, and multi-functional interaction capabilities. It demonstrates potential for integrated sensing and communication applications such as touch interaction and gesture recognition in the scenario of RF signal transmission. Furthermore, such integrated RF architectures can potentially be combined with advanced array technologies to support secure communications in future wireless networks [
28,
29,
30].
The structure of this paper is as follows.
Section 2 introduces the working principles of the design.
Section 3 shows the feasibility of the design through simulations.
Section 4 provides experimental validation and analyzes the results. Finally, conclusions are given in
Section 5.
2. Theoretical Analysis
The SPP structure is composed of periodic units arranged in series and parallel on the metal surface. Extensive research has been conducted on the mathematical expressions describing the dispersion characteristics of SPP structures, which are determined by their structural parameters. SPP structures are formed by introducing arbitrary periodic modulations onto the planar surface of a perfect electric conductor. Consequently, the mathematical expressions for their dispersion characteristics share significant similarities. As established in references [
31,
32,
33,
34], assuming that the dielectric is air, the dispersion relation for an SPP structure formed by grooves on a metal surface of infinite thickness is given by Equation (1).
where
is the propagation constant of the SPPs,
represents the free-space wavenumber,
and
denote the width and depth of the grooves, respectively, and
is the period of the unit cell. This equation also serves as a fundamental reference for establishing the dispersion relationships of other SPP structural configurations.
The SPP structure can be achieved through periodic variations along the transmission line. Consequently, the microstrip SPP structure is constructed by introducing periodic parallel open circuit branches onto the microstrip metal conductor. The parameters of the microstrip SPP structure can also be designed in accordance with Equation (1).
The working frequency bands of the structure are designed in the gigahertz (GHz) range with sensing function up to 4 GHz to ensure that it achieves sub-centimeter level touch sensing sensitivity. Based on the frequency range, the microstrip SPP unit structure is designed using microstrip technology on an FR-4 substrate, on which the complete SPP structure is implemented.
As shown in
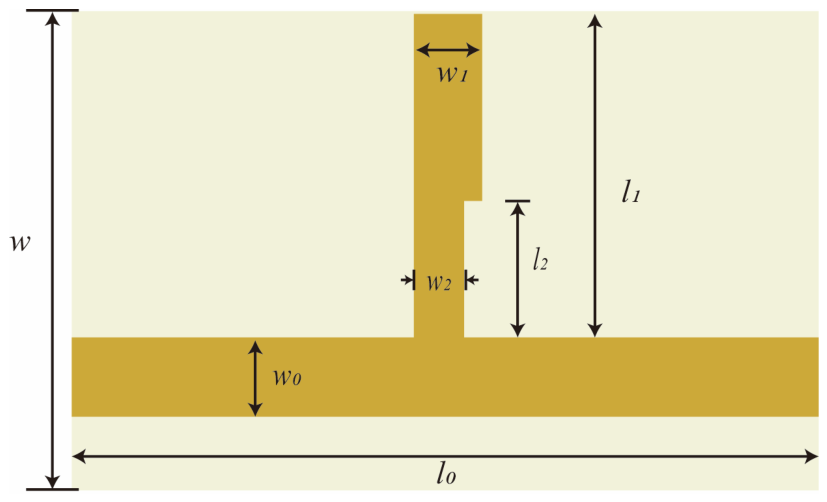
Figure 1 for the SPP unit, the structure is implemented on a dielectric substrate backed by a metal ground plane. It consists of a host microstrip transmission line with length
and width
and the parallel microstrip branch of total length
. The parallel branch comprises two sections: a bottom segment with width
and length
, followed by an open-circuited top segment of width
. From the perspective of an equivalent circuit, the main trunk of the SPP unit along the direction of electromagnetic wave propagation can be modeled as an equivalent inductance, while the branches perpendicular to this direction function as equivalent capacitance. Consequently, during signal transmission, currents within the structure can be excited to resonate, mimicking the behavior of SPPs in the working frequency range. By leveraging the resonant low-pass characteristic of SPPs, the structure functions as a low-pass microstrip filter below a specific cutoff frequency under a periodic arrangement of these units.
In the SPP configuration, signals exceeding the cutoff frequency are suppressed, whereas current signals below the cutoff frequency propagate through the entire structure. The electromagnetic properties are primarily determined by its geometric dimensions of the unit. By optimizing the geometric parameters, precise control over the cutoff frequency and transmission performance of the SPP structure can be achieved. An FR-4 substrate with a thickness of 0.8 mm, a relative permittivity of 4.62, and a loss tangent of 0.015 is used for the proposed structure. Here p = 5 mm denotes the array periodicity, while = 6.5 mm, mm, and mm are key structural parameters for fine-tuning the impedance matching and dispersion characteristics.
As illustrated in
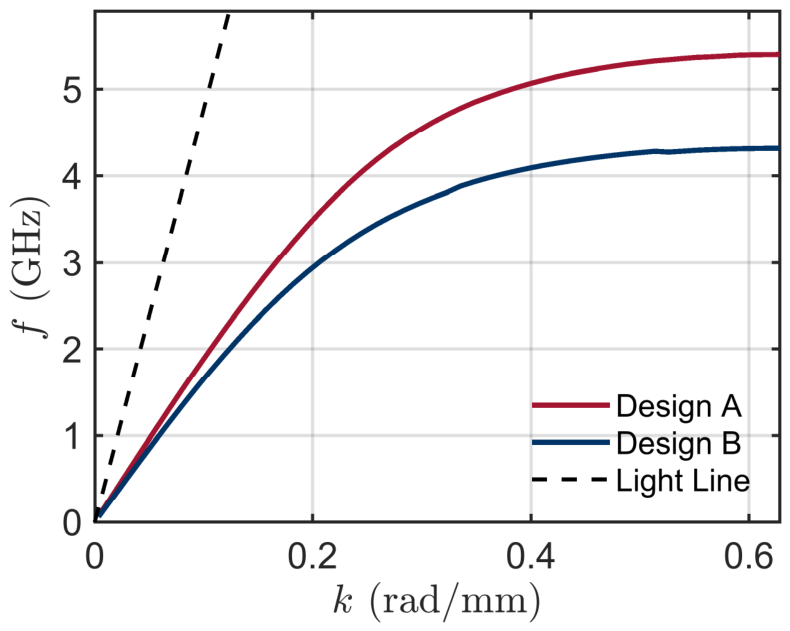
Figure 2, the dispersion curve of the SPP structure based on the unit shown in
Figure 1 was derived using eigenmode analysis. The results indicate that, at the boundary of the Brillouin zone, the asymptotic frequencies of the SPP mode are approximately 5.08 GHz and 4.3 GHz when the parallel branch width
is 0.7 mm and 2 mm, respectively. In addition, the dispersion curve lies consistently to the right of the light line, demonstrating the strong electromagnetic field confinement capability of the structure. Furthermore, the slow-wave factor exhibits a significant increase as the frequency increases. To clarify the mechanism of this frequency shift, the SPP structure can be represented by an equivalent LC circuit model [
35,
36,
37,
38]. The parallel microstrip branch introduces equivalent inductance and capacitance into the system. When the width of the branch top segment is increased from 0.7 mm to 2 mm, the equivalent parallel capacitor of the branch increases substantially. Because the asymptotic frequency is inversely proportional to the square root of the equivalent circuit parameters, the increased capacitor causes the dispersion curve to shift toward lower frequencies. As a result, the working frequency is reduced without increasing the physical length of the branch, which offers an effective strategy for the miniaturization of SPP-based devices. By increasing the capacitive reactance of the top segment, the proximity of the external medium can introduce more pronounced capacitance perturbations, thereby significantly improving the sensitivity of the proposed sensing mechanism.
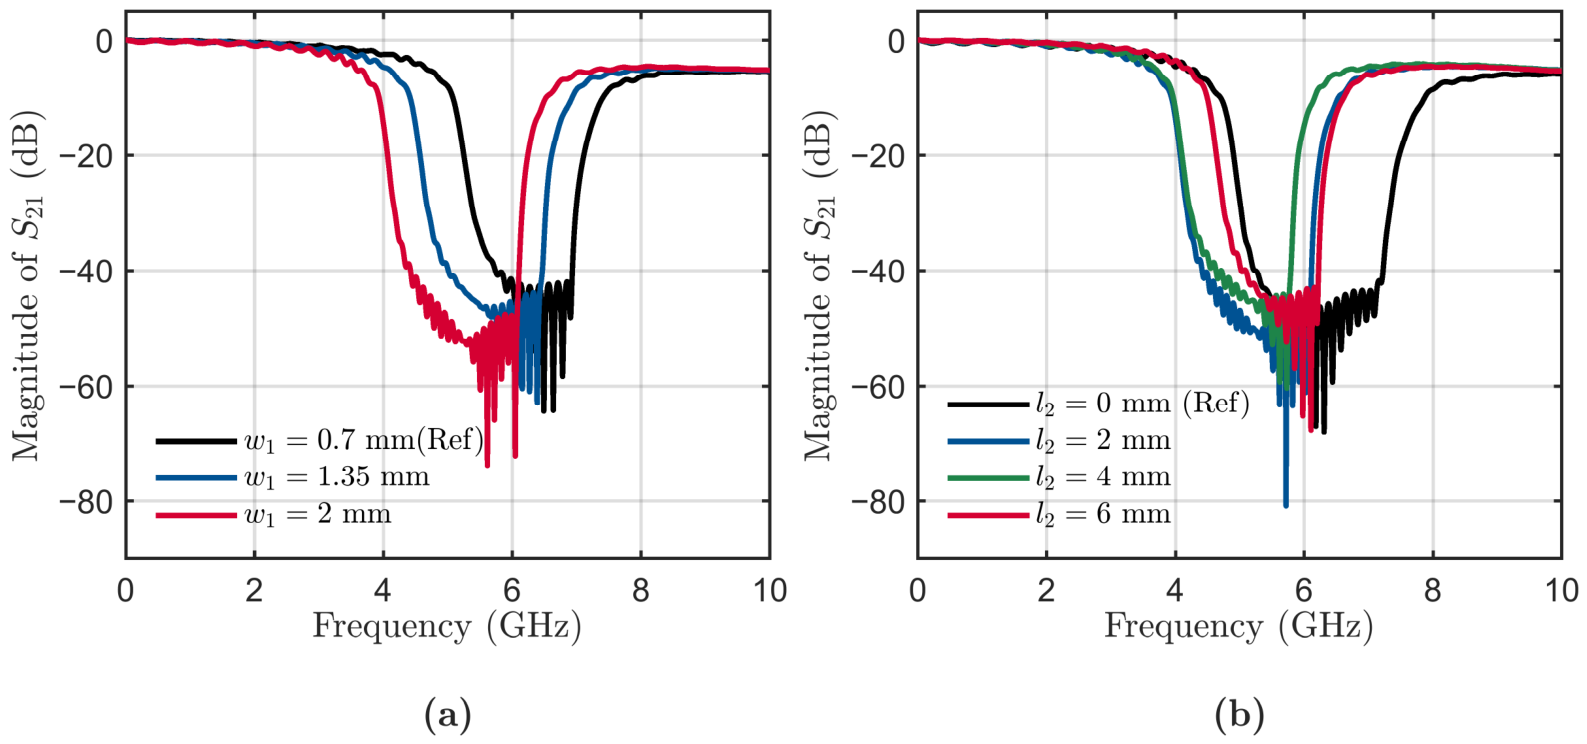
Figure 3a shows the variation of transmission coefficient with the frequency for different branch widths
. It can be observed that the structure with
mm achieves the highest signal suppression in the 4.7 GHz to 6 GHz frequency band. A similar mechanism is observed for the selection of
. As shown in
Figure 3b, when
is set to 2 mm, the structure exhibits strong stopband rejection over the target frequency band. Accordingly,
= 2 mm and
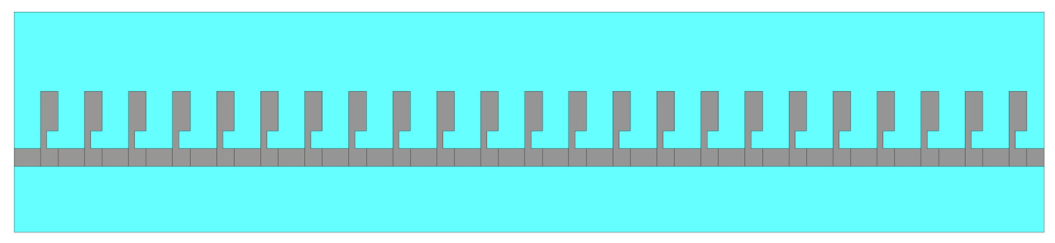
= 2 mm were selected as the optimized parameters for the final unit. The geometric configuration of the proposed SPP sensing structure based on these optimized parameters is shown in
Figure 4.
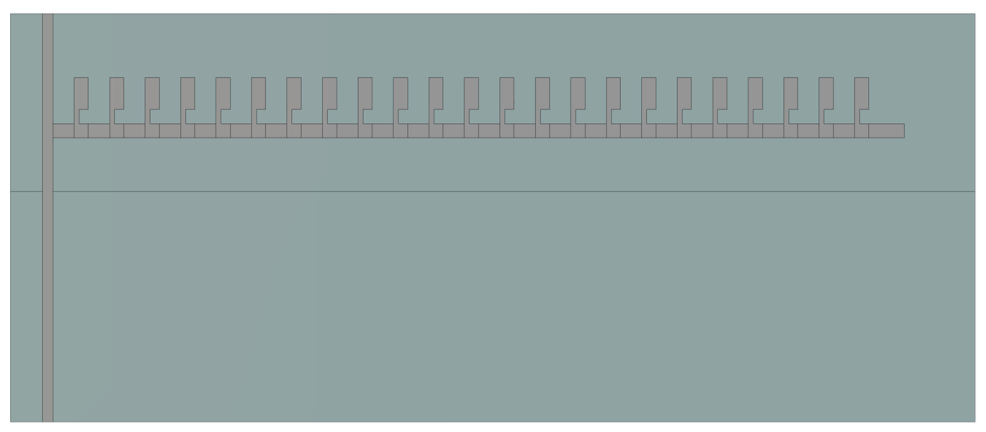
To utilize these low-pass and highly confined electromagnetic properties for practical applications, the SPP structure is incorporated as a parallel branch to a conventional host microstrip transmission line, forming an integrated sensing and communication structure as presented in
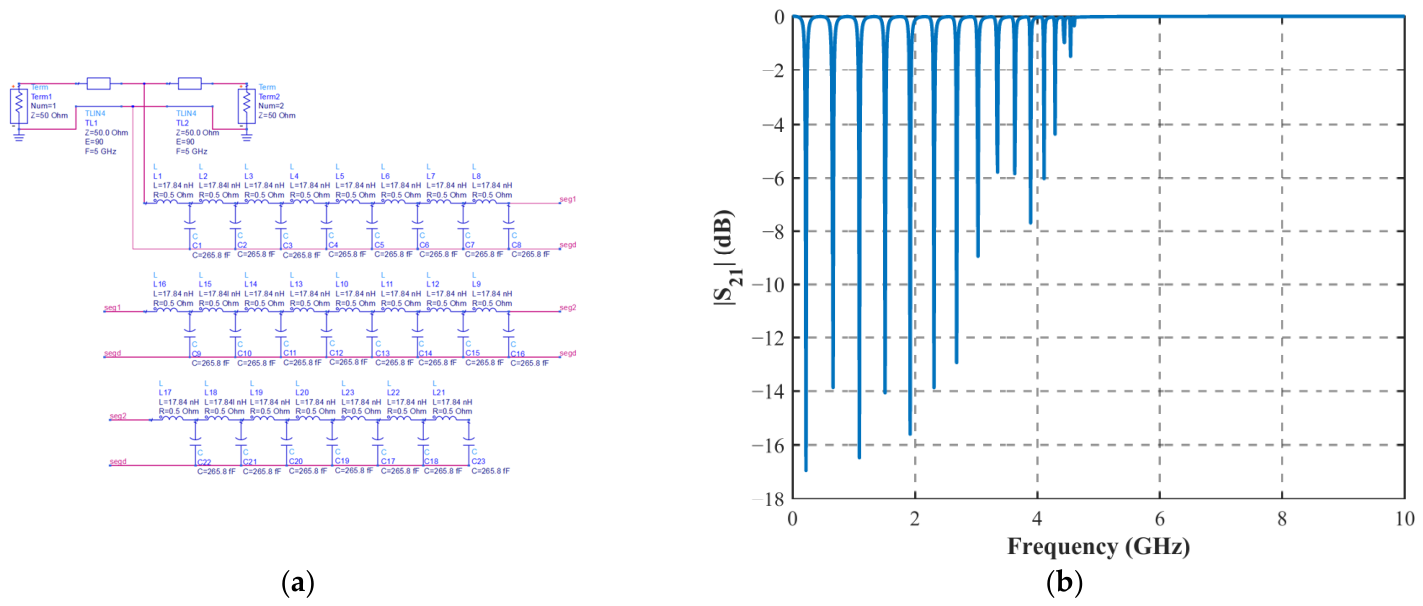
Figure 5. In this configuration, the main microstrip path enables signal transmission in the higher frequency band, while the parallel SPP units introduce multiple resonant modes below the cutoff frequency. To further elucidate the transmission mechanism of the entire parallel system, a cascaded equivalent LC circuit model is established, as depicted in
Figure 6a, where L = 17.84 nH and C = 265.8 fF. By calculating this circuit model using Advanced Design System with a simulation frequency sweep range from 0 to 10 GHz, the
result is obtained, as shown in
Figure 6b. It clearly exhibits the multiple resonance dips corresponding to the periodic SPP units. However, it is worth noting that the theoretical curve exhibits almost zero insertion loss in the passband and idealized resonant peaks without attenuation. This discrepancy arises because the equivalent circuit model purely captures the primary inductance and capacitance, completely neglecting the dielectric loss of the FR-4 substrate, the ohmic loss of the copper traces, radiation loss, and the complex parasitic capacitances between adjacent microstrip cells that are inherently captured in the full-wave simulations performed in CST Microwave Studio.
3. Design and Simulation
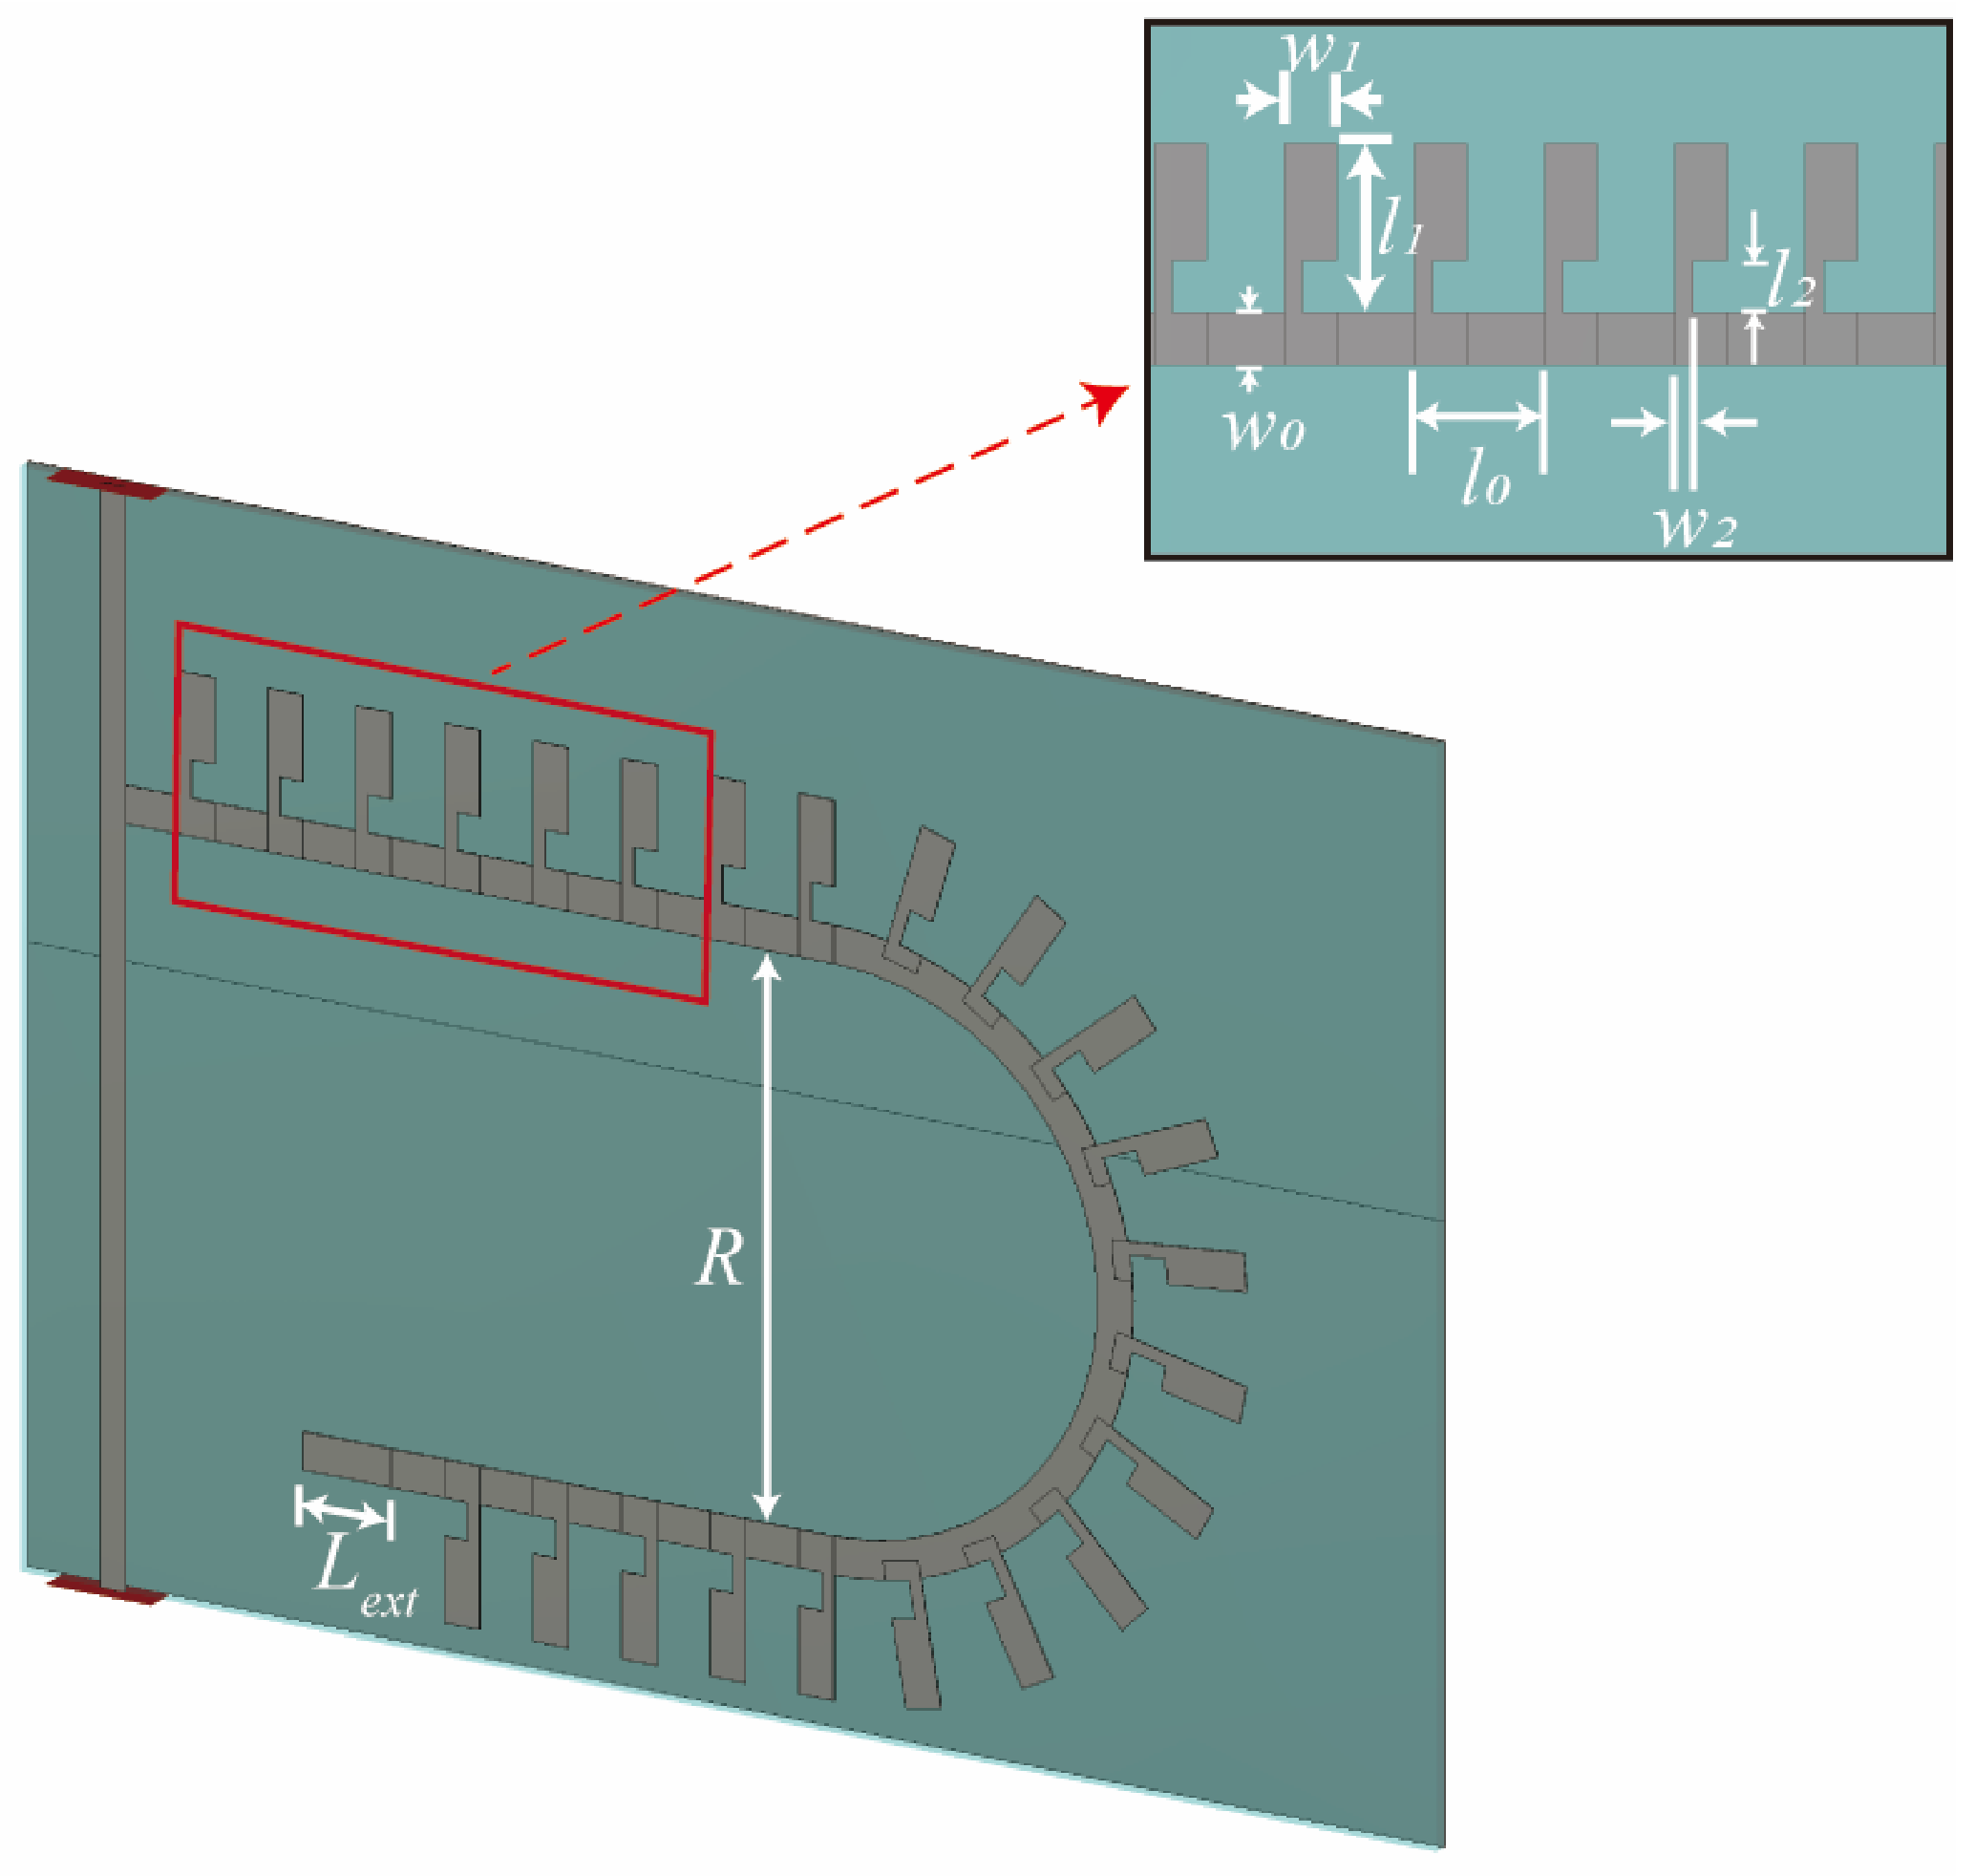
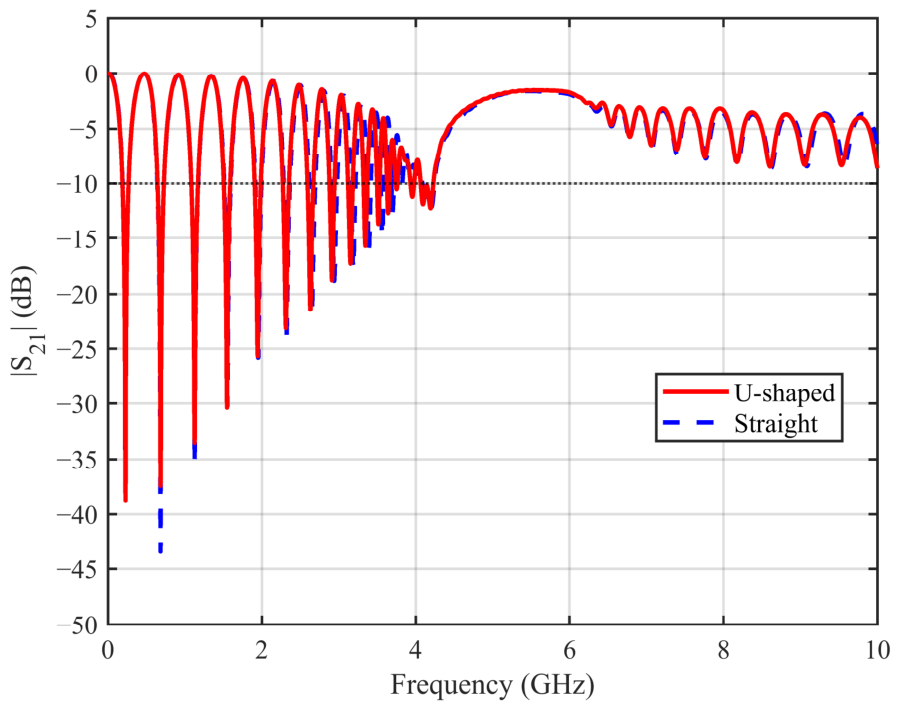
While the straight SPPs structure serves as an excellent reference to demonstrate the theoretical transmission behavior, its physical length limits its integration. To reduce the footprint of the sensing structure for compact applications, a U-shaped SPPs sensing structure is proposed, as shown in
Figure 7. The U-shaped geometry is essentially a folded implementation of the straight SPP array, in which all key geometrical parameters are preserved. Comparative simulation results indicate that the
values of the two configurations are nearly identical, as shown in
Figure 8. This confirms that the electromagnetic characteristics are preserved after folding. Therefore, the detailed geometric parameters are provided only for the U-shaped structure in
Figure 7, since the straight-line configuration shares the same parameters set. This design approach ensures structural compactness without altering the fundamental multiple resonance behavior of the SPP units.
The microstrip structure is fabricated on an FR-4 substrate with overall dimensions of 80 mm
57.5 mm. The substrate has a thickness of
, a relative permittivity of
, and a copper sheet thickness of 0.0375 mm. The port impedance and characteristic impedance of the microstrip line are both 50
. For better sensing response of SPPs, an extension transmission line with a length of
is introduced at the end of the SPPs structure. The optimized geometric dimensions are listed as follows:
= 14.9 mm,
= 5 mm,
= 5 mm,
= 6.5 mm,
= 2 mm,
= 2 mm,
= 2 mm,
= 0.7 mm. To evaluate the impact of the U-shaped configuration on transmission performance,
Figure 8 compares the
parameters of a conventional straight SPP line and the proposed U-shaped structure. The results show that the two curves are almost perfectly aligned, indicating that folding the SPPs into a U-shape does not significantly alter their intrinsic low-pass response. This characteristic makes the structure well-suited for compact sensing applications.
The transmission performance of the designed U-shaped SPPs waveguide was simulated using CST Microwave Studio. The simulated
amplitude response of the U-shaped SPP is plotted in
Figure 8. For frequencies below 4.7 GHz, the S-parameters display clear multiple resonance features. Within this band, the
curve exhibits severe frequency-dependent ripples, with amplitudes fluctuating from nearly 0 dB to resonant poles below −10 dB. Notably, the number of these resonant poles is governed by the quantity of shunt stubs along the SPP transmission line. In the frequency band of 4.7–6.0 GHz, the
amplitude curve demonstrates a remarkably flat passband with only minimal signal attenuation, indicating high transmission efficiency. The lower cutoff frequency of communication band is observed at
, corresponding to the −3 dB point of
. Within the passband, the minimum insertion loss is about 1.5 dB to achieve stable signal transmission. Furthermore, a flatter
response is achieved by optimizing the length
of the SPP shunt stub to suppress in band signal ripples.
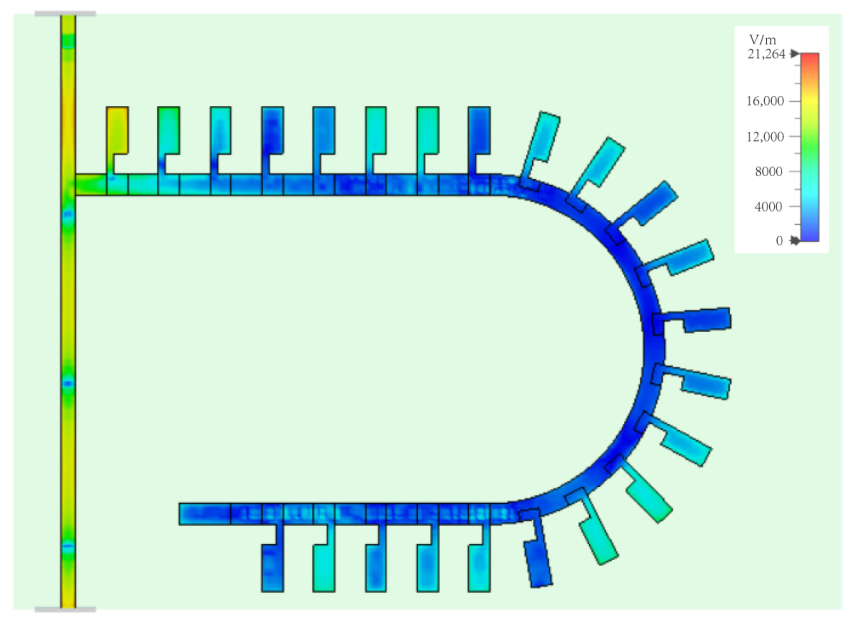
To illustrate the transmission capability in the proposed passband,
Figure 9 shows the simulated electric field distribution at 5.0 GHz. In
Figure 9, the electric field is predominantly concentrated along the main microstrip path and exhibits minimal field leakage into the SPP branch structure. This field distribution is consistent with the working principle of the designed microstrip filtering characteristics. In the proposed passband, the SPP units enforce strong field confinement, effectively suppressing electromagnetic propagation within the branch structures and thereby restricting most of the energy to the main microstrip path. Consequently, the signal propagates efficiently along the main microstrip path with low insertion loss, validating the proposed transmission characteristic.
To evaluate the sensing performance of the SPP sensing structure, two distinct Substance Under Test (SUT) models, a water tank and a human finger model, were positioned at different positions of the SPP sensing structure to simulate the variation in electromagnetic response. The walls of the water tank were designed to mimic the experimental 3D printed block, with the wall thickness of 1.0 mm and PLA material properties with a relative permittivity of and a loss tangent of . The water in the tank was modeled as dielectric blocks, , . The tank can span two units with . Meanwhile, a simplified human finger model was created with dimensions of to demonstrate bio-sensing capabilities. This phantom was assigned a relative permittivity of and a conductivity of to approximate the dielectric properties of human skin and muscle tissues at microwave frequencies.
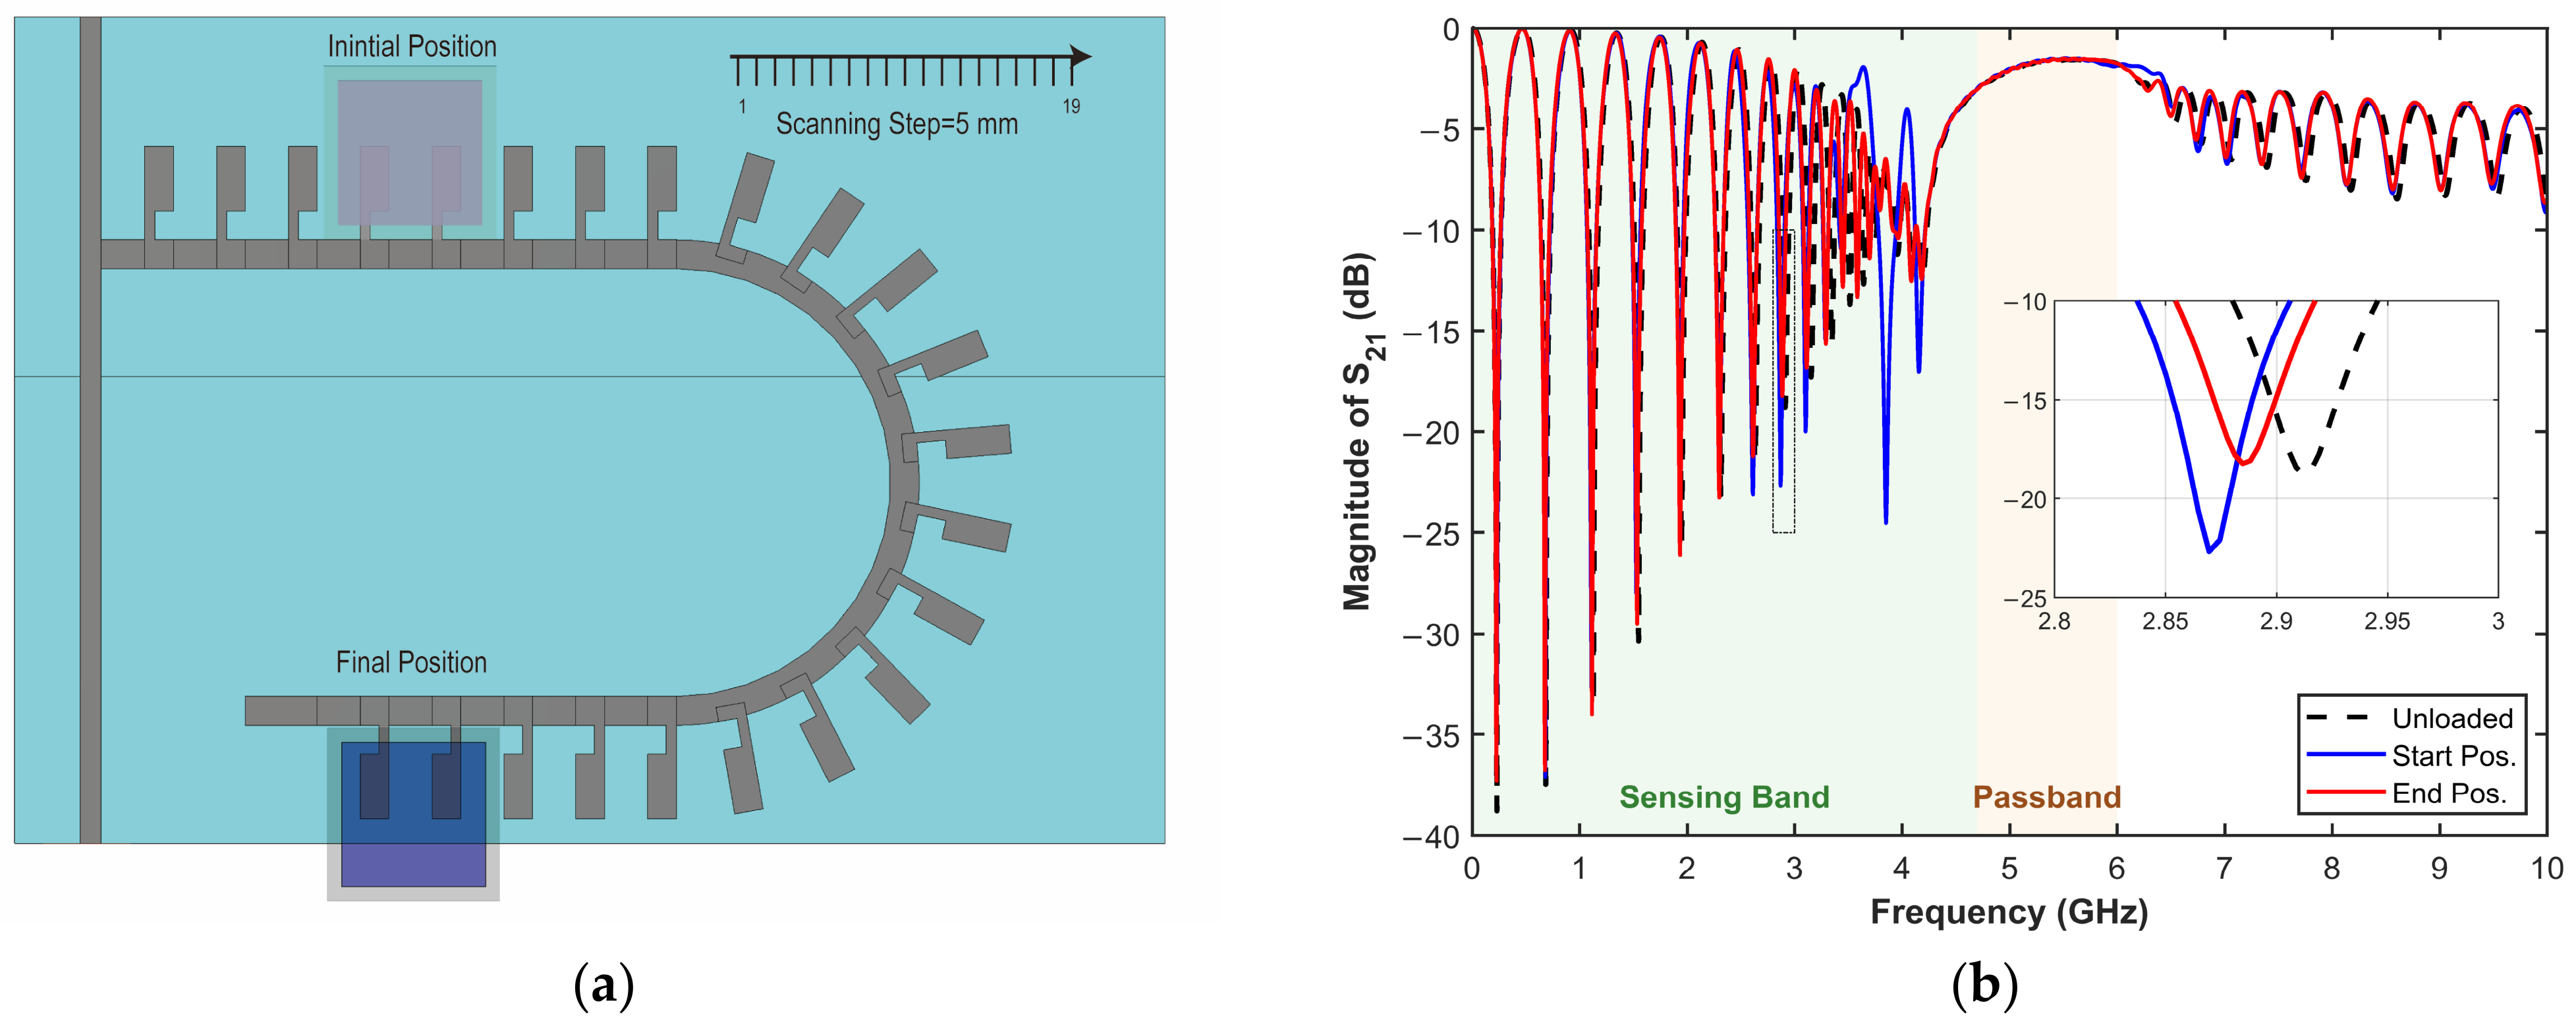
As illustrated in
Figure 10a, a scanning simulation experiment was conducted by sweeping across the SPP sensing area to systematically evaluate the electromagnetic response to spatial position and SUTs, including a water tank and a finger model. In this setup, the SUT was placed on the SPP units directly and translated with a step size of 5 mm, covering the sensitive regions spanning the shunt branches of each SPP unit. Two distinct target objects, a water tank and a finger model, were simulated. This setup rigorously accounts for the 1 mm standoff distance created by the container bottom, which separates the water from the sensing structure.
To intuitively illustrate the spectral perturbations induced in the transmission response during sensing operation,
Figure 10b presents the
transmission amplitude curves measured at several representative contact positions of the water tank. It can be clearly observed that when the SUT enters the sensitive area of the SPP units, the resonant frequency points exhibit a significant shift, accompanied by variations in the amplitude of multiple resonant frequency points. These distinct spectral perturbations intuitively indicate the RF sensing capability and sensitivity of touch detection.
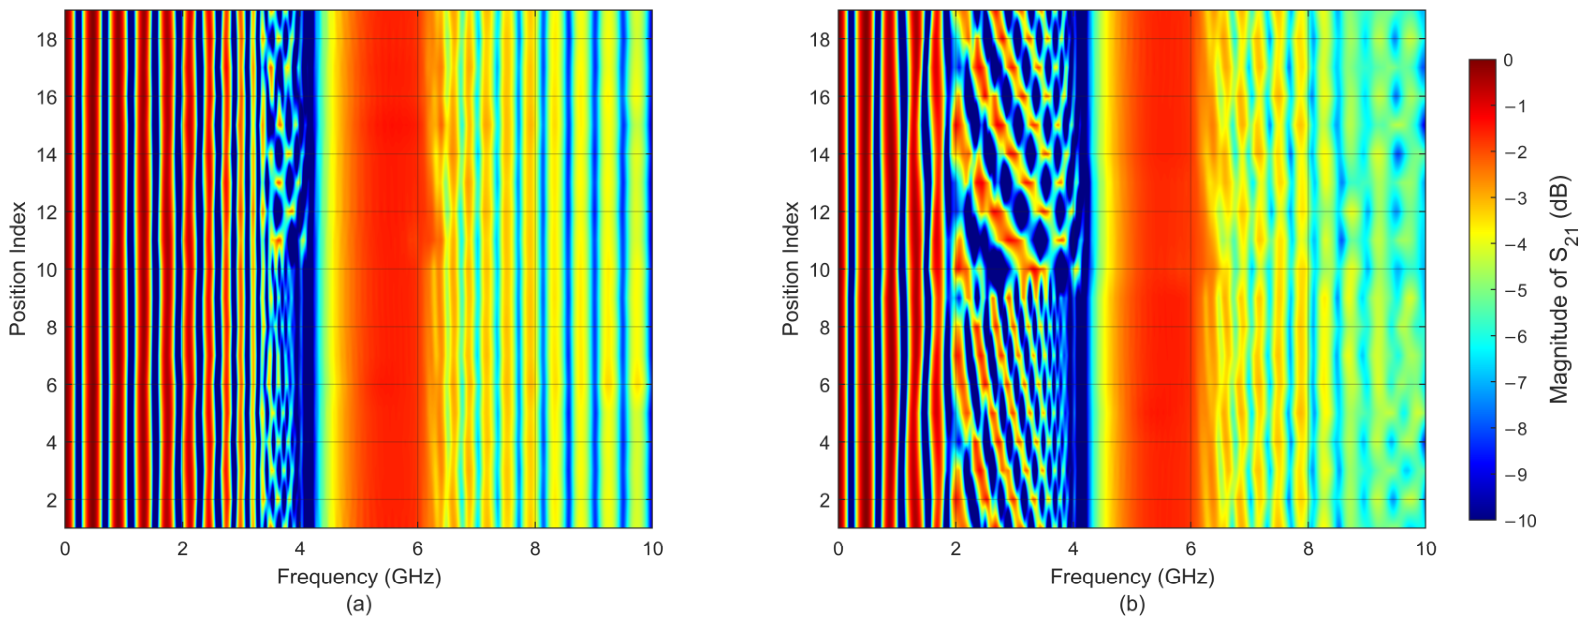
By compiling the
amplitude data acquired from nearly 40 spatially discrete positions,
Figure 10a shows the two-dimensional spectral-position maps. For the spectral-position maps in
Figure 11, 19 representative positions with a 5 mm interval are shown. For the regression dataset, denser simulations with a 0.5 mm displacement step resolution were further conducted. Throughout the testing range, the passband of the microstrip remains stable and unchanged upon the introduction of an SUT at different positions. This confirms that the localized touch does not disrupt the global propagation mode of the surface waves within the pass band, thereby validating the signal transmission stability of the structure.
In contrast, within the sensing band below 4.7 GHz, the trajectory of the resonant frequency points is clearly visualized in the form of a frequency comb. As the SUT moves from the position 1 toward position 19, the resonant frequency points gradually shift along the frequency axis, exhibiting smooth variations. These response curve changes indicate that the spectral perturbation strength is not strictly uniform along the structure but is influenced by the local electromagnetic field distribution of each SPP unit.
Compared to the water tank, the finger phantom induces a larger frequency shift and more pronounced amplitude fluctuations in the resonance response trajectories, as illustrated in
Figure 11. This discrepancy can be primarily attributed to the differences in the physical interface between the two SUTs and the sensing structure. Specifically, the 1 mm thick plastic base of the water tank acts as a dielectric standoff layer, preventing direct contact between the water dielectric and the sensor surface, which partially attenuates the coupling between the water and the fringing electric fields. In contrast, the human finger is pressed directly against the sensing area, establishing intimate physical contact. Furthermore, human tissue possesses a considerably higher relative permittivity and loss tangent compared to the PLA material of the water tank wall. Due to the combination of direct contact and stronger dielectric loading, the finger introduces a significantly greater perturbation to the fringing electric fields, thereby producing a larger resonant frequency shift. Notably, the resonance features remain spatially continuous from position 1 to position 19, indicating that the sensing response maintains positional correlation rather than random fluctuation. These results collectively validate that the proposed microstrip sensing structure is capable of resolving touch location through the measurement of spatially dependent spectral perturbations, as explicitly tracked by the frequency shift trajectory and the resonant response.
To further evaluate the spatial localization capability of the proposed microstrip SPP structure, a quantitative position reconstruction framework was established. The objective of this work is to determine whether the spectral perturbations induced by touches at different target positions contain sufficient information to accurately infer spatial position.
In order to establish a spectral-position relationship for the sensing structure, a series of full-wave simulations were conducted using CST Studio Suite. During the simulations, the sensing target was translated along the transmission line with a displacement step size of 0.5 mm. The corresponding transmission spectrum was recorded for each simulation.
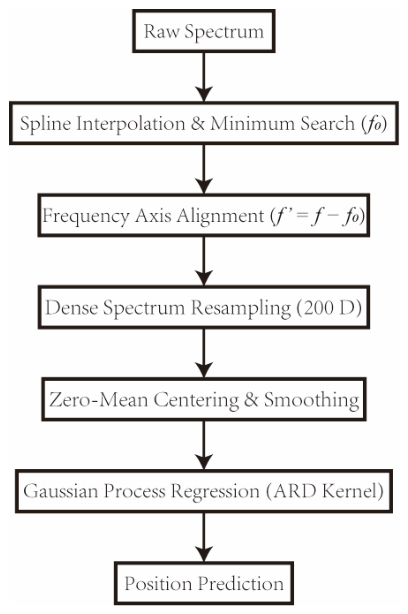
Instead of relying on handcrafted feature engineering, a compact and physics-informed regression framework based on spectral alignment and Gaussian process regression (GPR) was proposed to robustly extract the underlying spectral-position relationship. The overall processing pipeline of the proposed framework is illustrated in
Figure 12.
Given the transmission response
, spline interpolation is first applied to accurately identify the resonance minimum frequency
. The frequency axis is then transformed into a relative coordinate, as defined in Equation (2).
where
is the aligned relative frequency axis,
denotes the original absolute sweeping frequency axis of the measured spectrum, and
represents the frequency corresponding to the minimum of the measured transmission profile, thereby removing redundant global frequency offsets while preserving local spectral perturbations induced by spatial variations. The aligned spectrum is resampled onto a fixed 200-dimensional grid, followed by zero-mean normalization and moving average smoothing. The resulting feature vector is then fed into a GPR model with an Automatic Relevance Determination (ARD) squared exponential kernel, defined as Equation (3).
where
is the covariance kernel function evaluating the similarity between two spectral feature vectors
and
, and
and
are their
-th dimensional components.
represents the signal variance,
is the total number of feature dimensions, and
denotes the characteristic length-scale of the
-th feature dimension. The ARD mechanism adaptively weights the contribution of different spectral regions, enabling effective nonlinear regression with strong generalization capability [
39,
40,
41,
42]. To robustly train the GPR model and select the optimal hyperparameters, a fivefold cross-validation strategy with a fixed random seed was implemented to partition the dataset. For the dense simulation dataset, which comprises approximately 190 samples collected with a 0.5 mm displacement step, 80% of the data in each fold was randomly assigned for training and the remaining 20% for testing. During the training phase, the hyperparameters of the ARD squared exponential kernel, namely
and
, were automatically optimized by maximizing the log marginal likelihood. This Bayesian optimization inherently introduces a penalty for model complexity, which effectively mitigates potential overfitting issues when handling the 200-dimensional spectral features.
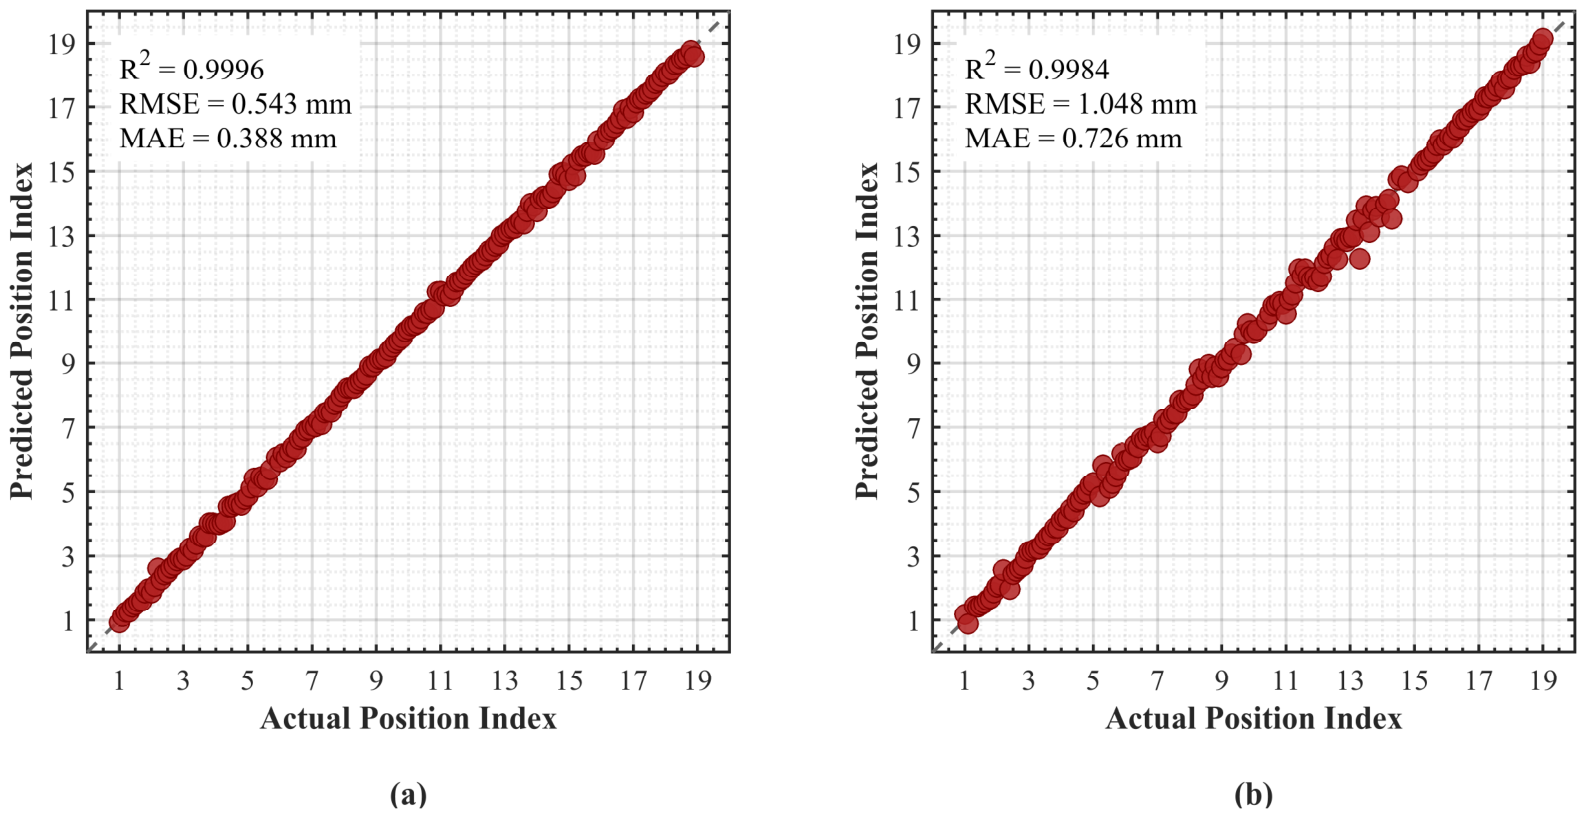
Figure 13 presents the predicted positions by the GPR model versus the actual physical displacements in the simulation environment. For the finger model in
Figure 13a, the regression yields an excellent
of 0.9996, with a Root Mean Square Error (RMSE) of 0.543 mm and a Mean Absolute Error (MAE) of 0.388 mm. Similarly,
Figure 13b demonstrates robust predictive performance for the water tank model with an
of 0.9984, an RMSE of 1.048 mm, and an MAE of 0.726 mm.
To systematically investigate the underlying algorithmic mechanisms and explicitly quantify the contribution of each proposed module, a progressive ablation study was conducted in the simulation environment. Instead of evaluating the system as a black box, we designed five incremental configurations. This approach isolates the performance gains achieved by our specific choices in regression modeling, physical normalization, feature extraction, and frequency alignment. The configurations are defined as follows.
Exp 1 represents the conventional approach in microwave sensing. It extracts 2D peak features, including resonant frequency and depth, and applies standard statistical Z-score normalization. A Support Vector Machine is then employed as the regressor. The Support Vector Machine is replaced with GPR in Exp 2, which validates the superiority of GPR in handling the inherent uncertainties of small-sample datasets while isolating its individual contribution. Exp 3 substitutes the Z-score normalization with a moving average smoothing scheme. This configuration evaluates the contribution of preserving raw amplitude information to the overall regression accuracy by retaining the physical amplitude variations rather than enforcing standardization. Exp 4 transitions from isolated peak tracking to a 200-dimensional data spectral representation, aiming to demonstrate that the complete spectral envelope carries structural information that is lost in traditional peak-based methods. Exp 5 represents our complete proposed framework. It introduces the frequency alignment module, shifting the data to a relative frequency axis centered at the primary resonance. Although this module is fundamentally designed to mitigate dataset shift and geometric misalignments in practical scenarios, evaluating it here under ideal simulation conditions establishes a baseline for the subsequent experimental validation. All configurations were evaluated under rigorous cross-validation to ensure fairness. The predictive performance, quantified by the
, MAE in physical units, for the finger model and the water tank model is summarized in
Table 1 and
Table 2, respectively.
Under ideal numerical conditions without measurement noise, the dense spectrum configurations unaligned model achieves near-perfect predictive accuracy, outperforming the aligned model, in which a measurable but modest performance degradation is observed. This behavior confirms that in a pristine, noiseless environment, the absolute resonance frequency itself serves as a highly informative indicator of spatial perturbation. In this context, the alignment operation removes globally shared frequency components while preserving local discriminative spectral patterns. Accordingly, the proposed alignment strategy can be interpreted as a controlled mechanism to reduce redundant frequency information and enhance robustness by suppressing absolute frequency references. Although this leads to a slight degradation under ideal conditions, it proves essential for mitigating dataset shift in experimental scenarios. As will be further demonstrated in the experimental section, the aligned model substantially outperforms its unaligned counterpart in real world settings, despite underperforming in noise-free simulations.
4. Experiments
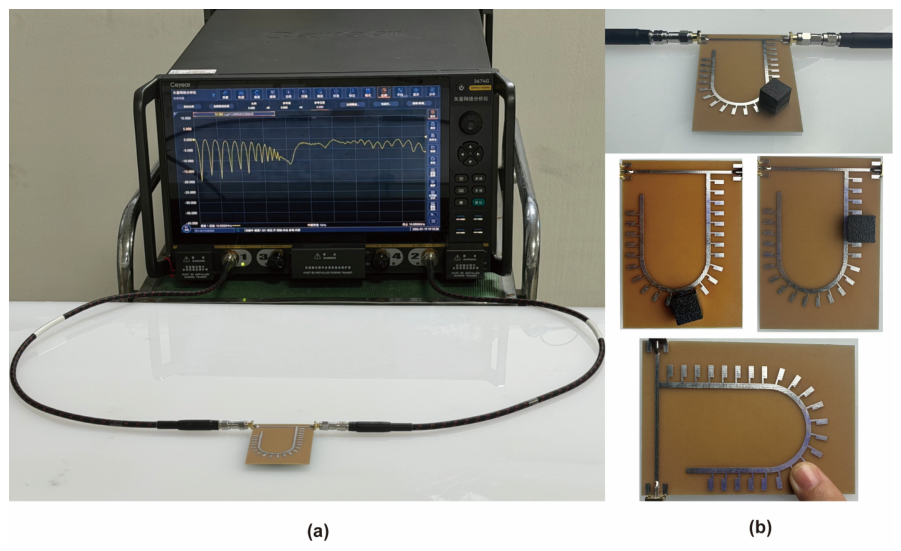
An experimental sample was fabricated to verify the sensing principle of the proposed SPP microstrip sensing system. The experimental setup is illustrated in
Figure 14a. The prototype microstrip structure was connected to the Vector Network Analyzer (VNA) Ceyear 3674G (from Ceyear Technologies, Qingdao, China) via coaxial lines and SMA connectors to measure the
. For the real-time dynamic tracking evaluation, the VNA was configured with 201 sweep points and an intermediate frequency bandwidth of 10 kHz to minimize the hardware sweep time. Prior to the measurements, a standard full two-port calibration procedure was performed to establish accurate measurement reference planes at the SMA connectors, to effectively eliminate systematic errors introduced by the VNA and coaxial cables. Furthermore, all physical measurements were conducted in a stable indoor laboratory environment with an ambient temperature of approximately 25 °C to minimize environmental interference. To rigorously evaluate the system’s repeatability, the measurement at each spatial position was repeated multiple independent times. For the quantitative data analysis, two independent trials were specifically selected. Although the maximum amplitude discrepancy between these two measurements was strictly within 1.8 dB, their spectral responses were still averaged. This averaging process was employed to further suppress random background noise and ensure the highest possible reliability for the subsequent feature extraction. To obtain the full measurement results of
for the sensing structure, the SUT was placed on the sensing structure with a step resolution of 5 mm. As illustrated in
Figure 14b, the touch region covered the entire sensitive area, including the SUT, with a water tank or a human finger. The highly consistent S-parameter responses observed across these repeated trials confirmed the excellent repeatability of the system.
The results shown in
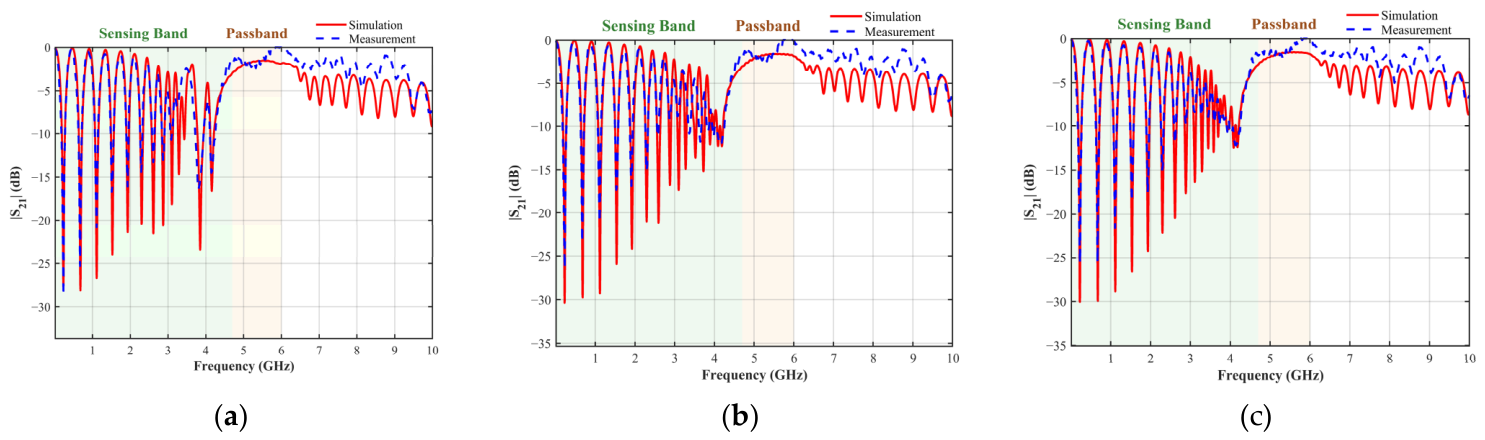
Figure 15 compare the amplitude variations of simulated and measured transmission coefficients of the proposed structure at various sensing positions. The simulation results are denoted by solid red curves, while the experimental measurements are represented by dashed blue curves.
As illustrated in
Figure 15, the working frequency range of interest is divided into two functional regions, a lower-frequency sensing band below 4.7 GHz and a communication band from 4.7 GHz to 6.0 GHz. The higher frequency spectrum beyond 6.0 GHz falls outside the designed operational bandwidth and is therefore excluded from the analysis. Within the sensing band, the structure exhibits multiple sharp resonance dips corresponding to different spatial positions. The measured resonant frequencies align well with the simulated predictions, validating the accuracy of the spatial localization mechanism. However, the measured resonance dips are generally shallower than those predicted by the simulations. This amplitude degradation is primarily attributed to the inherent dielectric losses of the substrate and the ohmic losses from the surface roughness of the fabricated traces.
The frequency range from 4.7 GHz to 6.0 GHz is designated as the communication passband. The simulation and experimental results show that it remains stable regardless of the sensing state. In simulation, the idealized structure exhibits a flat passband with an insertion loss ranging from approximately 1.5 dB to 3.0 dB, indicating high transmission efficiency with moderate in-band fluctuation. Meanwhile, in the experimental measurements, the amplitude curve exhibits 2.4 dB ripples, although the overall insertion loss within the passband is lower than in the simulation, fluctuating between approximately 0 dB and 2.4 dB. This discrepancy between simulation and measurement is primarily attributed to several practical factors. Firstly, impedance mismatches and parasitic radiation at the transitions between the SMA connectors and the microstrip line introduce signal reflections and ripples within the passband. Secondly, the actual FR-4 substrate and copper traces exhibit lower dielectric and ohmic losses than the conservative values assumed in the numerical model, resulting in a lower measured insertion loss in the experiment than in the simulation. Thirdly, uncalibrated electromagnetic scattering and reflections from nearby cables and surrounding objects in the measurement environment further perturb the transmission response. Nevertheless, despite the practical fluctuations caused by fabrication tolerances and material variations, the proposed structure successfully sustains a stable transmission channel. To further verify the integrity of the communication signal, a QPSK signal transmission experiment was conducted using a N5172B vector signal generator (from Keysight Technologies, Santa Clara, CA, USA) and a N9000B signal analyzer (from Keysight Technologies, Santa Clara, CA, USA). The QPSK signal with a 1 MHz bandwidth was modulated onto a 5 GHz center frequency. The measured Error Vector Magnitude was strictly maintained below 1.7% across all tactile sensing states, including the unloaded condition, finger touch, and water tank loading, explicitly confirming that the communication signal remains undistorted and maintains high integrity throughout the simultaneous sensing process.
Overall, despite the minor discrepancies caused by fabrication tolerances and material variations, the high consistency between the simulated and experimental results within the functional bands validates the proposed dual-function mechanism.
To experimentally validate the spatial localization capability, physical measurements were conducted across 19 positions with the SUT. At each spatial position, two independent measurements were performed and subsequently averaged to suppress random background noise, yielding a total of 19 experimental samples. Consistent with the methodology established in the simulation phase, the same algorithmic analysis framework was applied to process the measured spectral data. Given the limited number of experimental samples, a Leave-One-Out Cross-Validation strategy was adopted to rigorously partition the training and testing sets. Specifically, in each of the 19 iterations, 18 samples were used to train the GPR model and optimize the kernel hyperparameters, while the single remaining sample served as the blind test set. The hyperparameters of the ARD squared exponential kernel were automatically optimized in each iteration by maximizing the log marginal likelihood. This Bayesian optimization inherently introduces a penalty for model complexity, which effectively mitigates potential overfitting issues despite the limited sample size. This rigorous Leave-One-Out Cross-Validation strategy ensures an unbiased and reliable assessment of the model’s generalization capability in practical noisy environments.
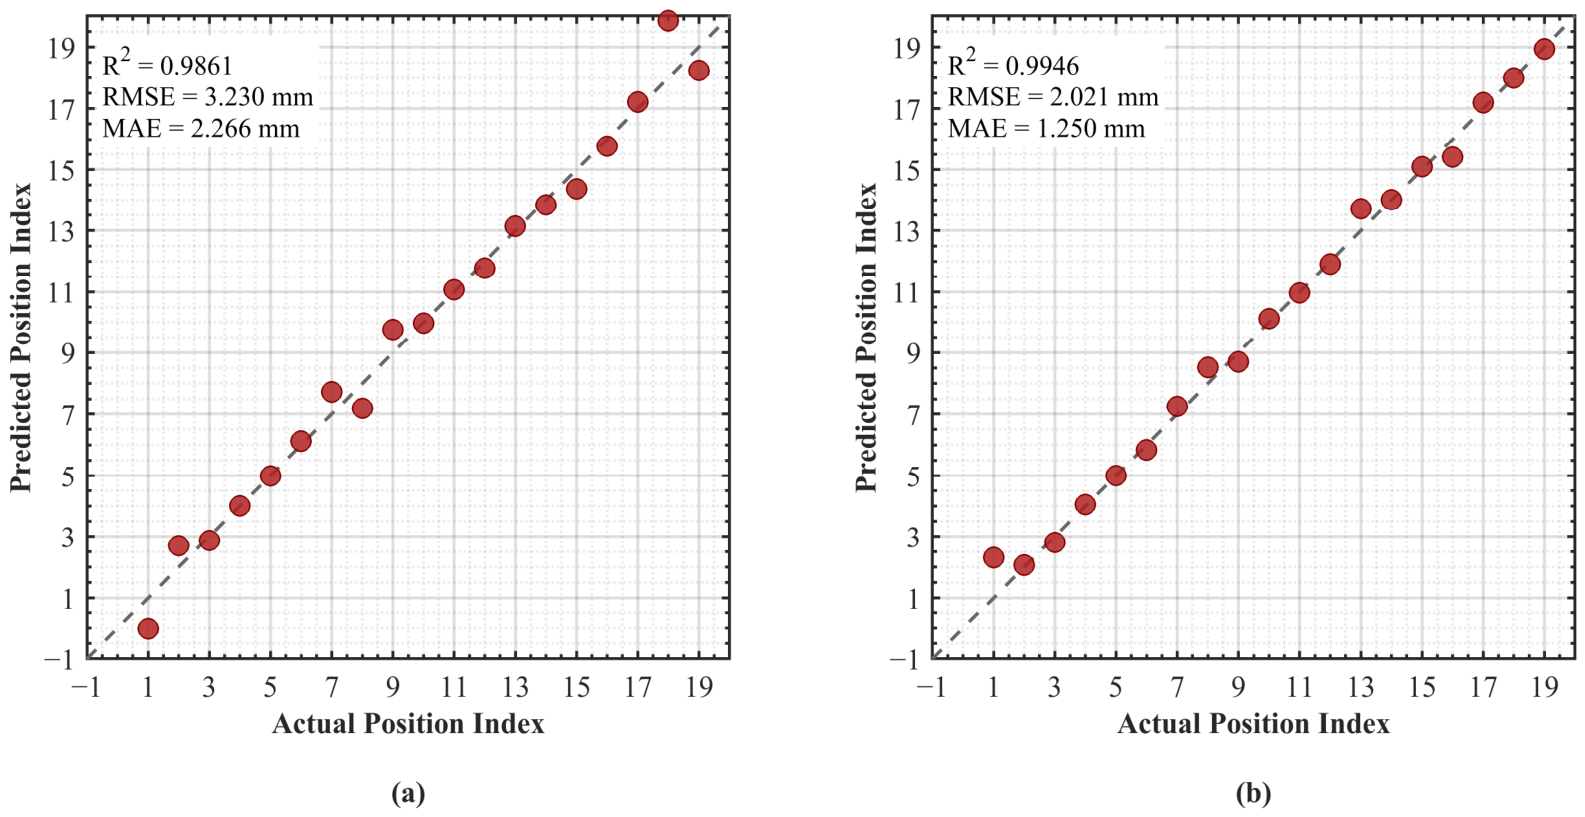
Figure 16 illustrates the predicted positions versus the real displacements, demonstrating accurate linear tracking under practical conditions. Specifically, for the finger model shown in
Figure 16a, the regression achieves an
of 0.9861, with an RMSE of 3.23 mm and an MAE of 2.266 mm. Similarly, for the water tank model in
Figure 16b, the fitting accuracy reaches an
of 0.9946, with an RMSE of 2.021 mm and an MAE of 1.250 mm. In both scenarios, the reconstructed positions closely follow the ideal linear relationship, confirming that the measured spectral responses retain sufficient spatial information for accurate position reconstruction. Furthermore, the RMSE remains below the 5 mm physical spacing between adjacent sensing elements, indicating that the system’s achievable spatial resolution is not fundamentally limited by the structural periodicity.
It should be noted that the localization errors in the experimental results are noticeably larger than those obtained in the simulation. This discrepancy primarily stems from three practical factors. First, the simulation environment is mathematically ideal with a fine displacement step size of 0.5 mm, enabling high spatial resolution in the reconstructed position estimates. In contrast, due to experimental condition limitations and the physical constraints imposed by manual hand positioning, the measurement step size was increased to 5 mm in the practical implementation. This tenfold increase in the measurement unit directly amplifies the baseline localization error, as the model can only resolve positions within the granularity of the step size. Furthermore, the physical prototype inevitably suffers from hardware imperfections, such as impedance mismatches at the SMA connectors, parasitic radiation, and fabrication tolerances of the FR-4 substrate and copper traces, which introduce unavoidable baseline ripples and amplitude distortions into the measured S-parameters, compounding the effect of the coarser step size. Second, experimental measurements are subject to minute mechanical alignment errors during the physical placement of the SUT. Unlike the mathematically precise 0.5 mm displacement steps in the simulation, manual positioning introduces sub-millimeter geometric deviations, which inherently introduces uncertainty into the spatial coordinate ground truth used for model evaluation. Third, uncalibrated environmental interferences, including RF coaxial cable bending and ambient electromagnetic scattering, cause dynamic baseline drifts that are entirely absent in the noise-free simulation environment. Nevertheless, despite these compounded real-world perturbations, the reconstruction errors remain below the 5 mm inter-position spacing, demonstrating that the proposed GPR and frequency alignment framework effectively captures the essential spatial-spectral features and validating its robustness in practical applications.
An ablation study was conducted on experimentally measured data to systematically investigate the contribution of each algorithmic module. Consistent with the simulation analysis, the configurations range from the traditional peak-tracking baseline to the complete proposed framework. The corresponding metrics for the finger model and the water tank model are summarized in
Table 3 and
Table 4, respectively.
Unlike the ideal simulation environment, practical measurements are inherently susceptible to physical disturbances, such as RF cable bending, subtle connector mismatches, and ambient temperature variation. Rather than introducing systematic dataset shifts between training and deployment, these non-idealities introduce random baseline drifts and global frequency offsets across different experimental samples. Consequently, if the regression model is trained directly on absolute frequency data, it may struggle to distinguish between genuine spatial displacements and environmental noise.
This vulnerability is quantitatively evident in the experimental ablation results. In contrast to the simulation results, the absence of the alignment module causes all models to exhibit severe performance degradation in the experimental environment. For instance, even with the 200-dimensional spectral data in Exp 4, the regression model completely fails, yielding a negative
value of −0.1142 and an MAE exceeding 25 mm, as shown in
Table 4. This clearly demonstrates that the implicitly learned absolute spectral–position relationship becomes entirely invalid under experimental baseline drift.
To resolve this issue, the proposed frequency alignment strategy anchors each measured spectrum to its intrinsic resonance minimum, mapping the data to a relative frequency axis. Consistent with the principles established in the simulation analysis, this operation acts as a robust spectral normalization step, effectively filtering out global frequency offsets and isolates only the local spectral envelope variations induced by spatial perturbations. As demonstrated in
Table 3 and
Table 4, this mechanism is indispensable, enabling the GPR model to successfully generalize to noisy, real-world data. As a result, the framework restores the
value to above 0.98 while reducing the MAE to 2.266 mm for the finger model and 1.250 mm for the water tank model.
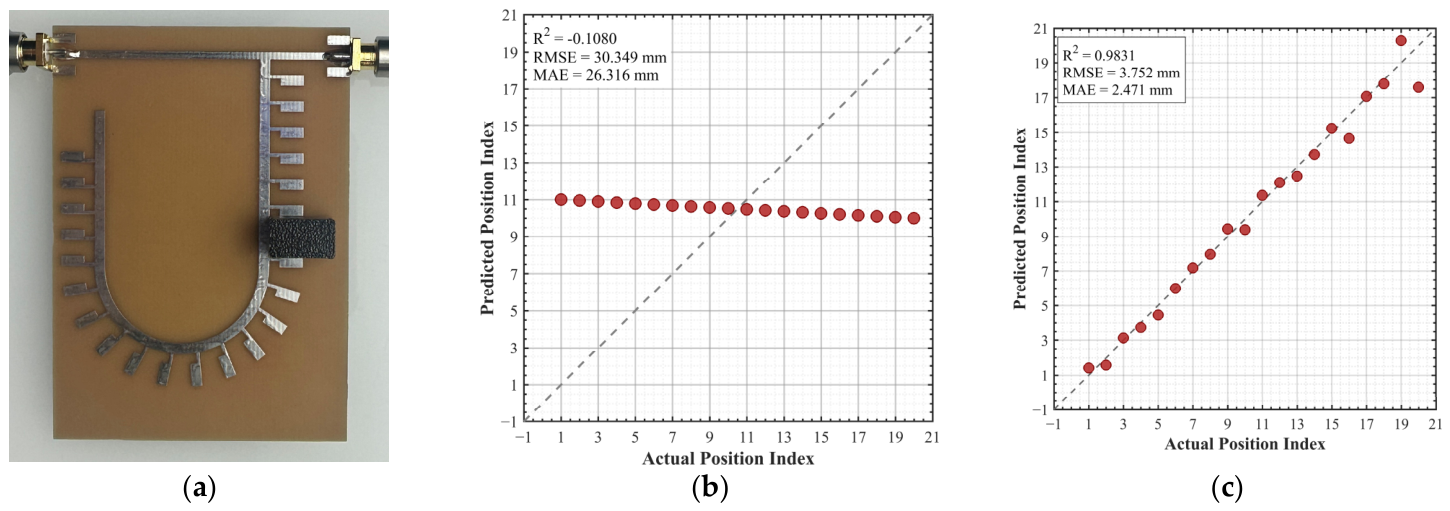
To further evaluate the generalization capability of the proposed algorithm and explicitly demonstrate the necessity of the frequency alignment module, an additional experiment was conducted using a significantly smaller water tank. This miniature water tank shares the identical PLA material composition and 1 mm wall thickness as the previously tested water block, but features highly compact dimensions of 7 mm × 12 mm × 10 mm. Unlike the previous target objects that spanned multiple parallel branches of the sensing structure, this miniature water tank was designed to cover only a single comb tooth at any given time as illustrated in
Figure 17a. Physical measurements were subsequently collected across 20 distinct spatial positions.
Due to its reduced dielectric footprint, this smaller object introduces considerably weaker spectral perturbations compared to the larger targets. When the measured data were directly fed into the GPR model without frequency alignment, the regression failed entirely to track the spatial displacements, which is clearly depicted in
Figure 17b. This failure can be attributed to the fact that the localized and weak resonant shifts induced by the small water tank are readily obscured by global baseline drifts inherent in practical noisy environments. In contrast, once the proposed frequency alignment strategy was applied to anchor each spectrum to its intrinsic resonance minimum, the global frequency offsets were effectively eliminated. As a result, the GPR model successfully generalized to this previously unseen target object and achieved accurate position reconstruction as demonstrated in
Figure 17c. This comparative result validates that the frequency alignment module is essential for isolating local geometric perturbations from environmental drift, thereby ensuring robust generalization of the machine learning framework across sensing targets of varying dimensions.
Table 5 compares the proposed SPP-based sensing structure with representative spoof SPP and planar microwave sensing systems reported in recent literature. The comparison includes typical RF sensing and human–computer interaction-oriented sensing architectures to highlight differences in sensing capability, spatial resolution, and communication functionality. Recent spoof SPP and planar microwave sensing structures have demonstrated strong electromagnetic field confinement and high sensitivity in various applications. For example, spatial resolutions of 1.25 mm have been achieved in skin abnormality detection using spoof SPP microstrip sensors [
22], while high-sensitivity dielectric characterization has been realized using spoof SPP Mach–Zehnder interferometer structures [
23]. In addition, RF-based interactive sensing systems have been explored for human–computer interaction, including gesture recognition using e-textile transmission lines [
24] and touch localization using conductive surface-based sensing platforms with localization errors of approximately 2.7 mm [
25].
However, most existing planar microwave sensing systems are designed for task-specific sensing applications and lack integrated communication capability. At the signal processing level, the Modulated Wideband Converter system has been explored for wideband spectrum sensing in ISAC-oriented applications [
26]. At the system architecture level, ISAC concepts have been widely explored in large-scale wireless systems such as millimeter-wave radar and large intelligent surfaces [
27], but these implementations typically rely on bulky architectures and complex signal processing frameworks, limiting their applicability in compact planar sensing platforms.
In comparison, the proposed U-shaped SPP microstrip structure achieves simultaneous high-resolution spatial sensing and continuous RF transmission within a compact footprint of 80 mm × 57.5 mm. By incorporating frequency alignment and GPR-based reconstruction, the system achieves localization accuracy between 1.25 mm and 2.27 mm while maintaining a 4.7–6.0 GHz transmission passband. These results demonstrate its potential for compact ISAC-oriented microwave sensing applications.
To evaluate the feasibility of dynamic tracking, which is a critical requirement for touch sensing applications, the computational latency of a single position reconstruction was systematically measured. Using MATLAB’s timeit function (MATLAB version 2024a), which executes the target routine multiple times and returns the mean elapsed time, we evaluated the online inference pipeline comprising frequency alignment, feature extraction, and GPR prediction, excluding one-time operations such as model loading. The mean reconstruction latency across all test samples was 6.77 ms, with a median of 5.70 ms and a standard deviation of 2.29 ms. Physical measurements further confirmed that the VNA hardware sweep time was 27.4 ms under the optimized configuration of 201 sweep points. The resulting end-to-end system latency is approximately 34.2 ms, corresponding to a practical dynamic tracking rate of over 29 Hz. Since typical finger sliding motions in human–computer interaction scenarios occur at speeds well below 5 Hz, this tracking rate demonstrates that the proposed system is capable of smooth, real-time position reconstruction during continuous sliding across the sensor surface.