1. Introduction
The selection and integration of electronic components are fundamental tasks in hardware design, yet they are increasingly complicated by volatile market conditions. Engineers are frequently compelled to seek alternative components not merely for design optimization, but as a necessary response to supply chain disruptions and component obsolescence. When a critical part becomes unavailable due to shortages or reaches its End-of-Life, the ability to rapidly identify a compatible replacement becomes the deciding factor in maintaining production schedules and preventing costly board redesigns.
However, identifying suitable alternative components requires finding datasheets with similar electrical and functional characteristics, a task that remains a significant bottleneck. Engineers rely heavily on manufacturer datasheets that are typically lengthy and complex. Thus, manual search and comparison can be a significant bottleneck, slowing the entire design process. Identifying suitable alternative components requires finding datasheets with similar characteristics. This is typically a slow process that relies heavily on keyword searches and manual comparisons.
Large Language Models (LLMs) offer significant automation potential but they often struggle with specialized technical data and can hallucinate or produce factually inaccurate information [
1]. Retrieval-Augmented Generation (RAG) [
2] addresses these limitations by grounding LLM responses with externally sourced information. RAG systems typically involve two modules. First, a retriever component searches and fetches relevant data snippets from a specified knowledge base based on the user’s query. The retrieved information is passed to the LLM, which uses this context together with the original query to produce a more accurate, relevant and factually grounded answer.
Although RAG pipelines help improve question and answer (QA) capabilities, efficiently identifying the most similar datasheets in a large corpus remains a significant challenge. Standard RAG architectures operate by retrieving isolated text chunks based on local keyword similarity, which is insufficient for component selection. Determining if one component is a viable alternative to another requires a holistic understanding of the entire datasheet, weighing architecture, pin compatibility, and electrical constraints simultaneously, rather than merely matching fragmented sentences. Consequently, standard chunk-based retrieval lacks the global context necessary to effectively rank components by overall technical equivalence.
Datasheets were selected as the target document type because they are the primary technical reference used by engineers during component selection, replacement, and system integration. They contain the functional, electrical, architectural, and packaging information required to assess compatibility, but this information is distributed across long PDF documents that combine descriptive text, tables, diagrams, pinout figures, and vendor-specific formatting. From a document-understanding perspective, datasheets can therefore be positioned as heterogeneous semi-structured technical documents: they are more structured than free-form reports, yet less standardized than purely tabular databases. Consequently, the results of this study are expected to be most relevant for similar engineering documents that combine narrative specifications with structured attributes and technical visuals, such as component manuals, hardware reference guides, or technical product specifications. The results should be generalized more cautiously to short plain-text documents or highly standardized machine-readable records, where the retrieval challenges differ substantially.
This paper introduces an intelligent datasheet assistant, which utilizes RAG and multimodal analysis, with a core innovation of efficiently identifying similar datasheets. Instead of exhaustive database searches, our system employs an LLM to generate a concise summary of the input datasheet. The vector embedding of this summary then enables rapid, semantically relevant retrieval of similar component candidates from a vector database. The system also provides (i) natural language QA grounded in specific datasheet content, (ii) detailed comparisons between a target component and retrieved similar alternatives, (iii) multimodal datasheet analysis incorporating visual information (diagrams and charts).
This paper provides a detailed look at the architecture of our system, with a particular focus on its innovative summary-driven retrieval process. We also explore key components such as the data intake pipeline, which utilizes semantic chunking [
3], the system’s capacity for multimodal analysis, and how it generates responses. Furthermore, we introduce a robust automated testing framework that leverages synthetic data generated by LLMs for a comprehensive evaluation [
4]. Beyond the synthetic benchmark evaluation, we also validate the proposed system on real-world MCU datasheets from commercial manufacturers. This real-world validation addresses a key limitation of synthetic data and demonstrates the practical applicability of the summary-driven retrieval approach on diverse, heterogeneous documentation. To assess the effectiveness of our summary-based retrieval and overall system performance, we conducted experiments with several LLMs, including Phi-4 [
5], Gemma [
6], Qwen [
7], and DeepSeek [
8] using evaluation approaches such as those found in RAGAS [
9].
The main contributions of our study are as follows. First, we developed an end-to-end RAG system tailored to the complex structure and content of electronic datasheets, integrating textual extraction, image referencing, semantic indexing, summary-driven retrieval, and structured comparison. To our knowledge, this is one of the first systems combining these techniques specifically for replacement-oriented electronic component similarity search. Second, we propose an efficient summary-driven retrieval mechanism, where an LLM generates a semantic summary of the input component and the embedding of this summary is used to query the vector database. Third, we introduce a controlled synthetic benchmark and report the complete synthetic configuration set, using this benchmark to analyze pipeline behavior under controlled conditions and to guide system development. Fourth, we compare local LLMs and stronger non-local summarizers on real datasheets, highlighting the role of summary quality in retrieval performance. Finally, we validate the proposed system on 18 publicly listed commercial MCU datasheets from eight manufacturers, reporting first-candidate family-level retrieval performance of 72.2% with confidence intervals and providing pilot-scale evidence of the system’s behavior on heterogeneous real-world datasheets.
The paper is structured as follows:
Section 2 describes the current state-of-the art RAG methods and related work conducted in electronics-related domains.
Section 3 details the architecture and methodology.
Section 4 describes the proposed evaluation framework using synthetic data, while
Section 5 expands on validation using real world data.
Section 6 presents the experimental findings using the framework for synthetic data, while
Section 7 discusses results for real commercial datasheets.
Section 8 discusses implications and limitations.
Section 9 concludes the paper and outlines future work.
Appendix A illustrates and describes the graphical user interface.
Appendix B provides access to the prompts used for generating summaries.
2. State of the Art and Related Work
2.1. Advancements in RAG Techniques
Recent RAG research has shifted from static, single-pass retrieval to adaptive, multi-hop, agentic, and self-correcting systems. A detailed study [
10] explains the move toward Agentic RAG, a new model that overcomes the limitations of older methods. This approach integrates independent AI agents into the RAG process. This integration enables the system to flexibly manage its tasks, continuously improve its results, and adapt to complex challenges. Building on this foundation, several specific implementations exemplify the agentic principles. One notable development is the Chain of Retrieval-Augmented Generation [
11] proposed by Liang Wang et al. CoRAG iteratively refines queries through rejection sampling to build multi-step retrieval chains before answer generation, improving the Exact Match by more than 10 points on the KILT benchmark [
12], especially in multi-hop scenarios. Building upon CoRAG, collaborative frameworks such as MA RAG (Multi Agent RAG) introduce specialized agents (Planner, Step Definer, Extractor, QA Agent) that engage in chain-of-thought prompting and dynamic coordination to handle ambiguities and distributed reasoning, thereby outperforming single-pass RAG without finetuning [
13]. Complementing agentic systems, PropRAG [
14], navigates proposition paths using a beam search over a knowledge-graph-like structure. Its offline graph extraction combined with LLMs for post-retrieval yielded state-of-the-art zero-shot recall and F1 scores across datasets including HotpotQA. Further innovations in cost-sensitive retrieval include CARROT [
15], which models chunk selection as a Monte Carlo Tree Search to optimize combinations of correlated context chunks under budget constraints, surpassing independent selection methods. In summary, these techniques represent a trajectory toward iterative, graph-aware, agent-driven, self-validating, and budget-sensitive RAG pipelines, which are all essential for reliable knowledge-grounded generation.
2.2. Applying RAG in Electronics Engineering
Concurrently, domain-specific applications of RAG in electronics have yielded promising results, though often with different objectives than component replacement. Alawadhi et al. [
16] described a specialized pipeline for circuit breaker datasheet retrieval, leveraging title-aware chunking, parallel LLMs (GPT-4o, Claude 3), and tailored embeddings. Differently than Alawadhi et al., who focus on precise parameter extraction for a single component type, our work targets the broader challenge of component similarityand replacement across diverse families (MCUs, ADCs, etc.), utilizing a novel summary-based embedding strategy rather than relying solely on chunking metadata.
RAG’s multimodal capabilities have also been explored for sensor-based systems. Mohsin et al. [
17] developed a framework for wireless environments in which sensor imagery is converted to text, semantically fused with object-level metadata, and jointly embedded. As opposed to Mohsin et al., who process real-time environmental sensor data, we apply multimodal analysis to static, high-density technical documentation (PDF datasheets), specifically training the system to interpret complex block diagrams and pinout schematics essential for design integration.
In the domain of industrial operations, Heredia et al. implemented an advanced RAG system for ceramic defect diagnosis in manufacturing quality control [
18]. Unlike Heredia et al., whose system is designed for downstream manufacturing anomaly detection, our assistant is tailored to the upstream hardware design phase, addressing the pre-production bottleneck of component selection and obsolescence management.
On the methodological front in specialized document retrieval, hybrid dense–sparse retrieval approaches have shown significant promise. Mandikal et al. demonstrated that combining classical sparse bag-of-words representations with dense transformer-based embeddings yields significantly better results than either approach alone, particularly for specialized scientific document retrieval [
19]. We build upon the hybrid retrieval foundation established by Mandikal et al. but extend it by introducing a summary-driven query mechanism. Instead of querying with raw keywords or questions, our system generates and embeds a semantic summary of the target component, which significantly improves the retrieval of structurally similar alternatives.
To our knowledge, the proposed system is among the first to integrate summary-driven datasheet embedding, multimodal datasheet processing, vector retrieval, and structured comparison for replacement-oriented electronic component search. The novelty of the work is therefore framed around the design, integration, and evaluation of this configuration, rather than around a broad priority claim over datasheet parsing or component search more generally.
Based on the related work presented, state-of-the-art RAG research highlights several key trends. Regarding the retrieval mechanisms themselves, key modern retrieval mechanisms such as multi-hop dynamic retrieval (CoRAG, PropRAG) have been developed, that enable more precise, step-wise information gathering. Agents have also been employed as orchestrators (MA RAG) for contextual planning and query reformulation. Validation of RAG pipelines is also an important factor in determining process performance. Thus, self-validating and adaptive pipelines have been developed to enhance the factual reliability in high-stakes applications. Efficiency and cost-awareness in chunk selection and budgeted retrieval (CORAG) was also addressed.
3. System Architecture and Methodology
The proposed datasheet assistant employs a multimodal RAG architecture composed of two distinct but interconnected workflows: (i) an offline reference database construction stage and (ii) an on-demand inference pipeline. These two processes are illustrated in
Figure 1 and
Figure 2, respectively. This separation enables scalable indexing of large datasheet corpora while preserving rich multimodal reasoning capabilities for dynamic user queries.
The offline stage is executed once to construct a static, semantically searchable reference corpus. The online stage is activated at runtime whenever a new datasheet is provided by the user. The architectural asymmetry between these two workflows is deliberate: the reference corpus is indexed using a lightweight text-only strategy to ensure scalability, whereas the dynamic query undergoes multimodal processing to maximize semantic precision during retrieval.
3.1. Offline Reference Database Construction
As illustrated in
Figure 1, the offline pipeline constructs the Reference Vector Database from existing component datasheets. PDF documents are first processed using PyPDFLoader (from langchain v1.1.0) to extract textual content. Visual elements such as block diagrams, pinout schematics, and functional illustrations are identified and replaced with textual placeholders (e.g.,
[IMAGE_REF]), while the original image files are preserved separately and linked through metadata.
To enable fine-grained semantic retrieval, the extracted text undergoes semantic chunking, configured to 1000-character segments with a 200-character overlap. This configuration balances contextual continuity with retrieval granularity. Each resulting text chunk is converted into a vector embedding using nomic-embed-text v1.5 [
20]. The embeddings are stored in a static Reference Vector Database implemented using ChromaDB v1.3.0 [
21], together with metadata linking each chunk to its source document and associated visual elements.
Importantly, the offline indexing process remains text-only. Avoiding multimodal embedding at this stage prevents the computational overhead associated with processing thousands of images, thereby ensuring scalability while maintaining effective semantic retrieval.
3.2. On-Demand Multimodal RAG Inference
The runtime inference pipeline, illustrated in
Figure 2, is activated when a new input datasheet is provided. In contrast to the offline indexing process, the dynamic query pathway preserves the global multimodal context of the document. The full textual content is extracted without chunking, and visual elements are retained in their original form.
A dedicated summarizing multimodal LLM (Model A) processes the combined text and image inputs to generate a comprehensive semantic summary of the component. This summary captures functional behavior, architectural structure, and diagrammatic information that may not be fully represented in textual descriptions alone. The generated summary is then converted into a query vector using the same embedding model employed for the reference corpus. In the implementation evaluated on real datasheets, the offline indexing, embeddings, BM25 retrieval, dense retrieval, and reranking stages can run locally. Query-datasheet summary generation was evaluated with Claude Sonnet 4.5 as a frontier non-local reference summarizer and with local models including phi4, deepseek-r1:14b, gemma3:12b, qwen2.5:14b, and gemma4:e4b. The strongest real-datasheet result for FRR with uses Claude Sonnet 4.5. We therefore distinguish between the locally runnable retrieval platform and the current summary-generation model choice.
This asymmetric design, where multimodal summarization is used for the dynamic query combined with text-only indexing for the static corpus enables precise retrieval while avoiding the complexity and storage demands of a fully multimodal vector database.
3.3. Retrieval-Augmented Generation
The RAG core serves as the system’s inference engine, responsible for processing user queries, retrieving pertinent context, and generating grounded responses. As illustrated in
Figure 3, the architecture supports two distinct interaction modalities, Direct QAand Comparative Analysis, through a unified three-stage pipeline.
3.3.1. Input Processing and Query Formulation
The retrieval mechanism must align with the user’s intent, requiring distinct query vector formulations for each interaction mode. In Direct Question Answering, the user interrogates the whole vector database with natural language queries (e.g., “Which MCUs support CAN-FD?”). The system embeds this question directly to form the query vector, optimizing retrieval for specific factual snippets. Conversely, in similarity search mode, where the objective is to identify alternative components, the system utilizes the summary vector generated in the on-demand inference pipeline as the query (see
Figure 2). This embedding encapsulates the target component’s global technical profile, ensuring that retrieval operates on holistic semantic similarity rather than isolated keyword matches.
3.3.2. Iterative Retrieval and Ranking Engine
A significant challenge in component selection arises because standard vector search retrieves individual text chunks, often returning multiple segments from the same document. To ensure diversity, we implement an iterative retrieval strategy. The system queries the Reference Vector Database and filters results for unique component identifiers. If the initial batch yields fewer than k unique components, the search batch size is automatically expanded until the target count is met or a safety limit is reached.
Once unique candidates are collected, they are ranked using a relevance score derived from the Euclidean distance
between the query vector and the component’s best-matching chunk. Since our embeddings are
-normalized, we calculate a cosine-equivalent similarity
as
where larger values indicate stronger matches. To prioritize results matching specific user constraints without distorting the similarity distribution, we then apply a bounded additive boost:
where
is an empirical term set to
for explicit constraint matches (e.g., specific manufacturer) and
for components contextually related to the input. The final top-
k selection is determined by sorting components in descending order of
.
3.3.3. Context Enrichment and Generation
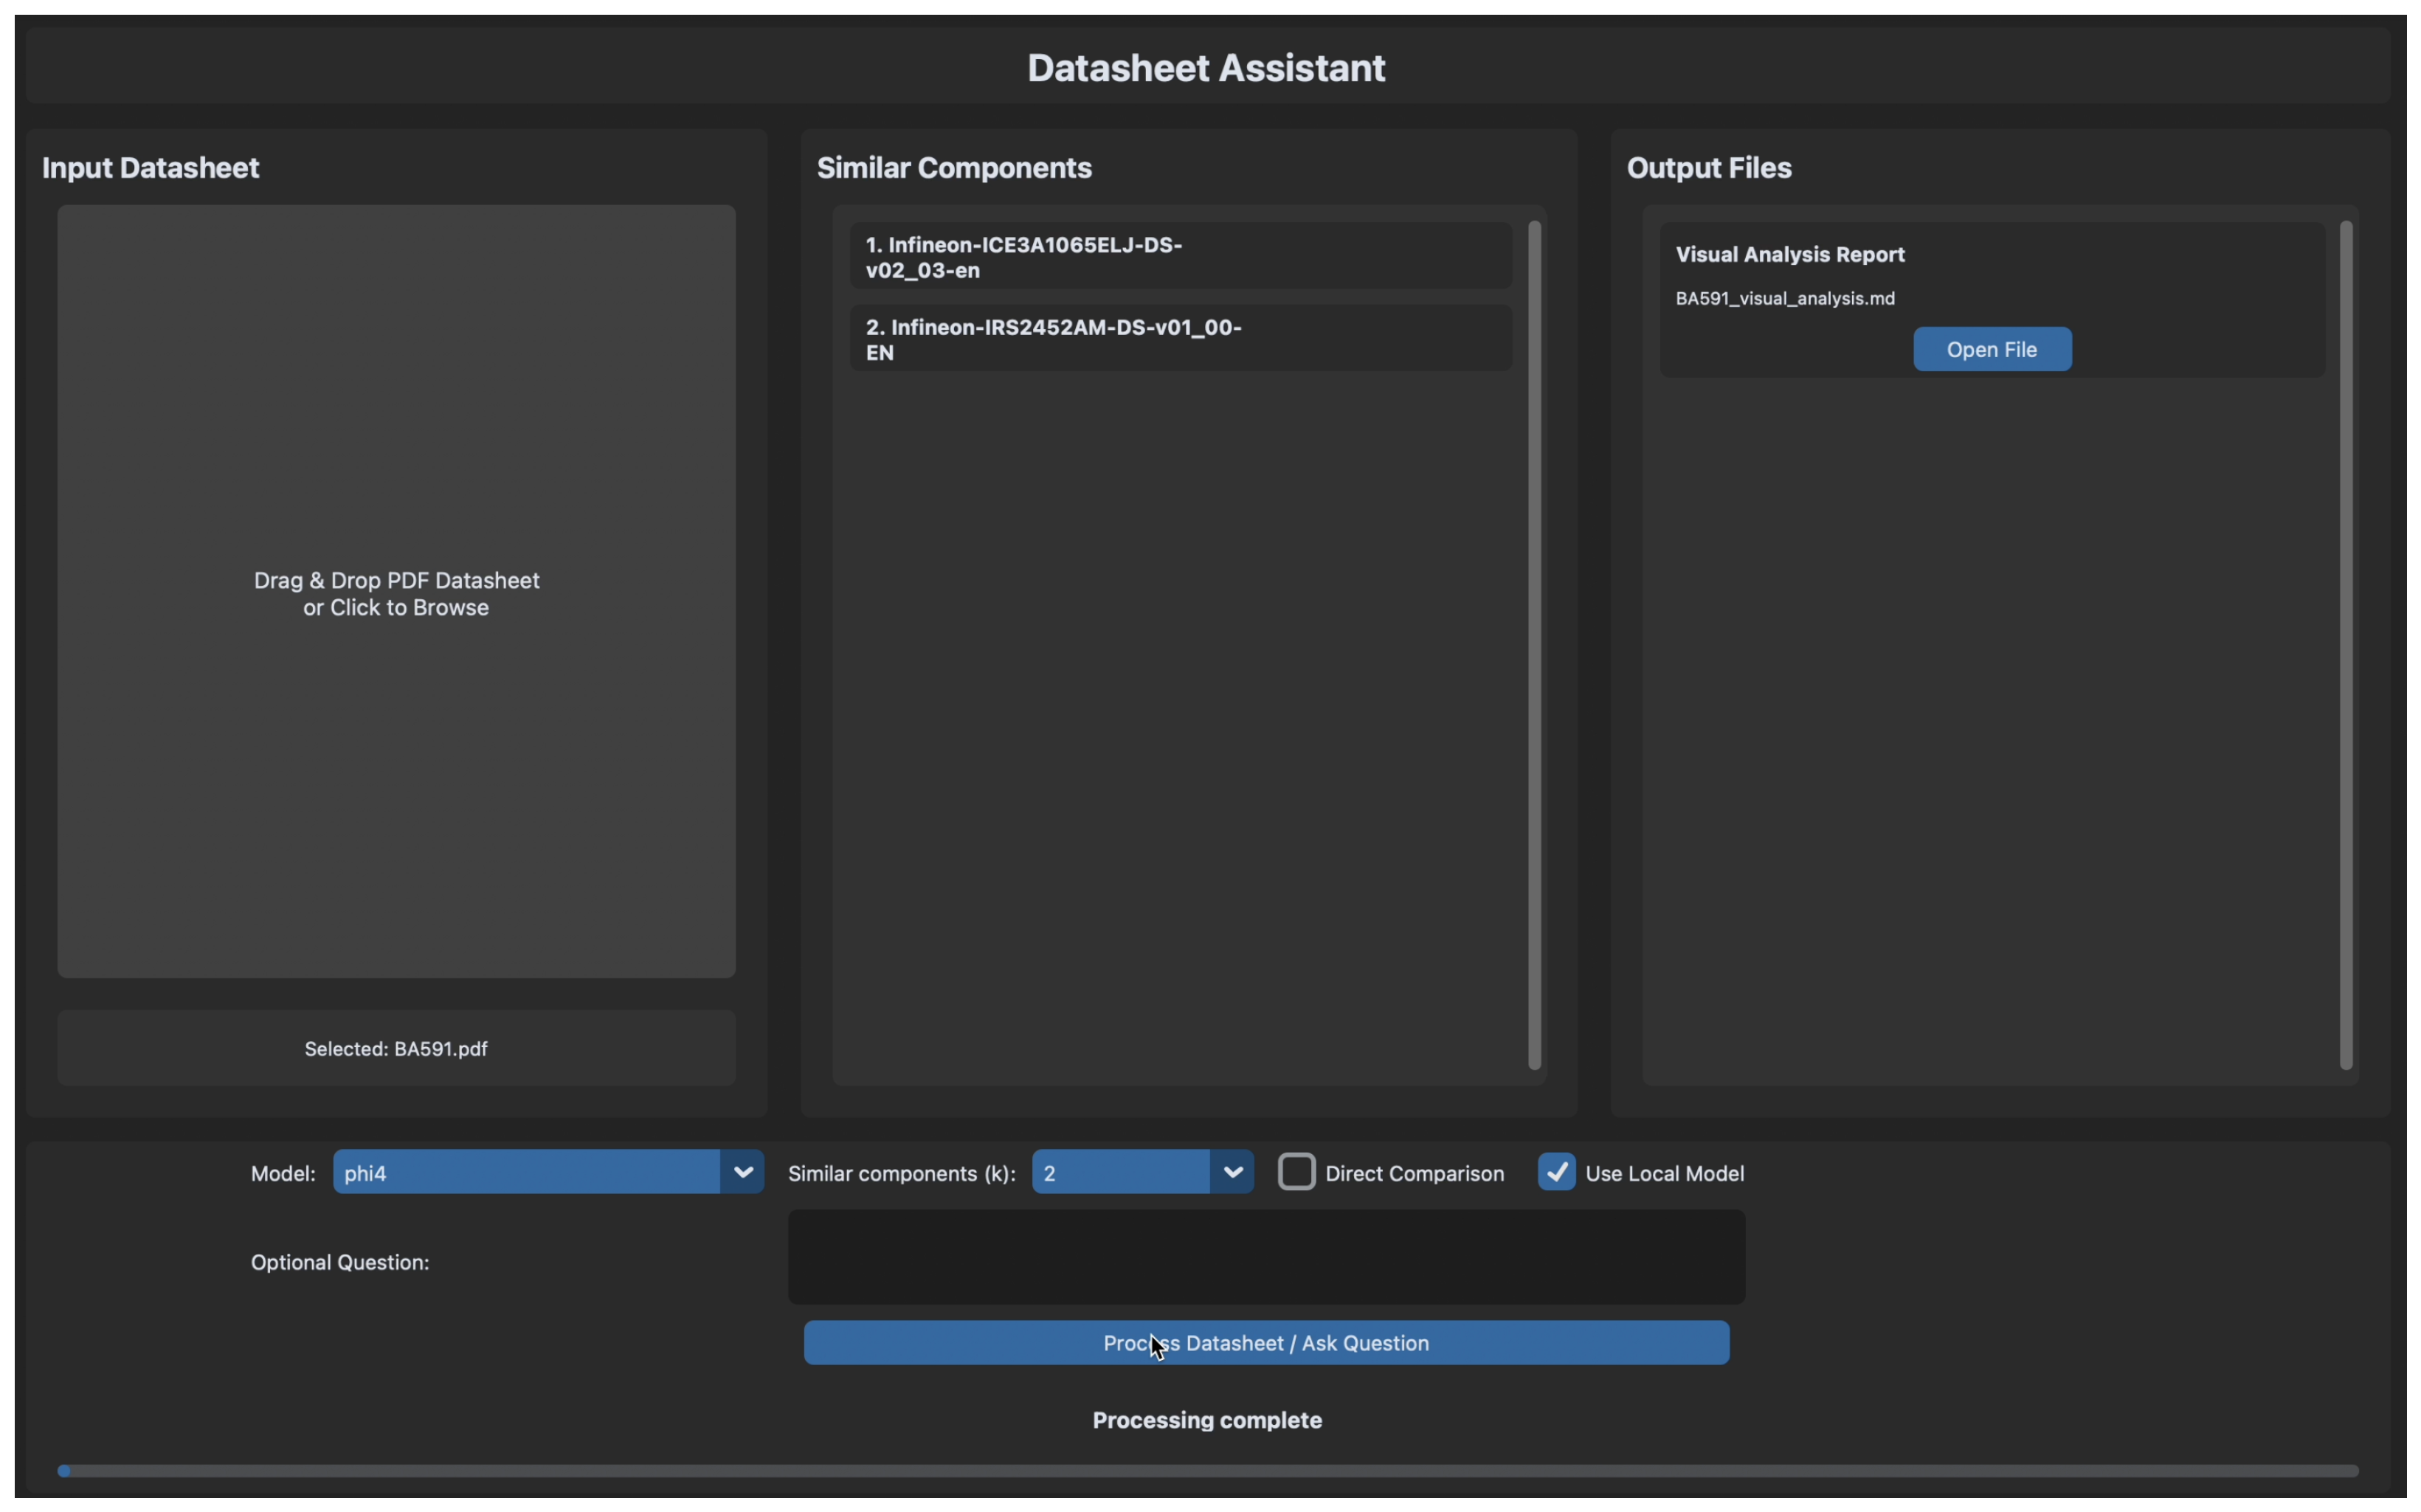
Following the retrieval of relevant candidates, the system enters the generation phase. To accommodate different trade-offs between speed and analytical depth, the Context Enrichment module operates in two distinct modes, selectable via the graphical user interface (
Figure A1). In the default standard mode, the system utilizes only the specific semantic text chunks retrieved via vector search, minimizing token usage and latency for rapid relevance assessments. Alternatively, the user can toggle the direct comparison mode, which triggers the retrieval of the complete textual content and associated visual data (images and schematics) for the top-
k selected datasheets. This maximizes the LLM’s reasoning capabilities by providing comprehensive technical context, albeit at higher computational cost.
Subsequently, the Context Assembly module dynamically constructs the final prompt based on the active functional mode. In the case of Question Answering, the prompt combines the specific user question with the target datasheet context (either retrieved chunks or full text depending on the enrichment setting), focusing the LLM on extracting precise answers grounded strictly in the provided documentation. Conversely, for Datasheet Comparison, the prompt aggregates the input datasheet with the k retrieved reference datasheets and injects a structured system instruction requiring a detailed analysis of similarities and differences. Crucially, this prompt is further augmented by any user-defined specific instructions entered via the GUI (e.g., “Is this component a direct replacement possibility?”), ensuring the comparison directly addresses the engineer’s specific constraints before being passed to LLM Model B for final synthesis. The output of the RAG inference pipeline is either a Technical Answer, when the input is a user question, or a Comparative Report between the input datasheet and the k retrieved datasheets, when the input is a datasheet.
4. Synthetic Testing and Evaluation Framework
Evaluating complex RAG systems requires objective and diverse metrics [
22]. We developed an automated framework using LLM-generated synthetic data. Existing studies already support the possibility of using automated LLM systems to evaluate RAG pipelines [
23].
4.1. Synthetic Datasheet and Query Generation
Evaluating complex RAG systems requires objective metrics grounded in known relationships [
22]. To this end, we developed an automated framework for generating synthetic datasheets with embedded ground truth, following established practices for synthetic data in ML evaluation [
4,
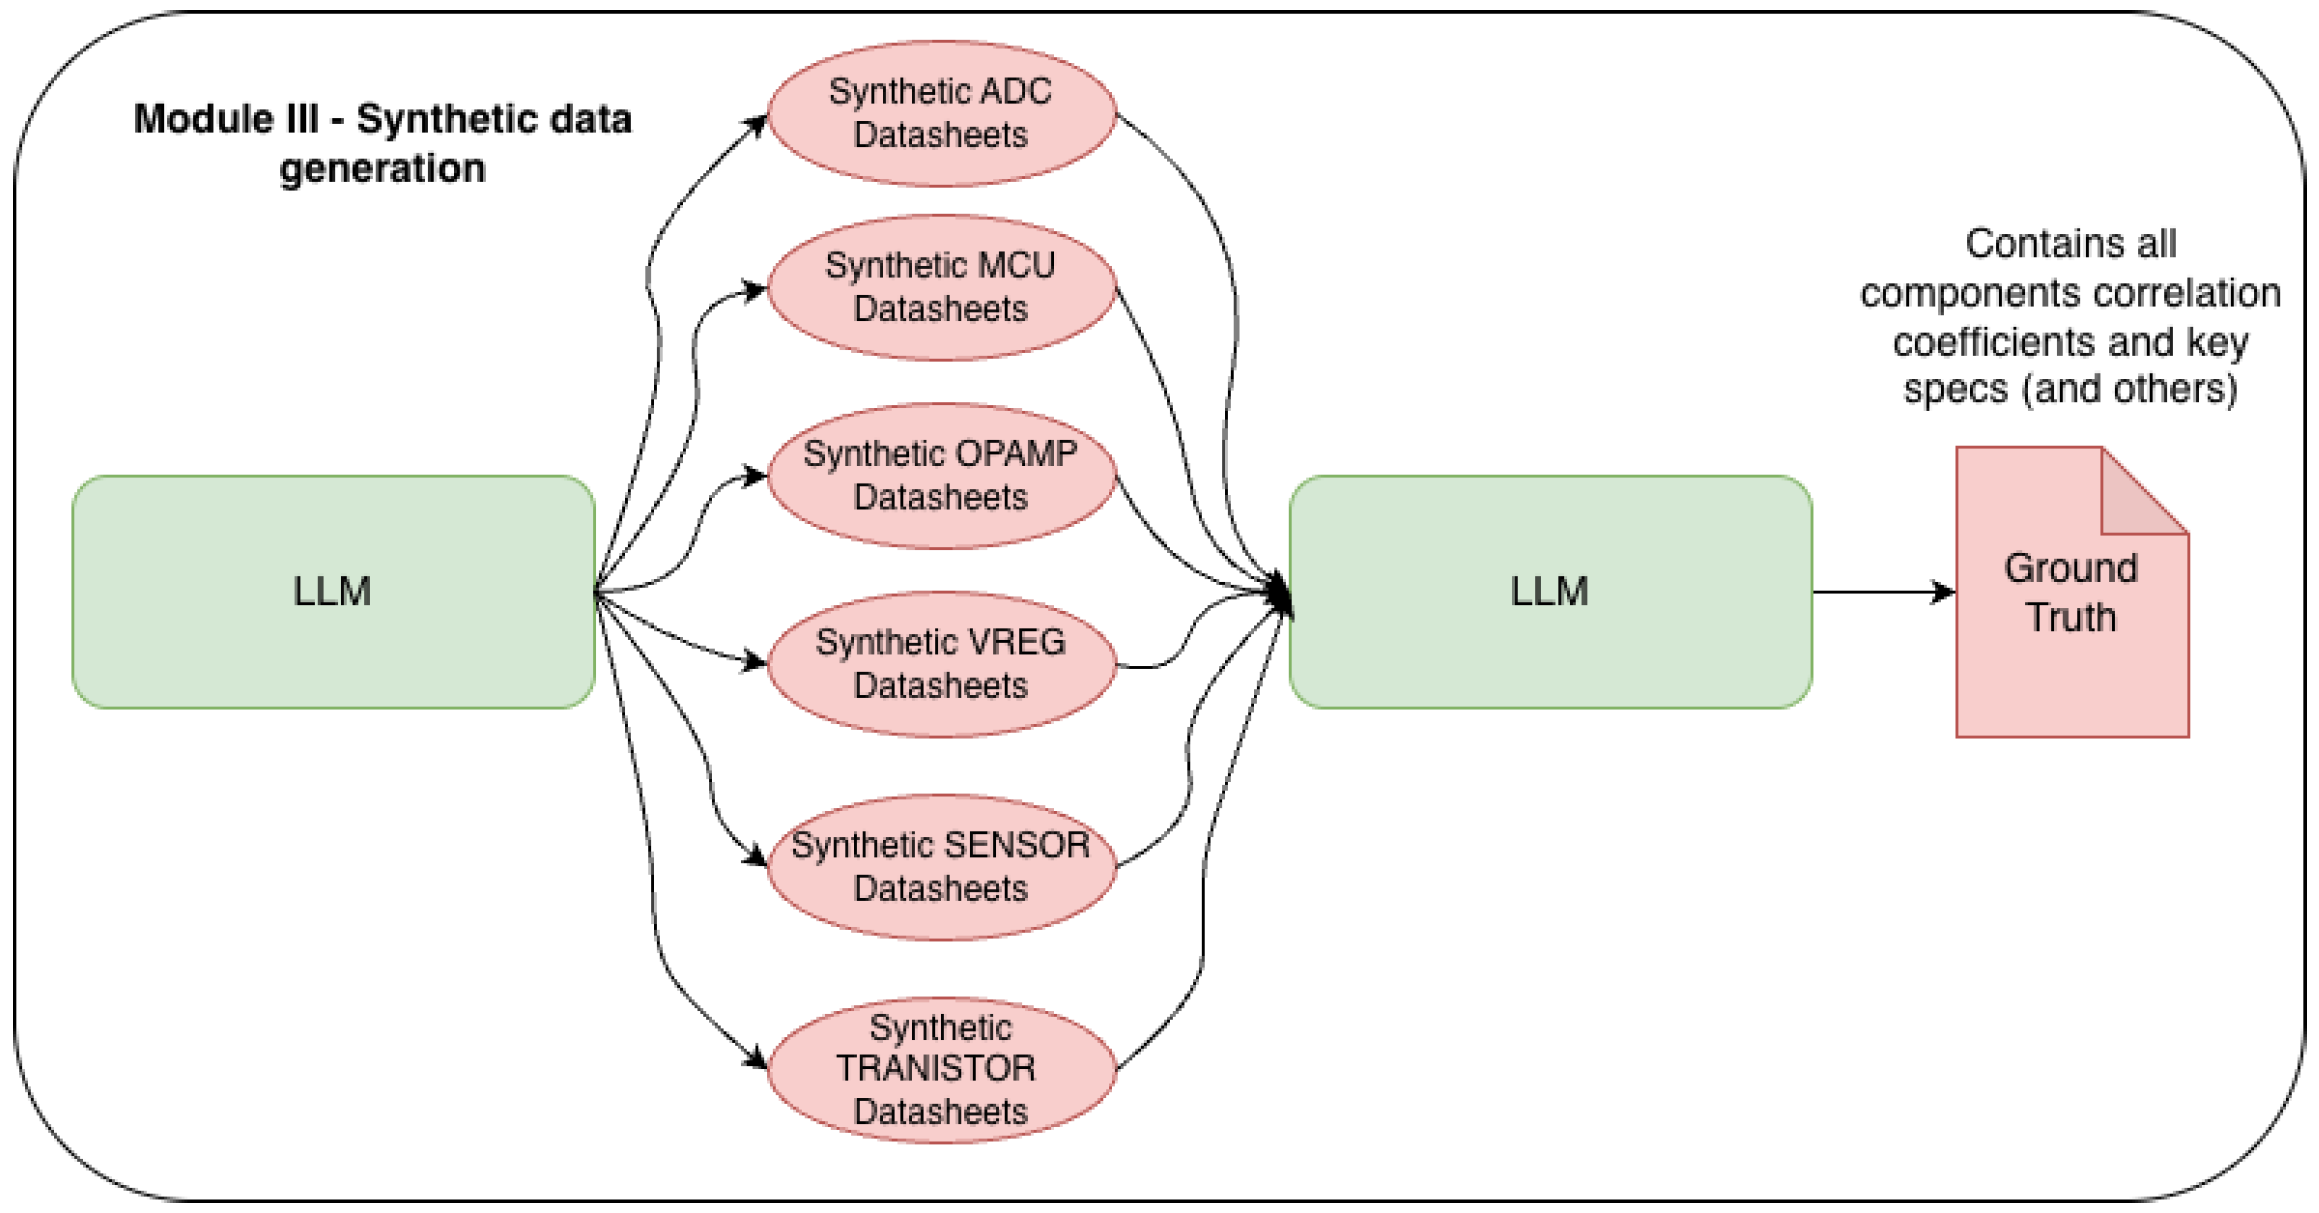
23]. The generation pipeline, illustrated in
Figure 4, comprises two main phases: datasheet synthesis and ground truth extraction.
4.1.1. Phase 1: Synthetic Datasheet Generation
The first phase produces a diverse corpus of realistic component datasheets. Six component families are defined: analog-to-digital converters (ADCs), microcontrollers (MCUs), operational amplifiers (OPAMPs), voltage regulators (VREGs), sensors, and transistors. Each family is further subdivided into three sub-families based on distinguishing technical characteristics. For instance, MCUs are partitioned into ARM-Based, RISC-V, and Ultra-Low-Power sub-families. Components are pre-assigned to these sub-families before generation, establishing the taxonomic structure that will later serve as the baseline for similarity evaluation.
An LLM agent receives a system prompt containing family-specific templates developed with domain experts, along with the target number k of components per family. For each component, the LLM generates realistic datasheet content conditioned on the assigned sub-family traits, covering standard sections such as general description, key features, specifications, pin configuration, application circuits, and package information. Placeholder images (pin diagrams, block diagrams, performance graphs, and package drawings) are programmatically generated and embedded using reference markers. The text and images are then compiled into PDF documents, yielding synthetic datasheets (30 in our experiments, with ).
4.1.2. Phase 2: Ground Truth Extraction
In the second phase, a separate analysis pipeline processes the generated datasheets to construct the evaluation ground truth. This process involves multiple extraction and scoring steps. First, key specifications, features, and typical applications are extracted from each datasheet into structured JSON records.
The datasheet texts are then chunked and embedded using the same embedding model as the retrieval pipeline, and pairwise semantic similarity scores are computed for intra-family component pairs. The resulting ranked pairs, together with the predefined family and sub-family metadata, define the synthetic similarity targets used by the automated evaluation.
Finally, for each pair of similar components, the LLM generates a structured list of technical differences to support evaluation of the system’s Comparative Analysis capabilities.
The synthetic reference rankings should be interpreted as embedding-derived reference rankings rather than independent human-labeled equivalence judgments. Although the synthetic datasheets and retrieval queries are not identical to the text used to construct the reference ranking, both the reference-ranking construction and the retrieval stage use the same embedding family. Therefore, the synthetic benchmark evaluates whether the summary-driven retrieval pipeline preserves embedding-induced similarity neighborhoods under controlled document-generation conditions. It does not independently establish technical substitutability between components. For this reason, the synthetic results are used to compare pipeline behavior under controlled conditions, while the real MCU validation in
Section 7 is used to assess behavior on authentic manufacturer datasheets.
The resulting ground truth JSON file comprises: (i) extracted technical specifications for each component, (ii) sub-family membership assignments, (iii) annotated similar pairs with continuous similarity scores
, and (iv) documented technical differences between similar components. The complete ground truth was reviewed and validated by a domain expert prior to use in evaluation. While synthetic data enables controlled evaluation against known ground truth, it may not capture all nuances present in real-world datasheets [
24]; we therefore complement this evaluation with testing on authentic manufacturer datasheets in
Section 7.
4.2. Automated Testing Pipeline
The synthetic evaluation is designed to test whether the retrieval system can identify functionally related components from their summaries alone. For each of the 30 synthetic components, a leave-one-out protocol is applied: the queried component’s data is excluded from the vector database, and its LLM-generated summary is used as the query vector. The system must therefore bridge both a format gap (compact summary versus verbose datasheet chunks) and a content gap (retrieving a different component that is functionally equivalent). Retrieved results are scored against the taxonomy-aware synthetic ground truth to determine whether the system surfaces components from the correct sub-family. An automated script orchestrates this process, executing the full RAG pipeline for both retrieval and direct comparison modes using a specific LLM (Model B). Each test case logs the retrieved components, the generated analysis, and the end-to-end latency, as presented in
Section 6.
4.3. Quality Assessment Methods
Evaluation covers generated datasheet content quality and RAG system output.
4.3.1. Critique Agent for Synthetic Data Quality
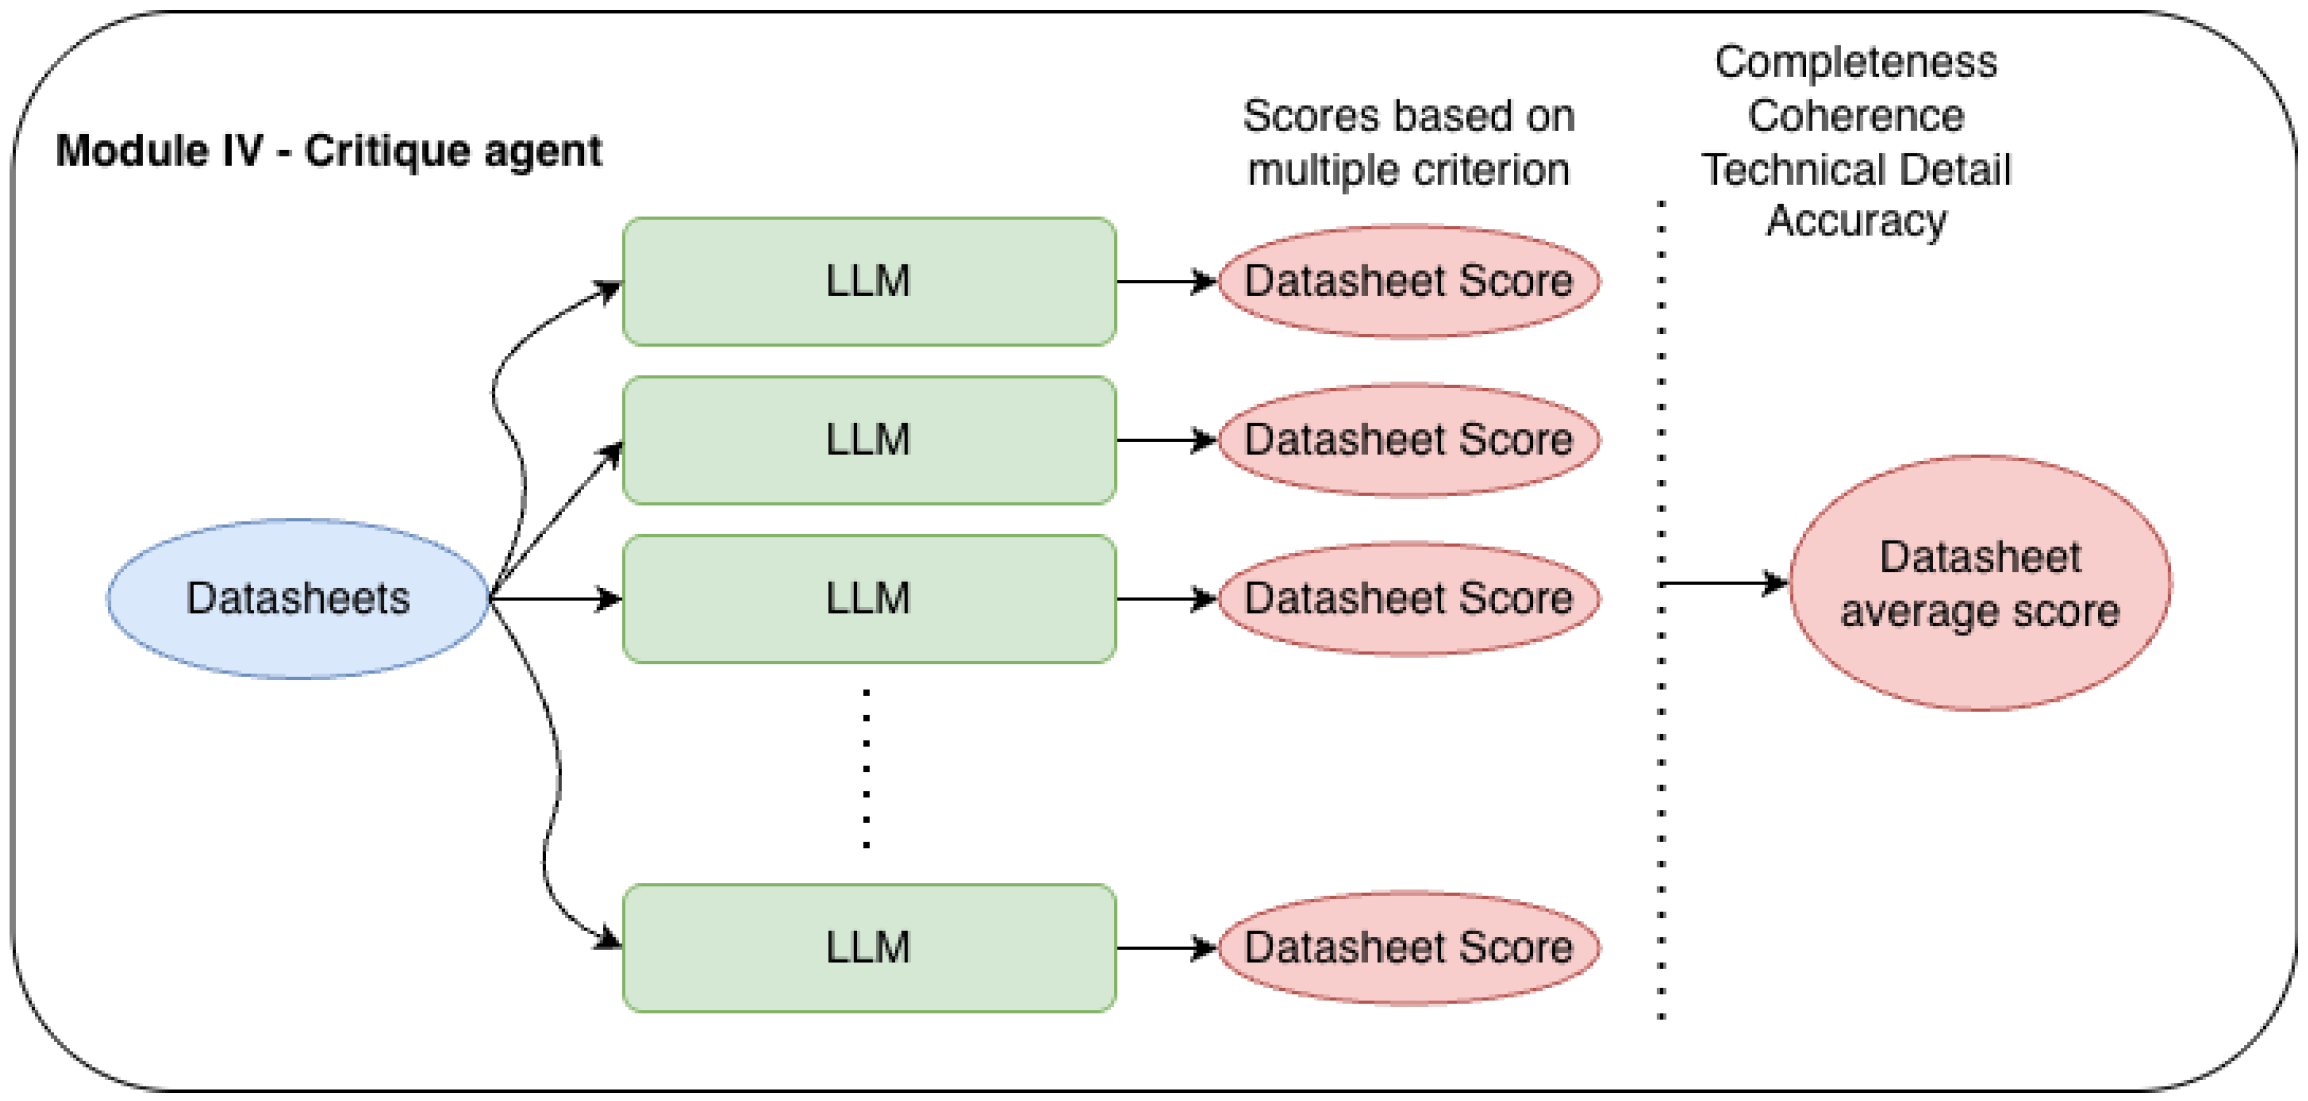
An LLM-based agent assesses the realism and coherence of the synthetic datasheets, scoring completeness, coherence, technical detail, and accuracy to validate benchmark quality (
Figure 5). To assess our synthetic benchmarking database, we compared the generated data with real datasheets. Considering the mean between the four metrics on a scale from 1 to 5, synthetic datasheets scored on average 0.5 points lower than real datasheets, which we considered tolerable in this use case.
4.3.2. RAG System Output Evaluation
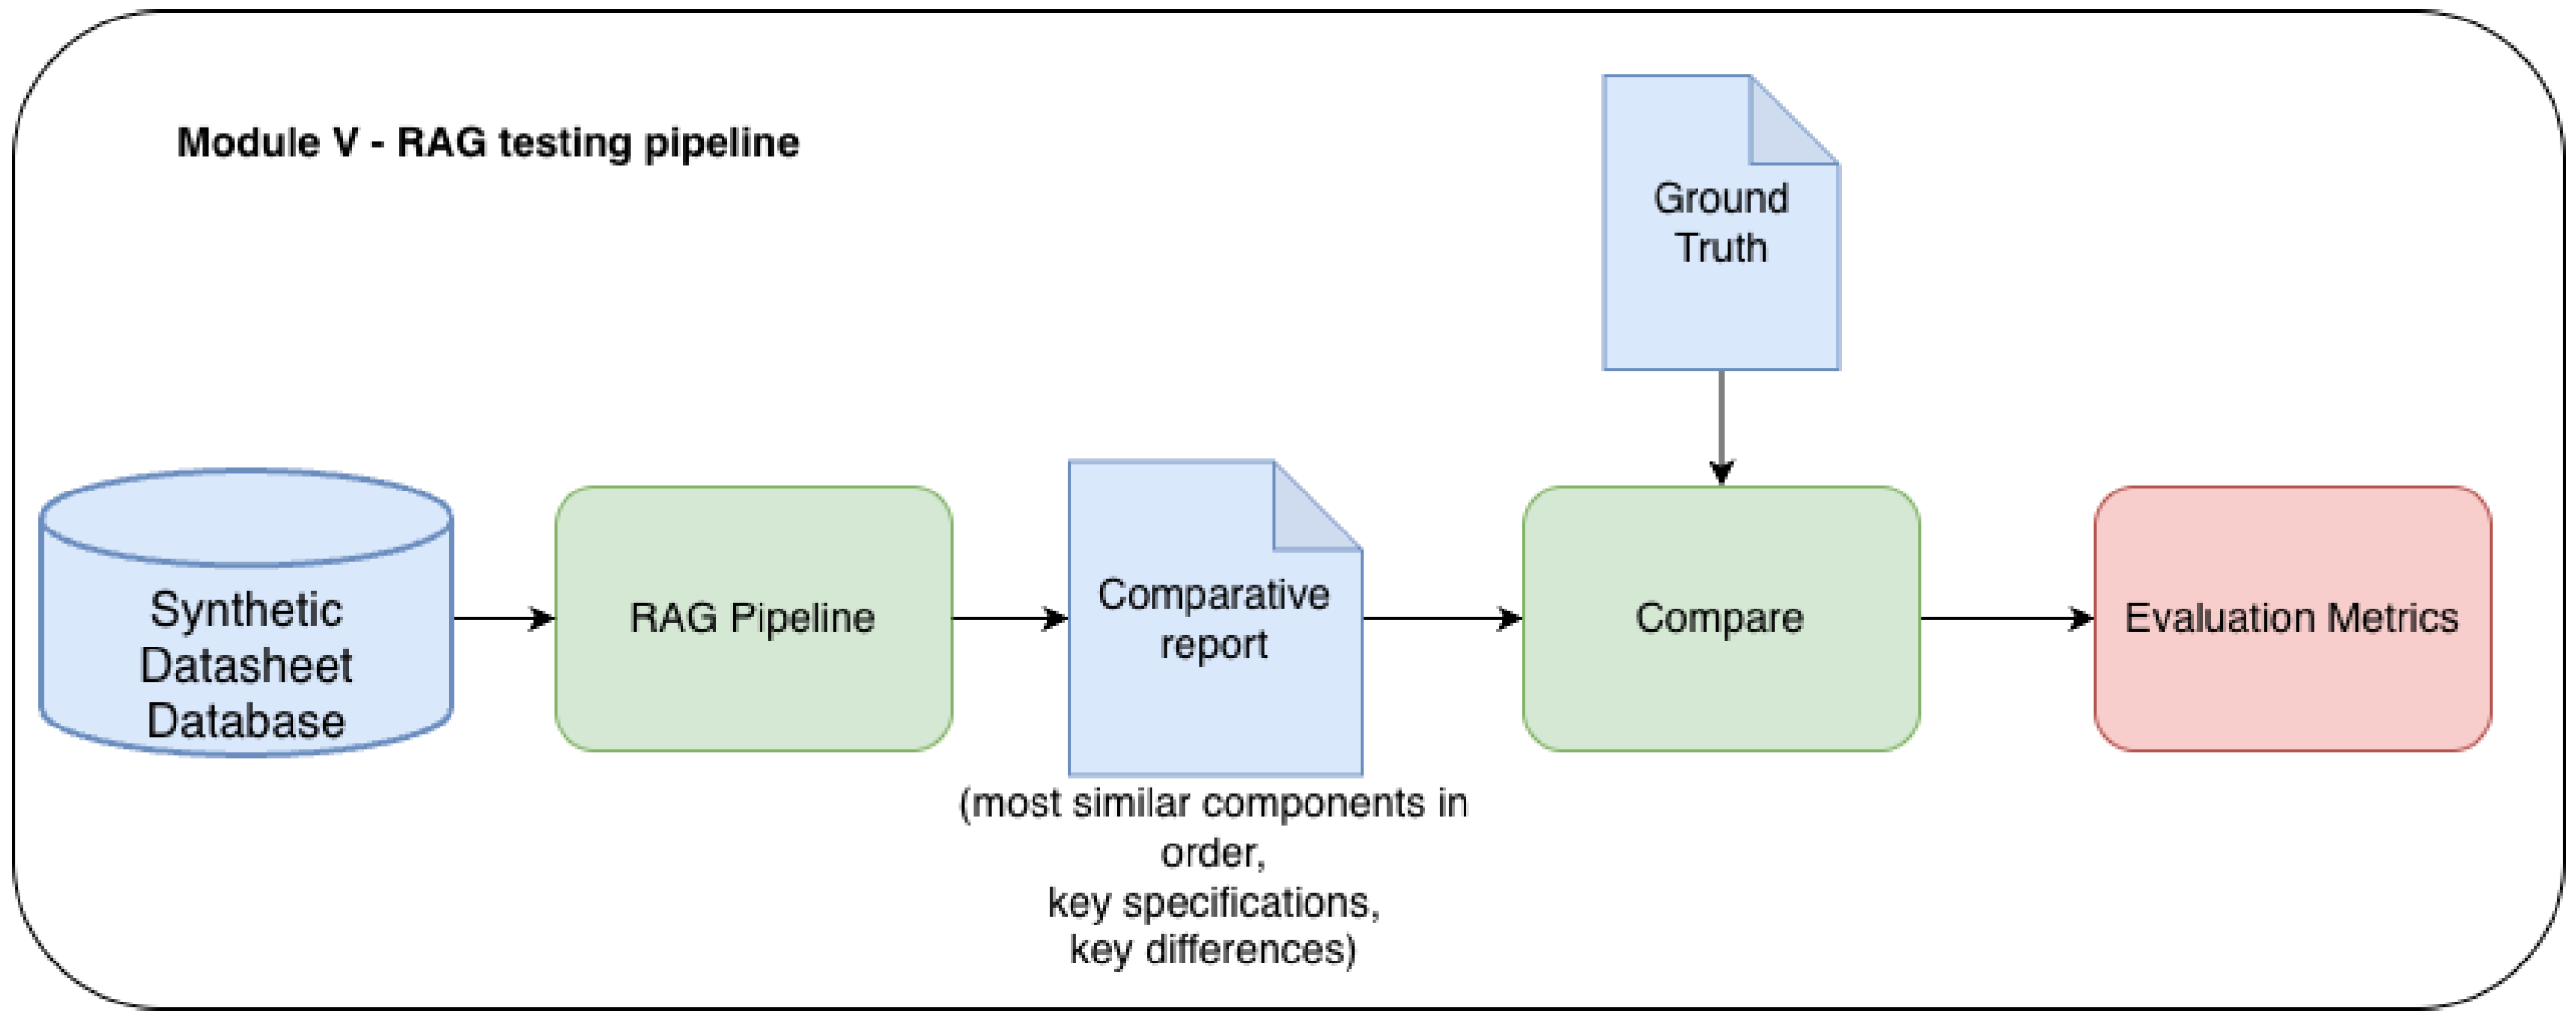
System outputs are evaluated against synthetic ground truth using metrics inspired by RAGAS [
9]: context relevance/retrieval quality (as match rate), answer/comparison relevance, recall, F1, completeness/coverage, and image integration. The complete testing workflow is shown in
Figure 6.
5. Real-World Validation
This section complements
Section 4 with a pilot-scale validation on real MCU datasheets. The component identities, datasheet references, and family definitions are listed in the manuscript, so the real-world dataset is publicly auditable from manufacturer documentation. The family assignments were fixed before retrieval experiments were run. They were defined and checked by domain experts with MCU and industrial semiconductor experience, including Infineon contributors and university researchers among the authors. This expert validation is appropriate for an initial engineering study, but it is not an external blinded assessment; we therefore report the real-data results as pilot evidence and identify independent external validation as future work.
5.1. Real Validation Datasets
The datasets were designed to test the system’s ability to distinguish between MCU families that differ along meaningful engineering dimensions while including cases where family boundaries are less distinct. Components were selected from eight major semiconductor manufacturers (Microchip, Texas Instruments, STMicroelectronics, NXP, Renesas, Nordic Semiconductor, Infineon, and Silicon Labs) to ensure diversity in documentation style and format. Two datasets were created to validate experimental findings. Both contain datasheets from nine MCUs, grouped in three distinguishable MCU families.
5.1.1. Dataset 1
This dataset contains nine MCUs organized into three families based on architecture complexity and target application:
The Simple Low Power IoT family comprises entry-level microcontrollers designed for battery-powered and low-complexity applications. This family includes the Microchip PIC16F18877 [
25] (8-bit PIC architecture, 32 MHz), TI MSP430FR5989 [
26] (16-bit RISC, 16 MHz), and Renesas RL78/G14 [
27] (16-bit proprietary, 32 MHz). These devices share characteristics including limited computational resources, emphasis on ultra-low power consumption, and suitability for simple sensor nodes and IoT endpoints. Despite different architectures from three different vendors, they occupy a similar market segment.
The General Purpose 32-bit family represents mainstream 32-bit ARM-based microcontrollers suitable for a broad range of applications. This family includes the ST STM32F405 [
28] (Cortex-M4F, 168 MHz), NXP LPC4088 [
29] (Cortex-M4F, 120 MHz), and Microchip ATSAME54P20A [
30] (Cortex-M4F, 120 MHz). All three devices share the same CPU core architecture but come from different vendors with different peripheral sets. This family tests whether the system recognizes architectural similarity across vendor-specific implementations.
The High Performance Specialized family contains processors optimized for signal processing and control applications. This family includes the Microchip dsPIC33CK256MP508 [
31] (16-bit DSC, 100 MHz), TI TMS320F28379D [
32] (32-bit C28x DSP, 200 MHz), and Infineon XMC4500 [
33] (Cortex-M4F, 120 MHz). This family is deliberately heterogeneous: two devices have DSP-specific architectures while one is ARM-based but positioned for industrial control. This tests whether the system can recognize functional similarity despite architectural differences.
5.1.2. Dataset 2
This dataset contains nine MCUs organized into three families representing more recent product categories with greater feature overlap:
The Secure Ultra Low Power family comprises modern MCUs combining security features with ultra-low-power operation. This family includes the ST STM32U575AG [
34], NXP LPC55S6x [
35], and Renesas RA4M3 [
36]. All feature ARM Cortex-M33 cores with TrustZone security extensions and are positioned for applications requiring both security and energy efficiency.
The Connectivity SoC family comprises wireless system-on-chip devices with integrated radio transceivers. This family includes the TI CC2674P10 [
37], Nordic nRF5340 [
38], and Silicon Labs EFR32MG24 [
39]. These devices support protocols such as Bluetooth Low Energy, Thread, and Zigbee. Critically, these devices also incorporate security features and low-power operation, creating substantial semantic overlap with the SecureUltraLowPower family.
The High Performance Control family contains high-end MCUs targeting industrial control and high-bandwidth applications. This family includes the NXP i.MX RT1170 [
40], ST STM32H753VI [
41], and Microchip SAM E70 [
42].
Database 2 was specifically designed to present a harder classification problem than Database 1, testing whether the system can distinguish families with substantial feature overlap.
5.2. Retrieval Strategies for Real-World Validation
Building upon the methodology established in the synthetic benchmark, multiple retrieval strategies were evaluated on the real-world datasets. The strategies represent a progression from simple vector similarity to more sophisticated multi-stage approaches, each grounded in established information retrieval research.
5.2.1. Baseline Vector Search
The baseline approach employs pure semantic similarity using dense vector embeddings. Retrieval is performed via cosine similarity in the embedding space. This approach, commonly termed dense passage retrieval [
43], has become the foundation of modern neural information retrieval systems. The embeddings are stored in ChromaDB [
21], an open-source vector database optimized for similarity search.
5.2.2. Hybrid BM25 + Vector Search
The hybrid strategy combines lexical matching with semantic similarity to capture both exact keyword matches and conceptual relationships. BM25 (Best Matching 25) [
44] provides the sparse retrieval component, excelling at matching technical terminology and part numbers that may not be well-represented in general-purpose embeddings. The dense and sparse scores are merged using Reciprocal Rank Fusion (RRF) [
45], which combines ranked lists by summing reciprocal ranks:
, where
is the rank of document
d in ranking
r and
k is a constant (typically 60). This fusion approach has proven effective in recent hybrid retrieval systems [
46] and does not require score normalization between the two retrieval methods.
5.2.3. Cross-Encoder Reranking
The reranking strategy employs a two-stage pipeline that has become standard in production retrieval systems [
47]. The first stage uses baseline vector search to retrieve an initial candidate set (top 20 results). The second stage applies a cross-encoder model (ms-marco-MiniLM-L-6-v2) [
48] to jointly encode the query and each candidate, producing more accurate relevance scores at the cost of increased computation. Unlike bi-encoders that encode query and document independently, cross-encoders can model fine-grained interactions between query and document tokens, typically yielding higher precision on the reranked results. This model was trained on the MS MARCO passage ranking dataset [
49] and has demonstrated strong transfer performance across domains.
5.2.4. Chunking Strategy Optimization
Document chunking is the process of splitting datasheet content into smaller segments for embedding and has a significant impact on retrieval quality. The chunking strategy must balance preserving sufficient context within each chunk against maintaining granularity for precise matching.
Two configurations were evaluated using semantic chunking with the RecursiveCharacterTextSplitter method from LangChain, which splits on natural boundaries such as section headers, paragraph breaks, and sentence endings: 1000 characters per chunk with 200-character overlap and 2000 characters per chunk with 400-character overlap.
The hypothesis for the extended configuration was that larger chunks would preserve more context across technical specifications, potentially improving retrieval accuracy.
The chunk-size comparison shows a mixed effect rather than a uniform degradation from larger chunks.
Table 1 reports the two chunking configurations on the real datasets for the two most relevant retrieval settings. The 1000/200 setting remains the selected default because it preserves the best Structured + Rerank result on DB2 and matches or exceeds the 2000/400 setting in the primary real-data operating point.
5.3. Summary-Generation Strategies
To determine the optimal query representation for component retrieval, we evaluated six distinct summarization strategies, each governed by a specific prompt design (detailed in
Appendix B). The Structured Summary adopts a hierarchical organization, categorizing specifications into Architecture, Memory, Peripherals, Power, and Communication, to facilitate direct comparison through consistent formatting. Conversely, the Detailed Summary provides a comprehensive narrative in paragraph form, ensuring that nuanced technical details often lost in rigid structures are preserved. To assess the impact of information density and focus, we implemented a Concise Summary to test whether a brief overview of key differentiators suffices for identification, alongside Feature-Focused and Spec-Heavy variants that prioritize peripheral sets and raw numerical data, respectively. Finally, the General + Applicability strategy integrates general technical specifications with potential use cases to provide a holistic view of the component’s functional role. All prompts used for the aforementioned summary-generation strategies are available in the
Appendix B. Structured summaries provided a strong and useful query representation across the real-world analyses, but they were not uniformly dominant across every database and retrieval depth. Structured + Rerank achieved the strongest combined first-candidate result, while Detailed+Baseline achieved the strongest DB2 first-candidate result and BM25 with the structured-summary query achieved the strongest FRR with
shortlist behavior. This indicates that the structured summary is valuable, while the downstream retrieval strategy determines how the benefit is distributed between first-rank accuracy and candidate-set coverage.
6. Experimental Results for Synthetic Datasets
Experiments utilized the framework in
Section 4 to evaluate performance across LLM configurations.
6.1. Experimental Setup
To evaluate the system’s performance across diverse architectural paradigms, we employed a suite of state-of-the-art small language models capable of efficient local execution. The retrieval subsystem utilizes nomic-embed-text v1.5 for high-fidelity vector embedding generation. For the generative components designated as Model A for synthetic data generation and Model B for response synthesis and evaluation we selected four high-performance models: Phi-4, Gemma 3 12b, Qwen2.5 14b, and DeepSeek R1 14b. We conducted a comprehensive evaluation across all 16 possible permutation pairings of these models to assess cross-model compatibility and performance stability. These specific architectures were chosen to represent strong local models that can run on consumer-grade hardware. The synthetic benchmark trials were executed locally on a MacBook workstation equipped with an Apple M2 Pro chip, demonstrating that the synthetic evaluation pipeline can be run without external cloud inference.
These models were selected because they represent the most powerful models that can run on a dedicated laptop graphics card. All experiments were performed on a MacBook laptop with an M2 Pro chip.
6.2. Evaluation Metrics
The aggregated results across the 16 Model A/Model B configurations revealed key insights into the system performance, retrieval effectiveness, generation quality, and latency trade-offs.
6.2.1. Retrieval Performance
The retrieval performance is fundamentally dictated by the quality of the synthetic data source (Model A). To objectively assess this, we utilize three metrics ranging from broad categorical accuracy to precise ranking alignment. First, the Family Retrieval Rate (FRR) provides insight into the system’s ability to narrow down results to the correct component type. It assesses categorical accuracy by calculating the percentage of the top-
k retrieved components that belong to the same predefined family (e.g., MCU, ADC) as the query component. For a query component
q with family
, and a retrieved set
, the metric is defined as
Moving to stricter criteria, the Similarity Retrieval Rate (SRR) quantifies the system’s effectiveness in identifying truly similar items. This metric serves as a direct measure of recallregarding the most relevant items established by the ground truth. It is defined as the proportion of the top-
k ground truth similar components (
) that are successfully identified within the system’s top-
k retrieved set (
):
Finally, the rank correlation evaluates the consistency of the system’s ordering against the ideal ground truth ranking. We utilize Spearman’s rank correlation coefficient to compare the ranks of components common to both the retrieved list and the ground truth set. For
n overlapping components, where
denotes the difference between the retrieved rank and the ground truth rank of component
i, the coefficient is calculated as
where
, with a value of
indicating perfect rank agreement.
To better explain these metrics, we will provide an example: Let us assume that for MCU3, the ground truth states that the most similar three components are MCU1, MCU5 and MCU4, in this order. Presume our algorithm retrieves MCU1, MCU4 and MCU5, in this order. This results in a Family Retrieval Rate of 100%, because all retrieved components are from the MCU family, a Similarity Retrieval Rate of 100%, because all three ground truth components were retrieved, and a rank correlation of 0.5, because while all correct items were found, MCU4 and MCU5 were swapped in order (MCU4 ranked 2nd instead of 3rd, MCU5 ranked 3rd instead of 2nd). This considered, rank correlation should be interpreted alongside SRR, since it only measures ordering of successfully retrieved items. When SRR is high, rank correlation provides meaningful ordering quality assessment.
Table 2 reports the retrieval performance for each data source model at
, the most demanding setting tested, where the system must return all four correct components simultaneously (considering each family of components has a total of 5 datasheets).
As shown in
Table 2, Phi-4 reaches FRR = 1.000 in the controlled synthetic benchmark, meaning that the retrieved components belong to the correct synthetic category in every test case. DeepSeek R1 14b and Qwen2.5 14b follow closely at 0.989 for both FRR and SRR, with Qwen2.5 14b producing the strongest rank correlation (
). Gemma 3 12b has lower synthetic retrieval metrics (FRR =
, SRR =
,
). These values compare synthetic data sources under a shared automated protocol and should be interpreted together with the ground truth caveats in
Section 4.
6.2.2. Question Answering Relevance
The system’s ability to retrieve relevant context for Direct Question Answering (QA) was evaluated using the Document Relevance F1 score. Across almost all Model A/Model B configurations, the average QA F1 score was 1.0. This result indicates that, under the controlled synthetic protocol, the retriever consistently surfaced the expected answer-bearing context for queries targeting known snippets in generated datasheets. The metric is therefore interpreted as a protocol-level retrieval check, while broader open-ended engineering QA robustness is assessed separately through real-datasheet experiments and qualitative analysis.
6.2.3. Comparative Analysis Coverage
The quality of the generated component comparisons was primarily assessed using the Comparative Analysis Coverage metric, which measures the percentage of predefined ground truth differences identified in the LLM’s output.
Table 3 reports the complete planned set of 16 Model A/Model B synthetic configurations.
The full table shows that comparison coverage is influenced by both Model A and Model B, but the synthetic data source has the strongest visible effect. Qwen2.5 14b as Model A delivers the highest and most consistent coverage across all Model B pairings, while DeepSeek R1 14b forms a second tier. By contrast, Gemma 3 12b as Model A yields the lowest coverage overall, and Phi-4 as Model A shows greater variability across evaluators. Reporting the complete planned configuration set avoids selecting only visually representative configurations and makes the synthetic evidence easier to audit.
6.2.4. Image Reference Rate
The ability of the system to explicitly reference expected image categories during analysis was measured using the Image Reference Rate. When processing a PDF containing embedded images (such as pin diagrams, block diagrams, or package drawings), and prompted with questions targeting these visual aspects, this metric measures the proportion of expected image categories that are lexically referenced in the generated textual response. It is computed by checking the textual output for keywords associated with expected image types. Therefore, a high Image Reference Rate indicates that the response mentions relevant visual categories, but it does not prove that the model accurately interpreted the figure content. Most configurations achieved high rates (average > 0.9), suggesting that the prompts elicit image references when multimodal analysis is enabled. Future evaluation should replace this lexical proxy with image-conditional QA that verifies whether generated descriptions match the actual figure content.
6.2.5. Latency Analysis
Total latency varied based on model choices, as shown in
Table 3. Similarity search remained relatively low across configurations (typically < 0.5 s), while generation constituted the bulk of runtime. The lowest total pipeline times (approximately 66–69 s) were observed in several Phi-4 or Gemma 3 12b configurations, whereas Gemma 3 12b as Model A with DeepSeek R1 or Gemma 3 12b as Model B produced the highest total runtimes (93.6–94.5 s).
From a deployment perspective, the latency profile should be interpreted as an offline or asynchronous engineering-assistant workflow rather than instant interactive search. Across the synthetic reports, similarity search itself remained sub-second (approximately 0.33–0.57 s), while generation dominated the end-to-end runtime (approximately 66–94 s). Practical optimizations include caching generated summaries, precomputing reference summaries, asynchronous UI updates, optional local/API summarization modes, and replacing general-purpose LLM summarization with faster domain-specific summarizers when available.
6.2.6. Summary of Findings
Analysis of the detailed synthetic metrics indicates that Data Source Quality (Model A) strongly affects retrieval fidelity in the controlled benchmark. Datasets generated by Qwen2.5 and DeepSeek R1 produced the highest synthetic similarity rates and rank correlations, whereas the Gemma 3 12b synthetic data led to weaker retrieval outcomes. The Generation/Evaluation Model (Model B) primarily affects comparison coverage and latency. The QA F1 and Image Reference Rate results should be interpreted as protocol-specific checks, not as broad proof of open-ended QA or visual grounding. Finally, direct comparison mode gives higher coverage because it receives the full datasheet context, but this comes at substantially higher generation latency than summary-driven retrieval. These synthetic findings motivate the real-datasheet experiments, but they do not replace independent real-world validation.
7. Experimental Results Validation on Real Datasheets
To validate the findings obtained on the synthetic benchmark, we conducted similar experiments on the MCU datasheet datasets presented in
Section 5.1.
7.1. Experimental Setup
We employed leave-one-out cross-validation: for each of the 18 MCUs, a vector database was constructed excluding that MCU’s datasheet, and the excluded MCU was used as the query component. We use the FRR definition from
Section 6.2 and report the real-datasheet results for FRR with
and FRR with
.
Based on the synthetic benchmark, the primary real-data configuration uses structured summaries embedded with nomic-embed-text-v1.5, semantic chunks of 1000 characters with 200-character overlap, and cross-encoder reranking with ms-marco-MiniLM-L-6-v2. The real-data summary comparison uses Claude Sonnet 4.5 as a non-local reference summarizer. The headline result for FRR with uses Claude Sonnet 4.5 for query summary generation. The local comparison uses phi4, deepseek-r1:14b, gemma3:12b, qwen2.5:14b, and gemma4:e4b; gemma4:e4b is included in the real-world comparison although it was not part of the synthetic benchmark.
7.2. Performance Analysis
7.2.1. Strategy Comparison on Real Data
Table 4 isolates the effect of the model used to generate the query datasheet summary. All other retrieval settings are held fixed: the query is represented as a structured summary, indexed datasheet chunks use
nomic-embed-text-v1.5, and final candidates are reranked with the cross-encoder. None of the local summary-generation conditions matches the Claude result for FRR with
. The newer Gemma4 E4B local model matches DeepSeek R1 14b at 55.6% FRR with
, while also outperforming the older Gemma 3 12b and Qwen2.5 14b local conditions on that metric. This pattern suggests that stronger local LLMs may improve the pipeline while preserving a local deployment path; at present, however, robust summary generation from heterogeneous real datasheets remains the main limiting step for lightweight local models in this pilot.
Table 5 compares retrieval and summary-format strategies on the real MCU datasets using Claude Sonnet 4.5 for query summary generation. The table reports FRR with
, which measures whether the highest-ranked retrieved component belongs to the same family as the query.
Table 5 shows that the best configuration depends on the database. Structured + Rerank performs best on DB1 for FRR with
(77.8%), while Detailed+Baseline performs best on DB2 (77.8%). Structured + Rerank remains the strongest aggregate first-candidate configuration across the two datasets, with an average FRR with
of 72.2%, but the DB2 result shows that it is not uniformly dominant across datasets.
External and no-summary retrieval baselines are included to isolate the contribution of the summary-driven query.
Table 6 reports combined results over both real MCU datasets (18 leave-one-out queries). The row “BM25 raw chunks, raw-datasheet query” is the true no-summary baseline: it queries the indexed raw datasheet chunks directly with raw query-datasheet text. The row “BM25 raw chunks, structured-summary query” is instead a summary-query lexical ablation, because it keeps the Claude-generated structured summary but replaces dense retrieval/reranking with BM25.
The combined baseline comparison shows that the true no-summary condition is the weakest result at both operating points. The row “BM25 raw chunks, raw-datasheet query” reaches only 33.3% FRR with and 36.1% FRR with , whereas every configuration that uses a generated summary performs better on both metrics. Even the weakest summary-driven setting in this comparison, Structured + Hybrid, improves to 55.6% for FRR with and 50.0% for FRR with , while the strongest settings reach 72.2% for FRR with (Structured + Rerank) and 55.6% for FRR with (BM25 raw chunks, structured-summary query). This directly supports the main contribution of the paper: introducing a summary-based query representation improves retrieval quality regardless of whether the downstream strategy uses BM25, dense retrieval, hybrid retrieval, or reranking. The remaining differences between strategies mainly affect how those gains are distributed between first-rank accuracy and broader candidate-set coverage.
The FRR with column gives a more stringent view of candidate-set purity than FRR with . Under the leave-one-out protocol, each query has only two same-family candidates available. Therefore, a query that retrieves one correct same-family component at rank 1 but a different-family component at rank 2 contributes only 0.5 to FRR with . This explains why Structured + Rerank reaches 72.2% for FRR with but only 41.7% for FRR with : the reranking stage often concentrates the most plausible same-family candidate at the first position, but it does not consistently keep the second same-family candidate at rank 2. By contrast, BM25 with the structured-summary query reaches 55.6% for FRR with , suggesting that lexical matching over the structured summary can preserve broader same-family candidate coverage. This is useful when the system is used as a shortlist generator, while Structured + Rerank remains preferable for the first-candidate operating point. Improving the reranking stage so that it preserves same-family coverage beyond the first rank is a limitation and future optimization target.
7.2.2. Per-Family Retrieval Analysis
To understand the failure modes,
Table 7 presents the per-family breakdown using each database’s best-performing configuration: Structured + Rerank for Database 1 and Detailed + Baseline for Database 2.
Table 8 complements this view by reporting Wilson 95% confidence intervals for the Structured + Rerank per-family FRR estimates, showing how uncertain those family-level estimates remain at this pilot scale.
As shown in
Table 7, SimpleLowPowerIoT was correctly matched despite different architectures (8-bit, 16-bit). GeneralPurpose32bit ARM Cortex-M4F devices were correctly identified across vendors. For HighPerfSpecialized, only TMS320F28379D was correct; dsPIC was retrieved as SimpleLowPowerIoT and XMC4500 was retrieved as GeneralPurpose32bit. SecureUltraLowPower security-focused Cortex-M33 MCUs were correctly identified. For ConnectivitySoC, CC2674P10 and nRF5340 were retrieved as SecureUltraLowPower. HighPerformanceControl high-performance MCUs were correctly identified.
The apparent 3/3 family results should not be described as statistically robust or near-perfect because each family contains only three queries.
Table 8 shows that the confidence intervals remain wide even when all three queries are correct: with only three queries per family, even 3/3 results correspond to a Wilson 95% interval of 43.9–100.0%, while 0/3 results still yield 0.0–56.1%. The per-family table is therefore most useful as a failure-analysis tool rather than as evidence of broad family-level generalization.
The results exhibit a bimodal distribution: four of six families achieved 3/3 first-ranked retrieval, while two families exhibited substantial failures. The failure patterns reveal systematic issues:
Because Structured + Rerank is selected below as the primary first-candidate operating point, we additionally inspect its per-family failures separately from the best-per-database summary in
Table 7. This separates the per-database best-case view from the behavior of the single configuration used for the final pilot-scale performance summary.
The HighPerfSpecialized family failures stem from architectural heterogeneity. Both the XMC4500 and dsPIC33CK were incorrectly retrieved as GeneralPurpose32bit devices. The XMC4500, despite being positioned for industrial control, shares the Cortex-M4F core with GeneralPurpose32bit devices, causing the retrieval system to prioritize architectural similarity over functional positioning. The dsPIC33CK, although a 16-bit DSC architecture, was matched to the Microchip ATSAME54P20A, likely due to shared vendor-specific terminology and peripheral naming conventions in Microchip datasheets. Only the TI TMS320F28379D was correctly matched within its family, as its distinctive C28x DSP architecture and TI-specific terminology provided sufficient differentiation.
The ConnectivitySoC results under Structured + Rerank suggest that the dense retrieval and cross-encoder reranking path does not weight connectivity-specific evidence as strongly as shared MCU, security, and low-power attributes. Wireless SoCs are distinguishable in practice, but their datasheets often combine integrated radio, protocol-stack, Cortex-M core, security, and low-power information in ways that can make semantic reranking favor broader architectural similarities. Because BM25 with the same structured-summary query recovers the ConnectivitySoC family more effectively, the limitation is not simply the absence of radio information in the summaries. Instead, it points to the downstream weighting and scoring stage: lexical retrieval can exploit explicit radio and protocol terms, whereas the dense/rerank path can underweight them relative to shared architectural features.
7.2.3. Configuration Selection
Given that different configurations performed best on each database, selecting a single configuration for production deployment required careful consideration.
Table 9 presents the key candidates evaluated for robustness across both datasets.
The purpose of evaluating two databases with different characteristics was to identify configurations that are less sensitive to a single dataset’s properties. While Detailed+Baseline achieved the highest single-database performance (77.78% on DB2), it showed higher variance across datasets (55.56% on DB1), indicating sensitivity to dataset characteristics.
The Structured + Rerankconfiguration was selected as the primary operating point because it had the highest combined FRR with across the two pilot datasets (72.2%, 13/18) and avoided the largest single-database drop among the summary-based configurations. The 5.5 percentage-point margin over Detailed+Baseline corresponds to one additional correct retrieval, so we do not describe it as statistically significant. Instead, we treat Structured + Rerank as the preferred pilot configuration because it combines the best aggregate first-candidate result with an interpretable structured query representation and a standard two-stage retrieval architecture.
The preferred configuration therefore depends on the intended operating point. If the system is used to return one primary replacement candidate, Structured + Rerank is the selected setting because it gives the highest combined FRR with . If the system is used as a shortlist generator, BM25 raw-chunk retrieval with the structured-summary query is the stronger option in this pilot because it gives the highest mean per-family FRR with and better preserves same-family coverage beyond the first rank.
Table 10 and
Table 11 present the final performance summary using the Structured + Rerank configuration as the primary first-candidate operating point.
Four of the six families obtain 3/3 correct first-ranked retrievals under Structured + Rerank, but these counts should be read together with the wide intervals in
Table 8. The notable outlier is ConnectivitySoC (DB2), which obtains 0/3 for FRR with
. TI CC2674P10, Nordic nRF5340, and Silicon Labs EFR32MG24 are all assigned SecureUltraLowPower devices as their highest-ranked candidates, with NXP LPC55S6x appearing first in all three cases. Manual inspection shows that the dense retrieval and reranking scores overemphasize shared Cortex-M cores, TrustZone/security accelerators, and low-power modes relative to the distinctive integrated 2.4 GHz radio hardware and wireless protocol stacks. This is a concrete limitation of the Structured + Rerank scoring path, not evidence that wireless SoCs are inherently ambiguous for engineers.
The added FRR with
values in
Table 11 and
Table 12 further clarify the failure mode and the operating-point trade-off. Under Structured + Rerank, ConnectivitySoC remains at 0.0% (0/6) for FRR with
, meaning that the three wireless SoC queries do not recover any same-family candidate in the first two ranks. For this configuration, the error is therefore not only a rank-1 sharpness issue; it reflects a stronger representational mismatch in which SecureUltraLowPower candidates dominate the top of the ranking. In contrast, BM25 raw-chunk retrieval with the same structured-summary query recovers ConnectivitySoC much more effectively, reaching 100.0% (3/3) for FRR with
and 83.3% (5/6) for FRR with
. The opposite trade-off appears for SimpleLowPowerIoT, where BM25 with the structured-summary query falls to 0.0% (0/3) for FRR with
and 16.7% (1/6) for FRR with
. This family combines 8-bit and 16-bit low-power MCUs from different vendors, so its members share a functional role more than a tight lexical signature; BM25 therefore tends to match generic, vendor, or peripheral terms to general-purpose or higher-performance devices, whereas Structured + Rerank better preserves the conceptual low-power controller grouping. Across all six families, Structured + Rerank remains the strongest first-candidate setting reported in this study, while BM25 with the structured-summary query gives the strongest candidate-shortlist behavior, with a mean per-family FRR with
of 55.6%. Thus, reranking is useful when the system is optimized for one top recommendation, whereas structured-summary BM25 is preferable when the engineering workflow benefits from a broader two-candidate shortlist.
7.2.4. Similarity Visualizations
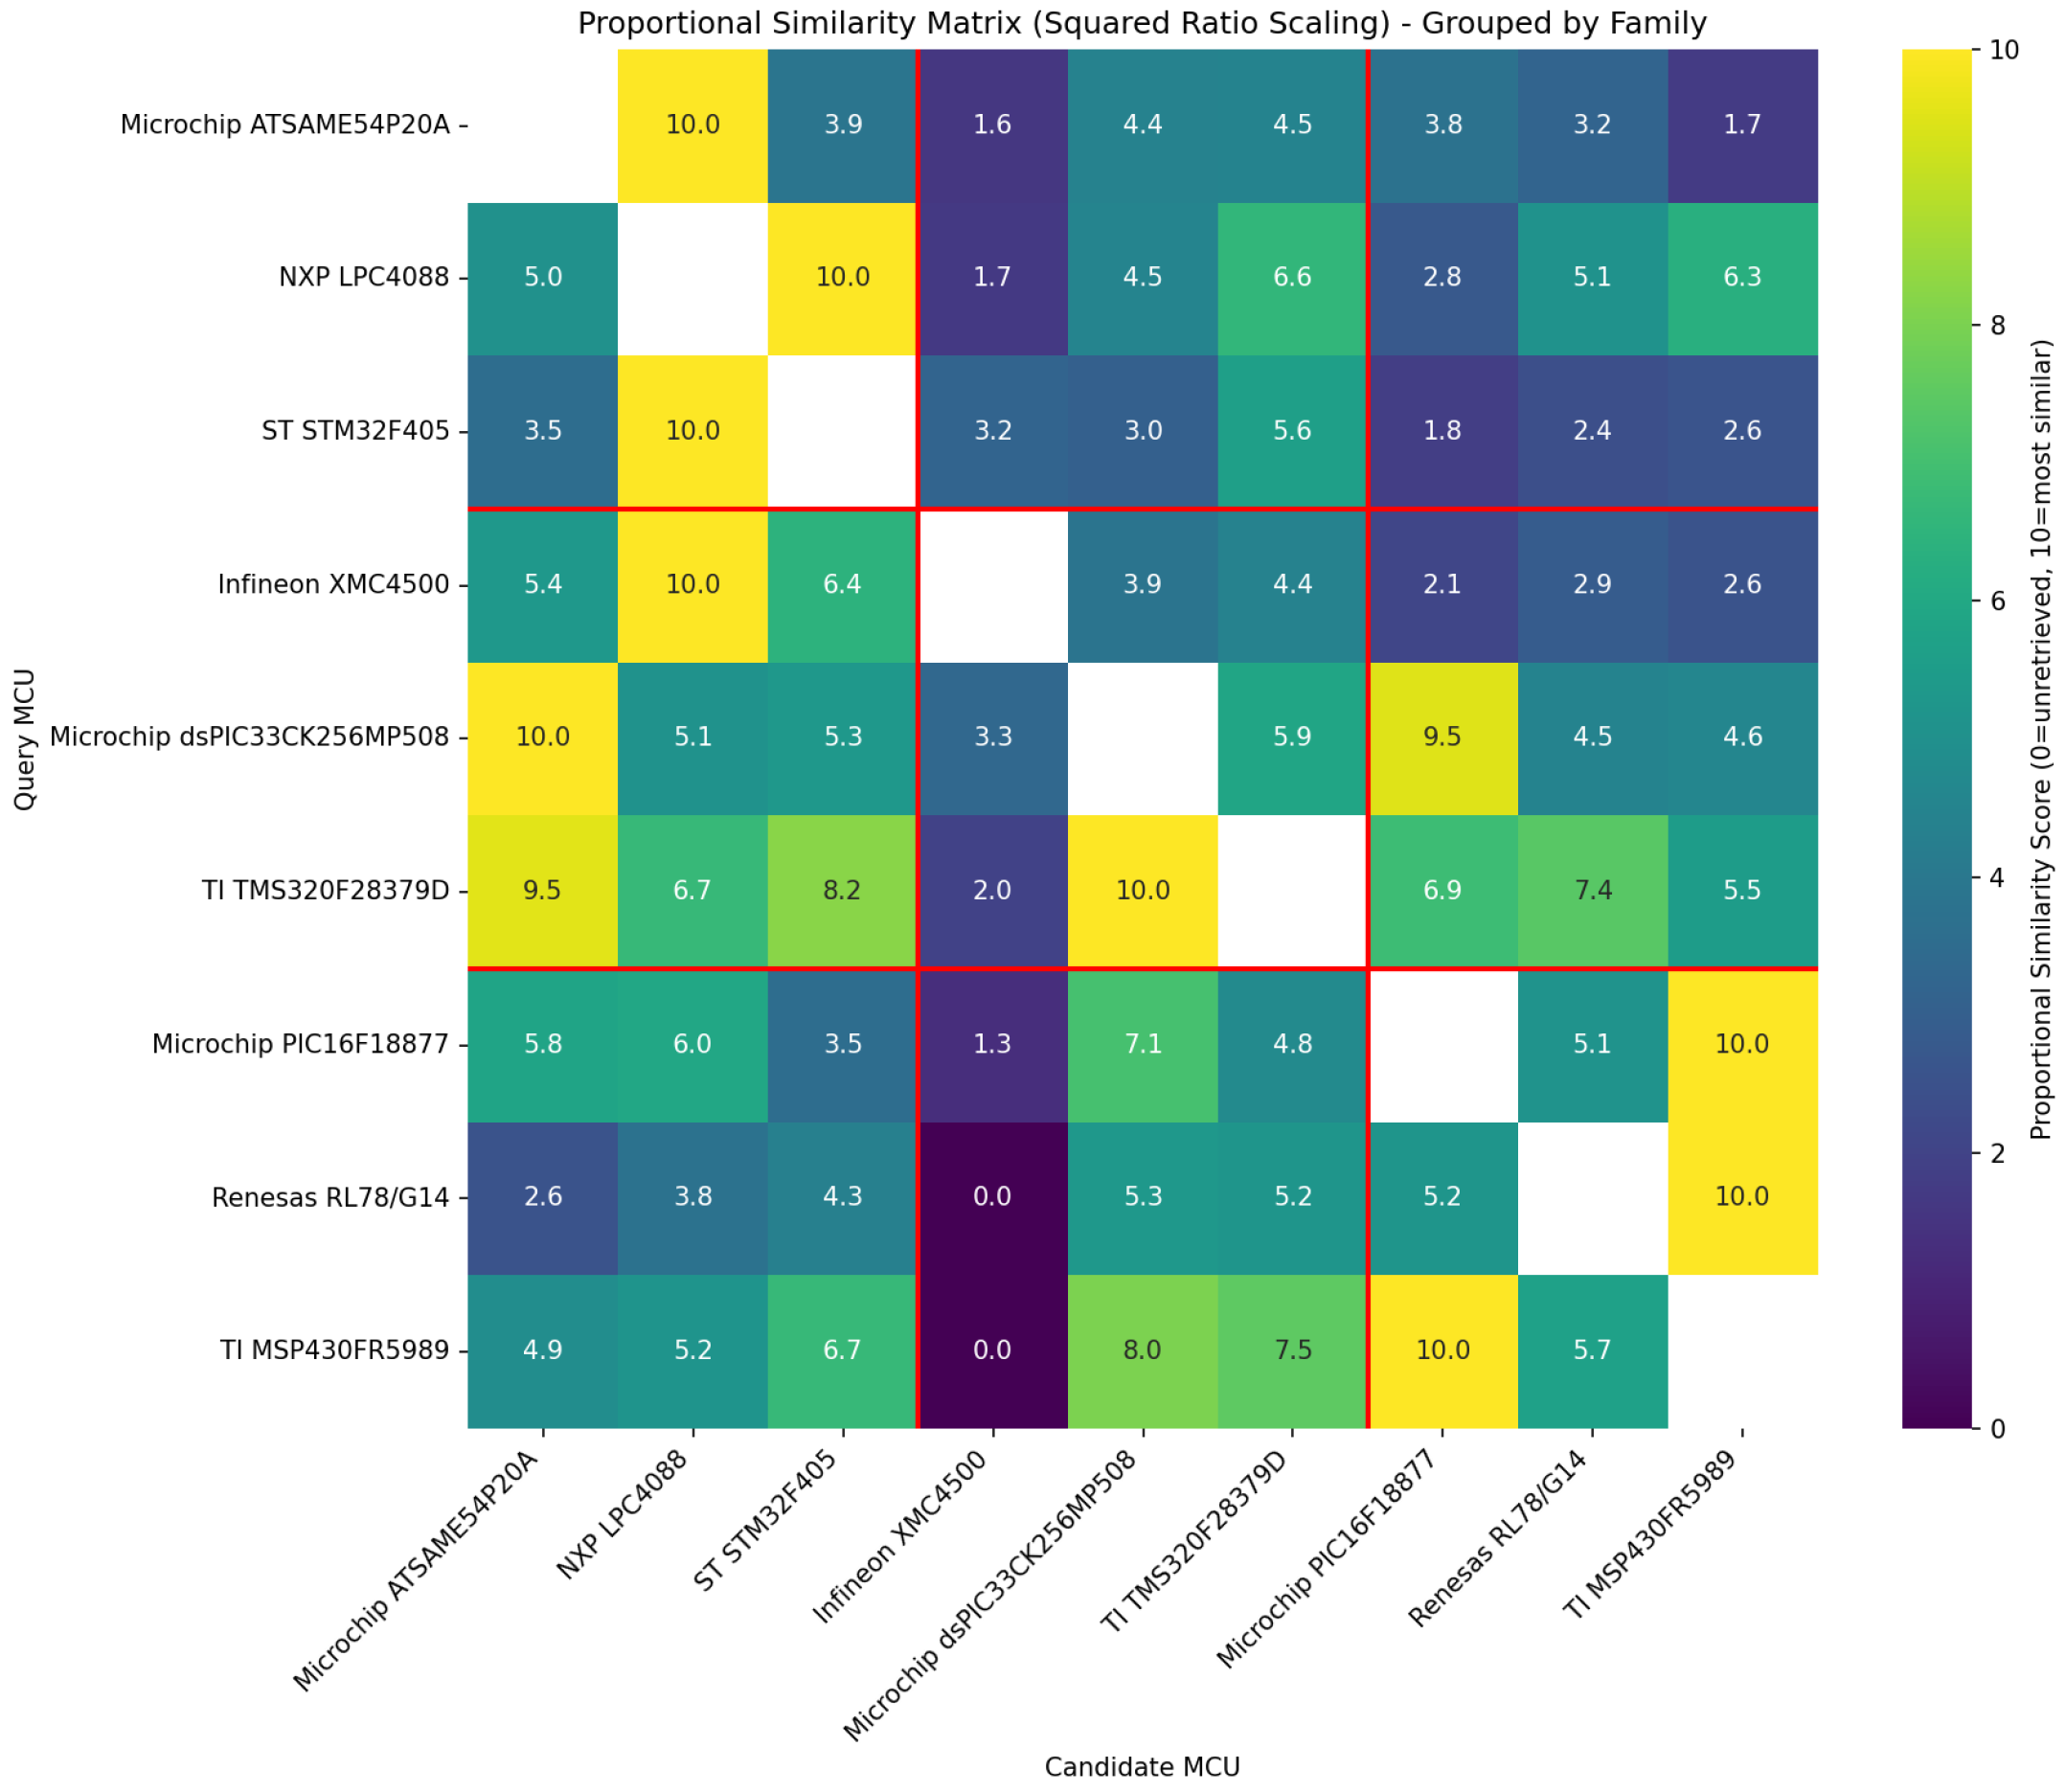
Figure 7 and
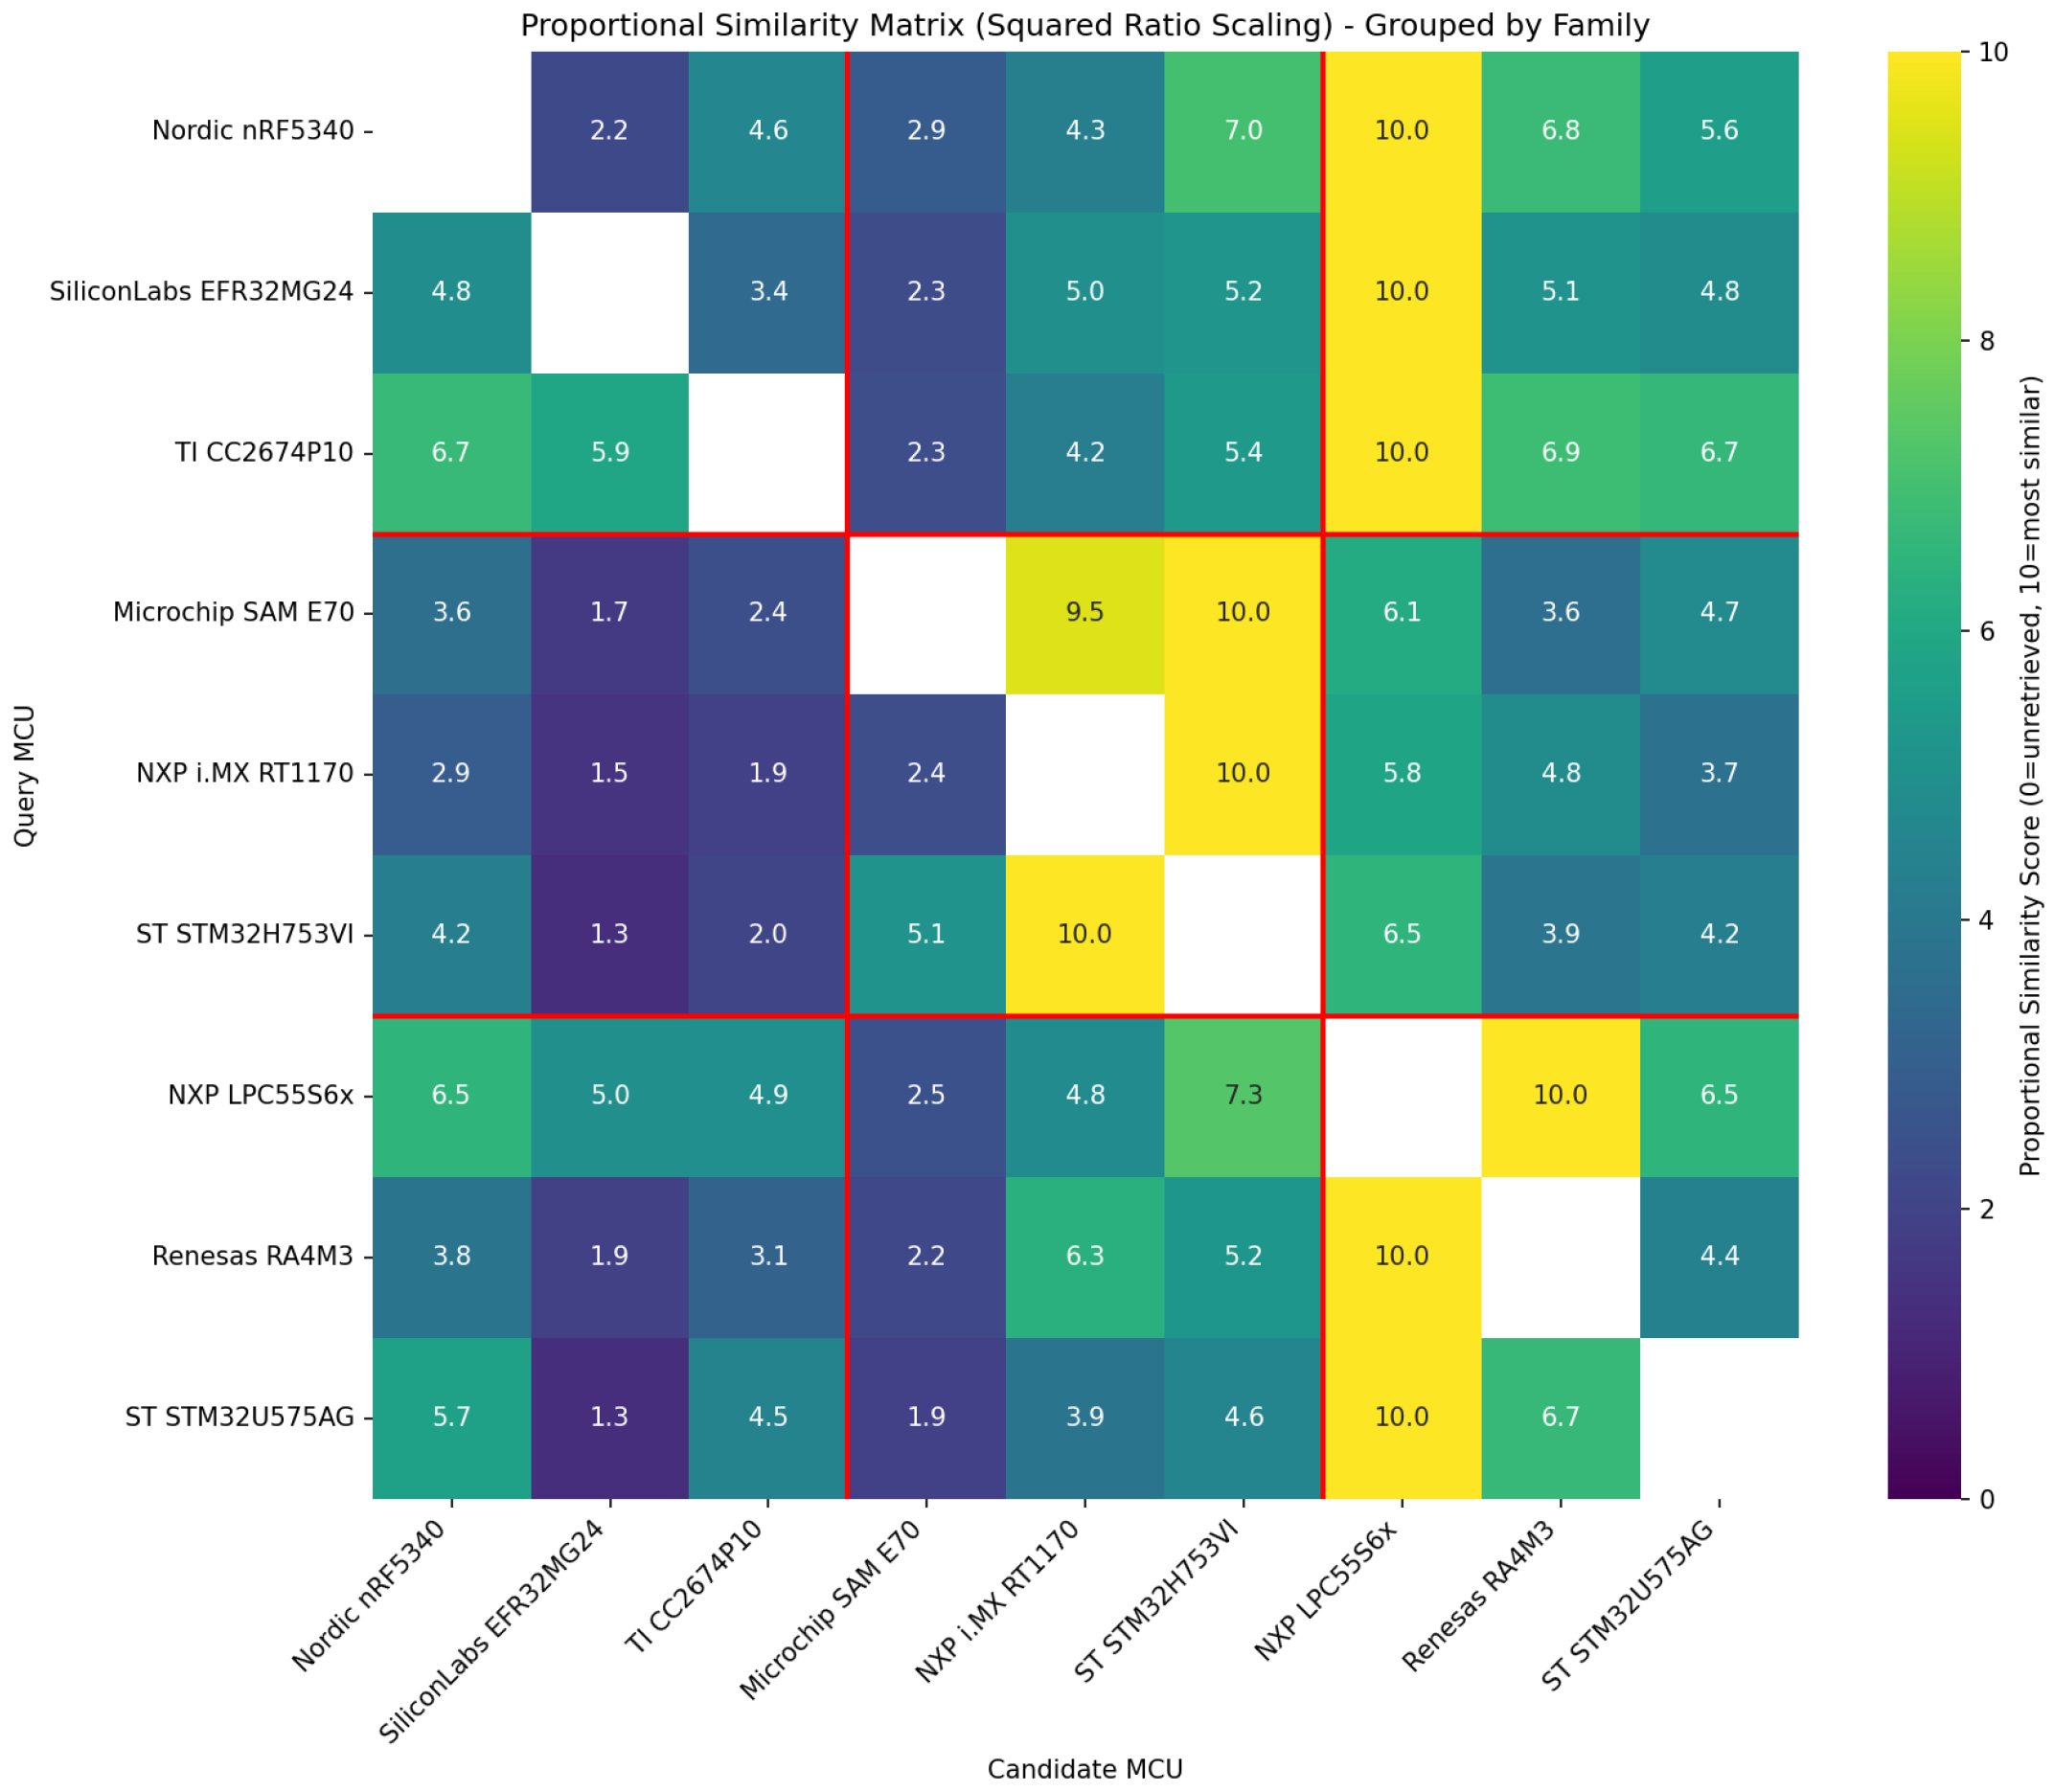
Figure 8 present proportional similarity matrices for both databases using the primary first-candidate Structured + Rerank configuration. In these matrices, each row represents a query MCU and each column represents a candidate MCU. The cell value indicates how similar the candidate (column) is to the query (row), with higher values (yellow) indicating stronger semantic similarity and lower values (purple) indicating weaker similarity. The diagonal cells are empty as components are not compared against themselves.
MCUs are grouped by family, with red lines delineating family boundaries. The three 3 × 3 blocks along the diagonal represent intra-family comparisons—ideally, these regions should exhibit high similarity scores (yellow), indicating that the system correctly identifies components within the same family as most similar to each other.
These matrices employ squared ratio normalization to reflect the true similarity magnitude returned by the cross-encoder:
where
is the cross-encoder similarity score for candidate
i and
is the maximum score among all candidates for that query. This quadratic normalization amplifies differences between high and low similarity items, making the relative similarity gaps between candidates immediately visible. The top match for each query consistently achieves the maximum score of 10, while less similar candidates display proportionally lower scores that reflect their actual semantic distance from the query. In each row, the component receiving a score of 10 is the one deemed most similar by the system, and this first-ranked retrieval is used to compute FRR with
. In a three-component family, if each row’s maximum score appears inside the family block, all three queries have a same-family first-ranked match. This is a count-level visualization of retrieval behavior, not a statistical claim of perfect family performance.
For Database 1, in
Figure 7, the GeneralPurpose32bit and SimpleLowPowerIoT families exhibit clear intra-family clustering, as evidenced by the yellow/green coloring within their diagonal blocks. Both families show all three 10s within their respective blocks, corresponding to 3/3 first-ranked family matches. In contrast, HighPerfSpecialized shows weaker within-family similarity, with its diagonal block displaying lower scores and two of its three components finding their top match (10) outside the family block, resulting in only 33.3% FRR with
. For Database 2, as depicted in
Figure 8, the ConnectivitySoC family exhibits similarity patterns that overlap with SecureUltraLowPower devices due to shared security and low-power characteristics. This is visible as all three ConnectivitySoC components assigning their top score (10) to SecureUltraLowPower devices rather than same-family components, yielding 0% FRR with
for this family. The HighPerformanceControl family demonstrates the strongest intra-family clustering, with all three 10 s appearing within its diagonal block and notably lower scores outside it.
8. Discussion
The results demonstrate the potential of multimodal RAG, particularly the summary-driven retrieval approach, for efficient datasheet analysis. Across the experiments, the proposed architecture was able to transform heterogeneous datasheet content into compact semantic query representations and use them effectively for replacement-oriented retrieval. The interaction between data source quality (Model A) and generation capability (Model B) was evident, showing that both retrieval design and summary fidelity contribute to final system behavior. The synthetic benchmark was useful for controlled pipeline analysis, while the real-datasheet validation provided an initial assessment under more heterogeneous manufacturer documentation. Model B also introduced a clear quality-latency trade-off, which is relevant for practical deployment.
The real-world validation provides encouraging pilot-scale evidence that summary-driven retrieval can transfer beyond synthetic datasheets. The Structured + Rerank configuration achieved 72.2% FRR with across 18 MCUs from eight manufacturers (13/18; Wilson 95% CI: 49.1–87.5%). This result is notable because the evaluated datasheets come from different manufacturers and exhibit substantial variation in terminology, organization, and presentation style. At the same time, because each family contains only three components, the per-family results should be interpreted with appropriate statistical caution. The real-data experiment is therefore best viewed as an initial feasibility evaluation and failure-analysis dataset for replacement-oriented MCU retrieval, rather than as a definitive benchmark across the full diversity of electronic components.
The difference between synthetic and real-world performance also clarifies the complementary role of the synthetic benchmark. Synthetic data remains useful for controlled development, latency analysis, prompt comparisons, and end-to-end pipeline checks, especially because it allows many Model A/Model B configurations to be evaluated reproducibly. However, because the synthetic reference rankings are embedding-derived, they are better interpreted as controlled similarity-neighborhood tests than as independent evidence of technical replacement equivalence. The real-data results extend this analysis by exposing practical challenges that are less visible in the synthetic benchmark, including PDF heterogeneity, manufacturer-specific terminology, overlapping MCU feature sets, and downstream dense/rerank scoring that may underweight domain-specific differentiators such as integrated radios even when those terms are present in structured summaries.
The baseline comparison provides one of the clearest positive findings of the study: the summary-driven query substantially improves first-candidate retrieval compared with true no-summary retrieval. True no-summary BM25 retrieval over raw datasheet text reached 33.3% combined FRR with . In contrast, Structured + Rerank reached 72.2% FRR with , and BM25 over raw chunks using the structured summary as the query reached 66.7%. These results suggest that the structured summary representation is a major contributor to first-candidate performance in this pilot evaluation. They also show that lexical retrieval remains useful when applied to well-formed summary queries, indicating that the benefit comes not only from dense retrieval but also from the quality and focus of the generated query representation.
Several factors contextualize the findings while also identifying concrete opportunities for improvement. First, Synthetic Data Limitationsremain, as synthetic generation does not fully capture real-world datasheet complexity [
24]; nevertheless, the benchmark provides a reproducible environment for controlled comparisons and pipeline stress testing. Second,
Dataset Size limits statistical strength: one additional correct or incorrect real-data retrieval changes the combined FRR with
by 5.6 percentage points. This motivates larger follow-up evaluations, but the present dataset still provides useful early evidence across eight manufacturers. Third, PDF Parsing Challenges remain because datasheets vary in organization, typography, tables, and figure placement; addressing these challenges is directly aligned with the proposed multimodal ingestion architecture.
From an architectural perspective, the system exhibits Summary Quality Dependence, which is both a current constraint and a clear path for improvement. Claude Sonnet 4.5 produced the strongest first-candidate real-data result, while the best local models tested reached 55.6% FRR with . This distinction does not affect the locality of indexing, embedding, retrieval, and reranking stages, which can run locally after summaries are available. Instead, it identifies summary generation as the main remaining dependency for robust fully local real-datasheet replacement search. In addition, Representational Overlap can affect retrieval when shared architectural, security, or low-power terminology receives more weight than narrower domain-critical features. The ConnectivitySoC results show that the dense/rerank path can underweight connectivity-specific evidence, whereas BM25 with the same structured-summary query can exploit explicit radio and protocol terms. This provides a concrete target for domain-aware feature weighting, hybrid lexical–semantic evidence, domain-specific reranking, or embedding fine-tuning. Finally, Evaluation Methodology can be strengthened in future work by adding blinded external annotation, although the component list and datasheet references used here are publicly auditable.
Improvements in future LLMs are likely to enhance several aspects of the proposed system, particularly summary fidelity, multimodal reasoning, comparison completeness, and robustness to noisy or heterogeneous PDF extraction. Stronger models can therefore be expected to improve both answer quality and, indirectly, retrieval quality when the generated summary more accurately captures the distinguishing attributes of a component. Importantly, the modular design of the proposed pipeline allows such improvements to be incorporated without changing the overall retrieval architecture. At the same time, some challenges are inherent to the RAG setting and are unlikely to disappear solely through larger models. These include dependence on document ingestion quality, incomplete or inconsistent information in the source datasheets, ambiguity between semantically overlapping component families, and the fact that retrieval quality is bounded by the representation stored in the vector database. In other words, better LLMs can reduce generation and summarization errors and strengthen the proposed workflow, while complementary improvements in parsing, domain-aware representation, and evaluation design remain important for robust deployment.
9. Conclusions and Future Work
This study addresses the challenge of inefficient manual analysis and comparison of electronic component datasheets by presenting a multimodal RAG-based datasheet assistant centered on summary-driven retrieval. The evaluation supports a bounded but positive conclusion: structured LLM summaries can provide an effective query representation for replacement-oriented retrieval, particularly when compared with true no-summary baselines, while real-datasheet performance remains sensitive to summary quality and dataset heterogeneity.
The controlled synthetic benchmark demonstrates that the pipeline can operate consistently across several LLM configurations and provides a useful environment for comparing prompts, retrieval settings, latency, and end-to-end behavior. Because the synthetic reference rankings are embedding-derived, the benchmark is interpreted as a controlled pipeline evaluation rather than as an independent equivalence test. On the real MCU datasets, Claude Sonnet 4.5 summaries with Structured + Rerank achieved 72.2% FRR with (13/18; Wilson 95% CI: 49.1–87.5%). Local model tests indicate that fully local execution is currently limited primarily by summary-generation quality. Overall, these findings position the system as a promising retrieval architecture and analysis workflow for datasheet-based component search.
Future work will expand real-world validation to larger and more diverse datasheet corpora, building on the initial MCU validation presented in this work. Scalability experiments will stress-test larger repositories to optimize latency, indexing efficiency, and resource use. A human-grounded testbench based on engineers’ feedback, together with a purpose-built user interface, will further align the assistant with practical hardware engineering workflows. Based on the real-world validation results, future improvements should also ensure that explicit feature categories, such as wireless connectivity and security capabilities, are both captured in the summary and preserved or weighted downstream through hybrid retrieval, domain-specific reranking, or embedding fine-tuning.
A further direction is adaptive retrieval configuration selection. The present results show that different operating points benefit from different methods: Structured + Rerank is strongest for first-candidate retrieval, while BM25 with the structured-summary query better preserves two-candidate shortlist coverage and is particularly effective for connectivity-oriented devices. A future system could use lightweight signals extracted from the query datasheet, such as component class, radio/protocol terminology, architecture family, or the intended output depth, to select or blend the most appropriate summary format and retrieval strategy for each query. Such an adaptive controller could preserve the strengths of semantic reranking for conceptual similarity while exploiting lexical retrieval when exact domain-critical terms are decisive.
Author Contributions
Conceptualization, D.C., G.N., H.C. and C.B.; methodology, D.C., G.N. and A.C.; software, D.C. and A.C.; validation, D.C., G.N., A.C., V.D., A.B. and G.P.; formal analysis, D.C., G.N. and A.C.; investigation, D.C.; resources, V.D., A.B., G.P., H.C. and C.B.; data curation, D.C. and A.C.; writing—original draft preparation, D.C.; writing—review and editing, G.N., A.C., H.C., C.B., V.D., A.B. and G.P.; visualization, D.C. and A.C.; supervision, G.N., H.C. and C.B.; project administration, G.N., V.D. and A.B.; funding acquisition, C.B., V.D., A.B. and G.P. All authors have read and agreed to the published version of the manuscript.
Funding
This research was funded through the academic–industry grant between Infineon Technologies and the National University of Science and Technology POLITEHNICA Bucharest, grant number 4520353088.
Institutional Review Board Statement
Not applicable.
Informed Consent Statement
Not applicable.
Data Availability Statement
The real-world validation components, datasheet citations, family definitions, and evaluation protocol are reported in the manuscript and refer to publicly available manufacturer datasheets. Redistribution of third-party PDF datasheets remains subject to the manufacturers’ terms. The implementation code, synthetic data generator source, and evaluation harness used in this study are private research materials and are not publicly released at this stage.
Acknowledgments
During the preparation of this study, the authors used ChatGTP 5.4 to generate synthetic data for validation experiments and to generate datasheet summaries for model comparison. The authors reviewed and edited the generated output and take full responsibility for the content of this publication.
Conflicts of Interest
The authors declare no conflicts of interest.
Abbreviations
The following abbreviations are used in this manuscript:
| ADC | Analog-to-Digital Converter |
| AI | Artificial Intelligence |
| BM25 | Best Matching 25 |
| CAN-FD | Controller Area Network with Flexible Data-Rate |
| DAC | Digital-to-Analog Converter |
| DB | Database |
| DMA | Direct Memory Access |
| DMIPS | Dhrystone Million Instructions Per Second |
| FRR | Family Retrieval Rate |
| GUI | Graphical User Interface |
| JSON | JavaScript Object Notation |
| LLM | Large Language Model |
| MCU | Microcontroller Unit |
| PDF | Portable Document Format |
| PWM | Pulse-Width Modulation |
| QA | Question Answering |
| RAG | Retrieval-Augmented Generation |
| RRF | Reciprocal Rank Fusion |
| SRR | Similarity Retrieval Rate |
Appendix A. Graphical User Interface
To facilitate user interaction with the datasheet assistant, a graphical user interface (GUI) was developed, depicted in
Figure A1. This interface provides an accessible way for engineers to utilize the system’s capabilities.
The GUI layout is structured to guide the user through the analysis process:
Inputs: Users select the primary datasheet for analysis in the left column, enter natural language queries (for QA or comparison initiation) in the lower part bracket, and select operational modes such as “Direct Comparison Mode” or “Use Local Model”. Buttons initiate the “Analyze Datasheet” or “Ask Question” workflows.
Retrieved Components (Middle Column): Upon analysis, this area displays the list of the top ‘k’ similar component datasheets retrieved from the vector database based on the query (the LLM-generated summary of the input datasheet). The number of components displayed depends on the configured ‘k’ value.
Output Display (Right Column): This area presents the generated results. It displays the detailed comparison between the input datasheet and the retrieved/specified similar components. If a question is also asked, it will also show the generated answer to the user’s query, grounded in the retrieved context.
This structured layout allows users to easily provide inputs, see the intermediate retrieval results (similar components), and view the final generated analysis or answer.
Figure A1.
Datasheet assistant graphical user interface (GUI).
Figure A1.
Datasheet assistant graphical user interface (GUI).
Appendix B. Prompts Used for Summary-Generation Strategies
This section presents the prompts developed for each of the six summary-generation strategies. Each prompt was designed to elicit specific types of information from the language model, optimized for different retrieval and comparison use cases.
Appendix B.1. Structured Summary Prompt
The structured summary prompt generates hierarchical JSON summaries with consistent key-value organization, enabling direct specification comparison across multiple datasheets.
| Prompt |
| You are an expert electronics engineer analyzing a microcontroller datasheet. Generate a structured JSON summary of the MCU with the following exact schema: |
| { “Device”: “<Full device name>”, “Architecture”: “<bit-width and architecture type>”, “Core_Frequency”: “<maximum frequency with units>”, “Flash_Memory”: “<size with units>”, “SRAM”: “<size with units>”, “Operating_Voltage”: “<voltage range>”, “Temperature_Range”: “<temperature range>”, “Power_Active”: “<active power consumption>”, “Power_Sleep”: “<sleep/low-power consumption>”, “ADC”: “<ADC specifications>”, “DAC”: “<DAC specifications if present>”, “Timers”: “<timer count and types>”, “PWM_Modules”: “<PWM specifications>”, “Communication”: [“<list of interfaces>”], “Special_Features”: [“<list of features>”], “Package_Options”: [“<available packages>”] } |
| Rules: Output valid JSON only, no additional text. Include exact values with units as stated in the datasheet. Use arrays for multiple items. Add additional relevant fields if the MCU has unique capabilities. Omit fields that don’t apply. Copy specifications exactly as written in the datasheet. |
| Datasheet content: {datasheet_text} |
Appendix B.2. Detailed Summary Prompt
The detailed summary prompt generates comprehensive paragraph-form technical descriptions, capturing nuanced details and relationships between features.
| Prompt |
| You are a senior electronics engineer writing a comprehensive technical summary of a microcontroller for engineering colleagues. Write a detailed summary (400–600 words) covering all major aspects of the MCU. |
| Structure your summary as follows: |
| Paragraph 1: Core architecture, performance metrics (frequency, DMIPS), memory configuration (Flash, SRAM, special memory types), and voltage/temperature operating ranges. |
| Paragraph 2: Analog capabilities in detail—ADC specifications (resolution, channels, sampling rate, special features), DAC, comparators, and any unique analog processing capabilities. |
| Paragraph 3: Digital peripherals—timers (count, resolution, special modes), PWM capabilities (resolution, dead-band, complementary outputs), DMA channels, and any specialized modules. |
| Paragraph 4: Communication interfaces—list all interfaces with their specifications (speed, channel count), noting any advanced features (USB OTG, CAN-FD, Ethernet with PTP, etc.). |
| Paragraph 5: Special/distinguishing features—security features, unique peripherals, safety mechanisms, and what makes this MCU stand out from others. |
| Final sentence: Summarize ideal application domains. |
| Rules: Write in technical prose, not bullet points. Include specific numbers and units. Mention unique or distinguishing capabilities. Maintain factual accuracy. Use technical terminology appropriate for engineers. |
| Datasheet content: {datasheet_text} |
Appendix B.3. Concise Summary Prompt
The concise summary prompt generates brief overviews focusing on essential differentiating characteristics, optimized for quick reference and rapid screening.
| Prompt |
| You are an electronics engineer creating a quick-reference summary of a microcontroller. Write a concise summary (80–120 words) in the following format: |
| <Device Name> - <Architecture> @ <Frequency>. Memory: <Flash>, <SRAM>, [special memory if notable]. [Key power spec if exceptional]. Key peripherals: <most important peripherals as comma-separated list>. Communication: <interfaces as compact list>. [Notable special feature if exceptional]. Applications: <3–4 target applications>. |
| Rules: Use abbreviations where standard (KB, MHz, MSPS, etc.). Use multiplication symbol for counts (e.g., 3 × SPI). Prioritize distinguishing features over common ones. Include power consumption only if notably low. Keep applications brief but specific. Single paragraph, dense information. |
| Example: “TI MSP430FR5989—16-bit RISC @ 16 MHz. Memory: 128 KB FRAM, 2 KB SRAM. XLP: 0.02 μA shutdown. Key peripherals: 12-bit ADC, ESI for metering, LCD driver, AES256. Communication: 2 × UART, 2 × SPI, 2 × I2C. Applications: Utility meters, portable medical, battery-powered data loggers.” |
| Datasheet content: {datasheet_text} |
Appendix B.4. Features-Focused Summary Prompt
The features-focused summary prompt emphasizes unique capabilities and differentiators, highlighting what makes each MCU stand out from competitors.
| Prompt |
| You are a product specialist highlighting what makes a microcontroller unique and valuable. Write a features-focused summary (200–300 words) that emphasizes differentiating capabilities. |
| Structure: |
| Paragraph 1: Lead with the MCU’s most distinctive features - what capabilities does it have that are rare or unique? Explain why these matter and what they enable. Use phrases like “tands out with,” “distinguishes itself through,” “uniquely enables.” |
| Paragraph 2: Elaborate on 2–3 key differentiating features in detail. For each feature, explain: What it is (technical description), Why it matters (the problem it solves), What it enables (applications or capabilities). |
| Paragraph 3: Mention supporting features that complement the key differentiators. How do other peripherals work together with the unique features? |
| Rules: Focus on what’s special, not what’s standard. Explain WHY features matter, not just WHAT they are. Compare implicitly to what’s typical. Use active, engaging language. Include specific numbers that demonstrate superiority. Don’t list basic specs unless they’re exceptional. |
| Datasheet content: {datasheet_text} |
Appendix B.5. Spec-Heavy Summary Prompt
The spec-heavy summary prompt produces dense presentations of numerical specifications with minimal prose, optimized for specification matching.
| Prompt |
| You are creating a specification sheet summary for a microcontroller database. Generate a dense, structured specification summary using the following format: |
| <Device Name> Specifications: Architecture: <architecture details> Performance: <frequency, MIPS/DMIPS if available> Memory: <all memory types with sizes> Voltage: <voltage range>; Temperature: <temperature range> Power: <all power consumption figures by mode> ADC: <full ADC specifications> DAC: <DAC specifications if present> Timers: <timer specifications> PWM: <PWM specifications if notable> DMA: <DMA channels if present> Communication: <all interfaces with specifications> Security: <security features if present> Special: <unique features> I/O: <GPIO count and notable features> Packages: <package options> |
| Rules: Use colon-separated key-value format. Include ALL numerical specifications. Use semicolons to separate multiple values on same line. Use parentheses for additional details. Abbreviate consistently (KB, MHz, MSPS, ch for channels). No prose sentences - data only. Include every interface count and specification. List all low-power modes with their consumption figures. |
| Datasheet content: {datasheet_text} |
Appendix B.6. General + Applicability Summary Prompt
The general + applicability summary prompt provides balanced technical descriptions with explicit application domain mapping, enabling use-case-driven retrieval.
| Prompt |
| You are a technical writer creating a summary that helps engineers determine if a microcontroller fits their application. Write a summary (250-350 words) with clear application guidance. |
| Structure: |
| Paragraph 1 (Technical Overview): Describe the MCU’s core capabilities—architecture, performance, memory, operating conditions. Establish its general category and performance tier. |
| Paragraph 2 (Key Capabilities): Detail the most important peripherals and features. Focus on capabilities that define what applications this MCU can address. Include specific numbers (ADC resolution/speed, timer count, communication interfaces). |
| Paragraph 3 (Application Guidance): Start with “Ideal for:” and provide a detailed list of specific applications. For each application, briefly note which features make it suitable. Format as: “<Application> leveraging <key features>”. |
| Include 6–8 specific application examples such as: Industrial automation requiring [specific features], Motor control applications utilizing [specific features], Battery-powered IoT sensors leveraging [specific features], Medical devices needing [specific features]. |
| Rules: Balance technical depth with accessibility. Make explicit connections between features and applications. Use “leveraging,” “utilizing,” “requiring” to connect features to applications. Include operating conditions for harsh environment applications. Mention safety/security features and their relevance. Be specific about applications (not just “industrial” but “industrial servo drives”). |
| Datasheet content: {datasheet_text} |
References
- Fan, W.; Ding, Y.; Ning, L.; Wang, S.; Li, H.; Yin, D.; Chua, T.-S.; Li, Q. A Survey on RAG Meeting LLMs: Towards Retrieval-Augmented Large Language Models. In Proceedings of the 30th ACM SIGKDD Conference on Knowledge Discovery and Data Mining (KDD ’24), Barcelona, Spain, 25–29 August 2024; pp. 6491–6501. [Google Scholar] [CrossRef]
- Lewis, P.; Perez, E.; Piktus, A.; Petroni, F.; Karpukhin, V.; Goyal, N.; Küttler, H.; Lewis, M.; Yih, W.; Rocktäschel, T.; et al. Retrieval-Augmented Generation for Knowledge-Intensive NLP Tasks. In Proceedings of the Advances in Neural Information Processing Systems, Red Hook, NY, USA, 6–12 December 2020; Volume 33, pp. 9459–9474. [Google Scholar]
- Singh, I.S.; Aggarwal, R.; Allahverdiyev, I.; Taha, M.; Akalin, A.; Zhu, K.; O’Brien, S. ChunkRAG: Novel LLM-Chunk Filtering Method for RAG Systems. arXiv 2024, arXiv:2410.19572. [Google Scholar]
- Nadăş, M.; Dioşan, L.; Tomescu, A. Synthetic Data Generation Using Large Language Models: Advances in Text and Code. IEEE Access 2025, 13, 134615–134633. [Google Scholar] [CrossRef]
- Microsoft Azure. Phi Open Models—Small Language Models. Available online: https://azure.microsoft.com/en-us/products/phi (accessed on 14 April 2025).
- Gemma Team; Thomas, M.; Cassidy, H.; Robert, D.; Surya, B.; Laurent, S.; Morgane, R.; Sanjay, K.M.; Juliette, L.; Pouya, T. Gemma: Open Models Based on Gemini Research and Technology. 2024. Available online: https://ai.google.dev/gemma (accessed on 14 April 2025).
- Bai, J.; Bai, S.; Chu, Y.; Cui, Z.; Dang, K.; Deng, X.; Dong, Y.; Fan, T.; Ge, W.; Han, Y.; et al. Qwen Technical Report. arXiv 2023, arXiv:2309.16609. [Google Scholar] [CrossRef]
- Bi, X.; Chen, G.; Chen, Z.; Cheng, X.; Cui, Q.; Dai, W.; Deng, H.; Ding, C.; Dong, H.; Du, Z.; et al. DeepSeek LLM: Scaling Open-Source Language Models with Longtermism. arXiv 2024, arXiv:2401.02954. [Google Scholar]
- Es, S.; James, J.; Espinosa Anke, L.; Schockaert, S. RAGAs: Automated Evaluation of Retrieval Augmented Generation. In Proceedings of the 18th Conference of the European Chapter of the Association for Computational Linguistics: System Demonstrations, St. Julians, Malta, 17–22 March 2024; pp. 150–158. [Google Scholar] [CrossRef]
- Singh, A.; Ehtesham, A.; Kumar, S.; Khoei, T.T. Agentic Retrieval-Augmented Generation: A Survey on Agentic RAG. arXiv 2025, arXiv:2501.09136. [Google Scholar]
- Wang, L.; Chen, H.; Yang, N.; Huang, X.; Dou, Z.; Wei, F. Chain-of-Retrieval Augmented Generation. In Proceedings of the Advances in Neural Information Processing Systems 38 (NeurIPS 2025), San Diego, CA, USA and Mexico City, Mexico, 30 November–7 December 2025; Curran Associates, Inc.: New York, NY, USA, 2026; Volume 38, pp. 59888–59915. Available online: https://proceedings.neurips.cc/paper_files/paper/2025/file/566aad4fac1acf17fd1ae8c3aef75326-Paper-Conference.pdf (accessed on 14 April 2025).
- Petroni, F.; Piktus, A.; Fan, A.; Lewis, P.; Yazdani, M.; De Cao, N.; Thorne, J.; Jernite, Y.; Karpukhin, V.; Maillard, J.; et al. KILT: A Benchmark for Knowledge Intensive Language Tasks. In Proceedings of the 2021 Conference of the North American Chapter of the Association for Computational Linguistics: Human Language Technologies, Online, 6–11 June 2021; pp. 2523–2544. [Google Scholar] [CrossRef]
- Nguyen, T.; Chin, P.; Tai, Y.W. MA-RAG: Multi-Agent Retrieval-Augmented Generation via Collaborative Chain-of-Thought Reasoning. arXiv 2025, arXiv:2505.20096. [Google Scholar]
- Wang, J.; Han, J. PropRAG: Guiding Retrieval with Beam Search over Proposition Paths. In Proceedings of the 2025 Conference on Empirical Methods in Natural Language Processing, Suzhou, China, 4–9 November 2025; pp. 6212–6227. [Google Scholar] [CrossRef]
- Wang, Z.; Yuan, H.; Dong, W.; Cong, G.; Li, F. CARROT: A Learned Cost-Constrained Retrieval Optimization System for RAG. In Proceedings of the 42nd IEEE International Conference on Data Engineering (ICDE 2026), Montréal, QC, Canada, 4–8 May 2026. accepted for publication. [Google Scholar]
- Alawadhi, S.; Abbas, N. Optimizing Retrieval-Augmented Generation for Electrical Engineering: A Case Study on ABB Circuit Breakers. In Proceedings of the 6th International Conference on Advanced Natural Language Processing (AdNLP 2025), Zurich, Switzerland, 17–18 May 2025; Computer Science & Information Technology (CS & IT). Volume 15, Number 09. pp. 59–77. [Google Scholar] [CrossRef]
- Mohsin, M.A.; Bilal, A.; Bhattacharya, S.; Cioffi, J.M. Retrieval Augmented Generation with Multi-Modal LLM Framework for Wireless Environments. In Proceedings of the 2025 IEEE International Conference on Communications Workshops (ICC Workshops), Montreal, QC, Canada, 8–12 June 2025; pp. 184–189. [Google Scholar] [CrossRef]
- Heredia Álvaro, J.A.; González Barreda, J. An Advanced Retrieval-Augmented Generation System for Manufacturing Quality Control. Adv. Eng. Inform. 2025, 64, 103007. [Google Scholar] [CrossRef]
- Mandikal, P.; Mooney, R. Sparse meets dense: A hybrid approach to enhance scientific document retrieval. arXiv 2024, arXiv:2401.04055. [Google Scholar] [CrossRef]
- Nussbaum, Z.; Morris, J.X.; Duderstadt, B.; Mulyar, A. Nomic Embed: Training a Reproducible Long Context Text Embedder. Trans. Mach. Learn. Res. 2025, 2025. Available online: https://www.scopus.com/pages/publications/85219359640 (accessed on 14 April 2025).
- ChromaDB Team. Chroma Documentation. 2024. Available online: https://docs.trychroma.com/ (accessed on 12 January 2026).
- Sivasothy, S.; Barnett, S.; Kurniawan, S.; Rasool, Z.; Vasa, R. RAGProbe: An Automated Approach for Evaluating RAG Applications. arXiv 2024, arXiv:2409.19019. [Google Scholar] [CrossRef]
- Brehme, L.; Ströhle, T.; Breu, R. Can LLMs be Trusted for Evaluating RAG Systems? A Survey of Methods and Datasets. In Proceedings of the 2025 IEEE Swiss Conference on Data Science (SDS), Zurich, Switzerland, 26–27 June 2025; pp. 16–23. [Google Scholar] [CrossRef]
- Zeng, S.; Zhang, J.; He, P.; Ren, J.; Zheng, T.; Lu, H.; Xu, H.; Liu, H.; Xing, Y.; Tang, J. Mitigating the Privacy Issues in Retrieval-Augmented Generation (RAG) via Pure Synthetic Data. In Proceedings of the 2025 Conference on Empirical Methods in Natural Language Processing, Suzhou, China, 4–9 November 2025; pp. 24527–24558. [Google Scholar] [CrossRef]
- Microchip Technology Inc. PIC16F18877 Datasheet. Technical Report. 2023. Available online: https://www.mouser.com/datasheet/3/282/1/40001768A.pdf (accessed on 12 January 2026).
- Texas Instruments. MSP430FR5989 Datasheet. Technical Report. 2023. Available online: https://www.ti.com/lit/ds/symlink/msp430fr5962.pdf (accessed on 12 January 2026).
- Renesas Electronics. RL78/G14 Datasheet. Technical Report. 2023. Available online: https://www.renesas.com/en/document/dst/rl78g14-data-sheet (accessed on 12 January 2026).
- STMicroelectronics. STM32F405 Datasheet. Technical Report. 2023. Available online: https://www.st.com/resource/en/datasheet/stm32f405zg.pdf (accessed on 12 January 2026).
- NXP Semiconductors. LPC4088 Datasheet. Technical Report. 2023. Available online: https://www.nxp.com/docs/en/data-sheet/LPC408X_7X.pdf (accessed on 12 January 2026).
- Microchip Technology Inc. ATSAME54P20A Datasheet. Technical Report. 2023. Available online: https://www.mouser.com/datasheet/3/282/1/SAM-D5x-E5x-Family-Data-Sheet-DS60001507.pdf (accessed on 12 January 2026).
- Microchip Technology Inc. dsPIC33CK256MP508 Datasheet. Technical Report. 2023. Available online: https://www.mouser.com/datasheet/3/282/1/dsPIC33CK256MP508-Family-Data-Sheet-DS70005349.pdf (accessed on 12 January 2026).
- Texas Instruments. TMS320F28379D Datasheet. Technical Report. 2023. Available online: https://www.ti.com/lit/ds/symlink/tms320f28379d.pdf (accessed on 12 January 2026).
- Infineon Technologies. XMC4500 Datasheet. Technical Report. 2023. Available online: https://www.infineon.com/assets/row/public/documents/30/49/infineon-xmc4500-datasheet-en.pdf (accessed on 12 January 2026).
- STMicroelectronics. STM32U575AG Datasheet. Technical Report. 2023. Available online: https://www.st.com/resource/en/datasheet/stm32u575ag.pdf (accessed on 12 January 2026).
- NXP Semiconductors. LPC55S6x Datasheet. Technical Report. 2023. Available online: https://www.nxp.com/docs/en/data-sheet/LPC55S6x.pdf (accessed on 12 January 2026).
- Renesas Electronics. RA4M3 Group Datasheet. Technical Report. 2023. Available online: https://www.renesas.com/en/document/dst/ra4m3-group-datasheet (accessed on 12 January 2026).
- Texas Instruments. CC2674P10 Datasheet. Technical Report. 2023. Available online: https://www.ti.com/lit/ds/symlink/cc2674p10.pdf (accessed on 12 January 2026).
- Nordic Semiconductor. nRF5340 Product Brief. Technical Report. 2023. Available online: https://www.nordicsemi.com/-/media/Software-and-other-downloads/Product-Briefs/nRF5340-SoC-PB.pdf (accessed on 12 January 2026).
- Silicon Labs. EFR32MG24 Datasheet. Technical Report. 2023. Available online: https://www.silabs.com/documents/public/data-sheets/efr32mg24-datasheet.pdf (accessed on 12 January 2026).
- NXP Semiconductors. i.MX RT1170 Datasheet. Technical Report. 2023. Available online: https://www.nxp.com/docs/en/data-sheet/IMXRT1170CEC.pdf (accessed on 12 January 2026).
- STMicroelectronics. STM32H753VI Datasheet. Technical Report. 2023. Available online: https://www.st.com/resource/en/datasheet/stm32h753vi.pdf (accessed on 12 January 2026).
- Microchip Technology Inc. SAM E70 Family Datasheet. Technical Report. 2023. Available online: https://www.mouser.com/datasheet/3/282/1/SAM-E70-S70-V70-V71-Family-Data-Sheet-DS60001527.pdf (accessed on 12 January 2026).
- Karpukhin, V.; Oguz, B.; Min, S.; Lewis, P.S.; Wu, L.; Edunov, S.; Chen, D.; Yih, W.T. Dense Passage Retrieval for Open-Domain Question Answering. In Proceedings of the 2020 Conference on Empirical Methods in Natural Language Processing (EMNLP); Association for Computational Linguistics: Stroudsburg, PA, USA, 2020; pp. 6769–6781. [Google Scholar]
- Robertson, S.; Zaragoza, H. The Probabilistic Relevance Framework: BM25 and Beyond; Foundations Trends® Information Retrieval; Now Publishers Inc.: Hanover, MA, USA, 2009; Volume 3, pp. 333–389. [Google Scholar]
- Cormack, G.V.; Clarke, C.L.; Buettcher, S. Reciprocal rank fusion outperforms condorcet and individual rank learning methods. In Proceedings of the 32nd International ACM SIGIR Conference on Research and Development in Information Retrieval, Boston, MA, USA, 19–23 July 2009; pp. 758–759. [Google Scholar]
- Ma, X.; Gong, Y.; He, P.; Zhao, H.; Duan, N. Query rewriting in retrieval-augmented large language models. In Proceedings of the 2023 Conference on Empirical Methods in Natural Language Processing, Singapore, 6–10 December 2023; pp. 5303–5315. [Google Scholar]
- Jiang, Z.; Tang, R.; Xin, J.; Lin, J. How Does BERT Rerank Passages? An Attribution Analysis with Information Bottlenecks. In Proceedings of the Fourth BlackboxNLP Workshop on Analyzing and Interpreting Neural Networks for NLP, Punta Cana, Dominican Republic, 7–11 November 2021; pp. 496–509. [Google Scholar] [CrossRef]
- Reimers, N.; Gurevych, I. Sentence-BERT: Sentence Embeddings using Siamese BERT-Networks. In Proceedings of the 2019 Conference on Empirical Methods in Natural Language Processing and the 9th International Joint Conference on Natural Language Processing (EMNLP-IJCNLP), Hong Kong, China, 3–7 November 2019; pp. 3982–3992. [Google Scholar] [CrossRef]
- Nguyen, T.; Rosenberg, M.; Song, X.; Gao, J.; Tiwary, S.; Majumder, R.; Deng, L. MS MARCO: A Human Generated MAchine Reading COmprehension Dataset. In Proceedings of the Workshop on Cognitive Computation: Integrating Neural and Symbolic Approaches 2016, co-located with the 30th Annual Conference on Neural Information Processing Systems (NIPS 2016), Barcelona, Spain, 9 December 2016; CEUR Workshop Proceedings. Volume 1773. [Google Scholar]
Figure 1.
Offline construction of the Reference Vector Database(one-time process). Existing PDF datasheets are processed through text extraction and image referencing. The extracted text is semantically chunked, and visual elements are replaced with placeholders while maintaining metadata links to original images. Each text chunk is converted into a vector embedding and stored in a static vector database. This text-only indexing strategy ensures scalability while enabling efficient semantic retrieval.
Figure 1.
Offline construction of the Reference Vector Database(one-time process). Existing PDF datasheets are processed through text extraction and image referencing. The extracted text is semantically chunked, and visual elements are replaced with placeholders while maintaining metadata links to original images. Each text chunk is converted into a vector embedding and stored in a static vector database. This text-only indexing strategy ensures scalability while enabling efficient semantic retrieval.
Figure 2.
On-demand multimodal RAG inference pipeline (runtime process). A new input datasheet is processed without chunking to preserve global context. Text and visual elements are jointly analyzed by a summarizing multimodal LLM to generate a comprehensive semantic summary, which is embedded as a query vector. This vector is used to retrieve relevant components from the static Reference Vector Database. A second LLM performs comparative reasoning between the input component and retrieved references, optionally incorporating multimodal analysis.
Figure 2.
On-demand multimodal RAG inference pipeline (runtime process). A new input datasheet is processed without chunking to preserve global context. Text and visual elements are jointly analyzed by a summarizing multimodal LLM to generate a comprehensive semantic summary, which is embedded as a query vector. This vector is used to retrieve relevant components from the static Reference Vector Database. A second LLM performs comparative reasoning between the input component and retrieved references, optionally incorporating multimodal analysis.
Figure 3.
RAG inference pipeline. The process consists of three stages: (1) Input Processing, where the query vector is formed either from a natural language question (Direct QA) or from the summary vector of the input datasheet (Comparative Analysis); (2) Retrieval and Ranking, where an iterative vector search over the static Reference Vector Database ensures selection of k unique components before similarity-based ranking; and (3) Context Enrichment and Generation, where the selected components are expanded into contextual prompts and passed to LLM Model B for grounded answer generation or structured comparative analysis.
Figure 3.
RAG inference pipeline. The process consists of three stages: (1) Input Processing, where the query vector is formed either from a natural language question (Direct QA) or from the summary vector of the input datasheet (Comparative Analysis); (2) Retrieval and Ranking, where an iterative vector search over the static Reference Vector Database ensures selection of k unique components before similarity-based ranking; and (3) Context Enrichment and Generation, where the selected components are expanded into contextual prompts and passed to LLM Model B for grounded answer generation or structured comparative analysis.
Figure 4.
Synthetic data generation pipeline. Phase 1 (left): An LLM instance, guided by domain-specific system prompts, generates k synthetic datasheets for each of six component families, producing a corpus of PDF documents. Phase 2 (right): The generated datasheets are processed to extract key specifications, and embedding-derived pairwise similarity scores are computed to produce a structured reference file for evaluation.
Figure 4.
Synthetic data generation pipeline. Phase 1 (left): An LLM instance, guided by domain-specific system prompts, generates k synthetic datasheets for each of six component families, producing a corpus of PDF documents. Phase 2 (right): The generated datasheets are processed to extract key specifications, and embedding-derived pairwise similarity scores are computed to produce a structured reference file for evaluation.
Figure 5.
Critique agent workflow (Module II). Each synthetic datasheet is independently assessed by an LLM agent that scores it across four quality dimensions: completeness, coherence, technical detail, and accuracy. The per-datasheet scores are then aggregated to produce an overall average quality score for the generated corpus.
Figure 5.
Critique agent workflow (Module II). Each synthetic datasheet is independently assessed by an LLM agent that scores it across four quality dimensions: completeness, coherence, technical detail, and accuracy. The per-datasheet scores are then aggregated to produce an overall average quality score for the generated corpus.
Figure 6.
Test benchmark block diagram. The system iterates through each datasheet in the synthetic corpus, using its generated summary as a query against a vector database built from the remaining datasheets (leave-one-out protocol). The LLM agent retrieves similar components, extracts key specifications, and identifies differences. Results are compared against the ground truth JSON to compute three evaluation metrics: match rate (proportion of correct similar components retrieved), precision/recall/F1 for specification extraction, and differences coverage (proportion of known distinctions identified). All metrics are averaged across the full dataset.
Figure 6.
Test benchmark block diagram. The system iterates through each datasheet in the synthetic corpus, using its generated summary as a query against a vector database built from the remaining datasheets (leave-one-out protocol). The LLM agent retrieves similar components, extracts key specifications, and identifies differences. Results are compared against the ground truth JSON to compute three evaluation metrics: match rate (proportion of correct similar components retrieved), precision/recall/F1 for specification extraction, and differences coverage (proportion of known distinctions identified). All metrics are averaged across the full dataset.
Figure 7.
Proportional similarity matrix for Database 1 using Structured Summary + Cross-Encoder Reranking.
Figure 7.
Proportional similarity matrix for Database 1 using Structured Summary + Cross-Encoder Reranking.
Figure 8.
Proportional similarity matrix for Database 2 using Structured Summary + Cross-Encoder Reranking.
Figure 8.
Proportional similarity matrix for Database 2 using Structured Summary + Cross-Encoder Reranking.
Table 1.
Chunk-size sensitivity on real MCU datasets.
Table 1.
Chunk-size sensitivity on real MCU datasets.
| DB | Configuration | Chunk/Overlap | FRR with |
|---|
| DB1 | Structured + Rerank | 1000/200 | 77.8% |
| DB1 | Structured + Rerank | 2000/400 | 77.8% |
| DB1 | Detailed + Baseline | 1000/200 | 55.6% |
| DB1 | Detailed + Baseline | 2000/400 | 55.6% |
| DB2 | Structured + Rerank | 1000/200 | 66.7% |
| DB2 | Structured + Rerank | 2000/400 | 55.6% |
| DB2 | Detailed + Baseline | 1000/200 | 77.8% |
| DB2 | Detailed + Baseline | 2000/400 | 66.7% |
Table 2.
Retrieval performance by data source model (Model A) at .
Table 2.
Retrieval performance by data source model (Model A) at .
| Model A | FRR | SRR | Rank Corr. |
|---|
| DeepSeek R1 14b | 0.989 | 0.989 | 0.77 |
| Gemma 3 12b | 0.883 | 0.844 | 0.73 |
| Phi-4 | 1.000 | 0.940 | 0.68 |
| Qwen2.5 14b | 0.989 | 0.967 | 0.86 |
Table 3.
Comparative Analysis Coverage and latency for all LLM configurations.
Table 3.
Comparative Analysis Coverage and latency for all LLM configurations.
| Model A (Data Src) | Model B (Eval/Gen) | Coverage (Retrieval/Direct) | Latency [s] (Search/Gen./Total) |
|---|
| Phi-4 | Phi-4 | 0.895/0.980 | 0.44/68.97/69.40 |
| Phi-4 | Gemma 3 12b | 0.885/0.869 | 0.44/67.71/68.15 |
| Phi-4 | Qwen2.5 14b | 0.581/0.771 | 0.44/67.89/68.33 |
| Phi-4 | DeepSeek R1 14b | 0.596/0.634 | 0.46/67.78/68.24 |
| Gemma 3 12b | Phi-4 | 0.638/0.818 | 0.46/65.95/66.41 |
| Gemma 3 12b | Gemma 3 12b | 0.694/0.686 | 0.57/93.93/94.50 |
| Gemma 3 12b | Qwen2.5 14b | 0.606/0.812 | 0.42/79.25/79.67 |
| Gemma 3 12b | DeepSeek R1 14b | 0.610/0.806 | 0.55/93.06/93.61 |
| Qwen2.5 14b | Phi-4 | 0.971/1.000 | 0.41/68.83/69.25 |
| Qwen2.5 14b | Gemma 3 12b | 1.000/0.971 | 0.38/67.15/67.53 |
| Qwen2.5 14b | Qwen2.5 14b | 0.971/0.971 | 0.38/72.59/72.97 |
| Qwen2.5 14b | DeepSeek R1 14b | 0.967/1.000 | 0.37/72.34/72.70 |
| DeepSeek R1 14b | Phi-4 | 0.848/0.971 | 0.41/70.13/70.54 |
| DeepSeek R1 14b | Gemma 3 12b | 0.830/0.943 | 0.40/75.93/76.32 |
| DeepSeek R1 14b | Qwen2.5 14b | 0.863/0.909 | 0.49/79.17/79.66 |
| DeepSeek R1 14b | DeepSeek R1 14b | 0.894/0.956 | 0.43/75.67/76.10 |
Table 4.
Effect of the query summary-generation model on real-datasheet retrieval performance. For every row, the retrieval pipeline uses the same Structured Summary query format, nomic-embed-text-v1.5 embeddings, 1000/200 chunking, and cross-encoder reranking; only the model used to generate the query datasheet summary changes. Results are combined across DB1 and DB2.
Table 4.
Effect of the query summary-generation model on real-datasheet retrieval performance. For every row, the retrieval pipeline uses the same Structured Summary query format, nomic-embed-text-v1.5 embeddings, 1000/200 chunking, and cross-encoder reranking; only the model used to generate the query datasheet summary changes. Results are combined across DB1 and DB2.
| Summary Source | Correct Retrievals | FRR with | FRR with |
|---|
| Claude Sonnet 4.5 | 13/18 | 72.2% | 41.7% |
| phi4 local | 9/18 | 50.0% | 47.2% |
| deepseek-r1:14b local | 10/18 | 55.6% | 41.7% |
| gemma4:e4b local | 10/18 | 55.6% | 41.7% |
| gemma3:12b local | 8/18 | 44.4% | 47.2% |
| qwen2.5:14b local | 9/18 | 50.0% | 41.7% |
Table 5.
Comparison of summary format and retrieval strategy on real MCU datasheets. All rows use Claude Sonnet 4.5 for query summary generation, nomic-embed-text-v1.5 embeddings, and 1000/200 chunking. The table reports FRR with separately for DB1 and DB2 and as their average.
Table 5.
Comparison of summary format and retrieval strategy on real MCU datasheets. All rows use Claude Sonnet 4.5 for query summary generation, nomic-embed-text-v1.5 embeddings, and 1000/200 chunking. The table reports FRR with separately for DB1 and DB2 and as their average.
| Summary Format | Retrieval Strategy | DB1 FRR | DB2 FRR | Average |
|---|
| Structured | Rerank | 77.8% | 66.7% | 72.2% |
| Structured | Hybrid | 33.3% | 66.7% | 50.0% |
| Structured | Baseline | 22.2% | 44.4% | 33.3% |
| Detailed | Baseline | 55.6% | 77.8% | 66.7% |
| Detailed | Rerank | 44.4% | 44.4% | 44.4% |
| Detailed | Hybrid | 22.2% | 55.6% | 38.9% |
Table 6.
Comparison of the proposed summary-driven retrieval pipeline against lexical and no-summary baselines on the combined real MCU datasets. Results aggregate DB1 and DB2 for 18 leave-one-out queries. Summary-based rows use Claude Sonnet 4.5 query summaries, nomic-embed-text-v1.5 embeddings, and 1000/200 chunking; the BM25 raw-datasheet row is the true no-summary lexical baseline.
Table 6.
Comparison of the proposed summary-driven retrieval pipeline against lexical and no-summary baselines on the combined real MCU datasets. Results aggregate DB1 and DB2 for 18 leave-one-out queries. Summary-based rows use Claude Sonnet 4.5 query summaries, nomic-embed-text-v1.5 embeddings, and 1000/200 chunking; the BM25 raw-datasheet row is the true no-summary lexical baseline.
| Condition | FRR with | FRR with |
|---|
| Structured + Rerank | 72.2% | 41.7% |
| BM25 raw chunks, structured-summary query | 66.7% | 55.6% |
| Detailed + Baseline | 66.7% | 44.4% |
| Structured + Hybrid | 55.6% | 50.0% |
| BM25 raw chunks, raw-datasheet query | 33.3% | 36.1% |
Table 7.
Per-family retrieval performance (best configuration per database, FRR with ).
Table 7.
Per-family retrieval performance (best configuration per database, FRR with ).
| Family | Database | Best Config | FRR with |
|---|
| SimpleLowPowerIoT | DB1 | Struct + Rerank | 100% (3/3) |
| GeneralPurpose32bit | DB1 | Struct + Rerank | 100% (3/3) |
| HighPerfSpecialized | DB1 | Struct + Rerank | 33.3% (1/3) |
| SecureUltraLowPower | DB2 | Detailed + Base | 100% (3/3) |
| ConnectivitySoC | DB2 | Detailed + Base | 33.3% (1/3) |
| HighPerformanceControl | DB2 | Detailed + Base | 100% (3/3) |
Table 8.
Per-family Wilson 95% confidence intervals for Structured + Rerank.
Table 8.
Per-family Wilson 95% confidence intervals for Structured + Rerank.
| Family | DB | Correct Retrievals | FRR with | Wilson 95% CI |
|---|
| SimpleLowPowerIoT | DB1 | 3/3 | 100.0% | 43.9–100.0% |
| GeneralPurpose32bit | DB1 | 3/3 | 100.0% | 43.9–100.0% |
| HighPerfSpecialized | DB1 | 1/3 | 33.3% | 6.1–79.2% |
| SecureUltraLowPower | DB2 | 3/3 | 100.0% | 43.9–100.0% |
| ConnectivitySoC | DB2 | 0/3 | 0.0% | 0.0–56.1% |
| HighPerformanceControl | DB2 | 3/3 | 100.0% | 43.9–100.0% |
Table 9.
Configuration robustness analysis for FRR with .
Table 9.
Configuration robustness analysis for FRR with .
| Configuration | DB1 FRR | DB2 FRR | Average |
|---|
| Structured + Rerank | 77.8% | 66.7% | 72.2% |
| Detailed + Baseline | 55.6% | 77.8% | 66.7% |
Table 10.
Final pilot-scale performance summary with 95% confidence intervals (Structured + Rerank).
Table 10.
Final pilot-scale performance summary with 95% confidence intervals (Structured + Rerank).
| Dataset | Correct Retrievals | FRR with | Wilson 95% CI | Clopper–Pearson 95% CI |
|---|
| Database 1 | 7/9 | 77.8% | 45.3–93.7% | 40.0–97.2% |
| Database 2 | 6/9 | 66.7% | 35.4–87.9% | 29.9–92.5% |
| Combined | 13/18 | 72.2% | 49.1–87.5% | 46.5–90.3% |
Table 11.
Per-family retrieval performance using Structured + Rerank. FRR with measures whether the first-ranked candidate belongs to the same family; FRR with measures the fraction of the two available same-family candidates recovered in the first two ranks.
Table 11.
Per-family retrieval performance using Structured + Rerank. FRR with measures whether the first-ranked candidate belongs to the same family; FRR with measures the fraction of the two available same-family candidates recovered in the first two ranks.
| Family | Database | FRR with |
FRR with |
|---|
| SimpleLowPowerIoT | DB1 | 100% (3/3) |
50.0% (3/6)
|
| GeneralPurpose32bit | DB1 | 100% (3/3) |
50.0% (3/6)
|
| HighPerfSpecialized | DB1 | 33.3% (1/3) |
16.7% (1/6)
|
| SecureUltraLowPower | DB2 | 100% (3/3) |
66.7% (4/6)
|
| ConnectivitySoC | DB2 | 0% (0/3) |
0.0% (0/6)
|
| HighPerformanceControl | DB2 | 100% (3/3) |
66.7% (4/6)
|
Table 12.
Per-family retrieval performance using BM25 raw-chunk retrieval with the structured-summary query. FRR with measures whether the first-ranked candidate belongs to the same family; FRR with measures the fraction of the two available same-family candidates recovered in the first two ranks.
Table 12.
Per-family retrieval performance using BM25 raw-chunk retrieval with the structured-summary query. FRR with measures whether the first-ranked candidate belongs to the same family; FRR with measures the fraction of the two available same-family candidates recovered in the first two ranks.
| Family | Database | FRR with | FRR with |
|---|
| SimpleLowPowerIoT | DB1 | 0.0% (0/3) | 16.7% (1/6) |
| GeneralPurpose32bit | DB1 | 100.0% (3/3) | 66.7% (4/6) |
| HighPerfSpecialized | DB1 | 33.3% (1/3) | 50.0% (3/6) |
| SecureUltraLowPower | DB2 | 100.0% (3/3) | 66.7% (4/6) |
| ConnectivitySoC | DB2 | 100.0% (3/3) | 83.3% (5/6) |
| HighPerformanceControl | DB2 | 66.7% (2/3) | 50.0% (3/6) |
| Mean across six families | DB1 + DB2 | 66.7% | 55.6% |
| Disclaimer/Publisher’s Note: The statements, opinions and data contained in all publications are solely those of the individual author(s) and contributor(s) and not of MDPI and/or the editor(s). MDPI and/or the editor(s) disclaim responsibility for any injury to people or property resulting from any ideas, methods, instructions or products referred to in the content. |




 ,
,