Article

Design of a Rapid License Plate Localization Algorithm Utilizing Color Statistical Features

1
Chengdu College, University of Electronic Science and Technology of China, Chengdu 611731, China
2
Department of Physical Science and Technology, Southwest Jiaotong University, Chengdu 611756, China
*
Authors to whom correspondence should be addressed.
Electronics 2026, 15(11), 2232; https://doi.org/10.3390/electronics15112232
Submission received: 7 February 2026 / Revised: 30 April 2026 / Accepted: 18 May 2026 / Published: 22 May 2026

Abstract

Aiming at the problems of weak background adaptive ability, high dependence on edge features, high computational complexity of some traditional license plate location algorithms, high deployment cost and strong training dependence of location model based on deep learning, this paper proposes a fast license plate location algorithm based on statistical color features. The algorithm uses the HSV color space as the main processing channel, and quantifies the regional color distribution characteristics by constructing the hue histogram and calculating its standard deviation and other statistics, which significantly improves the discrimination and illumination adaptability of the license plate mask in complex background. Compared with the lightweight deep learning models such as “You Only Look Once Version 12 Nano”, this algorithm does not need GPU acceleration and model loading, eliminates the need for data training, significantly reduces the deployment cost and complexity, and can run efficiently on the general computing platform. The experimental results show that compared with the YOLOv12n model, the average processing time of this algorithm is shortened by 30.81% (when YOLOv12n is evaluated with GPU) or 48.42% (when YOLOv12n is evaluated with CPU) at the cost of sacrificing about 5.8% positioning accuracy. The positioning accuracy still reaches 93.7%, demonstrating high processing efficiency and excellent platform adaptability. The algorithm has the advantages of being lightweight, efficient and interpretable, and is especially suitable for intelligent parking lots, edge devices and other scenes sensitive to real time, cost and energy consumption.

1. Introduction

1.1. Research Background and Significance

With the continuous expansion of urban transportation systems and the rapid development of Intelligent Transportation Systems (ITSs), automatic vehicle recognition and management have become crucial for improving road efficiency and traffic safety. License Plate Recognition (LPR), as the core technology for vehicle identification, has been widely applied in scenarios such as electronic policing, intelligent tolling, parking management, and vehicle tracking.
Traditional license plate detection methods mainly rely on machine vision technologies, such as the Open Computer Vision Library (OpenCV) [1]. These approaches achieve satisfactory performance under standard conditions, but their recognition accuracy and real-time capability are significantly reduced in complex environments, including low illumination, skewed shooting angles, and occlusions caused by stains or dirt. In recent years, end-to-end LPR methods based on deep learning frameworks such as YOLO and Faster R-CNN have achieved remarkable progress. However, these models are highly dependent on computing resources and large-scale datasets, while their large parameter sizes and inference latency limit deployment on resource-constrained embedded platforms and edge devices.
Therefore, developing a robust, efficient, lightweight, and easily deployable license plate localization algorithm holds significant research value and engineering importance.

1.2. Research Status at Home and Abroad

Currently, research on license plate recognition both in China and abroad is mainly focused on two technical approaches: (1) end-to-end recognition systems based on deep neural networks, and (2) fast detection methods that integrate traditional image processing with statistical feature analysis.
With the advancement of deep learning technologies [2], models such as YOLOv12, EfficientDet, and CRNN have been widely applied to end-to-end tasks of license plate detection and character recognition. Among them, the YOLOv12n model proposed by Yunjie Tian et al. maintains a lightweight architecture while achieving favorable detection accuracy, making it highly practical for industrial deployment. Compared with traditional high-resolution object detection models, YOLOv12n possesses a deeper network structure and a larger receptive field through the attention center architecture and Area Attention module, thereby better accommodating high-resolution object detection requirements. In related international studies, Deb et al. proposed a license plate localization method based on the HSI color model and histogram thresholding, which demonstrated strong robustness [3]. Mufti et al. further noted in their survey that the combination of HSV/HSI color spaces with statistical features and fuzzy logic can consistently achieve detection accuracies exceeding 92% across multiple datasets [4].
To further analyze the deployment characteristics of different models, this study compares YOLOv12n with several of its variants. The results show that models such as YOLOv12s and YOLOv12m offer higher detection accuracy but at the cost of substantially increased parameter sizes and computational overhead, imposing stringent requirements on computing resources and GPU memory. These factors make them unsuitable for deployment on resource-constrained edge devices. Therefore, considering model size, computational complexity, and detection performance, this work adopts the officially released YOLOv12n version as the baseline model to reflect the adaptability and limitations of current mainstream lightweight deep learning methods in practical embedded deployments. The performance metrics of YOLOv12n are illustrated in Figure 1.
Compared with deep learning approaches, traditional image processing methods such as segmentation based on the HSV color space, morphological operations, and edge detection exhibit advantages of strong interpretability, ease of deployment, and no requirement for training. For instance, some studies have utilized the HSV color domain to quickly filter license plate color regions. However, these methods are highly dependent on image quality and illumination conditions, thus exhibiting limited adaptability.

1.3. Research Content and Innovations

1.3.1. Mask Extraction Mechanism Integrating HSV Color Features and Statistical Modeling

The HSV color space has the advantage of being more consistent with the human visual perception system, which makes color adjustment more convenient [5]. During the image-preprocessing and color segmentation stage, this study employs the HSV color space as the foundation, extracting the hue channel information and constructing its histogram distribution. Statistical features such as the dominant peak position, standard deviation, and peak proportion of the hue distribution are quantitatively analyzed. By jointly evaluating the peak shift and the dispersion of regional hues, a discrimination mechanism is established to assess the color consistency of license plate regions, thereby enhancing robustness and discriminative power in color representation. This method can adaptively handle fluctuations in the color distribution of blue license plates under varying illumination levels, imaging deviations, and complex backgrounds, thereby improving the accuracy and stability of mask extraction.

1.3.2. Multi-Dimensional Candidate Scoring Mechanism Based on Color Statistical Features

This work designs a scoring function that integrates multiple indicators, including area ratio, edge density, aspect ratio, and hue consistency. Among them, the hue scoring term is weighted based on the exponential penalty relationship between the hue standard deviation and an ideal template, effectively suppressing pseudo-blue regions and background interference, and thereby enhancing the reliability and discriminative power of the final candidate regions.

1.3.3. Superior Efficiency over YOLOv12n with High Deployment Performance

In the positioning test on 1000 randomly selected standard license plate images, the YOLOv12n model achieved a recognition accuracy of 99.5%, with a total processing time of 13.76 s (YOLOv12n evaluated with GPU) or 18.46 s (YOLOv12n evaluated with CPU). In contrast, the system proposed in this paper only takes 9.52 s to complete the positioning of all images while maintaining an accuracy of 93.7%, with the overall processing speed increased by approximately 30.81% (compared with YOLOv12n under GPU evaluation) or 48.42% (compared with YOLOv12n under CPU evaluation). Although there is a slight compromise in accuracy, the proposed system features lower power consumption, less hardware resource occupation and higher operational efficiency without GPU support. It is especially suitable for parking lot management and edge device deployment scenarios with strict requirements on real-time performance and computing resources.

2. Overall System Architecture Design

To achieve high real-time performance and high-accuracy license plate localization, this study proposes a modular algorithmic architecture based on adaptive image processing. The algorithm mainly consists of four core localization modules: image acquisition, image enhancement, mask extraction, and candidate region filtering. The localized license plate regions can then be recognized by general character recognition algorithms, such as convolutional neural network (CNN)-based models.

Overview of the System Workflow

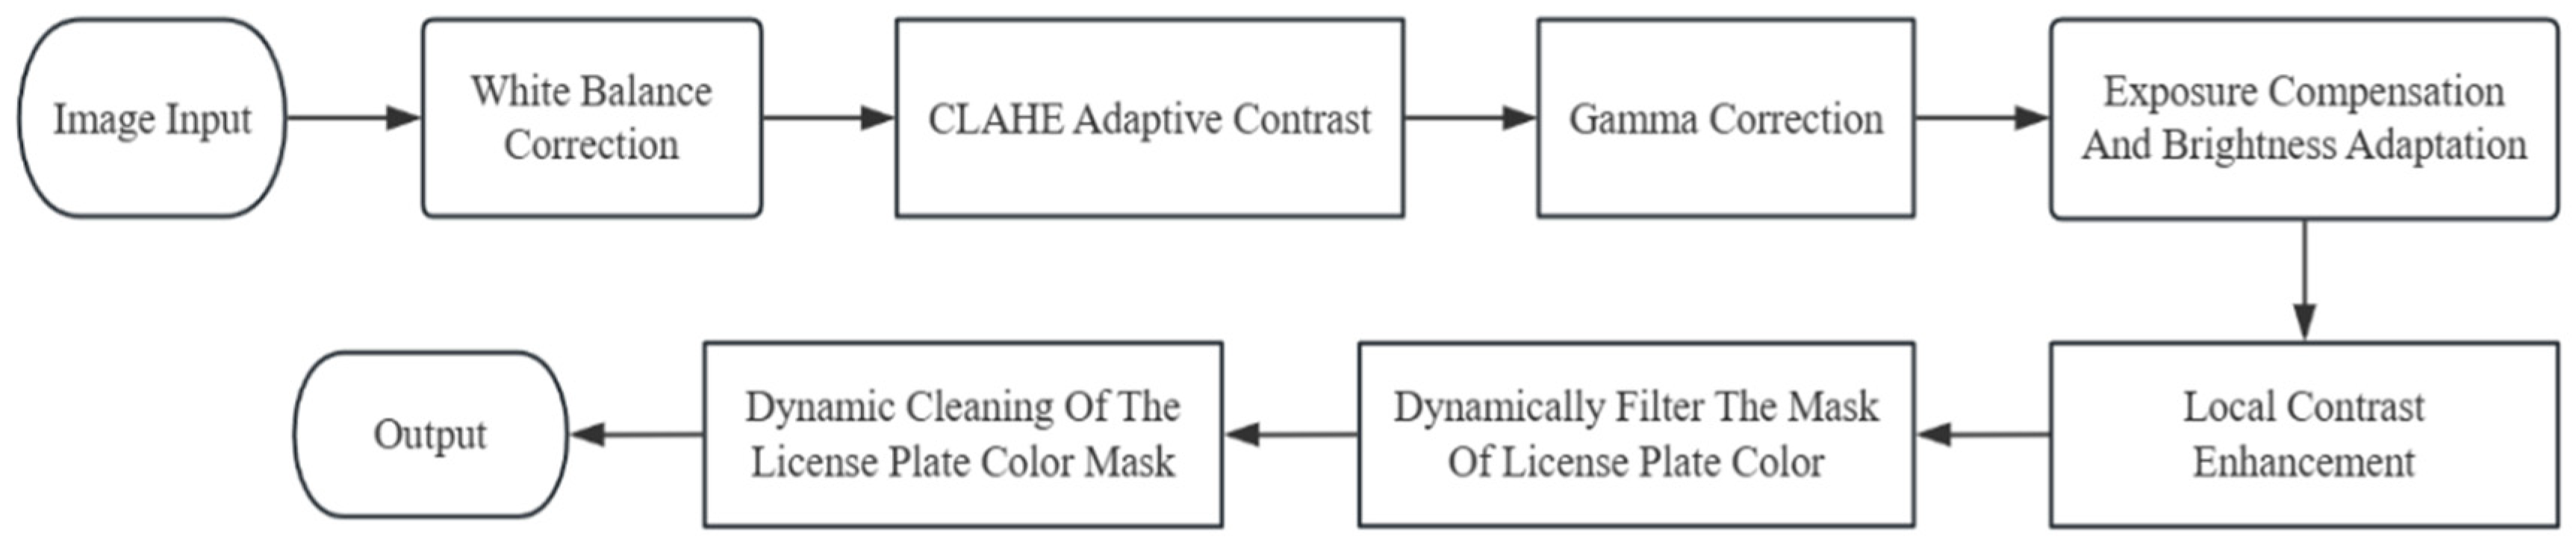
The system first evaluates the brightness of the input image and sequentially performs exposure compensation, automatic white balance correction, CLAHE-based local contrast enhancement, and gamma correction, thereby improving image clarity and color consistency under complex illumination conditions. The image is then converted into the HSV color space, where a brightness-driven dynamic thresholding method is employed to extract the blue license plate mask. Morphological operations are subsequently applied to enhance the connectivity of candidate regions and suppress background noise interference.
During the candidate region filtering process, histogram statistics and statistical feature analysis are conducted on the hue channel to determine stable license plate candidates. This approach is highly consistent with the method proposed in [6], which extracts blue regions based on hue and applies aspect ratio constraints for refinement. Furthermore, Mahmood et al. adopted a combination of HSV segmentation and morphological filtering in their LPLM module [7], further validating the effectiveness of the “color statistics + geometric structure filtering” strategy employed in this study. The minimum bounding rectangle and perspective transformation are then applied to achieve geometric correction of the license plate. Finally, the adaptively segmented character regions are processed by the PaddleOCR module to recognize and extract the license plate numbers.
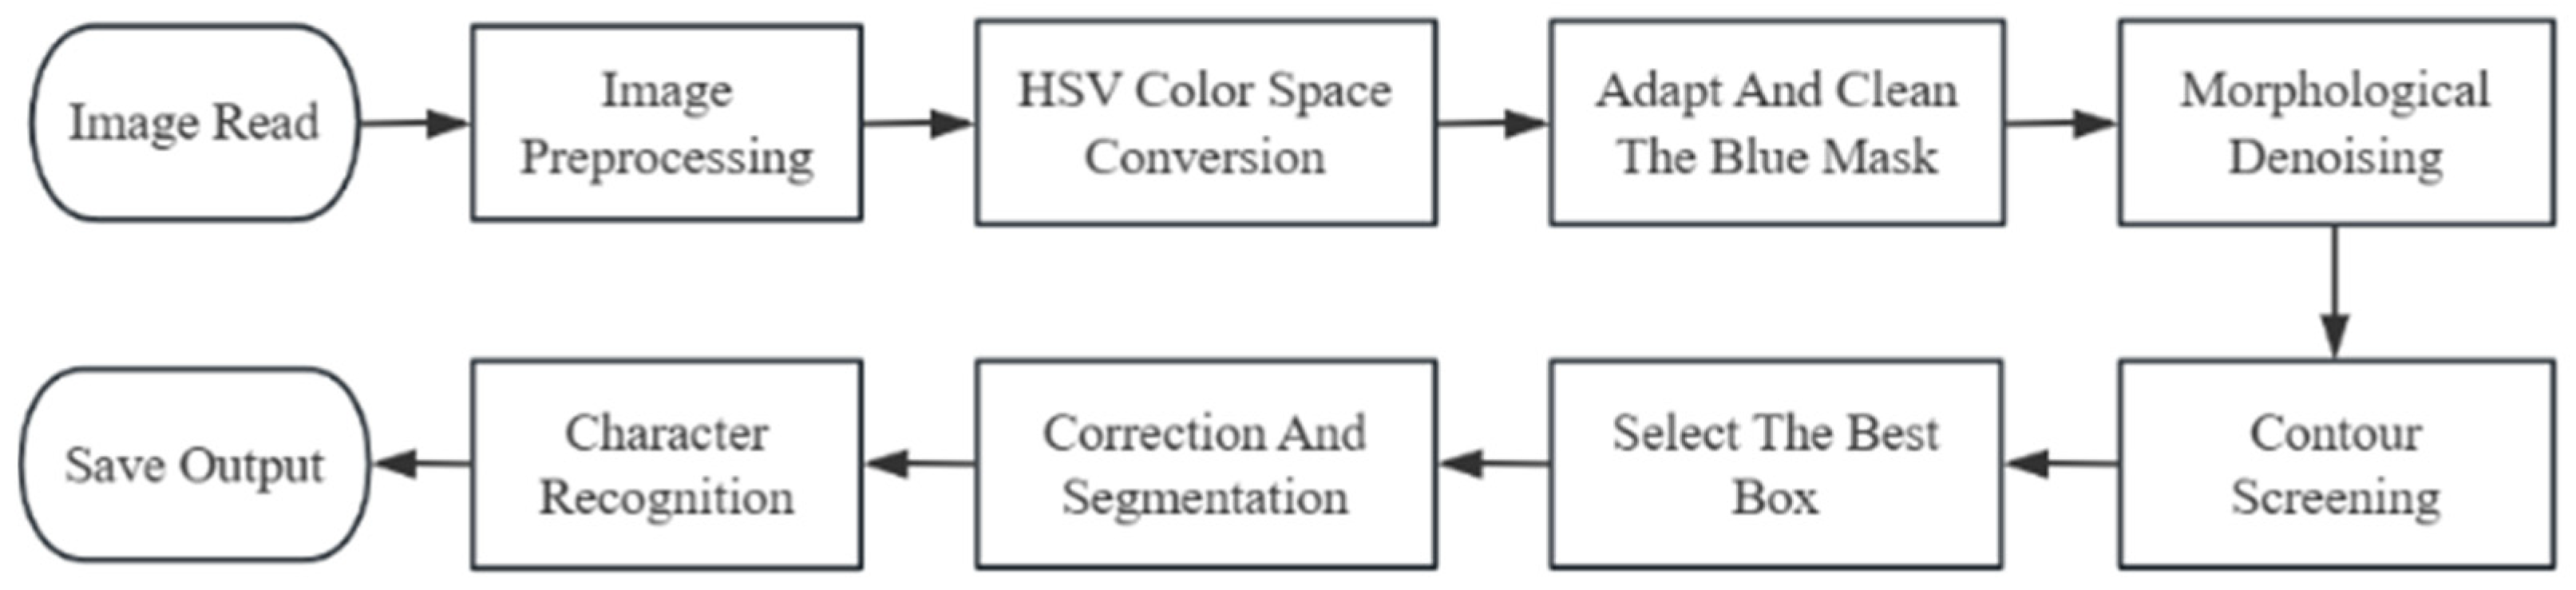
The system control flow is scheduled within a soft-core microprocessor, while computationally intensive tasks such as image filtering, color space transformation, morphological analysis, and connected component extraction are executed in parallel by hardware acceleration modules on the programmable logic (PL) side. Through the collaborative design of soft-core control and hardware-level parallel execution, the overall system latency is significantly reduced, and the throughput and real-time performance of image processing are effectively enhanced. The overall workflow of the proposed system is illustrated in Figure 2.

3. Image Preprocessing and HSV Color Statistical Analysis

To enhance the recognizability of license plate images under complex environments such as low illumination, strong reflections, and non-uniform lighting, this study proposes an image-preprocessing method that integrates adaptive brightness compensation, contrast enhancement, and white balance correction. The method dynamically adjusts processing parameters based on the overall brightness and color distribution characteristics of the image, ensuring that the license plate region maintains good visibility and color stability under different imaging conditions. The workflow is illustrated in Figure 3.

3.1. Adaptive Brightness Enhancement and Color Correction Method

To improve the detectability of license plates under complex illumination, this section presents an adaptive brightness enhancement and color correction pipeline based on grayscale distribution and color statistics. The pipeline consists of four stages: linear exposure compensation, dynamic gamma correction, local contrast enhancement, and mean-normalized white balance.

3.1.1. Adaptive Linear Exposure Compensation

First, an adaptive exposure compensation mechanism based on the grayscale mean is introduced. By dynamically setting the brightness gain coefficient and the offset, the original image undergoes linear brightness transformation, as defined in (1):
I ADJUSTED x , y = α I x , y + β
where I ( x , y ) denotes the grayscale value of the original image at pixel x , y , I ADJUSTED x , y represents the enhanced brightness value, α is the brightness gain coefficient for global brightness enhancement ( α > 1 indicates increment), and β is the brightness offset for adjusting the baseline intensity.

3.1.2. Dynamic Gamma Correction

To further refine the brightness mapping response, a dynamic gamma correction method based on grayscale distribution is introduced. The preprocessed image is first converted into grayscale and normalized, and the average brightness is calculated follows:
m = 1 H × W x = 1 W y = 1 H I x , y 255
where H and W denote the height and width of the image, respectively, and I x , y is the grayscale value at pixel x , y .
The gamma value is then determined according to the target mid-gray level:
γ = ln ( μ m i d ) ln ( m + 10 6 ) , γ [ 0.5 , 2.5 ]
where μ m i d is typically set to 0.5 to align the corrected mid-gray value with the standard, while upper and lower bounds are set to avoid over- or under-correction.
Finally, the corrected value is obtained via lookup table mapping:
I g a m m a ( x , y ) = ( I ( x , y ) 255 ) 1 γ × 255
where I g a m m a x , y represents the pixel value after Gamma correction. This step adaptively adjusts the gain curve for dark and highlight regions, making image details more balanced and visible.

3.1.3. Adaptive Local Contrast Enhancement Based on Lab Space

To enhance local details and edge information, the system adopts an adaptive contrast enhancement method based on LAB color space. The image is converted from BGR to LAB space, the luminance channel is extracted, and the CLAHE algorithm is applied, formulated follows:
L e n h a n c e d ( x , y ) = C L A H E ( L ( x , y ) , c l i p _ l i m i t , t i l e _ g r i d _ s i z e )
When L ¯ < 120 , the system selects the fine-grained enhancement parameter t i l e _ g r i d _ s i z e ( 8 , 8 ) , c l i p _ l i m i t = 2.0 ; in images with high brightness, in order to prevent excessive noise amplification, a larger grid and a higher clip value are used to balance the enhancement effect and stability.

3.1.4. Mean Normalized White Balance Correction

Finally, to correct color temperature deviations in images and address color inconsistencies across different devices, the system incorporates a mean-normalized white balance correction strategy. This method achieves color standardization by normalizing each channel and remapping them to a unified reference mean, with the specific expression as follows:
C i ( x , y ) = C i ( x , y ) μ i μ r e f
In Equation (6), C i x , y represents the pixel value in the R/G/B channel, μ i is the mean value of the channel, and μ r e f is the set reference brightness. This method effectively improves the color consistency of blue license plate regions in HSV space, providing a stable foundation for subsequent color-based segmentation and recognition.
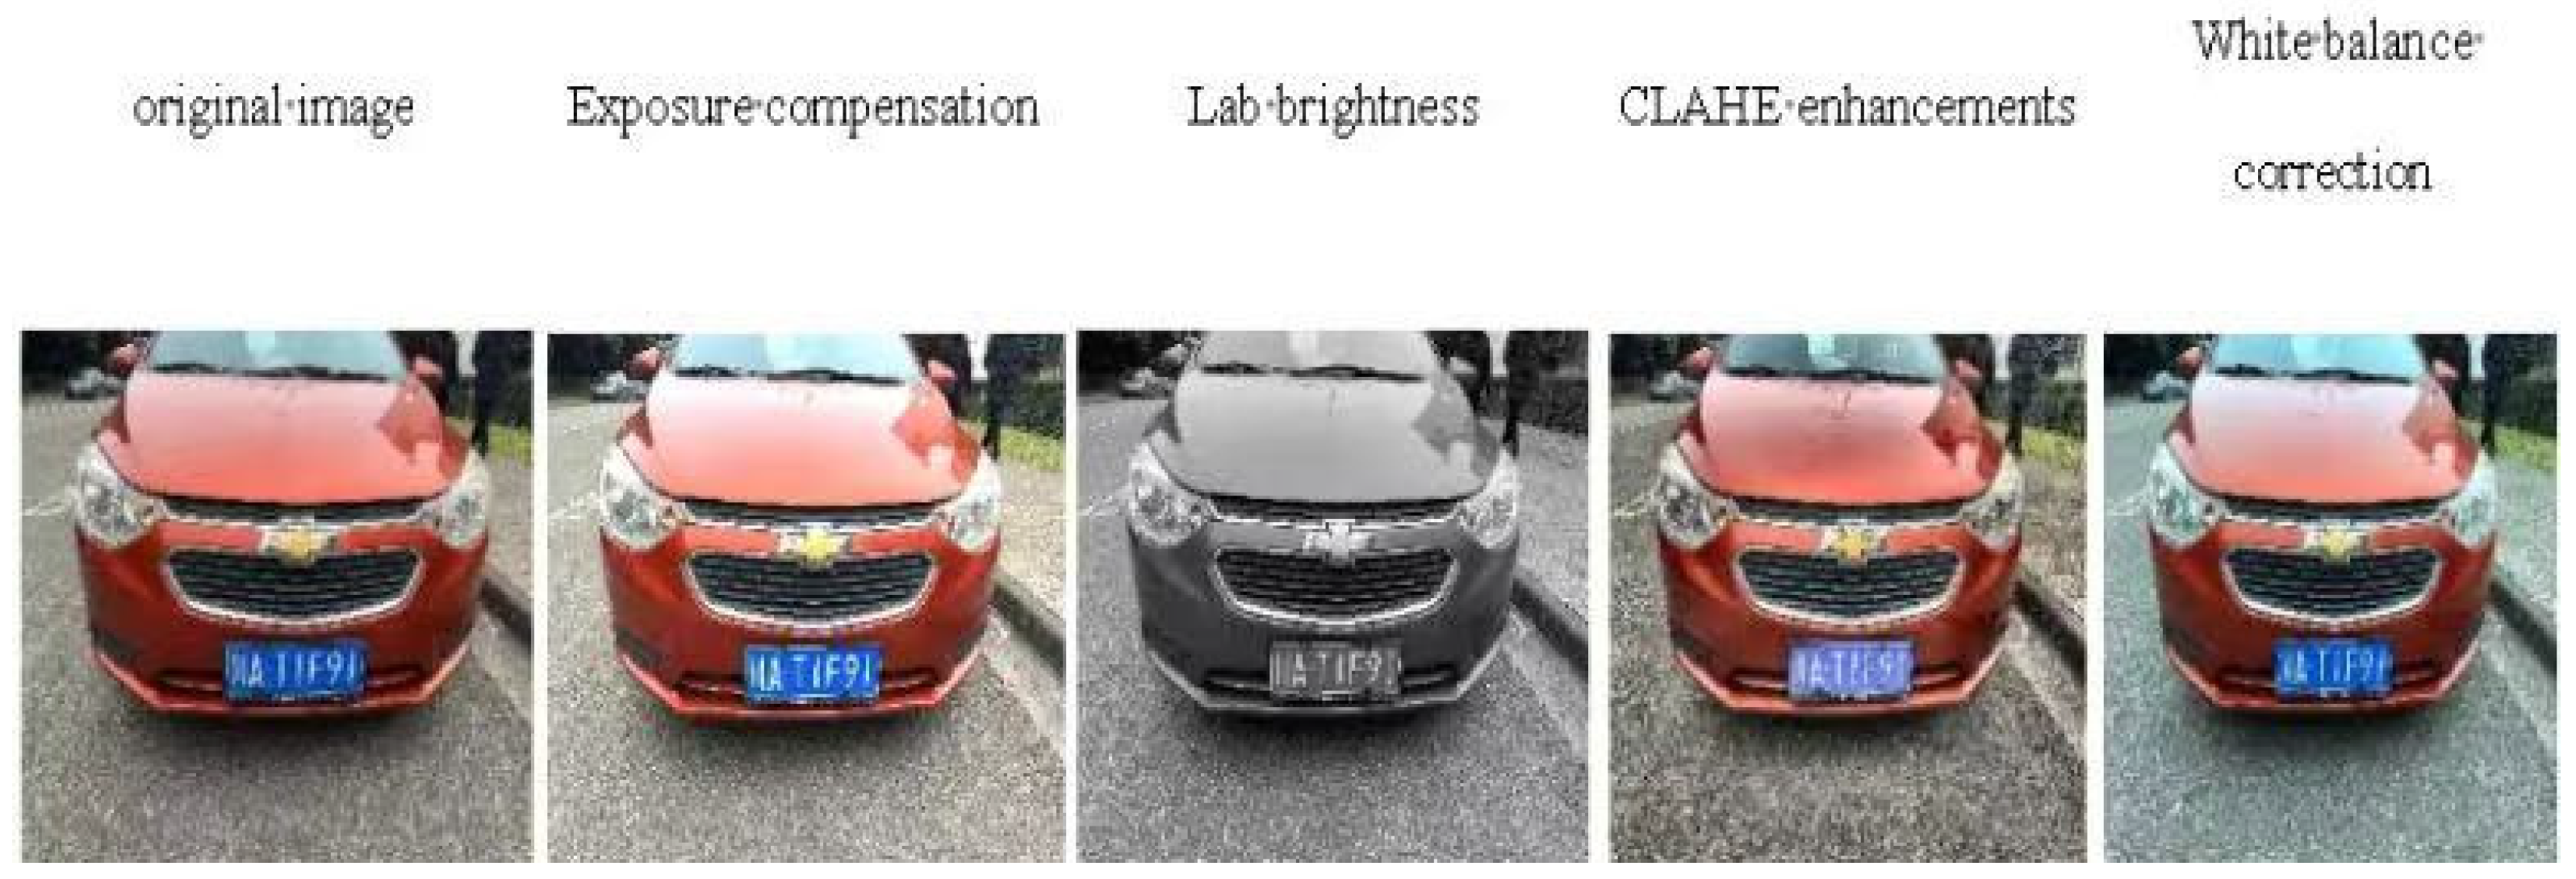
Figure 4 illustrates the visual comparison of the image enhancement method at each stage, showing significant improvements in overall brightness, contrast, and color [8].

3.2. Dynamic Mask Extraction Strategy for HSV Color Space

The standard license plate colors in mainland China mainly include blue, green, and yellow, with distinct tonal concentration. This paper uses the HSV color space, which offers better color separation, as the primary processing channel. By analyzing the image brightness and adaptively adjusting the threshold of the H channel, combined with a dynamic region analysis mechanism, the method gradually approximates the real license plate area. Compared to traditional fixed-threshold methods, this strategy has stronger adaptability under varying lighting conditions [9].

3.2.1. HSV Dynamic Mask and Failure Detection Path

After the image-preprocessing operations are completed, it is converted to the HSV color space, and the Hue channel is separated for analysis. If the Hue channel shows invalid color differences across the entire image (i.e., all pixel hues are similar or identical), it is determined that the color information is missing from the current image. The main process is then terminated, and the system switches to the backup strategy B, which is based on edge extraction and morphological closing operations for structural analysis, to perform the preliminary candidate license plate region selection.
Under the premise of normal mask generation, the system further evaluates the effectiveness of the mask based on its area proportion within the entire image. If the blue area is significantly small (below 0.5% of the total image area) or the area proportion is large but the connected regions are highly concentrated, it is considered that the mask segmentation has a serious deviation. In this case, the system switches to backup strategy A. This strategy, based on MSER (Maximally Stable Extremal Regions) region detection and edge density analysis, can reliably extract candidate license plate regions using structural information when color information is insufficient or color separation fails (as shown in Table 1).
If the mask area is within a reasonable range and no highly concentrated regions are present, the system continues to execute the main detection flow, which includes mask cleaning, connected region extraction, and candidate region filtering. This multi-level detection path combines color and structural dual-channel fault tolerance design, significantly improving the system’s robustness under low light, glare, or color contamination conditions.

3.2.2. Three Round Dynamic Threshold Trimming Mechanism

To enhance the system’s adaptability to blue license plates under complex lighting conditions, this paper designs a multi-round dynamic threshold adjustment strategy based on the Hue channel. The system first sets the initial Hue value range based on the overall image brightness. After the initial mask is generated, the effectiveness of the mask is judged based on its area proportion and the distribution of connected regions. If the mask area is insufficient or shows abnormal concentration, the Hue threshold range is gradually relaxed, and the mask is regenerated, with up to three rounds of attempts. Each round of adjustments is based on statistical features, dynamically correcting the threshold range to improve the robustness of license plate detection under non-ideal lighting conditions. The specific adjustment logic is shown in Table 2.

3.2.3. Auxiliary Parameter Adjustment Mechanism of Hue Histogram

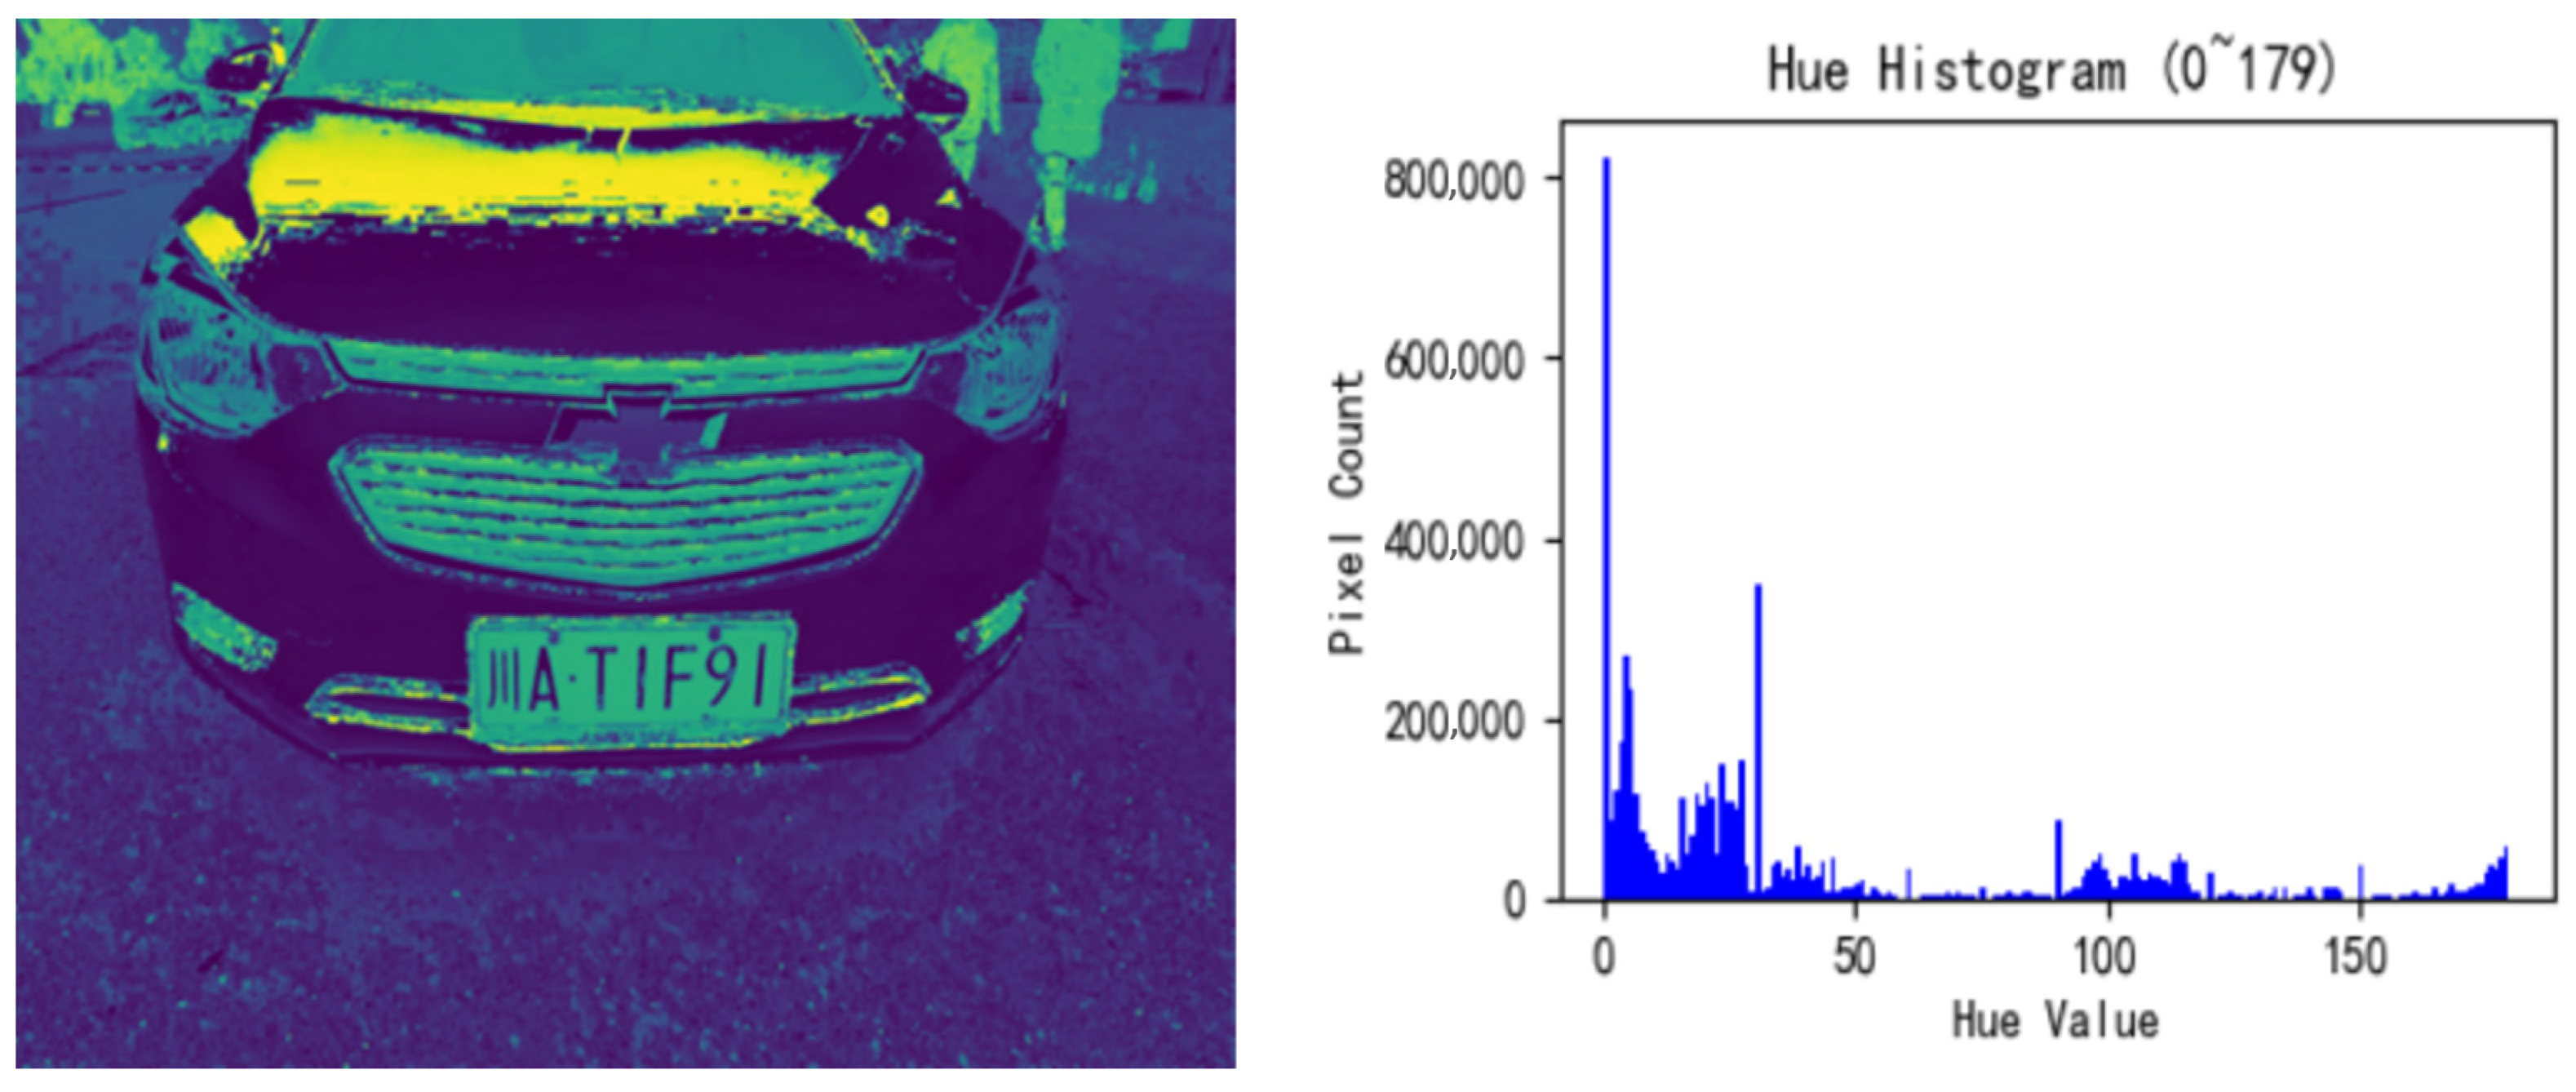
To improve the precision of dynamic threshold adjustment, the system introduces a Hue histogram analysis method based on the Hue channel. By statistically analyzing the Hue value distribution in the image, the system identifies the dominant Hue range, thereby determining whether the target blue region falls within the main Hue range. This strategy not only helps accurately determine whether further threshold fine-tuning is necessary, but also effectively eliminates pseudo-blue regions, such as the blue sky or water, that resemble the license plate color, preventing the false activation of the main detection path and enhancing the overall accuracy and robustness of the filtering process.
As shown in Figure 5, different images exhibit a distinct peak feature in the Hue channel histogram. Based on this, the system constructs a target Hue template to identify the most likely license plate areas and dynamically matches the real license plate blue tone.

3.2.4. Description of Color Space Contrast Experiment

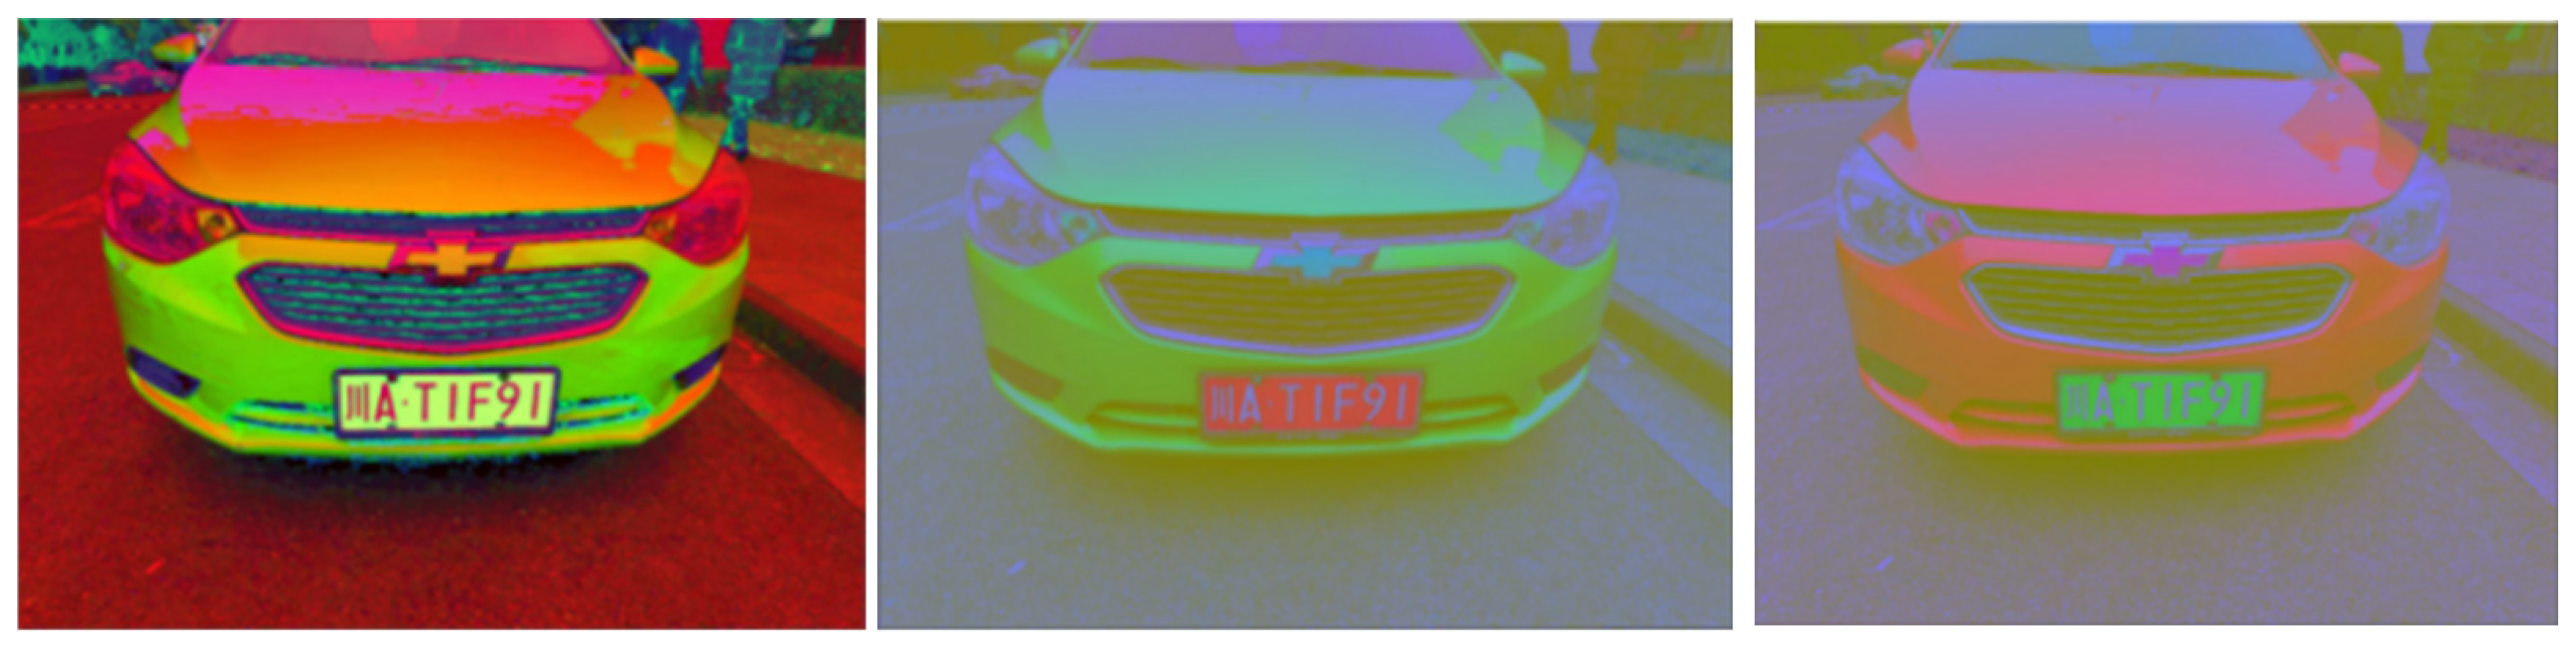
To quantitatively evaluate the performance of different color spaces in blue license plate region extraction, this paper constructs an automated evaluation process. First, a blue region mask in the HSV color space is selected as the pseudo Ground Truth (Pseudo GT). Based on a pre-set HSV color range (H ∈ [105, 130], S ∈ [80, 255], V ∈ [90, 255]), masks are generated for all images. This mask represents the system’s optimal response to blue license plate regions, serving as the evaluation benchmark for subsequent assessments. The color comparison images for HSV, YCrCb, and YUV color spaces are shown in Figure 6.
On this basis, blue region extraction is performed for the three color spaces (HSV, YCrCb, and YUV) using the same structural elements and morphological processing parameters to ensure fairness in the experiment. Then, based on the overlap between the predicted mask and the pseudo GT, the average Intersection over Union (IoU) and average Recall are calculated as performance evaluation metrics, with the following formulas:
I o U = | P r e d i c t G T | | P r e d i c t G T |
R e c a l l = | P r e d i c t G T | | G T |
Here, P r e d i c t represents the set of pixels identified as blue regions in the predicted mask, while G T denotes the set of true blue region pixels in the pseudo mask.
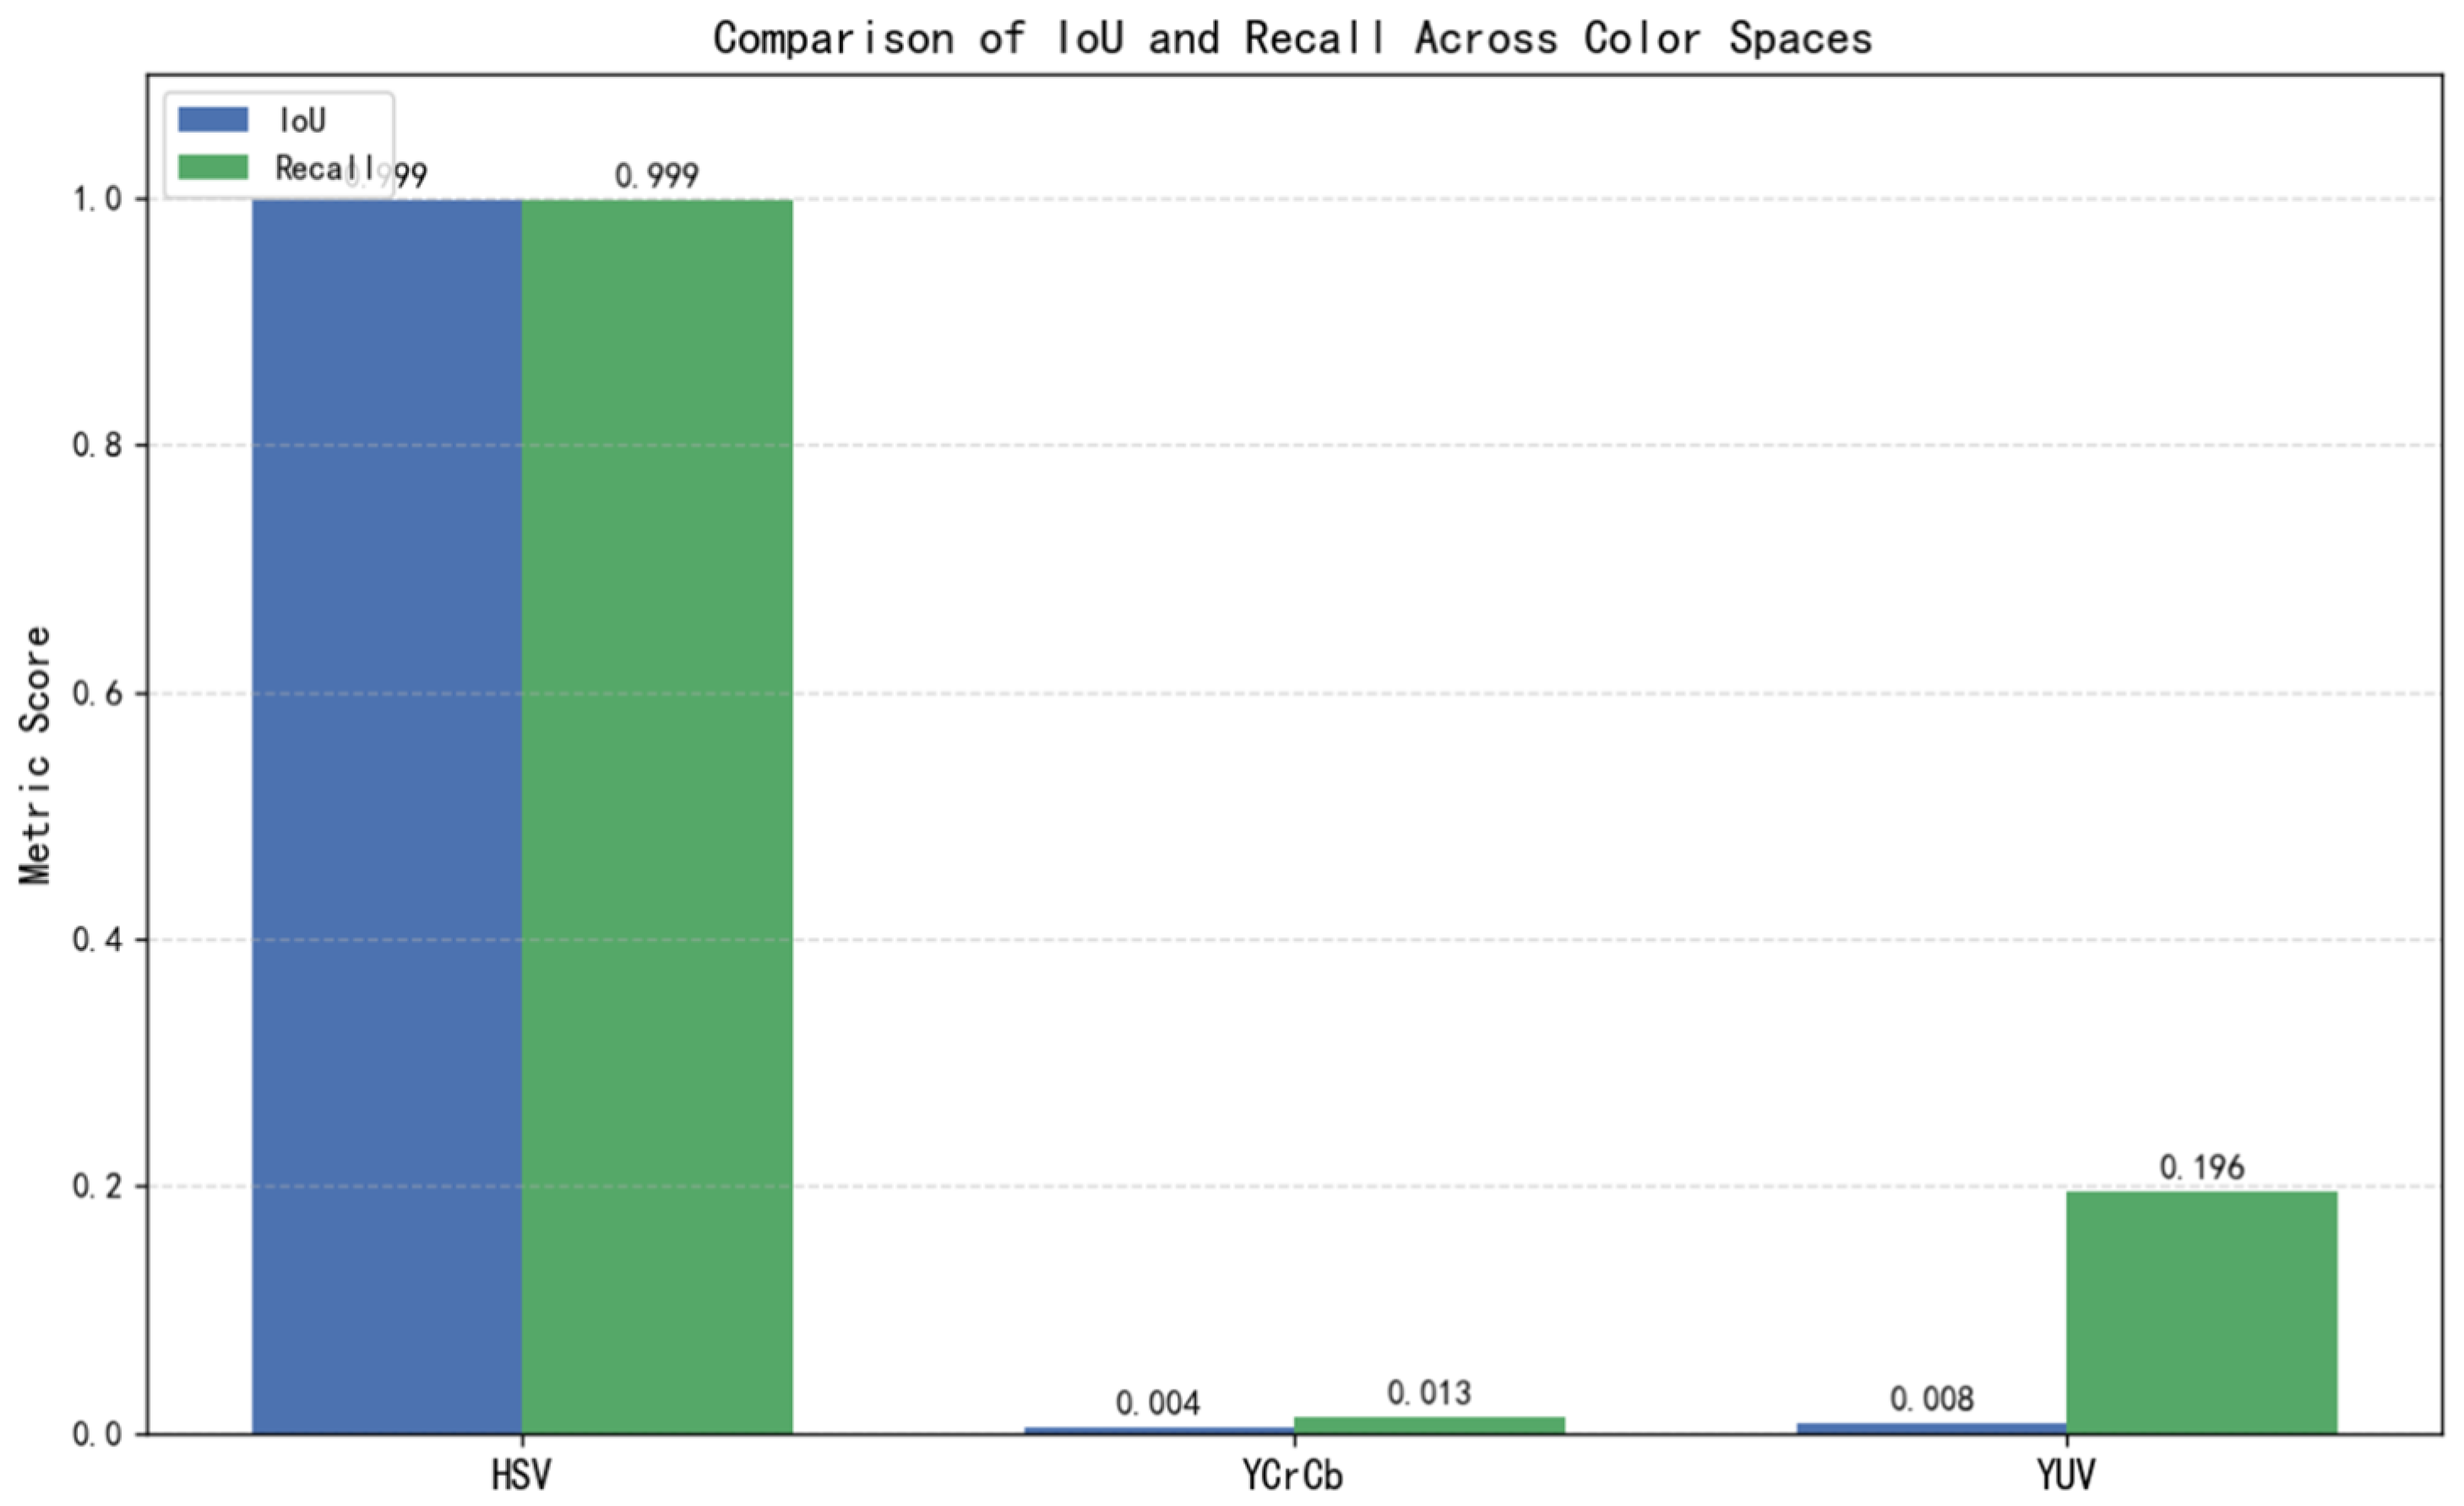
The performance comparison of the methods is shown in Figure 7. The experimental results show that the HSV color space performs best in blue license plate region extraction, with an average IoU and Recall both reaching 0.9989, nearly identical to the pseudo GT. Thanks to its advantage in separating Hue and brightness, HSV can stably separate blue regions under conditions like occlusion, glare, or distant images, demonstrating excellent robustness.
In contrast, the YCrCb and YUV spaces perform significantly worse for this task. Specifically, the average IoU of YCrCb is only 0.0043, and the Recall is 0.0132, making it almost unable to identify blue regions; YUV performs slightly better but still shows fuzzy segmentation boundaries, with frequent false positives and missed detections, indicating insufficient recognition accuracy. The relative improvement in IoU exceeds 23,000%, further illustrating the significant advantage of HSV in color separation.
In summary, HSV not only provides higher accuracy and recall in blue region extraction but also serves as a stable basis for generating pseudo GT, offering reliable support for subsequent feature extraction and filtering algorithms.

3.3. Mask Cleaning and Region Enhancement Algorithm

To improve mask quality and connectivity, this section develops an adaptive morphological processing pipeline that dynamically adjusts parameters based on mask area characteristics. The process begins by calculating the mask coverage ratio, which is the proportion of non-zero pixels in the blue mask ( A m ) to the total image area ( A t ), expressed as R = A m A t . Based on the coverage ratio, the system dynamically configures:
(1)
Erosion kernel size.
(2)
Dilation kernel size.
(3)
Dilation iteration count.
  • to adaptively address two typical scenarios:
(1)
Weak connectivity in small-area masks.
(2)
Excessive noise in large-area masks.
Processing pipeline:
(1)
Single erosion operation → noise suppression.
(2)
Controlled dilation operations → structure enhancement.
The complete transformation can be formally represented by:
M c l e a n = D i l a t e ( E r o d e ( M , k e ) , k d , n )
In this formulation:
(1)
M denotes the original blue mask.
(2)
Mclean represents the processed mask after morphological cleaning.
(3)
ke and kd specify the kernel sizes for erosion and dilation respectively.
(4)
N indicates the iteration count for dilation operations.
This strategy demonstrates dual effectiveness in:
(1)
Preserving the structural continuity of license plate characters.
(2)
Simultaneously suppressing background noise and false connection regions.
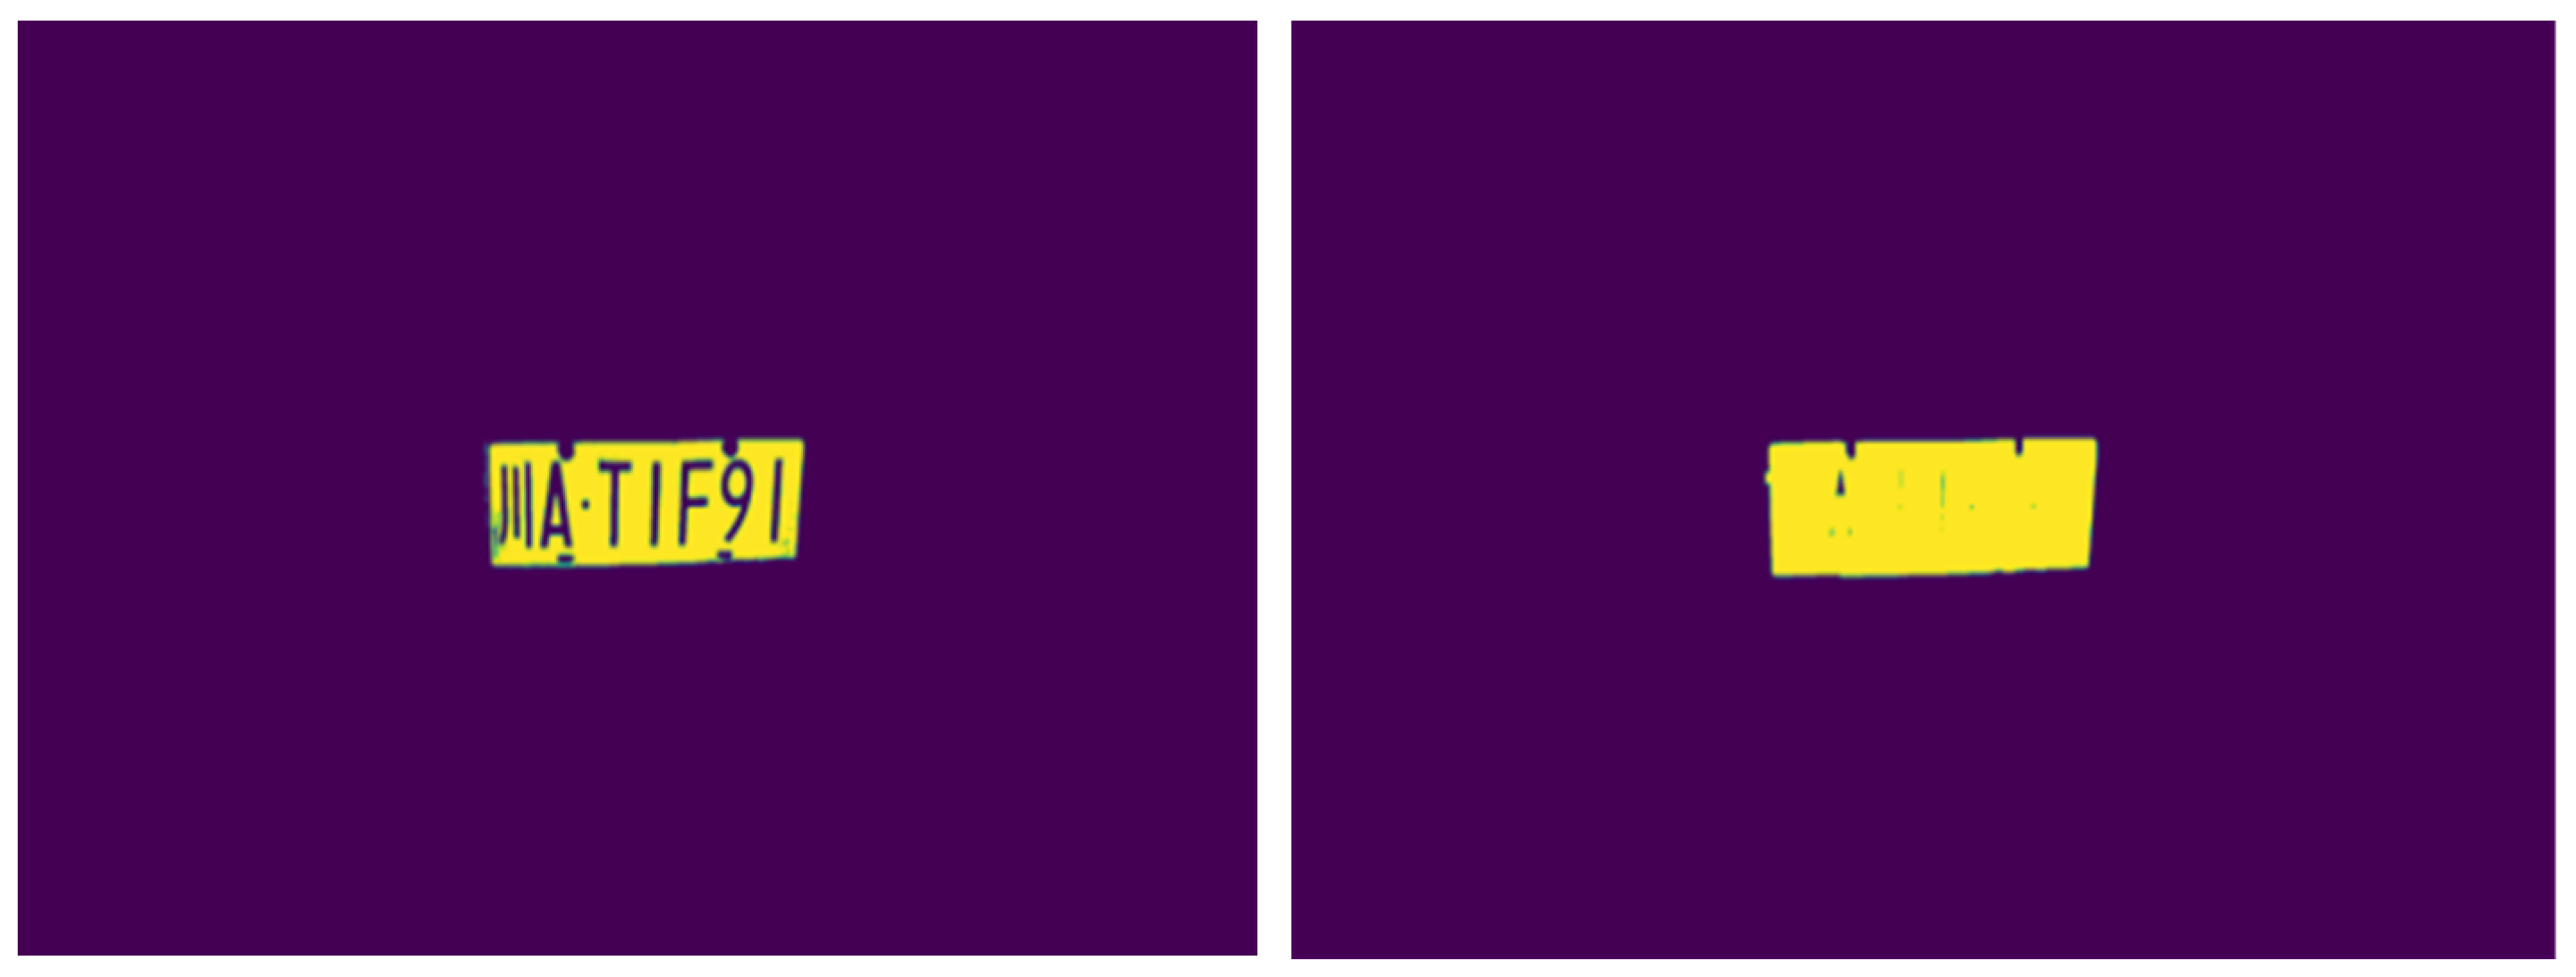
As visually confirmed in Figure 8, the comparative results before and after mask cleaning clearly exhibit.

4. License Plate Location and Candidate Box Selection Method

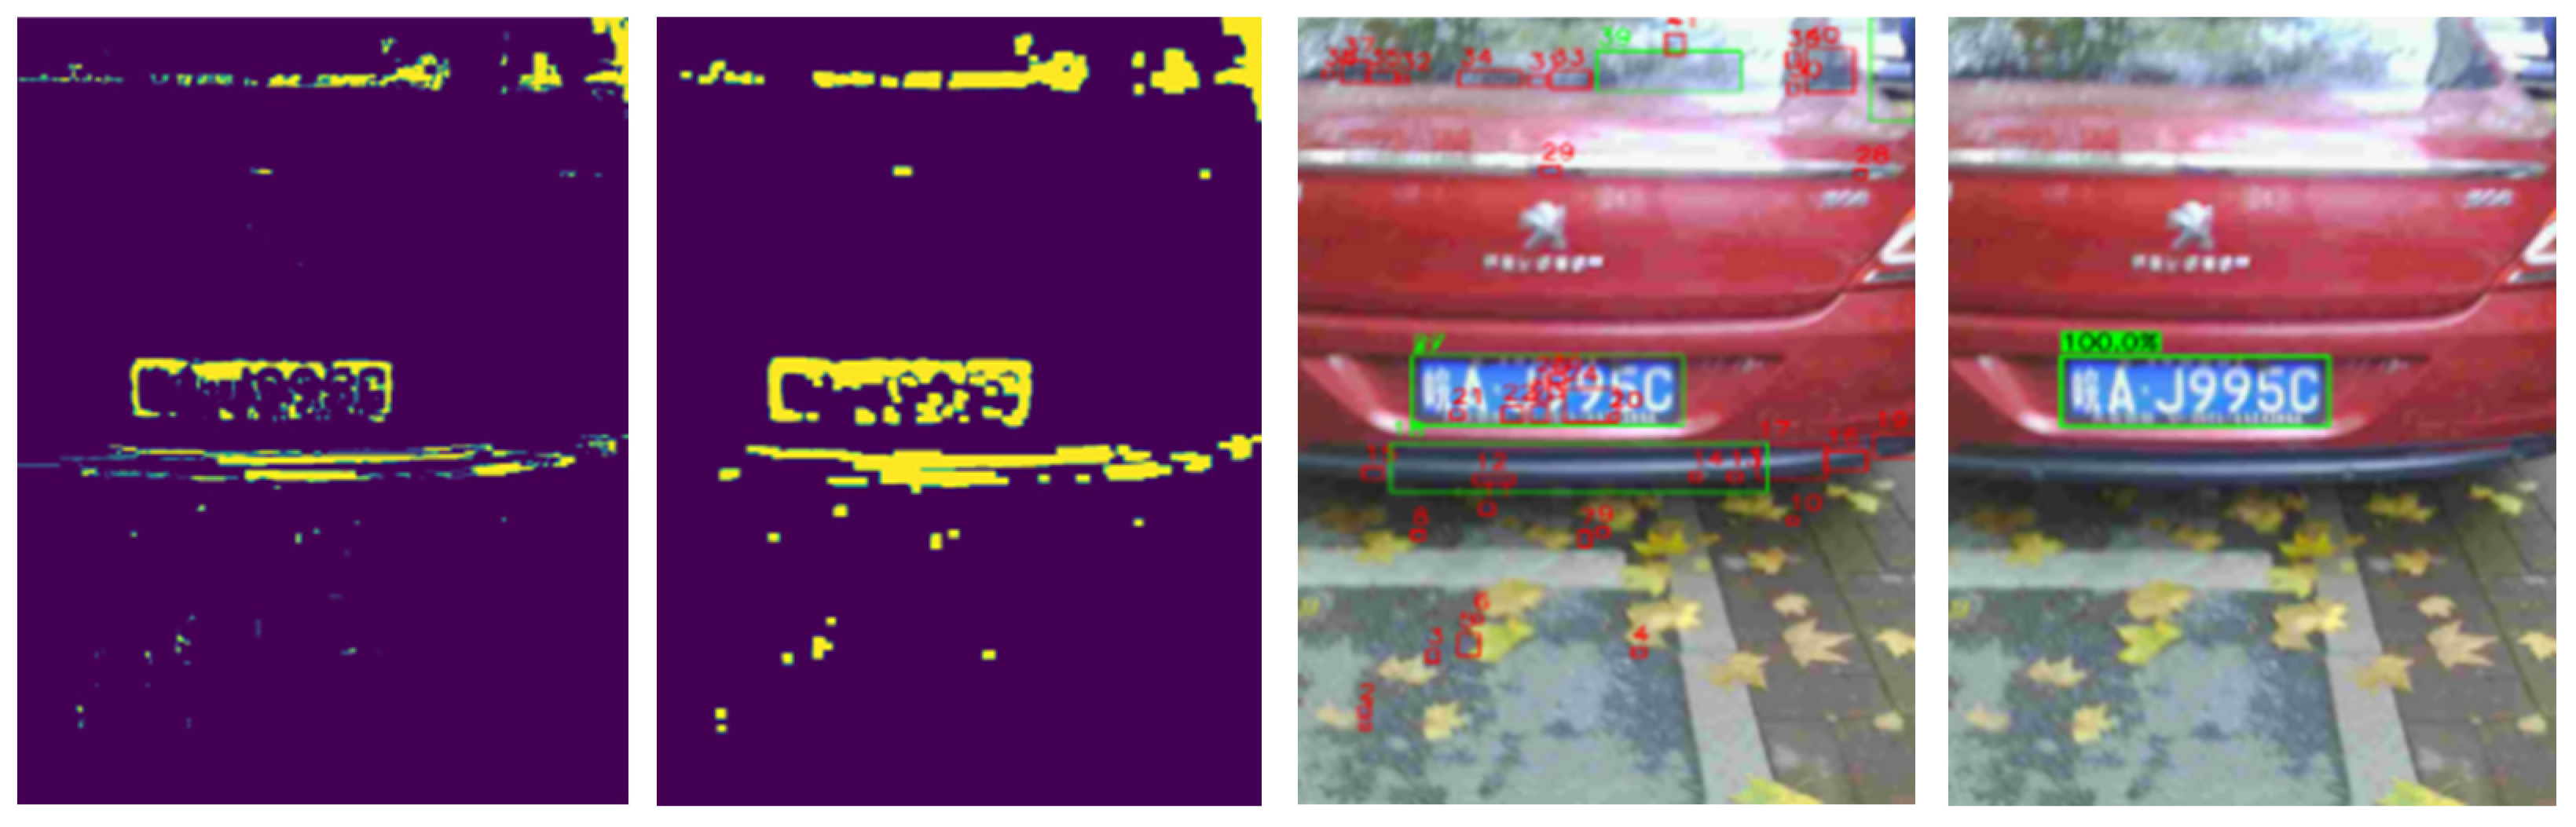
License plates in images typically exhibit distinct color features (e.g., blue or green background) and high structural texture density. Based on image preprocessing, this study designs an integrated candidate region screening algorithm that combines color distribution, structural density, and geometric attributes. The algorithm features dynamic threshold adjustment, region merging, and a scoring mechanism, enabling robust license plate detection across varying resolutions and complex scenarios. The complete workflow is illustrated in Figure 9.

4.1. Color Feature and Edge Density Analysis

For blue license plate region extraction, images are first converted to HSV color space. The system dynamically adjusts hue threshold ranges based on luminance conditions, employing iterative searching to ensure the mask region area meets minimum requirements. Subsequent morphological operations remove noise and enhance structural connectivity.
To further eliminate non-plate regions with similar colors but lacking plate-like structures (e.g., blue signs or clothing), this paper introduces edge density as an auxiliary criterion. The edge density of candidate regions is defined as follows:
D e = N e A r
where D e denotes the edge density of the candidate region, Ne represents the count of edge pixels extracted using the Canny operator within the region, Ar = w × h defines the area of the rectangular candidate region.
For candidate regions with smaller areas, the system employs a higher density threshold to improve screening accuracy; for regions meeting area requirements, a lower edge density is permitted to maintain recall rate. This strategy effectively suppresses false detections caused by high-frequency textured backgrounds.

4.2. Candidate Region Merging and Size Dynamic Threshold Design

To address fragmented license plate regions in real-world images, the system incorporates a position-and-overlap-based region merging mechanism. Two candidate regions are identified as belonging to the same license plate when satisfying the following dual conditions:
Horizontal Spacing Constraint:
| x 1 + w 1 2 x 2 w 2 2 | < T x
Given two candidate regions with: Horizontal starting coordinates: x 1 , x 2 , Respective widths: w 1 , w 2 , Threshold: T x .
Vertical Overlap Constraint:
R v = h o v e r l a p m i n ( h 1 , h 2 ) > 0.6
h o v e r l a p : vertical overlap height between two candidate regions, h 1 , h 2 : respective heights of the regions. After region merging is completed, the system applies filtering based on aspect ratio and area to avoid selecting irregular interference targets. The constraints are as follows:
Aspect Ratio Constraint w h and Area Upper-Bound Constraint A r :
1.2 < w h < 4.5
A r < 0.10 A i m g
where A i m g is the area of the whole image, which is designed to exclude excessive non license plate areas (such as background billboards).
The dynamic threshold and structure merging mechanism ensure that the final reserved candidate region has reasonable shape and continuous structure, and provide stable input for subsequent identification.

4.3. Optimal License Plate Area Scoring and Selection Algorithm

In order to select the optimal license plate area from multiple candidate boxes, the system introduces a weighted scoring mechanism, comprehensively considering four indicators: edge density, area ratio, shape matching and color consistency. The scoring function is defined as follows:
S = 0.7 d + 0.2 a + 0.1 r + 0.3 c
In Equation (15), d is the edge density, which is defined as the ratio of the number of edge points to the area of the region; a is the area proportion, that is, the ratio of the area of the candidate area to the area of the whole map; r is the shape matching degree, and the score is higher when the aspect ratio is close to the ideal value of 3.5; c is the score of color consistency, defined as follows:
c = e x p ( 2 σ H 2 σ c 2 ) , σ c = 10.0
In Equation (16), σ H is the standard deviation of H channel, and the smaller it is, the purer the hue [10].
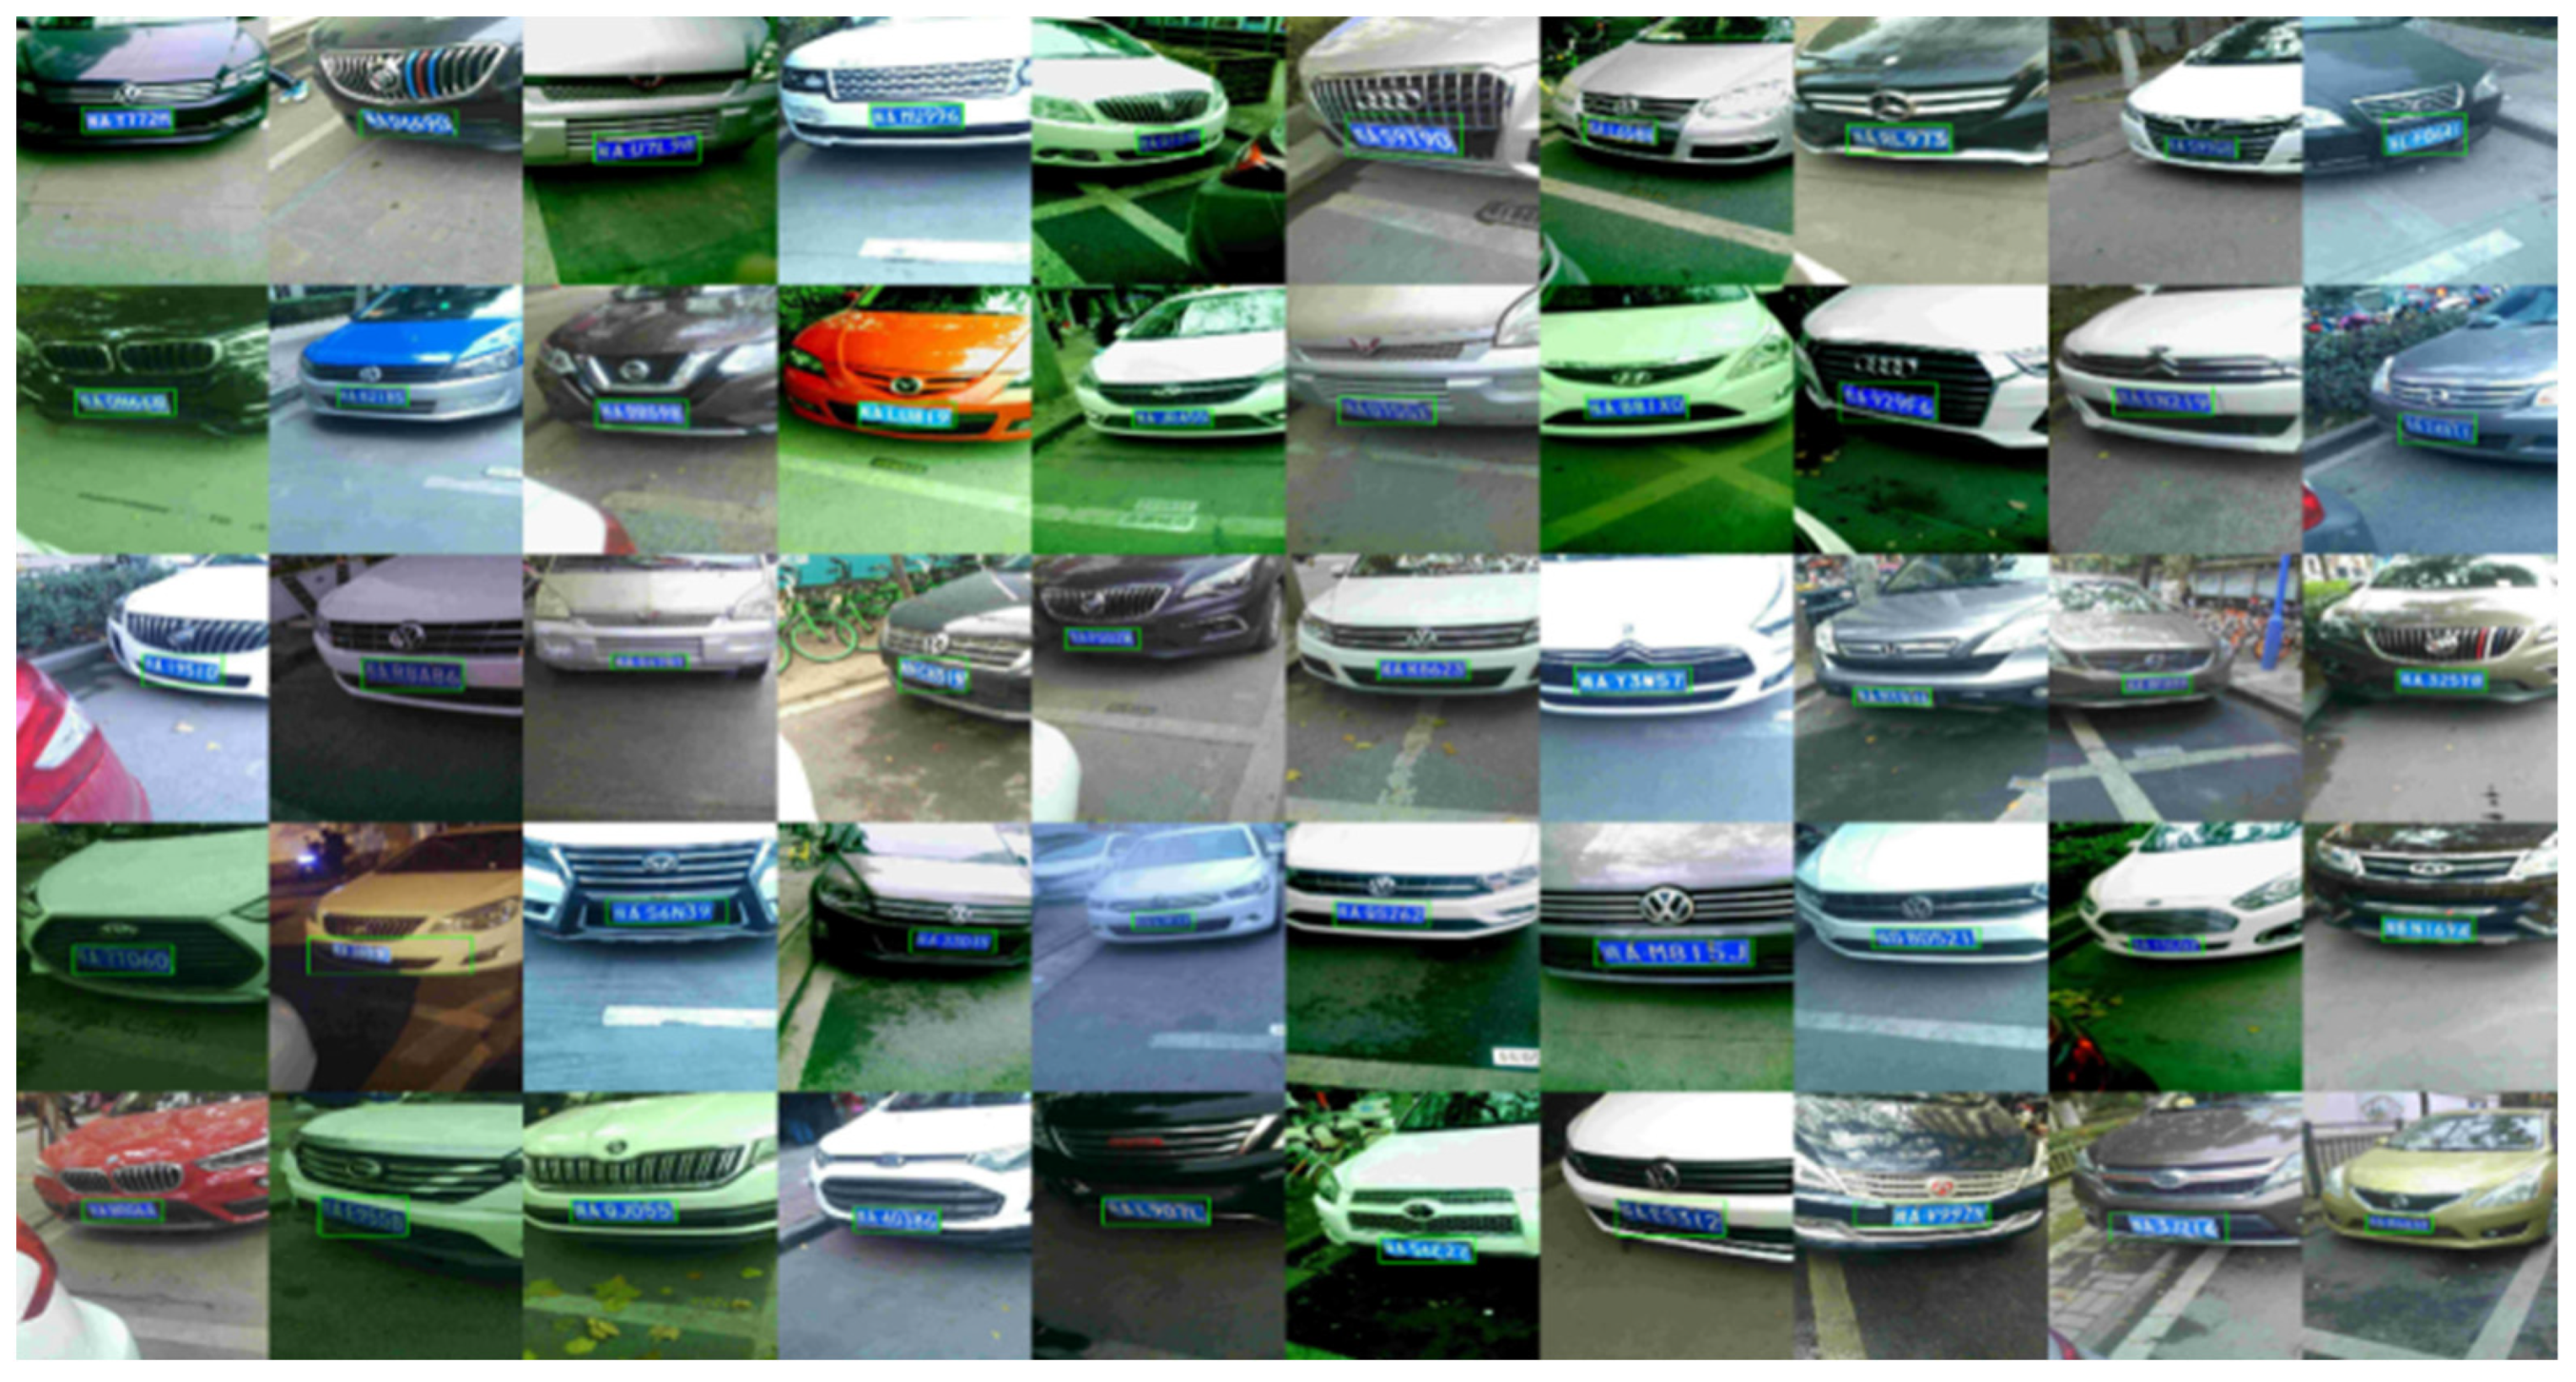
The system calculates the scores for all candidate regions and selects the one with the highest score as the final output. If no valid candidates are found, it switches to a backup detection method (MSER or morphological closing operation). This scoring strategy demonstrates strong robustness in complex environments, achieving a license plate detection accuracy of 93.7%, which is an improvement of approximately 10.9% over traditional methods, significantly reducing the false detection rate. Figure 10 shows typical recognition results.

5. Performance Test and Model Comparison Experiment

To verify the effectiveness of the proposed fast license plate localization algorithm based on adaptive image enhancement, this paper conducts multi-dimensional experimental tests from the perspectives of localization accuracy, processing time, and robustness, and performs comparative analysis with the representative lightweight deep learning model YOLOv12n to systematically evaluate the comprehensive performance of the proposed solution.

5.1. Description of Experimental Platform and Test Data Set

In this study, test systems are deployed on the following two types of platforms:
As shown in Table 3, deep learning models such as YOLOv12n require strong general computational capabilities and explicit GPU acceleration support. These models rely on high-power GPU resources, making them difficult to directly deploy on embedded or edge computing devices. Additionally, the model inference delay is constrained by the scheduling of the computational framework and the GPU memory bandwidth bottleneck [11].
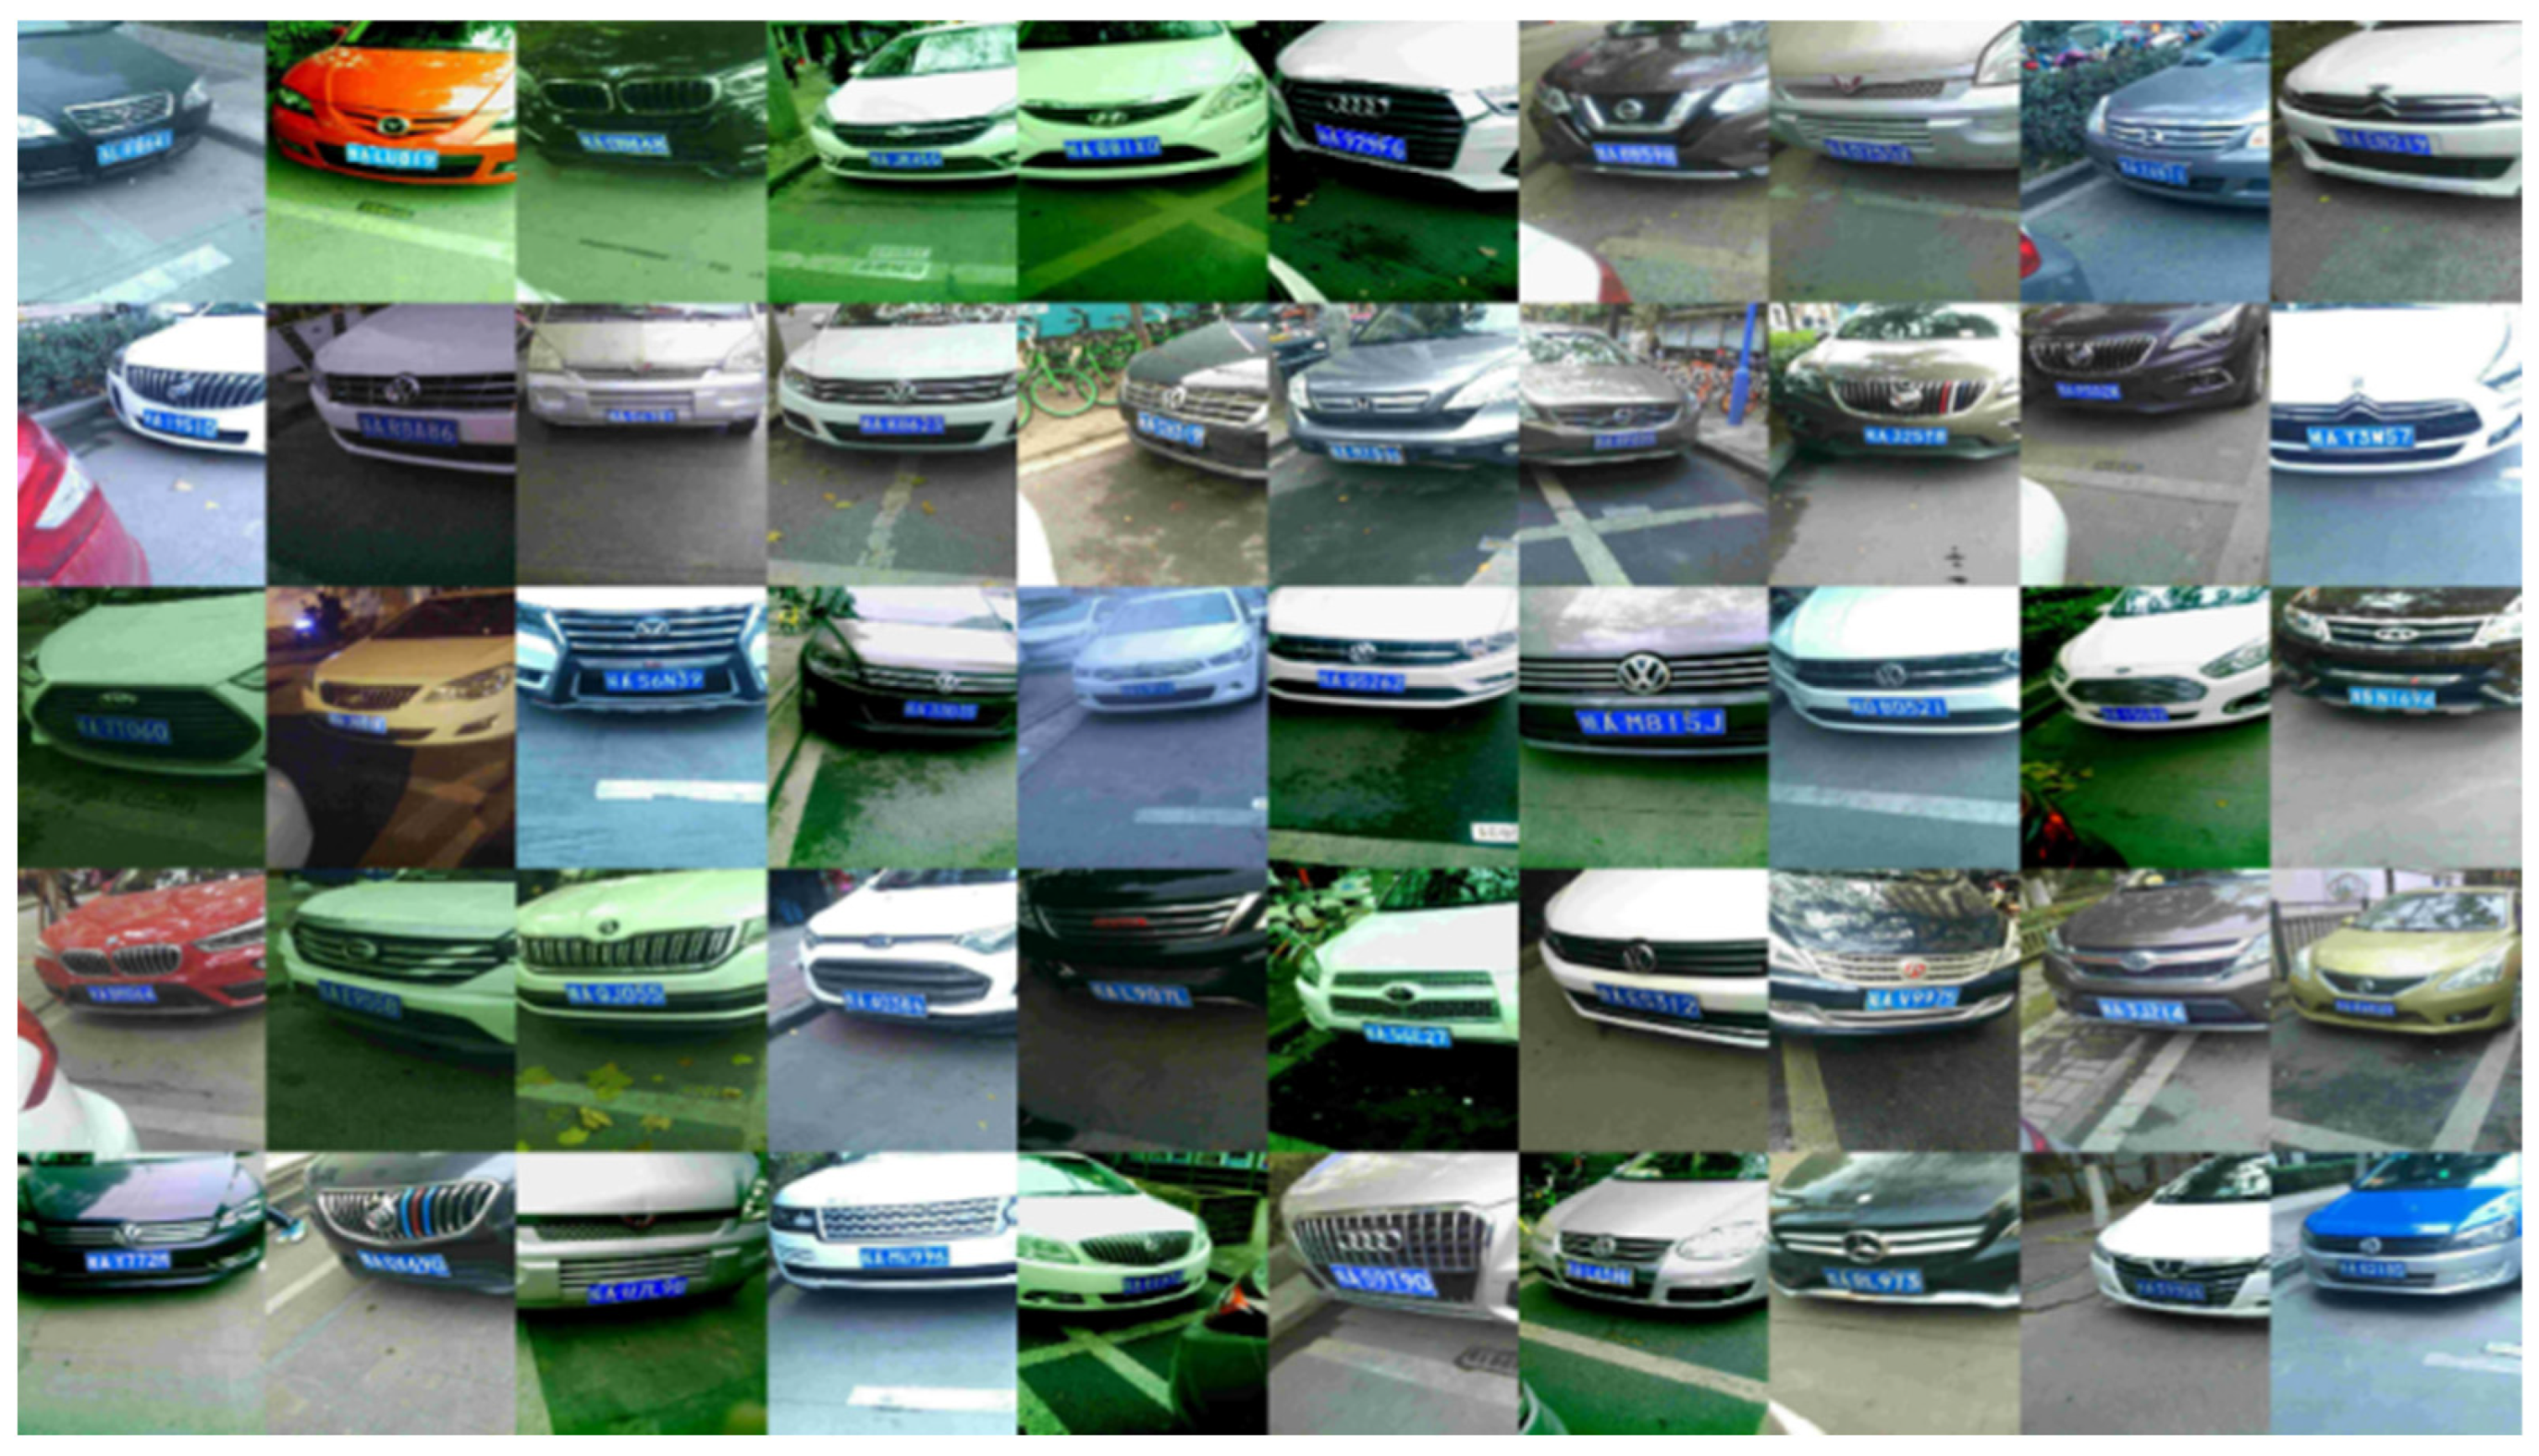
The test dataset is selected from publicly available CCPD2019 and CCPD2020 license plate image collections, as shown in Figure 11. Following typical parking lot environmental conditions—such as fixed viewing angles, static vehicles, and minimal background interference—1000 representative images were filtered out. This dataset covers various complex scenarios, including daytime, nighttime, occlusions, blurring, and angular deviations, realistically reflecting recognition challenges in parking lot environments.

5.2. Performance Comparison Between Yolov12n Model and This Scheme

To comprehensively evaluate system performance, this paper selects YOLOv12n, released by Ultralytics, as a reference model. Tests on a unified license plate image dataset were conducted for license plate localization, character segmentation, and recognition accuracy, along with comparisons of processing efficiency and power consumption. The experimental results are shown in Table 4.
As a lightweight deep learning model, YOLOv12n demonstrates excellent performance in localization and recognition accuracy, achieving a license plate localization accuracy of 99.5% and a character recognition accuracy of 96.5%. However, it relies on GPU-based inference, with an average processing time of 13.76 ms per image and an overall system power consumption of about 45 watts, which makes deployment on resource-constrained embedded devices challenging.
In contrast, the algorithm proposed in this paper adopts traditional image processing methods, implementing the license plate localization pipeline with OpenCV [12]. While maintaining reasonable accuracy, the algorithm achieves a localization accuracy of 93.7%. The average processing time per image is 9.52 ms, representing an improvement of approximately 30.81% over YOLOv12n.
The proposed algorithm achieves high-speed localization on general-purpose computing platforms, fully demonstrating the lightweight and efficient nature of statistical color feature-based and traditional vision methods.
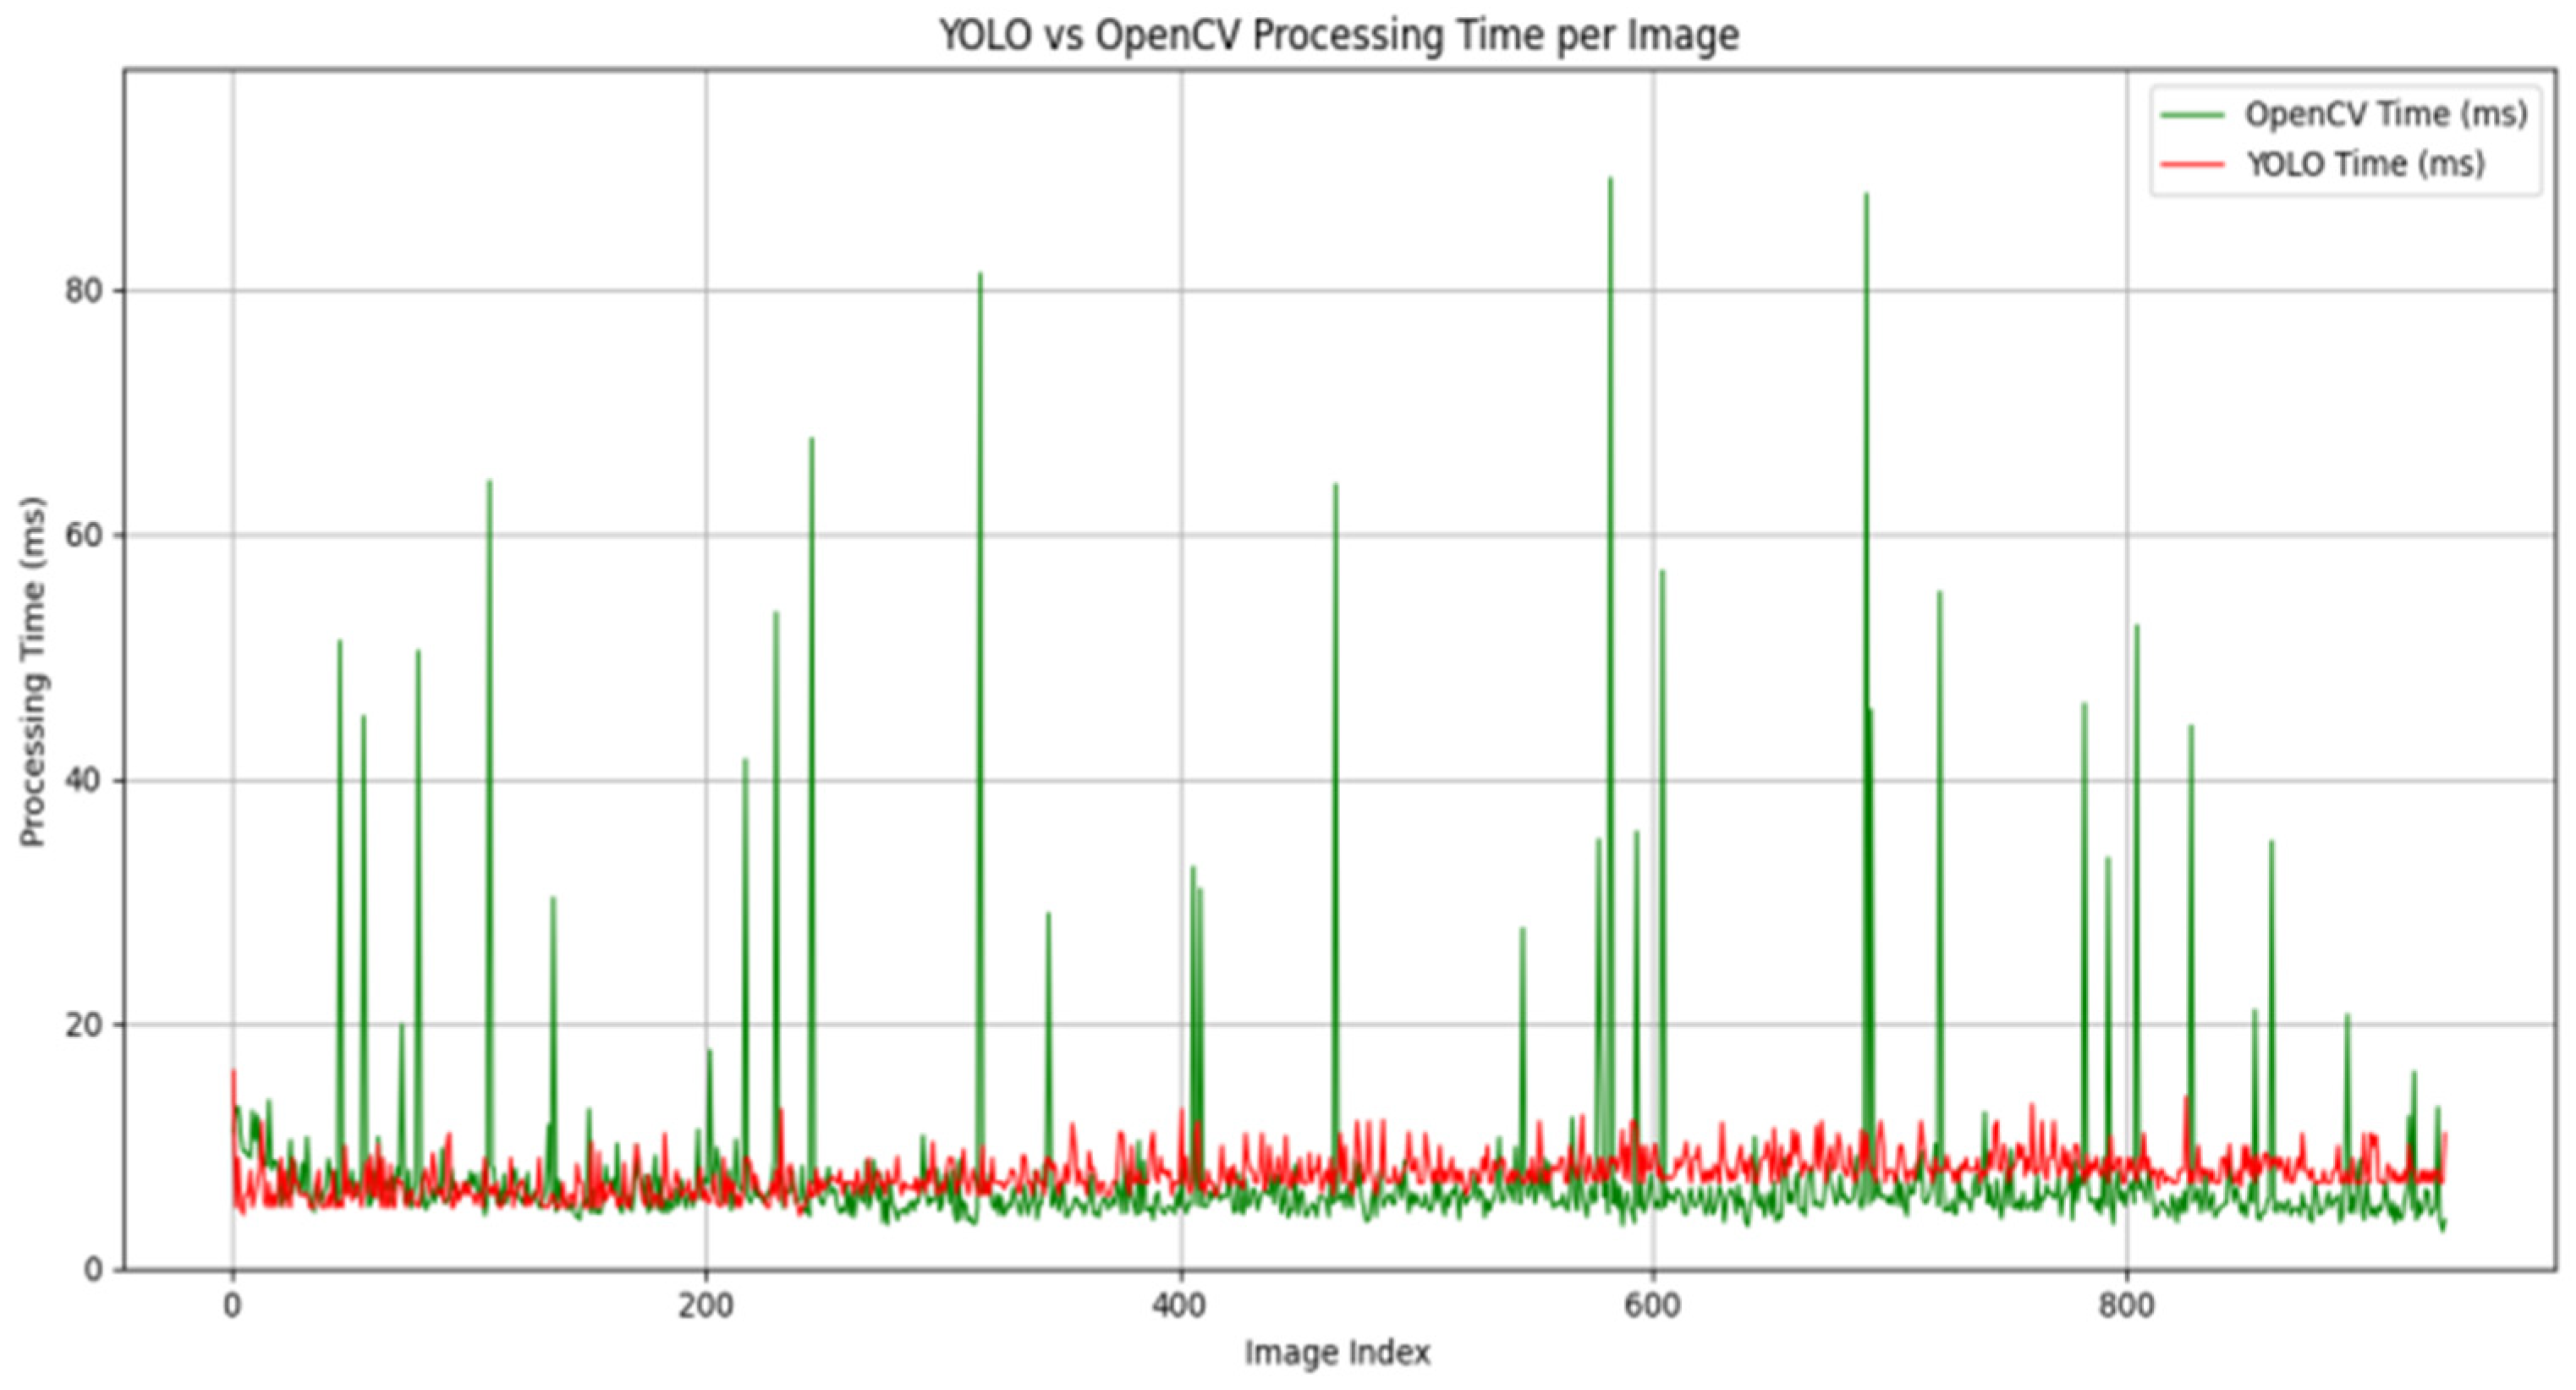
Figure 12 and Figure 13 compares the distribution of image processing times between the proposed algorithm implemented with OpenCV and YOLOv12n. The results show that the proposed algorithm exhibits shorter processing delays for most images, with the majority of processing times concentrated in the 5–9 ms range. Although latency fluctuations occur in a few complex images, they can be effectively optimized through techniques such as image enhancement and ROI constraints. Considering accuracy, speed, and resource consumption, the proposed algorithm demonstrates higher efficiency in license plate localization tasks, making it particularly suitable for scenarios with high real-time requirements.

6. Conclusions

This paper addresses the challenges faced by traditional license plate recognition systems in complex environments, such as low localization accuracy, high latency, and difficulties in deploying deep learning models. A fast license plate localization algorithm based on statistical color features is proposed. The algorithm integrates HSV color space analysis with morphological structure extraction, and employs a multi-feature joint filtering strategy—combining edge density, aspect ratio, and hue consistency—to achieve rapid localization of license plate regions. It is characterized by being lightweight, interpretable, and efficient.
In terms of algorithm design, an adaptive image-preprocessing framework was developed, incorporating mechanisms such as exposure compensation, contrast enhancement, white balance correction, and brightness adaptation. This significantly improves image quality and robustness under low-light conditions. During candidate region extraction and filtering, dynamic HSV mask generation and morphological cleaning are applied in conjunction with a statistical feature scoring method, effectively improving localization accuracy. The experimental results demonstrate that combining color statistical features with geometric features can significantly enhance license plate localization accuracy, consistent with the conclusions of Rezaei et al., who proposed a localization approach based on the fusion of multiple statistical features [13].
Comparative experiments with the YOLO12n model show that, while achieving comparable localization accuracy, the proposed algorithm exhibits a clear advantage in processing speed, making it particularly suitable for resource-constrained edge computing scenarios.
The experimental results indicate that the proposed algorithm achieves a localization accuracy of 93.7% in various complex environments, with an average processing time of only 9.52 ms, verifying its superiority in both real-time performance and robustness [14]. This work provides a practical and feasible design pathway for high-performance license plate localization algorithms.

Author Contributions

Conceptualization, H.G. and J.G.; methodology, H.G.; software, H.G. and J.W.; validation, M.L., X.T. and Y.X.; formal analysis, C.J.; investigation, R.H.; resources, H.X.; data curation, Z.W.; writing—original draft preparation, H.G.; writing—review and editing, H.G. and J.G.; visualization, Z.Z.; supervision, J.G.; project administration, J.G.; funding acquisition, J.G. All authors have read and agreed to the published version of the manuscript.

Funding

This research was funded by the Gongga Talent Development Program, Chengdu College of University of Electronic Science and Technology.

Data Availability Statement

The data presented in this study are available on request from the corresponding authors.

Conflicts of Interest

The authors declare no conflict of interest.

References

  1. Li, Z.Y.; Wang, J.X.; Dang, R.; Liu, C.; Li, C.; Shi, T.; Fang, B. Research on license plate detection based on OpenCV and CNN. J. Hebei Univ. Archit. Eng. 2022, 40, 189–192. [Google Scholar]
  2. Hinton, G.E.; Salakhutdinov, R.R. Reducing the dimensionality of data with neural networks. Science 2006, 313, 504–507. [Google Scholar] [CrossRef] [PubMed]
  3. Deb, K.; Kang, S.J.; Jo, K.H. A vehicle license plate detection method for intelligent transportation system applications. Cybern. Syst. Int. J. 2009, 7, 90–96. [Google Scholar] [CrossRef]
  4. Shashirangana, J.; Padmasiri, H.; Meedeniya, D.; Perera, C. Automated license plate recognition: A survey on methods and techniques. IEEE Access 2020, 9, 11203–11225. [Google Scholar] [CrossRef]
  5. Gao, M.Q. Low-light image enhancement algorithm based on Retinex and HSV color space. J. Guangdong Light Ind. Vocat. Tech. Coll. 2024, 23, 9–13. [Google Scholar] [CrossRef]
  6. Subhalakhsmi, K.; Siva Soundharam, V. Automatic license plate recognition system based on color features and vehicle tracking. Proc. Int. Conf. Eng. Res. Technol. (IJERT) 2018, 3, 123–128. [Google Scholar]
  7. Mahmood, Z.; Khan, K.; Khan, U.; Adil, S.H.; Ali, S.S.A.; Shahzad, M. Towards automatic license plate detection. Sensors 2022, 22, 1245. [Google Scholar] [CrossRef] [PubMed]
  8. Xu, F. Research and Implementation of License Plate Recognition Algorithm. Master’s Thesis, Yangzhou University, Yangzhou, China, 2020. [Google Scholar]
  9. Ma, X.F. Research on image dehazing based on the HSV-improved Retinex algorithm. J. Jingdezhen Univ. 2024, 39, 53–57. [Google Scholar]
  10. Wang, Y.R.; Zhou, F.X.; Chen, J.S.; Zheng, H.N. Research on license plate recognition system based on OpenCV and LSD. Inf. Comput. (Theor. Version) 2023, 35, 36–38+69. [Google Scholar]
  11. Huang, B. Research on Multi-License Plate Character Recognition Algorithm Based on Deep Learning. Master’s Thesis, Hefei University of Technology, Hefei, China, 2019. [Google Scholar]
  12. Yang, L. Research and Implementation of License Plate Recognition System Based on OpenCV. Master’s Thesis, Hunan University, Changsha, China, 2017. [Google Scholar]
  13. Rezaei, M.; Isehaghi, I. An efficient method for license plate localization using statistical features. In Proceedings of the RoboCup Symposium; Springer: Cham, Switzerland, 2019; pp. 1–6. [Google Scholar]
  14. Wang, L.Y.; Bai, J.; Li, W.J.; Jiang, J.Z. Research progress on YOLO series object detection algorithms. J. Comput. Eng. Appl. 2023, 59, 15–29. [Google Scholar]
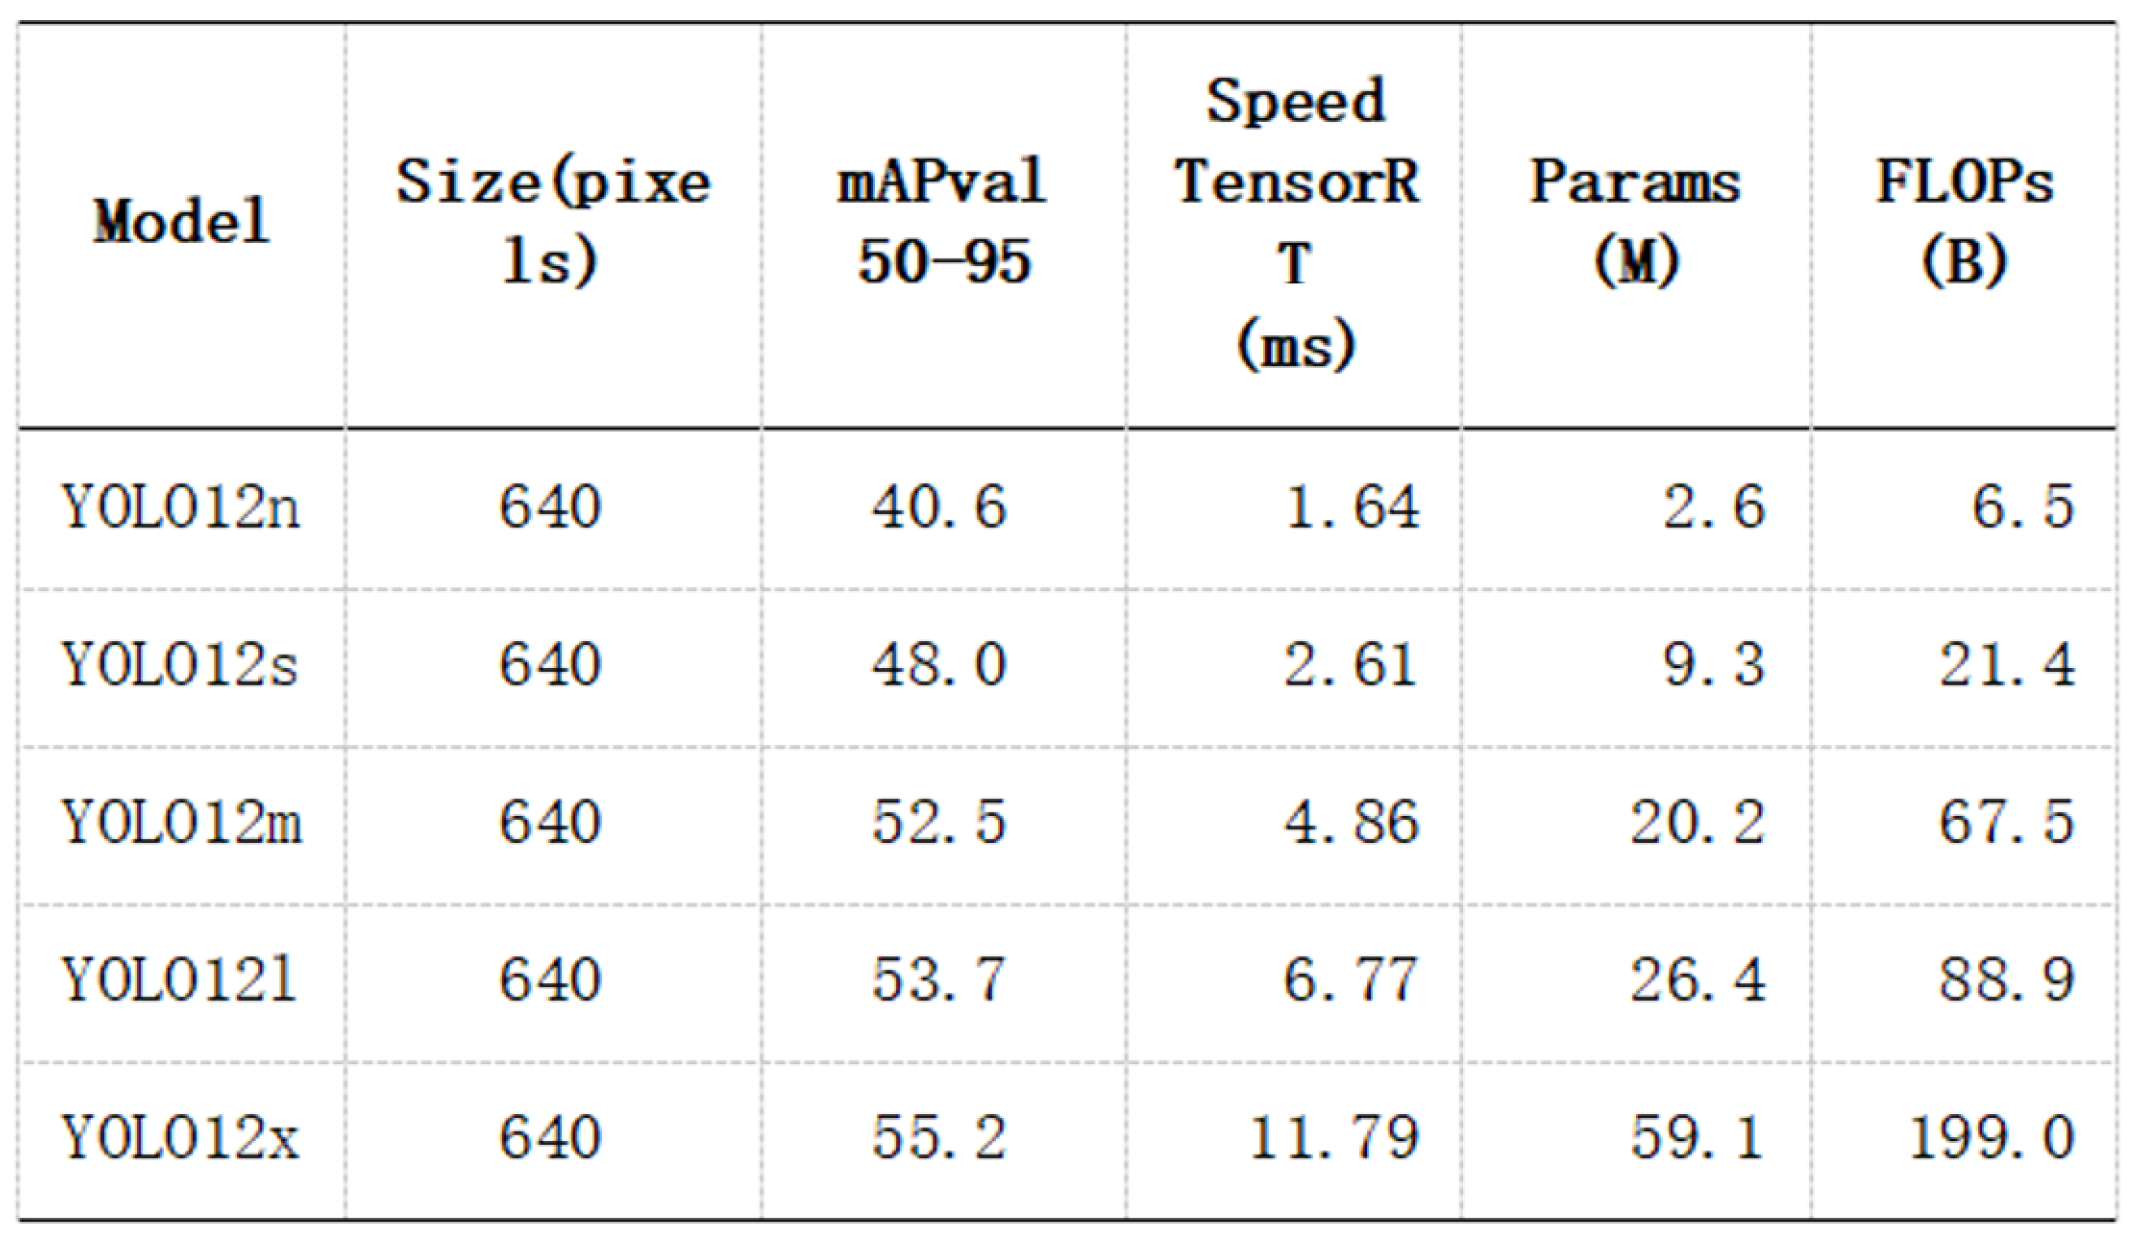
Figure 1. Performance metrics of TOLOv12n.
Electronics 15 02232 g001
Figure 2. System workflow diagram.
Electronics 15 02232 g002
Figure 3. Flowchart of the proposed adaptive license plate image preprocessing algorithm.
Electronics 15 02232 g003
Figure 4. Comparison between the original image and the stages of image enhancement processing.
Electronics 15 02232 g004
Figure 5. HSV H Channel Image and Hue Statistical Histogram.
Electronics 15 02232 g005
Figure 6. Color Comparison Between HSV, YCrCb, and YUV Space.
Electronics 15 02232 g006
Figure 7. Performance Comparison of HSV, YCrCb, and YUV Spaces.
Electronics 15 02232 g007
Figure 8. Effects of mask extraction and mask cleaning.
Electronics 15 02232 g008
Figure 9. Comparison of candidate box selection results for license plate regions.
Electronics 15 02232 g009
Figure 10. Final License Plate Region Recognition Result.
Electronics 15 02232 g010
Figure 11. Experimental Testing Dataset.
Electronics 15 02232 g011
Figure 12. Platform-Specific Localization Testing Results.
Electronics 15 02232 g012
Figure 13. Comparison of Single-Image Processing Time: OpenCV vs. YOLO.
Electronics 15 02232 g013
Table 1. Mask proportion processing strategy.
Percentage of Mask AreaProcessing Strategy
<0.5%Alternate strategy A
0.5~30%Main detection process
>30%Alternate strategy A
Table 2. Multi-round Dynamic Adjustment Strategy for Adaptive HSV Mask Extraction.
IterationCondition AnalysisFine-Tuning ActionsTrigger Mechanism
Initial IterationImage brightness estimationSet basic hue rangeDefault execution
Second IterationInsufficient mask area or abnormal connectivityHue threshold adjustment approx. ±5Mask area or area structure does not meet requirements
Third IterationThe second Iteration of adjustment is still invalidHue threshold adjusted to ±10The mask is still too small or too concentrated
Table 3. YOLOv12n comparison model deployment platform (Windows environment).
ConfigurationConfiguration Instructions
operating systemWindows 11 23H2
Processor (CPU)Intel(R)Core(TM) i7-13650HX
Graphics Processing Unit (GPU)Nvidia GeForce RTX 4060 Laptop
FrameworkTorch 2.1.0+cu121
CUDA13.0
Python3.12.11
Table 4. Comparison of YOLOv12n and the Metrics of This System.
IndexYOLOv12n (Windows Platform)This System
Positioning correction rate99.5%93.7%
Character recognition accuracy96.5%95%
Average processing time per sheet13.76 ms9.52 ms
Whether to rely on deep learning modelsYesNo
Disclaimer/Publisher’s Note: The statements, opinions and data contained in all publications are solely those of the individual author(s) and contributor(s) and not of MDPI and/or the editor(s). MDPI and/or the editor(s) disclaim responsibility for any injury to people or property resulting from any ideas, methods, instructions or products referred to in the content.