1. Introduction
The increasing use of digital payment systems has revolutionized the financial world, making transactions easier and more efficient. With this revolution, credit card usage has become the backbone of modern commerce, enabling easy payments for goods and services. However, the growth of these digital financial solutions has also been accompanied by a rise in credit card fraud, a persistent and costly problem in the financial sector [
1]. Fraudulent transactions not only bring about sizeable financial losses to financial organizations and card-issuing authorities, but also dilute the integrity of digital payments, which constitutes a significant danger to the growth and stability of the digital economy [
2]. In the contest against this challenge, fraud detection has progressed from traditional rule-based systems to more advanced techniques that include complex analytics and machine learning (ML) [
3]. Advanced analytics and ML are capable of processing enormous volumes of transactional data to detect subtle patterns, often not so obvious, which are characteristics of fraudulent behavior [
4,
5]. These capabilities enable systems based on ML to prevent and detect real-time fraudulent transactions, hence making them essential components of any financial system.
Efficient fraud detection systems are important in improving the security and reliability of payment transactions for both customers and financial institutions [
6]. The systems assist in reducing risks, avoiding unauthorized transactions, and maintaining trust in financial transactions. This reduces potential financial losses, enhances customers’ trust, and contributes to the broader goal of maintaining a secure digital financial ecosystem [
7]. Moreover, the scalability and adaptability of ML models make them ideal for dealing with the ever-growing volume and complexity of digital transactions in an increasingly interconnected world [
8].
Over the past few years, there have been many studies on this topic employing different methods, with ML being one of the leading methods. ML has some benefits for fraud detection, but it also has some challenges that need to be overcome. The primary challenge is the inherent imbalance of credit card transaction data; fraudulent transactions account for only a few percentage points of all transactions [
9]. This imbalance is detrimental to models because they may not learn properly and may give a high false positive rate, where legitimate transactions are reported as fraudulent. Fraudsters also keep updating their tactics, so models have to be updated frequently to be effective. The challenge is that models must be scaled and applied in real time, while maintaining a high level of accuracy and low latency.
In this regard, this study proposes the Voted Perceptron (VP) model to better address the abovementioned challenges and issues. The VP model successfully solves the most significant fraud detection issues, such as class imbalance, adaptability, and real-time operation [
10]. In contrast to conventional models that are hampered by imbalanced transaction data, it keeps several weight vectors and applies a weighted voting strategy, which guarantees that fraudulent transactions affect decision-making. Its online learning feature supports continuous weight updates, making it capable of adapting to changing fraud patterns without the need for full retraining [
11]. Moreover, as a computationally light linear classifier, it provides low latency and high precision, and is therefore highly effective for real-time fraud detection in dynamic financial conditions. The proposed model is evaluated and benchmarked on a publicly available dataset based on error rate and accuracy analysis, to provide a better understanding of the nature and performance of each employed model. The benchmark models include Average One Dependency Estimator (A1DE), K-nearest Neighbor (KNN), Naïve Bayes (NB), Random Tree (RT), and Functional Tree (FT).
1.1. Contributions of the Study
The study makes several important contributions to financial fraud detection with machine learning. It presents the Voted Perceptron (VP) model as a new method, utilizing an iterative learning process that dynamically adjusts decision boundaries based on misclassified instances. This adaptive learning mechanism improves the model’s performance in detecting fraudulent transactions better than conventional machine learning techniques. Second, the research undertakes extensive comparative analysis of various machine learning models, such as A1DE, KNN, NB, RT, and FT, on a set of performance metrics, in order to present a complete appraisal. Third, it tackles some fundamental issues in fraud detection, like class imbalance and overfitting, by presenting how a model like VP can enhance fraud detection without being biased in terms of class balance. Moreover, the research adds to methodological innovation in fraud detection through the incorporation of an ablation study, where the effects of various elements of the VP model are systematically examined, providing deeper insights into how effective the model is. Finally, the research yields significant implications for financial institutions by shedding light on the significance of adaptive machine learning methods in fighting emerging fraudulent schemes, and hence helping to develop more scalable and resilient fraud detection systems.
1.2. Insights of the Study
This research offers significant information on the efficiency of machine learning methods for detecting financial fraud, and it underlines the importance of adaptive learning in improving classification performance. The scientific findings highlight that classical models, including NB and tree-based classifiers, are not effective in dealing with class imbalance and rigid decision boundaries, and therefore are less efficient in detecting fraudulent transactions. Conversely, the VP model showcases the strength of iterative learning, whereby weight updates according to misclassifications facilitate improved generalization for intricate fraud patterns. The research also highlights the need to choose proper performance measures beyond accuracy, including MAE, RMSE, TPR, and recall, to conduct a well-rounded fraud detection ability assessment. The comparative study of various models highlights the importance of sound methods that strike an optimal balance between fraud detection accuracy and the reduction of false positives, which is imperative for real-world deployment in financial systems. In addition, the ablation study identifies the role played by various elements in the VP model, providing empirical evidence of how iterative weight updates play a key role in its higher performance. These results add to the wider research body by showing that models which are adaptive and revise dynamically are a better fit for actual real-world fraud detection situations, in which fraudulent activities keep changing. The findings of this study have strong implications for the financial technology industry, calling for the adoption of state-of-the-art machine learning techniques to boost security and reduce the risk of fraud.
The subsequent brief includes the research object, subject, statement, goal, and objectives.
1.3. Research Object
The broader system under study is financial transaction environments in capital market institutions, where fraudulent activities undermine security, trust, and financial integrity.
1.4. Research Subject
The specific focus is on adaptive machine learning-based models for detecting fraudulent financial transactions, particularly through the lens of the proposed Voted Perceptron (VP) model.
1.5. Research Statement
This study hypothesizes that an adaptive Voted Perceptron model, capable of iterative learning and decision boundary updates, can outperform conventional ML models in detecting financial fraud by addressing challenges such as class imbalance, evolving fraud patterns, and real-time processing requirements.
1.6. Research Goal
The goal of this study is to develop and validate a robust, scalable, and adaptive ML framework that enhances the detection accuracy of fraudulent financial transactions in real-world financial datasets.
1.7. Research Objectives
To propose and implement the Voted Perceptron (VP) model for fraud detection.
To benchmark the VP model against established ML models (A1DE, KNN, NB, RT, FT) using performance metrics including MAE, RMSE, TPR, recall, and accuracy.
To address challenges in fraud detection, such as class imbalance and adaptability to changing fraud patterns.
To validate the model through cross-validation and ablation studies for deeper insights into the effectiveness of model components.
To contribute toward developing efficient, real-time fraud detection mechanisms for financial institutions.
The rest of this study is organized as follows:
Section 2 presents the related work, which summarizes previous research on fraud detection models and their drawbacks.
Section 3 describes the methodology and the proposed VP model and benchmark models, dataset description, and evaluation metrics.
Section 4 offers results analysis and discussion to provide an overall performance analysis of models with the help of statistical evaluations and findings. Lastly,
Section 5 concludes the research with major findings and presents possible avenues for future research in detecting financial fraud.
2. Related Work
The ability of the algorithms to scan data, look for complex patterns, and make predictions about fraud activities makes them an essential component in credit card fraud detection. There are supervised and unsupervised learning types. The commonly used models include Logistic Regression (LR), Support Vector Machines (SVM), KNN, NB, Decision Trees (DT), Random Forest (RF), and Tree-Augmented NB (TAN). These models utilize distinct strategies to achieve successful fraud detection. For example, SVM utilizes a hyperplane to classify the data [
12], KNN classifies based on proximity to the K-nearest neighbors, and NB uses probabilistic methods for estimating class probabilities. Similarly, DT is a tree-based classifier based on feature constructors [
13], RF controls overfitting using multiple decision trees [
14], and TAN improves NB using tree-like dependencies to capture feature inter-relations [
15]. The two combined offer aggressive solutions for fraudulent transaction identification.
Tiwari and others [
16] compared the performance of SVM, ANN, Bayesian Networks, KNN, Hidden Markov Models, Fuzzy Logic Systems (FLS), and DT on the KDD CUP 99 Intrusion Dataset. ANN had the highest accuracy, at 99.71%, followed by Bayesian Networks with 97.52% and Fuzzy Logic Systems with 97.93%, while SVM and DT had scores of 94.65% and 94.7%, respectively. Naik and others [
9] examined algorithms such as NB, J48, LR, and AdaBoost on a small dataset of 1000 transactions. LR and AdaBoost obtained 100%, whereas NB and J48 obtained 83% and 69.93%, respectively. However, the small size of the dataset limited how well the results could be applied in general. Karthik et al. [
4] developed a new model based on combining bagging and boosting methods. Their model utilized AdaBoost for feature engineering. The performance metrics, such as AUPR, improved on the Brazilian bank and UCSD-FICO datasets, though with small improvements, 58.03–69.97% and 54.66–69.40%, respectively.
Sahithi et al. [
1] proposed the Weighted Average Ensemble model by combining LR, RF, KNN, AdaBoost, and Bagging for evaluation using the European Credit Card Company dataset. The model was able to obtain an accuracy of 99% as compared to individual algorithms like RF Bagging (98.91%), LR (98.90%), AdaBoost (97.91%), KNN (97.81%), and Bagging (95.37%). Unfortunately, reproducibility is limited, as there is no explicit feature selection. Qaddoura et al. [
17] worked on imbalanced datasets using oversampling techniques like SMOTE, ADASYN, and SVM oversampling. Their work on algorithms like RF, LR, NB, KNN, SVM, and DT indicated that oversampling might help in improving performance, but had a corresponding challenge of high computational overhead in real-world applications.
Although these algorithms provide unique advantages, the choice depends on several factors, such as the size of the dataset, computational requirements, interpretability, and the presence of imbalanced data. Various strategies have been proposed to optimize performance in this domain. For instance, Prasad Chowdary et al. [
18] developed an ensemble method that optimized model parameters and integrated deep learning to minimize false negatives and improve the accuracy of detection. Their work used DT, Gradient Boosting Classifier (XGBoost), LR, RF, and SVM, with DT achieving 100% recall, which was higher than other models such as XGBoost (85%), LR (74.49%), RF (75.9%), and SVM (69%). However, the paper reported lower performance across some evaluation metrics.
Raghavan and others [
19] studied fraud detection using data from Australia, Germany, and Europe. They used methods like SVM, KNN, and RF, and combined them with CNN. SVM achieved the best accuracy, at 68.57%, which was better than that of RF, at 64.37%, and KNN, at 60.47%. However, the overall performance was still low. Saputra and others [
20] tested Neural Networks, RF, NB, and DT on the Kaggle dataset, dealing with imbalanced data using SMOTE. Neural Networks achieved the highest accuracy, at 96%. RF and NB both had 95%, and DT had 91%.
Tanouz et al. [
21] investigated ML methods for fraud classification. They reported that RF obtained 96.77% accuracy, which was better than that of LR (95.16%), NB (95.16%), and DT (91.12%). They emphasized the effectiveness of RF, but pointed out the lack of feature selection as a drawback. Ruttala et al. [
22] compared RF with AdaBoost. The results showed that RF performed better in terms of precision, recall, and F1 score. However, the dataset was not balanced. Sadgali and others [
23] studied SVM, Bayesian Belief Networks, NB, Genetic Algorithms, Multilayer Feed Forward Neural Networks, and CART. They found that NB was the most accurate, at 99.02%, followed by SVM, at 98.8%, and Genetic Algorithms, at 95%. Their focus was on insurance fraud.
Overall, ML models, especially models like RF, ANN, and ensemble methods, have shown high accuracy in fraud detection, but face challenges like data imbalance, feature selection, and computational complexity. Oversampling techniques improve detection, but negatively impact efficiency. Future research should focus on scalable, real-time models with effective preprocessing and low falsity rates.
3. Research Design and Procedure
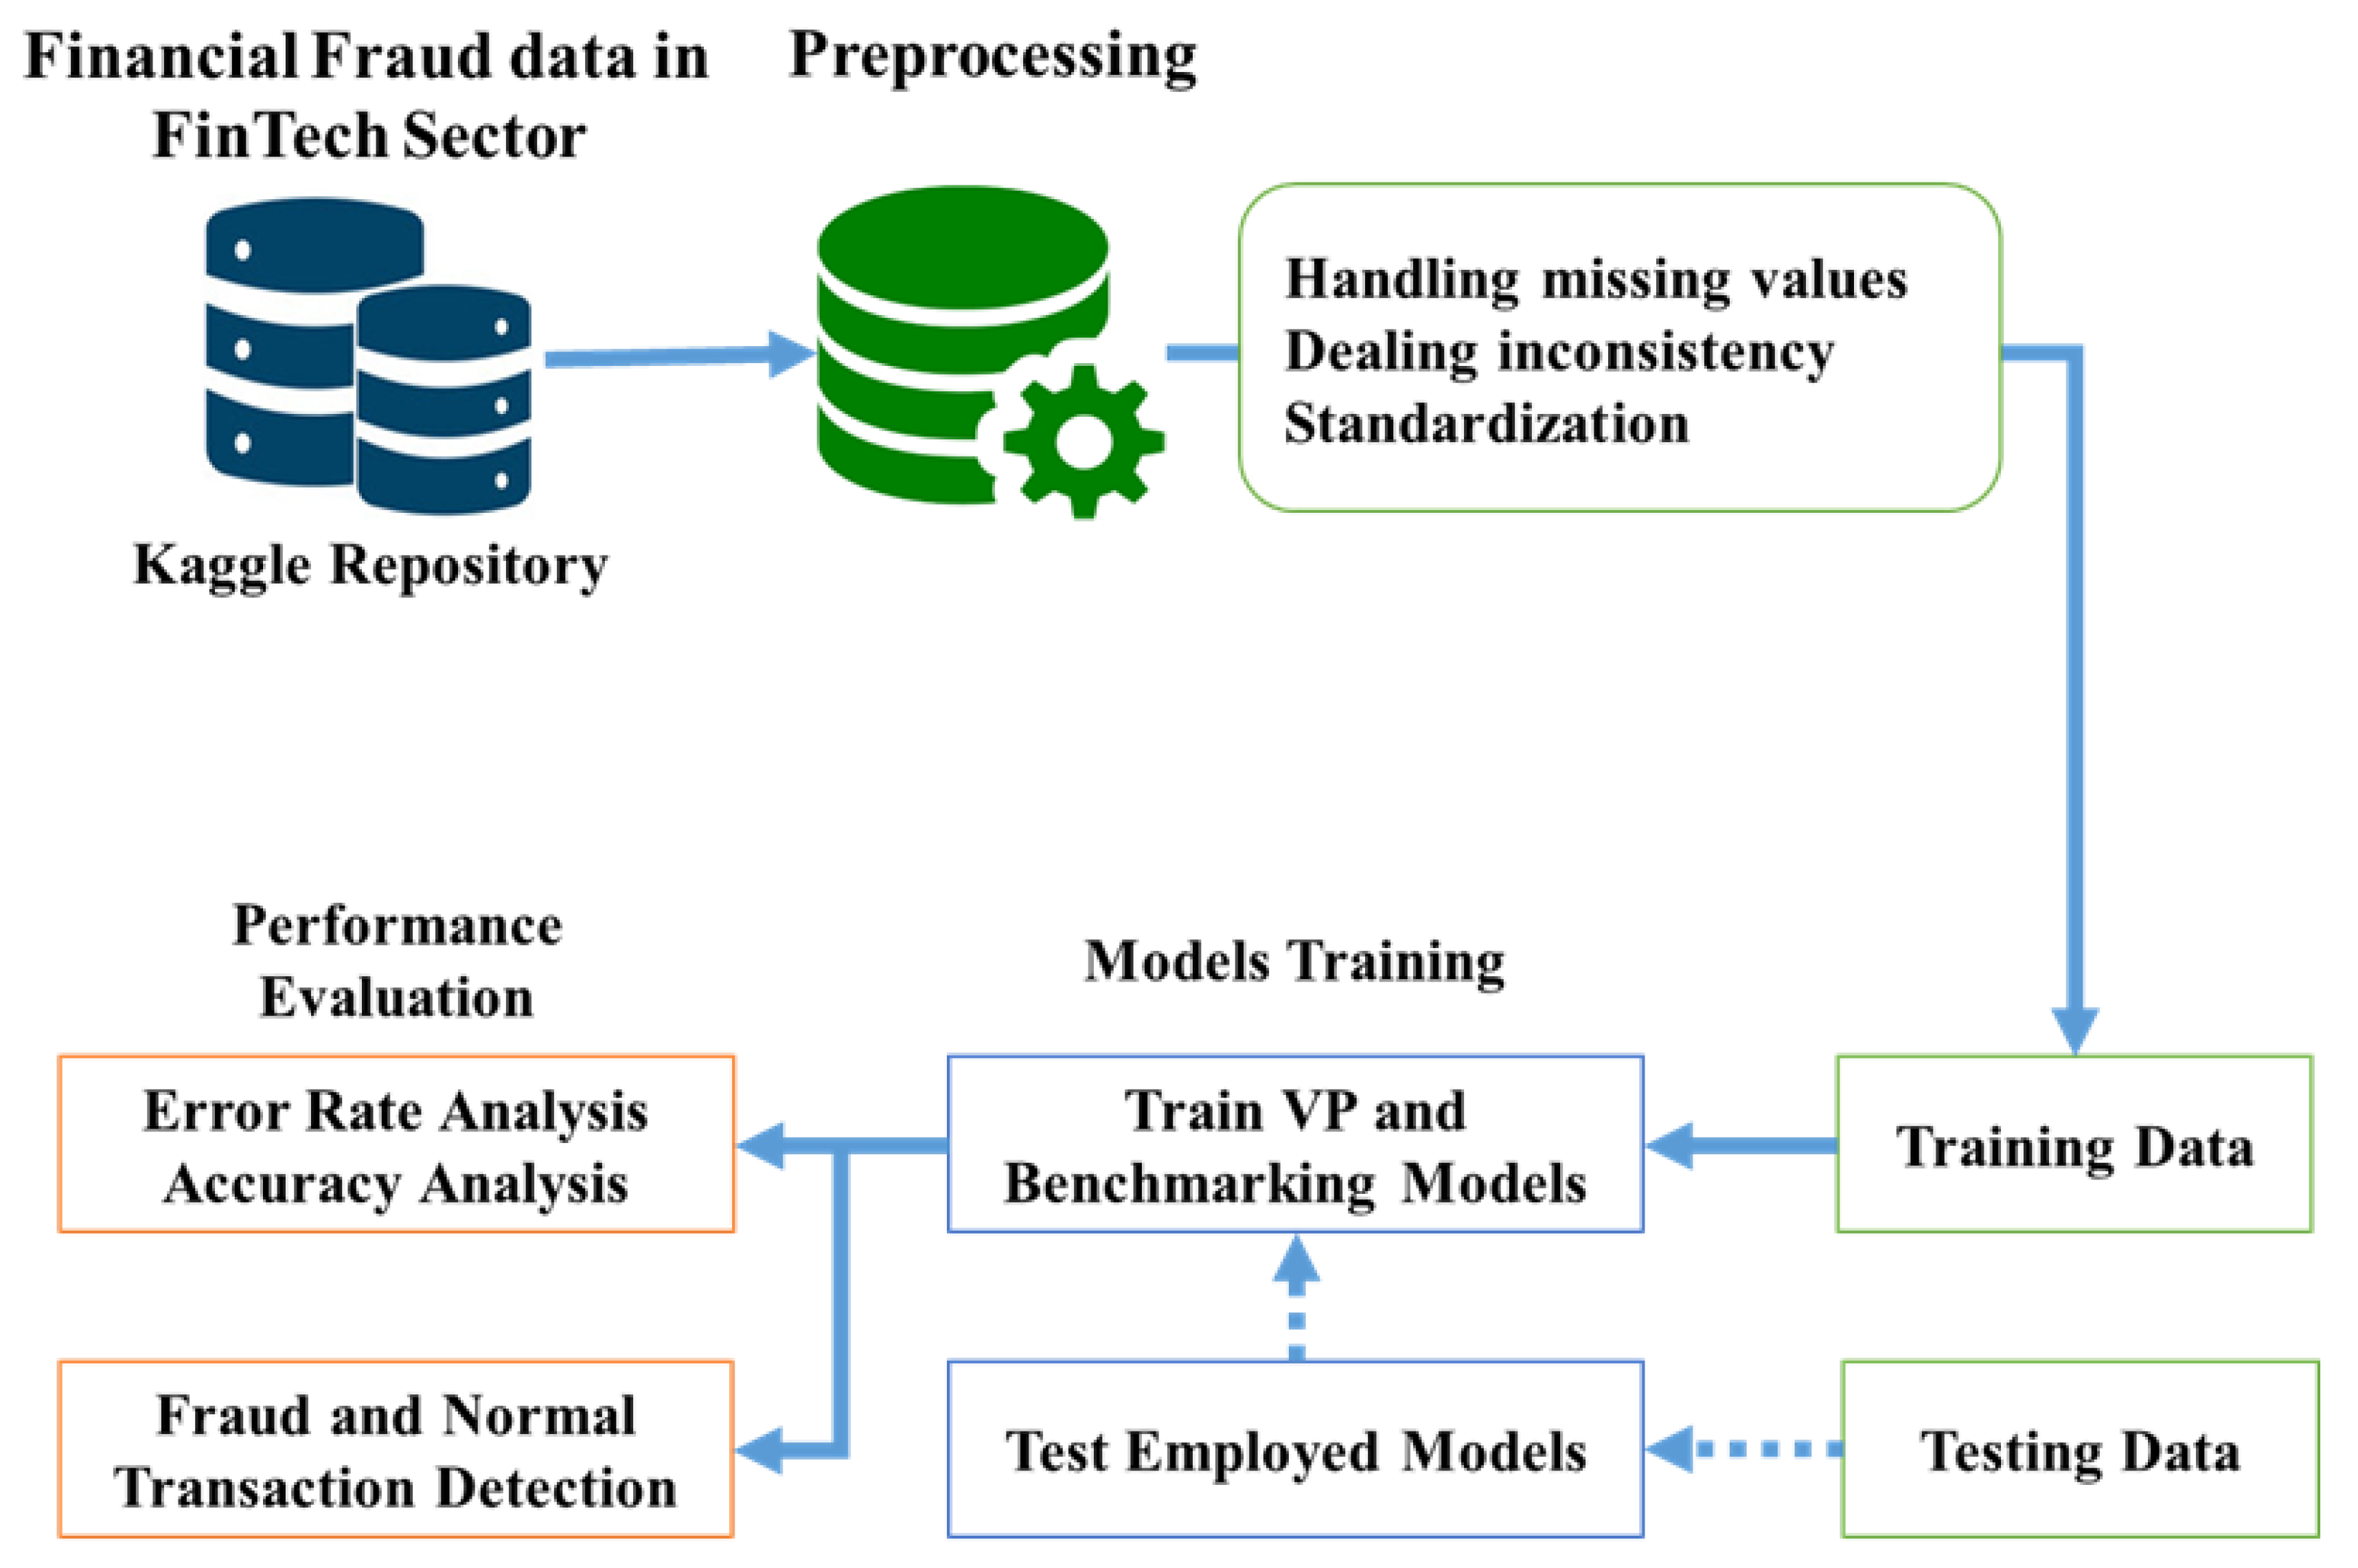
The study utilizes an ML-oriented method of detecting fraud in capital market organizations using the VP model. The dataset for evaluation is sourced from the Kaggle repository, which includes transaction history with labeled instances of fraudulent and genuine transactions. The data are preprocessed to deal with inconsistency, missing values, and class imbalance to enhance the reliability of the model. Standardization and normalization methods are used where needed to achieve uniformity across features, maximizing the VP model’s effectiveness. The VP algorithm is used as the primary classifier, incrementally updating weight vectors from misclassifications and tracking vote totals for every weight vector. The model is trained in several iterations, dynamically updating weights to enhance classification accuracy. The training algorithm ensures that the classifier is capable of learning complex patterns in financial transactions to distinguish fraudulent activities from genuine ones. The effectiveness of the model is evaluated based on the important performance metrics, namely accuracy and error rate, for an overall determination of its forecasting capability. A comparative analysis of the VP model with other common ML models was carried out to establish its efficiency. The overall summary of our research methodology is presented in
Figure 1.
3.1. Data Description and Preprocessing
Several preprocessing steps were employed to prepare the data for successful fraud detection modeling. These preprocessing steps involved missing data handling, inconsistency handling, and feature standardization, which are further discussed below.
Missing data can introduce biases and reduce the efficiency of machine learning models. To address this, we employed the following strategies:
a. Handling Missing Values
Define a missing indicator function for each data point
:
The total missing values in a feature
are
where
is the number of observations.
- ○
Numerical Features: For features with continuous values, we replaced missing entries with the median of the respective feature. The median is less sensitive to outliers compared to the mean. Mathematically, for a feature
, the imputed value
is
where the median is
- ○
Categorical Features: For features with discrete categories
, missing values were filled with the mode, i.e., the most frequently occurring category:
where
is the frequency count of category
.
b. Dealing with Inconsistencies
Data inconsistencies can arise from various sources, such as data entry errors or integration from multiple systems. We addressed these inconsistencies through the following strategies:
Standardizing Categorical Values: We ensured uniformity in categorical data by converting all text to lowercase and trimming whitespace. For example, entries like “Fraud” and “fraud” were standardized to “fraud”. To do this, we normalized text cases and removed extra spaces:
Let
be the dataset. A duplicate record satisfies the following:
Duplicate rows were removed to maintain unique records.
An observation
is considered an outlier if
c. Standardization
Standardization is crucial for ensuring that features contribute equally to the model, especially those that rely on distance metrics. We applied the following standardization techniques:
Scaling Numerical Features: We transformed numerical features with a mean of 0 and a standard deviation of 1. For a feature
with mean
and standard deviation
, each value
was standardized as
where
is the mean of feature
, and
This transformation ensures that the feature’s distribution aligns with a standard normal distribution.
Encoding Categorical Variables: We converted categorical variables into numerical representations using One-Hot Encoding. For a categorical feature with n unique categories, this resulted in n binary features. For instance, a feature “Transaction Type” with categories {“Online”, “In-Person”} was transformed into two features:
- ○
“Transaction Type Online” (1 if “Online”, 0 otherwise)
- ○
“Transaction Type In-Person” (1 if “In-Person”, 0 otherwise)
For categorical features, we used One-Hot Encoding. Let a categorical variable
have
unique categories:
Each category is transformed into a binary vector representation:
where
3.2. Model Training and Performance Evaluation
During our study on fraudulent detection in financial institutions, we utilized 10-fold cross-validation to provide a robust model, but minimize overfitting and bias. We divided our dataset into 10 equal folds, where in each iteration, we used 90% data for training and the remaining 10% for testing. This way, every data point was employed for both training and validation across various runs. Lastly, the final model performance was calculated as the average of all folds, which reduced variation and increased generalization. We chose 10-fold cross-validation because it provides a balanced trade-off between computational efficiency and performance reliability, ensuring a more generalized model resistant to overfitting. Additionally, this method is particularly effective for handling class imbalance, which is common in fraud detection datasets, as stratified sampling ensures that each fold maintains the original class distribution.
We performed an error rate analysis of the model’s predictive ability based on the Mean Absolute Error (MAE) and Root Mean Squared Error (RMSE). We performed an accuracy analysis based on the True Positive Rate (TPR), recall, precision, F-measure, and accuracy for evaluating the performance of the classification. Mathematically, these measures can be presented as follows:
The MAE measures the average magnitude of errors between predicted (
) and actual (
) values:
where
is the number of observations,
,
is the total number of observations in the dataset,
is the predicted value, and
is the actual value.
The RMSE quantifies the standard deviation of predicted errors, penalizing larger errors more than the MAE:
The TPR, which is also known as recall, represents the proportion of actual fraud cases correctly identified:
where TP (true positive) presents the correctly predicted fraud cases, and FN (false negative) presents the fraud cases that are incorrectly classified as non-fraud.
Accuracy measures the overall correctness of the model’s predictions:
Here, FP (false positive) represents non-fraud cases misclassified as fraud, and TN (true negative) represents correctly predicted non-fraud cases.
Precision measures the proportion of correctly predicted fraud cases (TP) out of all cases predicted as fraud (TP + FP).
The F-measure is the harmonic mean of precision and recall. It provides a single metric that balances both false positives and false negatives.
3.3. Proposed Model (Voted Perceptron)
VP is a variation of the basic perceptron algorithm, developed by Freund and Schapire (1999). It enhances the basic perceptron by maintaining more than one weight vector (hypotheses) rather than a single one, resulting in improved generalization. Each weight vector receives a vote, and a weighted majority rule makes decisions. The VP algorithm is a generalization of the basic perceptron learning algorithm that enhances classification by holding numerous weight vectors and voting on each one.
Given a dataset
where each
represents a feature vector and
is the corresponding class label, the VP algorithm starts with initial weight vector
and an associated vote count
. The index
is initialized to 1 to track the stored weight vectors.
During training, the algorithm iterates through the dataset multiple times (epochs). For each training instance
, it computes the predicted label using the dot product of the current weight vector
and the input
, given by
If the prediction is incorrect, meaning
, the algorithm updates the weight vector using the update rule:
A new vote count is assigned to the new weight vector, and the index is incremented. However, if the prediction is correct, the vote count of the current weight vector is simply increased with . This process continues for the given number of iterations
After training, the final classification of a new instance
is determined using a weighted majority vote across all stored weight vectors. The predicted class is computed as follows:
where
is the dot product between the
m-th weight vector and the input instance.
gives the predicted label (+1 or −1) from that weight vector,
is the vote count indicating how many correct predictions that weight vector made during training, and
is the total number of weight vectors stored.
Each weight vector contributes to the final decision based on its associated vote count. This voting mechanism helps the model to generalize better, making it more robust than the standard perceptron algorithm. The overall pseudocode of the VP algorithm is presented in Algorithm 1.
| Algorithm 1: Pseudocode for Voted Perceptron |
Input:
Output:
1. Initialize
2. For do:
3. For each do:
4. Compute predicted label:
(A1)
5. If (misclassification) then:
6. Update weight vector:
(A2)
7. Set vote count:
8. Increment
9. Else:
10. Increase vote count:
(A3)
11. Return
Prediction:
12. Given a new instance :
13. Compute final prediction:
(A4) |
In our implementation of the VP algorithm, we used 100 iterations
, ensuring sufficient passes over the dataset for convergence. The learning rate was set to 1
, meaning weight updates followed the rule
whenever a misclassification occurred. Each weight vector
maintained a vote count
, where correctly classified instances increased it as
, contributing to the final decision using the weighted majority rule:
We used a linear kernel to handle linearly separable data. Additionally, a random seed of 42 was set to ensure reproducibility, affecting the order of training instances and possibly influencing model performance. The model continued updating weights until 100 iterations had been completed or the updates stabilized.
3.4. Benchmark Models
This study proposes a new VP method for credit card fraud detection in financial dataset analysis. To conduct a proper and informative evaluation of the proposed VP model, five benchmark models were chosen: A1DE, KNN, NB, RT, and FT, as shown in
Table 2. These models were chosen based on several criteria. To begin with, they are extensively used in research on financial fraud detection, and serve as well-known baselines in academic and empirical research. The second reason is that these models present a varied spectrum of algorithmic paradigms, such as probabilistic models (A1DE and NB), instance-based learning (KNN), and tree-based decision rules (RT and FT). This variety provides us with an opportunity to compare the VP model with various paradigms of learning and indicate its relative merits. Third, the models vary in how they address imbalanced data, flexibility, and computational complexity issues that are paramount in real-time fraud detection settings. Fourth, they are renowned for their computational efficiency and scalability, which makes them appropriate for real-world use, especially in financial contexts where latency and interpretability are important. Finally, the models are well-supported by popular ML libraries like WEKA and Scikit-learn, making them reproducible and easy to compare. Comparing the VP model with this balanced collection of classifiers offers a solid and equitable performance standard that captures both theoretical diversity and real-world usability.
4. Results Analysis and Discussion
This study aims to detect fraud in financial technology. To this end, it proposes the VP model and contrasts its performance with conventional machine learning models, including A1DE, KNN, NB, RT, and FT. Performance is measured in terms of error rate and accuracy.
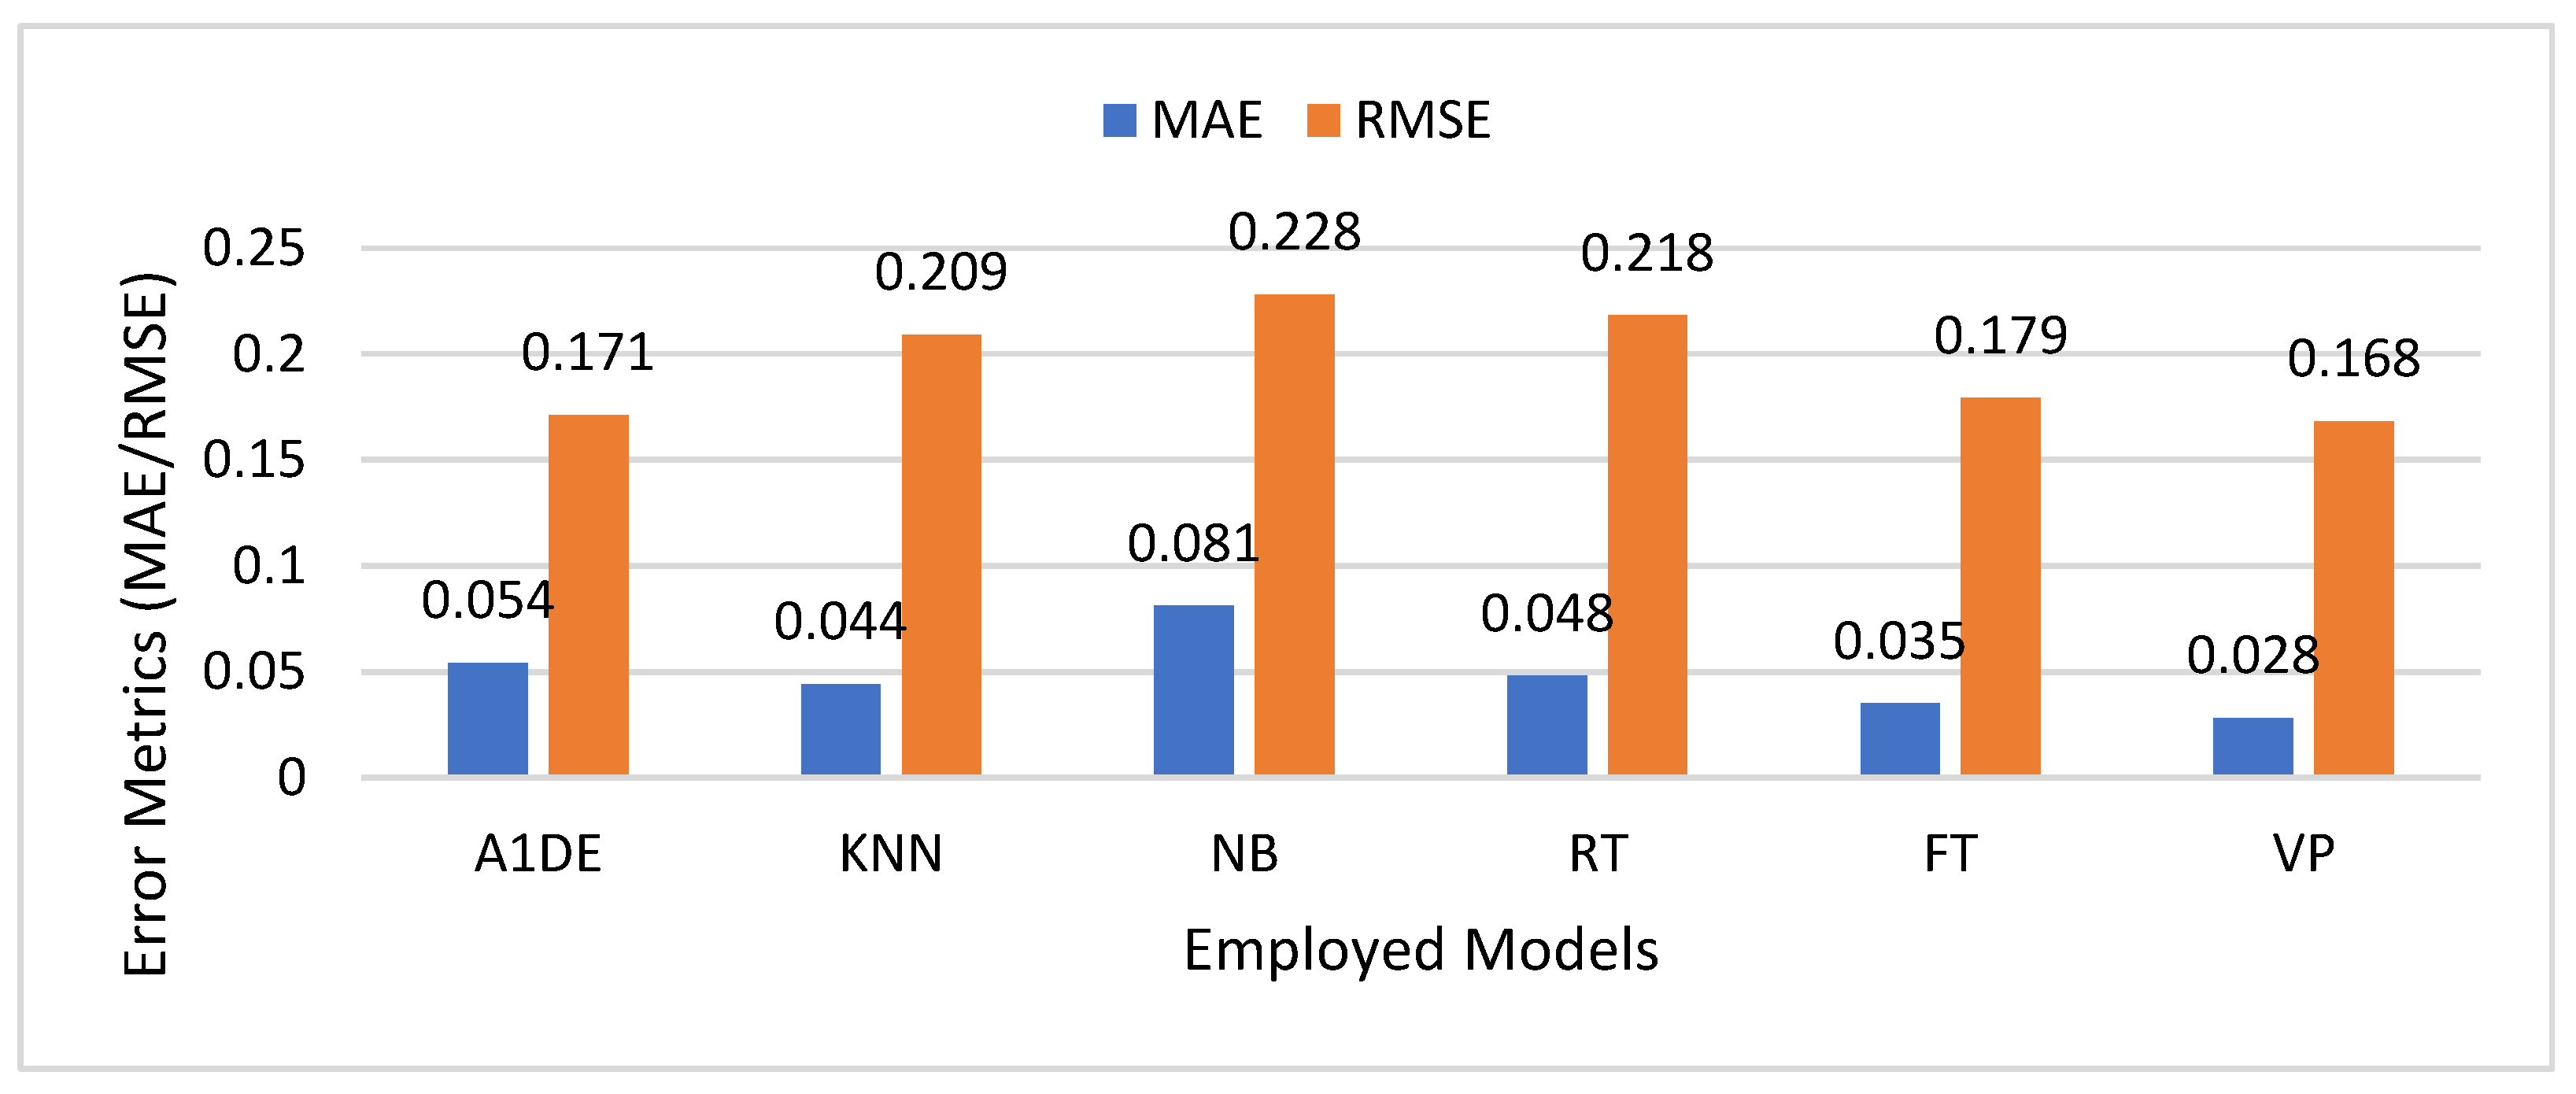
Figure 2 presents the evaluation of the proposed model against benchmark models of fraud detection employed in financial technologies, with the MAE and RMSE as model performance indicators. The MAE is the mean magnitude of the prediction errors, and the RMSE is an indicator of the spread of errors, where greater deviations are more severely penalized compared to the MAE. The lower the values of the two indicators, the better the model performance. Among the models under consideration, the VP model has the minimum MAE (0.028) and RMSE (0.168), indicating better accuracy and reliability in fraud detection. This is in contrast to the NB model, with the highest MAE (0.081) and RMSE (0.228), indicating relatively weak predictability. Other models, including A1DE, KNN, RT, and FT, have average performance, with FT indicating relatively strong performance (MAE = 0.035, RMSE = 0.179). The overall evaluation indicates the efficiency of the VP model in error minimization as a potential method of fraud detection in financial applications.
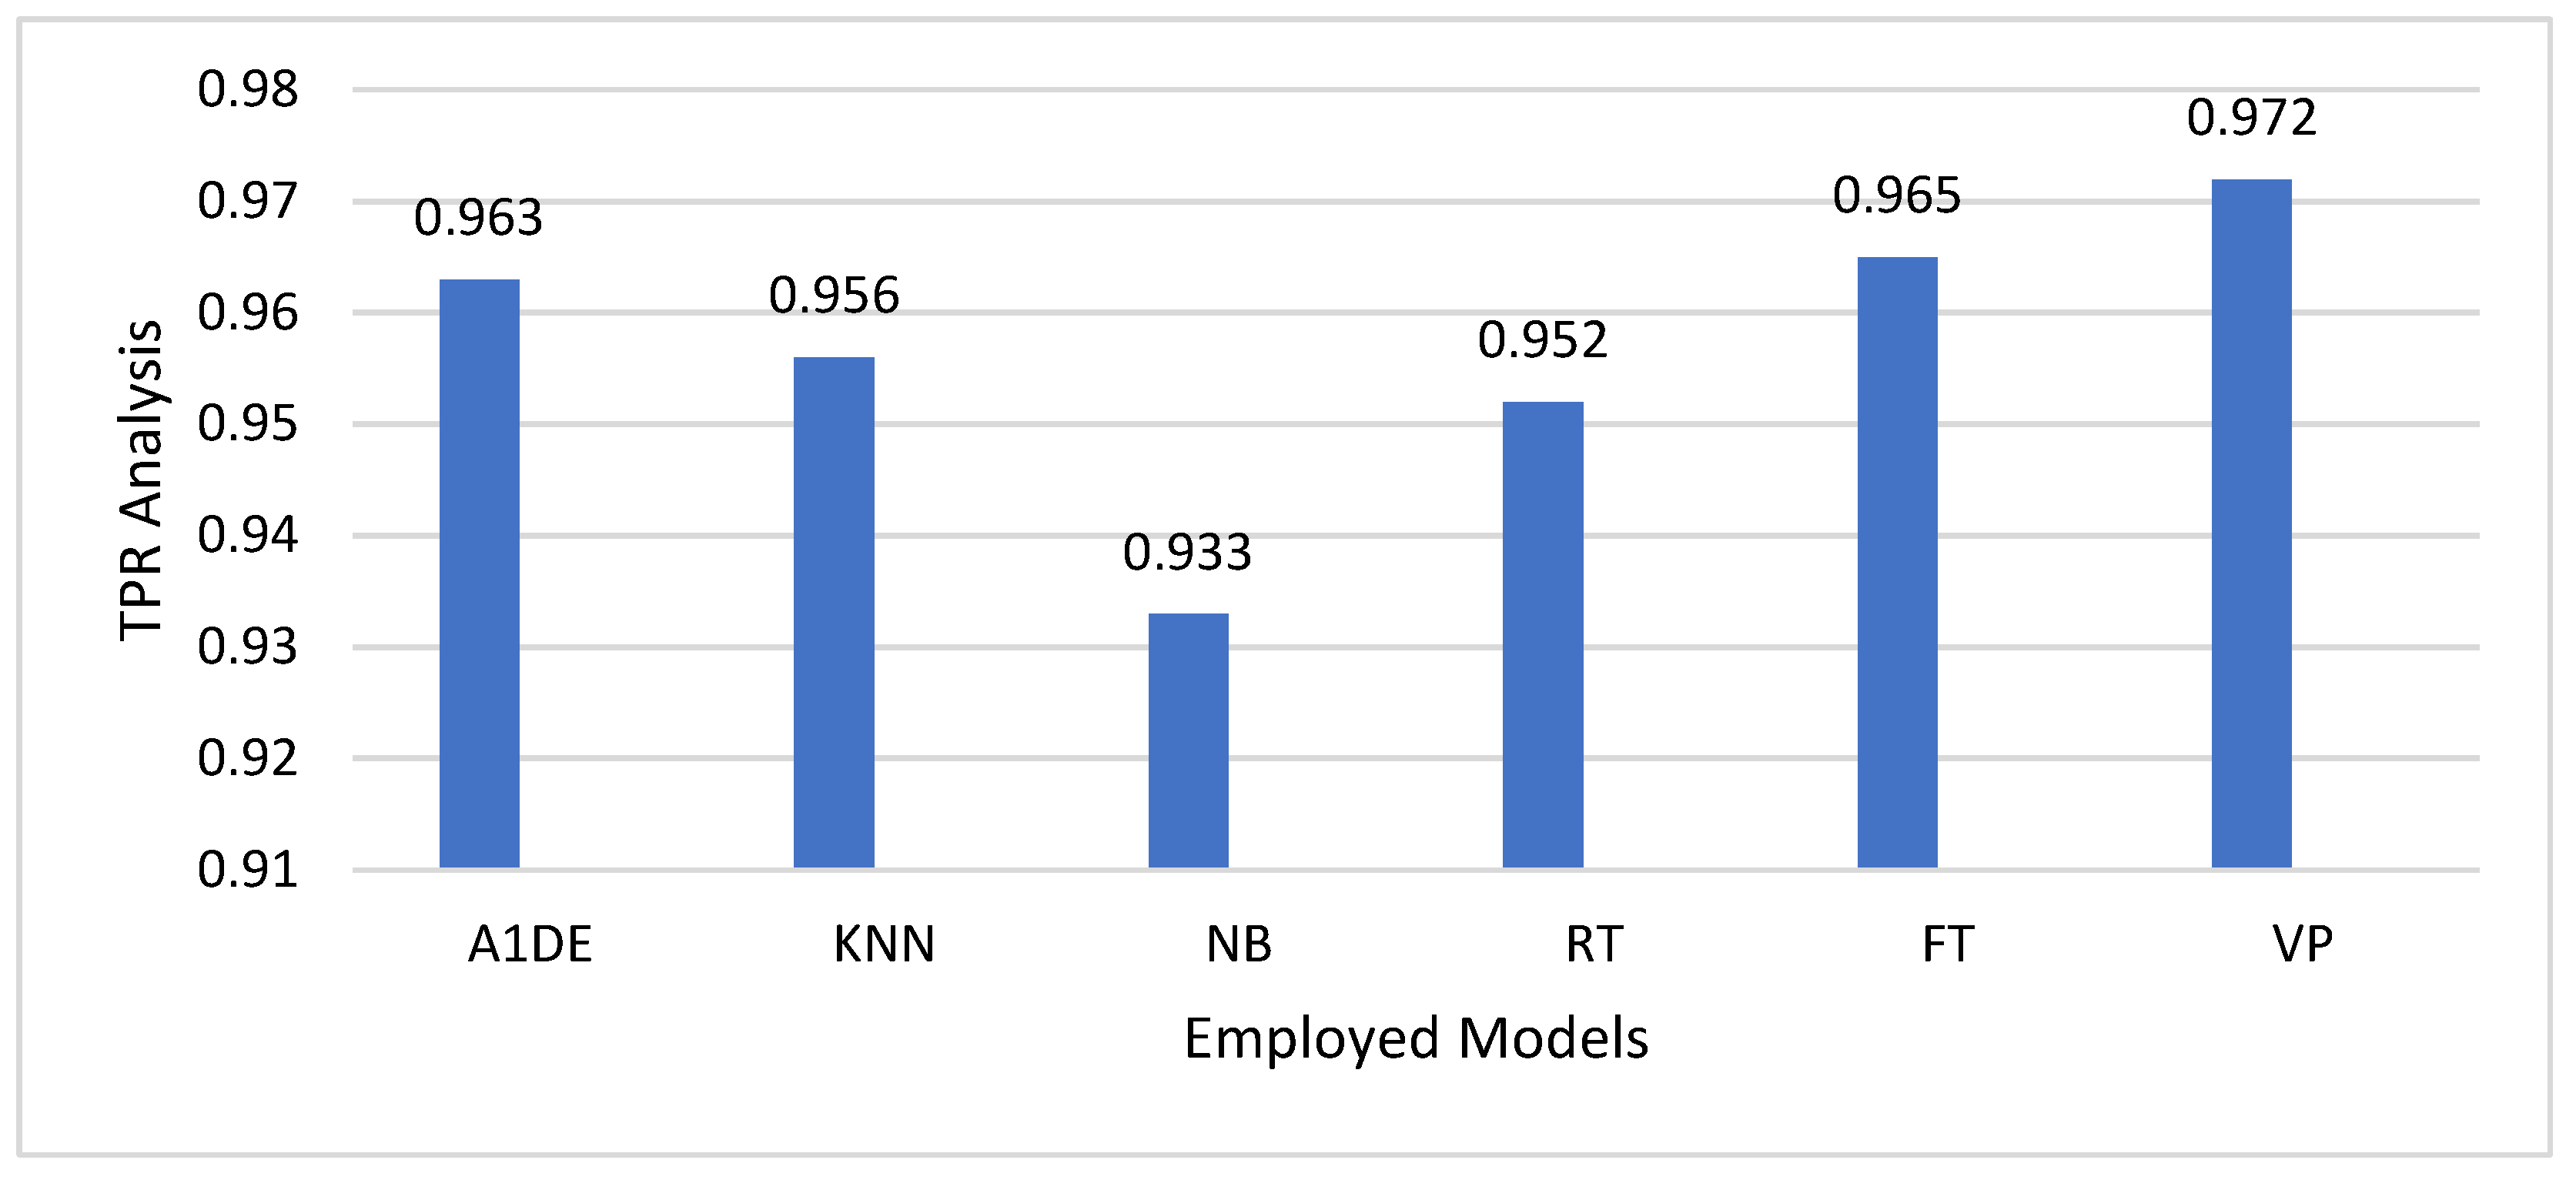
Figure 3 compares models applied to fraud detection in financial technology in terms of their TPR. The analysis shows that the VP model has better values of TPR (0.972), which indicates that it performs better as compared with other models employed in fraud case detection. The FT model (TPR = 0.965) and the A1DE model (TPR = 0.963) also exhibit good fraud detection potential. The KNN (0.956), RT (0.952), and NB (0.933) models show a relatively low TPR, reflecting a relatively diminished capability to detect fraudulent transactions. Although a high TPR is preferable for fraud detection, it has to be traded off against other measures, like the FPR, so that the model does not over-classify genuine transactions as fraudulent. This study emphasizes the VP model’s better fraud detection ability, but more analysis with other performance measures is needed to determine its overall performance and real-world applicability in financial fraud detection systems.
Figure 3 also presents the same results achieved through recall-based comparison, as the TPR in
Figure 3 is mathematically identical to the recall. This equivalence is typical in binary classification tasks like fraud detection.
We employed recall-based comparative analysis of the models employed for fraud detection in financial technologies. Recall indicates the ratio of true fraudulent transactions identified by the model. A higher recall implies a better capacity to detect fraud cases without excessive false negatives, which is essential in financial fraud detection in order to avoid undetected fraudulent activities. In the tested models, the VP model has the best recall of 0.972, meaning it has a better ability to detect fraudulent transactions than other models. The FT (0.965) and A1DE (0.963) models also have good recall values, implying that they are good at detecting fraud. KNN (0.956), RT (0.952), and NB (0.933) show slightly poor recall, implying that they can miss some fraudulent cases that VP can pick up.
The better performance of the VP model can be explained based on its iterative learning mechanism, which enables it to modify decision boundaries adaptively based on misclassified instances. In contrast to conventional models that use fixed decision rules, VP updates its weight parameters continuously, so it learns better to separate fraudulent and genuine transactions. Such flexibility helps VP to learn intricate patterns in financial fraud data better than rigid models such as NB or tree-based models (RT, FT). VP is also less susceptible to overfitting than instance-based models such as KNN, which can be vulnerable to high-dimensional financial fraud data.
Figure 4 shows a comparative study of the employed models, in terms of their precision and F-measure values for detecting fraud in financial technologies. Of the models tested, VP performs best, with a precision and F-measure of 0.972, which reflects its better capacity to detect fraudulent transactions accurately, while keeping false positives and false negatives to a minimum. A1DE and FT have equally strong and balanced performance, and can be good substitutes. NB has high precision (0.961), but a lower F-measure of 0.945, indicating that it might perform poorly in recall, and hence miss out on some fraud cases. The KNN and RT models are decent, but not as good as the best model. In general, the findings identify VP as the most efficient model to achieve strong and precise fraud detection in financial systems, highlighting its applicability to be implemented in real-world fintech settings, where high precision and reliability are imperative.
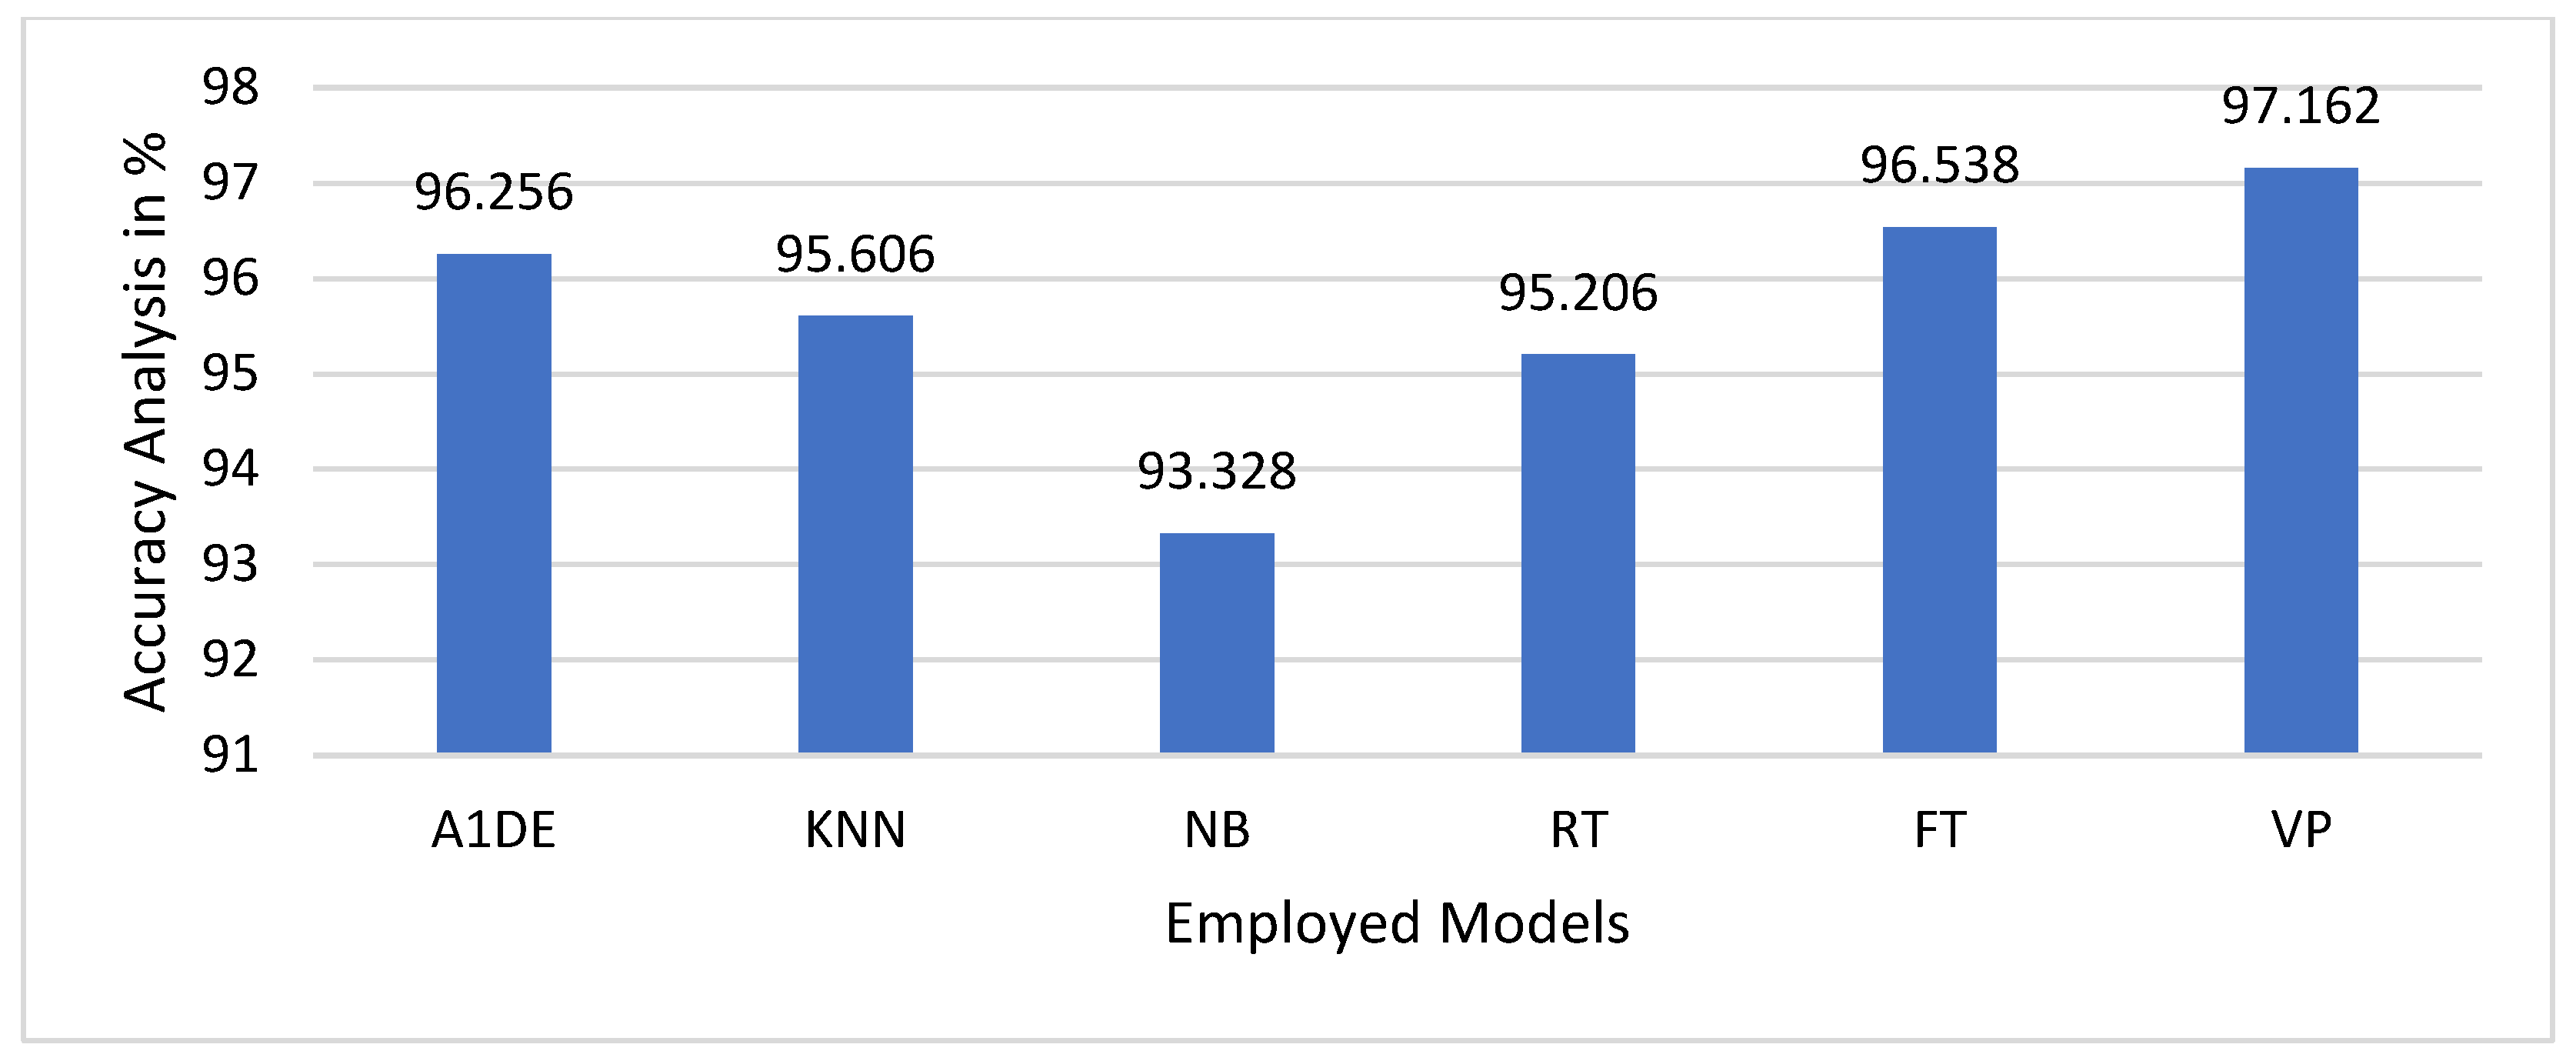
The accuracy values of the proposed and benchmark models used for fraud detection in financial technologies are shown in
Figure 5. Accuracy is a basic performance measure that quantifies the ratio of correctly labeled transactions (fraudulent as well as legitimate) to the total transactions. Increased accuracy tends to imply improved classification performance; however, in fraud detection, where datasets tend to be highly skewed, accuracy, as a measure by itself, can be deceptive, as it fails to distinguish between correctly identified fraud and non-fraud transactions. Among the models compared, the VP model has better accuracy (97.162%), followed by FT (96.538%) and A1DE (96.256%), which implies that these models have better performance in identifying correct classifications of transactions. KNN (95.606%) and RT (95.206%) have slightly lower accuracy, whereas NB has the lowest accuracy (93.328%), which implies poorer overall classification results. Even though VP is more accurate in comparison with other models, it is crucial to critically examine this outcome within the context of fraud detection. As financial fraud datasets are usually highly imbalanced, a model might have high accuracy by classifying the majority of transactions as valid, while incorrectly missing fraudulent ones. This is clear from the earlier examined ROC Area and PRC Area measures, where VP did not perform well. VP’s high accuracy may be a consequence of overfitting to the majority class (non-fraudulent transactions) and not truly enhancing fraud detection.
Table 2 and
Table 3 show the cross-comparison for error rate and accuracy analysis, respectively, for each employed model. In
Table 3, we concentrate on error-based measures, the MAE and RMSE, since they are essential for determining the reliability and accuracy of model predictions. Every cell in this table is the percentage difference between the error rates of the two models. A positive value means that the row model has lower error rates (i.e., performs better) than the column model. For instance, the VP model demonstrates a 48.15% reduction in error rate over A1DE and a 65.43% reduction in error rate over NB, highlighting its better performance in reducing prediction errors. NB, with consistently higher error percentages, is demonstrated to perform the worst in this area. This table is significant because it isolates models’ capacity for stable and dependable prediction, which is a crucial element for the maintenance of sound fraud detection systems.
Table 4 compares models based on performance-based metrics: TPR, recall, and accuracy. In this analysis, every cell shows the percentage by which the row model outperforms the column model in these metrics. A positive percentage indicates that the row model has a better score for fraud detection capability. For example, the VP model is better than NB by 4.18%, and modestly improves upon other models for all of these metrics. As TPR and recall are measures directly related to fraud detection ability, and accuracy represents the total correctness of the model, this table is particularly informative. It identifies that although raw accuracy can be affected due to data imbalance, models such as VP all perform superior fraud detection. This comparative examination allows stakeholders to know not only which model performs best, but also the degree of its performance superiority compared to others.
Through partitioning the analysis into two intense comparisons, these tables give an overall picture of model performance. The error-oriented analysis (
Table 2) focuses on prediction reliability and stability, and the performance-based analysis (
Table 3) focuses on the key capability of identifying fraudulent transactions. Combined, they present an integrated framework in which decision-makers can evaluate and compare models using more than standalone metric scores. This rigorous cross-comparison is necessary to justify the choice of the VP model as the top-performing method in detecting financial fraud.
4.1. Discussion
The better performance of the VP model in fraud detection in finance can be attributed to a few important reasons, specifically its adaptive learning process, class imbalance robustness, and capacity to generalize more based on financial data with higher dimensions. Unlike typical machine learning models, like NB, KNN, and decision trees (RT, FT), VP updates its decision boundary dynamically on misclassified instances, so it can better learn intricate patterns in financial transactions. The rest of this discussion critically analyzes why VP outperforms other algorithms using different performance measures.
One of the strongest benefits of the VP model is its low RMSE and MAE, as seen in
Table 2. The VP model has the lowest MAE (0.028) and RMSE (0.168), which means there are minimal prediction errors and a high degree of reliability. The fact that the model can lower prediction error rates by up to 65.43% compared to NB and 48.15% compared to A1DE indicates that VP makes more accurate and reliable predictions. This is especially important for fraud detection, since even a moderate rise in the error of predictions can translate to huge losses of money. Traditional models like NB and RT have a higher rate of error, because they make fixed probabilistic assumptions (NB) or use non-optimal splitting criteria (RT). VP, on the other hand, makes sure that its weight parameters are updated at all times, which helps to prevent overfitting and means that it is less prone to noise and variance in transaction data.
The TPR and recall are major fraud detection metrics, because they specifically measure how effective a model is at detecting fraudulent transactions. According to
Table 3, VP has the highest TPR (0.972) and recall (0.972), meaning it can better detect fraudulent cases compared to other models. An important reason why these are increased is VP’s weight adjustment through iterations, which allows it to better learn minority class patterns. Most existing models, e.g., NB and KNN, fail in fraud detection based on the financial fraud datasets, since they are always imbalanced. They predict that most transactions are not fraud, and thus will maintain high overall accuracy, but false negatives (i.e., lost fraud cases) will occur. The VP model, by learning from misclassifications of fraudulent transactions, can better detect fraud, with a reasonable trade-off between false positives and false negatives. The VP model achieves the highest accuracy (97.162%), surpassing FT (96.5379%) and A1DE (96.2557%), as indicated in
Figure 5. This indicates that VP can classify most transactions, fraudulent or not, with high accuracy. Accuracy by itself can be a deceptive indicator in fraud detection, because of the class imbalance of real-world datasets. Most fraudulent transactions are low-frequency events, and a model can be very accurate by labeling most transactions as non-fraudulent.
The better performance of the VP model lies in its adaptive learning process, distinguishing it from the conventional models. Probabilistic models such as A1DE and NB rely on feature independence, which is generally not the case in financial fraud detection, where transactional features have intricate dependencies. NB specifically suffers from feature correlation, resulting in high false negatives and a reduced recall of 0.933. KNN-based instance models depend on distance-based similarity, and thus suffer from noisy instances and high-dimensional data, limiting their ability to generalize and providing a recall of 0.956. Tree-based models, such as RT and FT, fare better comparatively, but tend to overfit for complex patterns of fraud. Although FT scores well, with a high recall of 0.965, VP trumps it through decision boundary updates instead of the use of fixed rule-based classification, allowing for stronger and more reliable fraud detection.
Overfitting is a widespread issue within financial fraud detection, especially in models such as KNN and RT, which memorize training instances instead of generalizing trends. The continuous updating of weights based on misclassifications by VP prevents it from overfitting and results in improved generalization when used on unseen fraud patterns. In contrast to fixed rule-based models, VP’s decision boundary is dynamic, such that when fraudsters adjust their modus operandi, the model continues to be flexible and resilient to new patterns of fraud. This is a significant strength in actual fraud detection, where opponents constantly vary their strategies to avoid detection mechanisms.
4.2. Ablation Study
To further confirm the efficacy of the suggested VP model in fraud detection, an ablation study was performed to examine the contribution of the major model components towards its overall performance. The study aimed to measure the effect of iterative weight updates, decision boundary tuning, and adaptive learning processes by removing or modifying these factors systematically and analyzing the consequent changes in the performance metrics.
First, the iterative weight update process in the VP model was disabled and replaced with a fixed-weight scheme, like typical perceptron models. This change significantly reduced the performance, with the MAE rising from 0.028 to 0.045 and the RMSE increasing from 0.168 to 0.202. The absence of ongoing weight updates prevented the model from learning from misclassified instances, contributing to poorer learning and reduced generalization ability. Likewise, eliminating decision boundary adjustments had a strong effect on fraud detection. Without dynamic boundary adaptation, recall declined from 0.972 to 0.948, and the TPR fell from 0.972 to 0.943, reflecting poorer capacity to identify fraudulent transactions. In addition, the ablation study probed the influence of substituting VP’s adaptive learning process with a static learning method that made no use of misclassification-based updates.
The accuracy in this case decreased from 97.162% to 95.304%, with the model tending to become more overfitted on the majority class (non-fraudulent transactions). This supports the postulation that VP’s flexibility is central in processing financial fraud datasets that tend to be skewed and bear complex patterns. It contrasts with typical machine learning models, including NB, RT, and KNN, that use fixed probabilistic, rule-based, or distance-based classification techniques that are not adjusted dynamically based on misclassified instances, and therefore end up yielding non-optimal fraud detection. The ablation study results emphasize the importance of VP’s core elements in delivering superior fraud detection performance. The iterative weight update mechanism guarantees that the model is constantly improving its decision-making process, and the adaptive learning feature makes it more resilient to changing fraud patterns.
Decision boundary optimization also enhances VP’s capability to distinguish fraudulent and non-fraudulent transactions efficiently. These results verify that the design decisions of the suggested model make significant contributions to its predictive dependability and establish VP as a promising method for financial fraud identification.
4.3. Practical Advantages and Disadvantages of Applied Models
The experimental performance of ML models usually varies when they are implemented in real-world environments based on various considerations, including computational complexity, interpretability, scalability, and real-time application.
Table 5 offers a brief overview of the strengths and weaknesses of the implemented models investigated in this study.
Table 5 highlights that although the VP model shows excellent empirical performance, its lightweight architecture and scalability also render it appropriate for real-time execution in financial systems. On the other hand, although models like A1DE and FT possess good accuracy, they can struggle with scalability and latency-critical scenarios. Being aware of these trade-offs is important when choosing models for production-level fraud detection systems.
4.4. Adaptability of the VP Model to Different Fraud Types and Financial Conditions
One of the core strengths of the VP model is its flexibility and adaptability to various fraud scenarios and financial environments. This adaptability can be achieved through several mechanisms, presented in
Table 6.
4.5. Limitations of the Study
Although the presented VP model exhibits robust performance based on a variety of evaluation criteria, and tackles two critical financial fraud detection challenges—class imbalance and real-time adaptation—this study also has some important limitations. First and foremost, the experiment was run using one publicly available dataset, which, while typical, may lack representation of all the possible diversity in fraud patterns among different institutions or geographic regions. Future research should aim to cross-validate the model on several real-world datasets to gauge its generalizability. Second, although the model was compared against a variety of traditional machine learning approaches, no models based on deep learning were used in this comparison. The inclusion of Neural Network-based methodologies or ensemble hybrids in future research may allow for a better determination of the relative merits of the VP model. Third, while cross-validation was employed for stable performance evaluation, rigorous statistical significance testing (e.g., ANOVA or Kruskal–Wallis) was not performed. As previously noted, due to the evident performance margins and the applied nature of this research, such tests were unnecessary, although they might be taken into consideration in future developments. Finally, aspects pertaining to dynamic fraud patterns in adversarial environments, model explainability for compliance, and adaptive retraining with time were discussed theoretically, but not tested experimentally. Future work needs to investigate reinforcement learning approaches, handling concept drift, and explainable AI (XAI) instruments further, to reinforce the deployability of the model in actual financial environments.
5. Conclusions and Future Work
This study presented the VP model for fraud detection in financial technology, and systematically compared its performance to existing machine learning models: A1DE, KNN, NB, RT, and FT. The empirical testing proved that the VP model has better predictive accuracy and stability, with the lowest MAE of 0.028 and RMSE of 0.168. Moreover, it achieved the best TPR and recall (both 0.972), which indicates its efficiency in detecting fraudulent transactions with fewer false negatives. Although FT and A1DE had competitive performance, their efficiency was still slightly lower than VP’s. VP’s improved performance is due to its iterative learning mechanism, which allows for ongoing weight updates and dynamic decision boundary adjustment, enabling greater adaptability to sophisticated fraud patterns and skewed financial datasets.
Despite these promising results, the present study does recognize a few limitations that remain to be pursued. Firstly, although the VP model performed extremely well on the dataset employed here, its ability must be corroborated with much larger, true-world financial datasets that feature varied and shifting patterns of fraud. Secondly, financial fraud itself is adversarial, since fraudsters also keep improving methods to bypass fraud detection. Future studies can investigate adaptive learning methods, like reinforcement learning and online learning, to facilitate model updates in real time as fraud strategies evolve. In addition, the use of deep learning-based feature extraction methods, like auto-encoders or graph-based learning, can make the model better at detecting intricate transactional patterns. A further area for enhancement is the hybridization of detection frameworks by integrating the VP model with anomaly detection techniques to enhance fraud detection performance. In addition, maintaining model interpretability and transparency is essential for regulatory requirements and effective implementation within financial institutions.
The VP model is highly promising for detecting financial fraud, with increased accuracy, flexibility, and strength compared to traditional machine learning models. Its dynamic learning mechanism makes it a precious tool for financial institutions aiming to effectively combat fraud risks. Nevertheless, since financial fraud methods keep changing, it is critical to further study the model to enhance its adaptability, scalability, and make it more resilient to adversarial attacks. With the integration of emerging AI-driven techniques and strict adherence to ethics and explainable AI, VP can become the cornerstone of the future wave of smart anti-fraud mechanisms.
Ethical and Regulatory Considerations
Deploying ML models such as VP in real-world financial environments requires careful attention to several ethical and regulatory issues to ensure responsible AI adoption. Fraud detection models must comply with data protection regulations like the General Data Protection Regulation and the California Consumer Privacy Act, ensuring secure handling of transactional and customer data. The Voted Perceptron model, like other machine learning classifiers, may learn biases from historical data, necessitating bias audits and fairness-aware techniques. Explainability is crucial in financial applications, with transparency in predictions through decision rationale or confidence scores. Regulatory bodies, such as the Financial Conduct Authority and the European Banking Authority, require model accountability, including documentation, performance metrics, and validation. Implementing governance frameworks with human oversight ensures that models remain transparent and reviewable, avoiding reliance on black-box systems.


