
Three-Dimensional Localization Method of Underground Target Based on Miniaturized Single-Frequency Acoustically Actuated Antenna Array

 ,
,
Abstract
1. Introduction
2. Methods
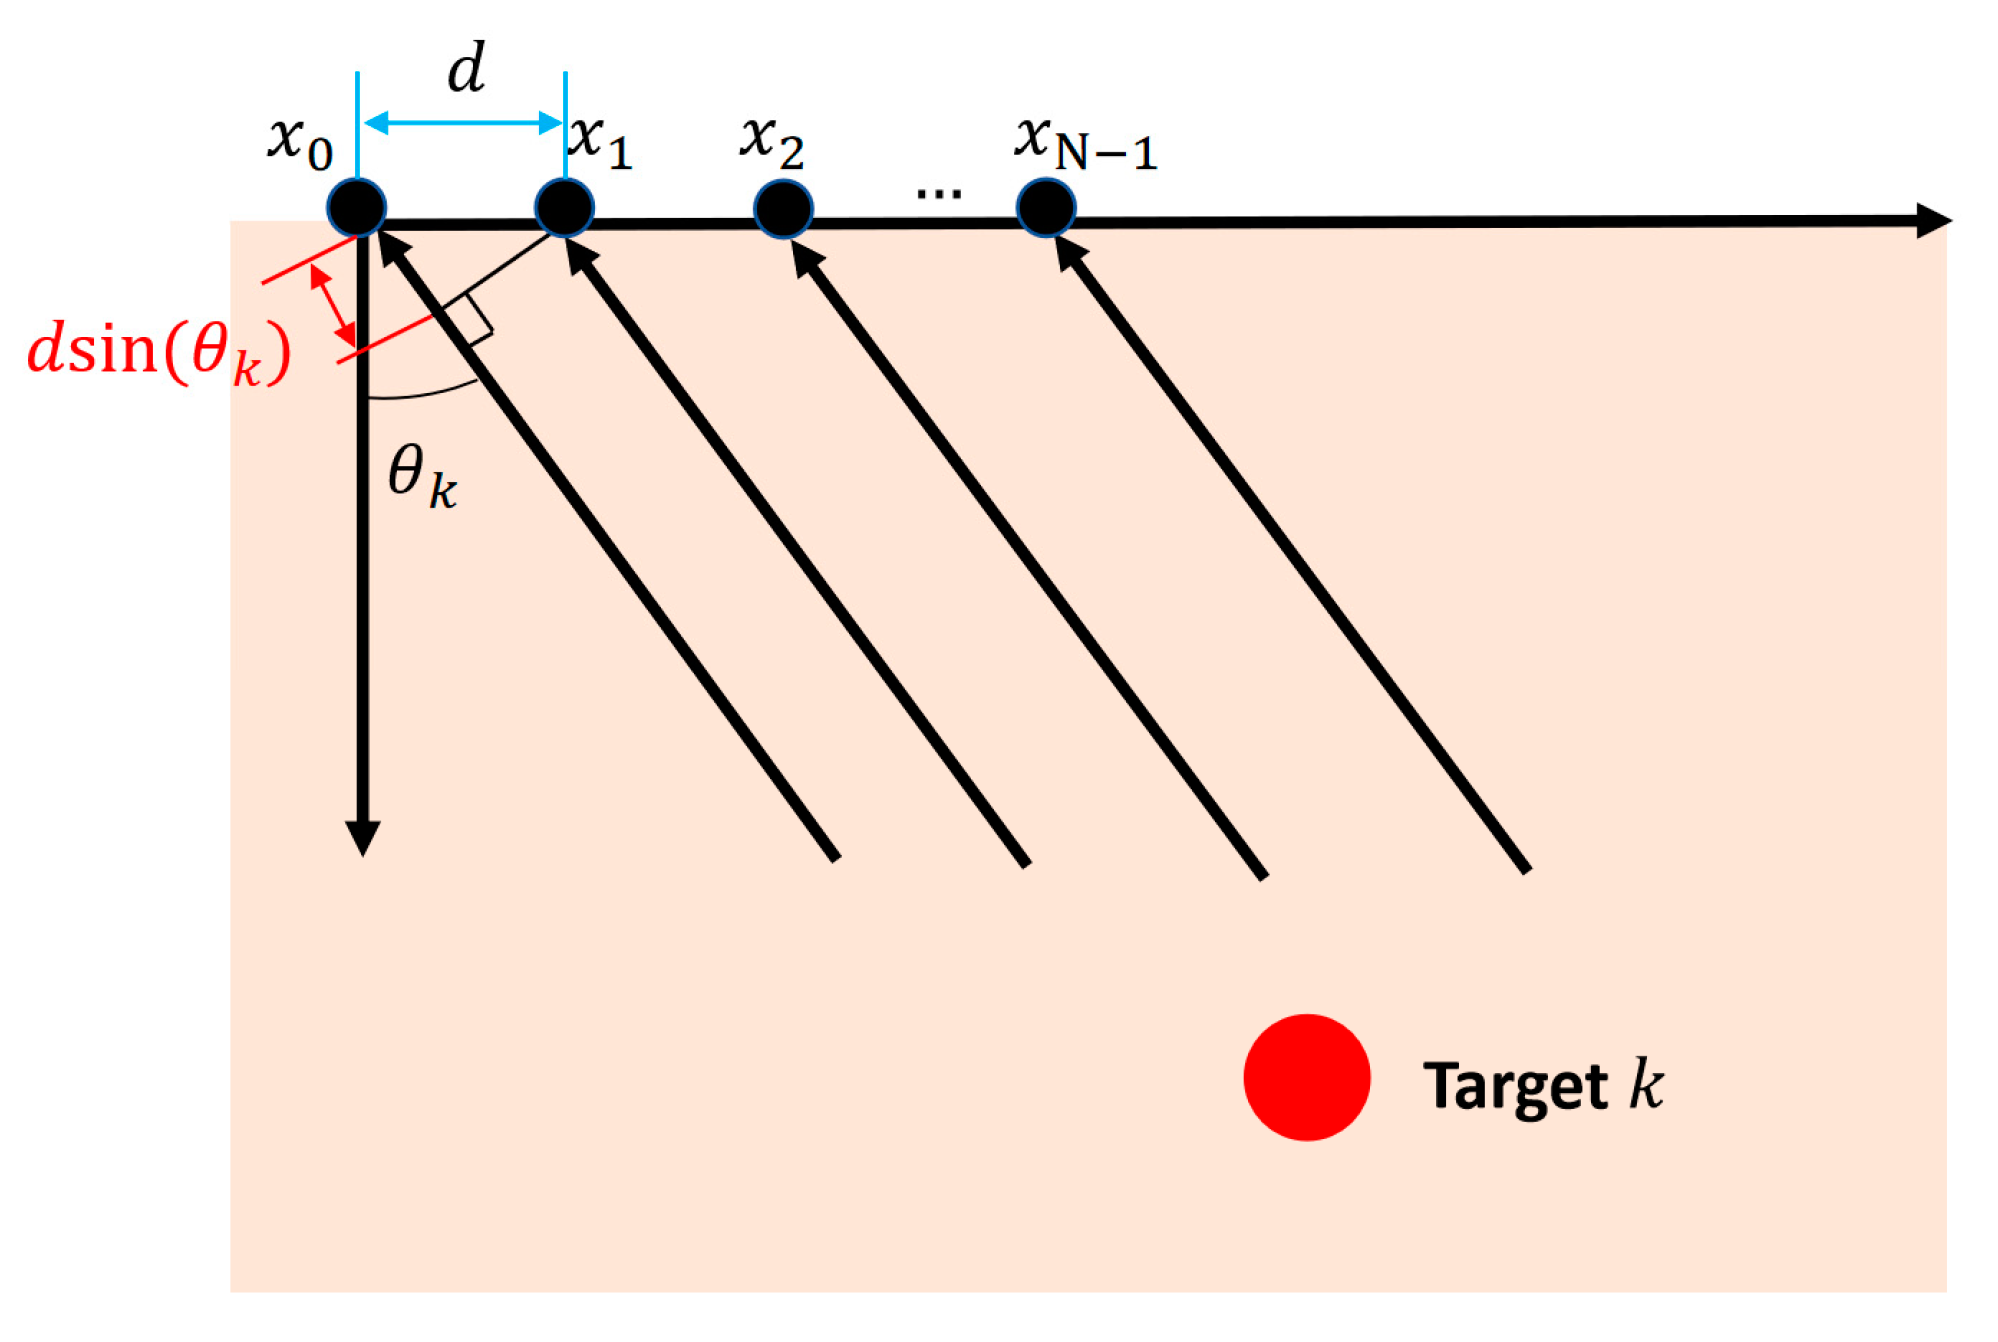
2.1. Signal Model
- Signal sources are zero-mean and non-Gaussian;
- The array elements receive ideal Gaussian white noise that is statistically independent of the signal sources;
- The number of signal sources is smaller than the number of array elements;
- All elements in the receiving array maintain identical reception characteristics across all directions without mutual interference or coupling effects.
2.2. DOA Estimation of Underground Targets
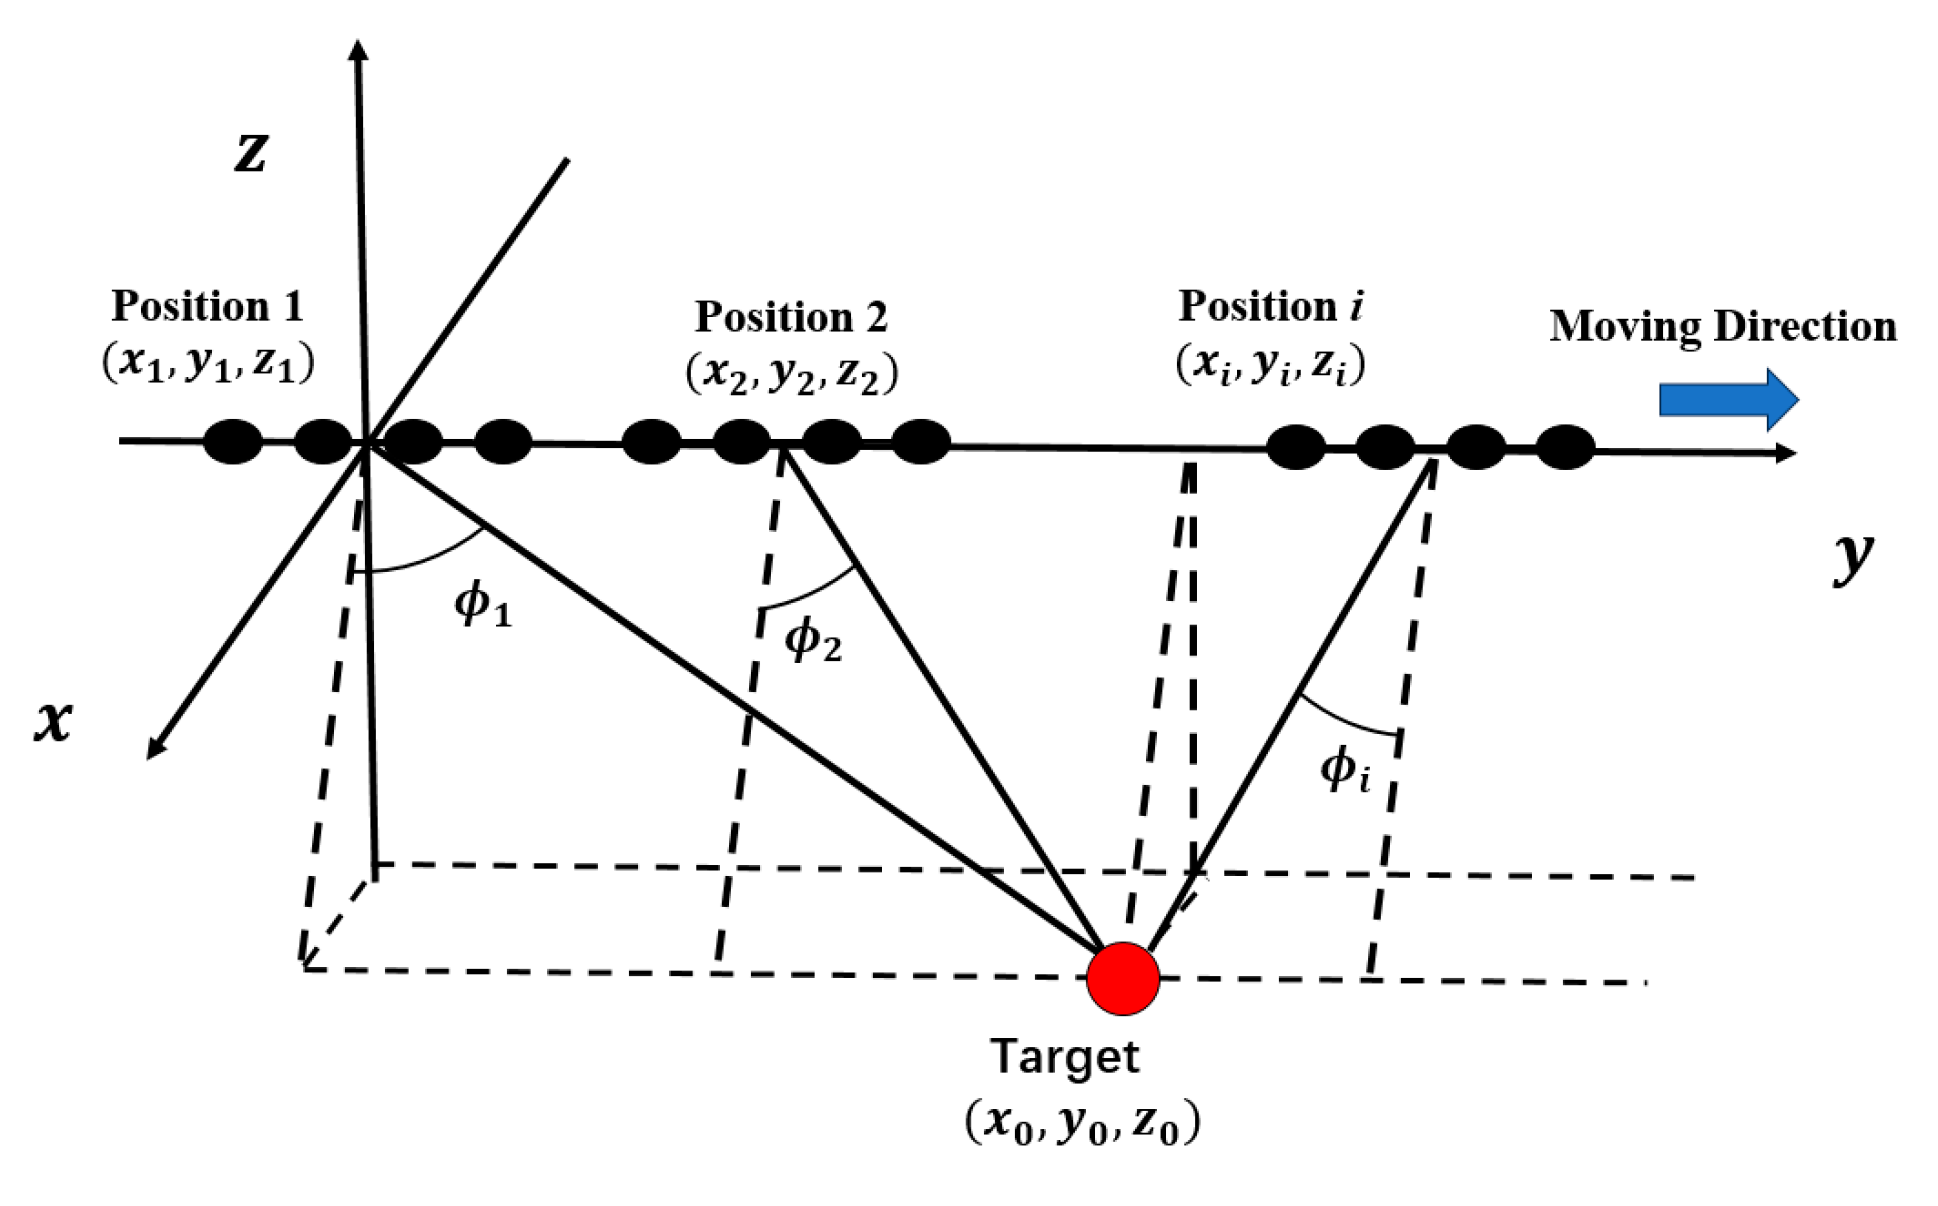
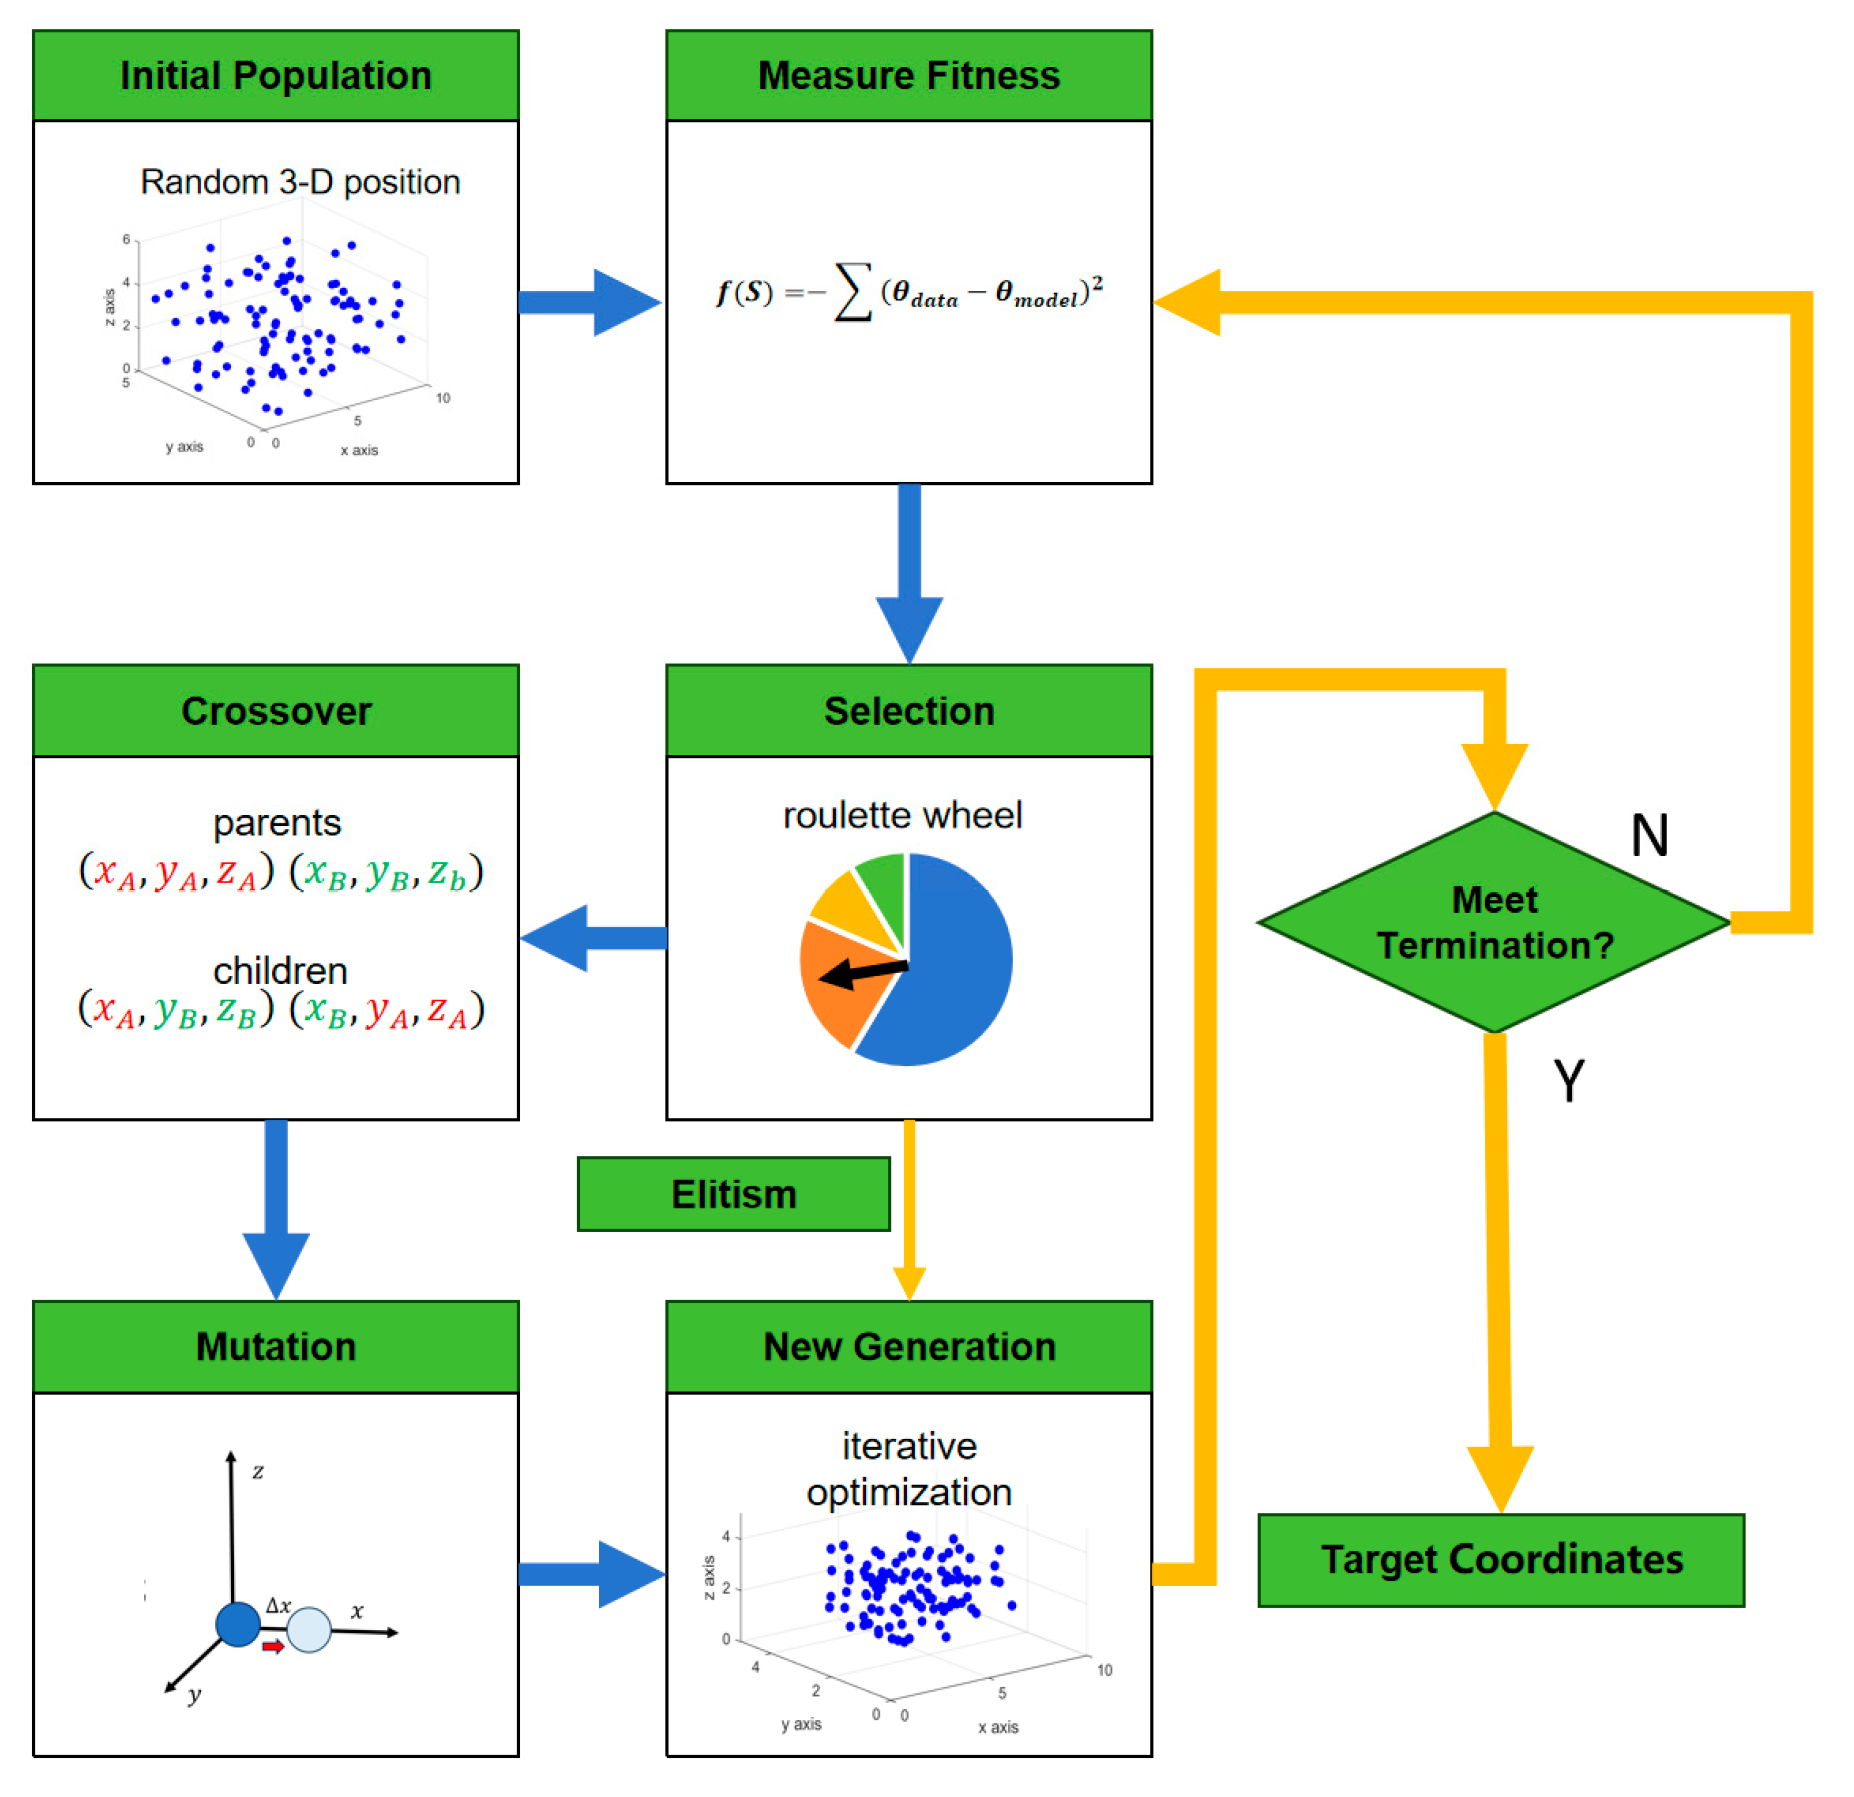
2.3. Target Position Estimation Based on Genetic Algorithm
- Population initialization: set the population size to M, and randomly generate an initial population containing M coordinates within the system’s detectable range:
- 2.
- Fitness evaluation: Substitute individual parameters and antenna positions into the target model to calculate the modeled angle. For the individual m in the population at the sampling point i, the modeled angle and are
- 3.
- Selection operation: Based on the fitness of individuals, those with higher fitness in the current population are selected and copied to the next generation. To ensure the robustness of the algorithm, this paper adopts the elitism strategy, in which the individual with the highest fitness is directly transferred to the next generation without participating in subsequent operations. The remaining individuals are selected using the roulette wheel method, where the wheel is divided into sectors proportional to each individual’s fitness. The pointer randomly stops at one of the sectors, and the selected individual is passed to the next generation. The probability of selection is determined by the central angle of each sector, which is based on the relative fitness of the individuals, as shown in Equation (37).
- 4.
- Crossover operation: This operation simulates the genetic recombination process by combining the traits of parent individuals to generate new offspring. In this paper, a single-point crossover is used, where a position is selected in the parent individuals’ genes, and the segment starting from that position is swapped, producing two new offspring. Let the gene representations of parent individuals a and b be as follows:
- 5.
- Mutation operation: This operation introduces random changes to an individual’s genes, increasing the diversity of the population and preventing it from getting trapped in local optima. In this paper, a small perturbation is added to a randomly selected dimension of an individual’s parameters, causing a slight shift in the current coordinate position in a random direction. Taking x-coordinate mutation as an example, this operation can be formulated aswhere is a small perturbation that follows a normal distribution.
- 6.
- Iteration: The offspring generated through the aforementioned steps form a new population generation. This population iteratively undergoes fitness evaluation, selection, crossover, and mutation to produce the next generation.
2.4. Algorithm Flow
- Direct wave removal:
- Angle calibration:
- Data association:
3. Experiments
3.1. Numerical Simulation
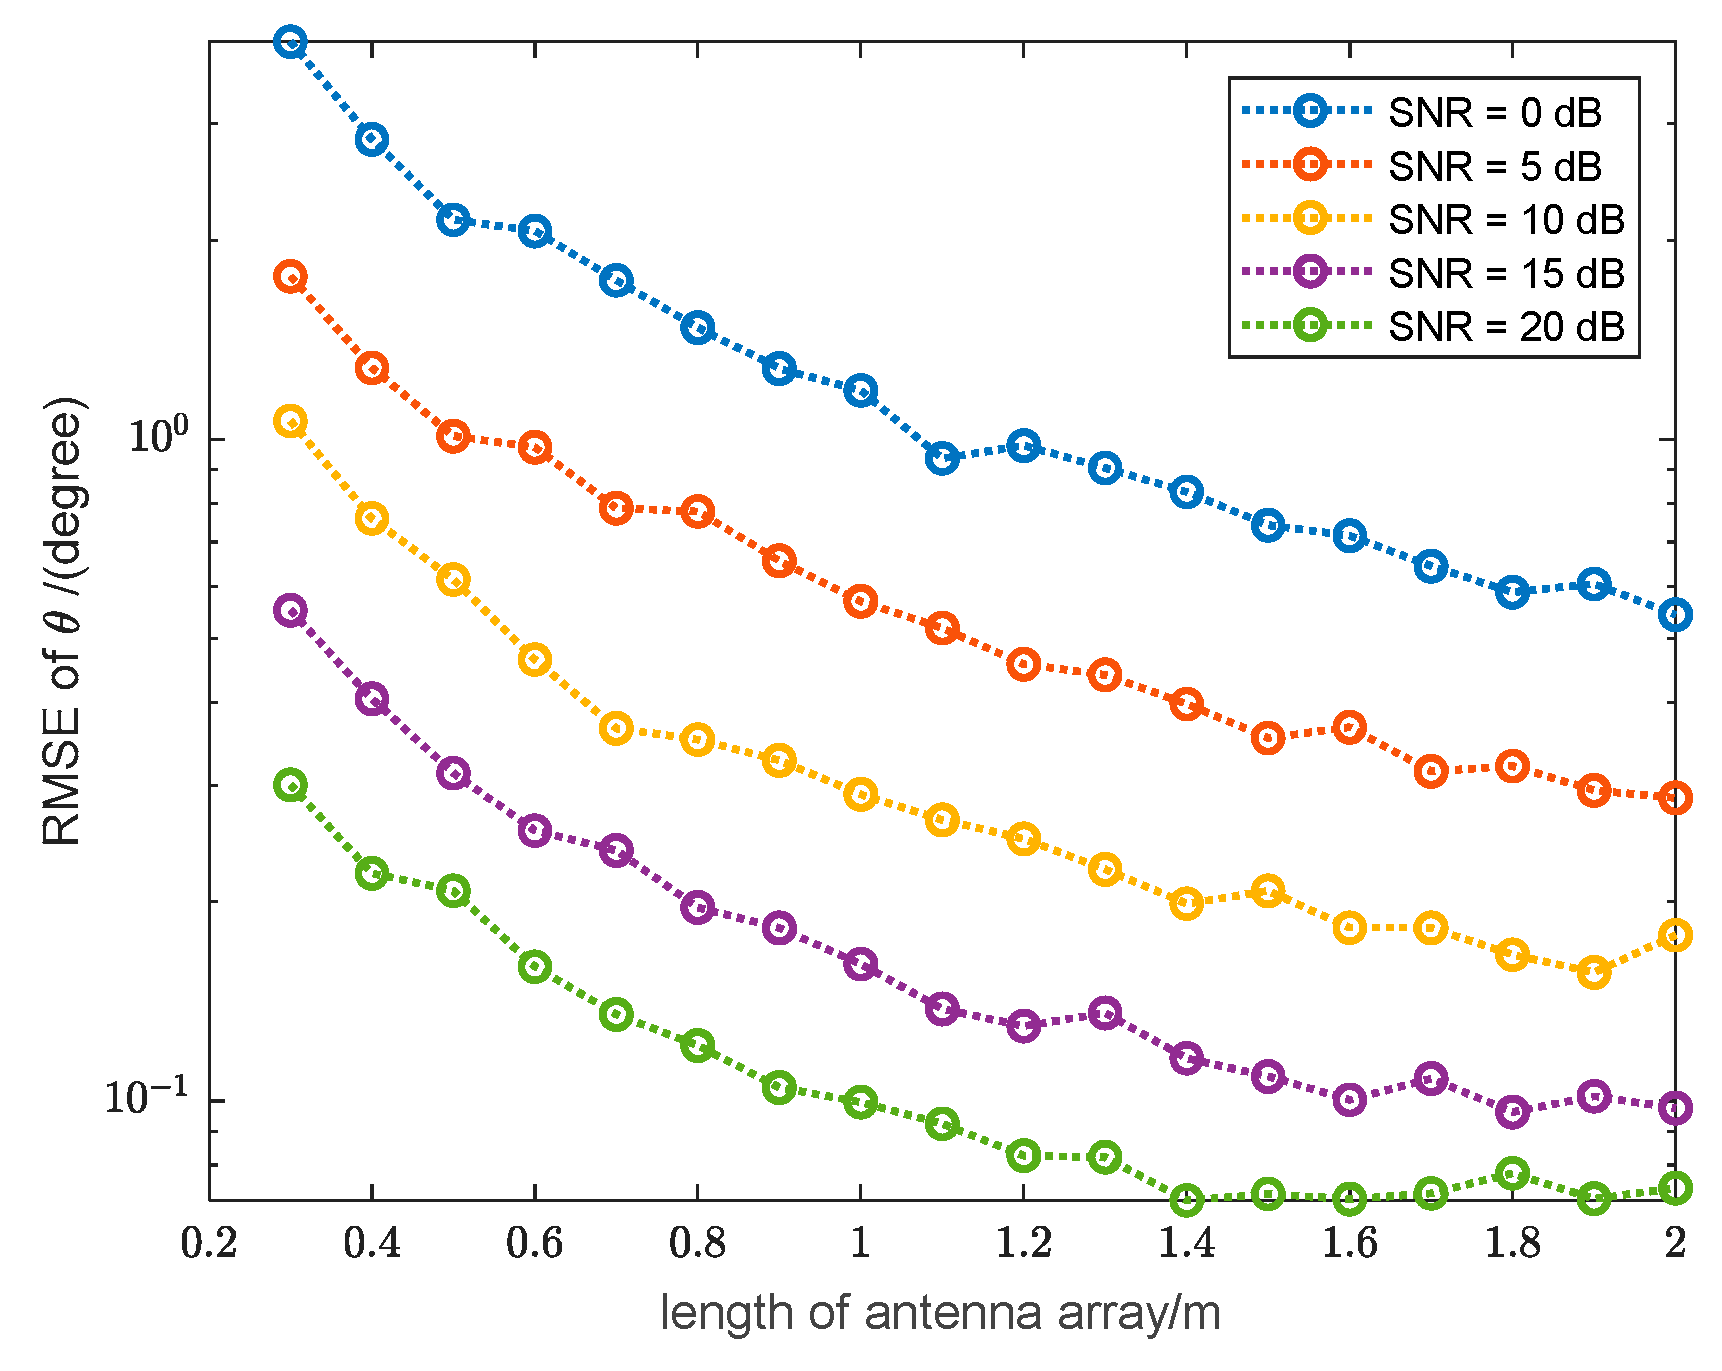
3.1.1. Effect of Array Dimension on DOA Estimation Accuracy
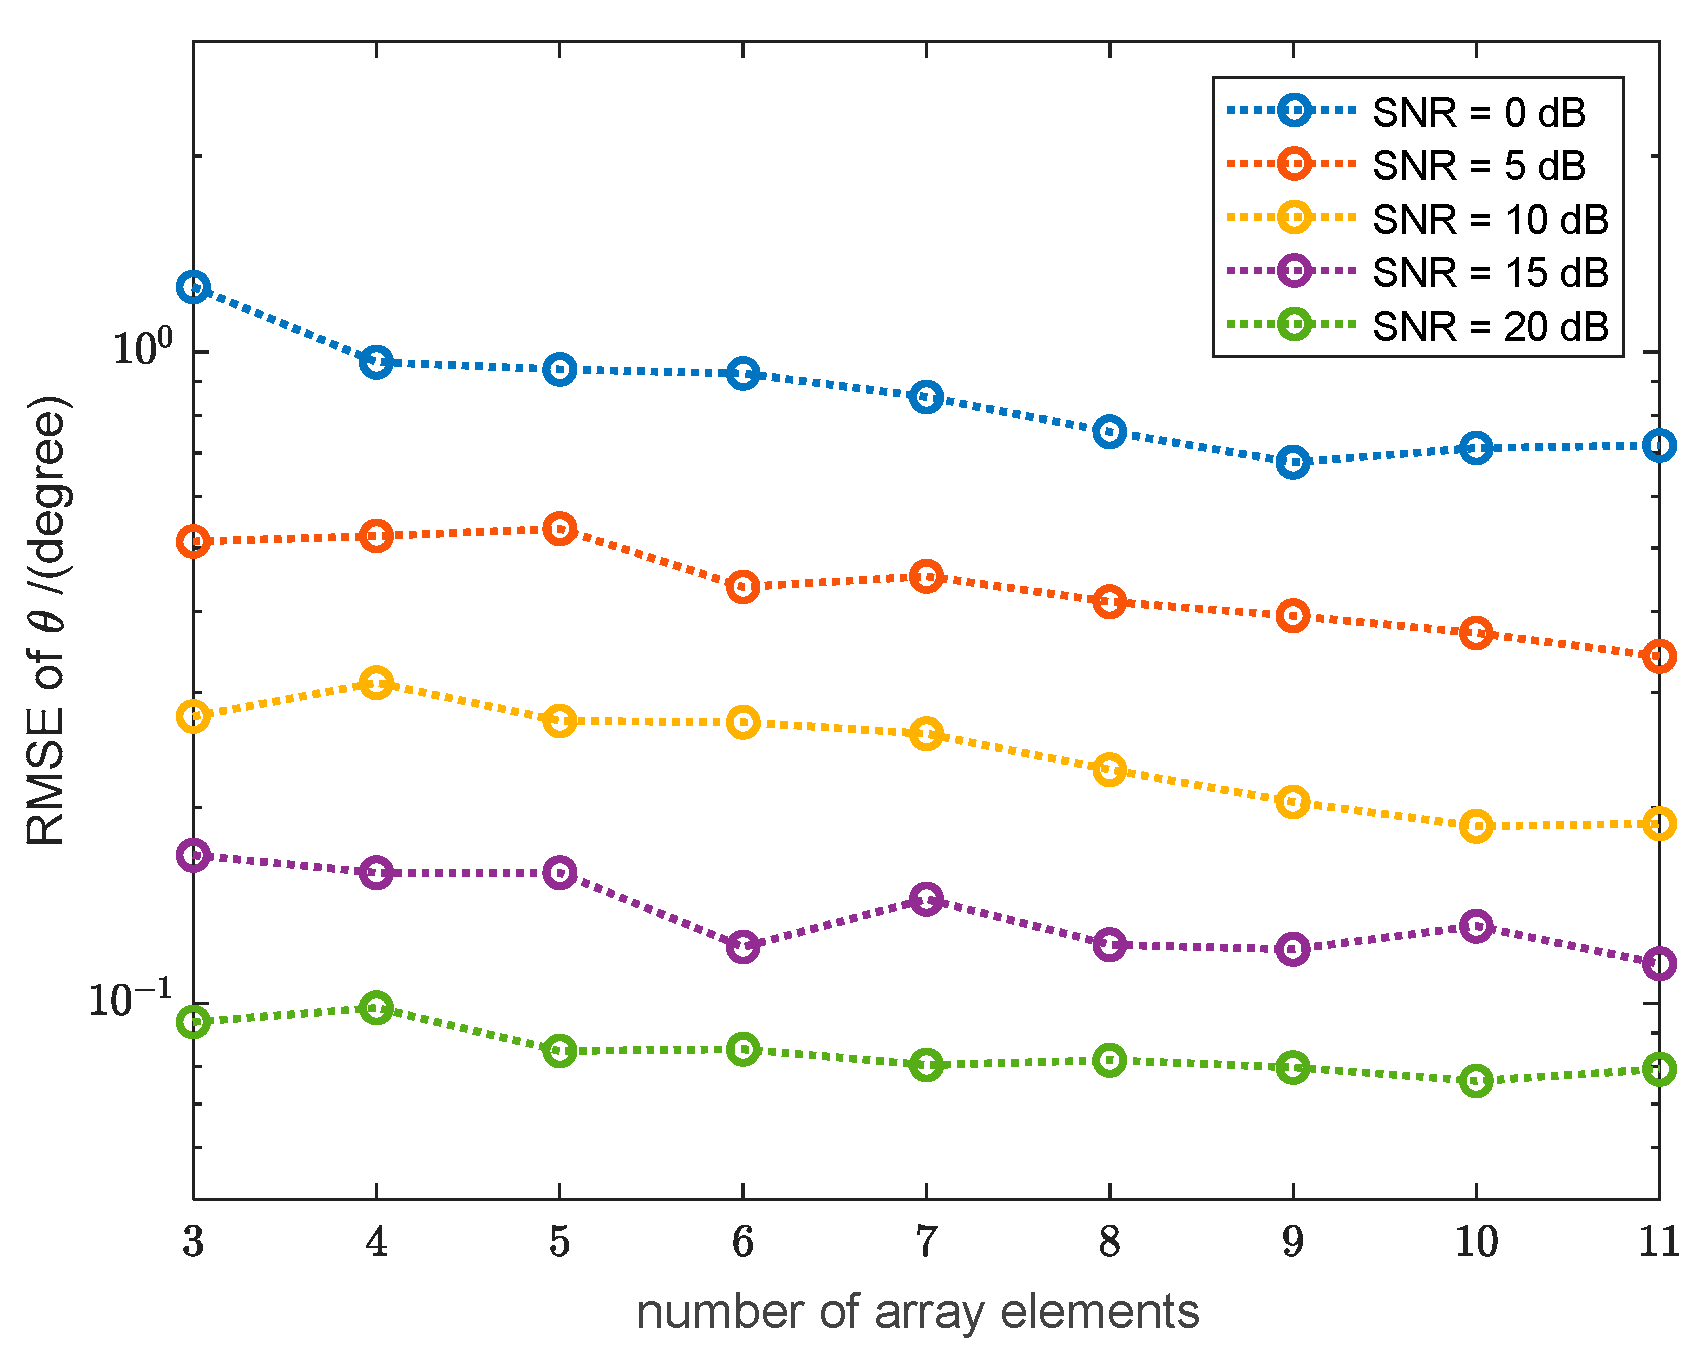
3.1.2. Effect of Number of Array Elements on DOA Estimation Accuracy
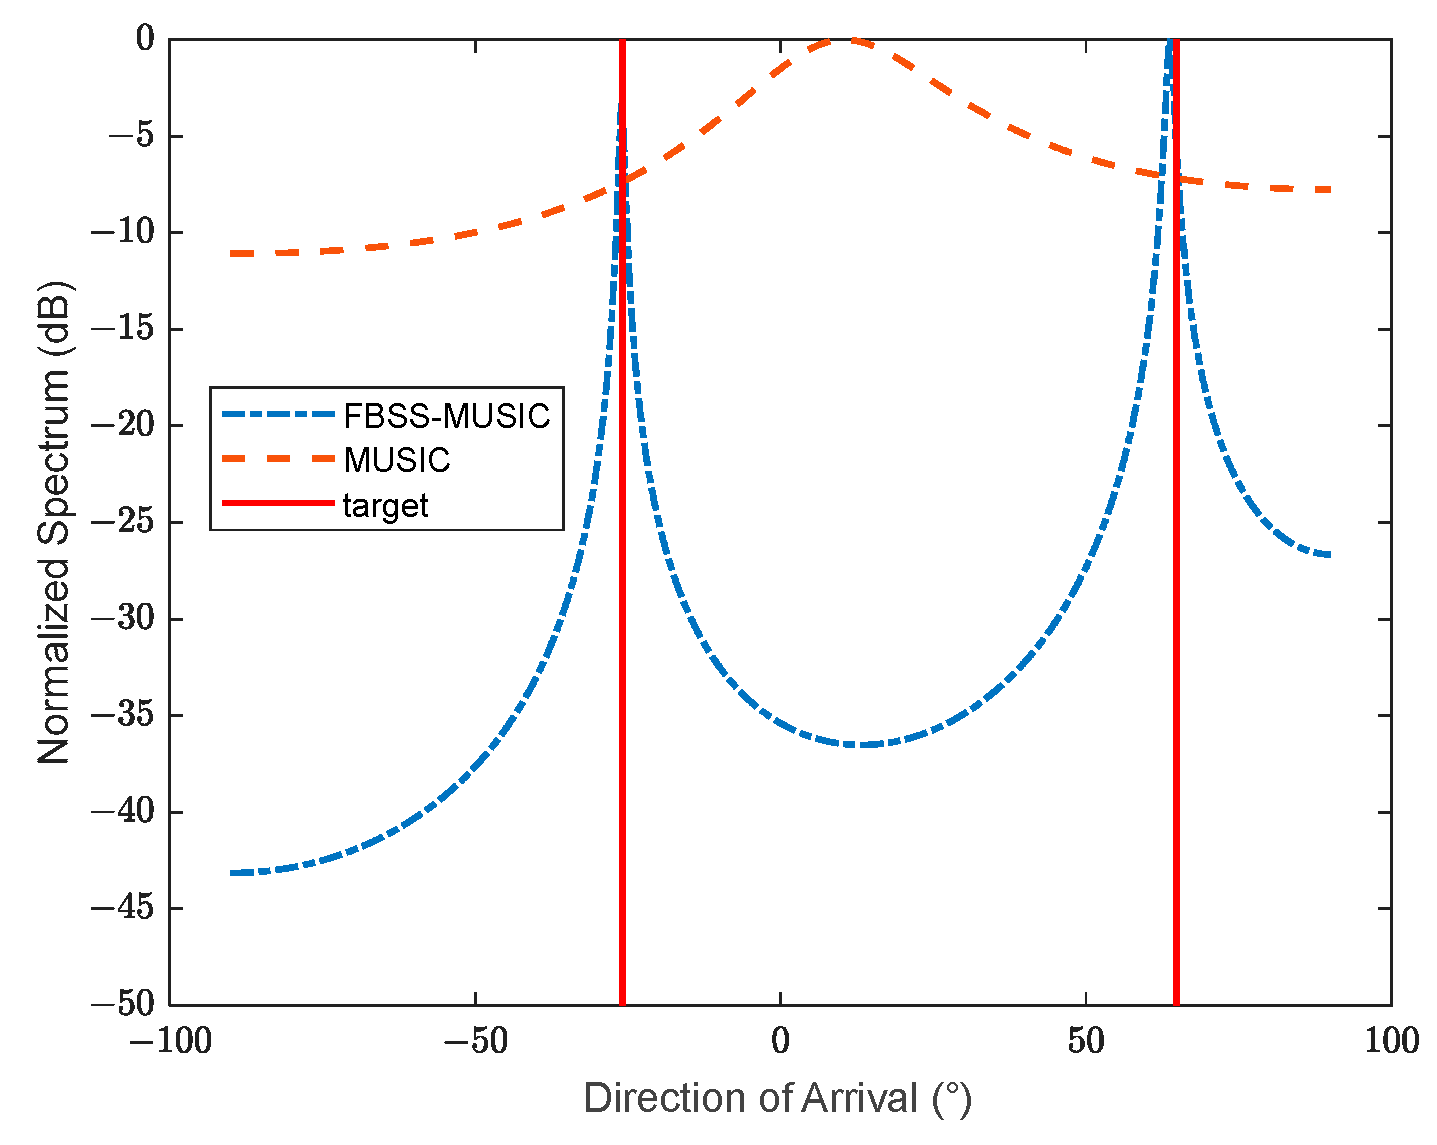
3.1.3. Effect of Coherent Signal Discrimination
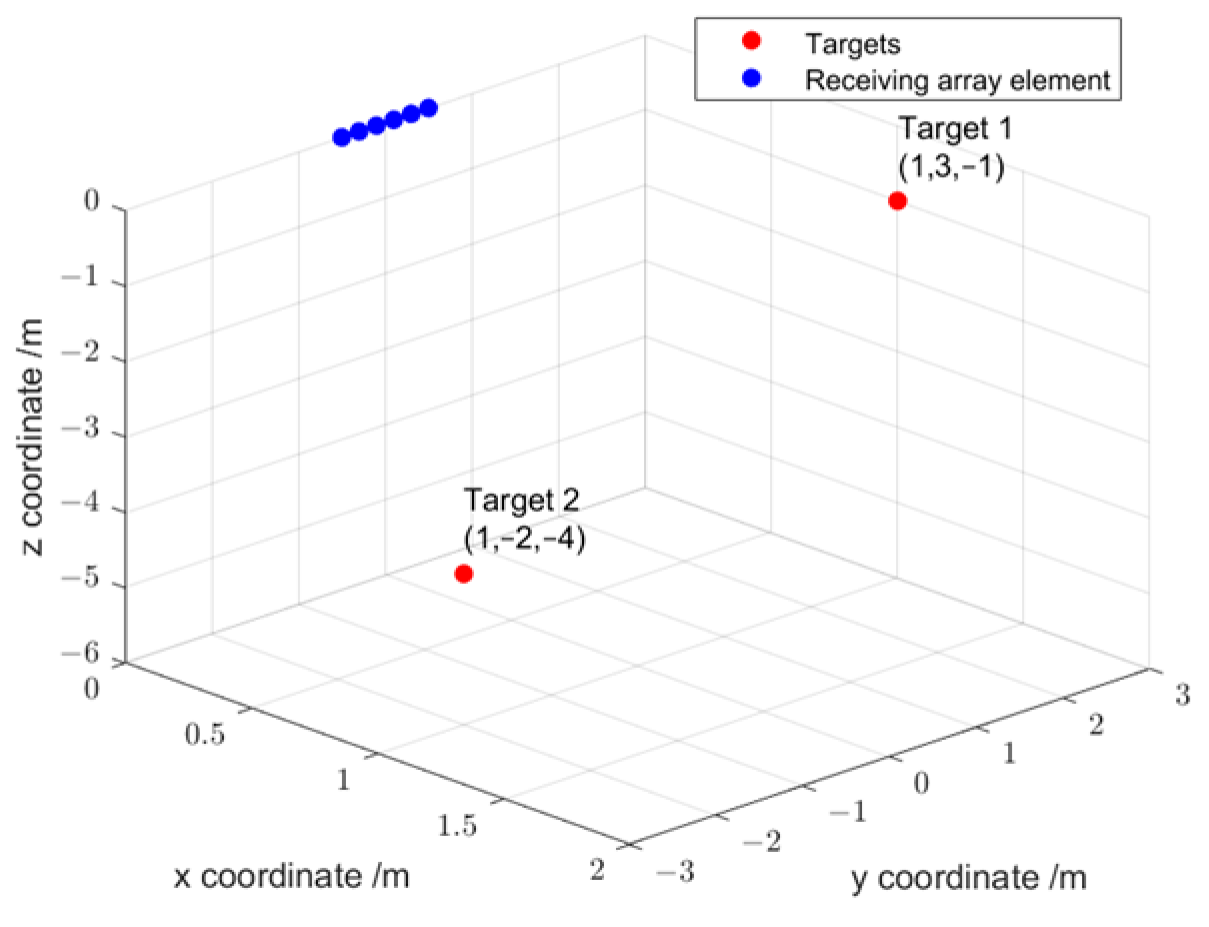
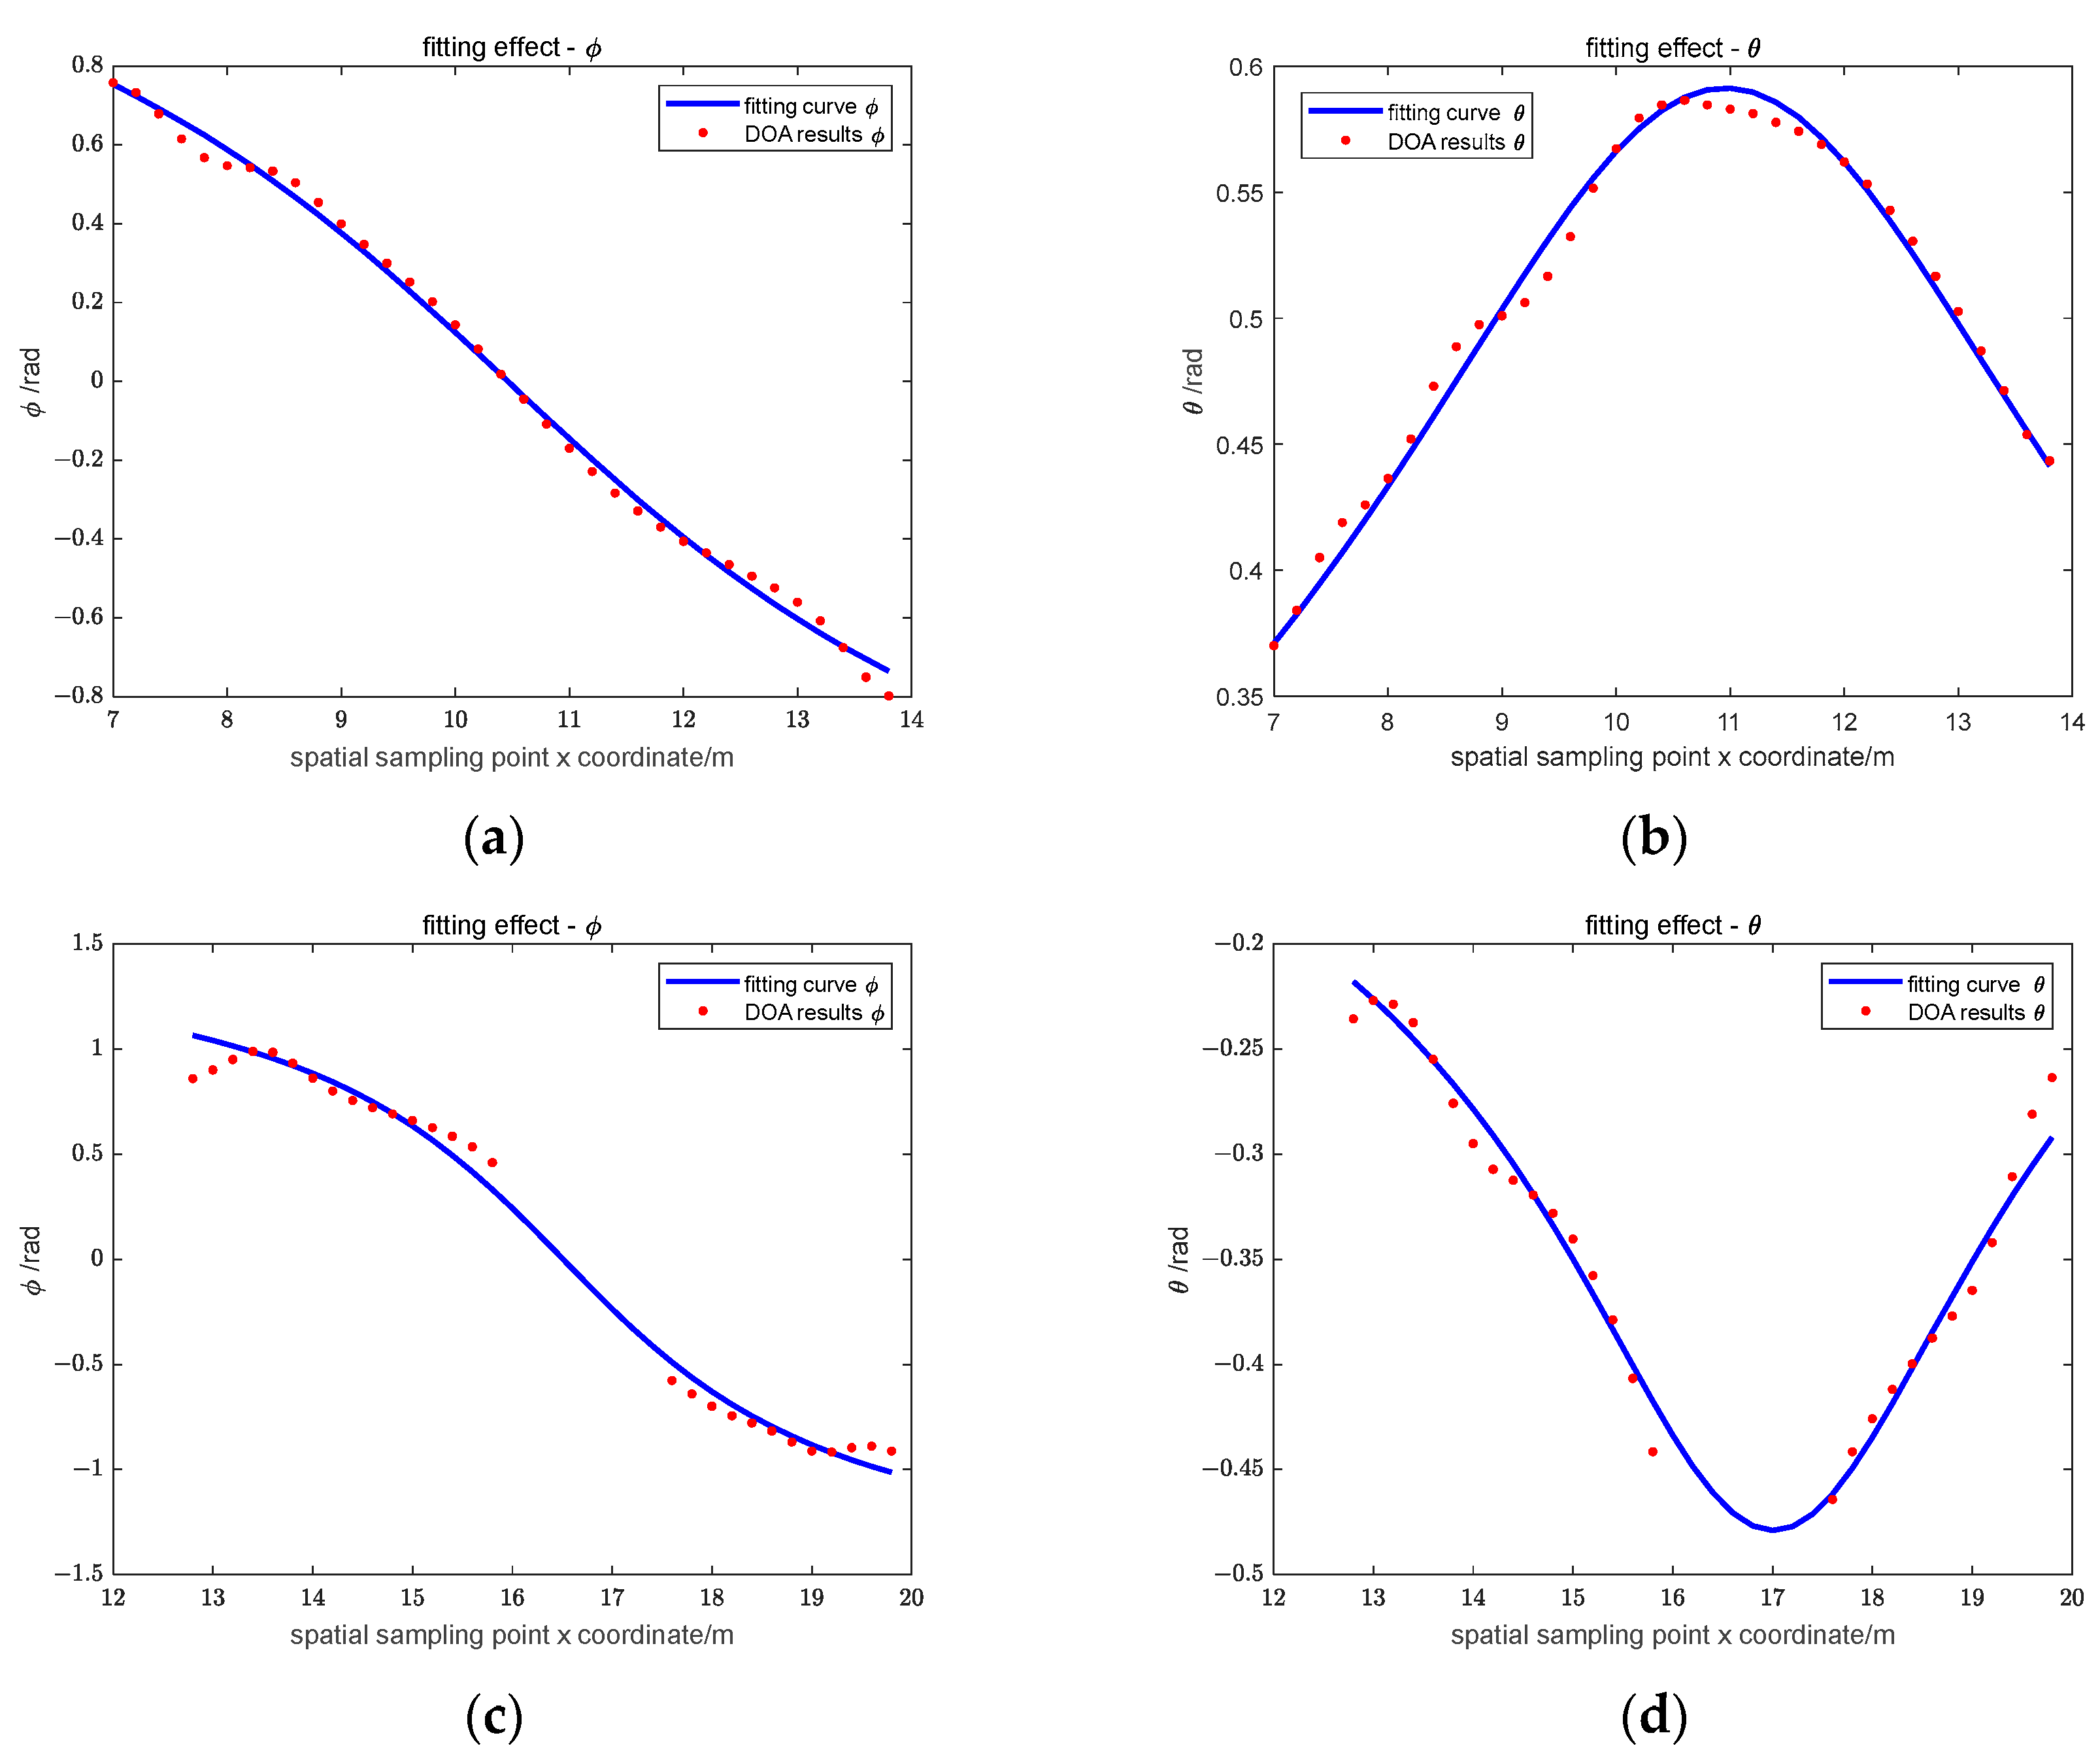
3.1.4. Underground Target Localization Performance
3.2. Electromagnetic Simulation of the Underground Scene
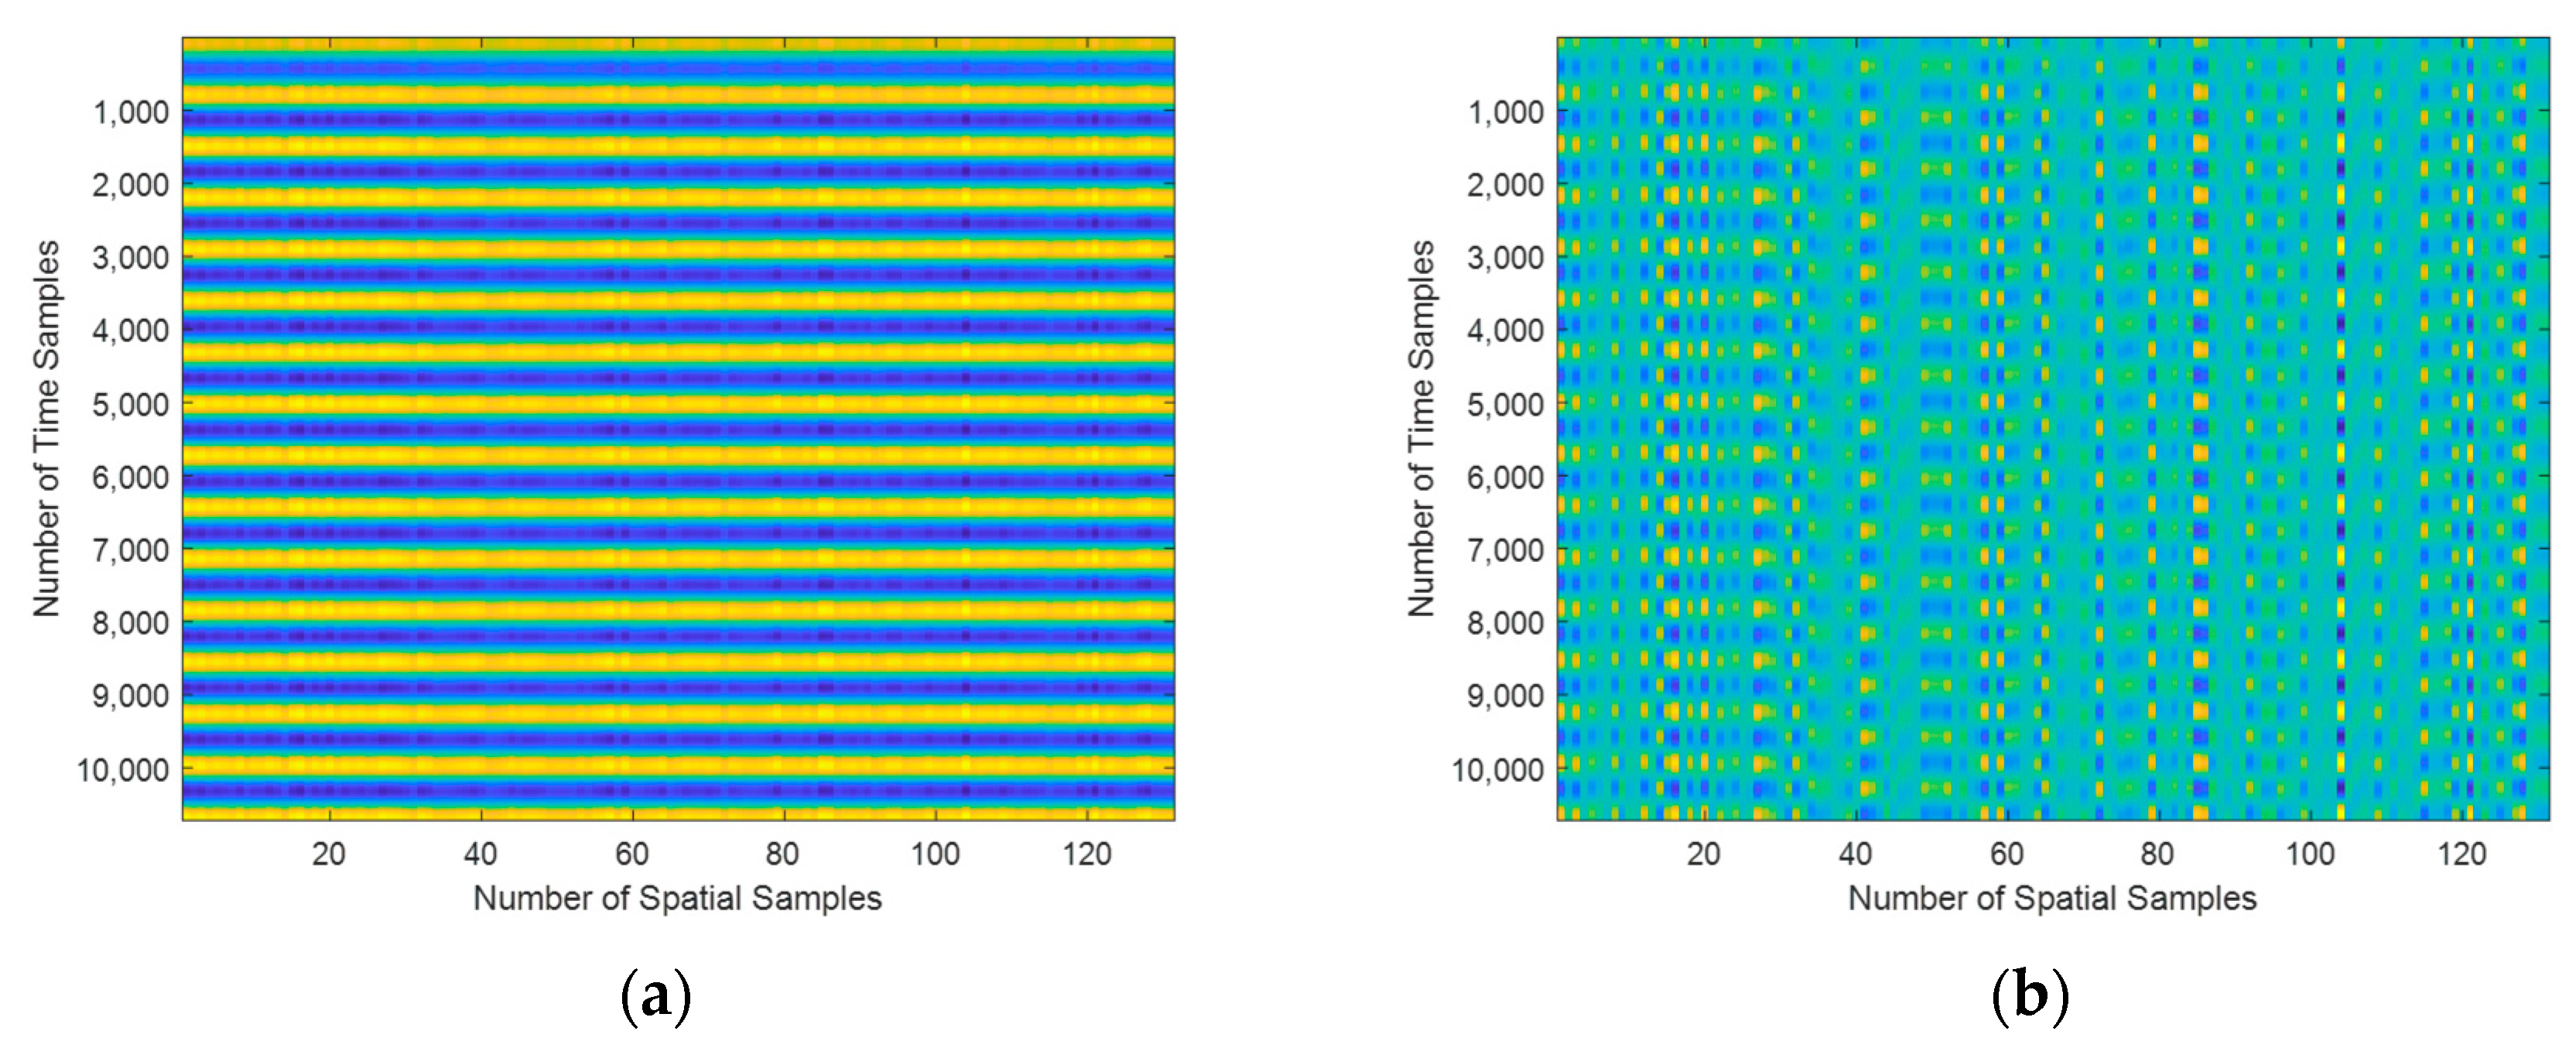
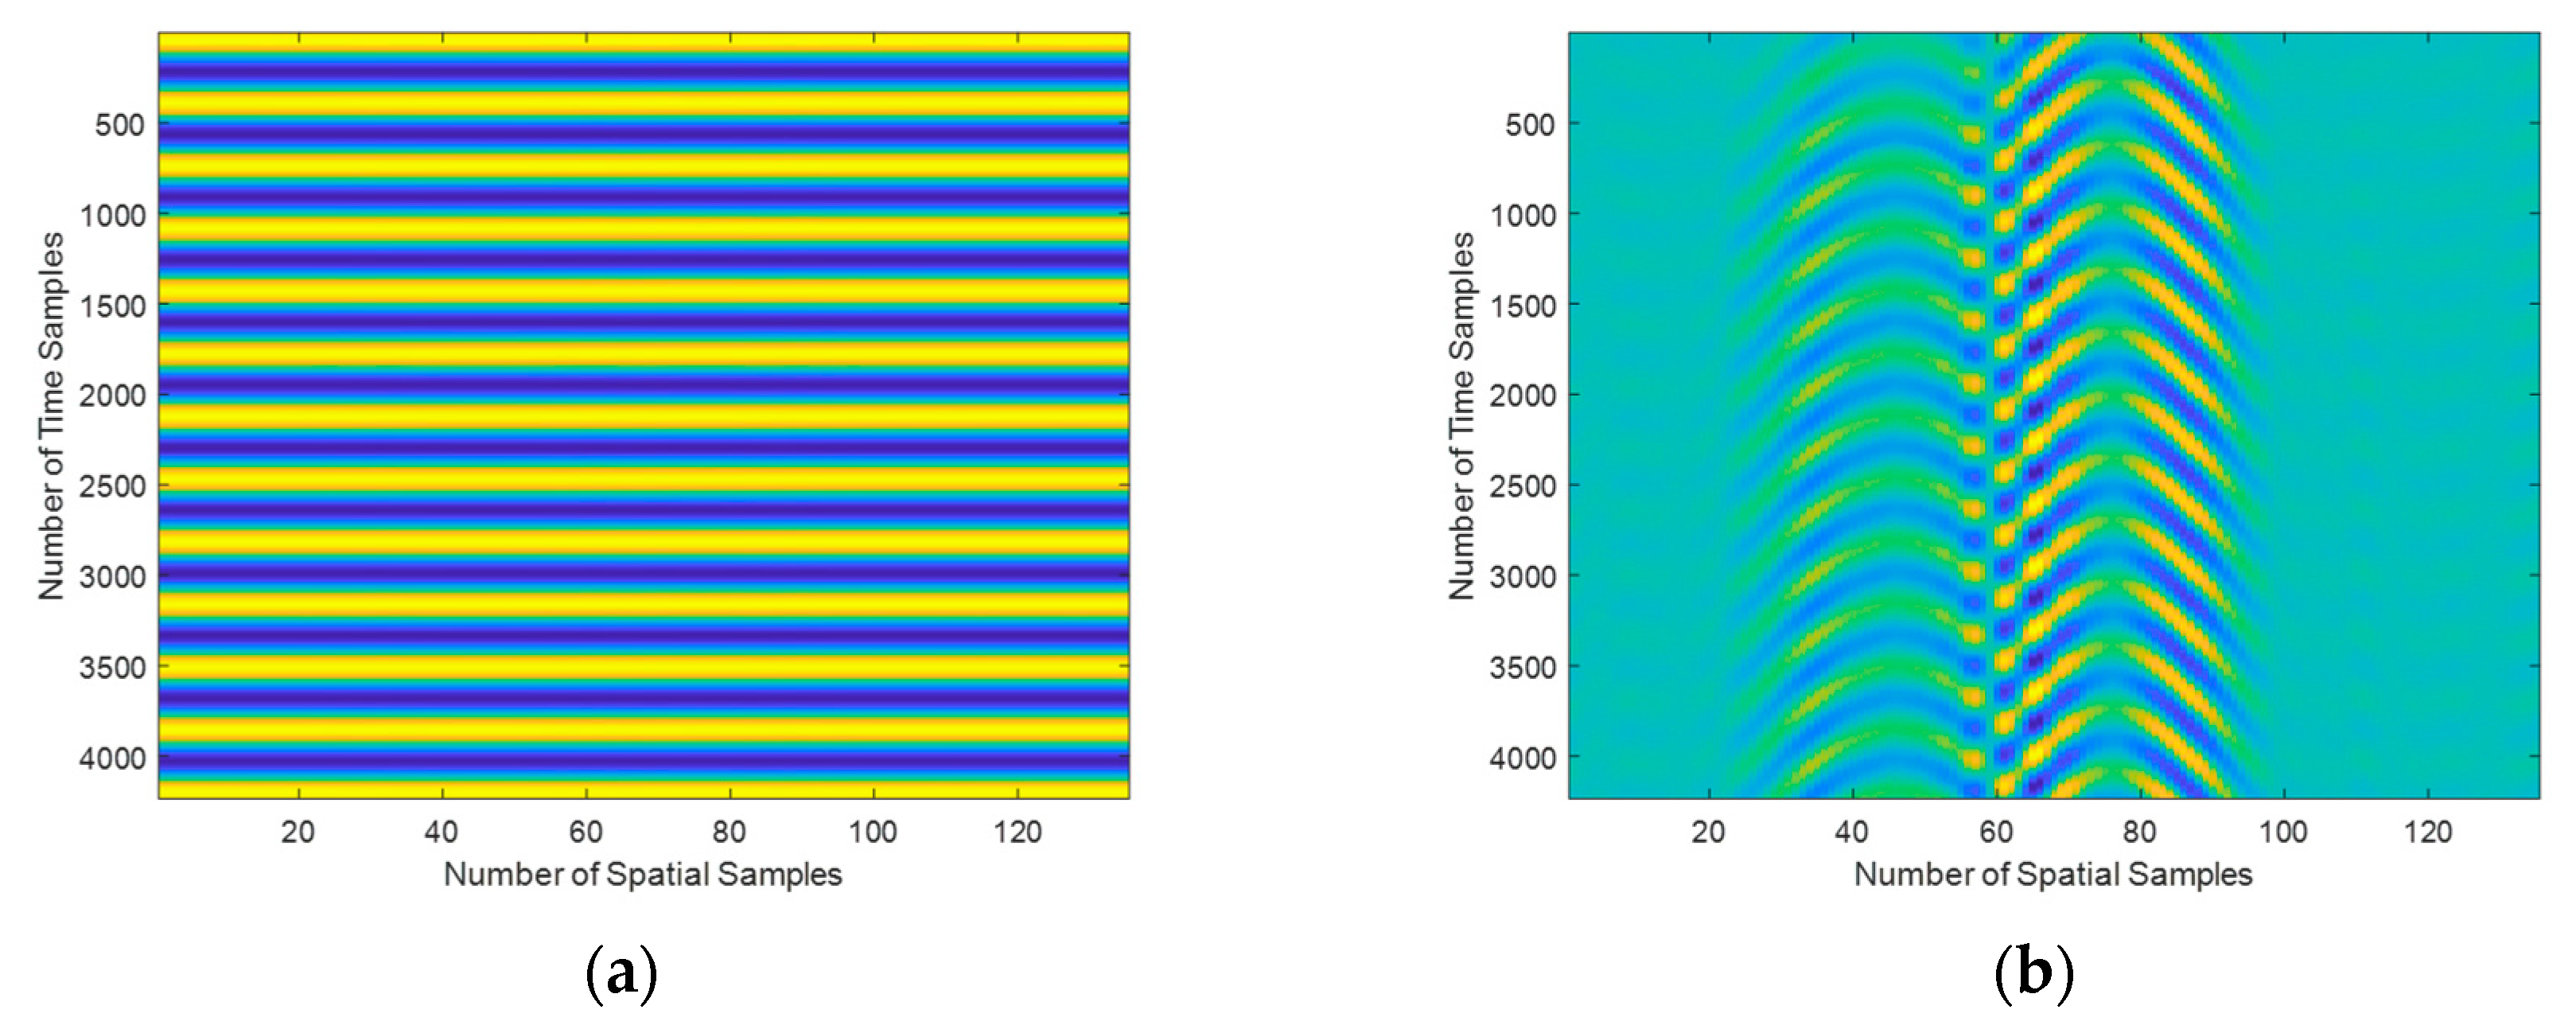
3.2.1. Echo Signals in Different Scenarios
3.2.2. Simulation of Uniform Medium Metal Ball Target Scenario
4. Discussion
5. Conclusions
Author Contributions
Funding
Data Availability Statement
Conflicts of Interest
References
- Koyan, P.; Tronicke, J.; Klose, T.; Guillemoteau, J. 3D GPR to explore peat deposits: Strategies for data acquisition, processing, and interpretation. In Proceedings of the 2023 12th International Workshop on Advanced Ground Penetrating Radar (IWAGPR), Lisbon, Portugal, 5–7 July 2023. [Google Scholar]
- Catakli, A.; Mahdi, H.; Al-Shukri, H. Attribute analyses of GPR data for heavy minerals exploration. In Proceedings of the 2012 IEEE Applied Imagery Pattern Recognition Workshop (AIPR), Washington, DC, USA, 9–11 October 2012. [Google Scholar]
- Elseicy, A.; Solla, M.; Alonso-Díaz, A.; Arias, P. Pavement layer interface detection from GPR data using deep learning. In Proceedings of the 2023 12th International Workshop on Advanced Ground Penetrating Radar (IWAGPR), Lisbon, Portugal, 5–7 July 2023. [Google Scholar]
- Akiyama, N.; Morooka, T.; Suzuki, K.; Kidera, S. Anomaly detection method with rebar response suppression for microwave ground penetrating radar pavement inspection. IEEE J. STARS 2024, 17, 12945–12958. [Google Scholar] [CrossRef]
- Novo, A.; Sala, R.; Kauffman, M.; Llobet, S.; Simon, P.R.; Arvanitis, M. High-resolution GPR investigation over a Roman mosaic in Empuries, Spain. In Proceedings of the 2021 11th International Workshop on Advanced Ground Penetrating Radar (IWAGPR), Valletta, Malta, 1–4 December 2021; pp. 1–5. [Google Scholar]
- Dematteis, N.; Troilo, F.; Grab, M.; Maurer, H.; Giordan, D. Identification of bedrock topography-related ice fractures in the Planpincieux Glacier using helicopter-borne GPR and DTM analysis. In Proceedings of the 2021 IEEE International Geoscience and Remote Sensing Symposium (IGARSS), Brussels, Belgium, 11–16 July 2021. [Google Scholar]
- Lombardi, F.; Griffiths, H.D.; Lualdi, M.; Balleri, A. Characterization of the internal structure of landmines using ground-penetrating radar. IEEE Geosci. Remote Sens. Lett. 2021, 18, 266–270. [Google Scholar] [CrossRef]
- Bestagini, P.; Lombardi, F.; Lualdi, M.; Picetti, F.; Tubaro, S. Landmine detection using autoencoders on multipolarization GPR volumetric data. IEEE Trans. Geosci. Remote Sens. 2021, 59, 182–195. [Google Scholar] [CrossRef]
- Huan, Z.; Zhao, J.; Xiang, B.; Xiong, Q.; Deng, F. Parallel plate VLF mechanical antenna. In Proceedings of the 2018 IEEE International Symposium on Antennas and Propagation & USNC/URSI National Radio Science Meeting, Boston, MA, USA, 8–13 July 2018. [Google Scholar]
- Cui, Y.; Wu, M.; Song, X.; Huang, Y.-P.; Jia, Q.; Tao, Y.-F.; Wang, C. Research progress of small low-frequency transmitting antenna. Acta Phys. Sin. 2020, 69, 208401. [Google Scholar] [CrossRef]
- Bickford, J.A.; Duwel, A.E.; Weinberg, M.S.; McNabb, R.S.; Freeman, D.K.; Ward, P.A. Performance of electrically small conventional and mechanical antennas. IEEE Trans. Antennas Propag. 2019, 67, 2209–2223. [Google Scholar] [CrossRef]
- Zhou, Q.; Yao, F.; Shi, W.; Hao, Z.; Zheng, H.; Liu, B.; He, P. Research on mechanism and key technology of mechanical antenna for a low-frequency transmission. Sci. Sin. Technol. 2020, 50, 69–84. [Google Scholar] [CrossRef]
- Fu, Y.; Li, D.; Wang, Z.; Zhong, J.; Li, J.; Zhu, X. Research on piezoelectric acoustically excited miniaturized antennas for low-frequency transmitting with experimental validation. IEEE Sens. J. 2025, 25, 2244–2253. [Google Scholar] [CrossRef]
- Li, W.; Li, D.; Zhou, K.; Fu, Q.; Yuan, X.; Zhu, X. A survey of antenna miniaturization technology based on the new mechanism of acoustic excitation. IEEE Trans. Antennas Propag. 2023, 71, 263–274. [Google Scholar] [CrossRef]
- Li, W.; Wang, Y.; Zheng, J.; Xu, B.; Zhu, X. Nonreciprocal electromagnetic transmission and reception mechanisms of magnetoelectric acoustically excited antennas. IEEE Antennas Wirel. Propag. Lett. 2024, 23, 4268–4272. [Google Scholar] [CrossRef]
- Liu, J.; Zhang, C.; Li, K.; Ji, Y.; Ma, S.; Gu, H.; Zhang, P.; Liang, X.; Gao, H.; Guo, J.; et al. Acoustically mediated piezoelectric antenna for ultracompact biomedical electronics. IEEE Antennas Wirel. Propag. Lett. 2025, 24, 374–378. [Google Scholar] [CrossRef]
- Zhang, C.; Ji, Y.; Gu, H.; Zhang, P.; Liu, J.; Liang, X.; Yang, F.; Ren, T.; Nan, T. Surface acoustic wave actuated MEMS magnetoelectric antenna. IEEE Electron. Device Lett. 2024, 45, 2009–2012. [Google Scholar] [CrossRef]
- Wang, F.; Zhang, Q.; Ye, S.; Yang, G.; Shi, C.; Qin, Z. A three-dimensional imaging ground penetrating radar system based on SAA. Mod. Radar 2020, 42, 21–27. [Google Scholar]
- Liu, S.; Wang, W.; Fu, L.; Lu, Q. Linear prediction-based DOA estimation for directional borehole radar 3-D imaging. IEEE Trans. Geosci. Remote Sens. 2019, 57, 5493–5501. [Google Scholar] [CrossRef]
- Zhang, S.; Lui, H.; Wang, Y.; Meng, X. Design of a Directional Borehole Radar System. In Proceedings of the 2024 Photonics & Electromagnetics Research Symposium (PIERS), Chengdu, China, 21–25 April 2024; pp. 1–6. [Google Scholar]
- Zeng, Z.; Li, W.; Xi, J.; Huang, L.; Wang, Z. Inverse direction imaging method of array type GPR based on DOA estimation. J. Jilin Univ. (Earth Sci. Ed.) 2017, 47, 1308. [Google Scholar]
- Haigh, S.; Kulon, J.; Partlow, A.; Gibson, C. Comparison of Objectives in Multiobjective Optimization of Ultrasonic Positioning Anchor Placement. IEEE Trans. Instrum. Meas. 2022, 71, 2513212. [Google Scholar] [CrossRef]
- Zhou, N.; Liu, Q.; Yang, Y.; Wu, D.; Gao, G.; Lei, S.; Yang, S. An Indoor Positioning Algorithm Based on Particle Filter and Neighbor-Guided Particle Optimization for Wireless Sensor Networks. IEEE Trans. Instrum. Meas. 2024, 73, 8500516. [Google Scholar] [CrossRef]
- Krim, H.; Viberg, M. Two decades of array signal processing research: The parametric approach. IEEE Signal Process. Mag. 1996, 13, 67–94. [Google Scholar] [CrossRef]
- Shan, T.-J.; Wax, M.; Kailath, T. On spatial smoothing for direction-of-arrival estimation of coherent signals. IEEE Trans. Acoust. Speech Signal Process. 1985, 33, 806–811. [Google Scholar] [CrossRef]
- Pillai, S.U.; Kwon, B.H. Forward/backward spatial smoothing techniques for coherent signal identification. IEEE Trans. Acoust. Speech Signal Process. 1989, 37, 8–15. [Google Scholar] [CrossRef]
- Yan, L.; Liu, H.; Xia, Y. Survey on space-air-ground integrated multi-target tracking algorithms. J. Signal Process. 2024, 40, 1951–1971. [Google Scholar]


| Radar Manufacturer | Center Frequency | Antenna Dimension |
|---|---|---|
| Sensors & Software Pluse EKKO | 50 MHz | 2 m (length) |
| 100 MHz | 1 m (length) | |
| 200 MHz | 0.5 m (length) | |
| GSSI | 100 MHz | 2.031 m × 0.965 m × 0.305 m |
| 200 MHz | 0.6 m × 0.6 m × 0.3 m |
| True Coordinate (x, y, z)/m | Estimated Coordinate (x, y, z)/m | Coordinate Estimation Error/m | |
|---|---|---|---|
| Target 1 | (11, 3.5, −3.5) | (11.0003, 3.4937, −3.5082) | 0.0104 |
| Target 2 | (17, 0.5, −2.5) | (17.0024, 0.5074, −2.5175) | 0.0192 |
| True Coordinate (x, y, z)/m | /m | /m | /m | RMSE/m | |
|---|---|---|---|---|---|
| Target 1 | (11, 3.5, −3.5) | 0.0025 | 0.0042 | 0.0157 | 0.0165 |
| Target 2 | (17, 0.5, −2.5) | 0.0017 | 0.0073 | 0.0153 | 0.0170 |
| Parameter | Value |
|---|---|
| relative permittivity | 6 |
| conductivity | 0.001 S/m |
| relative permeability | 1 |
| type of waveform | continuous sine |
| center frequency | 60 MHz |
| True Coordinate (x, y, z)/m | Estimated Coordinate (x, y, z)/m | Coordinate Estimation Error/m | |
|---|---|---|---|
| Target 1 | (11, 2.5, −3.5) | (10.9588, 2.4881, −3.5116) | 0.0444 |
| Target 2 | (17, −0.5, −2.5) | (16.9983, −0.54129, −2.5269) | 0.0498 |
Disclaimer/Publisher’s Note: The statements, opinions and data contained in all publications are solely those of the individual author(s) and contributor(s) and not of MDPI and/or the editor(s). MDPI and/or the editor(s) disclaim responsibility for any injury to people or property resulting from any ideas, methods, instructions or products referred to in the content. |
© 2025 by the authors. Licensee MDPI, Basel, Switzerland. This article is an open access article distributed under the terms and conditions of the Creative Commons Attribution (CC BY) license (https://creativecommons.org/licenses/by/4.0/).
Share and Cite
Ju, C.; Liu, Y.; Liu, J.; Nan, T.; Cheng, X.; Zhang, Z. Three-Dimensional Localization Method of Underground Target Based on Miniaturized Single-Frequency Acoustically Actuated Antenna Array. Electronics 2025, 14, 1859. https://doi.org/10.3390/electronics14091859
Ju C, Liu Y, Liu J, Nan T, Cheng X, Zhang Z. Three-Dimensional Localization Method of Underground Target Based on Miniaturized Single-Frequency Acoustically Actuated Antenna Array. Electronics. 2025; 14(9):1859. https://doi.org/10.3390/electronics14091859
Chicago/Turabian StyleJu, Chaowen, Yixuan Liu, Jianle Liu, Tianxiang Nan, Xinger Cheng, and Zhuo Zhang. 2025. "Three-Dimensional Localization Method of Underground Target Based on Miniaturized Single-Frequency Acoustically Actuated Antenna Array" Electronics 14, no. 9: 1859. https://doi.org/10.3390/electronics14091859
APA StyleJu, C., Liu, Y., Liu, J., Nan, T., Cheng, X., & Zhang, Z. (2025). Three-Dimensional Localization Method of Underground Target Based on Miniaturized Single-Frequency Acoustically Actuated Antenna Array. Electronics, 14(9), 1859. https://doi.org/10.3390/electronics14091859