Article

Probabilistic Measurement of CTI Quality for Large Numbers of Unstructured CTI Products

by
Georgios Sakellariou
*,
Menelaos Katsantonis
and
Panagiotis Fouliras
Department of Applied Informatics, University of Macedonia, 156, Egnatia Str., 54636 Thessaloniki, Greece
*
Author to whom correspondence should be addressed.
Electronics 2025, 14(9), 1826; https://doi.org/10.3390/electronics14091826
Submission received: 15 March 2025 / Revised: 25 April 2025 / Accepted: 28 April 2025 / Published: 29 April 2025
(This article belongs to the Section Computer Science & Engineering)

Abstract

:
This paper addresses the critical challenge of evaluating the quality of Cyber Threat Intelligence (CTI) products, particularly focusing on their relevance and actionability. As organizations increasingly rely on CTI to make cybersecurity decisions, the absence of CTI quality metrics challenges the assessment of intelligence quality. To address this gap, the article introduces two innovative metrics. Relevance ( R e ) and Actionability ( A c ) are designed to evaluate CTI products in relation to organizational information needs and defense mechanisms. Using probabilistic algorithms and data structures, these metrics provide a scalable approach for handling large numbers of unstructured CTI products. Experimental findings demonstrate the effectiveness of metrics in filtering and prioritizing CTI products, offering organizations a tool to prioritize their cybersecurity resources. Furthermore, experimental results demonstrate that, using the metrics, organizations can reduce candidate CTI products by several orders of magnitude, understand weaknesses in defining information needs, guide the application of CTI products, assess CTI products’ contribution to defense, and select CTI products from information sharing communities. In addition, the study has identified certain limitations, which open avenues for future research, including the real-time integration of CTI into organizational defense mechanisms. This work significantly contributes to standardizing the quality evaluation of CTI products and enhancing organizations’ cybersecurity posture.

1. Introduction

Cyberattacks continuously threaten organizations worldwide, seeking to compromise their assets’ confidentiality, integrity, and availability. In the past decade, the majority of threat actors have become professionals, with the European Union Agency for Cybersecurity (ENISA), distinguishing the majority of them into the following groups: state-sponsored actors, cybercrime actors, hacker-for-hire actors, and hacktivists [1]. At the same time, these actors can organize highly sophisticated and coordinated attacks, such as disinformation attacks [2], side channel attacks [3,4], distributed denial of service [5], and supply chain attacks [6].
This hazardous environment has led organizations to adopt new defense mechanisms, with CTI having a prominent role in their defense arsenal. CTI is the field where data from various sources are collected, analyzed, and assessed about threat actors and their motivation, attacks’ methodology, and victims to produce intelligence that helps organizations prevent or predict a cyberattack and follow intelligence-based decision making [7]. Although most cybersecurity specialists understand the importance of CTI and believe that the quality of CTI meets their standards, they are also concerned about missing actionable CTI due to the large scale of data that must be processed daily [8].
The large number of CTI sources and data that organizations use in their daily defense against threat actors makes the identification of actionable and relevant CTI a problem that lies in the area of Big Data since the 5Vs (velocity, volume, value, variety, and veracity) differentiate the generated intelligence and its application within defense mechanisms. In addition, relevance and actionability are key quality factors of CTI, introducing the dimension of quality of CTI as an alternative point of view to manage this problem.
In general, the information within CTI encompasses both structured and unstructured data, serving as the input or output of a threat intelligence process [7]. Therefore, identifying the most relevant and actionable CTI products for an organization or a security analyst based on the CTI quality of a large-scale data flow is the problem that this work deals with. To formulate this problem, we have determined the following research questions.
  • RQ1: In what ways can the relevance and actionability of unstructured CTI products be defined and quantitatively assessed?
  • RQ2: What methodologies can be employed to rigorously assess the CTI products in relation to the organizations willing to use them?
  • RQ3: In what manner can the proposed methodologies be systematically applied to extensive datasets?
To answer these questions, we have developed the Relevance ( R e ) and Actionability (Ac) CTI quality metrics that leverage probabilistic data structures and algorithms to face the large-scale unstructured CTI products, which are the main contribution of this work. Toward the development of R e , we discuss the information needs of an organization in terms of CTI and introduce the concept of analyzing an organization as an open system in the context of CTI. Similarly, in the case of A c , we analyze the decision-making process in the context of cybersecurity of an organization, and we propose an innovative modeling approach for it, which drives us in the definition of the metric in relation to the defense mechanisms of an organization. Finally, in the last part of this work, we implement the metrics and experimentally measure them against a dataset of CTI products.
The remainder of this paper is organized as follows. Section 2 presents the related work and alternative approaches in the bibliography. Section 3 presents the background of this work is divided into three subsections; in Section 3.1, we present the key concepts and definitions related to this work; in Section 3.2, we formally define the problem described in the introduction and in Section 3.3, we present the algorithmic and mathematical background of this work. The proposed metrics are presented in Section 4. In Section 5, we propose an implementation of the two metrics and explain the implementation assumptions. In addition, the experimental results of the application of the proposed metrics in unstructured CTI products are analyzed. Finally, in Section 6, we present our conclusions and future work.

2. Related Work

In the bibliography, few works deal with massive unstructured CTI data quality. There is a perplexity between the quality of CTI sources and the quality of the produced intelligence (CTI products). Moreover, the formal identification of actionable and relevant CTI quality factors remains a significant research challenge, due to the diverse methodologies employed by researchers. Only a part of the bibliography deals with CTI quality; for example, Tale et al. [9] discuss the quality of large unstructured data. They propose the construction of a data quality profile for a dataset using only a sample for their analysis that captures the general features, such as type, format, and data domain. They use the data quality profile as input in their unstructured big data quality assessment model to evaluate the overall quality of the dataset. But their work is domain-agnostic and does not focus on CTI.
Zibak et al. [10] assess the quality of threat intelligence by identifying key dimensions—such as accuracy, actionability, interoperability, provenance, relevance, reliability, and timeliness—utilizing a systematic literature review and a Delphi study with input from 30 experts. They differentiate between threat data and intelligence, emphasizing their distinct purposes and quality priorities. Their study reveals a lack of standardized metrics for assessing intelligence quality and stresses the need for aligning intelligence products with user needs. Challenges like privacy issues, limited resources, and underdeveloped threat intelligence programs obstruct quality evaluation. Although their study does not delve into the technical aspects of CTI quality assessment or the factors added by the volume of CTI data, it lays the groundwork for developing metrics and frameworks to improve the quality and efficacy of threat intelligence.
Tundis et al. [11] present a feature-oriented approach to automate the evaluation of open-source CTI sources, with a particular emphasis on Twitter. They introduce a CTI relevance score designed to measure the significance of sources by leveraging metadata and word embeddings, prioritizing both timeliness and informativeness. Their experiments show enhancements in the early detection of cyber threats, minimizing alert delays while preserving accuracy. Nevertheless, their research concentrates on the quality of the sources and does not address the quality of the intelligence they produce. Specifically, they aim to measure the relevance of each Twitter user (considered the CTI source in their study) involved in CTI generation, but do not assess the quality features of the intelligence itself.
Azevedo et al. [12] propose the PURE platform to generate enriched Indicators of Compromise (IoCs) that improve the quality characteristics of IoCs collected from different sources of Open Source Intelligence (OSINT). To succeed in the development of enriched IoCs, the authors combine filtering, deduplication, and clustering techniques based on the similarity of IoCs. However, PURE has been designed to handle average data volumes and the authors do not explain the cost of calculating the respective similarity indices.
Schaberreiter et al. [13] propose a methodology for evaluating the trust of CTI sources. Their method is based on the calculation of ten parameters (extensiveness, maintenance, false positives, verifiability, intelligence interoperability, compliance, similarity, timeliness, and completeness) on Structured Threat Information Expression (STIX) objects and the continuous estimation of a trust indicator for each source. However, the authors follow a closed-word assumption, namely that the CTI shared by the sources comprises the entire worldview of threat intelligence, which is contrary to the belief of unknown unknowns in threat intelligence [14].
Yang et al. [15] introduce an automated approach to evaluate CTI quality by merging feed trustworthiness with content availability. They represent CTI feed interactions using a correlation graph and implement an iterative algorithm to evaluate the originality of the feed. Machine learning is applied to assess CTI content based on features, such as multi-source verification, completeness, and timeliness. Their approach integrates feed trustworthiness and content availability, incorporating a dynamic aging factor for real-time adaptability. However, because their study focuses on CTI quality factors of trustworthiness and availability, it does not address the specific characteristics of CTI consumers.
In their work, Schlette et al. [16] tackle the challenge of evaluating and illustrating the quality of CTI. They introduce a set of data quality dimensions and metrics, specifically designed for the STIX format, facilitating both automated and expert-led assessments of CTI artifacts. Additionally, they employ visual analytics to display quality indicators, enabling security analysts to interpret and engage in CTI quality evaluations. They also emphasize the significance of measuring CTI quality and its potential benefits for threat intelligence information sharing platforms. However, their approach relies on the structured nature of STIX, utilizing specific attributes, thereby limiting its applicability to structured CTI products.
Zhang et al. [17] propose the Threat Intelligence Automated Assessment Model (TIAM) for the quality assessment of large-scale CTI. More specifically, they aggregate IoCs extracted from STIX objects and sparse text-based intelligence to assess the overall intelligence. Then, they correlate the IoCs with the adversarial Tactics, Techniques, and Common Knowledge (ATT&CK) knowledge base [18] to identify potential attack techniques. TIAM defines the alert level, the created time, the external references, and the Common Vulnerability Scoring System (CVSS) (only in the case of vulnerabilities) as the assessment features of IoCs and proposes weighted scores for each evaluation. However, the authors do not explore quality factors, such as accuracy, timeliness, and completeness, and how these quality factors can be measured in the case of large-volume CTI.
While the field of CTI quality assessment still demands deeper investigation, its role in enhancing CTI sharing, boosting cybersecurity resilience, and mitigating overall risks has been evident since the inception of CTI. As highlighted by Wagner et al. [19], collaborative CTI sharing network participants must be adept at filtering relevant and actionable CTI products to prevent analysts from being overwhelmed with vast volumes of data. Additionally, as noted by Geras and Schreck [20], utilizing CTI products in a targeted manner based on their quality is essential because it contributes to real-time decision-making and reduces potential risks associated with false positive incidents, influencing an organization’s response strategies. This study addresses CTI quality challenges by proposing and applying two novel metrics, R e and A c .
The rest of the related bibliography refers to the use of big data techniques to handle CTI and its quality.
Tao et al. [21] proposed a modified classified protection model based on CTI and big data analysis techniques, in which CTI is utilized in awareness and detection of the defense mechanism. However, the system that implements the modified model is based on the bulk consumption of CTI without evaluating the quality of the data. At the same time, no false-positive/negative detection statistics are presented.
Marchetti et al. [22] propose the AUSPEX framework for the detection of advanced persistent threats (APTs). AUSPEX utilizes internal and external sources of raw data (e.g., logs, OSINT) and CTI to detect APTs, which are then analyzed using big data techniques. However, CTI is used only in the form of blacklists without mentioning their effectiveness.
Wheelus et al. [23] propose a big data architecture specialized in collecting and analyzing CTI data by combining existing and widely used big data techniques. Moreover, they use the proposed architecture to demonstrate its capabilities in a series of CTI problems, such as malware-type detection. However, they do not explore the quality of the results and how the latter can become part of CTI products.
Finally, Martins et al. [24] develop the Automated Event Classification and Correlation platform, which combines classification, trimming, enrichment, and clustering techniques to improve the quality of events on threat intelligence platforms. They propose a unified taxonomy that seeks to simplify the categorization of a threat. However, they do not explain what quality factors are intended to improve and how to measure this improvement.
Table 1 provides a summary of the findings from examining the bibliography of related work in CTI quality.
Through a comprehensive review of the pertinent literature, we have identified several research gaps, resulting in the formulation of the research questions delineated in Section 1: (a) the CTI quality factors, particularly relevance and actionability, lack precise definitions, and the metrics used for quality evaluation are not explicitly correlated with these quality factors, (b) there is a tendency to evaluate the quality of CTI products interdependently of the consumer’s (e.g., organizations) characteristics that intend to use them, and (c) the employment of CTI quality measurement on large-scale datasets remains limited.

3. Background

3.1. Key Concepts

3.1.1. Unstructured CTI Products

The results of a threat intelligence process are called CTI products [7]. Those results can take a structured or unstructured format. Structured CTI products [25] are formatted following a standard such as STIX [26], whereas unstructured CTI products are written in natural language or do not follow a well-defined standard [27]. For the remainder of this paper, we focus on unstructured CTI products and use unstructured text data that contain information about cybersecurity as our experimental base.

3.1.2. Relevance CTI Quality Factor

Relevance is a crucial CTI quality factor [28], which determines the level at which the content of a CTI product meets the informational needs of a specific CTI consumer employing it in decision making [7,10]. Pawlinski et al. [29] state that a piece of information (e.g., a CTI product) is considered relevant if it is “applicable” in the area of the one that uses it, where the term “area” describes the networks, software, and hardware comprising one’s systems. Moreover, Deliu et al. [30] stress that an effective CTI process should result in relevant CTI products. In summary, the relevance CTI quality factor reflects the level at which a CTI product is considered to have a cybersecurity impact on the CTI consumer. In this context, “impact” pertains to modifications within the system, which may manifest as alterations in the system architecture, implementation of security controls, and the commencement of cybersecurity protocols (e.g., incident management).

3.1.3. Actionability CTI Quality Factor

In general terms (that is, including system decisions, e.g., Intrusion Detection System (IDS) detection and experts’ decisions), the actionability CTI quality factor expresses the immediacy of the use of a CTI product in a decision-making process [28]. In addition, actionability appears to be a compound quality factor that integrates other CTI quality factors such as relevance, completeness, ingestibility, accuracy, and timeliness [19,28,29]. In general, actionability reveals at what level a CTI product can initiate a decision by a CTI consumer at a given moment [7,10].

3.1.4. Relevance vs. Actionability

At this point, we need to clarify the relationship between the two quality factors and why it is important for organizations to be aware of both factors in the context of CTI. In simple terms, we can say that an actionable CTI product is always relevant to an organization, but a relevant CTI product is not always actionable. The main reasons for this proper-subset relationship between relevance and actionability are time and the organization’s ability to use CTI products. Within the scope of CTI, organizations need to recognize the importance of the relevance quality factor to determine which CTI products pertain to them (such as CTI products related to the software the organization employs). Conversely, it is essential for an organization to consider the actionability quality factor to ascertain whether a CTI product can be used by its current capabilities (e.g., by an IDS) at any specific time.

3.2. Problem Definition

Consider a set of CTI sources S, which produce a large number of unstructured CTI products that have the characteristics of big data’s 5Vs (velocity, volume, value, variety, and veracity). In this case, the fundamental research question is how we can evaluate the quality of those unstructured CTI products in reference to a given organization C that aims to use them as input to a decision-making or CTI process and wants to avoid investing resources in the analysis of unrelated data. In this context, we investigate the development of two metrics, R e and A c , to quantify the relevance and actionability of CTI quality factors for unstructured CTI products, respectively.
At this juncture, it is crucial to explore the challenges linked to the nature of unstructured CTI products, which stem from their unstructured text-based format. Evaluating any quality factor of unstructured CTI products necessitates recognizing the obstacles in handling large quantities of text data. The primary challenges include the inherent ambiguity of natural languages, the limits on scalability in text mining [31], and the identification of content. However, in our situation, the proposed metrics effectively address these challenges by employing techniques and algorithms that are specifically designed to handle the typical issues encountered in text mining.

3.3. Probabilistic Algorithms and Data Structures

Probabilistic algorithms and data structures have been proposed in the bibliography [32] to handle problems in the area of Big Data. Those algorithms, being nondeterministic by definition, utilize mainly hashing techniques, and their results include a “tolerable” error. Next, we present two categories of probabilistic algorithms and data structures: those focusing on the similarity problem, and those focusing on the membership problem. We use the first category of algorithms on the definition of the relevance metric ( R e ), and the second category of algorithms on the definition of the actionability metric ( A c ).

3.3.1. Probabilistic Algorithms and Data Structures of Similarity Category

Probabilistic algorithms and data structures in the similarity category handle problems such as finding the nearest neighbor for a given document, detecting duplicates, and clustering. This similarity category includes algorithms and data structures such as MinHash [33]. Similarity expresses the level of resemblance between two objects (for example, documents). To handle this problem numerically, objects are usually represented as sets of features called canonical forms in the case of documents. Then, the Jaccard similarity is used to calculate the percentage of their common features (i.e., similarity). Formally, the Jaccard similarity for two documents d 1 , d 2 , is given by the following formula: J ( d 1 , d 2 ) = | d 1 d 2 | | d 1 d 2 | , where | d 1 d 2 | represents the count of features shared by both d 1 and d 2 , and  | d 1 d 2 | signifies the total count of distinct features present in either d 1 or d 2 . It is important to highlight that we have opted for Jaccard similarity among various document similarity metrics [34,35] as it is integral to the theory of the M i n H a s h  algorithm.
M i n H a s h implements Locality Sensitive Hashing (LSH) [36]. The basic idea is that when similar documents are hashed with an LSH algorithm, they are highly likely to produce hash values in a close range. An LSH function generally ensures that the collision probability for similar documents is higher than for two irrelevant, random documents. An LSH algorithm combines two functions: Locality-Sensitive Bucketing, which maps documents in a hash table of buckets indexed by the hash values, and the Finding Similar Documents function, which searches the hash table for a given document d and returns its candidate documents, then calculates the similarity of d and the returned documents to find those that have a similarity above a certain threshold.
In the case of M i n H a s h , let us consider a set of indexed features (words) that we are looking for in documents, and let us say that a document (d) contains a number of these features. If we construct a bit array for the indexes and set the indexes of the features of d to 1 and randomly permutate the indexes, then the M i n H a s h value of d is the position of the left-most set bit on the permutated bit array. If we choose k-random permutations, we construct the M i n H a s h signature for d by assigning each of the respective M i n H a s h values to a k-length vector. For a set of documents d i , M i n H a s h creates the M i n H a s h signature matrix, where the rows correspond to permutations and the columns to documents. In its implementations, M i n H a s h uses a random hash function. Moreover, it has been proven that for documents d 1 , d 2 , the probability that their signatures on the M i n H a s h signature matrix are equal is the Jaccard similarity of those documents P ( m i n h a s h s i g ( d 1 ) = m i n h a s h s i g ( d 2 ) ) = J ( d 1 , d 2 ) .

3.3.2. Probabilistic Algorithms and Data Structures of Membership Problem Category

Probabilistic algorithms and data structures belonging to the category of the membership problem are tasked with deciding whether an element is a member of a dataset or not [32]. The category of membership problem includes algorithms and data structures like the Bloom filter [37] and the Cuckoo filter [38]. A Cuckoo filter is a data structure that leverages Cuckoo hashing.
Hash functions, particularly cryptographic hash functions (e.g., SHA256), are widely used in cybersecurity and play a crucial role in probabilistic algorithms and data structures. Generally speaking, a hash function maps an arbitrary size of data to a fixed-length hash value: h ( x ) y ( k l e n g t h ) , y : a v a l u e o f f i x e d k -length. A hash table is a dictionary that comprises a m-length unordered array of k-buckets indexed by key k ϵ [ 0 , m 1 ] . An element x is inserted in the bucket with the key k = h ( x ) , where h is a hash function of the range [ 0 , m 1 ] .
Cuckoo hashing utilizes two hash functions instead of one to index a new element to the cuckoo hash table, namely an array of buckets where an element has two candidate buckets, one for each hash function. A new element is inserted into one of these two buckets if it is empty; otherwise, the algorithm randomly selects one of the two occupied buckets and inserts the element, moving the existing element to its alternative candidate bucket. The process repeats until an empty bucket is found or until a maximum number of displacements is reached. Lookup and deletion are performed by determining the candidate buckets of an element by computing the two hashes.
A cuckoo filter is a variation of a cuckoo hash table, but instead of key-value pairs, it stores fingerprints (f) of a predefined length (p). A cuckoo filter consists of a hash table with a bucket capacity b. The indices of the candidate buckets for an element x are calculated by applying the following three equations: f = h ( x ) m o d p , i = h ( x ) m o d m , and  j = ( i h ( f ) m o d m ) m o d m . The interesting characteristics of a cuckoo filter with respect to the membership problem are that false positives are possible with probability P f p 2 b 2 p . In contrast, false negatives are impossible (that is, P f n = 0 ). Moreover, cuckoo filters support dynamic addition and deletion.

4. Proposed Algorithms

4.1. Methodology

To define the proposed metrics R e and A c , we adopt a structured methodology for developing CTI metrics [27]. This methodology is outlined in the eight steps of Table 2. Briefly, in Section 4.2.1, Section 4.2.2, Section 4.3.1 and Section 4.3.2, we address all the aspects related to STEP-1 of the methodology for the R e and A c metrics, respectively. Section 4.2.3 and Section 4.3.3 provide an in-depth analysis of the application of the remaining steps for developing these two CTI metrics. By employing this systematic approach, we integrate the quality characteristics of a metric into its definition, enabling a theoretical evaluation of different metrics.

4.2. Defining the Relevance CTI Quality Metric

To quantify the relevance of a CTI product, we need to determine the reference point to which we define and measure the CTI quality metric, which in our case is organization C (cf. Section 3.2). As discussed in Section 3.1, the relevance quality factor is related to the informational needs of C and the applicability and the potential impact of a CTI product on C. However, to define the Relevance quality metric, R e , we need to analyze in more detail what organization C is and how those abstract notions (i.e., informational needs, applicability, impact) are defined within C.

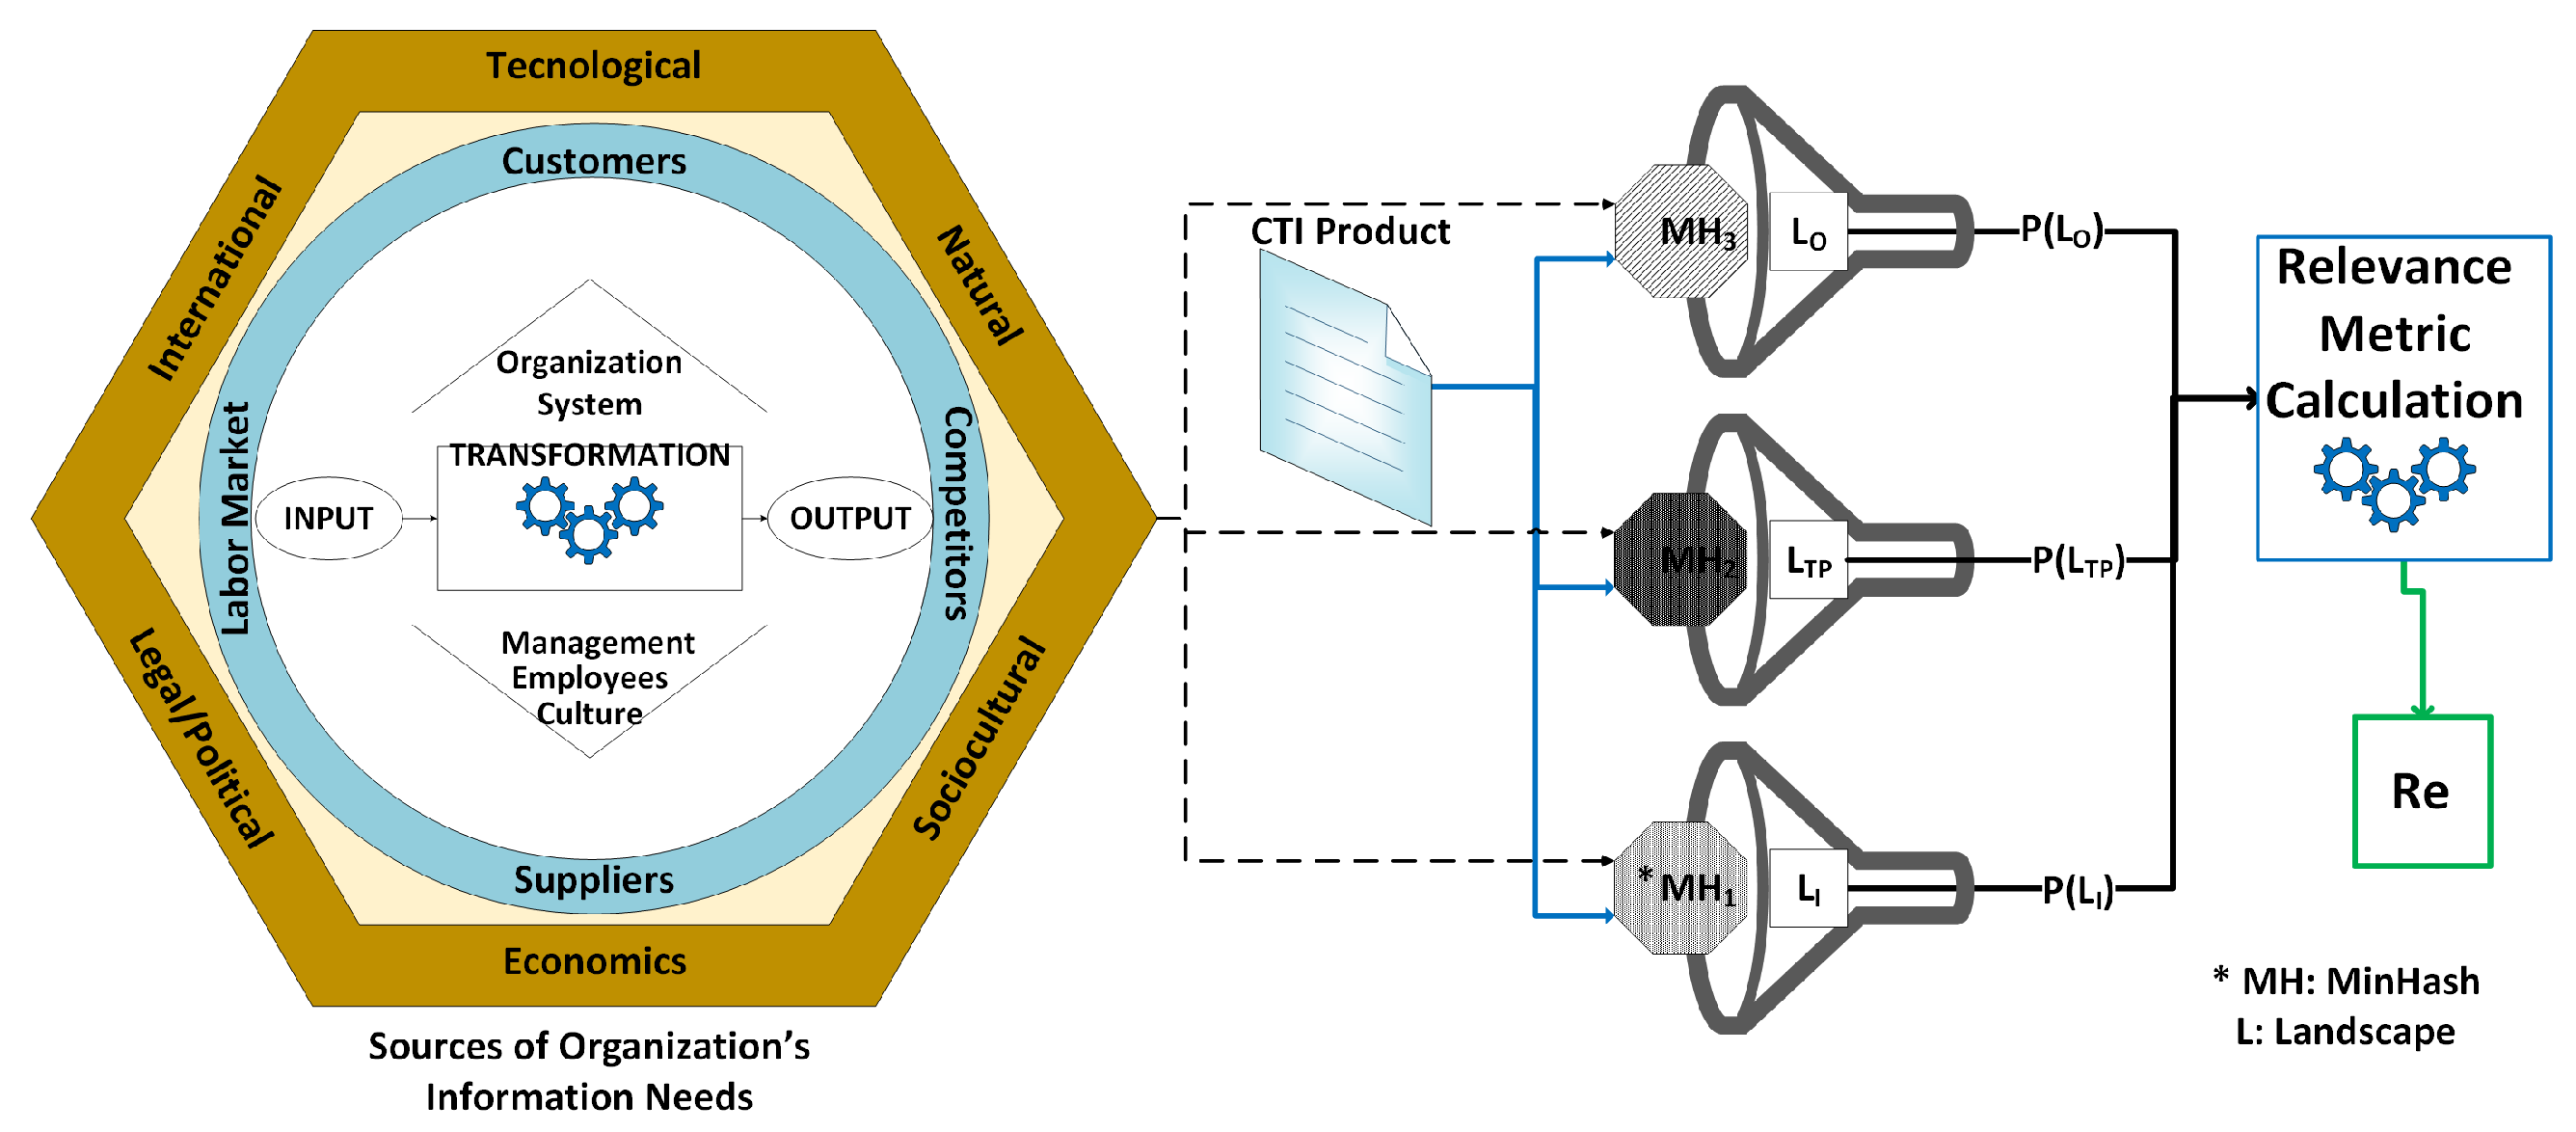
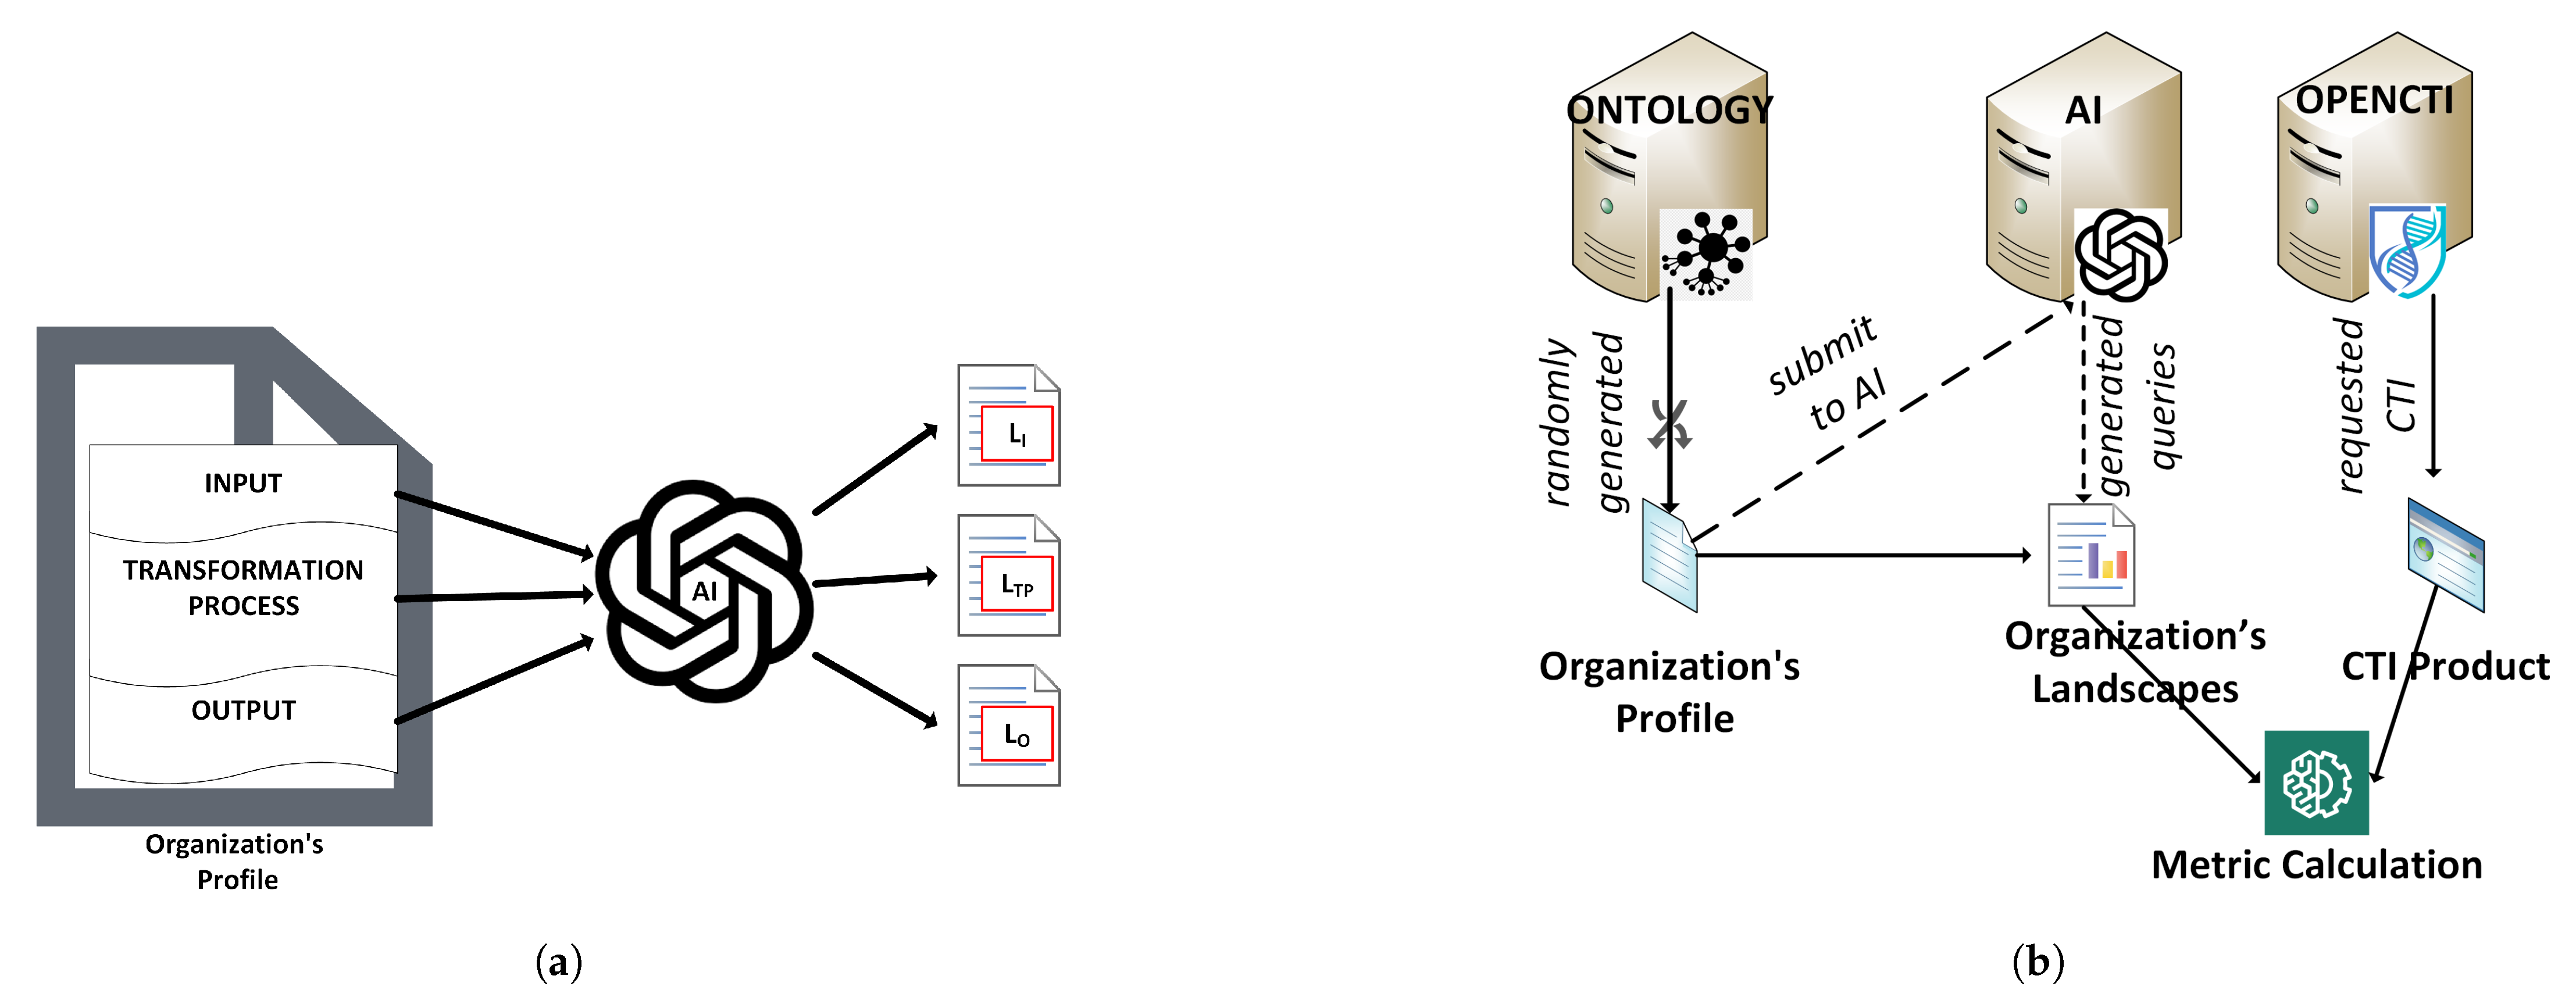
4.2.1. Determining Organization C

According to Scott and Davis [39], an organization can be described as an open system [40], meaning that it comprises parts that operate as one, interacting with the environment to achieve its goal. As a result, an organization is modeled as a system that receives input (i.e., materials, human resources, capital, technology, information), applies a transformation (i.e., work activities, management activities, technology, and operations methods) and generates output (i.e., products, information, financial, and human impact). The environment that affects an organization can be further divided into three layers [41]:
  • the general environment
  • the task environment and the internal environment.
The general environment affects all organizations almost equally and includes international, technological, natural, sociocultural, economic, and legal/political aspects. The task environment includes customers, competitors, suppliers, and the labor market, which interact directly with an organization. Finally, the internal environment includes the interorganizational aspects of employees, management, and culture, which handle the transformation of input to output.

4.2.2. Organization Aspects and the Relevance CTI Quality Metric

The environments described in Section 4.2.1 determine the information needs, the applicability, and the impact of a CTI product on an organization. The core idea of the proposed quality metric R e is the observation that an organization is interested in information that helps it survive (i.e., applicability and impact) and obtains this information as input from each of its environments. Information needs are usually expressed as questions, e.g., which vulnerabilities affect our information systems? Which business areas were attacked more last year?
At the same time, information applicability and impact can act as a filter for potential answers to information needs. For example, let us assume that an organization receives CTI products related to cyber attacks in business areas similar to those in which the organization operates; moreover, those cyber attacks are based on the exploitation of a specialized operating system. In this case, the organization needs to know about cyber attacks against the business areas in which it operates (information need). Consequently, it investigates the received CTI products to determine whether the exploited operating system is part of its information systems (applicability) and whether the version of the operating system it uses can be exploited (impact).
To focus more on CTI, we identify the following relative aspects of each environment [41] that can be a source of threat information for an organization: international, technological, customers, competitors, suppliers, and employees. Each of these aspects can be related to the input, the transformation process, and the output of an organization. Hence, the fundamental question is as follows: How can we use those environmental aspects to identify the potential relationship of a CTI product with an organization? To answer this question, we observe that a threat can impact the inputs, the transformation process, or the output of an open system. For this reason, we adopt and extend the notion of the information landscape [42] to combine the information needs of the organization related to a CTI product and the applicability and impact of the information that a CTI product delivers to an organization. For each organization, we propose three information landscapes: input landscape ( L I ), transformation process landscape ( L T P ), and output landscape ( L O ).
Landscape L I includes the information needs related to the suppliers, competitors, and capital sources of an organization. Those needs arise from the potential later impact against suppliers, competitors, and capital sources that a cyber threat can cause to an organization.
Landscape L T P includes information needs related to an organization’s business activities (e.g., business areas that an organization operates), its internal operations (e.g., Human Resource Management (HRM)) and its information systems (that is, the information needs of L T P reflect the three risk assessment tiers described in National Institute of Standards and Technology (NIST) Special Publication (SP) 800-30 [43]).
Finally, landscape L O includes information needs related to an organization’s products (e.g., does a threat actor focus on a specific brand product?) and providing services. In the context of the Relevance metric, these landscapes are materialized as unstructured text documents that contain detailed expressed information needs.

4.2.3. Relevance Metric Generic Calculation Mechanism

The generic idea of calculating the relevance metric is based on M i n H a s h Signatures estimated between the information landscapes of an organization C and a CTI product. These probabilities represent the level at which a CTI product responds to the information needs of an organization. Then, a weighted average of those probabilities is calculated, representing the R e metric. Figure 1 depicts the generic mechanism for calculating the R e metric.
To define in detail the proposed metric R e , we follow the eight-step methodology of [27] as outlined in Table 2.

STEP 1

As a first step, we name the metric in development. According to our analysis in Section 4.2.1 and Section 4.2.2, we intend to develop a metric R e , which measures the relevance of the CTI product P with the organization C, taking into account the information needs of C.

STEP 2

Having defined the metric’s name, we need to identify and determine the variables that contribute to the metric’s calculation. So, we determine the set of variables X that calculates R e . Based on our analysis in Section 4.2.2, X includes the three landscapes L I , L T P , and  L O , and the CTI product P. So, X = { L I , L T P , L O , P } .
At this point, we need to analyze in more detail what these variables contain and how they can be constructed. First, we turn our attention to the three proposed landscapes. Each of the variables, L I , L T P , and  L O , is the textual representation of the information needs of C. Therefore, L I should contain the textual description of the information needs of C about its suppliers, competitors, and capital sources. L T P should contain the textual description of the information needs of C about its business activities, internal operations, and information systems. Finally, L O should contain the textual description of the information needs of C about its products and services. These variables can be constructed and updated using formal taxonomies (e.g., Domain Industry Taxonomy (DIT) [44]) that describe business activities, products, services, capital sources, etc., or C can construct them by writing its information in a text format (e.g., competitor A has the following business activities; we use version K of the information system B). The accurate determination of information needs in the context of CTI is a future research challenge. However, Section 5 presents an example of how organization C can construct them. Here, P represents the textual form of a CTI product.

STEP 3

Here, the methodology [27] focuses on the definition of the mathematical function that calculates the metric. So, in this step, we define a function F that calculates the R e metric. As we have previously mentioned, the idea is that when we only have to select a few CTI products from a bunch of millions of CTI products, represented in text format, we select those that are close to the information needs of an organization. We calculate the value of R e by averaging the three equally-weighted M i n H a s h values ( M H 1 , M H 2 , M H 3 ) of the CTI product P and the information landscapes of organization C. So, we define F as follows:
F ( X ) = A v g ( M H 1 ( P , L I ) , M H 2 ( P , L T P ) , M H 3 ( P , L O ) )

STEP 4

In this step, we determine the subjectivity and objectivity of R e , which is defined as Γ in [27] and takes one of the values in { S O , S S , O S , O O } . A metric is characterized as subjective or objective by examining two characteristics: the involvement or not of the human factor in the determination of its variables and the deterministic or non-deterministic characteristic of metric F. We observe that the human factor is involved in the determination of L I , L T P , and  L O because these variables express the information needs of an organization C. Therefore, R e is estimated from subjective data. Moreover, using the M i n H a s h function in the calculation of R e introduces a non-deterministic component because it requires the selection of a number of random hash functions. So, we can say that R e is a subjective metric of subjective data. In summary, we infer that Γ = S S .

STEP 5

In this step, the methodology theoretically estimates the performance of metrics F, which is usually expressed as time complexity, by analyzing the algorithm that calculates F. We use Algorithm 1 to estimate the performance of R e , expressed as time complexity. As stated in [33], a  M i n H a s h algorithm that uses k hash functions has a time complexity of O ( k n ) . The algorithm that calculates R e comprises the application of three M i n H a s h functions and the calculation of the average value of their results. Therefore, the performance of calculating R e is O ( k n ) because the three M i n H a s h functions are applied independently, and the average value is calculated only once. Consequently, the time complexity for calculating R e is O ( k n ) (which is deemed more effective when compared to using other document similarity measures, such as brute-force comparison with a complexity of ( O ( n 2 d ) )). It is important to note that performance is articulated in terms of time complexity based on the methodology outlined by [27], and serves as a comparative measure among different metric implementations. Since the population size of CTI products under evaluation is typically one, we do not undergo a space complexity analysis of the algorithm we propose. This implies that the algorithm (i.e., the three M i n H a s h ) is executed with a specific CTI product in mind. For the subsequent CTI product, the memory from the prior computation can be reused. This situation differs from time complexity, where n represents the number of distinct text documents serving as inputs to the algorithm. Additionally, we provide the experimental findings related to time and space measurement in Section 5.3.4.
Algorithm 1   R e Metric Calculation Algorithm
Require: P, L I , L T P , and  L O
        F , l 1 , l 2 , l 3 0
        l 1 M H 1 ( P , L I )
        l 2 M H 2 ( P , L T P )
        l 3 M H 3 ( P , L O )
        F A v g ( l 1 , l 2 , l 3 )

STEP 6

In this step, the methodology theoretically analyzes the accuracy of F which, in simplicity, explains how close to the real value of the metric is the calculated one. The calculation of R e includes a nondeterministic factor (that is, introduced by M i n H a s h ). Specifically, M i n H a s h estimates the J a c c a r d similarity of two given documents with an error probability ϵ related to the number of hash functions k. In simple words, the accuracy of M i n H a s h increases as the number of hash functions used increases ( ϵ 1 k [45]), with a cost on the storage space required for the calculation of M i n H a s h . Consequently, the accuracy of R e depends on the errors of the M i n H a s h functions of Algorithm 1 ( F ( ϵ 1 , ϵ 2 , ϵ 3 ) ). Thus, A = A v g ( δ 1 , δ 2 , δ 3 ) , where δ 1 = J 1 ϵ 1 ( J 1 the Jaccard similarity of P and L I ), δ 2 = J 2 ϵ 2 ( J 2 the Jaccard similarity of P and L T P ), and  δ 3 = J 3 ϵ 3 ( J 3 the Jaccard similarity of P and L O ).

STEP 7

In this step, the methodology performs a sensitivity analysis of the metric F to theoretically determine how sensitive F is to changes in its input variables. We use the elementary effects method [46] to perform a theoretical sensitivity analysis of F. To apply the elementary effects method, we first identify the variables of X whose change organization C does not control. Of the four variables, X = { L I , L T P , L O , P } , only P can be changed by actors that do not belong to C. On that note, we observe that P is the input of three different M i n H a s h functions that comprise F, and each of these has one of the variables L I , L T P , L O , as the second input. Applying the elementary effects method, we consider the t selected levels (a selected level represents a discrete value in which a variable can be set during the application of the elementary effects methods) at which P and Y ¯ (a new CTI product that is derived by randomly causing minor changes in P) can be set, where Ω is their discretized input space. Then, the elementary effect of P, E E P , is as follows:
E E P = F ( L I , L T P , L O , Y ¯ ) F ( L I , L T P , L O , P ) Δ
where Δ ϵ { 1 t 1 , 1 1 t 1 } and Y ¯ = P ± Δ . Then, the distribution F P of E E P is derived by randomly sampling Y ¯ from Ω . According to the elementary effects method, the sensitivity measures are the mean ( μ P ) and standard deviation ( σ P ) of the distribution F P , and the mean of the absolute values ( μ P * ) of | E E P | of the respective distribution | E E P | G P . Here, μ P assesses the influence of P in R e , μ P * again assesses the influence of P in R e simultaneously handling negative values of E E P , and  σ P reveals the total effects of the interactions between the variable P and the variables L I , L T P , and  L O . Following the sampling approach proposed in the elementary effects method [46], we conclude that for the distributions F P , G P derived from r samples, we calculate μ P as follows:
μ P = 1 r j = 1 r E E P = 1 r j = 1 r F ( L I , L T P , L O , Y j ¯ ) F ( L I , L T P , L O , P j ) Δ j = 1 r j = 1 r ( A v g ( M H 1 ( L I , Y j ¯ ) , M H 2 ( L T P , Y j ¯ ) , M H 3 ( L O , Y j ¯ ) ) Δ j A v g ( M H 1 ( L I , P j ) , M H 2 ( L T P , P j ) , M H 3 ( L O , P j ) ) Δ j )
To simplify the calculation, let us explore how a change Δ in P affects the value of M i n H a s h between P and L I . We consider that n-hash functions construct the M i n H a s h signatures, S i g ( X ) (i.e., n-length signature). Then, M H 1 ( L I , P ) is given by the following formula:
M H 1 ( L I , P ) = i = 1 n δ [ S i g ( L I [ i ] ) S i g ( P [ i ] ) ] , 0 n
where δ is Kronecker’s delta. Similarly, for  Y = P ± Δ , we calculate the following:
M H 1 ( L I , Y ) = i = 1 n δ [ S i g ( L I [ i ] ) S i g ( Y [ i ] ) ] , 0 n
and we name the difference between the two values α L I = M H 1 ( L I , Y ) M H 1 ( L I , P ) . Focusing on the effect of Δ in M i n H a s h calculation, we observe that it is only related to the probability of Δ affecting the bitwise comparison of the two M i n H a s h signatures. Specifically, if we define k i = S i g ( L I ) i S i g ( Y ) i and l i = S i g ( L I ) i S i g ( P ) i , then Δ always affects α L I except for P ( k i l i = 0 ) = 1 . This is equivalent to the probability that the M i n H a s h value of P and Y is equal to one, P ( M H 1 ( Y , P ) = 1 ) which is always almost one because Y derives from P by adding a small Δ . This means that the value of M H 1 ( L I , P ) is practically not affected by Δ . It is only affected by the similarity estimation error of M i n H a s h that absorbs the error introduced in M H 1 by Δ . Moreover, this error is related to the number of hash functions, n, used for the construction of M i n H a s h signatures [32]. As a result, we can consider α L I as Δ -independent, becoming equal to zero for small values of deltas. Similarly to α L I , we define α L T P , and  α L O . Hence, Equation (3) is transformed into the following:
μ P = 1 r j = 1 r ( A v g ( α L I , α L T P , α L O ) j Δ j )
In addition, for the calculation of μ * and σ , we have the following:
μ P * = 1 r j = 1 r | E E P j | = 1 r j = 1 r ( | A v g ( α L I , α L T P , α L O ) j | Δ j )
σ P 2 = 1 r 1 j = 1 r ( E E P j μ P ) 2 = 1 r 1 j = 1 r ( A v g ( α L I , α L T P , α L O ) j Δ j μ P ) 2
In conclusion, from  α L I , we can infer that for small values of deltas regarding α L T P , α L O , μ P (Equation (6)) and μ P * (Equation (7)), P has a constant influence on R e , while for large values of deltas, the value of R e depends on the deviation of Δ . Additionally, from  σ P (Equation (8)), we can infer that the interactions between P and variables L I , L T P , and  L O depend on the magnitude of the change ( Δ ). In simple words, for small changes, we expect R e ( P ) R e ( Y ) , while for large changes, we expect R e ( P ) R e ( Y ) . The threshold Δ needs to be determined experimentally, for it to be considered large enough.
Having performed the sensitivity analysis, we determine the behavior quality factor [27], as  B = ( μ P , μ P * , σ P ) , for  R e .

STEP 8

In summary, we define the following:
R e = ( { S S , O ( k n ) , B = ( μ P , μ P * , σ P ) , A = A v g ( δ 1 , δ 2 , δ 3 ) } , F ( L I , L T P , L O , P ) )

4.3. Defining the Actionability CTI Quality Metric

Similar to Section 4.2, to quantify the actionability of a CTI product, we set organization C as a reference point for the definition and measurement of A c . As mentioned in Section 3.1, actionability is related to decision-making processes, especially cybersecurity decision-making processes. As a result, to define the A c metric, we first need to analyze what a cybersecurity decision-making process is.

4.3.1. Cybersecurity Decision-Making Process and Actionability

The decision-making process has been analyzed in the literature in different contexts. However, from a cybersecurity perspective, Magna et al. [47] have modeled the decision-making process and analyzed the types of information needs that are required for a successful choice of action (decision). At the same time, Cotae et al. [48] distinguished three categories of decision-making in cybersecurity: decision-making (a) under-certainty, (b) under-risk, and (c) under-uncertainty. Those categories reflect the state of knowledge of a decision-making system at the moment when a decision is made. From this aspect, a CTI product is actionable when it transforms a decision-making process from an under-uncertainty to an under-risk or under-certainty process.
Furthermore, in the literature [43,49], the actions that a decision-making process can result in are summarized in three capability categories: (a) prevention, (b) detection, and (c) response/recovery. Consequently, a CTI product is actionable when it leads to a state change in these capabilities (e.g., adding new rules to an IDS, which is part of the detection capability). In this study, we model these capabilities as cognitive agents, calling them defense mechanisms to define the quality metric of actionability of CTI products, A c .

4.3.2. Defense Mechanism Modeling

In this study, we define a defense mechanism as a cognitive agent [50,51]. This means that a defense mechanism comprises an inference engine and a knowledge base. In addition, a defense mechanism can receive input from the environment (by communicating), perceive the environment, and generate an output that affects its environment or updates its knowledge base (see Figure 2a).
Consider a typical rule-based IDS as an example of how we can model a system with detection capability as a defense mechanism. This IDS consists of a knowledge base (i.e., the IDS’s ruleset), which stores the alert rules, and a reasoning mechanism that generates alerts. Furthermore, it receives input as new alert rules or network traffic. In the first case, the IDS updates its knowledge base, while in the second case, the IDS’s reasoning mechanism compares the network traffic with the alert rules and takes an action (e.g., generates an alert or not).
From a CTI quality perspective, the moment a defense mechanism receives a CTI product ( P i ) as input, it has its knowledge base in a given state s t i . Then, we say that a CTI product causes an action (that is, it is actionable) when the defense mechanism updates its knowledge base to a new state s t i + 1 . So, we can express the actionability of a CTI product in terms of a defense mechanism as the conditional probability of its knowledge base changes to the new state s t i + 1 given the current state of the knowledge base s t i and the input P i . In summary, we say A c ( P i ) = P r ( s t i + 1 | s t i , P i ) .

4.3.3. Actionability Metric Generic Calculation Mechanism

In the case of an organization C, with a set of defense mechanisms D = { d t } t = 1 n , all of which have their knowledge base in a randomly defined state s t i with i N , a CTI product independently of its other quality factors, can be actionable if it leads to a decision that changes one or more of the states of the knowledge base of defense mechanisms.
We observe that to measure actionability, we must examine whether a CTI product finally leads to any knowledge base change. However, if we explore all the CTI products individually, we do not need to have a quality metric. So, in the case of organization C, we propose an approximation of the overall actionability of a CTI product based on the observation that the states of the knowledge base of the defense mechanisms are the result of decisions taken against CTI products that have previously appeared. So, we associate each knowledge base state ( s t i ) of the defense mechanism with the respective set of CTI products S t P ( i ) = { P t 1 , . . . , P t i } , which leads to this state. We estimate the actionability of a given CTI product P t i + 1 in the organization C as the average probability that P t i + 1 is a member of these sets S t P ( i ) . In the case of large amounts of unstructured CTI products, to estimate this probability, we propose the use of Cuckoo filters. Specifically, we construct a Cuckoo filter, C F [ S t P ( i ) ] , for each S t P ( i ) (that is, a Cuckoo filter for each defense mechanism), and calculate the actionability of a new CTI product, P t i + 1 , based on the membership test of it against the Cuckoo filters. Figure 2b presents the generic calculation mechanism of the proposed actionability metric.
Similarly to Section 4.2.3, we apply the eight-step methodology of Table 2. For the sake of brevity, we avoid explaining the purpose of each step as we do in Section 4.2.3.

STEP 1

Based on our analysis in Section 4.3.1 and Section 4.3.2, we propose a metric A c , which measures the actionability of the CTI product P from the defense mechanisms of an organization C.

STEP 2

Following the previous discussion, we observe that the variables involved in the calculation of A c are the CTI product, P, for which we estimate its actionability and n Cuckoo filters (that is, equal to the number of defense mechanisms of organization C). So, the set of variables, X, used for the estimation of A c is as follows: X = { P , C F [ S P ( 1 ) ] , . . . , C F [ S P ( n ) ] } .

STEP 3

Based on the methodology of Table 2, we have to define the function F that computes the metric A c . As mentioned previously, the idea is to measure the actionability of a CTI product P in relation to the organization C, by testing the potential membership of P in the sets of CTI products that have contributed to the knowledge base state of each defense mechanism of C. All defense mechanisms are equally weighted in membership testing. So, we test P against each constructed Cuckoo filter and average the total score. Specifically, we define the function F as follows:
F ( X ) = i = 1 n ( δ i ) n , w h e r e δ i = 1 , i f P m e m b e r   o f C F [ S P ( i ) ] 0

STEP 4

Similarly to Section 4.2.3, in this step we determine the objectivity and subjectivity, Γ , of  A c . We observe that none of the variables of F are affected by a human factor, so we infer that A c is calculated by objective data. On the other hand, the membership decision that a Cuckoo filter provides comes with a probability of false positive [32], which depends on the Cuckoo filter’s constructive characteristics. So, the decision part of F is non-deterministic and we consider that F is a subjective function applied to objective variables. Hence, we infer that Γ = S O .

STEP 5

To estimate the performance M of Table 2 for A c , we use the Algorithm 2, from which we observe that the algorithm performs n lookup on the Cuckoo filters of O ( 1 ) cost in time complexity [38], and a division of O ( 1 ) . So, A c has a performance of O ( n ) expressed in time complexity.
Algorithm 2   A c Metric Calculation Algorithm
Require: P, C F [ S P ( 1 ) ] ,…, C F [ S P ( n ) ]
        F , s u m 0
    for i in range(1,n) do
       if  P C F [ S P ( i ) ]  then
            s u m + = 1
       end if
    end for
        F s u m / n

STEP 6

Although the characteristics of the Cuckoo filters, C F [ S P ( i ) ] , introduce a nondeterministic bias, at the time that F computes the value of A c , C F [ S P ( i ) ] are stable and do not change by F. So, based on Algorithm 2, we infer that F is deterministic and does not introduce bias in the computation of A c , thus the accuracy of, A, and Table 2 is equal to one, A = 1 .

STEP 7

Similarly to Section 4.2.3, we apply the elementary effects method for the theoretical sensitivity analysis of F. Once again, only changes in the variable P of X are not controlled by C. Furthermore, we observe that P is tested against n Cuckoo filters regarding its potential membership in the set of CTI products that construct each of those Cuckoo filters. In this case, we again assume the t selected levels and the elementary effect of P, E E P , is as follows:
E E P = F ( Y ¯ , C F [ S P ( 1 ) ] , , C F [ S P ( n ) ] ) F ( P , C F [ S P ( 1 ) ] , , C F [ S P ( n ) ] ) Δ
where Δ ϵ { 1 t 1 , 1 1 t 1 } and Y ¯ = P ± Δ . Then, the mean ( μ P ), the mean of the absolute values ( μ P * ), and the standard deviation ( σ P ) of the distribution F P of E E P , which is obtained by randomly sampling Y ¯ from Ω , assess the influence of P in A c and reveal the total effects of the interactions between the variable P and the variables C F [ S P ( 1 ) ] , , C F [ S P ( n ) ] . So, we have for the calculation of μ P :
μ P = 1 r j = 1 r E E P = 1 r j = 1 r F ( Y ¯ , C F [ S P ( 1 ) ] , , C F [ S P ( n ) ] ) F ( P , C F [ S P ( 1 ) ] , , C F [ S P ( n ) ] ) Δ j = 1 r j = 1 r ( i = 1 n ( δ Y j ¯ i ) n i = 1 n ( δ P j i ) n Δ j ) =
We notice that Y = P ± Δ and the two sums s Y ¯ j = i = 1 n ( δ Y j ¯ i ) n and s P j = i = 1 n ( δ P j i ) n are independent because they sum the membership decisions of the Cuckoo filters, which are based on hash functions; as a result, even a minor Δ j change can cause a different decision in the Cuckoo filters because the avalanche effect of the hash functions affects them. So, we can consider the difference a j = s Y ¯ j s P j as a random value, which is independent of P. So, we have the following:
μ P = 1 r j = 1 r ( a j Δ j ) r a n d o m v a l u e i n d e p e n d e n t f r o m Y ¯ a n d P
For the calculation of μ * and σ , we have the following:
μ P * = 1 r j = 1 r ( | a j | Δ j ) r a n d o m v a l u e i n d e p e n d e n t f r o m Y ¯ a n d P
σ P 2 = 1 r 1 j = 1 r ( a j Δ j μ P ) 2 i n d e p e n d e n t f r o m Y ¯ a n d P
In conclusion, we can infer from μ P (Equation (13)) and μ P * (Equation (14)) that P has an influence on A c which does not depend on the magnitude of change Δ . Furthermore, σ P (Equation (15)) reveals that the interactions between P and the variables C F [ S P ( 1 ) ] , , C F [ S P ( n ) ] ) F ( P , C F [ S P ( 1 ) ] , , C F [ S P ( n ) ] do not depend on the magnitude of the change ( Δ ).
After performing the theoretical sensitivity analysis, we determine the behavior quality factor [27], as B = ( μ P , μ P * , σ P ) , for A c .

STEP 8

Finally, we define the following:
A c = ( { S O , O ( n ) , B = ( μ P , μ P * , σ P ) , A = 1 , F ( P , C F [ S P ( 1 ) ] , , C F [ S P ( n ) ] ) )
Please note that the built-in false positive rate (i.e., P f p 2 b 2 p ) associated with the Cuckoo Filters, as outlined in Section 3.3.2, has a minor impact on the measurement of A c . Specifically, let us assume the worst-case scenario in which all the decisions taken by the n C F s are false positives. Then, the probability that A c = 1 equates to a notably small value ( 2 b 2 p ) n , since the hash value length p is significantly greater than the bucket size b.

5. Implementation on a Hypothetical System—Experiments

In this part, we implement the metrics proposed in Section 4 by developing experimental environments in parallel. In addition, we present a way for an organization to adjust one of the proposed metrics to its own security and environmental requirements. For the rest of this section, we set the experimental environments of the two metrics in Section 5.1 and Section 5.2, and present the experimental results of them in Section 5.3 and Section 5.3.4.

5.1. Experimental Environment of Relevance Metric

An organization C is expected to define its information needs as part of its risk management process. For example, we can assume that an organization using Amazon Web Services S3 buckets to store its clients’ data needs information related to cybersecurity violations against S3 buckets. More specifically, assume that C has a supplier S 1 . In that case, the information needs of C regarding S 1 are not limited to, but can be expressed by the following queries:
  • Does S 1 face any cyberattack?
  • Are S 1 products affected by any vulnerability?
Obviously, to determine its information needs regarding S 1 , C needs to expand the previous list with queries related to the products, the business activities, etc. Moreover, the answer to some queries (for example, “What are the common cyber threats that affect the agricultural business area?”) can result in more sub-queries (for example, “What ransomware has been used against other agricultural companies?”) whose answers should be added as responses to the information needs of C.
To simulate the definition of information needs as those distributed across the three landscapes, L I , L T P , and L O , we emulate inter-organizational processes utilizing artificial intelligence (AI) and business ontologies. So, in our experiments, we create random organizations C 1 , C 2 , . . . C n and determine their functions by creating organizational profiles. Those profiles are constructed by randomly selecting entities (e.g., business areas) from ontologies and structured naming schemes. The use of ontologies ensures that the randomly created profiles follow a common logic. For example, when the information technology business area is selected, then the business activities or the products cannot belong to the agricultural business area. An organizational profile is a simplified textual description of an organization’s environment, and it is introduced here to overcome the need for a detailed organizational description (e.g., operations, customers, suppliers, functions, business areas, products, etc.). For simplicity, we construct those profiles to match the three landscapes. Table 3 presents the utilization of the ontologies. Then, we use AI to develop the information needs, in the form of queries, for the three landscapes (see Figure 3a).
Furthermore, for the selection of CTI products, we have deployed an OpenCTI server [59], which collects various CTI products from many sources. In our experiments, we randomly select some of those products and calculate R e .
Details of those sources and the configuration of the OpenCTI server are available as part of the source code of this work. Figure 3b depicts the functionality of the experimental environment for R e .

5.2. Experimental Environment Actionability Metric

To implement and evaluate the experimental environment of A c , we consider an organization C, that has k defense mechanisms in place that are equally distributed in the three capability categories (that is, prevention, detection, and response/recovery).
In this case, we used the sources of an OpenCTI server to randomly collect t CTI products. We distributed the collected CTI products equally in k sets, each representing the knowledge base of a defense mechanism. Then, we used these k sets to construct the Cuckoo filter of each defense mechanism (see Figure 4a). Finally, we used these Cuckoo filters to calculate A c of different CTI products collected again from the OpenCTI server. Figure 4b depicts the experimental environment for the calculation of A c .

5.3. Analysis of Experimental Results

Following the assumptions made in the setup of the experimental environment of the metrics, in this section, we present the results of the calculation of the metrics against CTI products collected from various sources (see Table 4). In our case, the gathered CTI products vary in context and complexity, which is a common situation for numerous organizations [60]. Therefore, the CTI products studied include both straightforward CTI feeds and more detailed incident reports. The experiments utilized a total of 32,012 CTI products, with 5000 reserved as a validation set, and the remainder employed in setting up the environments.
Additionally, in the interest of thoroughness, Table 5 and Table 6 detail the properties of the organizations generated at random for the experiments concerning the R e and A c metrics, respectively.

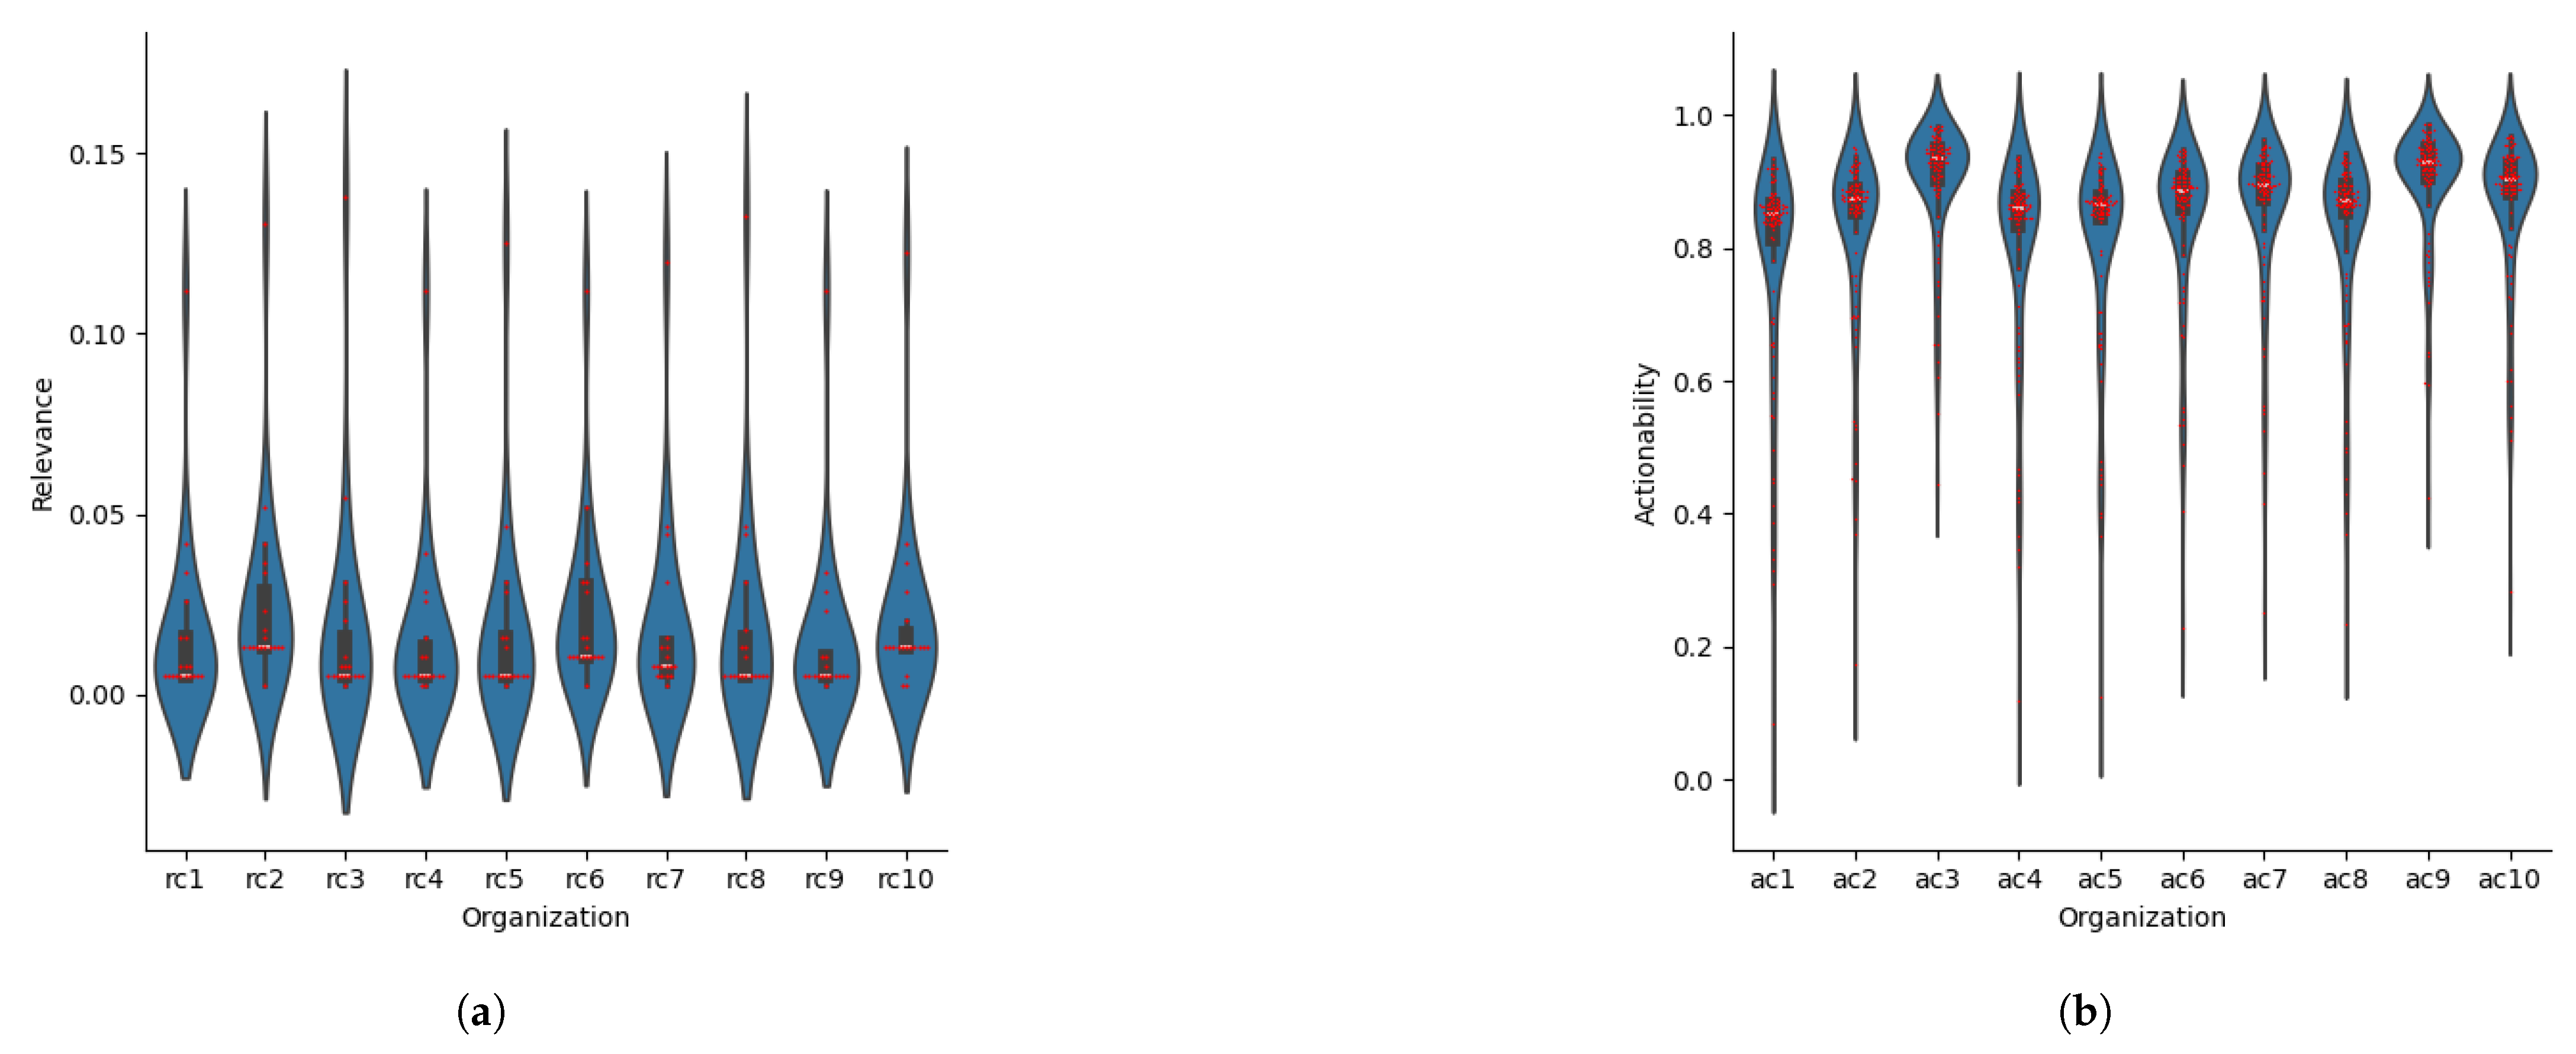
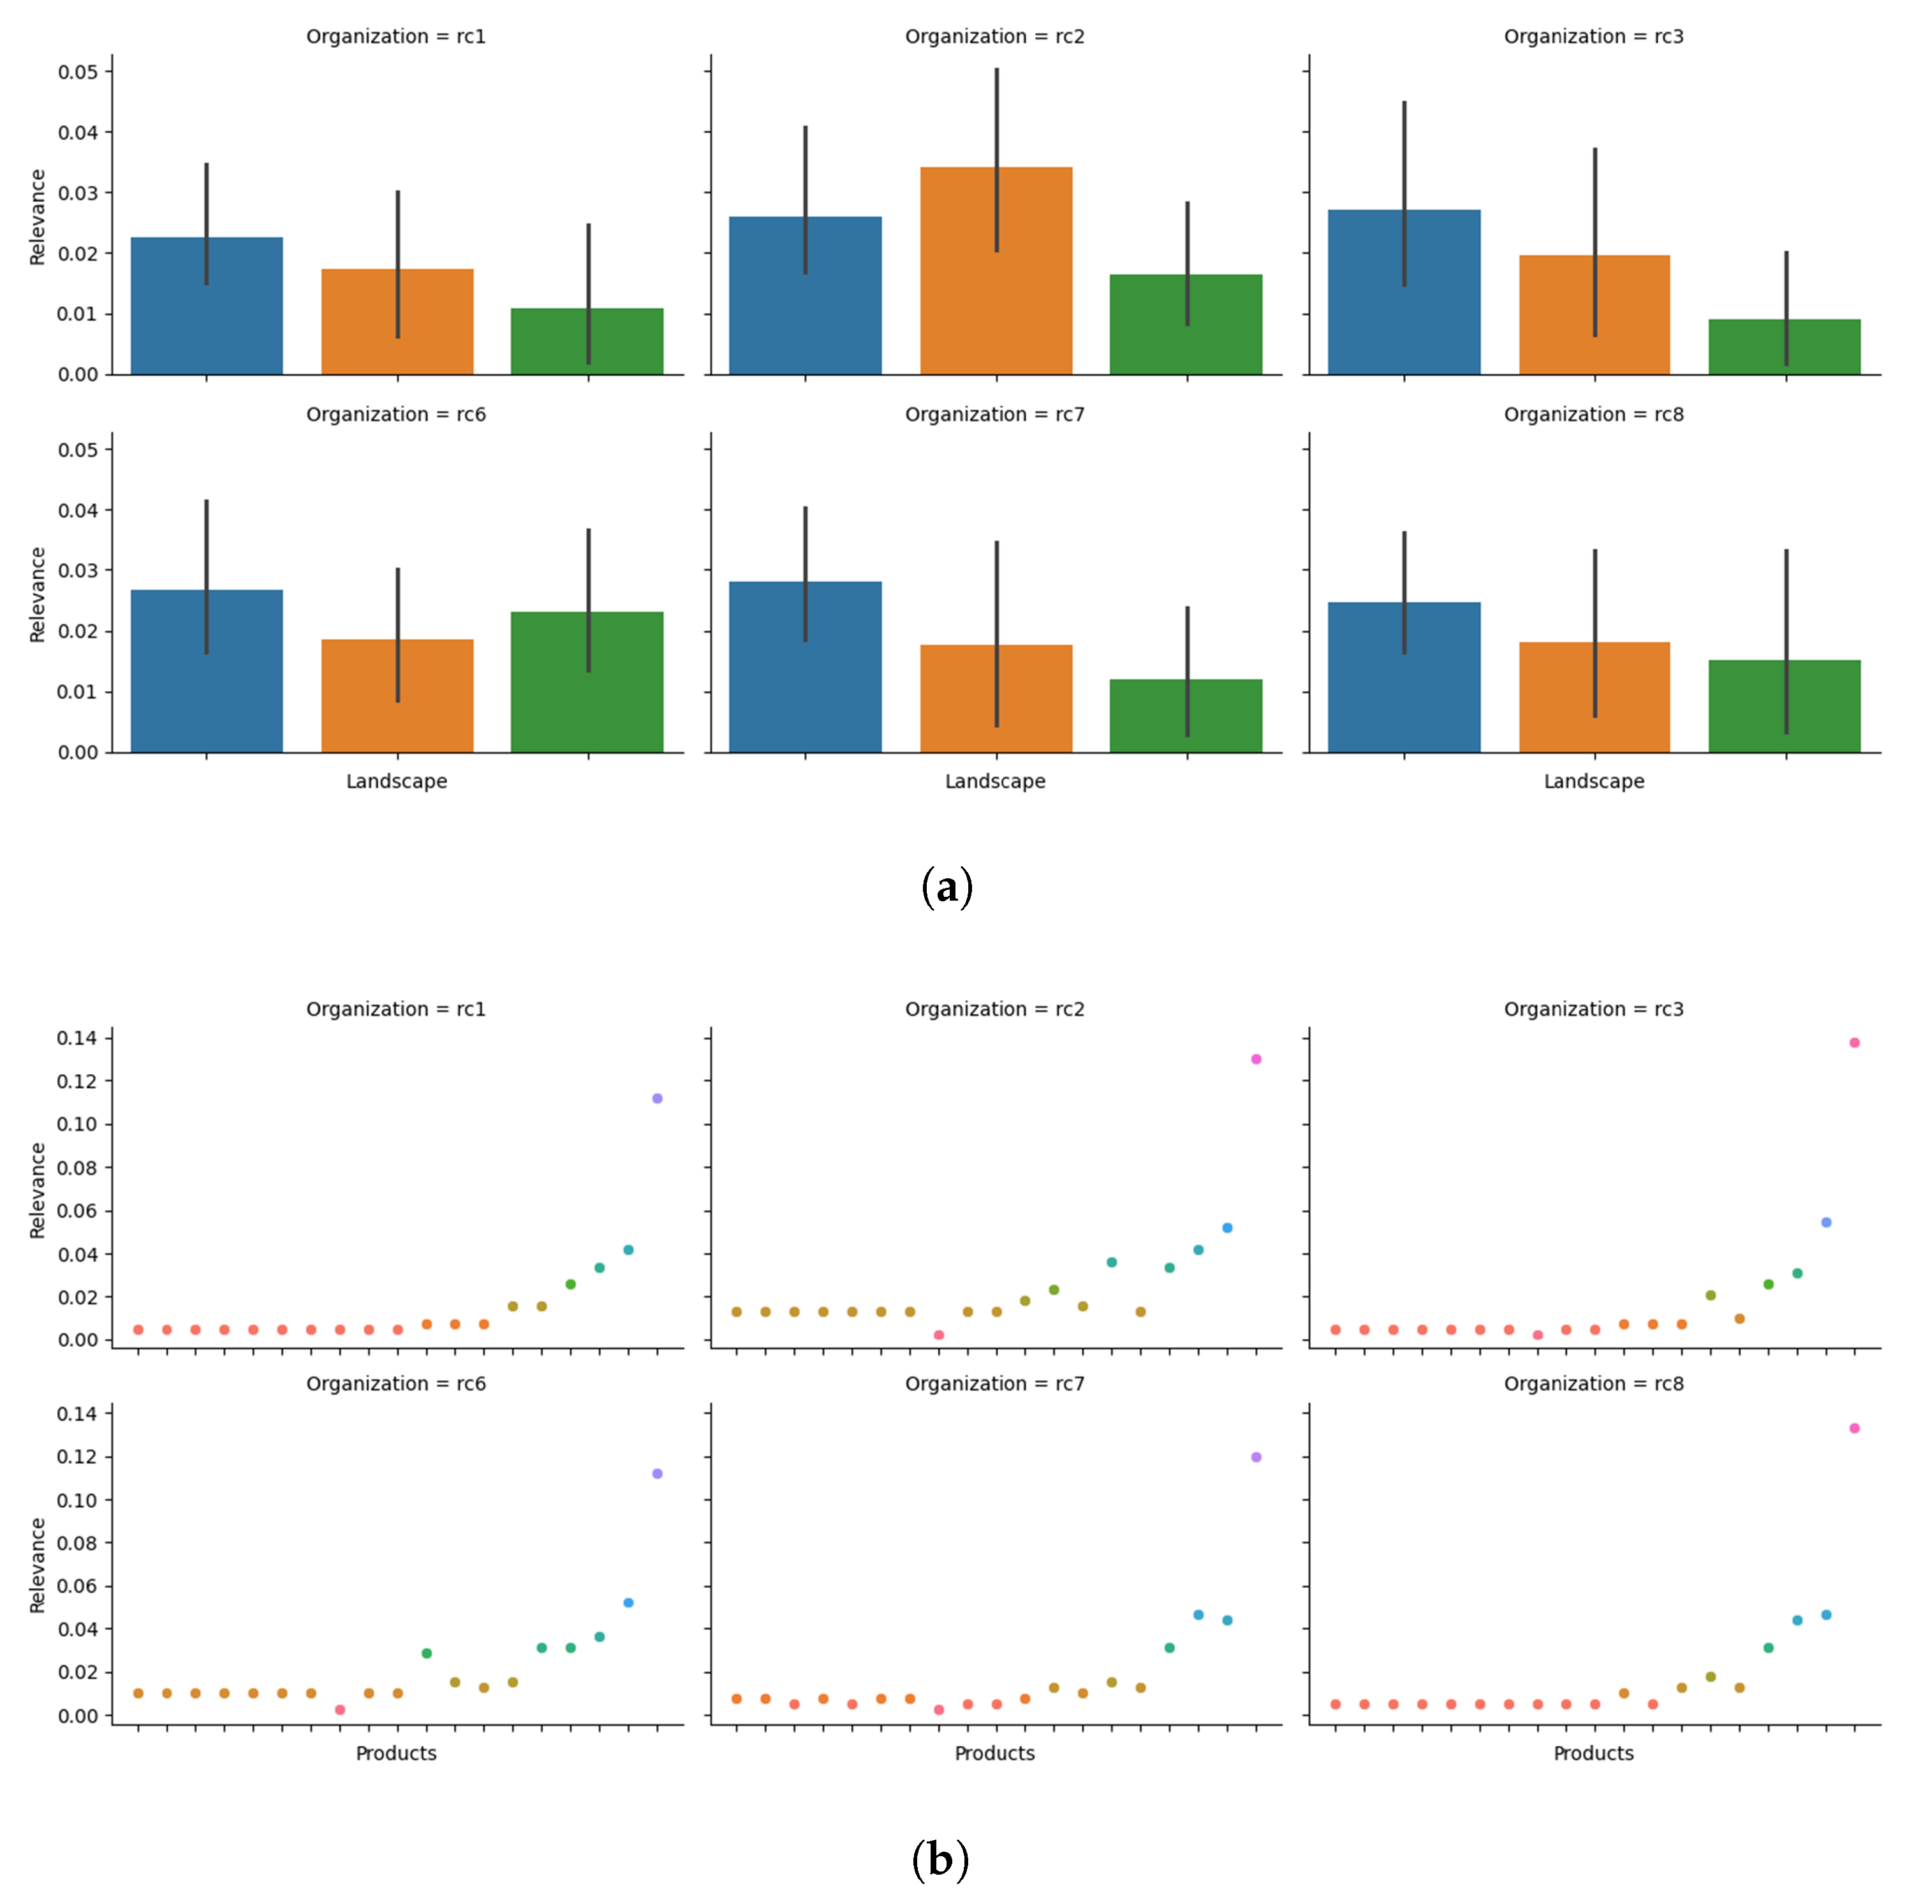
5.3.1. Relevance Metric Experimental Results Analysis

R e calculation quantifies the relationship between the content of a CTI product and the information needs of organizations. As explained in Section 5.1, we have constructed artificial organizations to evaluate the calculation of R e against their information needs, such as those expressed through the landscapes. In Figure 5a, we present the R e calculation distribution of one hundred CTI products randomly selected from the validation dataset against the ten artificial organizations. We observe that the distribution of the calculation of the metric varies between 0.001 and 0.20, with a mean value of approximately 0.025 for all organizations, which demonstrates the capabilities of R e as a filter for CTI products.
To better explain the previous conclusion, in Figure 6b, we present the comparison of CTI products with the highest calculation of the metric against the artificial organizations of this experiment, in which we observe that only a small percentage of CTI products have an R e higher than the mean value. So, to demonstrate how an organization can use the metric as a filter to decide which CTI products are worth further examination, let us assume that the organization r c 1 defines a threshold of R e = 0.10 for choosing CTI products as interesting. From this, we can infer that in the case of our experiment, r c 1 we will have to examine two CTI products out of the hundred for which R e has been calculated. Moreover, using the mean calculation of R e (see Figure 5a), r c 1 can estimate the number of potential CTI products that require further examination and, by extension, the required resources.
In addition, an organization can assess the thoroughness of its information needs for each landscape by analyzing the way its landscape contributes to the overall calculation of the metric. In Figure 6a, we present the average metrics calculations for each landscape per organization. Based on that, an organization can identify significant differences between landscapes (e.g., organization r c 3 ), which can be an indicator of an insufficient definition of the information needs of a landscape.
In summary, an organization can employ R e in several ways, which include the following:
  • Serving as a filter for unstructured CTI products. The organization can define a R e threshold, allowing only those CTI products for further analysis where the calculated R e surpasses this set threshold.
  • Acting as a resource predictor for the assessment of CTI products. This utilizes the distribution traits of calculated R e from prior unstructured CTI products and the R e threshold. For instance, if the R e values for one thousand unstructured CTI products adhere to a normal distribution (i.e., mean μ and standard deviation σ ) and the organization establishes a threshold of μ + 3 σ , then a cybersecurity manager can predict that out of every thousand unstructured CTI products received, only about 10 will necessitate further analysis, enabling efficient resource allocation.
  • Functioning as an indicator of how well-defined the organization’s information needs are by analyzing each landscape’s impact on the R e calculation.

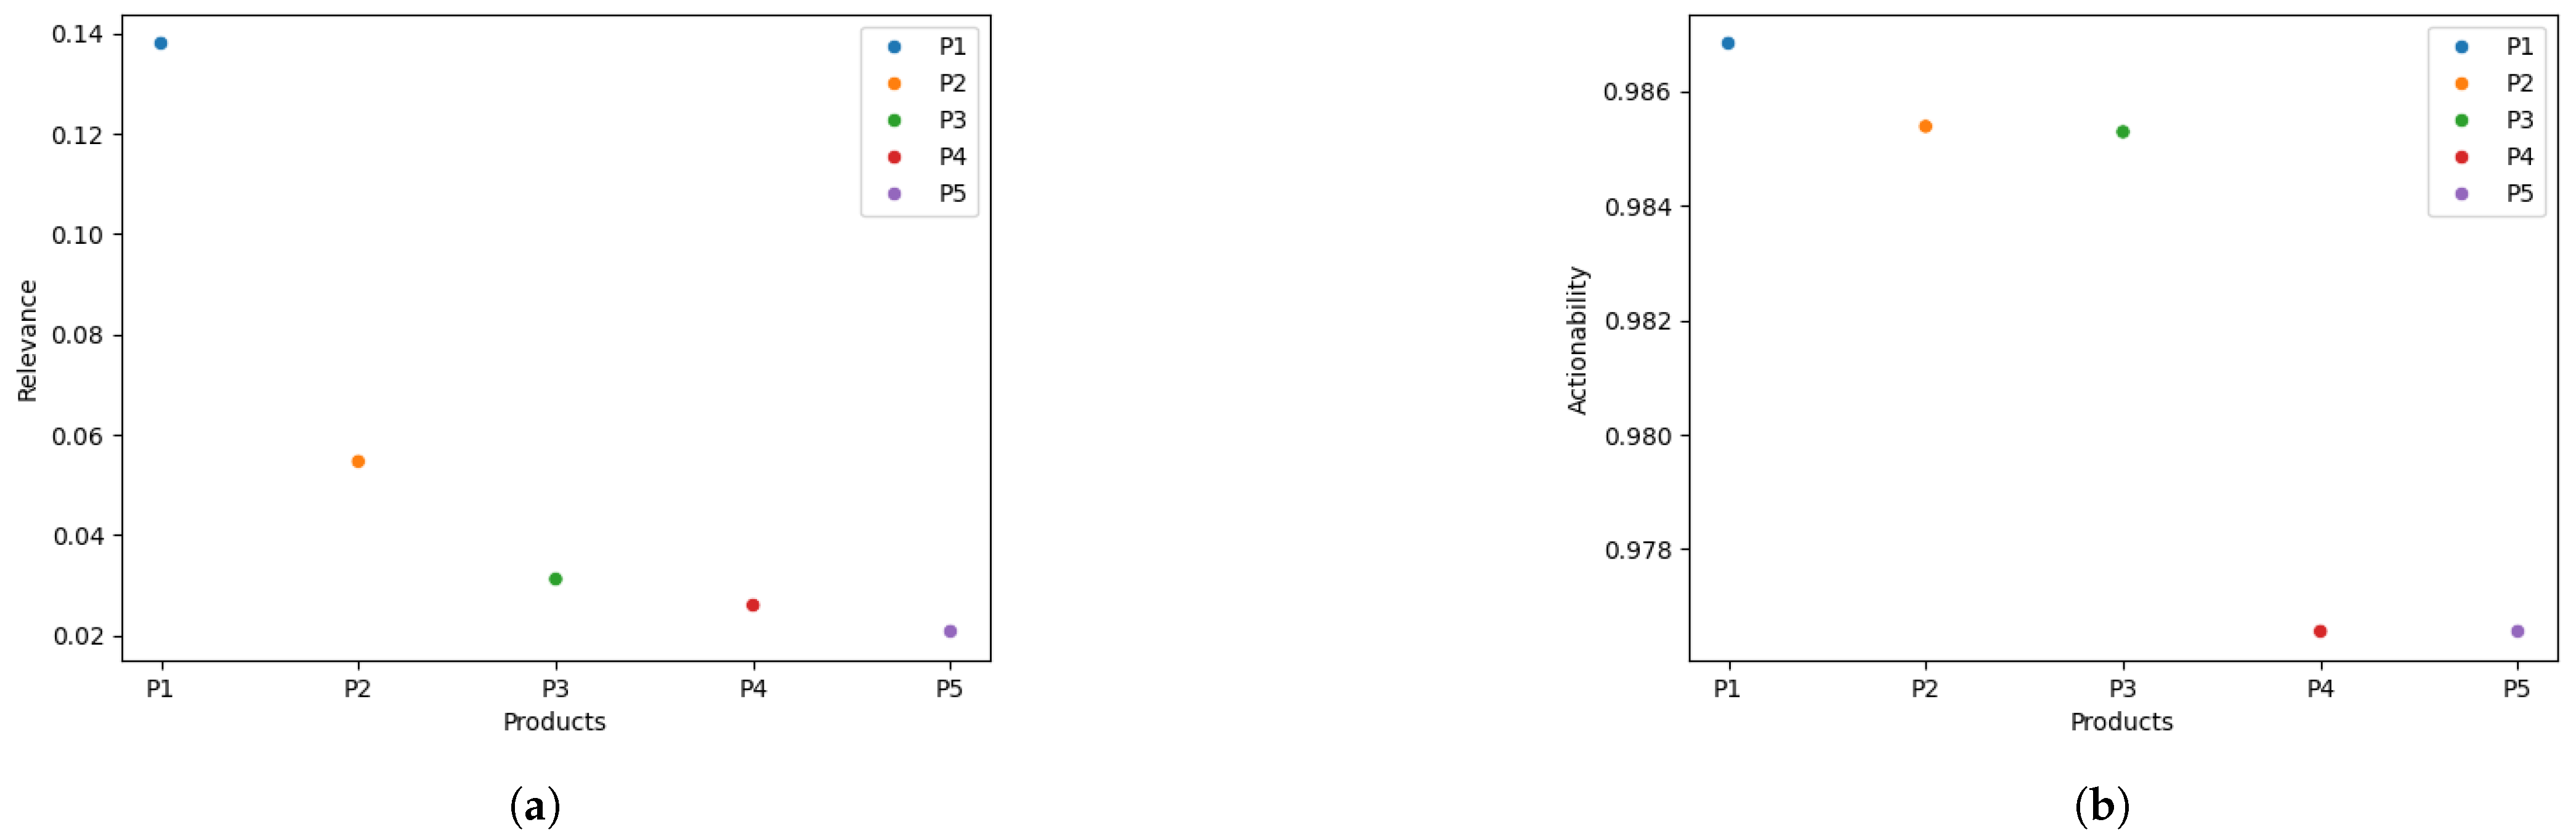
5.3.2. Actionability Metric Experimental Results Analysis

The A c calculations of the CTI products against the artificial organizations of the experiment quantify the probability that a CTI product will change the state of their defense mechanisms. In Figure 5b, we present the calculation distributions of A c of one hundred CTI products across the organizations. We observe that most of the calculations are in the range of A c = 0.75 and A c = 0.99 which comes from the fact that each organization is represented by a number of defense mechanisms and their respective Cuckoo filters, which vary from five to twenty, whose knowledge bases have been formed by the limited amount of CTI products and sources mentioned in Table 4. However, A c can be applied as a filter for CTI products (e.g., setting a threshold on the mean value of each organization), and an organization can infer from these distributions how useful the CTI products consumed for them are and, by extension, evaluate the quality of the CTI sources.
Furthermore, in Figure 7a, we present the calculations of the CTI products A c per defense mechanism in the organization A c 10 . The diagram reveals whether a CTI product can affect the state of each defense mechanism. In that way, an organization can choose which of its defense mechanisms a specific CTI product can be applied to, minimizing the resources required for a more detailed examination of a CTI product.
In addition, in Figure 7b, we present the comparison of the A c calculations of the CTI products between the different organizations. We observe that the calculations appear to follow a similar pattern between them, which is evident from the fact that the knowledge bases of their defense mechanisms have been created by randomly selecting CTI products from the same pool. However, even under this constraint, we observe how organizations with similar defense mechanisms can use the metric to select CTI products that are useful for their environment. For example, let us assume that two organizations with similar defense mechanisms participate in a CTI information sharing community, if the first organization calculates A c of one CTI product and shares this value within the community, then the second organization can use this information as a selection criterion for the CTI product.
In summary, the prospective application of A c by the organization can be summarized as follows:
  • Analogous to R e , A c can be employed as a filter for unstructured CTI products by setting a threshold for A c and selecting only those CTI products for further review whose calculated A c is above the threshold.
  • It can act as an assessment metric for a CTI source by comparing the average A c values of unstructured CTI products sourced from different CTI sources.
  • It can act as a means to accurately apply a CTI product by evaluating how the CTI product might impact each defense mechanism.
  • It can function as a selection criterion for CTI products among organizations that have a similar arsenal of defense mechanisms and are part of a threat intelligence sharing community.

5.3.3. Relevance and Actionability Metrics Experimental Results of an Organization
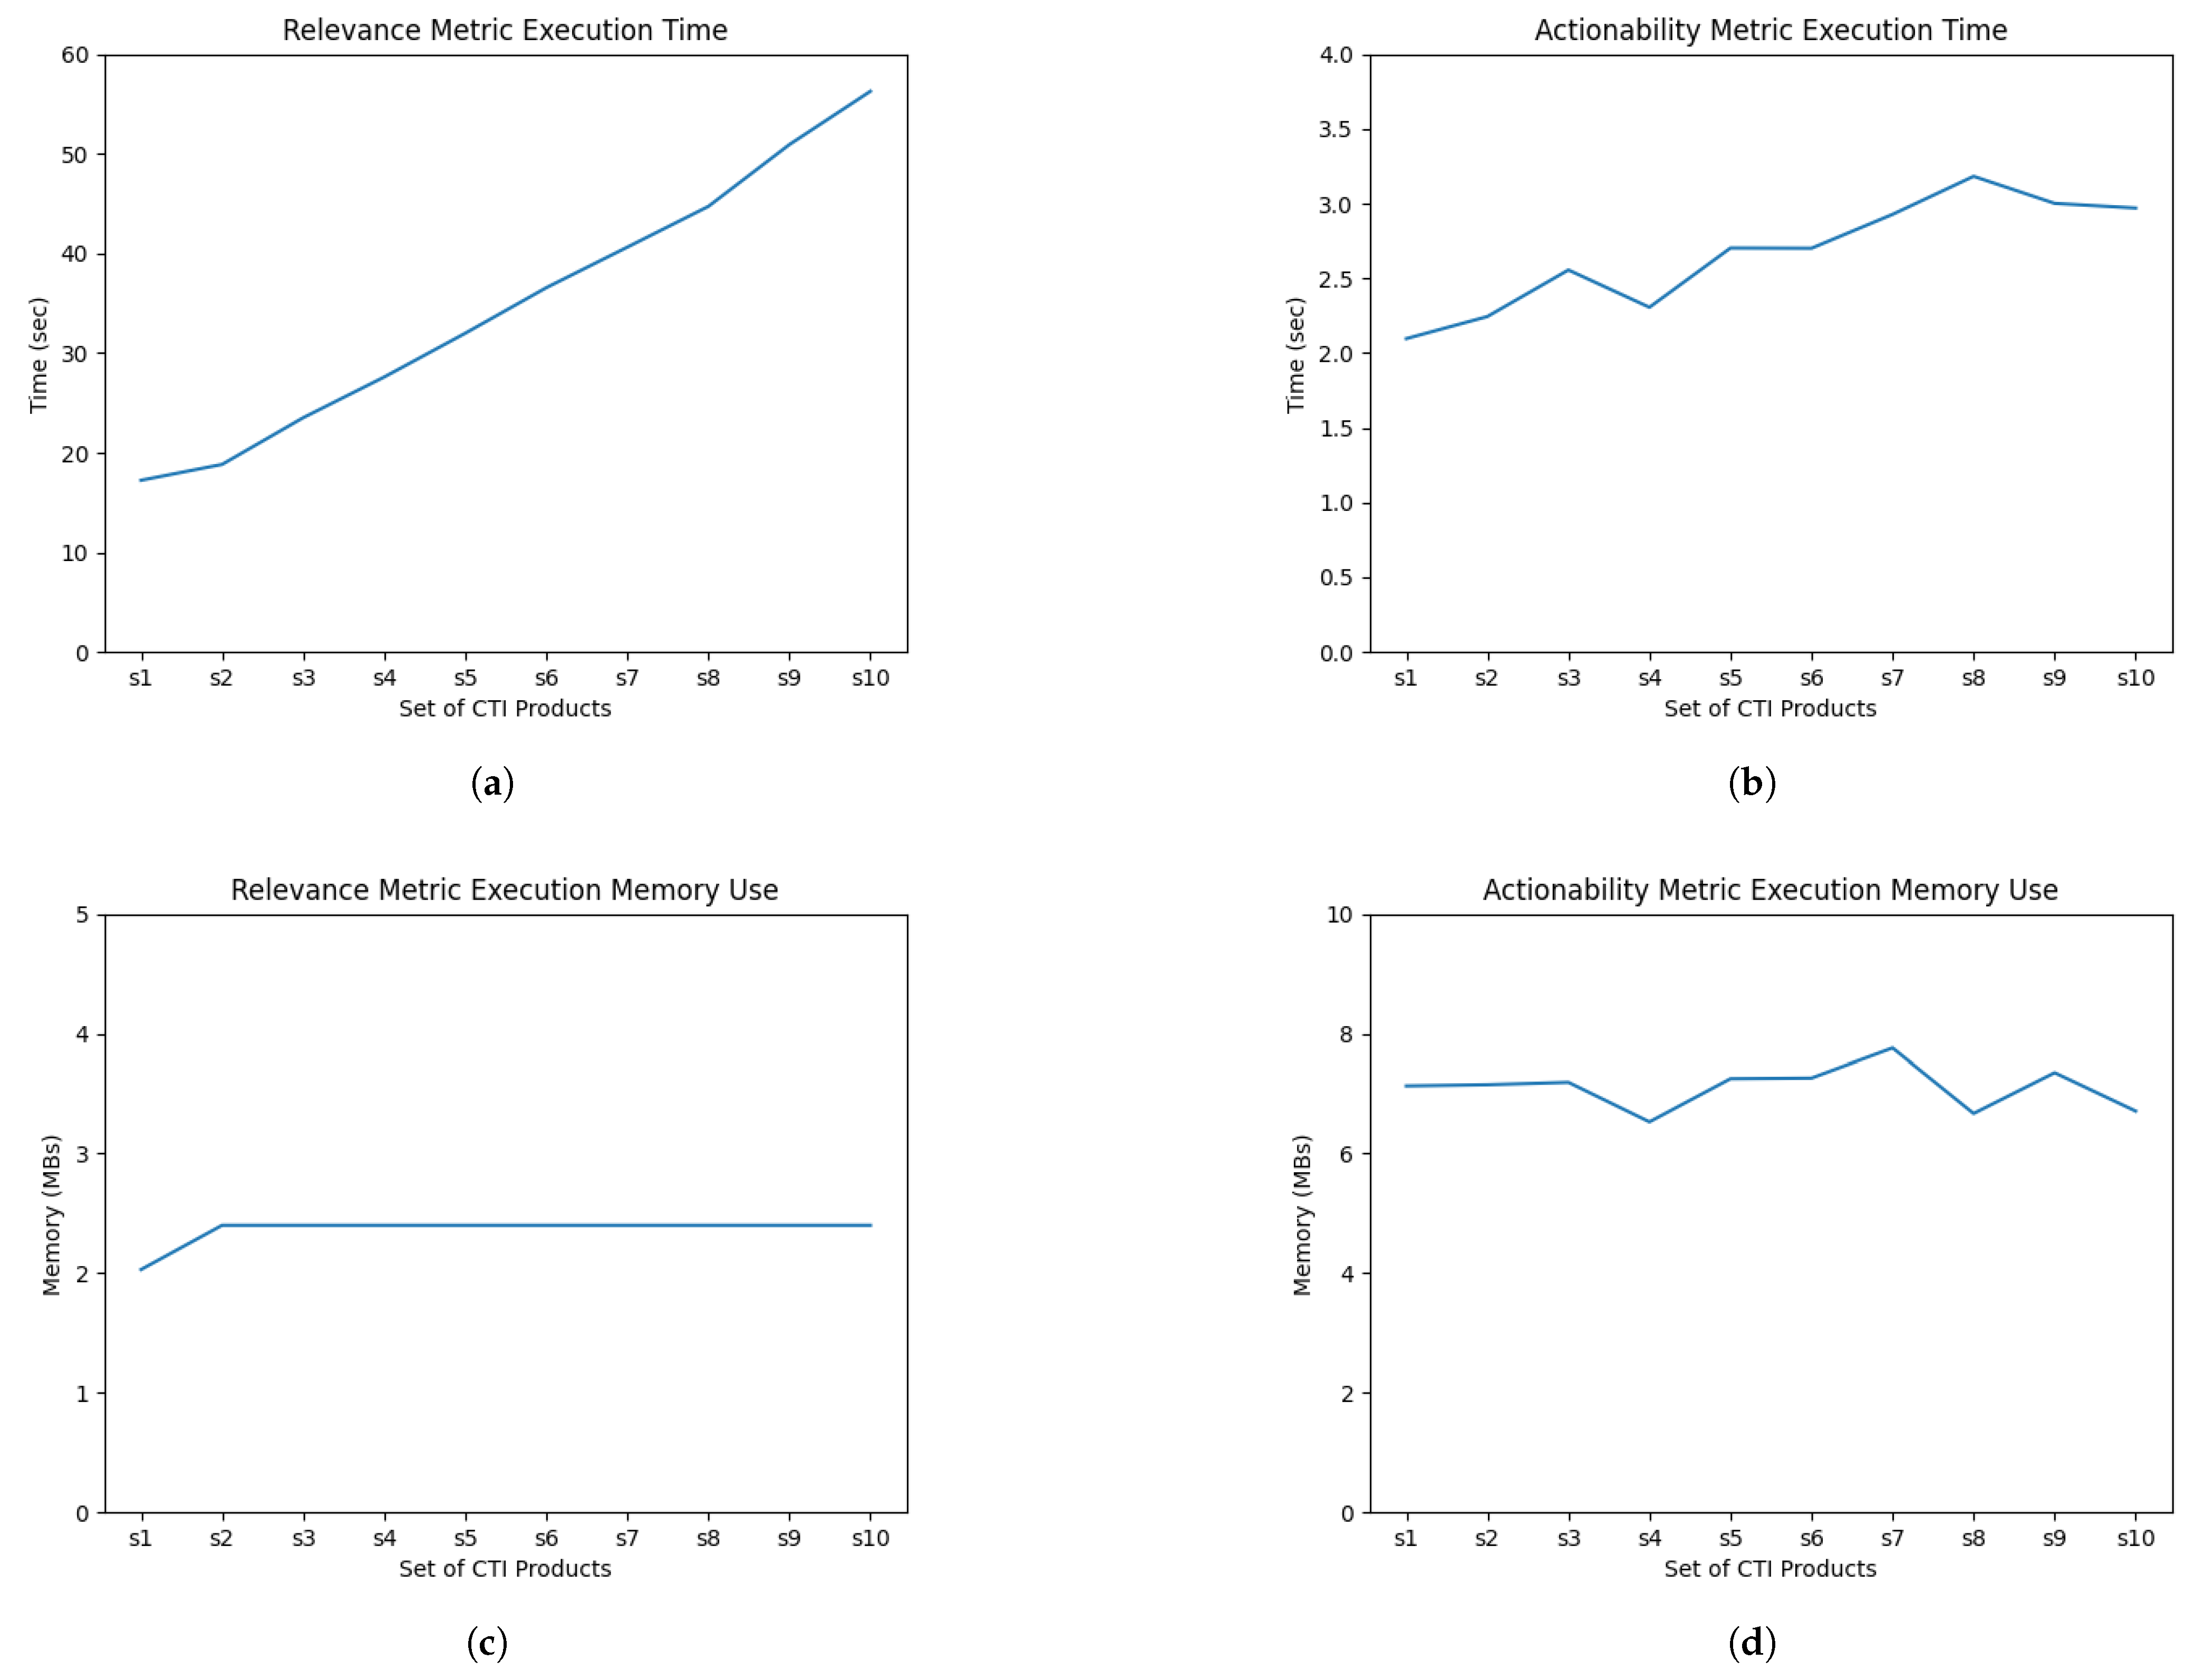
In this section, we examine the experimental results of the measurement of R e and A c of a number of selected CTI products for two of the organizations created randomly. Specifically, in Table 7, we present the profile of the organizations r c 3 . For simplicity, we give the numbers and an example of the different entities that comprise each landscape; however, the profile is available in this paper’s source code. Furthermore, in Table 8 we present the structure of a c 9 , particularly the number of defense mechanisms that comprise the a c 9 and the number of CTI products assigned to their knowledge bases. In Table 9, we present the CTI products for which R e and A c have been calculated for r c 3 and a c 9 , respectively. Finally, in Figure 8a,b, we present the measurement of R e and A c of the CTI products in Table 9 for organizations r c 3 and a c 9 , respectively.
In the case of organization r c 3 , the organization’s experts can use R e to select the P 1 (Poll Vaulting Report) for further examination and analysis between the five presented CTI products. By examining the profile of r c 3 (e.g., r c 3 offers “community services”), we can validate that P 1 is probably relevant to it. Similarly, in the case of a c 9 , we observe that the organization’s experts can use the A c to select P 1 (NETBIOS Scanner Report), P 2 (Cross-Site Scripting Vulnerability Report), and P 3 (SQL Injection Attack Report) for further investigation regarding their applicability in the organization’s defense mechanisms. Moreover, we observe that the CTI products (P1–5) have a high A c value and are related to web/network traffic, which is explained by the fact that the knowledge bases of a c 9 ’s defense mechanisms consist of such a type of information.

5.3.4. Experimental Results of R e and A c Performance

To empirically validate the performance of R e and A c , as discussed in Section 4.2.3 and Section 4.3.3, we once again employ the organizations r c 3 and a c 9 , respectively. For this purpose, we have designed ten random sets of CTI products ( s 1 , s 2 , , s 10 ) by incrementally adding one hundred CTI products to each subsequent set, beginning with one hundred. Subsequently, we compute the execution time required to calculate R e and A c for each individual set. Figure 9 illustrates the observed outcomes. Additionally, we include measurements of memory usage for the computation of R e and A c (Refer to Figure 9).
The experimental outcomes validate the theoretical performance evaluations of O ( k n ) for R e and O ( n ) for A c , respectively.

5.3.5. Discussion

After detailing the experimental implementation, it is necessary to clarify why, at this stage, we must refrain from comparing the proposed metrics with other CTI quality assessment methodologies or metrics, and why this will be considered a focus of our future research endeavors in the area of CTI quality.
Although numerous works cite the significance of measuring CTI quality [10,69], few [13,70] delve into the technical implementation details seen in other fields [71]. On the other hand, there are implementations often involving CTI quality metrics that are deeply integrated into larger systems, making them hard to isolate for comparative measurement [12,15,17]. Furthermore, the differentiation between structured and unstructured CTI products necessitates a potential comparison to use purpose-specific datasets, a topic for which, to the best of our knowledge, there is a scarcity of research. Moreover, the methodologies and metrics for CTI quality, particularly within threat intelligence platforms [7], remain proprietary and inaccessible to the public. Available CTI quality metrics, regardless of their structured or unstructured focus, are utilized within specialized contexts [70], needing replication to facilitate metric comparison. Thus, we suggest this comparison as a potential avenue for future research.

6. Conclusions

In summary, this study presents a novel approach to evaluating the quality of unstructured CTI products through the introduction of Relevance ( R e ) and Actionability ( A c ) metrics. These metrics provide a structured and scalable approach for evaluating CTI products, aligning them with the unique informational needs and defense mechanisms of organizations. Although the study acknowledges certain constraints, such as the limited scope of the datasets used, it provides a solid foundation for future research and practical applications. By addressing these limitations and exploring future research opportunities, this work establishes the foundations for more robust, adaptive, and automated cybersecurity solutions to enhance the utility of CTI in the ever-changing cybersecurity domain. In the remainder of this section, we examine the contribution of this study in Section 6.1, discuss its limitations and the underlying assumptions in Section 6.2, and explore potential future research directions in Section 6.3.

6.1. Contribution

In this paper, we explore the aspects of CTI quality, focusing on the relevance and actionability of unstructured CTI products. The increasing reliance on CTI in cybersecurity and the necessity for organizations to evaluate the quality of the intelligence they consume have introduced significant challenges in evaluating the quality of these products. Organizations rely on relevant and actionable CTI products to make cybersecurity decisions, but the lack of standardized metrics complicates this process. This paper proposes two innovative metrics, Relevance ( R e ) and Actionability ( A c ), to address these challenges.
The research questions posed in this study aimed to assess how the relevance and actionability of CTI products can be defined and quantitatively calculated. The main contribution of this paper is the proposal of two metrics: R e and A c . The proposed metrics are designed to incorporate the characteristics of organizations by evaluating the quality of CTI products in relation to organizations’ information needs and defense mechanisms, respectively. To answer the first and second research questions, we have introduced the concepts of informational landscapes, which is a notion introduced for the first time on CTI to the best of our knowledge, and the modeling of the organizations’ defense mechanisms as cognitive agents. Furthermore, by leveraging probabilistic algorithms and data structures, these metrics provide a scalable approach to assess the quality of CTI products, ensuring their applicability in large datasets of CTI products, and answering our third research question. Based on the information currently available to us, it is the first time that probabilistic data structures and algorithms are used in the context of CTI quality evaluation. In addition, the experimental findings indicate that these metrics can serve as effective filters for organizations seeking to prioritize their CTI analysis efforts, ensuring that only the most pertinent information consumes their cybersecurity resources. To summarize, Section 4.2 and Section 4.3 provide answers to the RQ1, while Section 3.3, Section 4.2.2 and Section 4.3.2 address the RQ2. Lastly, RQ3 is covered in Section 4.2.3, Section 4.3.3 and Section 5.3.
The main advantages of our approach, in contrast to similar endeavors, can be outlined in the following key points:
  • Our metrics are designed using a systematic methodology that facilitates a clear analysis of any component.
  • The proposed metrics are independent of any specific system, allowing for their integration into existing systems.
  • Metrics evaluation yields explicit numerical results, which are essential in data quality metrics [72], and are not part of a comprehensive framework that transparently demonstrates the application of the calculated results.
  • The metrics are independent of the CTI product structure, enabling the potential evaluation of structured CTI products, given that a simple data cleaning technique is applied to their inputs.
Additionally, due to the abstract concepts on which the proposed metrics are based, they are resilient to the dynamic nature of cyber-threats. Simultaneously, they can be seamlessly integrated with established frameworks such as MITRE ATT&CK [18], because the provided CTI products include extensive textual descriptions that can serve as input for the proposed metrics. Specifically, we can easily pinpoint within campaigns like C0010 [73], Night Dragon [74], and Operation Spalax [75], textual content about particular business areas, functions, and systems in an organization, which will, in the case of, for example, R e , elevate the computed value.
Furthermore, at this point, we have to discuss the benefits of the proposed metrics in comparison with asking an AI model how relevant or actionable a CTI product is for an organization. First, we should recognize that the use of AI makes it possible to evaluate the relevance and actionability of CTI products. However, an AI model trained with organization’s classified data (e.g., models of IT systems, architecture of an organization’s IT environment, business activities, etc.) introduces a significant risk to an organization’s cybersecurity posture because an attacker capable of exploiting this model would identify and exploit the organization’s weaknesses [76,77]. In addition, it is difficult for an organization to know the level of efficacy that an AI model has when it continuously handles a large number of CTI products. In comparison, the proposed metrics do not rely on any communication with models or algorithms hosted outside of the organization. At the same time, the proposed metrics use algorithms that are designed to handle a large amount of data by definition.

6.2. Limitations and Assumptions

Despite the contributions of this work, we need to recognize that our study faced several constraints, which open future research paths.
Initially, the limited scope of the datasets employed to validate the proposed metrics compelled us to make certain assumptions during the design of experimental organizations. This led to the artificial creation of their information needs and knowledge bases for defense mechanisms, potentially restricting the generalizability of our results. As mentioned in Section 5, the scarcity of CTI datasets prompted us to assemble the dataset for this study by collecting CTI products using an OpenCTI server along with specific CTI sources for a designated timeframe. This mirrors the approach a new organization might adopt for CTI. Nonetheless, this method might have limited the data to particular attack types and tactics. Furthermore, in crafting the landscapes, we implemented AI to develop the experimental organizations’ information needs, possibly introducing bias based on the state of the AI model used. However, we consider this approach more advantageous than the manual landscape constructions by a small team of researchers.
Secondly, due to their probabilistic nature, the proposed metrics come with an acceptable margin of error that might impact precision in certain situations. Nevertheless, this paper does not explore such scenarios for the sake of simplicity. To clarify this limitation, it is important to delve into the nature of probabilistic data structures. These structures are intentionally designed to trade some degree of accuracy for reduced time and space complexity. Consequently, their application introduces a minor error, the analysis of which is outside the scope of this study and will be addressed in our future research.
Third, to maintain minimal complexity, we have kept the design and implementation of the experimental environments simple, but we must acknowledge that incorporating the metrics into an organization’s current processes and systems can be difficult. This difficulty arises from the complexity of pinpointing information needs and managing defense mechanisms within an organization because these tasks involve, on one side, individuals not specialized in cybersecurity, and on the other side, a range of mostly proprietary systems and technologies.

6.3. Future Work

In summary, looking towards the future, our findings give rise to several open research questions:
  • How can we experimentally evaluate the CTI quality metrics, including common data analytics methods like precision-recall and confusion matrices?
  • How can all characteristics of probabilistic data structures be utilized in the computation of metrics (e.g., dynamic updates in Cuckoo filters)?
  • Is it possible to clearly and systematically define organizational information needs in the CTI context?
  • How can these metrics be employed to incorporate selected CTI products into the knowledge bases of organizations’ defense mechanisms in real-time?
  • In what ways can these metrics be integrated into existing CTI frameworks and systems?
Based on these research questions, we propose the following future research directions:
  • Developing benchmark datasets specifically for CTI.
  • Investigating the experimental comparison of CTI quality metrics.
  • Examining the use of alternative probabilistic data structures for measuring CTI quality.
  • Formally defining the informational needs of organizations concerning CTI.
  • Researching the real-time integration of CTI products into organizational defense mechanisms, grounded in their CTI quality.
  • Investigating the integration of CTI quality metrics into existing frameworks and open-source systems.
Our future work will concentrate on employing these metrics for the real-time integration of CTI products into organizational cyber defenses. We aim to assess the impact of CTI quality in enhancing an organization’s cybersecurity posture. This will involve developing automated tools for real-time CTI assessment and integration, aligning the metrics with current cybersecurity frameworks, and exploring their application in collaborative environments like threat-sharing platforms.

Author Contributions

Conceptualization, G.S. and P.F.; methodology, G.S.; validation, G.S., M.K. and P.F.; formal analysis, G.S.; investigation, G.S.; data curation, G.S.; writing—original draft preparation, G.S.; writing—review and editing, G.S., M.K. and P.F.; visualization, G.S., M.K. and P.F.; supervision, P.F. and M.K. All authors have read and agreed to the published version of the manuscript.

Funding

This research received no external funding.

Data Availability Statement

The source code and datasets of the experiments are available under a GNUv3 General Public License in the respective GitHub repository: Source Code (https://github.com/geosakel77/s3 (accessed on 5 March 2025)).

Conflicts of Interest

The authors declare no conflicts of interest.

References

  1. ENISA. ENISA Threat Landscape 2022; Technical Report; ENISA: Athens, Greece, 2022. [Google Scholar] [CrossRef]
  2. Aïmeur, E.; Amri, S.; Brassard, G. Fake news, disinformation and misinformation in social media: A review. Soc. Netw. Anal. Min. 2023, 13, 30. [Google Scholar] [CrossRef] [PubMed]
  3. Ni, T.; Zhang, X.; Zhao, Q. Recovering Fingerprints from In-Display Fingerprint Sensors via Electromagnetic Side Channel. In Proceedings of the CCS 2023, 2023 ACM SIGSAC Conference on Computer and Communications Security, Copenhagen, Denmark, 26–30 November 2023; pp. 253–267. [Google Scholar] [CrossRef]
  4. Ni, T.; Zhang, X.; Zuo, C.; Li, J.; Yan, Z.; Wang, W.; Xu, W.; Luo, X.; Zhao, Q. Uncovering User Interactions on Smartphones via Contactless Wireless Charging Side Channels. In Proceedings of the IEEE Symposium on Security and Privacy, San Francisco, CA, USA, 21–25 May 2023; pp. 3399–3415. [Google Scholar] [CrossRef]
  5. Vishwakarma, R.; Jain, A.K. A survey of DDoS attacking techniques and defence mechanisms in the IoT network. Telecommun. Syst. 2020, 73, 3–25. [Google Scholar] [CrossRef]
  6. Ohm, M.; Plate, H.; Sykosch, A.; Meier, M. Backstabber’s Knife Collection: A Review of Open Source Software Supply Chain Attacks. In Lecture Notes in Computer Science (Including Subseries Lecture Notes in Artificial Intelligence and Lecture Notes in Bioinformatics); Springer: Cham, Switzerland, 2020; pp. 23–43. [Google Scholar] [CrossRef]
  7. Sakellariou, G.; Fouliras, P.; Mavridis, I.; Sarigiannidis, P. A Reference Model for Cyber Threat Intelligence (CTI) Systems. Electronics 2022, 11, 1401. [Google Scholar] [CrossRef]
  8. MANDIANT. Global Perspectives on Threat Intelligence; Technical Report; MANDIANT: Reston, VA, USA, 2023. [Google Scholar]
  9. Taleb, I.; Serhani, M.A.; Dssouli, R. Big Data Quality Assessment Model for Unstructured Data. In Proceedings of the 2018 13th International Conference on Innovations in Information Technology, IIT 2018, Al Ain, United Arab Emirates, 18–19 November 2018; pp. 69–74. [Google Scholar] [CrossRef]
  10. Zibak, A.; Sauerwein, C.; Simpson, A.C. Threat Intelligence Quality Dimensions for Research and Practice. Digit. Threat. Res. Pract. 2022, 3, 44. [Google Scholar] [CrossRef]
  11. Tundis, A.; Ruppert, S.; Mühlhäuser, M. A Feature-driven Method for Automating the Assessment of OSINT Cyber Threat Sources. Comput. Secur. 2022, 113, 102576. [Google Scholar] [CrossRef]
  12. Azevedo, R.; Medeiros, I.; Bessani, A. PURE: Generating quality threat intelligence by clustering and correlating OSINT. In Proceedings of the 2019 18th IEEE International Conference on Trust, Security and Privacy in Computing and Communications/13th IEEE International Conference on Big Data Science and Engineering, TrustCom/BigDataSE 2019, Rotorua, New Zealand, 5–8 August 2019; pp. 483–490. [Google Scholar] [CrossRef]
  13. Schaberreiter, T.; Kupfersberger, V.; Rantos, K.; Spyros, A.; Papanikolaou, A.; Ilioudis, C.; Quirchmayr, G. A quantitative evaluation of trust in the quality of cyber threat intelligence sources. In Proceedings of the ACM International Conference Proceeding Series, New York, NY, USA, 26–29 August 2019; p. 10. [Google Scholar] [CrossRef]
  14. Chismon, D.; Ruks, M. Threat Intelligence: Collecting, Analysing, Evaluating; Technical Report; MWR InfoSecurity: London, UK, 2015. [Google Scholar]
  15. Yang, L.; Wang, M.; Lou, W. An automated dynamic quality assessment method for cyber threat intelligence. Comput. Secur. 2025, 148, 104079. [Google Scholar] [CrossRef]
  16. Schlette, D.; Böhm, F.; Caselli, M.; Pernul, G. Measuring and visualizing cyber threat intelligence quality. Int. J. Inf. Secur. 2021, 20, 21–38. [Google Scholar] [CrossRef]
  17. Zhang, S.; Chen, P.; Bai, G.; Wang, S.; Zhang, M.; Li, S.; Zhao, C. An Automatic Assessment Method of Cyber Threat Intelligence Combined with ATT&CK Matrix. Wirel. Commun. Mob. Comput. 2022, 2022, 12. [Google Scholar] [CrossRef]
  18. MITRE MITRE ATT&CK®. 2025. Available online: https://attack.mitre.org/ (accessed on 5 March 2025).
  19. Wagner, T.D.; Mahbub, K.; Palomar, E.; Abdallah, A.E. Cyber threat intelligence sharing: Survey and research directions. Comput. Secur. 2019, 87, 101589. [Google Scholar] [CrossRef]
  20. Geras, T.; Schreck, T. The “Big Beast to Tackle”: Practices in Quality Assurance for Cyber Threat Intelligence. In Proceedings of the 27th International Symposium on Research in Attacks, Intrusions and Defens, New York, NY, USA, 30 September–2 October 2024; pp. 337–352. [Google Scholar] [CrossRef]
  21. Tao, Y.; Zhang, Y.; Ma, S.; Fan, K.; Li, M.; Guo, F.; Xu, Z. Combining the big data analysis and the threat intelligence technologies for the classified protection model. Clust. Comput. 2017, 20, 1035–1046. [Google Scholar] [CrossRef]
  22. Marchetti, M.; Guido, A.; Pierazzi, F.; Colajanni, M. Countering Advanced Persistent Threats through security intelligence and big data analytics. In Proceedings of the International Conference on Cyber Conflict, CYCON, Tallinn, Estonia, 31 May–3 June 2016; pp. 243–261. [Google Scholar] [CrossRef]
  23. Wheelus, C.; Bou-Harb, E.; Zhu, X. Towards a big data architecture for facilitating cyber threat intelligence. In Proceedings of the 2016 8th IFIP International Conference on New Technologies, Mobility and Security, NTMS 2016, Larnaca, Cyprus, 21–23 November 2016; pp. 1–5. [Google Scholar] [CrossRef]
  24. Martins, C.; Medeiros, I. Generating Quality Threat Intelligence Leveraging OSINT and a Cyber Threat Unified Taxonomy. ACM Trans. Priv. Secur. 2022, 25, 39. [Google Scholar] [CrossRef]
  25. Fujii, S.; Kawaguchi, N.; Shigemoto, T.; Yamauchi, T. CyNER: Information Extraction from Unstructured Text of CTI Sources with Noncontextual IOCs. In Advances in Information and Computer Security; Cheng, C.M., Akiyama, M., Eds.; Springer: Cham, Switzerland, 2022; pp. 85–104. [Google Scholar]
  26. Jordan, B.; Piazza, R.; Wunder, J. STIX v2.1 Specification. 2025. Available online: http://docs.oasis-open.org/cti/stix/v2.1/ (accessed on 5 March 2025).
  27. Sakellariou, G.; Fouliras, P.; Mavridis, I. A Methodology for Developing & Assessing CTI Quality Metrics. IEEE Access 2024, 12, 6225–6238. [Google Scholar] [CrossRef]
  28. Watson, K. Assessing the Potential Value of Cyber Threat Intelligence (CTI) Feeds; Technical Report; Johns Hopkins Applied Physics Laboratory: Laurel, MD, USA, 2020. [Google Scholar]
  29. Pawlinski, P.; Jaroszewski, P.; Kijewski, P.; Siewierski, L.; Jacewicz, P.; Zielony, P.; Zuber, R. Actionable Information for Security Incident Response; Technical Report; ENISA: Athens, Greece, 2014. [Google Scholar]
  30. Deliu, I.; Leichter, C.; Franke, K. Collecting Cyber Threat Intelligence from Hacker Forums via a Two-Stage, Hybrid Process using Support Vector Machines and Latent Dirichlet Allocation. In Proceedings of the 2018 IEEE International Conference on Big Data (Big Data), Seattle, WA, USA, 10–13 December 2018; pp. 5008–5013. [Google Scholar] [CrossRef]
  31. Hassani, H.; Beneki, C.; Unger, S.; Mazinani, M.T.; Yeganegi, M.R. Text Mining in Big Data Analytics. Big Data Cogn. Comput. 2020, 4, 1. [Google Scholar] [CrossRef]
  32. Gakhov, A. Probabilistic Data Structures and Algorithms for Big Data Applications, 1st ed.; BoD–Books on Demand: Norderstedt, Germany, 2022. [Google Scholar]
  33. Broder, A.Z. On the resemblance and containment of documents. In Proceedings of the International Conference on Compression and Complexity of Sequences, Salerno, Italy, 13 June 1997; pp. 21–29. [Google Scholar] [CrossRef]
  34. Ebad, S.A.; Darem, A.A.; Abawajy, J.H. Measuring Software Obfuscation Quality—A Systematic Literature Review. IEEE Access 2021, 9, 99024–99038. [Google Scholar] [CrossRef]
  35. Wang, J.; Dong, Y. Measurement of Text Similarity: A Survey. Information 2020, 11, 421. [Google Scholar] [CrossRef]
  36. Indyk, P.; Motwani, R. Approximate nearest neighbors: Towards removing the curse of dimensionality. In Proceedings of the Conference Proceedings of the Annual ACM Symposium on Theory of Computing, Dallas, TX, USA, 24–26 May 1998; pp. 604–613. [Google Scholar]
  37. Bloom, B.H. Space/time trade-offs in hash coding with allowable errors. Commun. ACM 1970, 13, 422–426. [Google Scholar] [CrossRef]
  38. Fan, B.; Andersen, D.G.; Kaminsky, M.; Mitzenmacher, M.D. Cuckoo filter: Practically better than bloom. In Proceedings of the CoNEXT 2014—Proceedings of the 2014 Conference on Emerging Networking Experiments and Technologies, Sydney, Australia, 2–5 December 2014; pp. 75–88. [Google Scholar] [CrossRef]
  39. Scott, W.R.; Davis, G.F. Organizations and Organizing: Rational, Natural and Open Systems Perspectives, 1st ed.; Routledge: New York, NY, USA, 2015. [Google Scholar] [CrossRef]
  40. Von Bertalanffy, L. The theory of open systems in physics and biology. Science 1950, 111, 23–29. [Google Scholar] [CrossRef]
  41. Daft, R.L. Management; Cengage Learning: Boston, MA, USA, 2015. [Google Scholar]
  42. Savolainen, R. Information landscapes as contexts of information practices. J. Librariansh. Inf. Sci. 2021, 53, 655–667. [Google Scholar] [CrossRef]
  43. Joint Task Force Transformation Initiative. NIST Special Publication 800-30 Revision 1—Guide for Conducting Risk Assessments; Technical Report September; NIST: Gaithersburg, MD, USA, 2012.
  44. RRDG. Domain Industry Taxonomy. 2022. Available online: https://rrdg.centr.org/projects/standards/domain-industry-taxonomy/ (accessed on 5 March 2025).
  45. Broder, A.Z.; Charikar, M.; Frieze, A.M.; Mitzenmacher, M. Min-wise independent permutations (extended abstract). In Proceedings of the Thirtieth Annual ACM Symposium on Theory of Computing, Dallas, TX, USA, 24–26 May 1998; pp. 327–336. [Google Scholar] [CrossRef]
  46. Saltelli, A. Sensitivity Analysis for Importance Assessment. Risk Anal. 2002, 22, 579–590. [Google Scholar] [CrossRef]
  47. M’manga, A.; Faily, S.; McAlaney, J.; Williams, C.; Kadobayashi, Y.; Miyamoto, D. A normative decision-making model for cyber security. Inf. Comput. Secur. 2019, 26, 636–646. [Google Scholar] [CrossRef]
  48. Cotae, P.; Kang, M.; Velazquez, A. A Cybersecurity Model for Decision-Making Problems under Uncertainty Using Game Theory. In Proceedings of the 2020 13th International Conference on Communications, COMM 2020-Proceedings, Bucharest, Romania, 18–20 June 2020; pp. 15–22. [Google Scholar] [CrossRef]
  49. Jalali, M.S.; Siegel, M.; Madnick, S. Decision-making and biases in cybersecurity capability development: Evidence from a simulation game experiment. J. Strateg. Inf. Syst. 2019, 28, 66–82. [Google Scholar] [CrossRef]
  50. Sichman, J.S.A.; Demazeau, Y.; Boissier, O. When can knowledge-based systems be called agents. Proc. Simpósio Bras. De Inteligência Artif. 1992, 9, 172–185. [Google Scholar]
  51. Akerkar, R.; Sajja, P. Knowledge-Based Systems; Jones & Bartlett Publishers: Burlington, MA, USA, 2009. [Google Scholar]
  52. BigPicture. Free Dataset-Companies|BigPicture Documentation. 2024. Available online: https://docs.bigpicture.io/docs/free-datasets/companies/ (accessed on 5 March 2025).
  53. EDM Council. FIBO. 2020. Available online: https://spec.edmcouncil.org/fibo/ (accessed on 5 March 2025).
  54. EUROSTAT. Glossary: Statistical Classification of Economic Activities in the European Community (NACE)-Statistics Explained. 2006. Available online: https://ec.europa.eu/eurostat/statistics-explained/index.php?title=Glossary:Statistical_classification_of_economic_activities_in_the_European_Community_(NACE) (accessed on 5 March 2025).
  55. Fraunhofer ISC. General Process Ontology (GPO). 2021. Available online: https://data.ontocommons.linkeddata.es/vocabulary/GeneralProcessOntology(gpo) (accessed on 5 March 2025).
  56. NIST, C.F.P. Official Common Platform Enumeration (CPE) Dictionary. 2021. Available online: https://nvd.nist.gov/products/cpe (accessed on 5 March 2025).
  57. EBWSRG. The Product Types Ontology: Use Wikipedia Pages for Describing Products or Services with GoodRelations and Schema.org. 2024. Available online: http://www.productontology.org/ (accessed on 5 March 2025).
  58. EU. ECCF Core Ontology-EU Vocabularies-Publications Office of the EU. 2021. Available online: https://op.europa.eu/en/web/eu-vocabularies/dataset/-/resource?uri=http://publications.europa.eu/resource/dataset/54i (accessed on 5 March 2025).
  59. Filigran. OpenCTI Documentation. 2024. Available online: https://docs.opencti.io/latest/ (accessed on 5 March 2025).
  60. Palo Alto. What Is Cyber Threat Intelligence (CTI)?—Palo Alto Networks. 2025. Available online: https://www.paloaltonetworks.ca/cyberpedia/what-is-cyberthreat-intelligence-cti (accessed on 5 March 2025).
  61. CISA. Known Exploited Vulnerabilities Catalog. 2025. Available online: https://www.cisa.gov/known-exploited-vulnerabilities-catalog (accessed on 5 March 2025).
  62. CVE. Common Vulnerabilities and Exposures. 2025. Available online: https://www.cve.org/ (accessed on 5 March 2025).
  63. AlienVault. Open Threat Exchange. 2025. Available online: https://otx.alienvault.com/dashboard/new (accessed on 5 March 2025).
  64. Feedly. Feedly Threat Intelligence. 2025. Available online: https://feedly.com/i/discover (accessed on 5 March 2025).
  65. Fraunhofer FKIE. Malpedia. 2025. Available online: https://malpedia.caad.fkie.fraunhofer.de/ (accessed on 5 March 2025).
  66. MISP. MISP Default Feeds. 2025. Available online: https://www.misp-project.org/feeds/ (accessed on 5 March 2025).
  67. MITRE. MITRE Atlas. 2025. Available online: https://atlas.mitre.org/ (accessed on 5 March 2025).
  68. TweetFeed. Indicators of Compromise (IOCs) Shared by Infosec Community. 2025. Available online: https://tweetfeed.live/ (accessed on 5 March 2025).
  69. Sillaber, C.; Sauerwein, C.; Mussmann, A.; Breu, R. Data Quality Challenges and Future Research Directions in Threat Intelligence Sharing Practice. In Proceedings of the 2016 ACM on Workshop on Information Sharing and Collaborative Security, New York, NY, USA, 24 October 2016; pp. 65–70. [Google Scholar] [CrossRef]
  70. Dimitriadis, A.; Prassas, C.; Flores, J.L.; Kulvatunyou, B.; Ivezic, N.; Gritzalis, D.A.; Mavridis, I.K. Contextualized Filtering for Shared Cyber Threat Information. Sensors 2021, 21, 4890. [Google Scholar] [CrossRef]
  71. Ehrlinger, L.; Wöß, W. A Survey of Data Quality Measurement and Monitoring Tools. Front. Big Data 2022, 5, 850611. [Google Scholar] [CrossRef]
  72. Heinrich, B.; Hristova, D.; Klier, M.; Schiller, A.; Szubartowicz, M. Requirements for Data Quality Metrics. J. Data Inf. Qual. (JDIQ) 2018, 9, 12. [Google Scholar] [CrossRef]
  73. MITRE-C0010. C0010, Campaign C0010|MITRE ATT&CK®. 2025. Available online: https://attack.mitre.org/campaigns/C0010/ (accessed on 5 March 2025).
  74. MITRE-Night Dragon. Night Dragon, Campaign C0002|MITRE ATT&CK®. 2025. Available online: https://attack.mitre.org/campaigns/C0002/ (accessed on 5 March 2025).
  75. MITRE-Operation Spalax. Operation Spalax, Campaign C0005|MITRE ATT&CK®. 2025. Available online: https://attack.mitre.org/campaigns/C0005/ (accessed on 5 March 2025).
  76. Rahman, M.M.; Siddika Arshi, A.; Hasan, M.M.; Farzana Mishu, S.; Shahriar, H.; Wu, F. Security Risk and Attacks in AI: A Survey of Security and Privacy. In Proceedings of the International Computer Software and Applications Conference, Torino, Italy, 26–30 June 2023; pp. 1834–1839. [Google Scholar] [CrossRef]
  77. Sun, H.; Zhu, T.; Zhang, Z.; Jin, D.; Xiong, P.; Zhou, W. Adversarial Attacks Against Deep Generative Models on Data: A Survey. IEEE Trans. Knowl. Data Eng. 2023, 35, 3367–3388. [Google Scholar] [CrossRef]
Figure 1. Relevance metric generic calculation mechanism.
Electronics 14 01826 g001
Figure 2. Actionability metric (a) Defense mechanism and (b) Generic calculation mechanism.
Electronics 14 01826 g002
Figure 3. Concepts of R e metric calculation experimental environment. (a) Process of information needs creation. (b) Relevance metric experimental environment.
Electronics 14 01826 g003
Figure 4. Concepts of A c metric calculation experimental environment. (a) Process of cuckoo filters creation. (b) Actionability metric experimental environment.
Electronics 14 01826 g004
Figure 5. CTI products metrics calculation distributions across organizations. (a) Relevance distribution. (b) Actionability distribution.
Electronics 14 01826 g005
Figure 6. Relevance metrics calculation. (a) Sample of organizations’ average relevance calculations per landscape. (b) Comparison of CTI products relevance between sample of organizations.
Electronics 14 01826 g006
Figure 7. Actionability metrics calculation. (a) CTI products’ actionability calculation per defense mechanism of Org. a c 10 . (b) Comparison of CTI products actionability between organizations.
Electronics 14 01826 g007
Figure 8. CTI products metrics of organizations r c 3 and a c 9 . (a) CTI products relevance metric for r c 3 . (b) CTI products actionability metric measurement for a c 9 .
Electronics 14 01826 g008
Figure 9. Execution time and memory measurements on the organizations r c 3 and a c 9 . Relevance metric execution on r c 3 : (a) Time measurements; (c) Memory measurements. Actionability metric execution on a c 9 : (b) Time measurements; (d) memory measurements.
Electronics 14 01826 g009
Table 1. Summary of related work.
ArticleStrengthsWeaknesses
Tale et al. [9]evaluation of quality on unstructured big datadomain agnostic, not focusing on CTI
Zibak et al. [10]identification of key CTI quality dimensions and CTI quality challengeslack of analysis on technical implementation
Tundis et al. [11]CTI relevance score, combination of different CTI quality factorsfocus on CTI sources and not on the CTI products
Azevedo et al. [12]CTI quality-based enrichment of IoCsnot designed to handle big data
Schaberreiter et al. [13]evaluation of CTI sources trust, continuous estimation of a CTI source indicatorclosed-world assumption about the threat intelligence
Yang et al. [15]combination of various quality factors for the measurement of CTI products trustworthiness and availabilitynot addressing the characteristics of CTI consumers
Schlette et al. [16]introduces a set of STIX-based data quality dimensionslimited to structured CTI products
Zhang et al. [17]quality assessment of large-scale CTInot exploring the CTI quality factors for the assessment but specific features of IoCs
Tao et al. [21]big-data analysis of CTI for the improvement of defense mechanismsbulk consumption of CTI remains a problem, no CTI quality evaluation
Marchetti et al. [22]big-data analysis of CTIno measurement of CTI effectiveness
Wheelus et al. [23]big-data based processing of CTInot exploring the quality of the produced intelligence
Martins et al. [24]pipeline-based processing of CTI products to improve their qualitynot targeting on the improvement of specific quality factors
Table 2. CTI Quality Metrics Development Methodology.
StepDescription
1Based on the CTI data or sources, try to identify what can better express their quality and name this metric M.
2Determine the set of variables X necessary to calculate M.
3Define function F, which computes metric M.
4Analyze X and F to determine subjectivity and objectivity Γ .
5Analyze F to determine the performance of M (i.e., time complexity of M calculation), P.
6Analyze F to determine the precision of M, A.
7Conduct sensitivity analysis on M to determine B.
8Construct metric M = ( Q , F ( X ) )
Table 3. Relevance Metric Landscapes’ Datasets.
LandscapeInformation Needs ofOntology and Datasets
Input Landscape ( L I )SuppliersCompanies [52]
Competitors
Capital SourcesFinancial Industry Business Ontology (FIBO) [53]
Transformation Process Landscape ( L T P )Business ActivitiesNomenclature statistique des Activites economiques dans la Communaute Europeenne (NACE) [54], Domain Industry Taxonomy (DIT) [44]
Internal OperationsGeneral Process Ontology (GPO) [55]
Information SystemsCommon Platform Enumeration (CPE) [56]
Output Landscape ( L O ) Products ServicesFIBO [53], Product Types Ontology (PTO) [57], European Core Conceptual Framework (ECCF) [58]
Table 4. CTI Products Sources.
CTI SourcesNum. of CTI Products in DatasetNum. of CTI Products in Validation Dataset
MITRE ATT&CK [18],
CISA KNOWN VULNERABILITIES [61],
CVE [62],
ALIENVAULT [63],
FEEDLY [64],
MALPEDIA [65],
MISP FEEDS [66],
MITRE ATLAS [67],
TWEETFEED [68]
32,0125000
Table 5. Experimental Organizations Characteristics of R e metric.
Org.Input Landscape ( L I )Transformation Process Landscape ( L TP )Output Landscape ( L O )
Num. of Suppliers Num. of Competitors Num. of Capital Sources Num. of Business Activities Num. of Internal Operations Num. of Information System Num. of Products Num. of Services
r c 1 12161018101818
r c 2 1266841831
r c 3 1419712101559
r c 4 19661661855
r c 5 171851011677
r c 6 712111471712
r c 7 9144791991
r c 8 1214111991353
r c 9 195713101893
r c 10 91325711103
Table 6. Experimental Organizations Characteristics of A c metric [KB: Knowledge Base, DM: Defense Mechanism].
Org.Num. of DMsNum. of CTI Products in KB of a DMTotal Num. of CTI Products in the KBs of the DMs
a c 1 171793043
a c 2 154777155
a c 3 317895367
a c 4 18293293
a c 5 27346346
a c 6 5507507
a c 7 12804804
a c 8 14417417
a c 9 419171917
a c 10 811168298
Table 7. Organization r c 3 Profile.
LandscapeProfile
Input Landscape ( L I )Num. of Suppliers: 14 (e.g., GRIVE)
Num. of Competitors: 19 (e.g., M.A.P.L.E)
Num. of Capital Sources: 7 (e.g., SPDR S&P 500 ETF Trust)
Transformation Process Landscape ( L T P )Num. of Business Activities: 12 (e.g., “auxiliary to financial services”)
Num. of Internal Operations: 10 (e.g., Information Transport Process)
Num. of Information Systems: 15 (e.g., XR3Player)
Output Landscape ( L O )Num. of Products: 5 (e.g., carpets, food products)
Num. of Services: 9 (e.g., community services)
Table 8. Organization a c 9 Structure.
Number of Defense MechanismsNumber of CTI Products in Knowledge Base of a Defense MechanismTotal Number of CTI Products in the Knowledge Bases of the Defense Mechanisms
419177668
Table 9. CTI Products used for the Measurement of R e and A c .
Measurement of Re MetricMeasurement of Ac
Product Remark Product Remark
P1Poll Vaulting ReportP1NETBIOS Scanner Report
P2Wrong Sphere Vulnerability ReportP2Cross-Site Scripting Vulnerability Report
P3OT URL Activity ReportP3SQL Injection Attack Report
P4Linux Kernel Vulnerability ReportP4Wrong HTTP Header Encoding Report
P5Firmware Buffer Overflow Vulnerability ReportP5Wrong HTTP Header Encoding Report
Disclaimer/Publisher’s Note: The statements, opinions and data contained in all publications are solely those of the individual author(s) and contributor(s) and not of MDPI and/or the editor(s). MDPI and/or the editor(s) disclaim responsibility for any injury to people or property resulting from any ideas, methods, instructions or products referred to in the content.

