Abstract
This study investigates the optimization of satellite constellations for Low-Power, Wide-Area Network (LPWAN)-based Internet of Things (IoT) communications in Very Low Earth Orbit (VLEO) at 200 km and 300 km altitudes and Low Earth Orbit (LEO) at 600km using a Genetic Algorithm (GA). Focusing on three LPWAN technologies—LoRa, Narrowband IoT (NB-IoT), and Mioty—we evaluate their performance in terms of revisit time, data transmission volume, and economic efficiency. Results indicate that a 300 km VLEO constellation with LoRa achieves the shortest average revisit time and requires the fewest satellites, offering notable cost benefits. NB-IoT provides the highest data transmission volume. Mioty demonstrates strong scalability but necessitates a larger satellite count. These findings highlight the potential of VLEO satellites, particularly at 300 km, combined with LPWAN solutions for efficient and scalable IoT Non-Terrestrial Network (IoT-NTN) applications. Future work will explore multi-altitude simulations and hybrid LPWAN integration for further optimization.
1. Introduction
In recent years, the explosive growth of IoT networks and the increasing need for global connectivity have demanded innovative approaches that can deliver reliable communication services to regions where terrestrial infrastructure is limited [1]. In particular, satellite communications via Non-Terrestrial Networks (NTNs) have garnered significant attention; however, traditional satellite constellation designs and communication technologies still face unresolved challenges and limitations.
Satellites have historically been developed and operated predominantly by governments, the military, and a few large corporations. However, the satellite industry has recently undergone significant transformation, driven by the active market participation of private companies [2] such as Starlink and OneWeb, along with the emergence of cost-effective launch vehicles like SpaceX’s reusable Falcon 9 and Rocket Lab’s small Electron rocket. These advancements, combined with the development of low-cost and high-efficiency technologies, have elevated Low Earth Orbit (LEO) satellite constellations as scalable and efficient solutions for global connectivity.
A prominent direction in recent communication technology advancements is the expansion of satellite-based communication using NTNs. NTN technologies offer the potential to provide stable and extensive connectivity, even in remote and underserved regions where terrestrial networks are inaccessible. This technological development, coupled with the rapid expansion of the Internet of Things (IoT), has increased the demand for reliable and efficient communication technologies tailored for various IoT-NTN environments [3].
In parallel, rapid advancements in Artificial Intelligence (AI) have driven significant progress in AI semiconductor technologies. These innovations have paved the way for the emergence of Artificial Intelligence of Things (AIoT), a paradigm that combines AI and IoT. AIoT enables real-time data processing within IoT devices, offering advantages such as reduced network bandwidth usage, decreased latency, and faster decision making. Moreover, local data processing via AIoT minimizes data transmission requirements, alleviates channel congestion, and ultimately reduces power consumption. With future communication paradigms such as 6G on the horizon, the integration of AIoT within NTN environments is anticipated to be a key enabler for enhanced connectivity and service provision.
Building upon these technological advancements, Low-Power, Wide Area Network (LPWAN) technologies have emerged as key enablers for the construction of IoT-NTN environments, especially when integrated with AIoT. In the context of NTNs, particularly for AIoT applications envisioned in future 6G networks, LPWAN technologies such as LoRa, Narrowband IoT (NB-IoT), and Mioty offer long-range communication capabilities with minimal power consumption, making them highly suitable for stable and efficient communication solutions in IoT-NTN scenarios. Among the various available LPWAN technologies, we have focused on these three solutions due to their complementary strengths. NB-IoT, standardized by 3GPP, is widely adopted because it can leverage both IoT-NTN environments and existing terrestrial networks, providing robust integration with current infrastructure. Mioty stands out for its ability to support a significantly larger number of connected devices, a critical factor for large-scale IoT deployments. Meanwhile, LoRa is recognized for its balanced performance in terms of long-range connectivity, low power consumption, and cost-effectiveness, making it a versatile choice for diverse IoT applications. This selection enables a comprehensive analysis of the trade-offs and potentials inherent in different LPWAN technologies within satellite-based communication frameworks.
Simultaneously, there has been growing interest in Very Low Earth Orbit (VLEO) satellites, defined here as orbit altitudes of approximately 300 km or lower. As evidenced by missions like the European Space Agency’s (ESA) Gravity Field and Steady-State Ocean Circulation Explorer (GOCE) [4] and the Japan Aerospace Exploration Agency’s (JAXA) Super Low-Altitude Test Satellite (SLATS), VLEO satellites offer advantages such as reduced communication latency and enhanced spatial resolution, though atmospheric drag can pose additional challenges.
This study aims to compare and analyze the combinations of satellite constellations and LPWAN technologies in an IoT-NTN environment. Specifically, by applying a genetic algorithm under identical conditions, we evaluate which communication method and orbital configuration achieve superior optimization results. Through this analysis, our goal is to propose the most effective satellite network configuration in terms of both cost efficiency and communication performance, thereby contributing a novel strategy for future IoT communication networks.
In light of these evolving technological trends, this study explores the potential of LPWAN technologies in VLEO environments, comparing their communication efficiency and latency improvements against conventional LEO satellites. Using a genetic algorithm, this study derives optimal satellite constellations tailored to various LPWAN technologies and IoT-NTN environments. By comparing these configurations, we proposes the most suitable combination of LPWAN technologies and satellite constellations to meet the targeted performance criteria.
2. Background and Related Technologies
2.1. LEO
Low Earth orbit (LEO) satellites operate at an altitude of up to 2000 km above Earth and play a critical role in providing global coverage and low transmission latency. These characteristics make LEO satellites highly suitable for applications such as high-speed Internet provision, remote area connectivity, Earth observation, and environmental monitoring. Specifically, their ability to support high-density data transmission and real-time communication makes them ideal for services requiring low-latency connections. Compared to traditional Geostationary Orbit (GEO) satellites, LEO constellations offer more flexible and scalable network configurations.
In response to the growing demand for global connectivity, LEO satellite networks have been rapidly expanding, driven by large-scale constellation projects from companies such as Starlink and OneWeb [5]. However, despite their scalability, the operation of LEO constellations presents several technical challenges. For example, the large number of satellites increases network maintenance costs, and the rapid movement of the satellites results in frequent handovers. To address these challenges, advanced technologies such as automated network management systems, efficient handover mechanisms, and satellite-to-satellite laser links have been actively developed. These innovations not only improve overall performance but also pave the way for more reliable and sustainable LEO network operations.
2.2. VLEO
Very low Earth orbit (VLEO) satellites operate at altitudes of approximately 200 to 500 km, significantly closer to Earth’s surface than conventional LEO satellites. As traditional LEO satellites approach saturation and space debris concerns continue to escalate, VLEO technology has gained attention as a promising alternative. Due to their lower altitude, VLEO satellites can offer reduced transmission latency and enhanced spatial resolution, making them highly effective for Earth observation, reconnaissance, and high-speed data transmission applications [6].
Transitioning from LEO to VLEO, the benefits and challenges also shift considerably. While VLEO satellites offer the potential for reduced launch and operational costs and facilitate the mass production and deployment of small satellites, their lower altitude introduces significant challenges. In particular, operating at such low altitudes intensifies the effects of atmospheric drag, which impacts orbital maintenance and fuel efficiency. To overcome these issues, research efforts have focused on aerodynamic satellite designs, drag-minimizing materials, and propulsion advancements.
Moreover, the advantages of VLEO satellites are not limited to cost reductions. Their proximity to Earth naturally facilitates orbital decay, aiding in the safe deorbiting of non-operational satellites and reducing long-term debris risks. The commercialization of VLEO satellites has been further propelled by data-driven design methodologies and modern optimization algorithms, including genetic algorithms and AI-based orbit simulation frameworks. These techniques are being leveraged to solve complex constellation design challenges, with promising applications in areas such as smart cities, environmental monitoring, and precision agriculture [7].
2.3. Walker–Delta Constellation
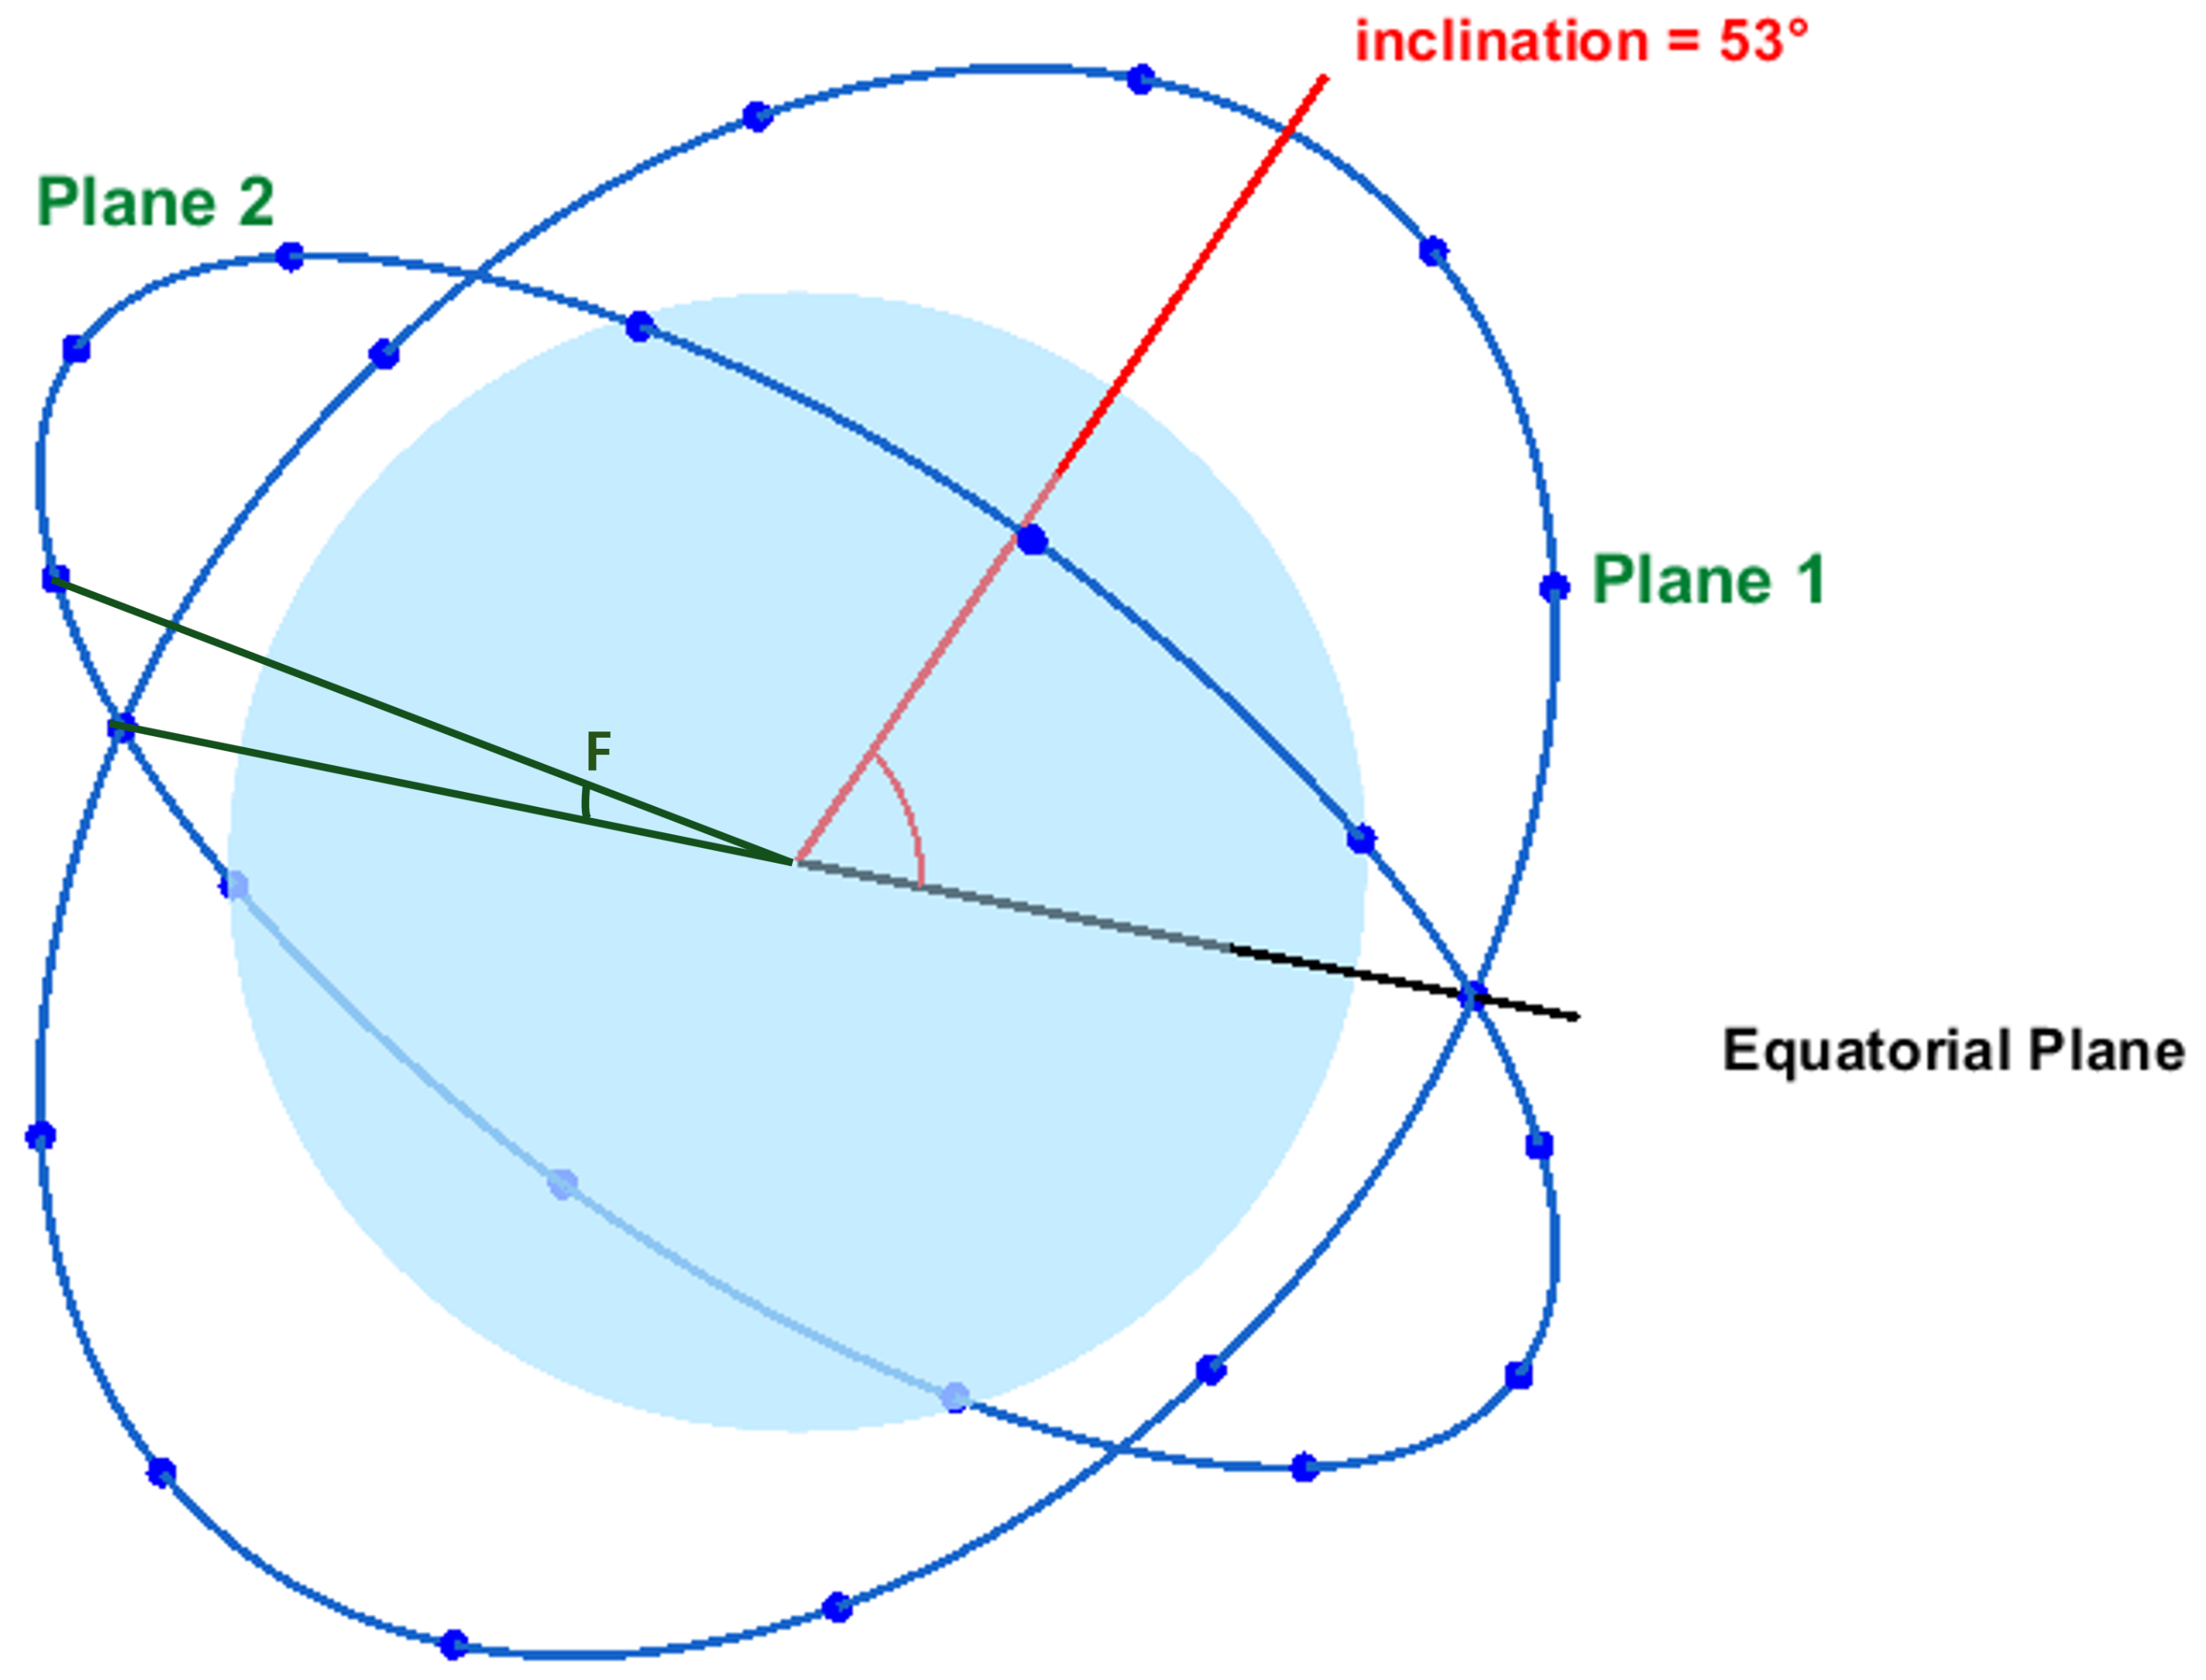
The constellation utilized in this study is based on the Delta–Walker constellation concept initially proposed by Clarke [8] and later refined via the Walker–Delta pattern introduced by Walker [9]. This pattern arranges multiple satellites at a shared altitude and inclination while uniformly distributing them across orbital planes, ensuring a consistent phase offset for continuous global or regional coverage.
In this study, we define a constellation group by its inclination (i), the number of orbital planes (p), and the total number of satellites within that group (n). Additionally, the relative phasing between satellites in different orbital planes is denoted by F. Unlike a traditional single Walker–Delta constellation with a uniform inclination, our approach views the overall satellite constellation as a combination of multiple distinct constellation groups.
Each group possesses its own specific inclination, along with its associated number of orbital planes and relative phasing. This multi-group strategy not only allows for the deployment of satellite clusters that are optimized for different coverage characteristics or regions of interest but also enhances revisit times and improves regional coverage when compared to a single, uniform-inclination Walker–Delta constellation [10].
It is important to note that within each individual constellation group, all satellites operate at the same orbital altitude (either LEO or VLEO). This study does not consider a hybrid Walker–Delta constellation in which satellites within the same pattern occupy different altitudes.
The proposed constellation design, leveraging this multi-group approach with potentially varying inclinations across groups, aims to offer continuous regional coverage and robust data collection while maintaining adaptability to mission-specific objectives. The parameters of each constellation group (inclination, number of planes, number of satellites, and relative phasing) are key variables explored and optimized within this research to achieve the desired performance metrics.
Figure 1 illustrates key aspects of the Walker–Delta constellation, such as the distribution of planes, inclination angles, and the phase factor (F). In the caption of Figure 1, we further clarify that within each constellation group (satellites sharing a single inclination angle), the phase factor (F) determines the relative longitudinal spacing between satellites in adjacent orbital planes, as per the MATLAB definition of the ’phasing’ parameter. The entire constellation comprises multiple groups with possibly different inclinations.
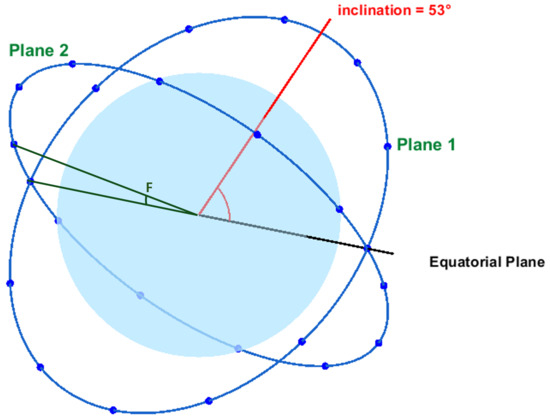
Figure 1.
Walker–Delta constellation.
2.4. NTNs
Advances in communication technologies and growing demand for next-generation services have accelerated the development of non-terrestrial networks (NTNs). The exponential growth of smart devices further drives this expansion.
NTNs provide stable and extensive connectivity in areas with limited terrestrial coverage, such as rural regions, maritime zones, and airborne platforms. According to the 3rd Generation Partnership Project (3GPP), NTNs can use relay nodes and base stations positioned at various altitudes. These include space-based systems (GEO, MEO, and LEO) and airborne systems like UAS and HAPS. For example, UASs (Unmanned Aerial Systems) offer flexible deployment for temporary or emergency coverage, while HAPSs (High Altitude Platform Stations) provide quasi-stationary platforms that bridge the gap between terrestrial and satellite networks [11].
A key benefit of NTNs is their ability to offer reliable connectivity in regions where building terrestrial networks is economically unfeasible. In addition to supplementing terrestrial networks, NTNs support continuous service for Machine-to-Machine (M2M) communications and Internet of Things (IoT) devices, thereby enabling seamless data exchange and real-time operations.
Given these advantages, NTNs are becoming vital for modern satellite constellations in commercial, scientific, and military applications. Their broad coverage, scalability, and reliability are crucial for next-generation space-based communication infrastructure. However, NTNs also face challenges such as Doppler shift compensation and complex satellite-to-ground handovers, which require effective solutions. In this study, we investigate the use of NTN technologies to facilitate communication between LEO and VLEO satellite constellations and ground-based IoT devices.
2.5. LPWANs
Low-Power, Wide-Area Network (LPWAN) technology supports long-range communication with very low power consumption, making it ideal for IoT and M2M applications. LPWANs have shown significant promise in various fields, such as security, agriculture, smart cities, and smart homes, thanks to their energy efficiency and low maintenance costs [12].
Traditional short-range wireless technologies (e.g., Zigbee and Bluetooth) offer low power consumption but suffer from a limited range, making them less suitable for large-scale deployments. In contrast, cellular technologies (3G, 4G, and 5G) provide long-range communication and high data rates, yet they typically demand higher power, which is a drawback for battery-powered IoT devices. Therefore, in IoT-NTN environments, where low-power operation is crucial, LPWANs strike an optimal balance between energy efficiency and extended coverage.
While LPWANs achieve energy-efficient operation, they generally support lower data rates compared to conventional satellite communications. This limitation can be mitigated by integrating LPWANs with AIoT—where edge computing techniques process data locally—thereby compensating for the lower data throughput and creating a synergistic effect.
2.6. LoRa
LoRa (Long Range) is an unlicensed LPWAN communication technology developed by Semtech, utilizing a proprietary Chirp Spread Spectrum (CSS) modulation scheme. This modulation technique enables long-range communication with minimal power consumption, making it particularly effective for large-scale IoT networks. The LoRaWAN protocol further enhances LoRa’s efficiency by adopting a star topology, where each node directly transmits data to a gateway. The gateway, powered by a direct energy source, connects to the core network infrastructure and can simultaneously receive and decode up to 50 concurrent transmissions, ensuring efficient large-scale deployments [13]. (The LoRaWAN protocol stack is defined in the official specification (v1.0.4) issued by the LoRa Alliance [14]).
Field-scale measurements report an average latency of 2–6 s, an energy consumption of ≈0.993 mJ bit−1, and ≈1200 simultaneous connections per 125 kHz channel for LoRaWAN nodes [15].
LoRa’s transmission characteristics are defined by several key parameters. It operates in the sub-1GHz ISM (Industrial, Scientific, and Medical) band, with frequency allocations varying by region, such as 868 MHz for Europe, 915 MHz for the US, and 923 MHz for Asia. The spreading factor (SF) ranges from SF7 to SF12, controlling the ratio between the symbol rate and chip rate, thereby balancing sensitivity and the data rate. A higher SF increases sensitivity and allows for longer transmission ranges but reduces the data rate, while a lower SF improves the data rate at the cost of reduced sensitivity. The bandwidth (BW) parameter defines the frequency range used for data transmission. A wider bandwidth results in faster data rates and shorter transmission times but reduces receiver sensitivity, whereas a narrower bandwidth increases sensitivity while limiting the data rate. Finally, the coding rate (CR) determines the level of forward error correction applied during transmission, typically set between 4/5 and 4/8, balancing error resilience and data throughput.
These flexible transmission parameters allow LoRa to be adapted for a wide range of deployment scenarios, providing robust data transmission and efficient spectrum utilization across diverse environments.
2.7. NB-IoT
Narrowband Internet of Things (NB-IoT) is a core component of LPWAN technologies, effectively leveraging existing cellular network infrastructure to provide low power consumption, long-range communication, and massive device connectivity, significantly contributing to the expansion of the IoT ecosystem. Standardized in 3GPP Release 13, NB-IoT supports both extended transmission ranges and power efficiency, enabling reliable and efficient communication for large-scale IoT deployments. Large-scale field trials have demonstrated an average energy consumption of 0.25 mJ bit−1, support for up to 50,000 devices per cell, and a mean latency of 1.5–10 s [16].
NB-IoT employs sub-carriers to support both single-tone and multi-tone transmissions. Single-tone transmission utilizes a single sub-carrier to maximize power efficiency, making it suitable for low-rate data transfer and periodic sensing applications. In contrast, multi-tone transmission leverages multiple sub-carriers simultaneously, increasing data rates and making it ideal for applications requiring higher throughput.
For uplink (UL) transmissions, multi-tone transmission uses QPSK modulation, while single-tone transmission employs either π/2-BPSK or π/4-QPSK modulation. On the downlink (DL), QPSK modulation is predominantly used to ensure signal robustness. These modulation techniques provide both energy efficiency and signal stability, ensuring reliable communication, even in interference-prone environments.
Notably, NB-IoT offers the highest data transmission rates among LPWAN technologies, excluding LTE-M, making it suitable for IoT applications with higher data-rate demands.
2.8. Mioty
Mioty is a standardized LPWAN technology based on ETSI 103 357, operating in the sub-1GHz ISM band and defined by three key protocols: Lfour, TS-UNB, and DD-UNB. By establishing a standardized ecosystem, Mioty enables interoperability among multiple manufacturers and service providers, with ongoing collaboration through organizations such as the Mioty Alliance to ensure sustainable technological advancement [17].
Mioty can accommodate more than one million concurrent devices per network while achieving sub-second average latency; its per-bit energy consumption is only 0.010 mJ [18]. The complete protocol stack is specified in ETSI TS 103 357-2 V2.1.1 [19].
Mioty excels in frequency efficiency, maintaining reliable communication in congested frequency environments through its Time-Slotted Multiple Access (TSMA) random channel access mechanism, which minimizes interference while supporting simultaneous connections for numerous devices. Notably, one of Mioty’s key differentiators is its ability to support a significantly larger number of connected devices compared to other LPWAN technologies.
A key advantage of Mioty lies in its scalability. Within a narrow 200 kHz bandwidth, it can support up to 3.5 million connections per day, making it particularly suitable for large-scale IoT networks such as smart cities, industrial automation, and environmental monitoring.
Furthermore, Mioty employs a hardware-independent architecture, allowing for flexible implementation across various platforms using software-defined solutions. This design minimizes both memory and processing power requirements, while the TSMA random channel access ensures robust data collection performance, even in interference-prone environments.
2.9. AIoT
With the rapid proliferation of IoT technologies, edge computing-based approaches have gained significant attention for their ability to reduce data transmission volumes and enhance system efficiency [20]. Traditional centralized data processing methods often suffer from high network loads and latency due to the transmission of large datasets [21]. To mitigate these issues, various techniques have been adopted for data compression and distributed processing, including advanced AI models, federated learning, and classical compression algorithms such as Run-Length Encoding (RLE) and Huffman coding [22,23].
For example, federated learning enables local model training on IoT devices by transmitting only essential model updates rather than raw data, thereby significantly reducing communication requirements [24,25]. Similarly, data compression techniques like RLE and Huffman coding eliminate redundancy, effectively reducing the size of data before transmission.
In this study, we referenced research conducted by Rinaldi Junior et al. [26] as a strategy to enhance data transmission efficiency and minimize power consumption in an AIoT scenario. In that study, RLE and the k-means clustering algorithm (with k = 5) were applied to agricultural remote sensing data in an edge-computing machine learning environment, reducing the total data volume by approximately 2.4 ± 0.7% relative to the original data.
Based on the unique constraints of a satellite-based IoT-NTN environment, our study assumes a more aggressive data reduction scenario, targeting a reduction rate of 15%. Accordingly, the initial daily data transmission volume is assumed to be 11.52 MB, and after applying a 15% reduction, the optimized daily data transmission target is calculated to be approximately 1.73 MB. This significant reduction in transmitted data not only decreases transmission delays and conserves energy but is also expected to make the use of LPWAN technology more advantageous in such environments.
Edge computing further contributes to system efficiency by enabling localized data processing directly on IoT devices, reducing the need for continuous communication with central servers. This approach minimizes network latency, facilitates faster feedback, and increases data handling capacity—particularly in resource-constrained environments such as embedded systems.
3. Experimental Scenario and Specifications
3.1. Scenario
The experimental scenario in this study involves communication within an NTN environment that utilizes a satellite constellation composed of two distinct groups operating at the same orbital altitude. Unlike traditional Delta–Walker constellations that employ a single inclination with multiple orbital planes, our design divides the constellation into two groups, each with its own inclination, number of orbital planes, number of satellites, and phase factor (F). This dual-inclination approach is adopted to complement the revisit time and coverage by leveraging the benefits of operating with two different inclinations.
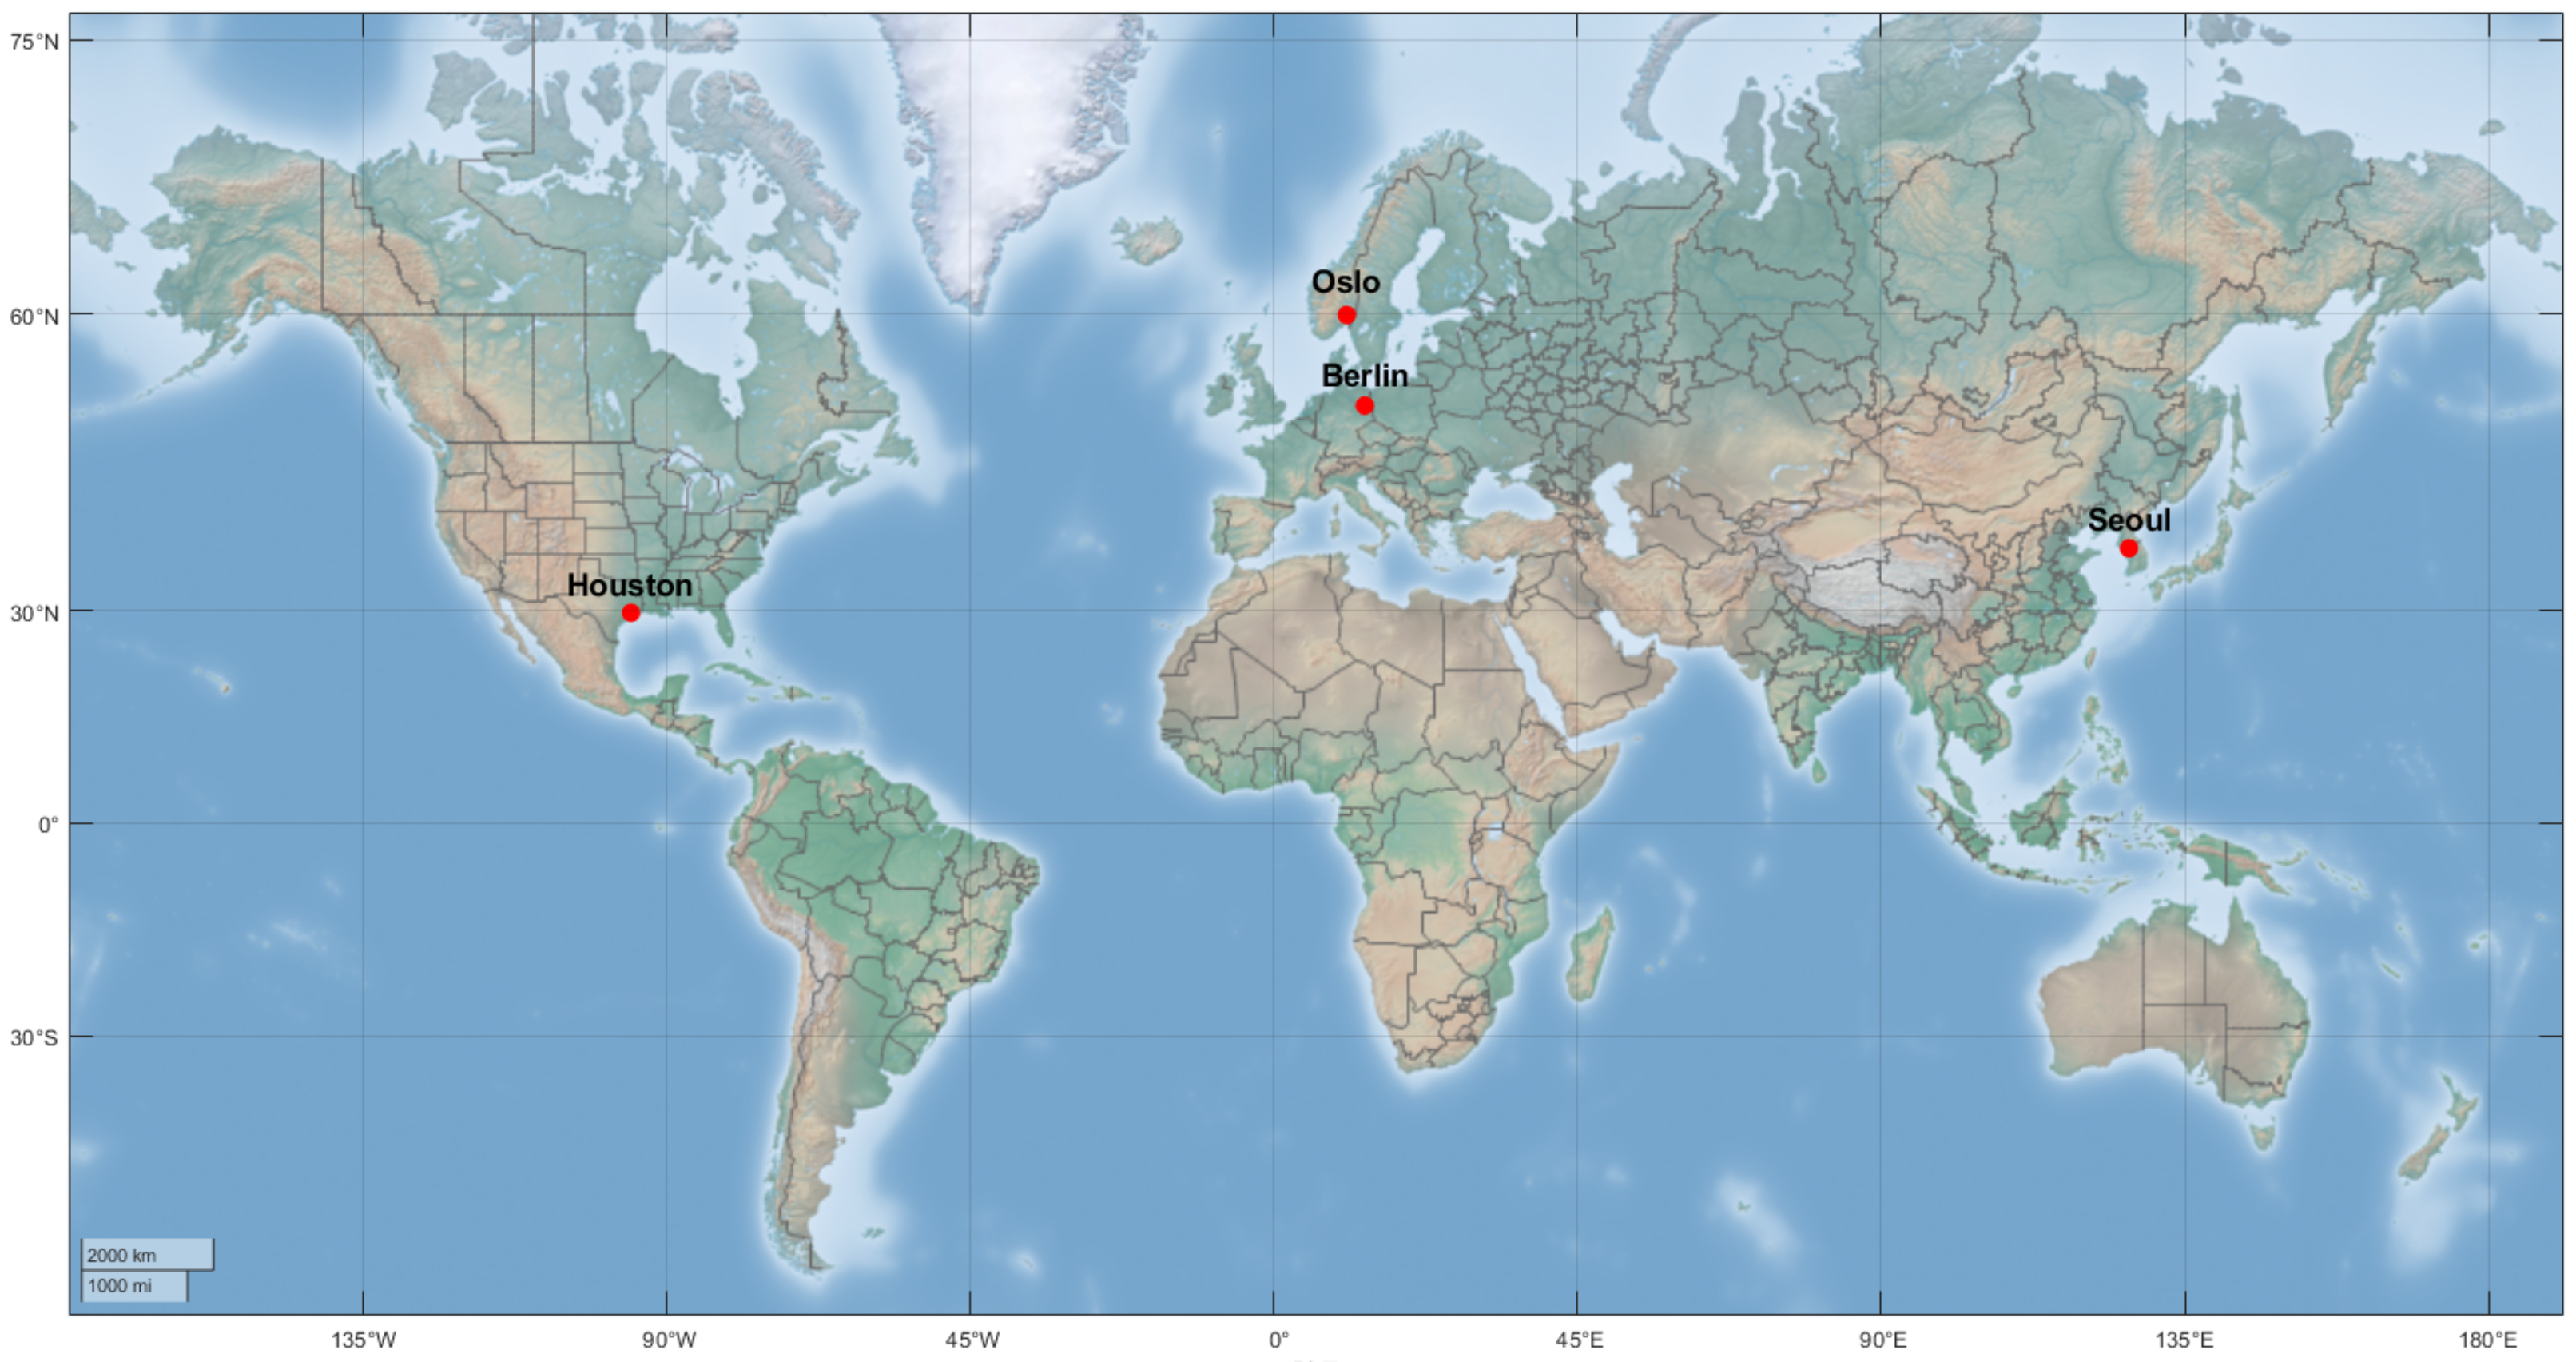
The simulation was conducted using MATLAB R2024a and Satellite Communication Toolbox (The MathWorks, Natick, MA, USA) over a 14-day period, from 1 January 2025 to 14 January 2025, with a sample time of 1 min, from which daily averages were calculated. Figure 2 shows the four utilized ground stations. These ground stations are located in representative cities in the northern hemisphere between 30° and 60° latitude chosen based on population and economic activity (Seoul, Berlin, Oslo, and Houston). The coordinates for each ground station are as follows: Seoul, 37.71°, 126.73°; Berlin, 52.50°, 13.42°; Oslo, 59.94°, 10.75°; and Houston, 29.76°, −95.37°. Key settings and parameters used in this simulation are summarized in Table 1.
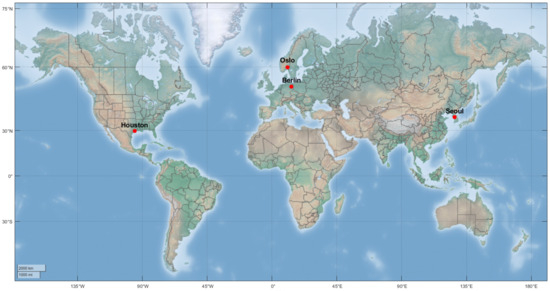
Figure 2.
Four ground stations.

Table 1.
Key simulation parameters.
At each time step, we first checked the elevation angle (mask = 5°). If the satellite was above this mask, we computed the link margin using system parameters (antenna gains, path losses, noise figure, etc.) based on Equation (1) [27]. Detailed system parameter values and satellite antenna characteristics are covered in a separate section. Coverage was assumed when
Based on this link margin criterion, the visible time instances were collected to calculate the revisit time and daily throughput.
3.2. LoRa Specifications
To determine the LoRa communication parameters used in this study, the following steps were undertaken. First, the bandwidth (BW), a fundamental parameter in LoRa communication, was set. Although BW can be chosen among 125 kHz, 250 kHz, and 500 kHz, this study selected 125 kHz—the narrowest available option—because a higher bandwidth would require a higher bit rate for the same spreading factor, thereby reducing the link margin in the power-constrained IoT-NTN environment. Additionally, considering the typically low data transmission requirements in AIoT applications, the 125 kHz option is deemed appropriate. The ISM band was set to 920 MHz in accordance with South Korean regulations.
Next, the bit rate () was calculated using the following equation [12]:
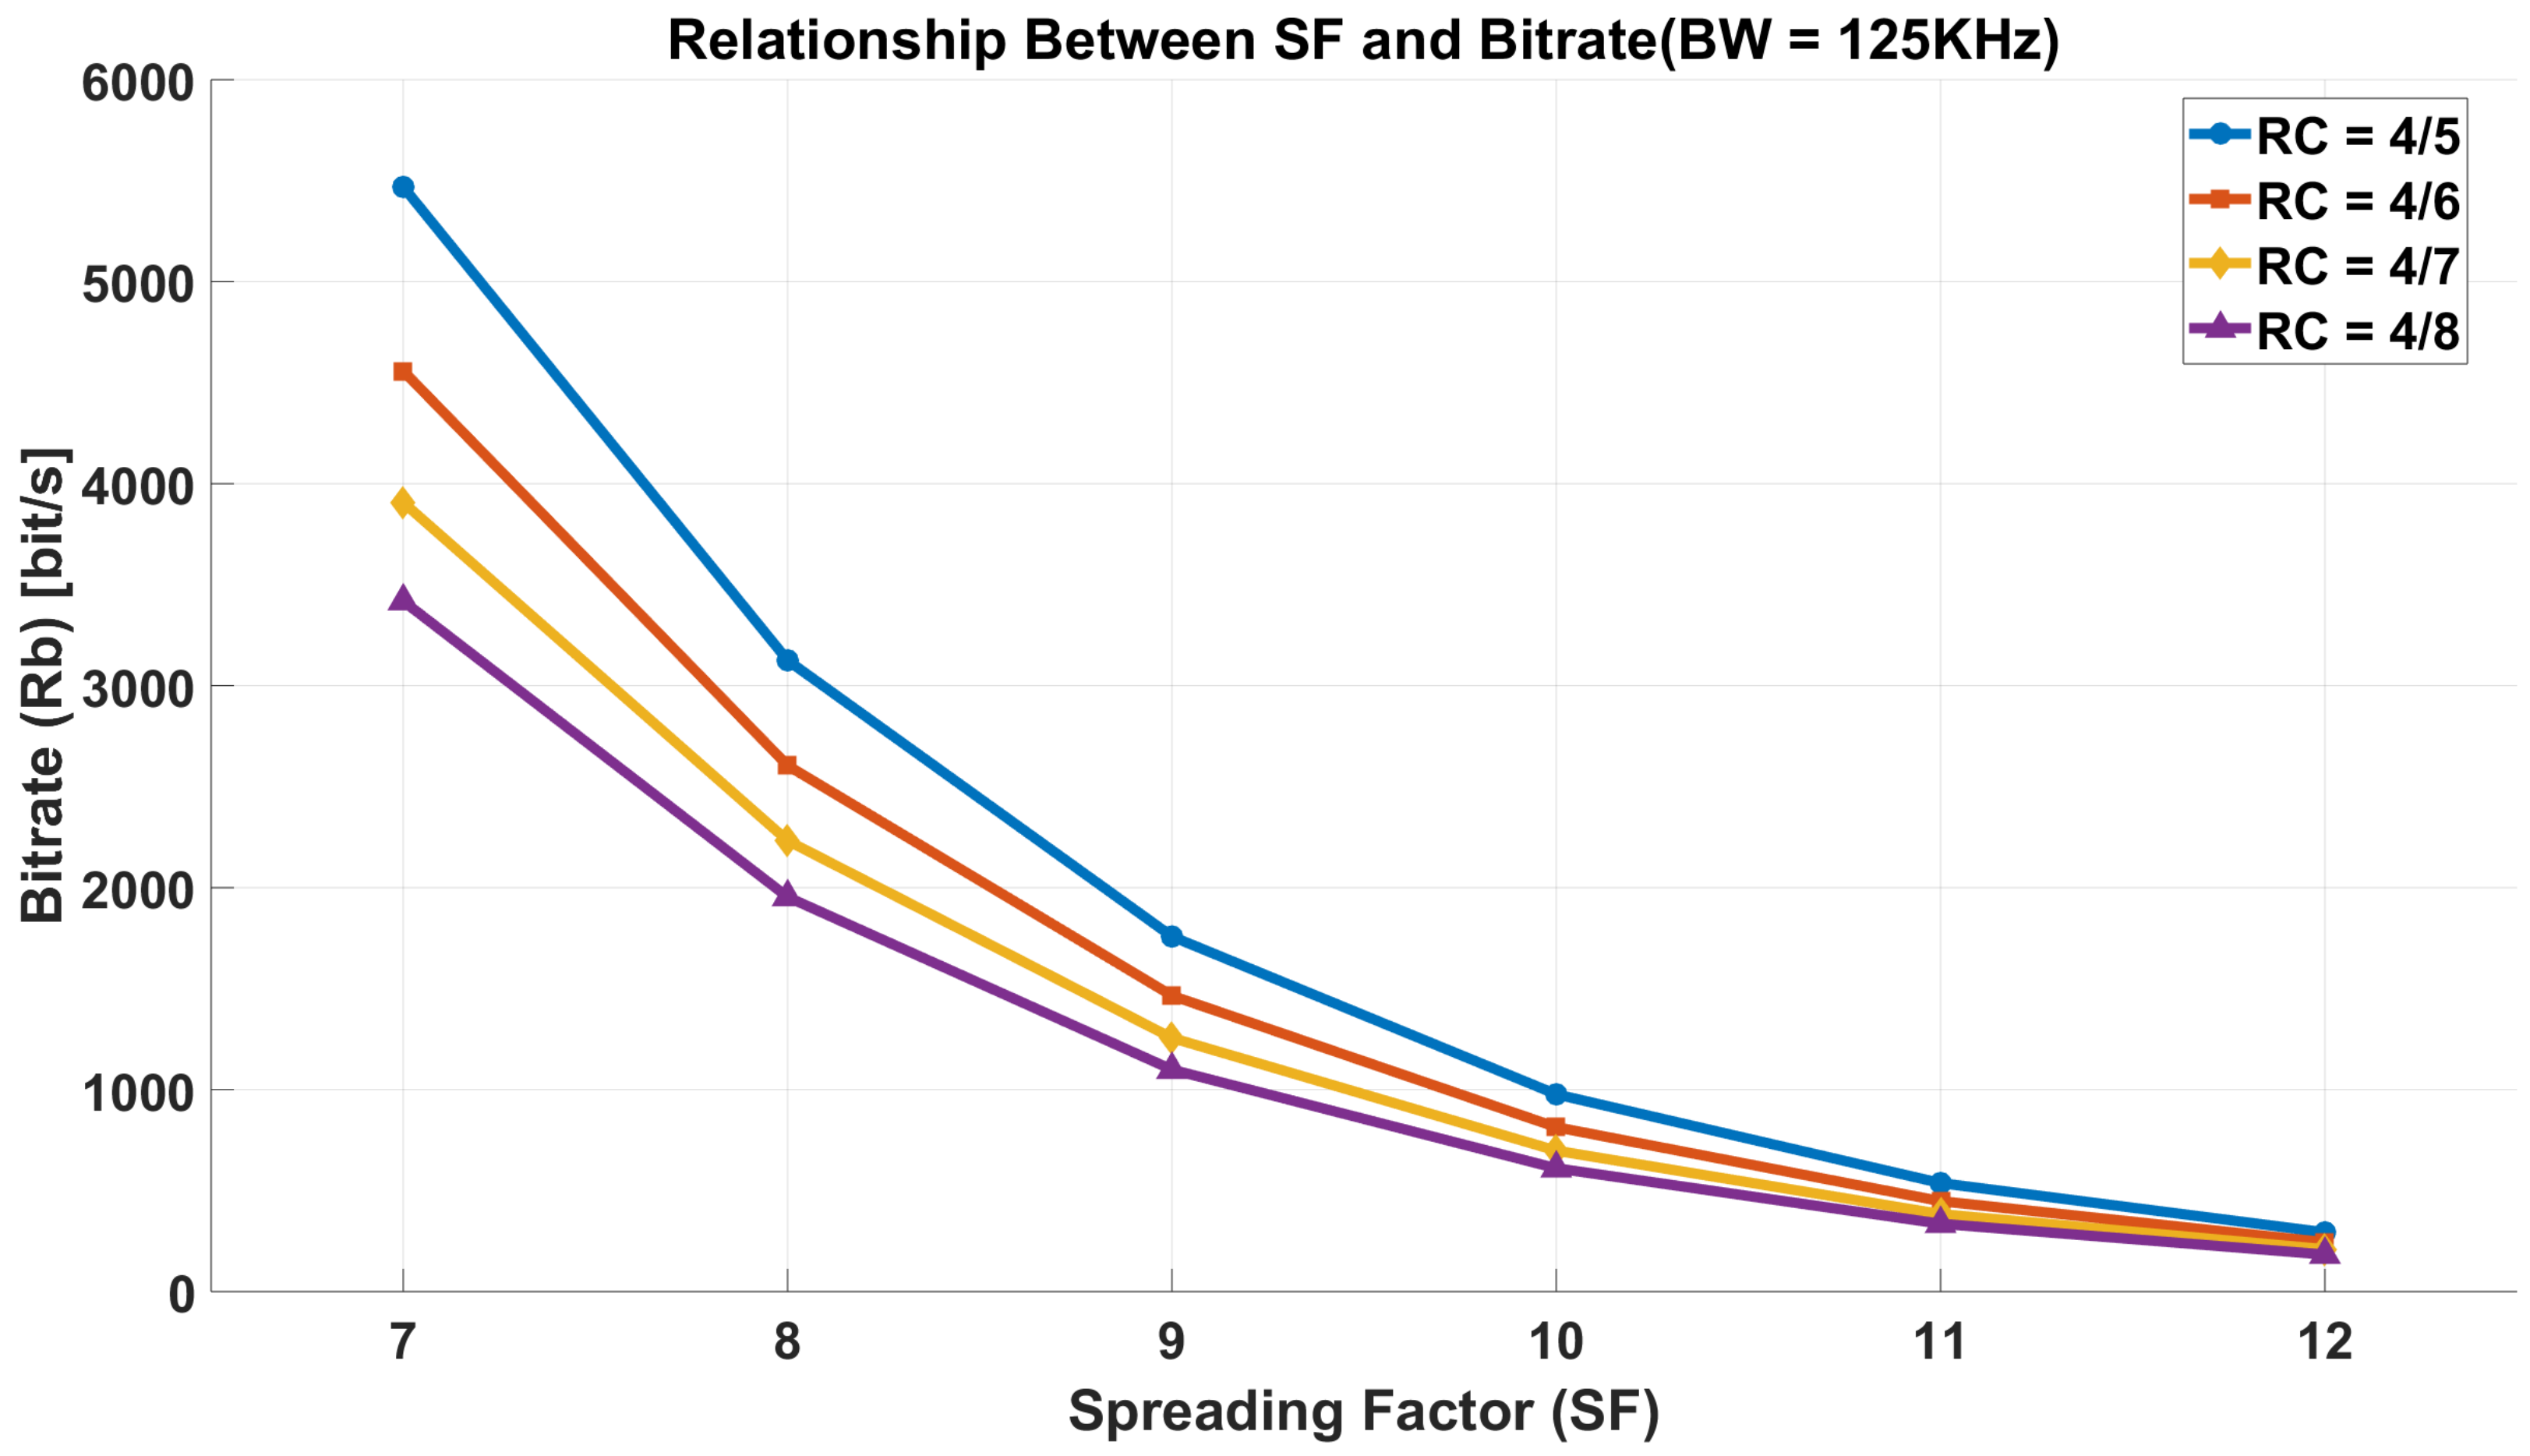
Figure 3 shows the relationship between the spreading factor (SF) and the bit rate for LoRa communication. Note that this experiment is a simulation study. For this study, SF = 8, the coding rate (CR) was set to 4/5, and BW = 125 kHz, yielding a bit rate of 2604 bps [15,28].
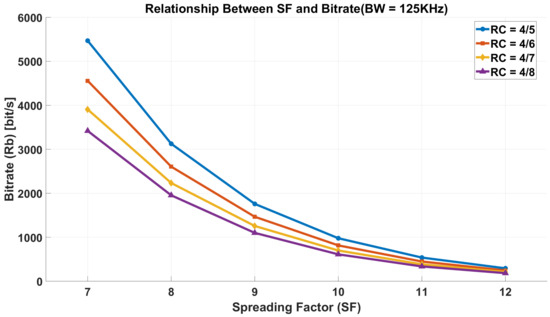
Figure 3.
Relationship Between SF and Bitrate (BW = 125 KHz).
The receiver sensitivity was set to −126 dBm for SF = 8. Sensitivity is determined by the signal-to-noise ratio (SNR), which decreases with increasing SF. The SNR was calculated as follows [12]:
For SF = 8, the SNR was set to 10 dB. The required was then computed as follows [12]:
Using SNR = 10 dB, BW = 125 kHz, and bps, the required was calculated as 6.8 dB. The transmission power for the LoRa uplink (UL) was set to −10 dBW (0.1 W), ensuring efficient power usage while maintaining reliable data transmission.
The system temperature and G/T were computed as follows [12]:
The calculated system temperature () was 693.7 K, and the G/T value was −26.27 dB/K.
3.3. NB-IoT Specifications
NB-IoT, when operated at an altitude under 600 km in a LEO constellation, is subject to Doppler shift, which is acknowledged but not further detailed here. To ensure robust performance in a satellite-based IoT-NTN environment, the frequency was set to 1995 MHz, with the single-carrier bandwidth limited to 180 kHz [11]. These frequency and bandwidth selections are proposed based on conventional wisdom to be advantageous for the IoT-NTN environment.
According to 3GPP Release 13, the maximum bit rate () for single-tone NB-IoT transmission can reach 16.9 kbps; however, for this study, was arbitrarily set to 10 kbps based on IoT power consumption considerations and the resulting link margin requirements.
The receiver sensitivity was calculated using a 15 kHz sub-carrier spacing and the following equation [29]:
Based on the NPUSCH format 2 settings from 3GPP Release 16, with a sub-carrier spacing of 15 kHz and a repetition factor of 16, the SNR was determined to be −3.9 dB [30], which requires an of 6.9 dB. The transmission power was set to −7 dBW, balancing efficient power usage with reliable data transmission.
3.4. Mioty Specifications
Mioty, similar to LoRa, operates in the ISM band. For this study, a frequency of 920 MHz was chosen, in accordance with South Korean regulations. The system supports both 100 kHz and 200 kHz bandwidth modes, as specified by the ETSI standard for uplink IoT applications. In this work, the bandwidth was set to 200 kHz in order to maintain a bandwidth similar to that of the other two communication technologies used in this study.
The TSMA (Time-Synchronized Multiple Access) mode used here was set with a carrier spacing of 2380.37 Hz. Since this is a simulation experiment, theoretical values were employed, and any practical implementation issues were ignored. For uplink transmission, Gaussian Minimum Shift Keying (G-MSK) modulation was used, resulting in a bit rate of 2380 bps in the Ultra Low-Power (ULP) transmission mode. Again, the bit-rate value was used as a theoretical parameter for the simulation.
According to ETSI TS 103,357 v1.1.1, the noise figure (NF) was set to 4 dB, and the transmission power (Tx Power) was −16 dBW. The receiver sensitivity was set to −139 dBm. The required for coherent reception was calculated as 3.6 dB. Using the same equations for and as described earlier, the system temperature was calculated as 583 K, and the value of was −25.51 dB/K [31].
All of these parameters were used as theoretical values in this simulation experiment. Table 2 summarizes the key communication parameters of the three LPWAN technologies evaluated in this study, while Table 3 provides the detailed specifications of the corresponding satellite and ground station configurations. All Parameter values originate from large-scale measurement campaigns and official specifications [14,15,16,18,19,32].
Table 2.
Communication specifications of LPWAN technologies.
Table 3.
Specifications of satellite and ground stations for LPWAN technologies.
3.5. Antenna Configuration
In this study, all satellite payloads are assumed to be mounted on a 1U CubeSat platform (100 × 100 × 100 mm). To meet the strict volume and mass budgets of both the CubeSat and IoT endpoint devices, we implemented a rectangular patch microstrip antenna specifically designed for this work on a 100 mm × 100 mm FR4 substrate. According to Widyastuti et al. [33], whereas existing Rogers Duroid-based designs achieve up to 2.6 dBi gain, a patch microstrip antenna designed on the same FR4 substrate exhibits 1.992 dBi gain. In this paper, considering the short lifespan and economic constraints of LEO/VLEO CubeSats, we selected an FR4-based patch microstrip antenna based on these experimental results, and within the limited 100 mm × 100 mm footprint, we optimized the parameters to tailor antennas for each communication band (920 MHz for LoRa and Mioty and 1995 MHz for NB-IoT) [34]. Moreover, the 1.6 mm-thick FR4 substrate offers low cost and compatibility with standard PCB processes, with short-term space qualification demonstrated in similar CubeSat studies.
Furthermore, in this section, we focus on gain, among various antenna performance metrics (e.g., return loss, VSWR), as the primary goal of this study is to select a single antenna that maximizes the link margin between the CubeSat and small IoT devices in an IoT-NTN LPWAN environment. In particular, for LPWAN-based IoT-NTN applications involving CubeSats and ground devices, gain is considered the most critical factor compared to other performance metrics.
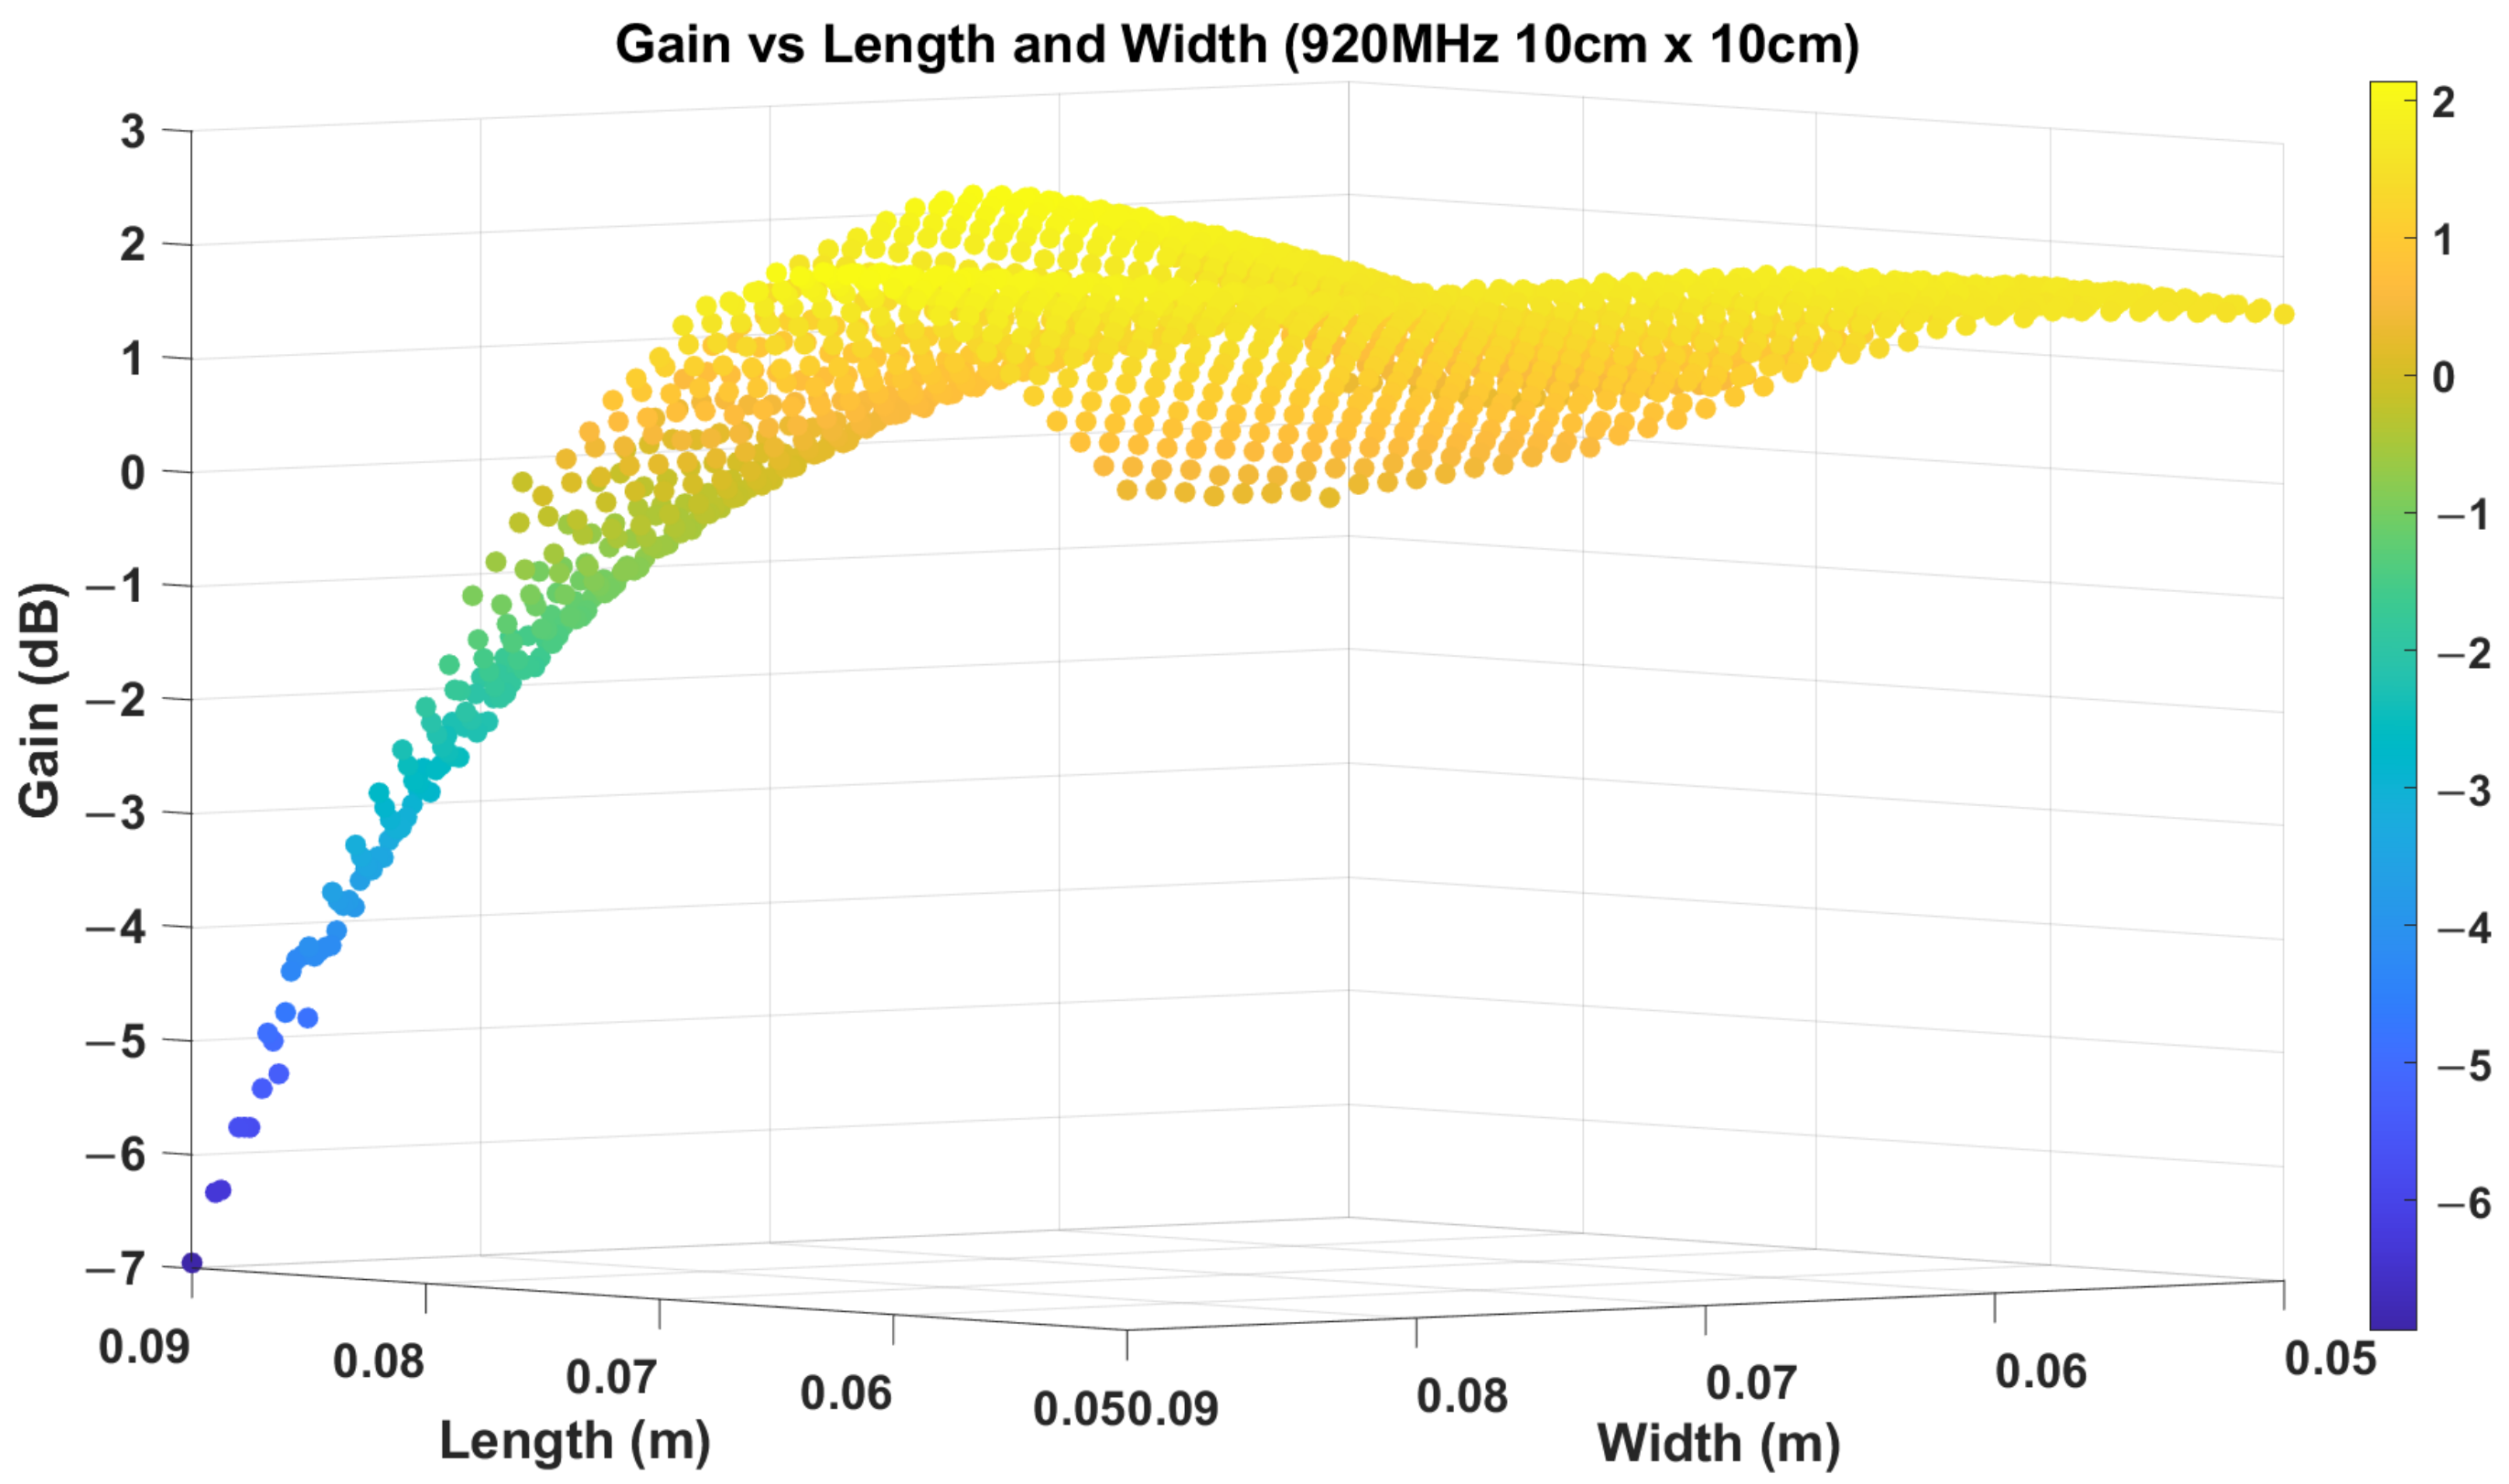
Antenna Design and Gain Optimization
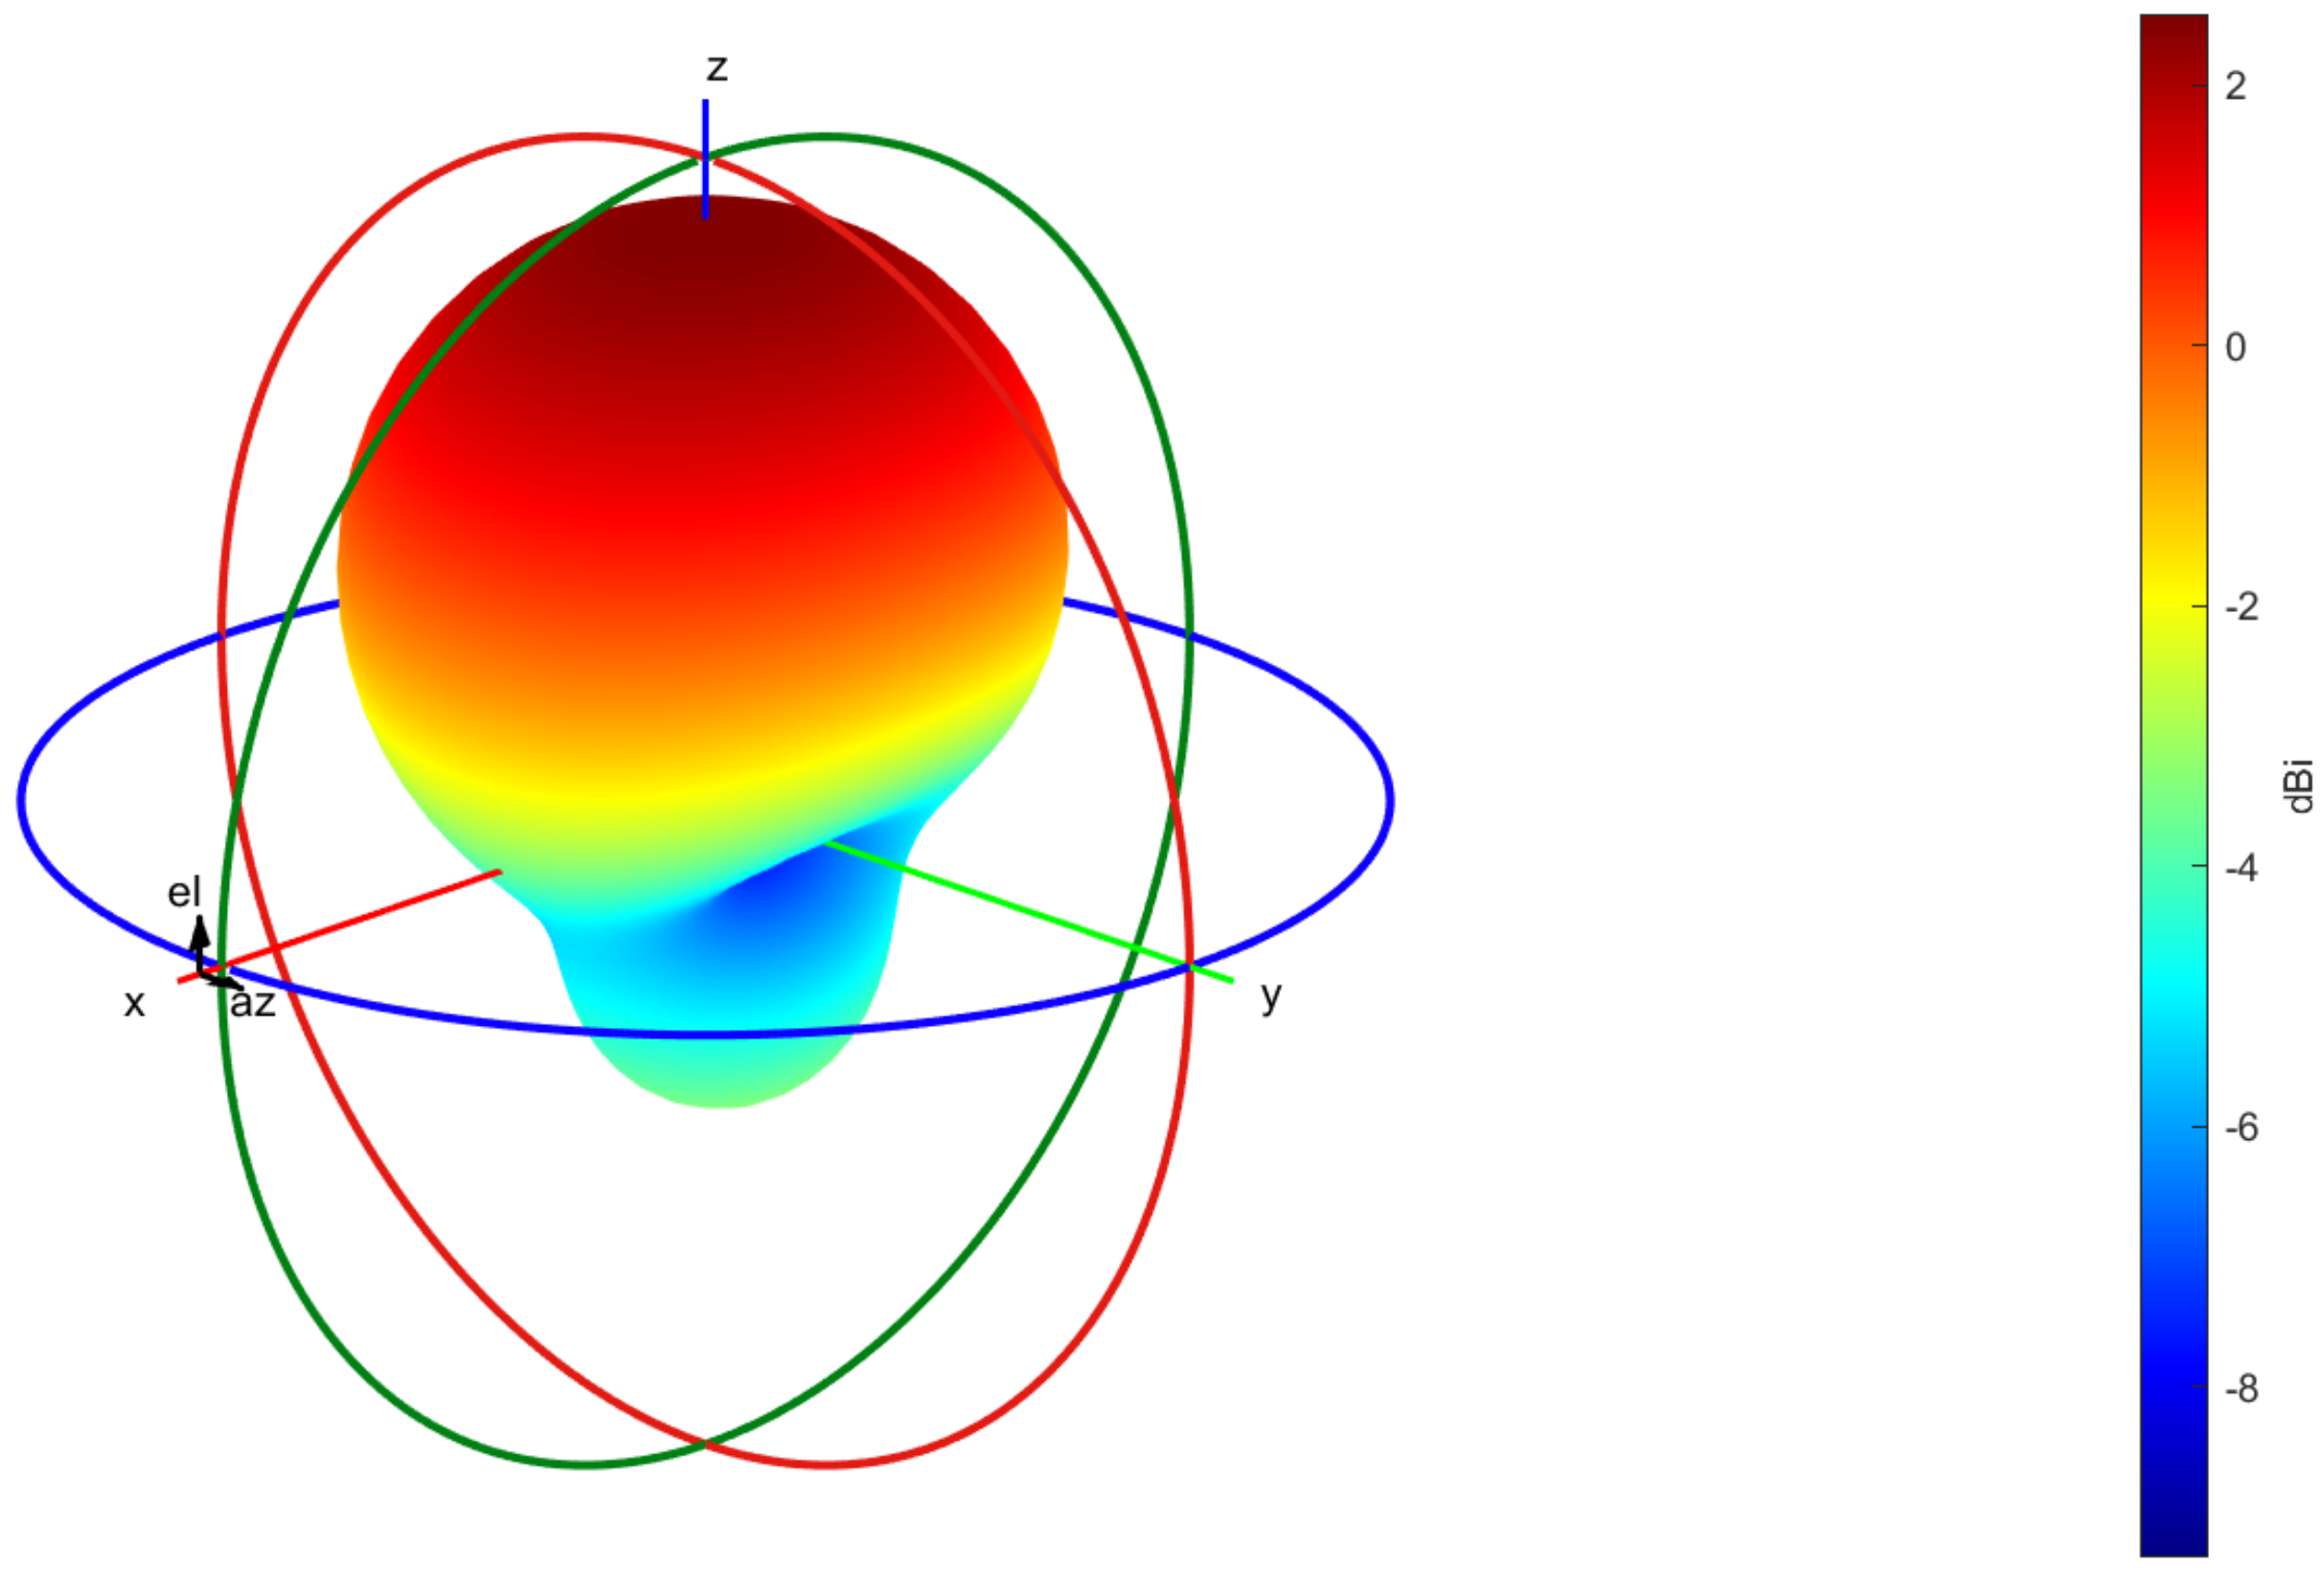
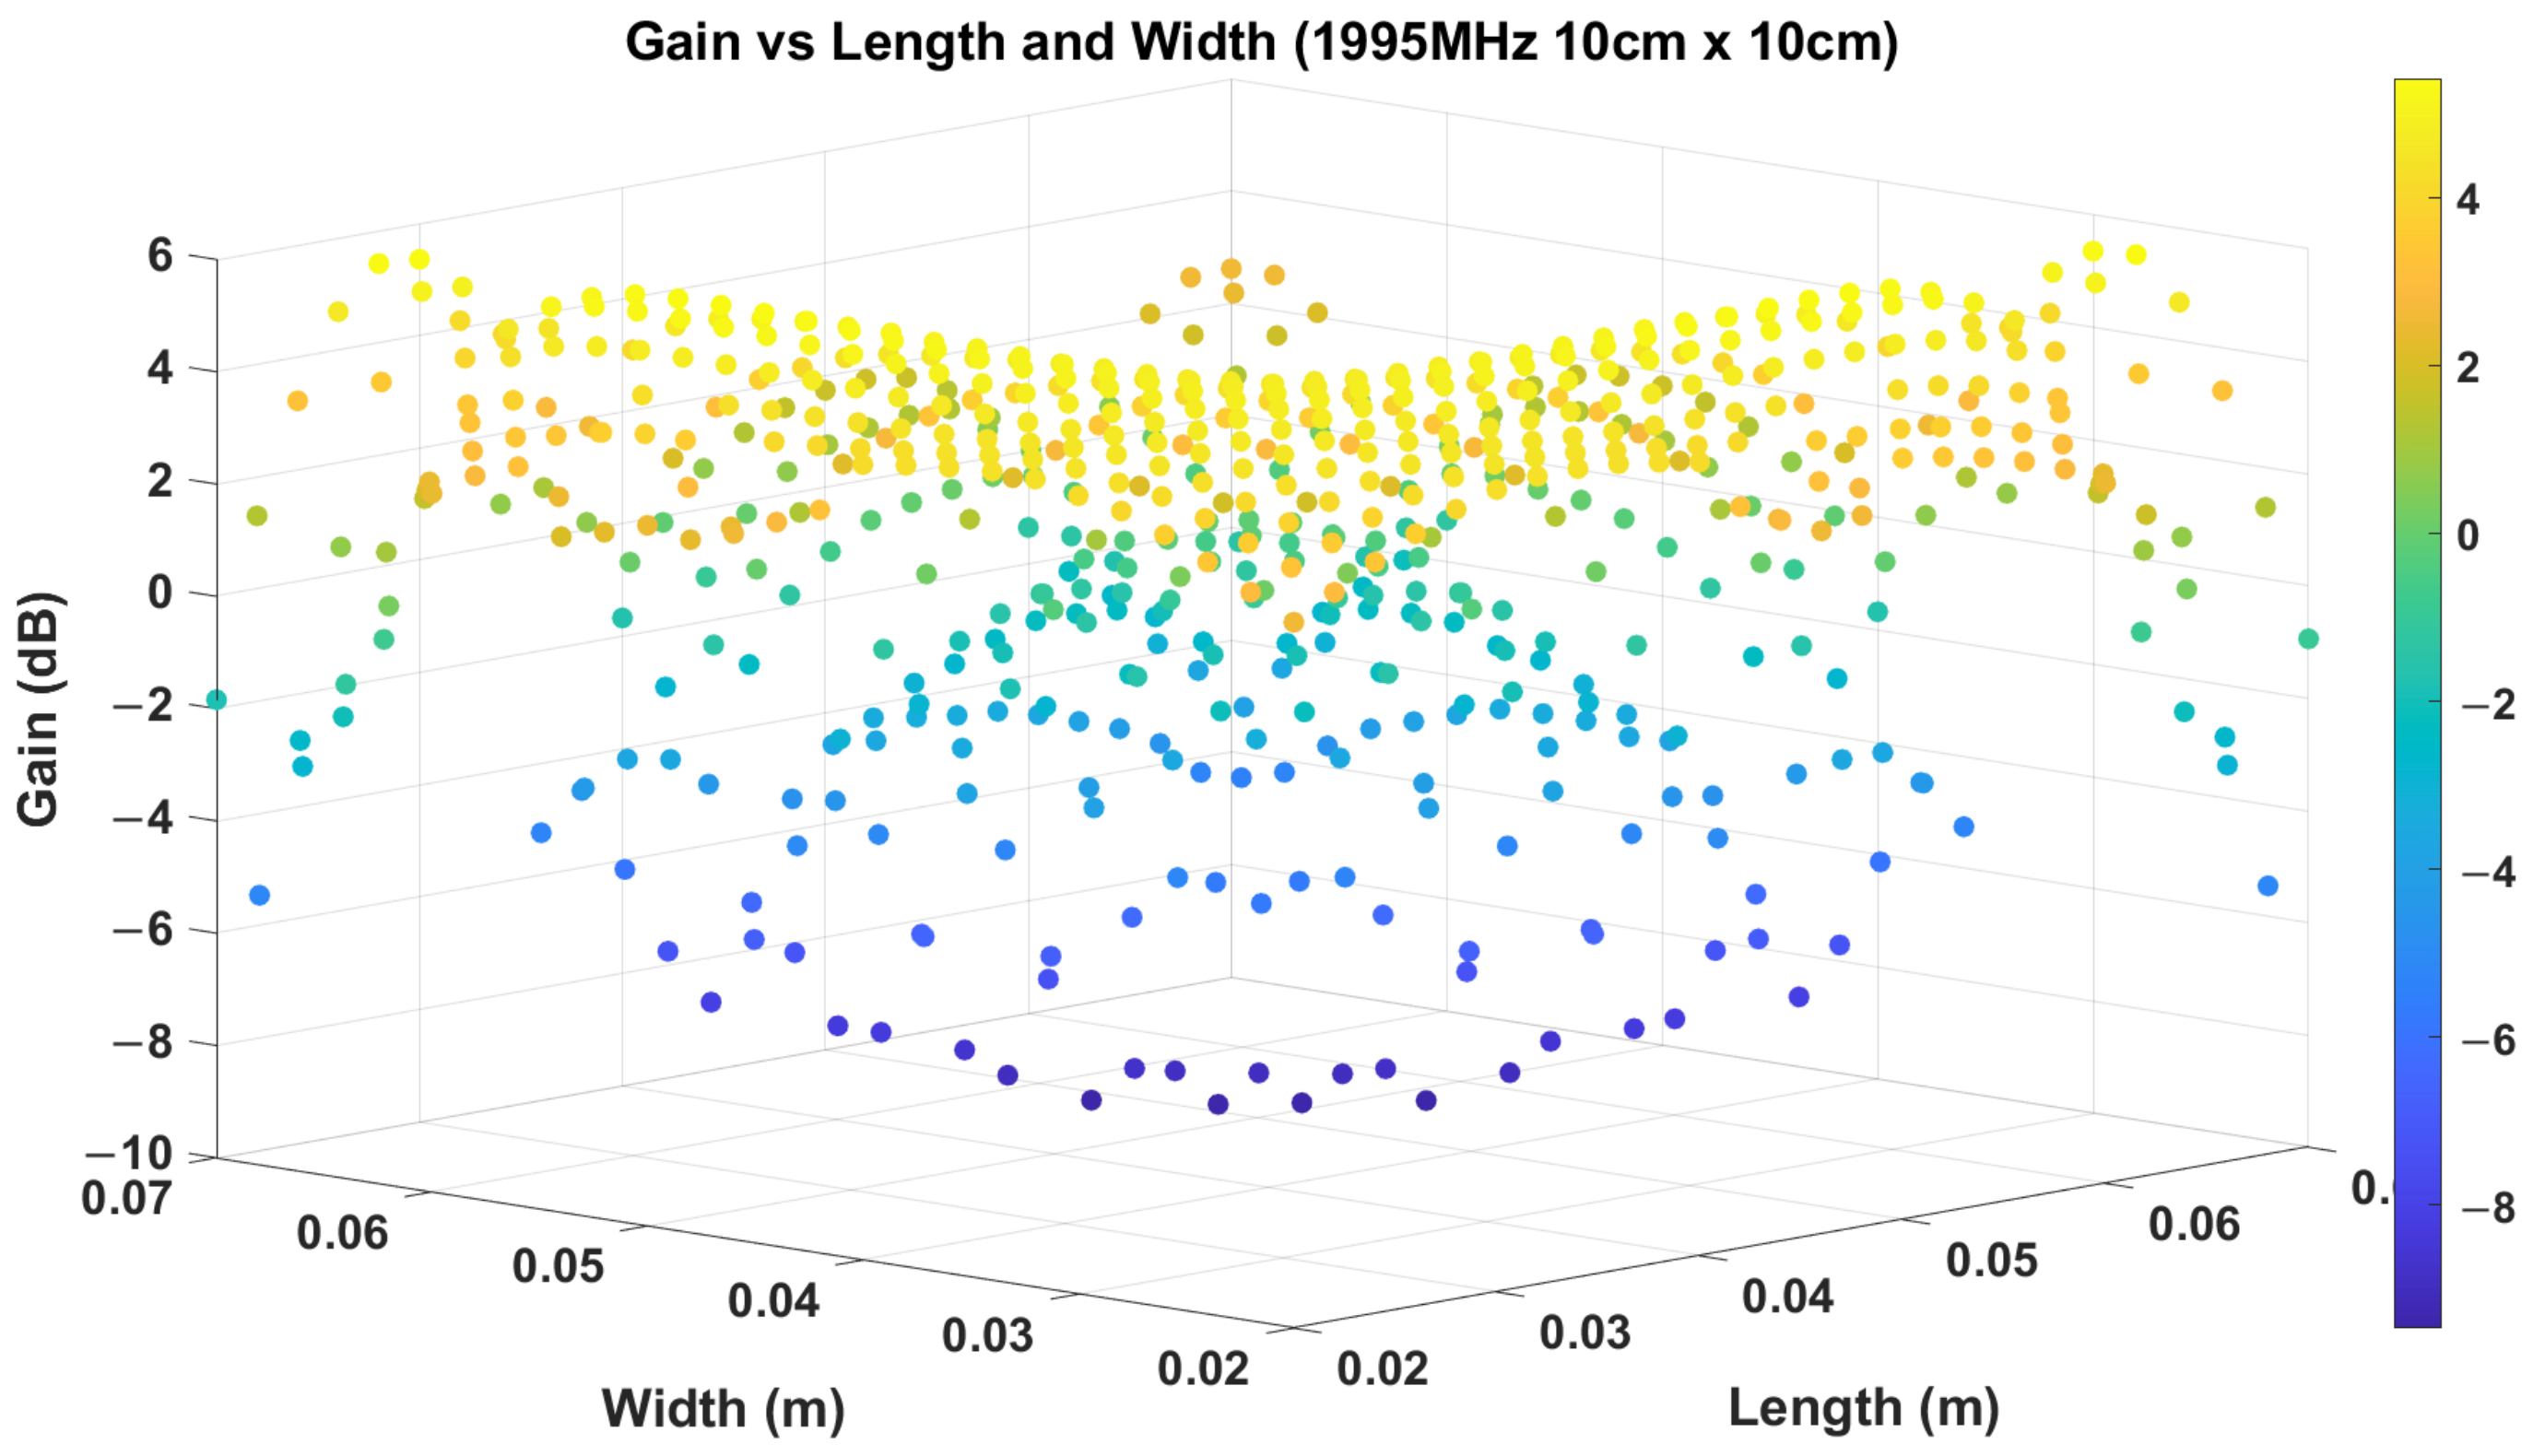
LoRa and Mioty both operate in the sub-1 GHz ISM band (920 MHz for South Korea). Therefore, a patch microstrip antenna was designed on a 100 mm × 100 mm FR4 substrate. To determine the optimal antenna size, MATLAB simulations were conducted by varying the patch width and length between 50 mm and 90 mm. The simulation process and resulting gain measurements are illustrated in Figure 4. The optimal dimensions were determined to be a length of 90 mm and a width of 63 mm (Figure 5), resulting in a maximum gain of 2.14 dB and a beam width of 112 degrees. Similarly, as shown in Figure 6, for NB-IoT, simulations were performed to determine the optimal design for a patch antenna operating at 1995 MHz. The optimal dimensions for NB-IoT were found to be a length of 70 mm and a width of 28 mm (Figure 7), yielding a maximum gain of 5.51 dB and an upwardly directed radiation pattern with a beam width of 110 degrees.

Figure 4.
Design and Simulation process of the 920 MHz patch microstrip antenna.

Figure 5.
Antenna radiation pattern of the 920 MHz patch microstrip.

Figure 6.
Antenna design and simulation process of the 1995 MHz patch microstrip.
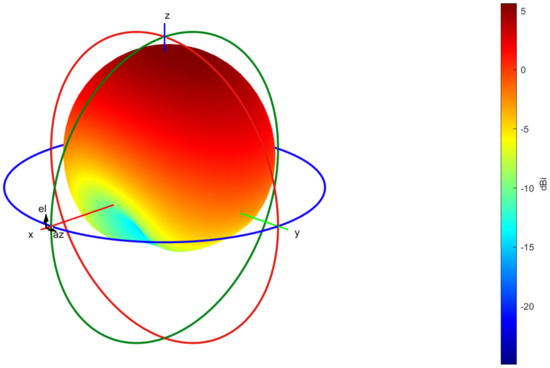
Figure 7.
Antenna radiation pattern of the 1995 MHz patch microstrip.
3.6. Data Transmission Specifications
This study applied data compression and preprocessing techniques to maximize data transmission efficiency and minimize power consumption in an AIoT scenario. Specifically, techniques such as run-length encoding (RLE) and the k-means clustering algorithm (with k = 5) were used to reduce the size of the transmitted data. Although previous computer-based simulations on sensor data processing (conducted on desktop platforms) demonstrated a modest data reduction of approximately 2.4 ± 0.7%, our approach considers an onboard IoT scenario, where, due to differences in processing conditions and constraints, a more aggressive reduction of up to 85% is achievable. In other words, only about 15% of the original data is transmitted. This assumption is based on considerations of a similar dataset and typical IoT hardware performance.
According to a study conducted by Rinaldi Junior et al [26], the initial daily data transmission volume was set to 11.52 MB, and after applying an 85% reduction, the optimized daily transmission target was calculated to be approximately 1.73 MB. This significant reduction in transmitted data not only decreases transmission delays and conserves energy but also makes the use of LPWAN technology more advantageous in a satellite-based IoT-NTN environment.
Note that all parameters in both the antenna and data transmission designs are based on theoretical values and simulation experiments. Practical implementation issues, such as measurement uncertainties and environmental variations, are beyond the scope of this study.
4. Genetic Algorithm Configuration
This study utilized a GA to optimize satellite constellation parameters for a region between latitudes 30° and 60°. This region was selected because it encompasses densely populated and economically active areas, as evidenced by the four chosen cities (Seoul, Berlin, Oslo, and Houston). These cities represent areas with high demand for IoT connectivity.
Unlike traditional Delta–Walker constellations, which deploy satellites in multiple planes with a single inclination, our approach divides the constellation into two distinct inclination groups. This dual-inclination strategy was adopted to ensure that both the revisit time and communication duration were evenly secured, thereby providing comprehensive service coverage over the 30–60° range.
The main objectives of the GA are outlined as follows:
- To maintain an average revisit time (Ravg) of 60 min or less, ensuring data are collected at least once per hour;
- To limit the maximum revisit time (Rmax) to 90 min, preventing excessive data accumulation;
- To ensure sufficient data transmission capability by meeting a target data volume, roughly set at 15% of the original data (approximately 1.73 MB based on an initial value of 11.52 MB) considering our IoT scenario;
- To minimize the total number of satellites (STotal) deployed, thereby reducing overall system cost.
These performance metrics are primarily evaluated based on the link margin, which is influenced by power consumption and the data transmission rate.
The GA simulation was performed using real satellite observation data collected over a 14-day period (1–14 January 2025). This period was chosen because it reflects recent operational conditions, and daily averages calculated over 14 days provide statistically significant results. Furthermore, the minimum daily data transmission volume was set to 2 MB to account for variability.
4.1. Why We Chose a Genetic Algorithm
The design space of our dual-inclination Walker–Δ constellation is mixed-integer, highly non-linear, and populated with numerous local optima. Classical gradient-based or branch-and-bound methods either fail to converge or scale poorly once the number of orbital planes exceeds ∼5. Among stochastic heuristics, the GA remains the most mature and well-documented technique for satellite constellation problems [35,36,37]. Key advantages include the following:
- Native integer encoding: Design variables {i, p, n, F} are stored directly as integers, avoiding real-to-binary conversions required by some PSO or SA implementations.
- Transparent constraint handling: Hard thresholds on the revisit time and throughput are incorporated via adaptive penalties, which is more intuitive than the cooling schedule of SA or the inertia/acceleration tuning of PSO.
- Diversity preservation: Elitism, combined with tournament selection, maintains global search pressure, whereas PSO often loses diversity after 20–30 iterations [36].
4.1.1. Literature-Based Comparison with Other Heuristics
Table 4 summarizes relative performance figures reported in recent studies [36]. Because absolute fitness values and run times are problem-specific, we normalized all results to the GA baseline quoted in each reference. These data confirm that the GA typically attains equal or lower final fitness with fewer hyperparameters to tune.
Table 4.
Performance ratios of heuristic optimizers as reported in the literature (GA = 1.00). Absolute numbers vary by study; only relative trends are compared here.
4.1.2. Computational Complexity of Our GA Implementation
For a population of size P and G generations, the GA evaluates P G chromosomes. With T = 14 × 24 × 60 = 20,160 time steps per chromosome and STotal ≤ 75 satellites, the leading cost is
In our experiments, we used P = 80 and G = 20. All simulations were executed on a desktop PC equipped with an AMD Ryzen 5 7500F (6 cores) and 16GB RAM. The average fitness evaluation time measured by timeit was 186 s per chromosome, yielding an overall single-core run time of 80 × 20 × 186 s ≈ 4960 min.
Hence, the GA delivers the best trade-off between solution quality, run time, and implementation effort for the mixed-integer, multi-objective constellation problem considered here.
4.2. GA Variables
The optimization process considers eight variables, divided equally for the two inclination groups. The variables are as follows:
- Inclination (deg): The orbital inclination of each satellite group, which is critical for meeting the revisit time and data transmission requirements and directly affects economic efficiency;
- Number of planes: The number of orbital planes for a given inclination, influencing the spatial distribution of satellites;
- Satellites per plane: The number of satellites within each plane; fewer satellites, while still meeting performance targets, imply higher economic efficiency;
- Phase difference (deg): The phase offset between satellites in the same plane, which affects the consistency of revisit times.
4.3. Range of Genetic Parameters
The ranges for the genetic variables were set based on practical operational limits:
- Inclination: 35° to 70°;
- Number of planes: 1 to 20;
- Satellites per plane: 1 to 20
- Phase difference: 0° to 19°.
These ranges ensure that our modified Delta–Walker constellation can flexibly accommodate various orbital configurations while maintaining efficient and economic optimization.
4.4. GA Simulation Environment and Parameter Settings
The GA simulation environment was configured as follows:
- Communication technologies: LoRa, NB-IoT, and Mioty;
- Orbit types: VLEO at 200 km and 300 km and LEO at 600 km;
- Ground station locations: Seoul, [37.71, 126.73]; Berlin, [52.5, 13.42]; Oslo, [59.94, 10.75]; and Houston, [29.76, −95.37];
- Generations = 20; population size = 80
These ground stations were selected because the latitude range of 30° to 60° north represents densely populated and urbanized regions, providing a realistic scenario for the optimization of IoT-NTN satellite coverage. The population size of 80 and the number of generations set to 20 were determined based on a balance between achieving sufficient optimization convergence and managing computational complexity. Preliminary analysis considered the relationship between these parameters and the total simulation time required to explore the search space effectively within reasonable limits.
4.5. Fitness Function and Weighting
The fitness function quantitatively evaluates satellite deployment performance based on four key indicators:
- Total number of satellites (STotal): Lower values are preferred to reduce system cost;
- Average revisit time (Ravg): The target is to have data collected at least once every 60 min;
- Maximum revisit time (Rmax): Should not exceed 90 min to avoid excessive delays;
- Average data transmission volume (Davg): Higher values indicate better data throughput—critical for our AIoT scenario.
The fitness function is defined as follows:
with the following thresholds:
- Rth = 60 min;
- Rmax,th = 90 min;
- Dth = 2 MB.
4.6. Weighting Factors and Penalty Coefficients
In the test environment targeting the VLEO (300,km) + LoRa combination, GA-based optimization requires the design of an appropriate fitness function, which depends on the setting of weights for various performance objectives. In this study, we conducted preliminary research to derive the optimal weighting combination to be used in the GA’s fitness function.
We defined six preliminary weighting sets (sets 1–6) with different weights for various objective metrics, which are detailed in Table 5. Each set was designed to emphasize specific goals. For instance, set 1 assigned the highest total number of satellites (w1 = 6), focusing on minimizing the satellite count, while set 2 assigned equal weights to all metrics (w1, w2, w3, and w4 = 1) in an attempt to achieve balanced optimization. Set 3 assigned higher weights for the average revisit time and daily data transmission volume (w2 = 3, w4 = 4), set 4 assigned the highest daily transmission volume (w4 = 8), set 5 assigned higher average and max revisit times (w2 = 4, w3 = 2), and set 6 is characterized by assigning relatively higher weights to the total number of satellites (w1 = 4) and daily data transmission volume (w4 = 5).
Table 5.
Comparison of weighting-factor values across preliminary sets (sets 1–6).
For each weighting set, we performed GA optimization (population = 80, generation = 20) to derive optimized constellations. The performance of each constellation was evaluated using four metrics: the total number of satellites (STotal), average revisit time (Ravg), maximum revisit time (Rmax), and daily data transmission volume (Davg). The comprehensive simulation results are presented in Figure 8.
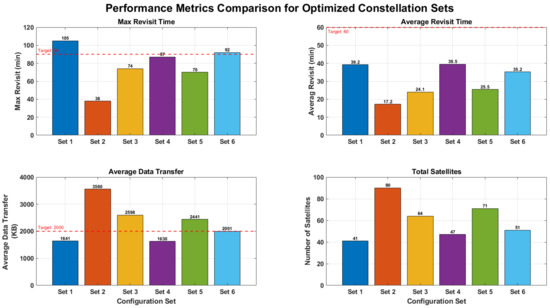
Figure 8.
Comparison of performance metrics for optimized constellation sets.
The performance evaluation showed that some sets did not satisfy the predefined performance thresholds. For example, in the case of set 1, the maximum revisit time (Rmax) exceeded the target threshold of 90 min by approximately 17%, failing to meet the service continuity requirement. While the average revisit time (Ravg) showed satisfactory results for all sets, for daily data transmission volume (Davg), set 1 and set 4 did not meet the target value of 2000 KB. Furthermore, they even fell short of the data transmission target of 1.73 MB defined for the scenario in Section 4, indicating that these sets were not suitable.
Based on a comprehensive assessment, we concluded that selecting the set with the smallest total number of satellites (STotal) among those satisfying all performance thresholds would represent the most efficient optimization strategy. According to this criterion, set 6 was selected as the final weighting set. Although set 6 showed a result for maximum revisit time (Rmax) exceeding the target threshold by approximately 2 min (refer to Figure 8), this deviation was considered to be within an acceptable range.
Meanwhile, penalties were applied during the optimization process for exceeding or falling below thresholds to encourage objective achievement. The penalty coefficients used for this purpose were fixed and applied identically across the optimization process for all preliminary weighting sets as follows:
Selected weighting factors for set 6 and their meanings are outlined as follows:
- w1 = 4: Total number of satellites—emphasizes cost and resource efficiency;
- w2 = 1: Average revisit time—ensures service quality;
- w3 = 0.5: Maximum revisit time—prevents excessive delays;
- w4 = 5: Data transmission volume—ensures sufficient throughput.
The penalty coefficients are listed as follows:
- : Penalty for exceeding the average revisit time threshold;
- : Penalty for exceeding the maximum revisit time threshold;
- : Penalty for falling below the data transmission threshold.
5. Results
This section presents the optimal satellite constellation configurations derived from the simulation-based GA optimization, along with the algorithm’s convergence behavior. The analysis is structured by communication technology (LoRa, NB-IoT, and Mioty) and orbital altitude (VLEO at 200 km, VLEO at 300 km, and LEO at 600 km).
Key evaluation metrics include the satellite configuration (total number of satellites, number of planes, and satellites per plane), communication performance (revisit time and data transmission volume), and economic efficiency (cost based on satellite count). These metrics collectively support a comprehensive assessment of system trade-offs.
5.1. Final Satellite Configuration and GA Performance
The optimized satellite constellations are summarized in Table 6, which includes the inclination, number of planes, satellites per plane, phase difference, total number of satellites, and the final GA fitness score for each technology and orbital scenario. Note that the GA fitness score is minimized; lower values indicate better performance.
Table 6.
Final genetic algorithm results for optimized satellite deployment.
Some configuration parameters—specifically, the inclination, number of planes, and satellites per plane—are presented in a dual-value format (e.g., 59.70/63.89), where each value corresponds to one of two independently optimized inclination groups. This dual-plane configuration enables independent optimization for each group, thereby balancing coverage, revisit time, and data throughput across the targeted orbital region.
5.2. Genetic Algorithm Convergence Analysis
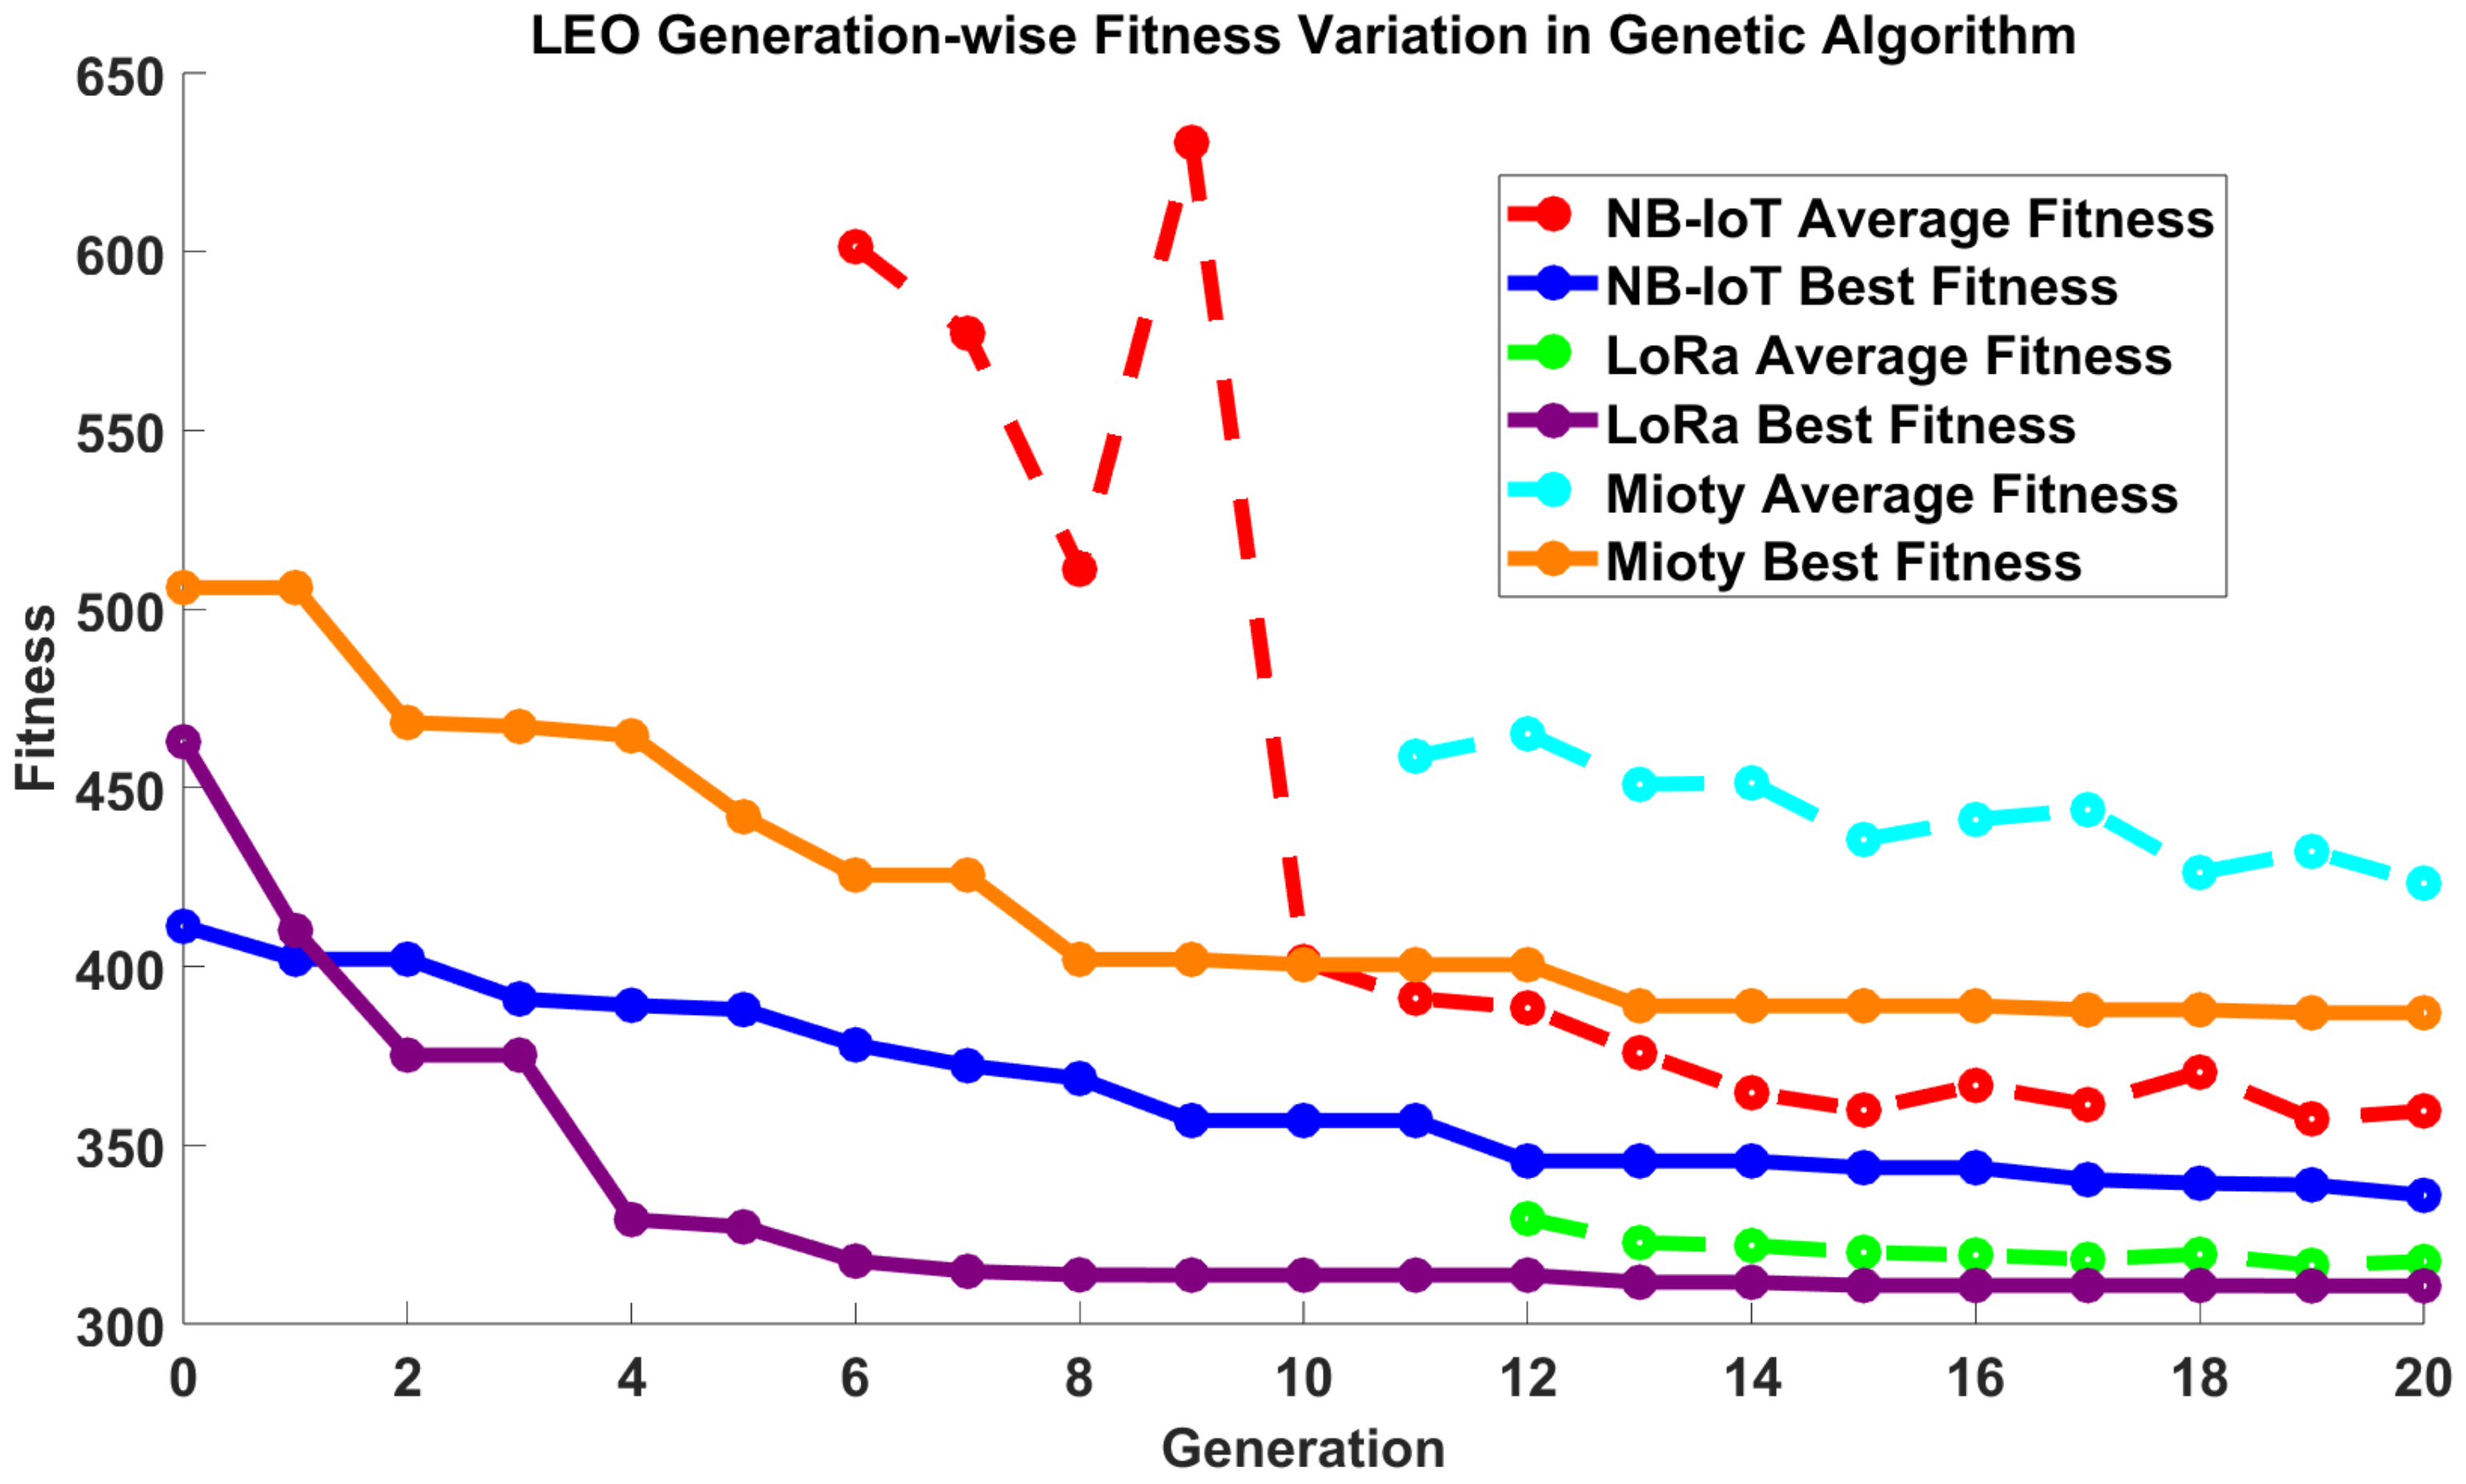
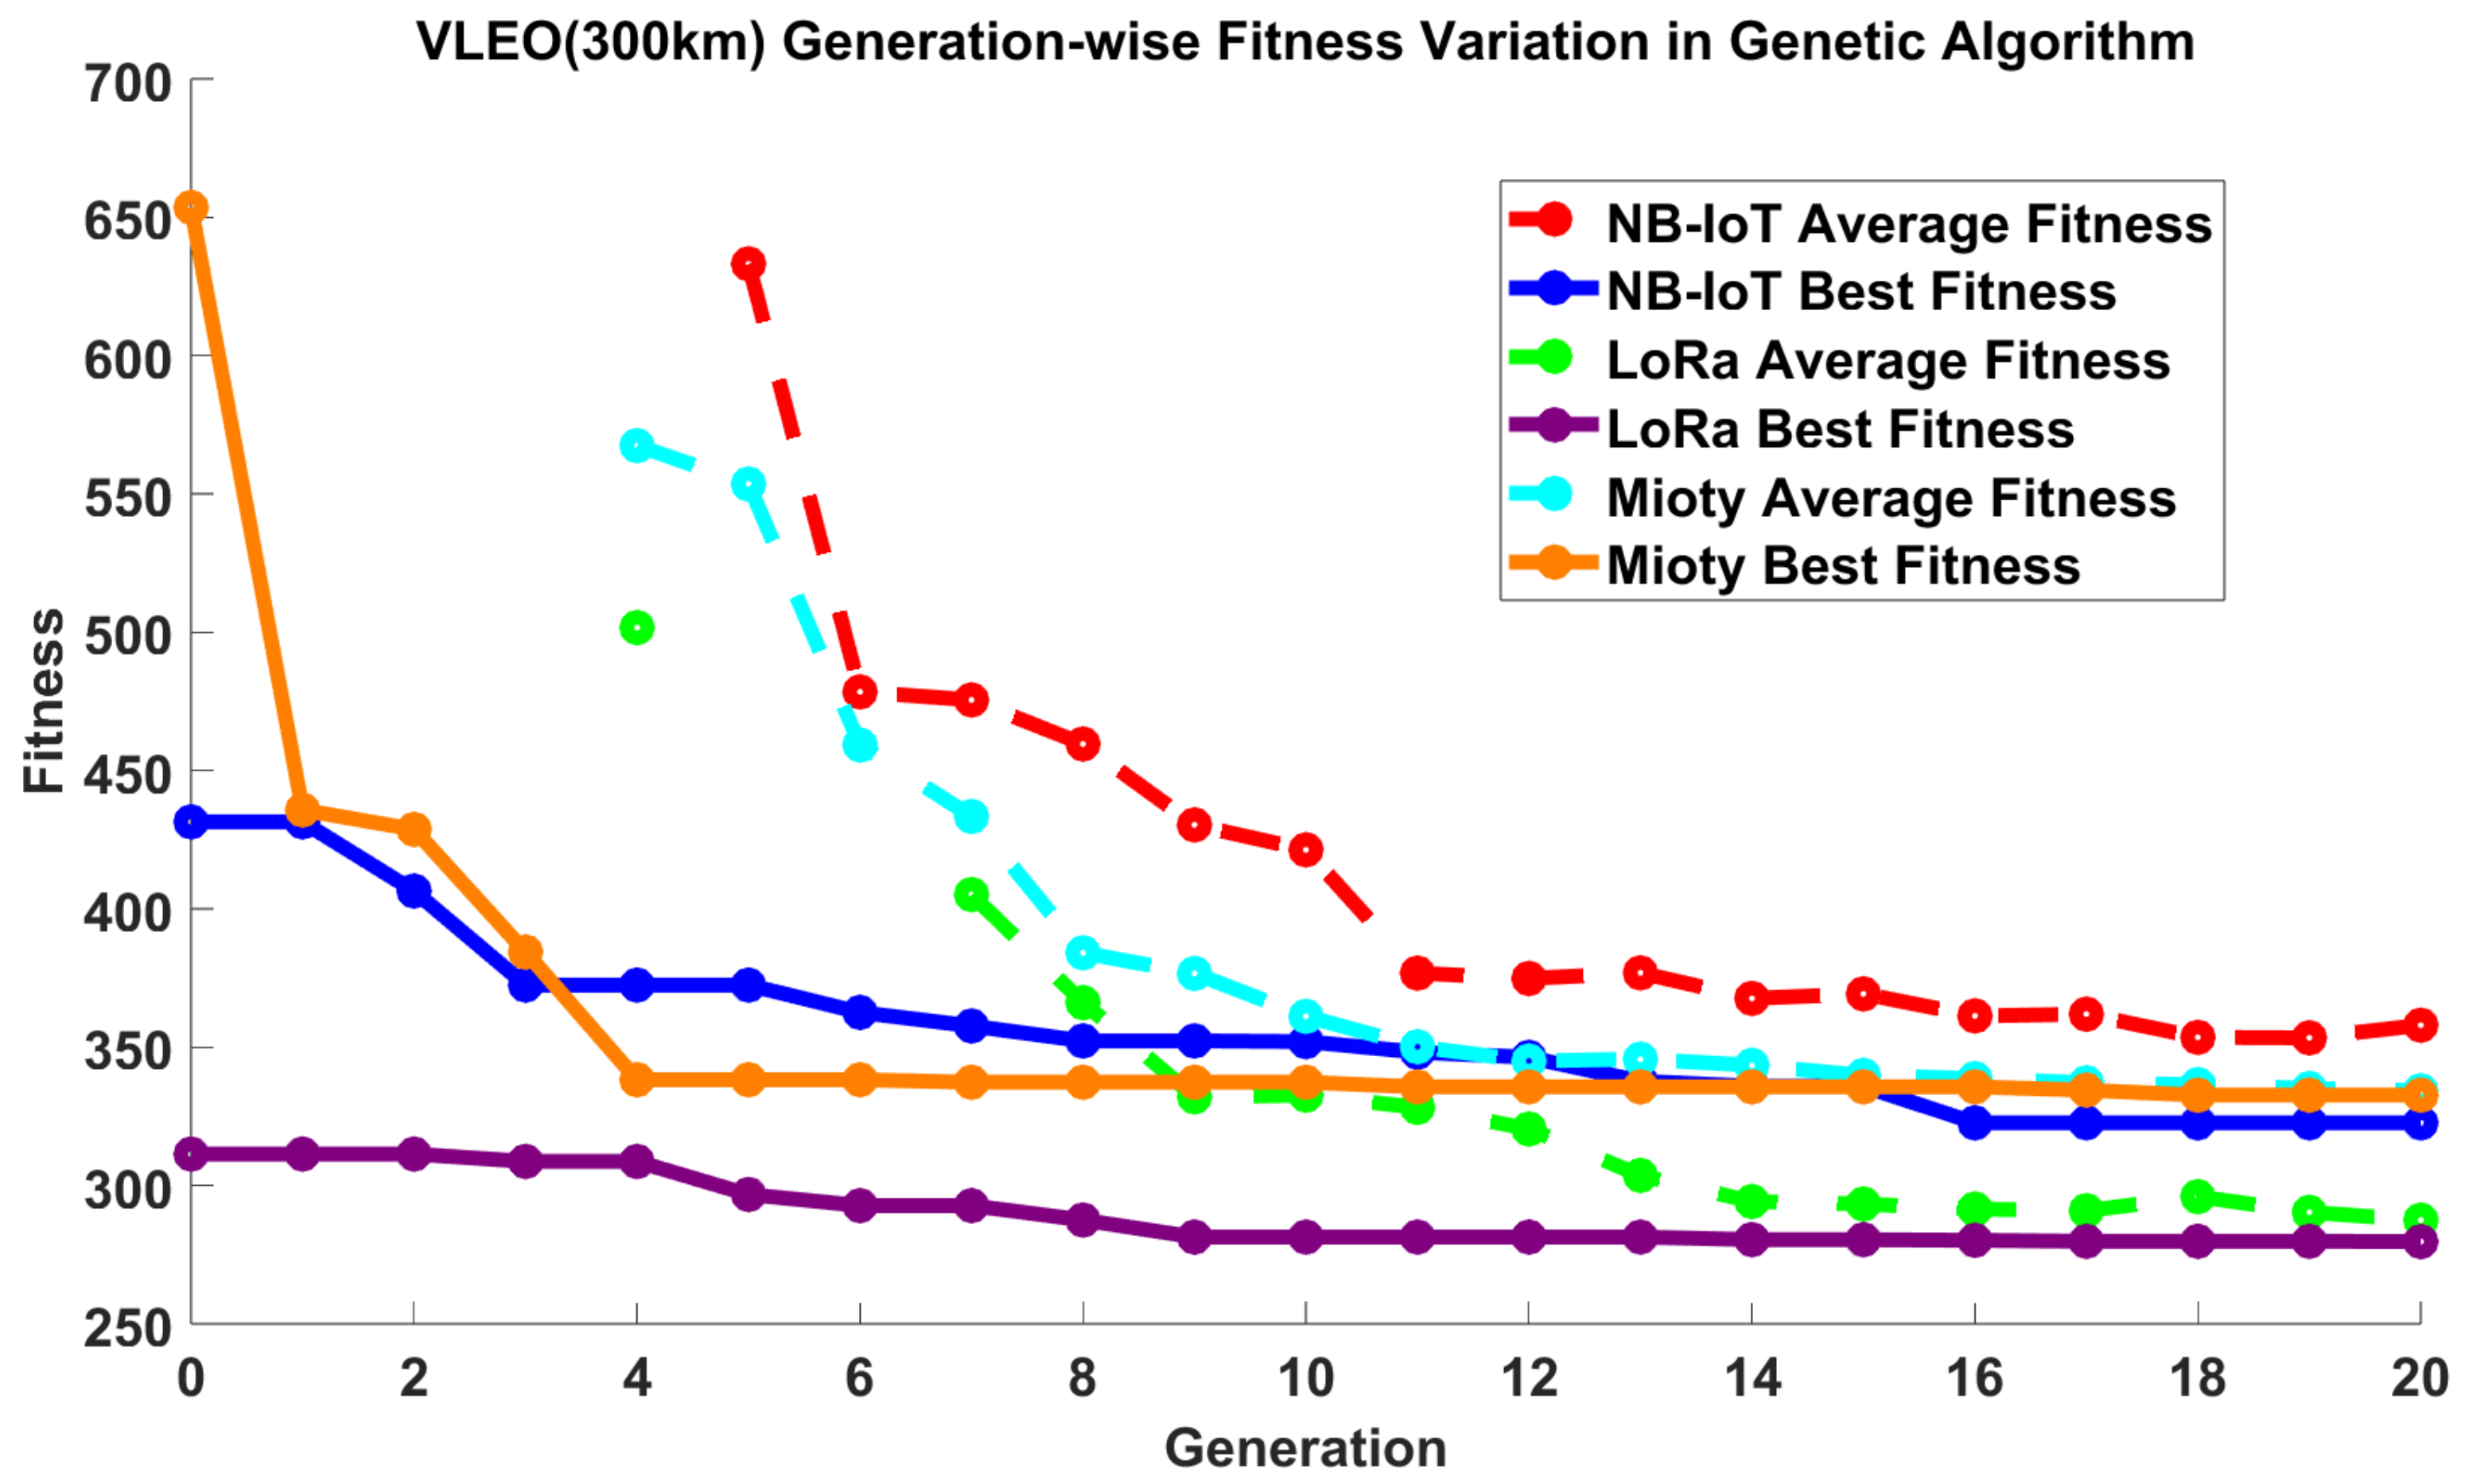
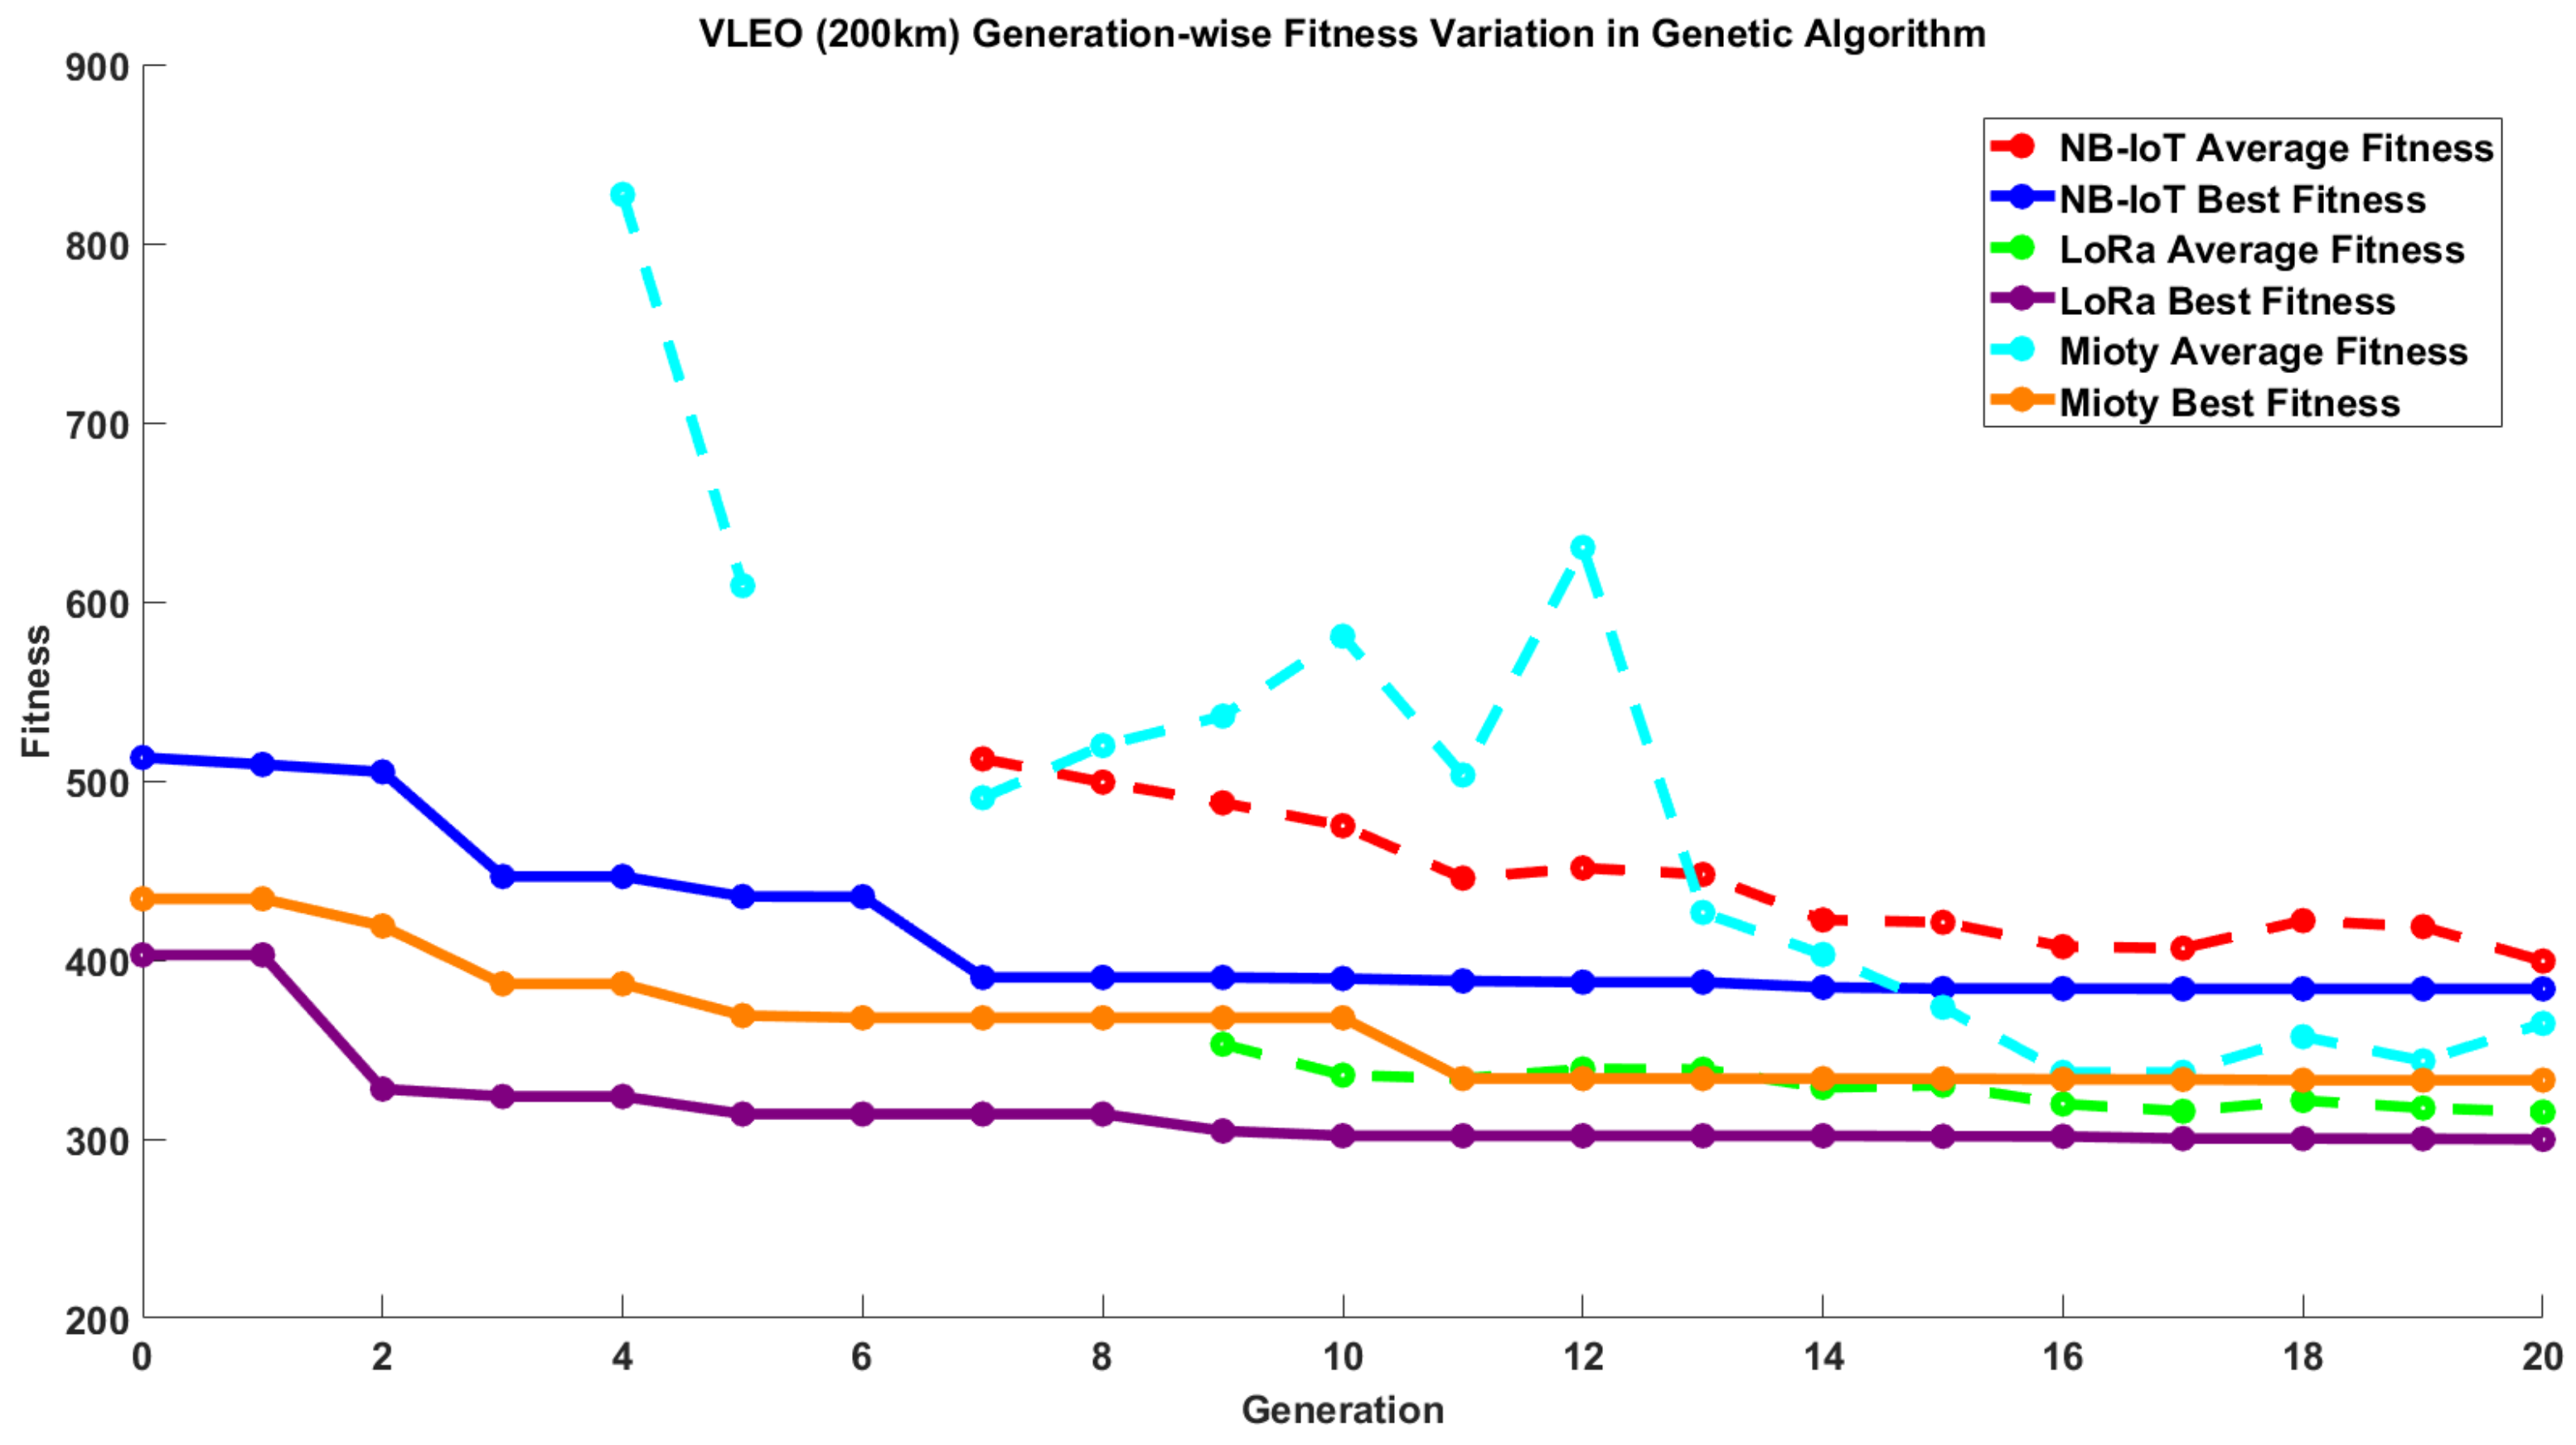
The convergence performance of the GA was evaluated by visualizing the evolution of key performance metrics—namely, the average revisit time, maximum revisit time, data transmission volume, and total number of satellites—across generations for different communication technologies. Figure 9, Figure 10 and Figure 11 provide the generation-wise average fitness values (GA values) and the optimized fitness values (GA values) for satellite constellations obtained by combining different orbits (LEO and VLEO) and LPWAN technologies (NB-IoT, LoRa, and Mioty).
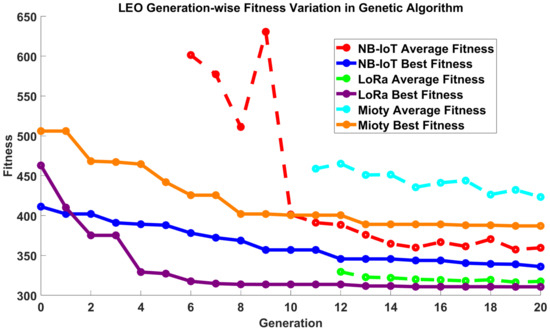
Figure 9.
GA convergence in the LEO environment for different communication technologies.
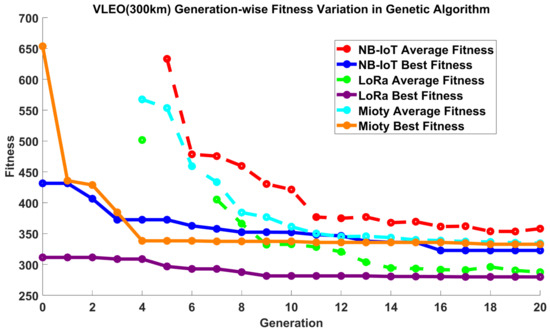
Figure 10.
GA convergence in the VLEO (300 km) environment for different communication technologies.
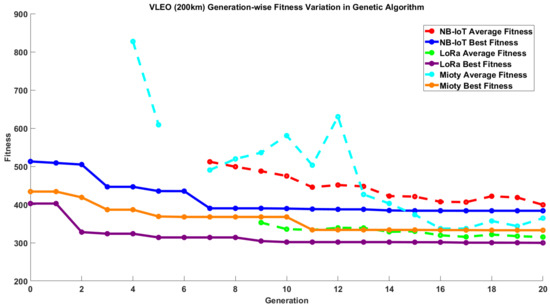
Figure 11.
GA convergence in the VLEO (200 km) environment for different communication technologies.
These convergence graphs clearly illustrate the GA optimization process, demonstrating that the fitness values gradually stabilize as generations progress. This trend not only confirms the stability of the GA but also validates the effectiveness of the optimization procedure, thereby verifying that the algorithm has successfully derived an optimal satellite deployment configuration.
Figure 9 illustrates the generation-wise variation in fitness during the satellite constellation optimization process for each communication technology. Best fitness converges almost entirely after generation 10, indicating that the genetic algorithm begins stabilizing around this point. Average fitness, while more volatile than best fitness, shows a gradual convergence trend after generation 14. The absence of average fitness values for generations 1–6 is due to excessively large values that exceed the visualization range.
In the LoRa-based communication environment, best fitness converges after generation 8, whereas average fitness rapidly aligns with best fitness around generation 12, then stabilizes. For the Mioty-based environment, best fitness converges quickly in the initial generations and stabilizes after generation 13. Average fitness continues to decrease toward best fitness but without fully stabilizing.
Figure 10 shows the generation-wise fitness variation for NB-IoT communication in the VLEO (300 km) environment, optimized using a genetic algorithm. Best fitness converges after generation 16, while average fitness gradually stabilizes after generation 12.
In the LoRa-based environment (also shown in Figure 10), best fitness converges by generation 9, and average fitness stabilizes from generation 14 onward. Meanwhile, for Mioty in the same figure, best fitness converges rapidly after generation 4, with average fitness aligning closely by generation 12.
Figure 11 shows the generation-wise fitness trend for NB-IoT communication in the VLEO (200 km) environment. Best fitness stabilizes around generation 7, while average fitness continues to converge, suggesting more generations may be needed for full convergence.
In the LoRa-based environment (also shown in Figure 11), best fitness converges by generation 9, although average fitness remains slightly short of complete convergence. For Mioty, best fitness stabilizes rapidly by generation 11, whereas average fitness appears to converge but exhibits a slight upward trend.
Across all three scenarios, best fitness values essentially converge, while average fitness, although not always fully converged, shows a clear downward trend. Consequently, we consider the constellation associated with the best fitness at generation 20 to represent the optimal configuration, indicating that each constellation was effectively optimized.
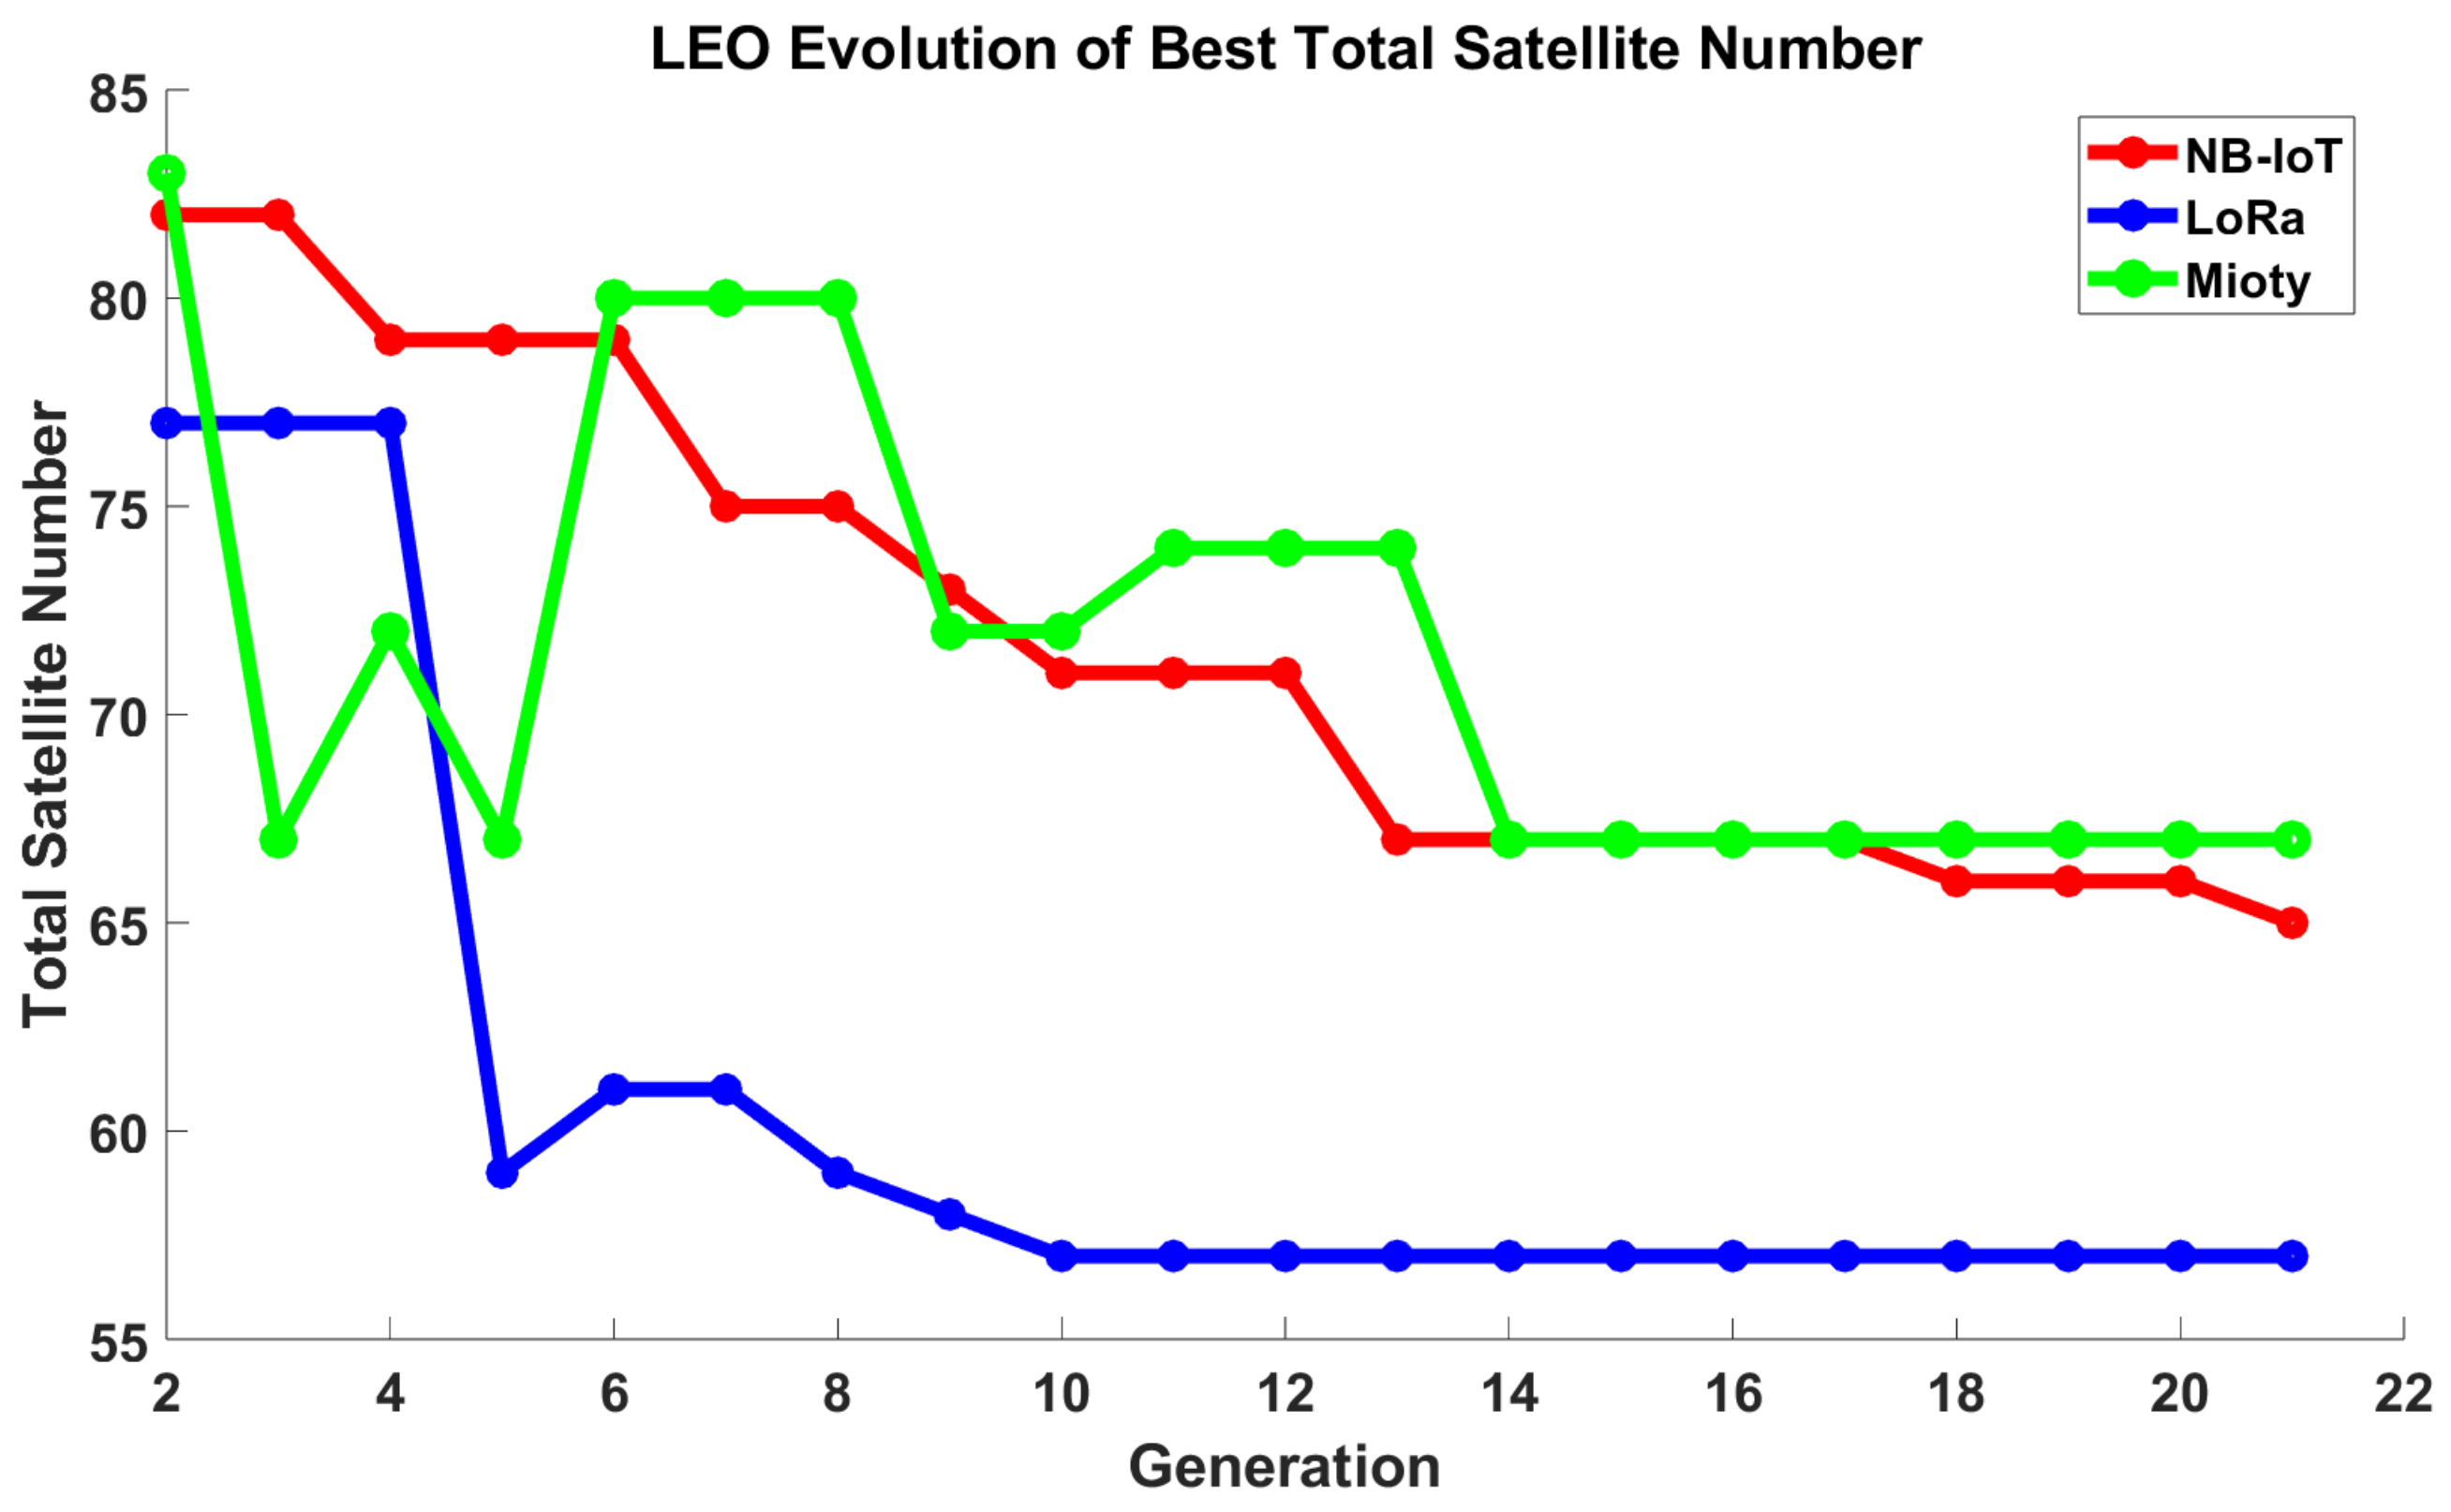
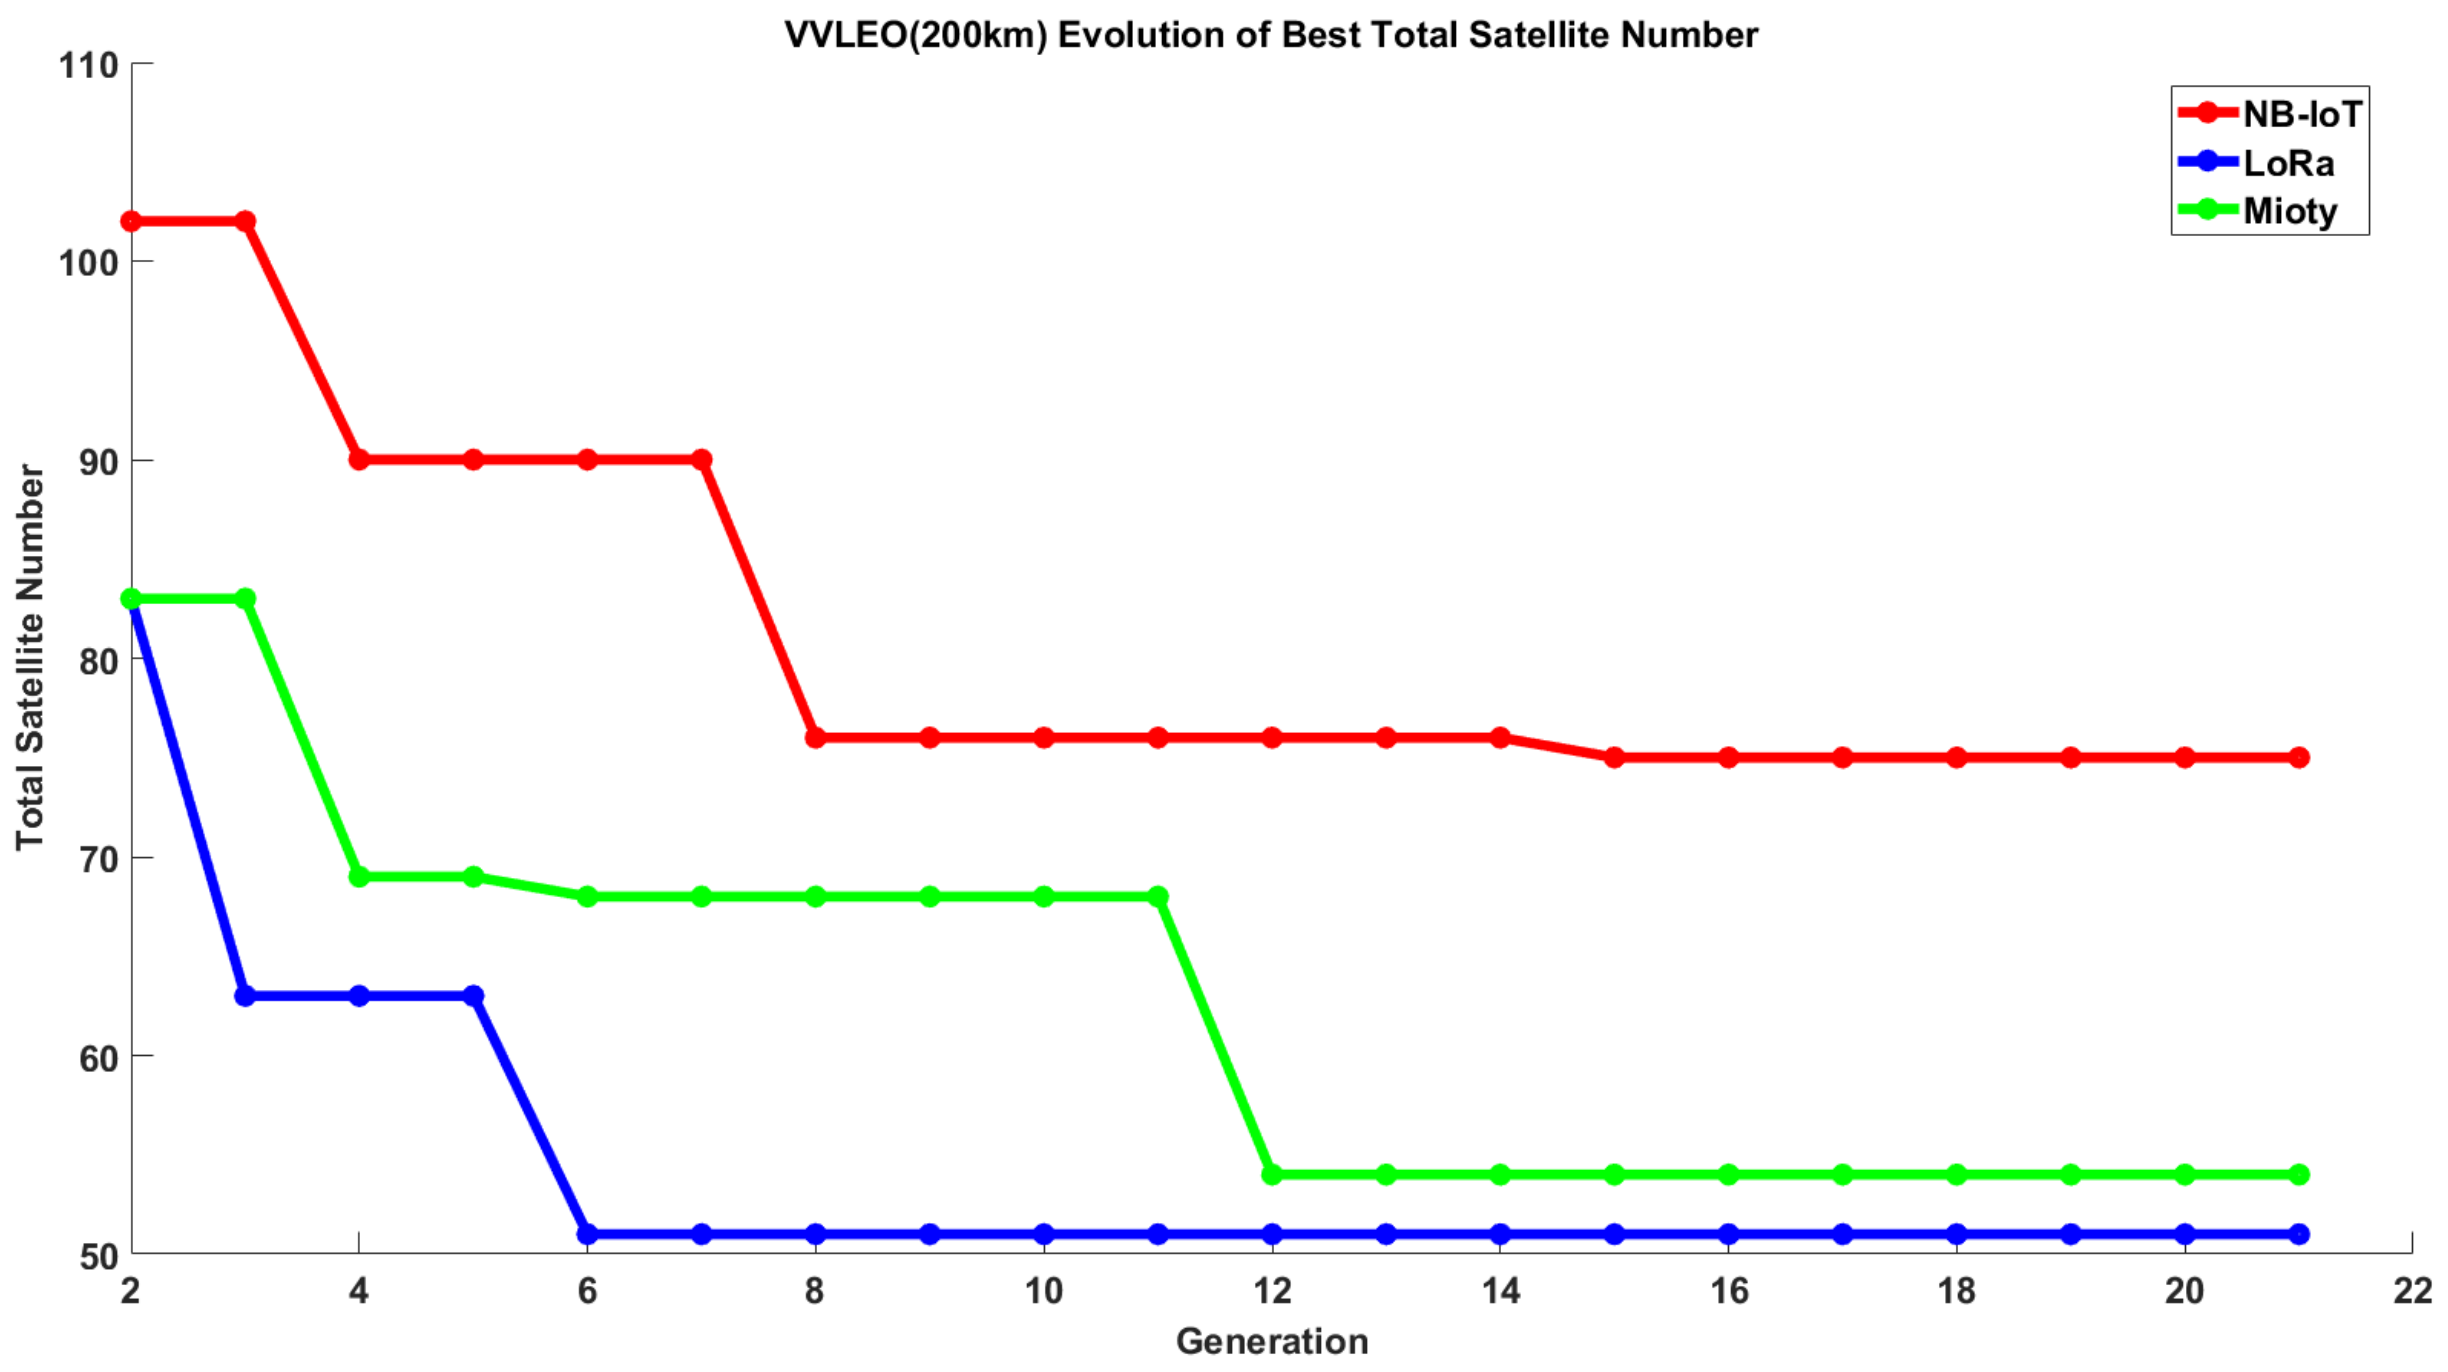
Additionally, to further validate the economic efficiency and structural consistency of the optimized satellite constellation, we introduced several graphs (Figure 12, Figure 13 and Figure 14) that illustrate the evolution of the satellite count corresponding to the best fitness values across generations. This graph demonstrates that, as the generations progress, the number of satellites selected in the optimal constellation steadily decreases and eventually stabilizes, reflecting a cost-effective configuration. This trend not only corroborates the convergence of the GA in terms of fitness but also highlights that the algorithm effectively identifies a satellite deployment strategy that minimizes the number of satellites—thereby reducing both deployment and operational costs—without compromising performance. Such a trade-off between performance and economic efficiency is central to our study’s objective, as it aligns with our goal of designing satellite constellations that are both technically robust and economically viable. The inclusion of this graph provides compelling visual evidence that our optimization approach successfully balances these critical aspects, reinforcing the overall direction and impact of our research.

Figure 12.
LEO evolution of best total number of satellites.
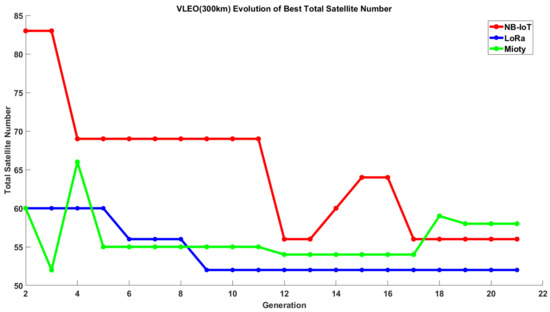
Figure 13.
VLEO (300 km) evolution of best total number of satellites.
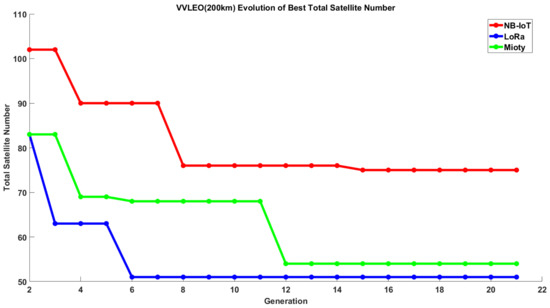
Figure 14.
VLEO (200 km) evolution of best total number of satellites.
Table 6 summarizes the final genetic algorithm optimization results for satellite constellation deployment by detailing the optimized configuration parameters for each communication technology and orbital combination. The table presents the optimized inclination in a dual-value format (e.g., 59.70/63.89°) to reflect the independent optimization of two inclination groups, the number of planes, and the number of satellites per plane to indicate the constellation structure, the phase difference representing the relative phase offset between satellites, the total number of satellites required, and the final GA fitness value (where lower values indicate a more optimal configuration). These results demonstrate that distinct optimal parameters are obtained for different technologies and orbital configurations, effectively balancing trade-offs among coverage, revisit time, and economic efficiency and thereby providing a robust basis for the final satellite deployment strategy.
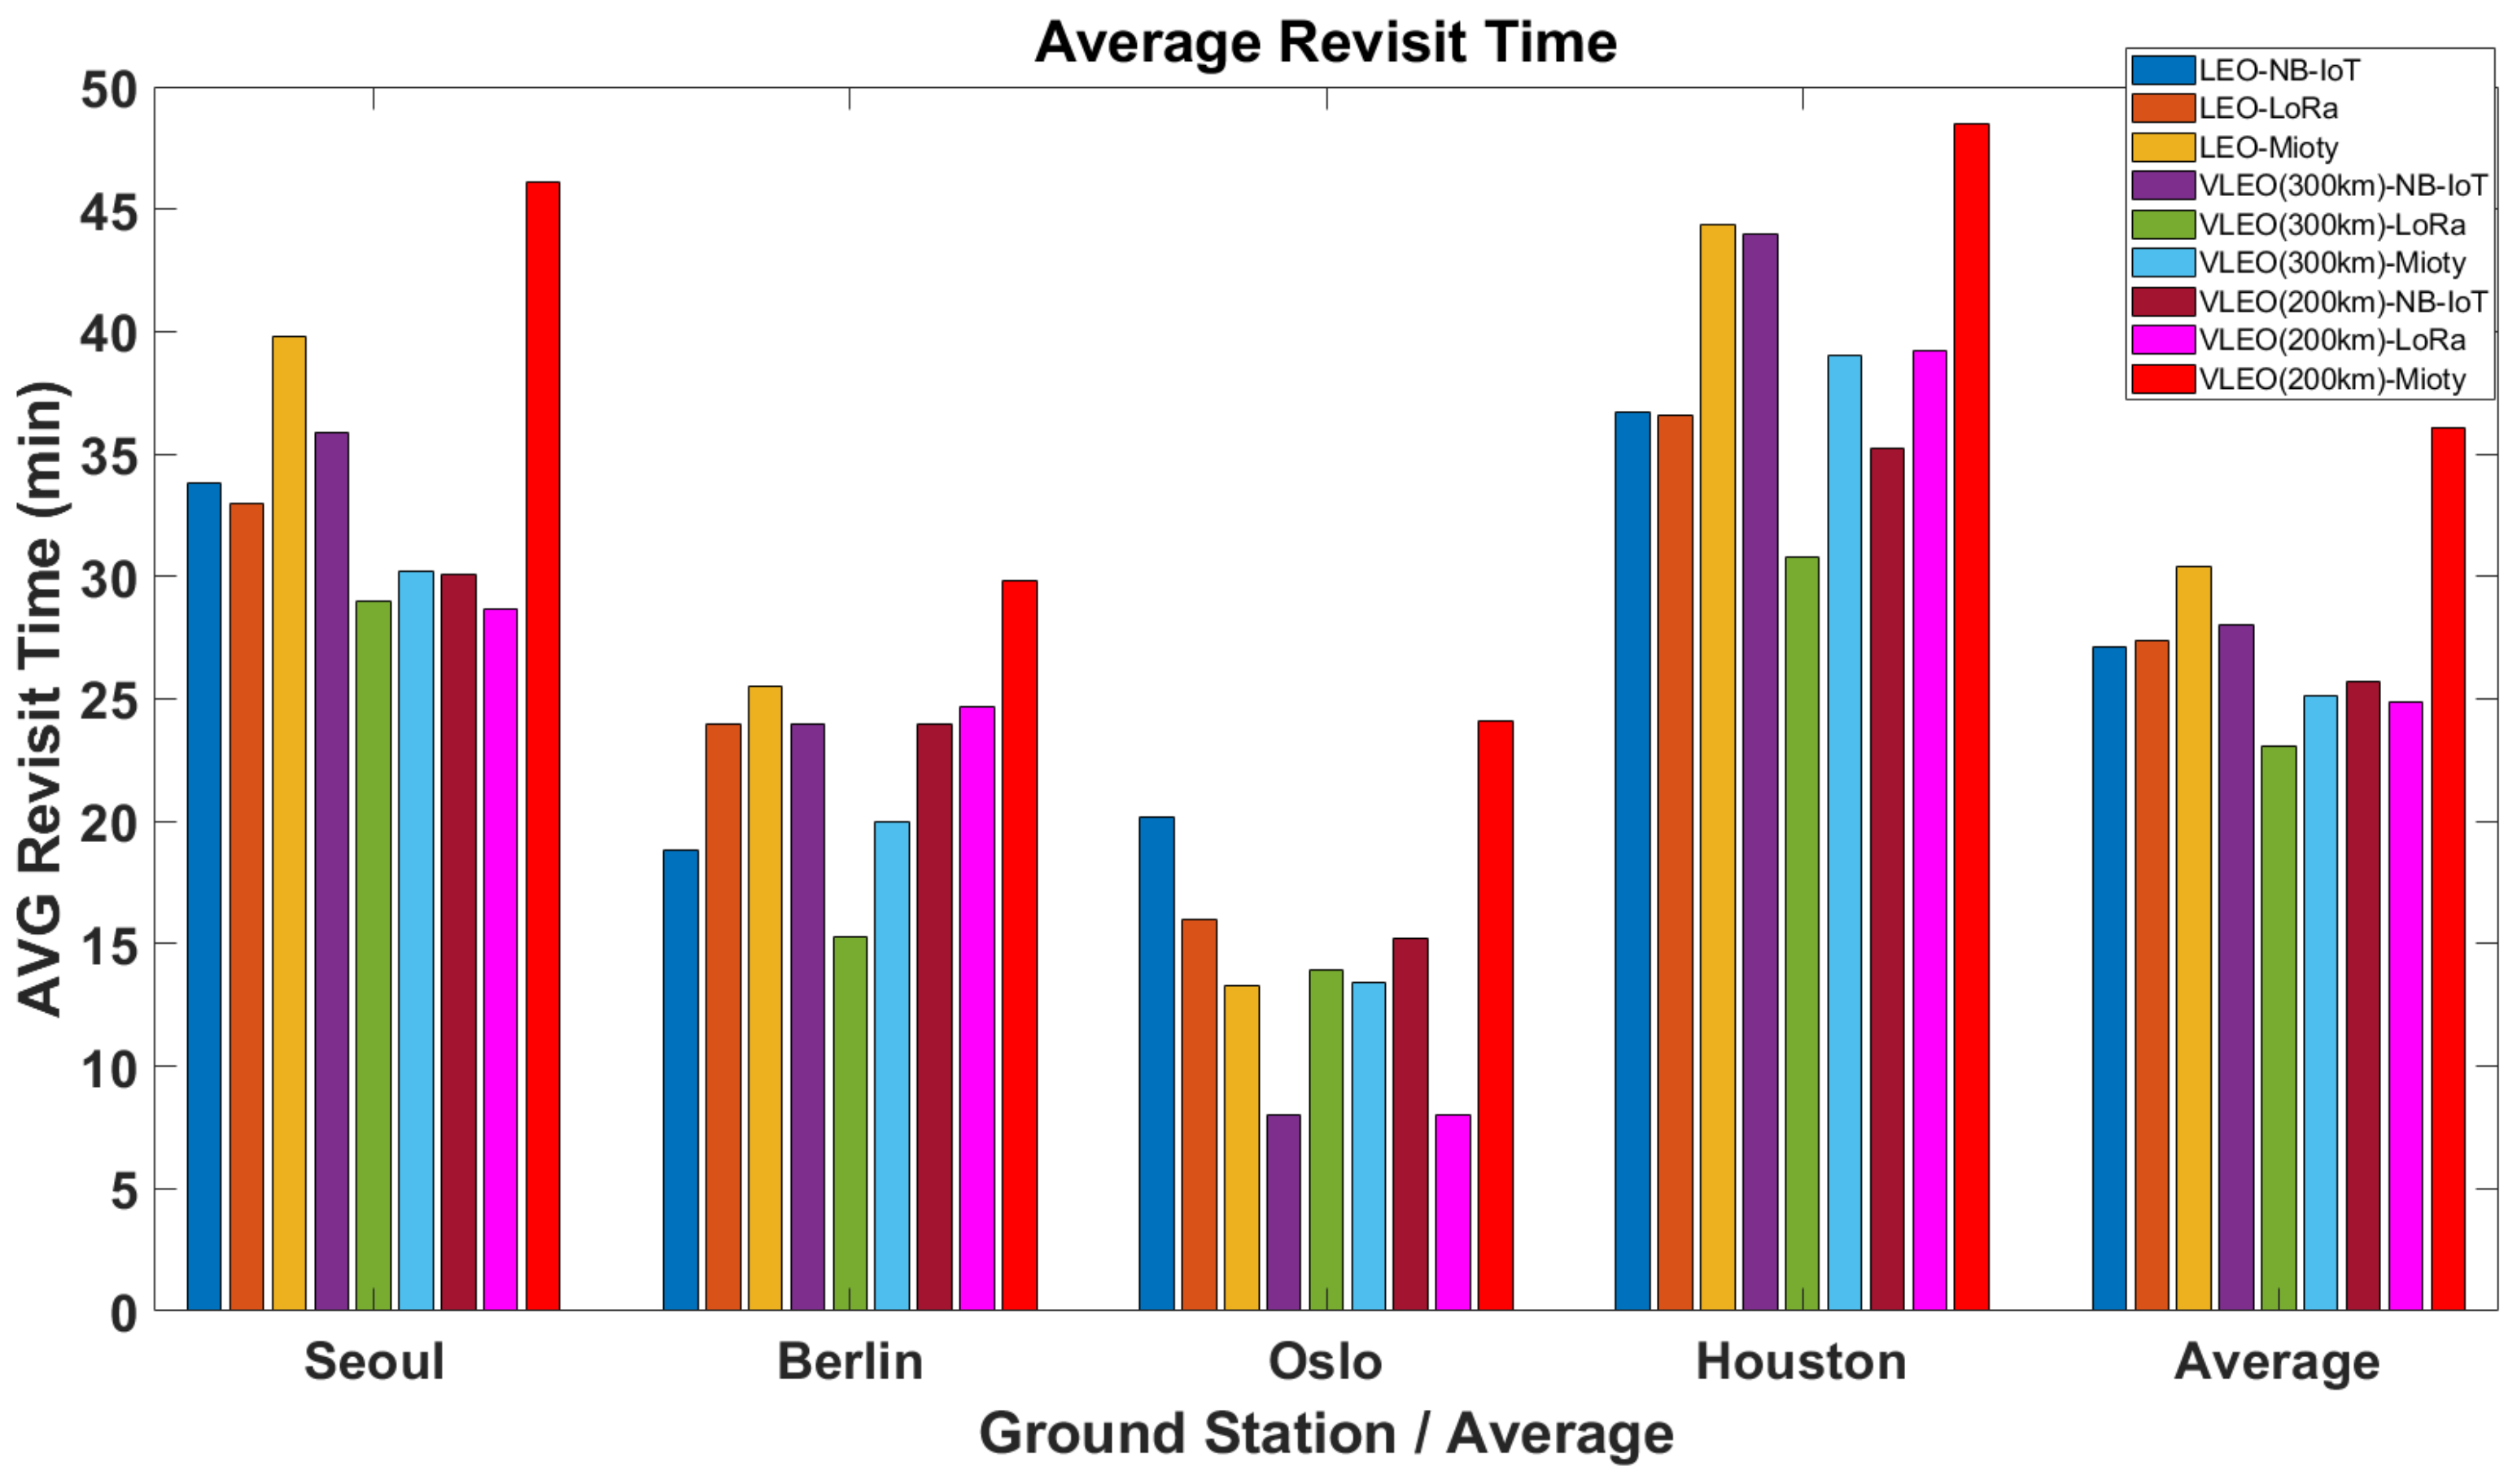
5.3. Revisit Time and Data Transmission Analysis
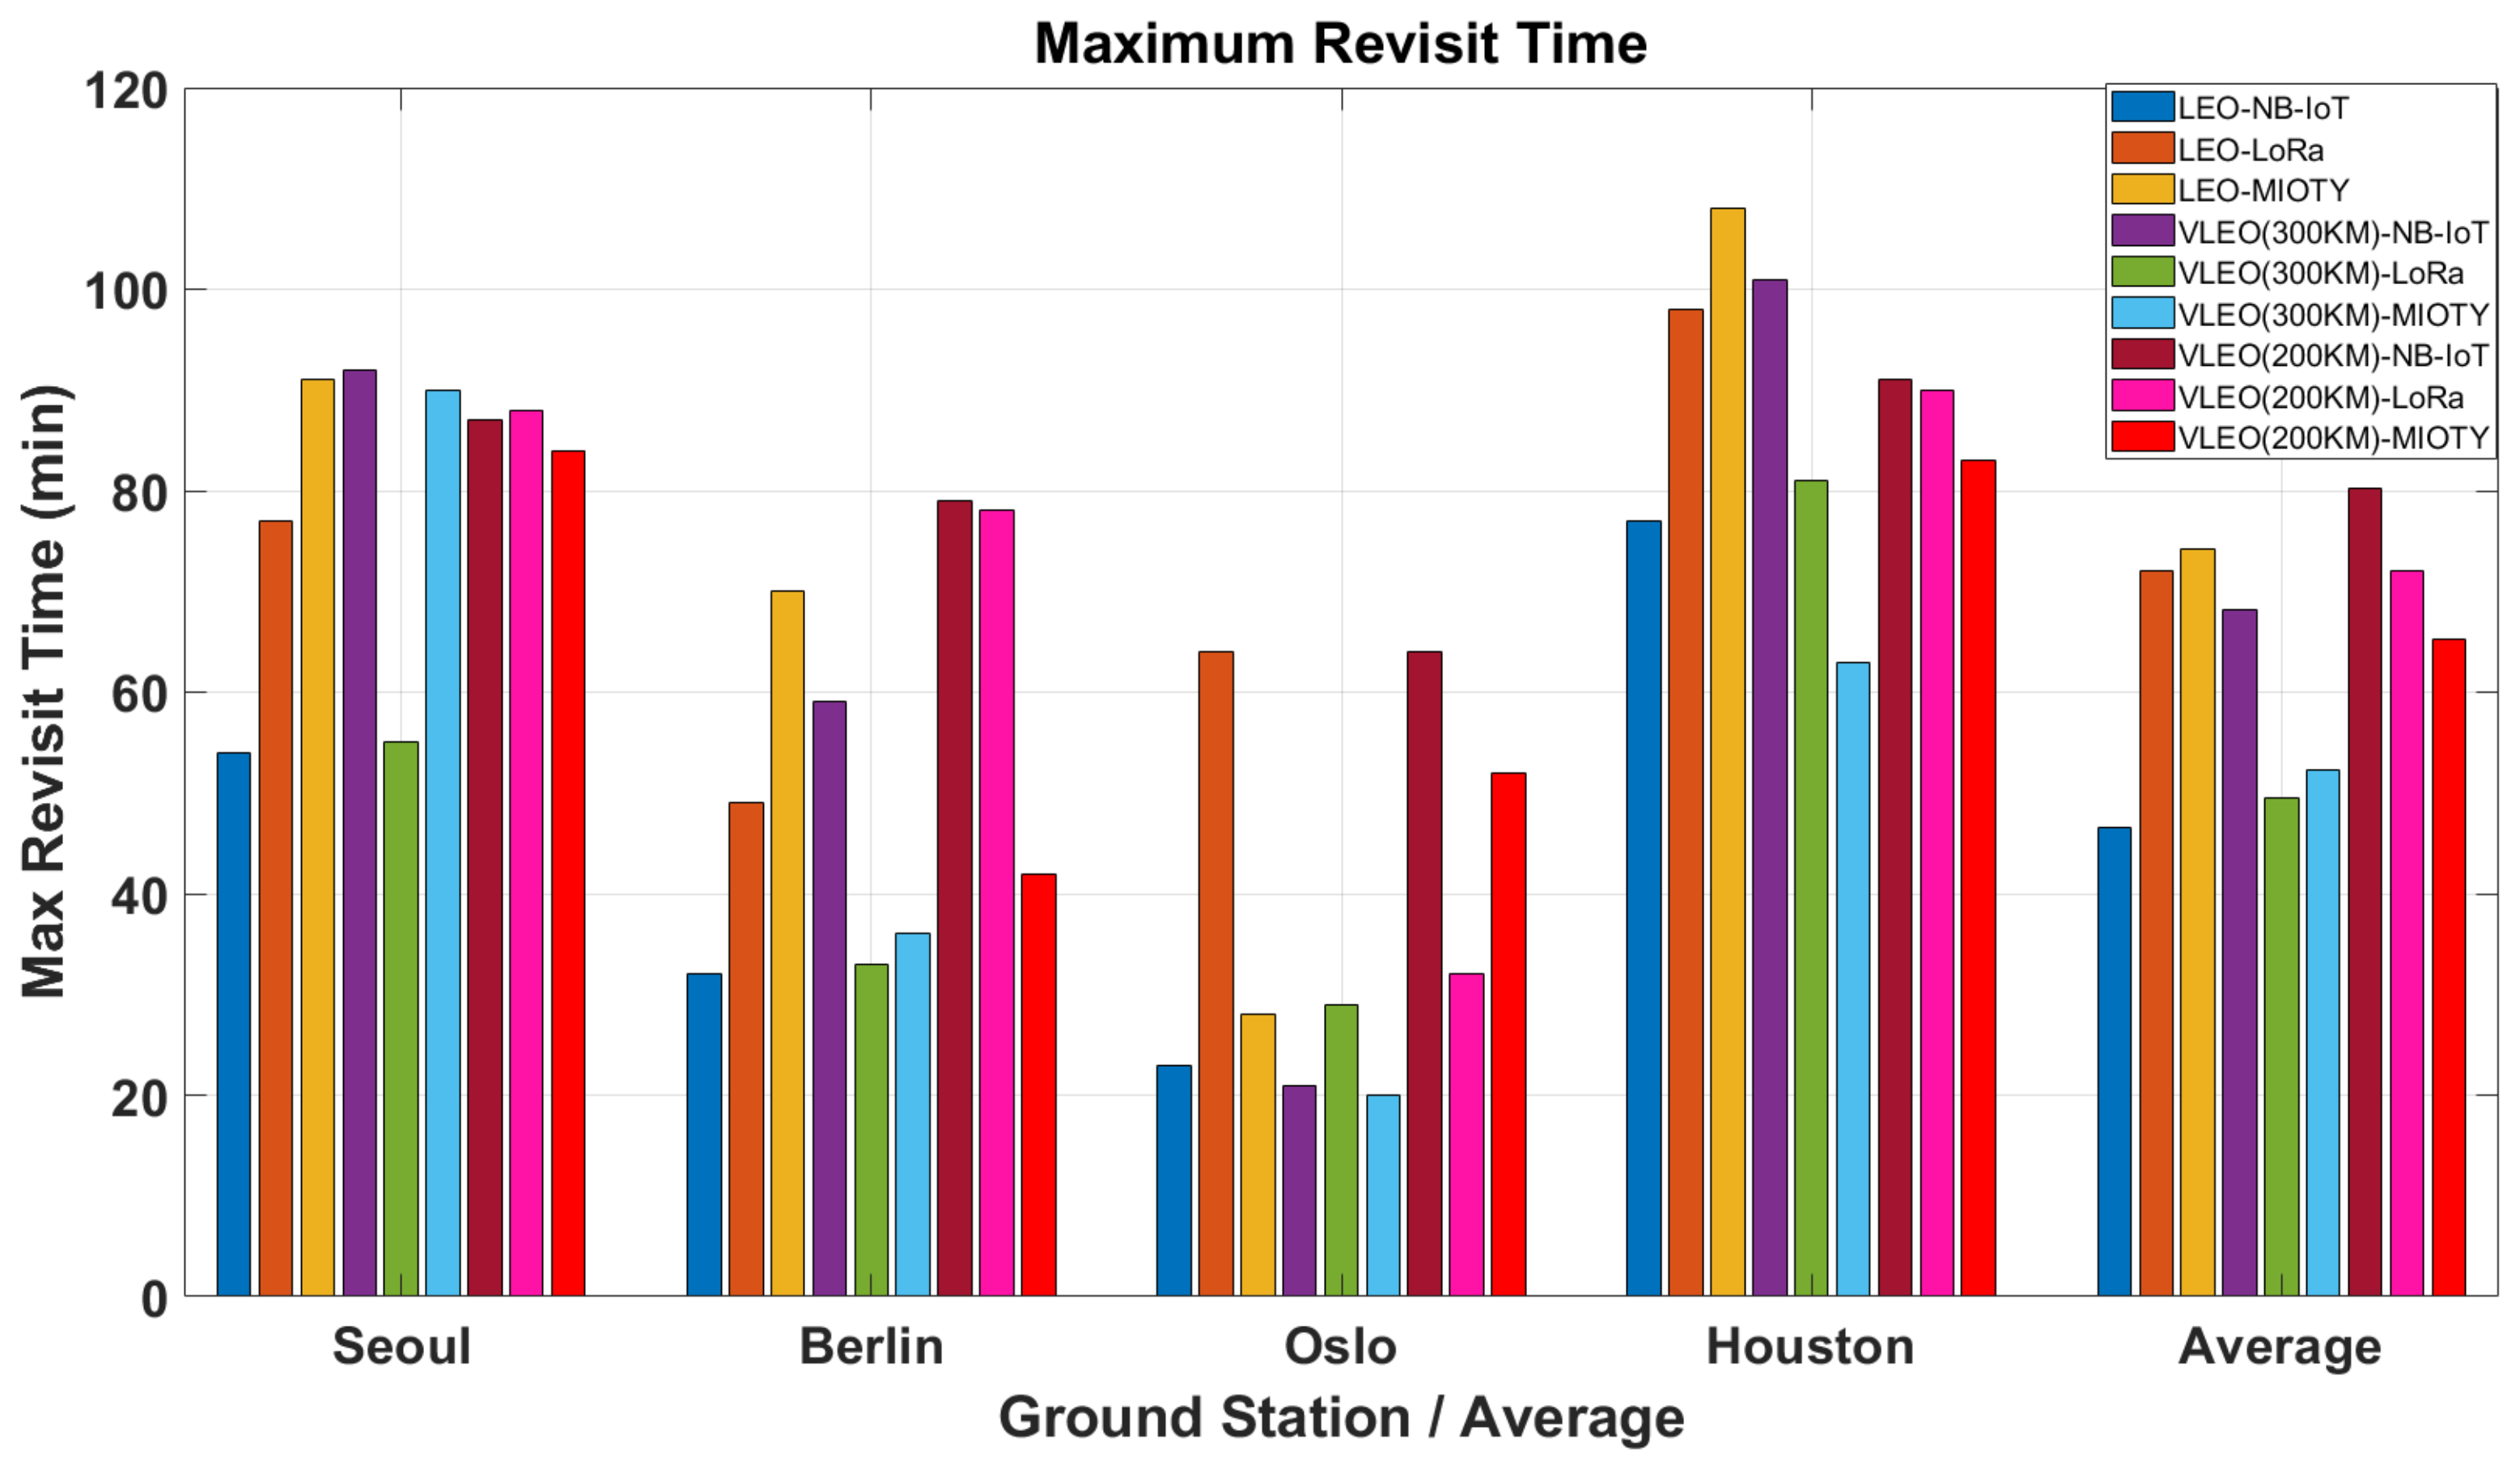
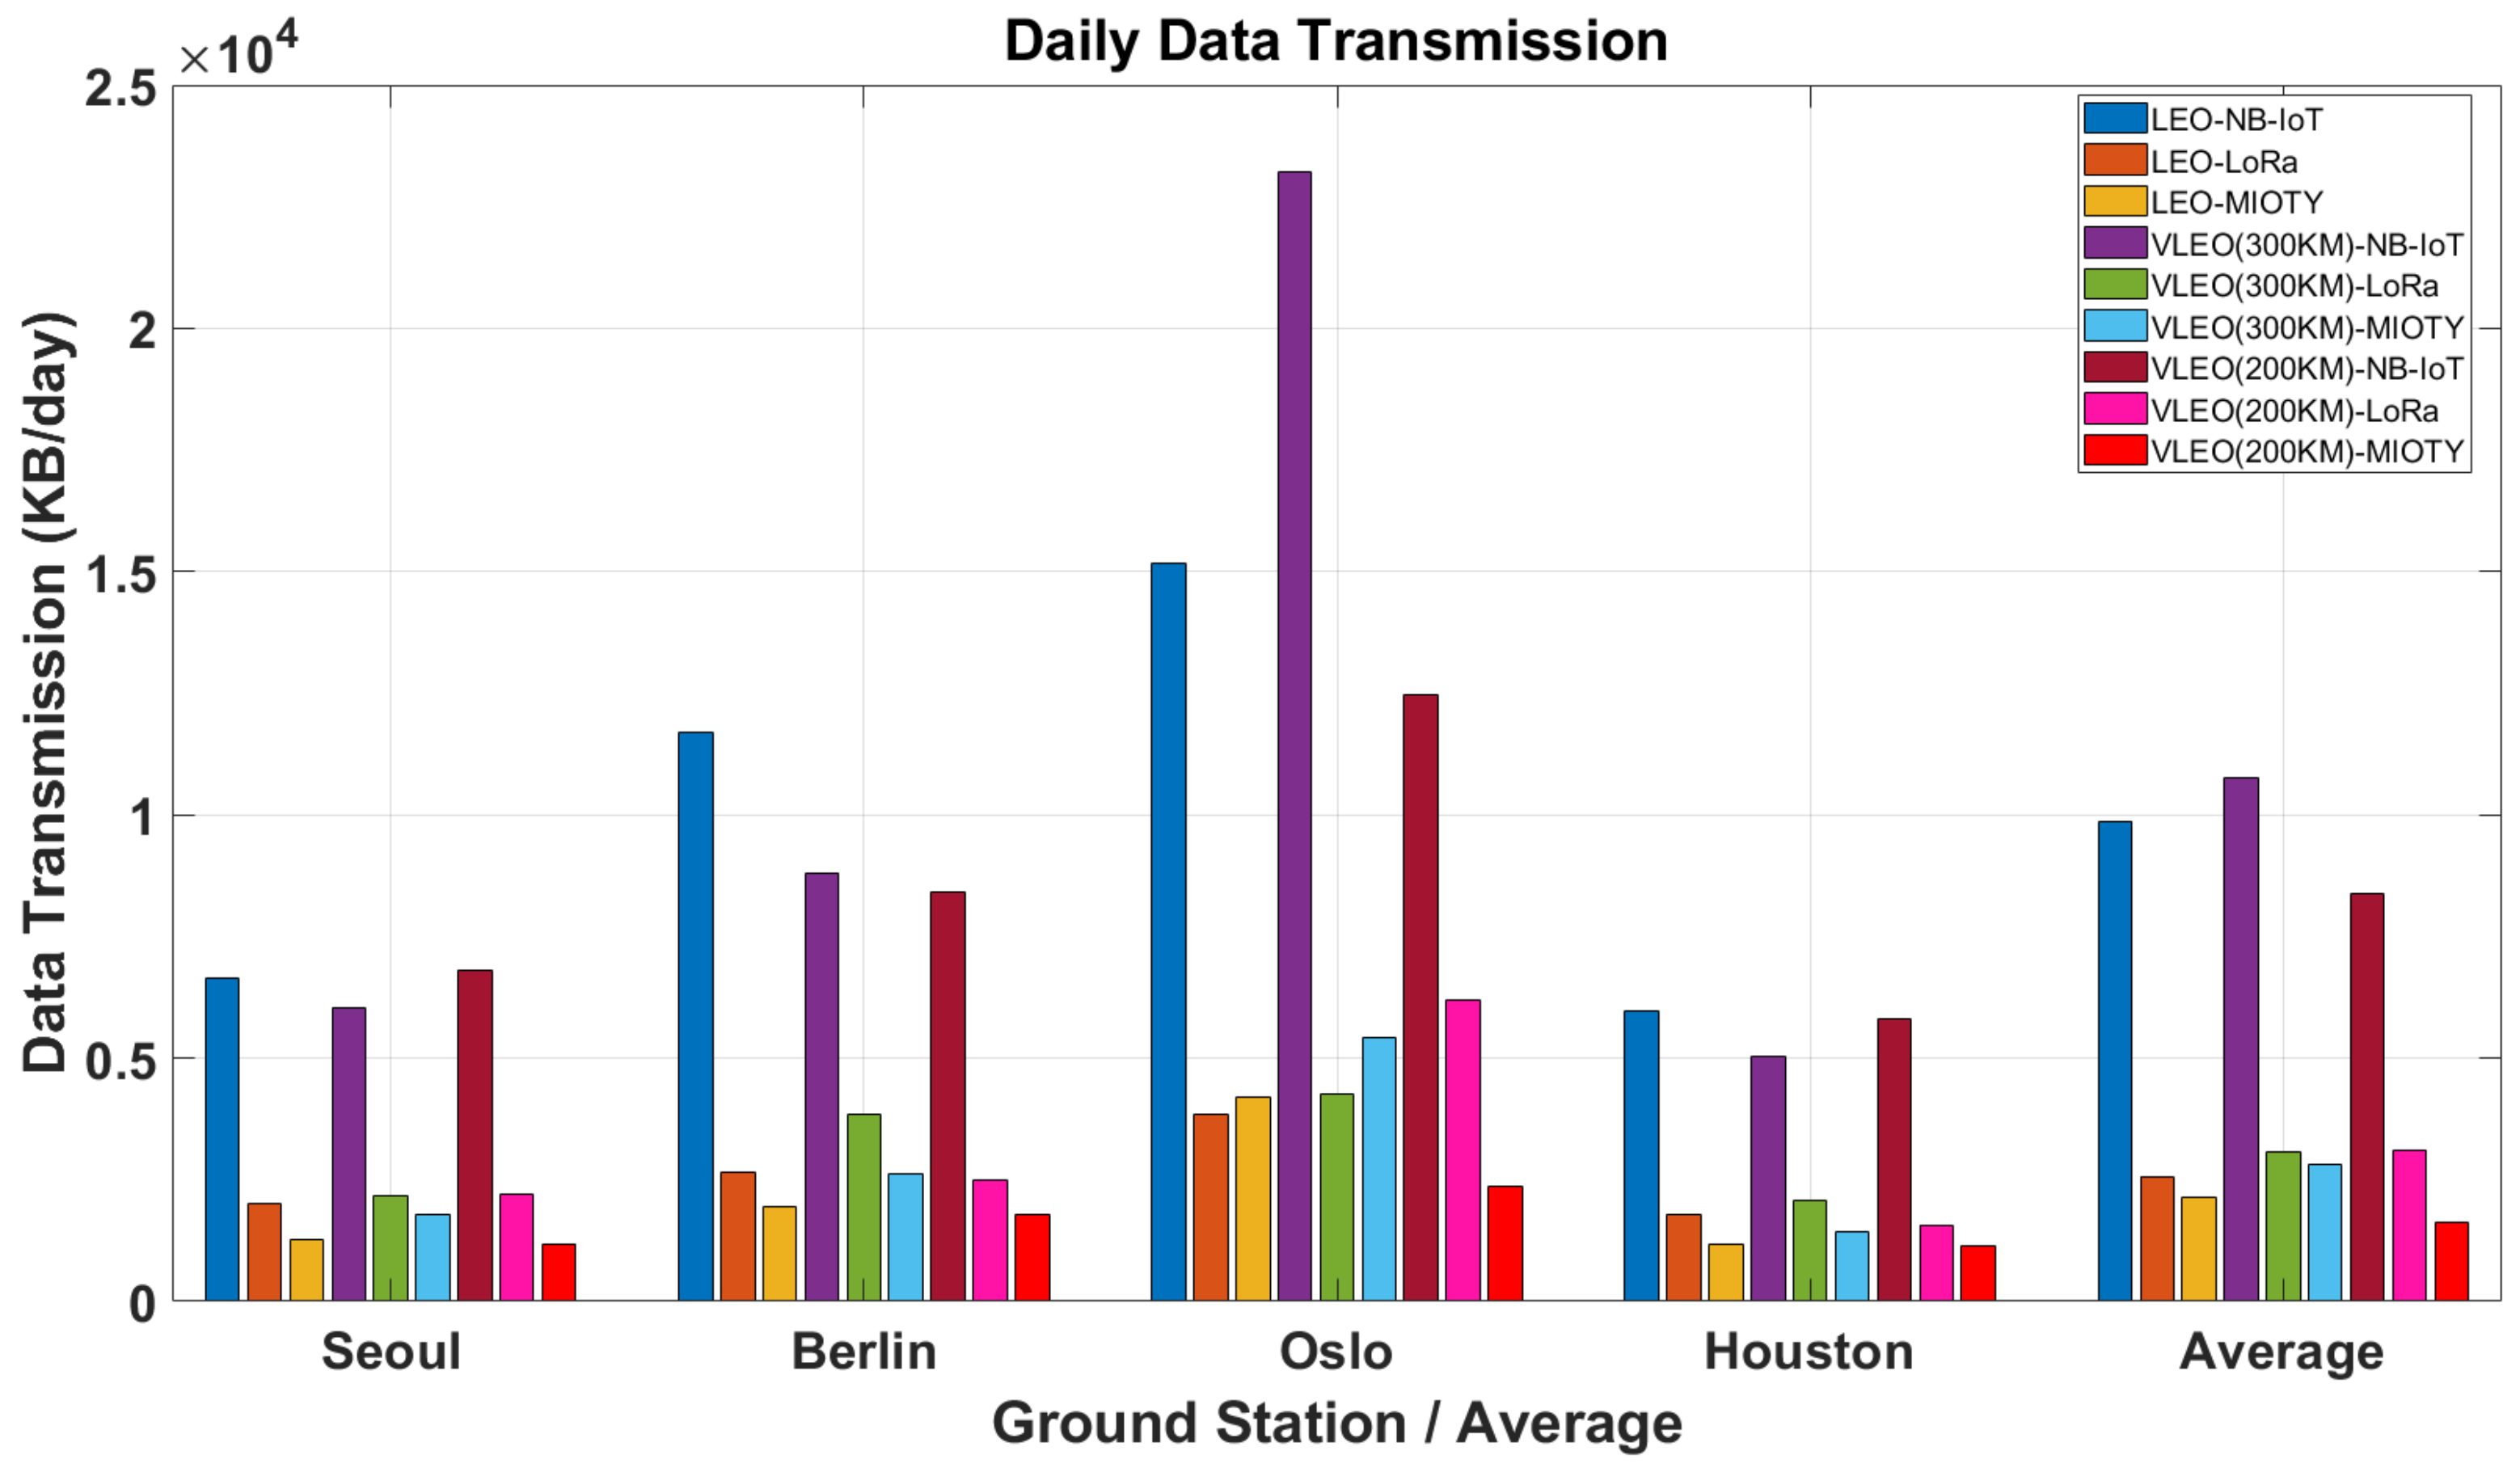
The average revisit time (Ravg) and maximum revisit time (Rmax) are crucial metrics for evaluating the service quality of satellite-based communication systems. Figure 15, Figure 16 and Figure 17 illustrate the average revisit time, maximum revisit time, and daily data transmission volumes for three LPWAN communication technologies (NB-IoT, LoRa, and Mioty) and three orbital configurations (600 km, 300 km, and 200 km) optimized using a genetic algorithm (GA) across four ground stations (Seoul, Oslo, Berlin, and Houston), as well as their overall averages.
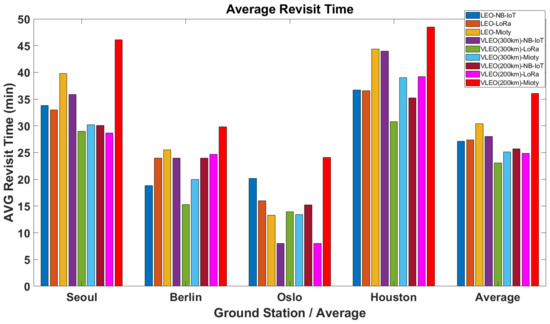
Figure 15.
Average revisit times of ground stations.
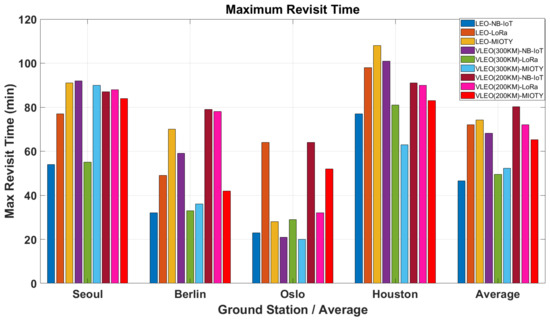
Figure 16.
Maximum revisit times of ground stations.
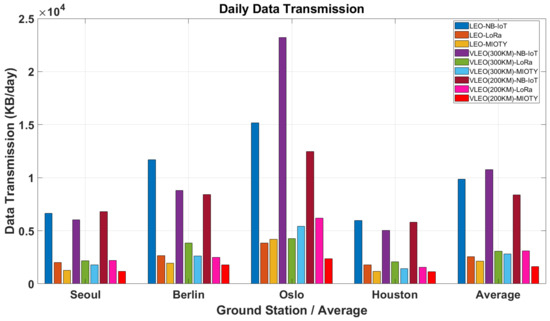
Figure 17.
Daily data transmission volumes of ground stations.
Figure 15 shows that the VLEO (300 km)-LoRa constellation achieves the shortest average revisit time, while the VLEO (200 km)-Mioty constellation exhibits the longest. Despite these differences, all configurations satisfy the target performance criterion of maintaining an average revisit time below 60 min. Notably, the Oslo ground station records a significantly shorter revisit time compared to other stations, which is likely attributed to its higher latitude and the resulting increased frequency of satellite passes.
In Figure 16, the variation in maximum revisit time is presented. The LEO-NB-IoT constellation demonstrates the lowest maximum revisit time, closely followed by the VLEO (300 km)-LoRa and VLEO (300 km)-Mioty configurations. Overall, the VLEO (300 km) configuration appears to be the most effective in minimizing maximum revisit times across the evaluated scenarios.
Figure 17 displays the daily data transmission volumes for each ground station. The VLEO (300 km)-NB-IoT configuration achieves the highest transmission volume, which can be attributed to NB-IoT’s higher bit rate. In contrast, the LoRa and Mioty configurations yield relatively lower transmission volumes, with LoRa slightly outperforming Mioty. These results indicate that NB-IoT is best suited for high-data-rate applications, while LoRa offers marginally better efficiency compared to Mioty.
In summary, these findings confirm that the GA effectively optimizes satellite constellation configurations. The VLEO (300 km) configuration, particularly when paired with LoRa, provides superior performance across key metrics. Moreover, NB-IoT exhibits enhanced performance in LEO and VLEO (300 km) environments compared to VLEO (200 km), and Mioty achieves its best performance in the VLEO (300 km) configuration. Overall, the results underscore the importance of carefully balancing coverage, revisit time, and data transmission efficiency to achieve a cost-effective and robust satellite deployment strategy.
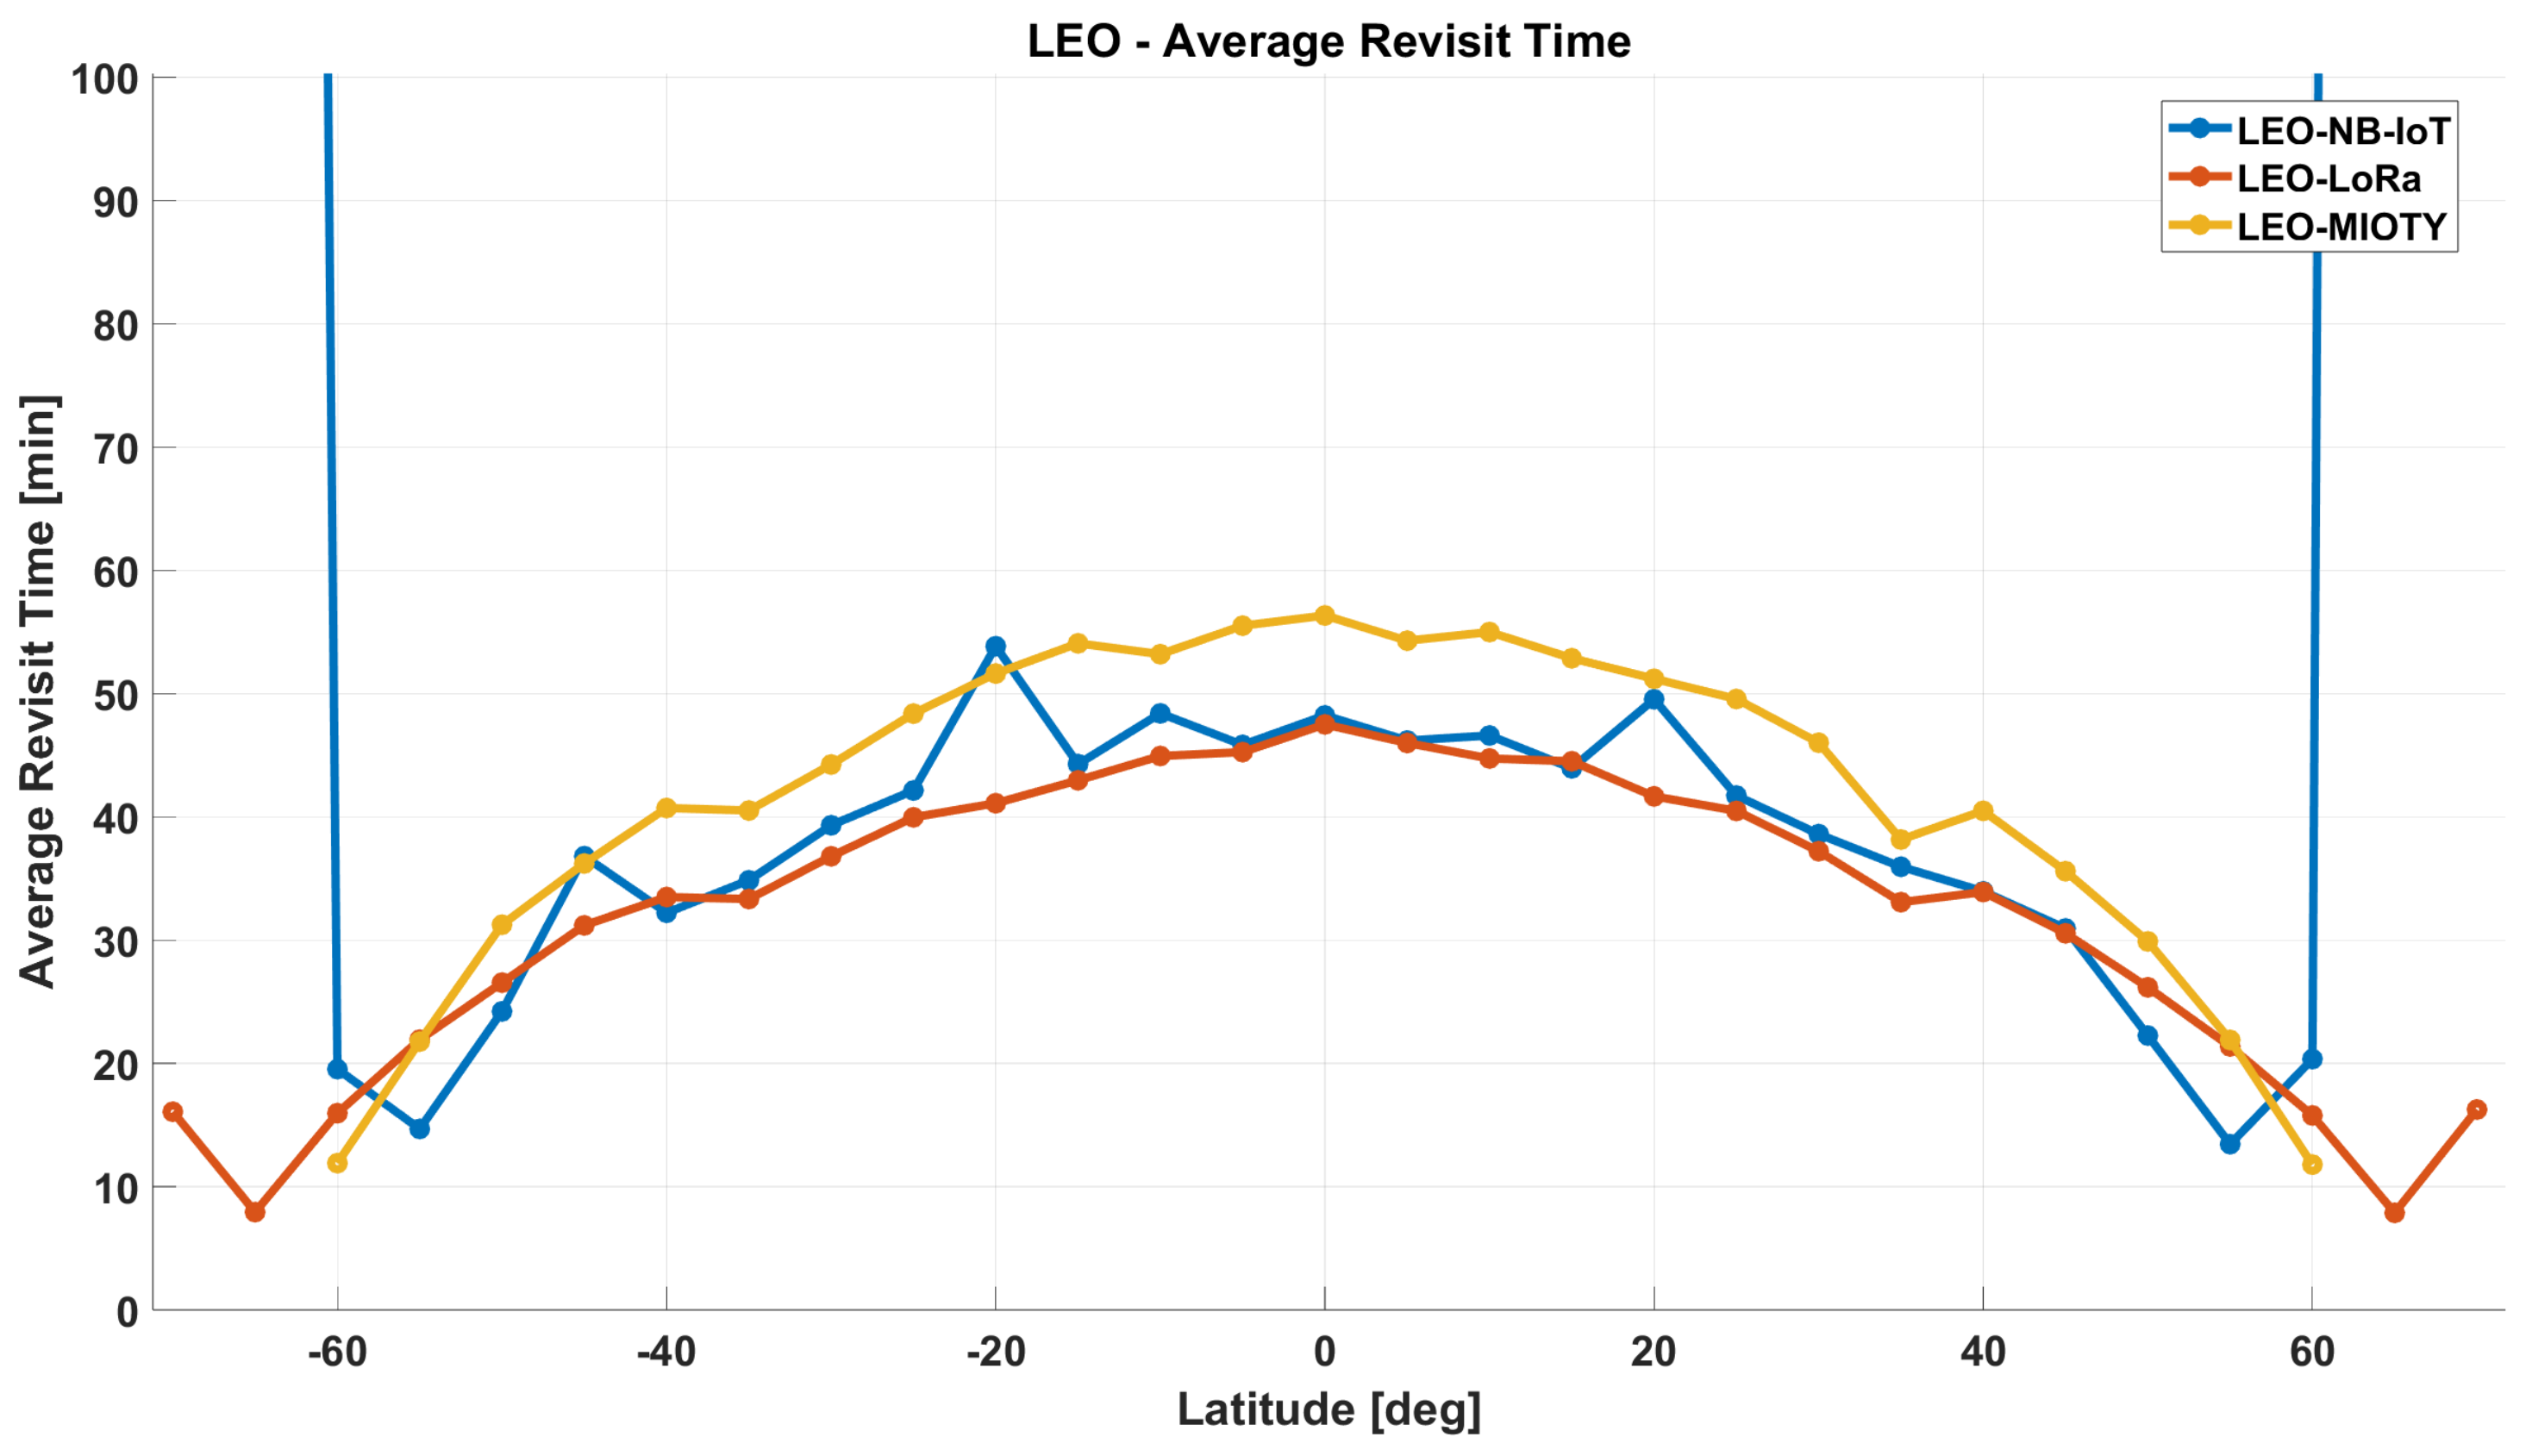
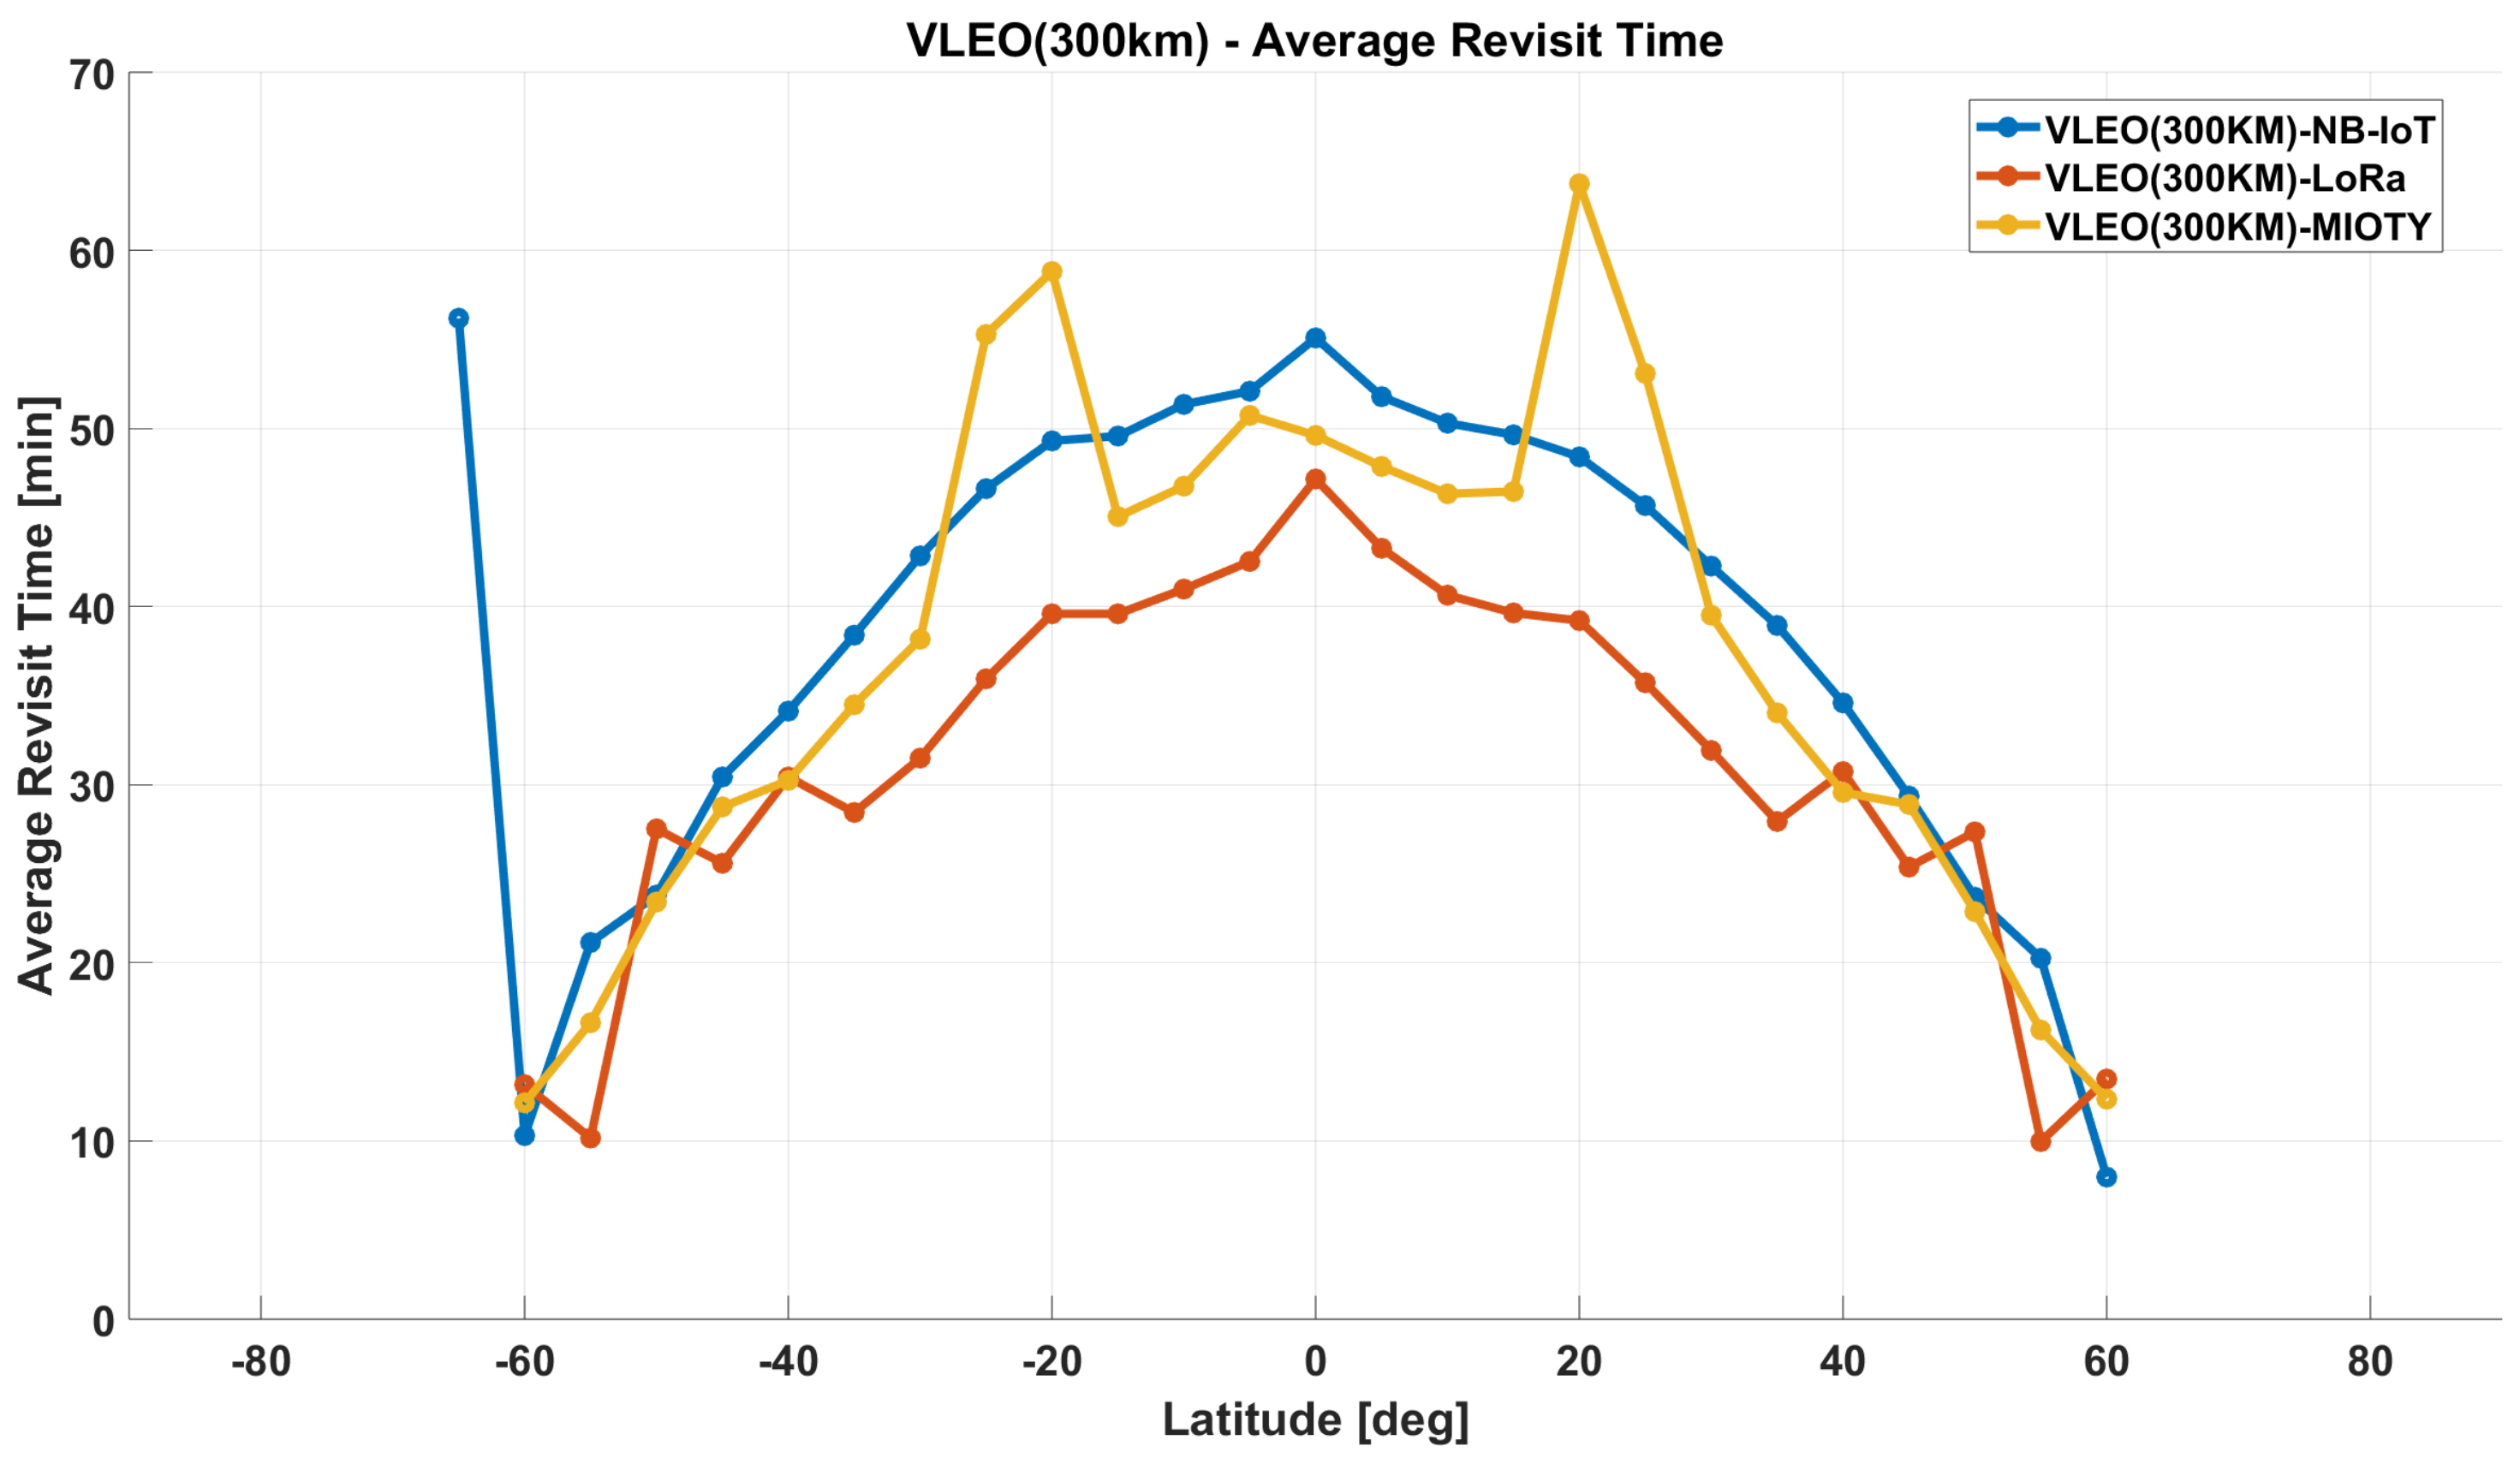
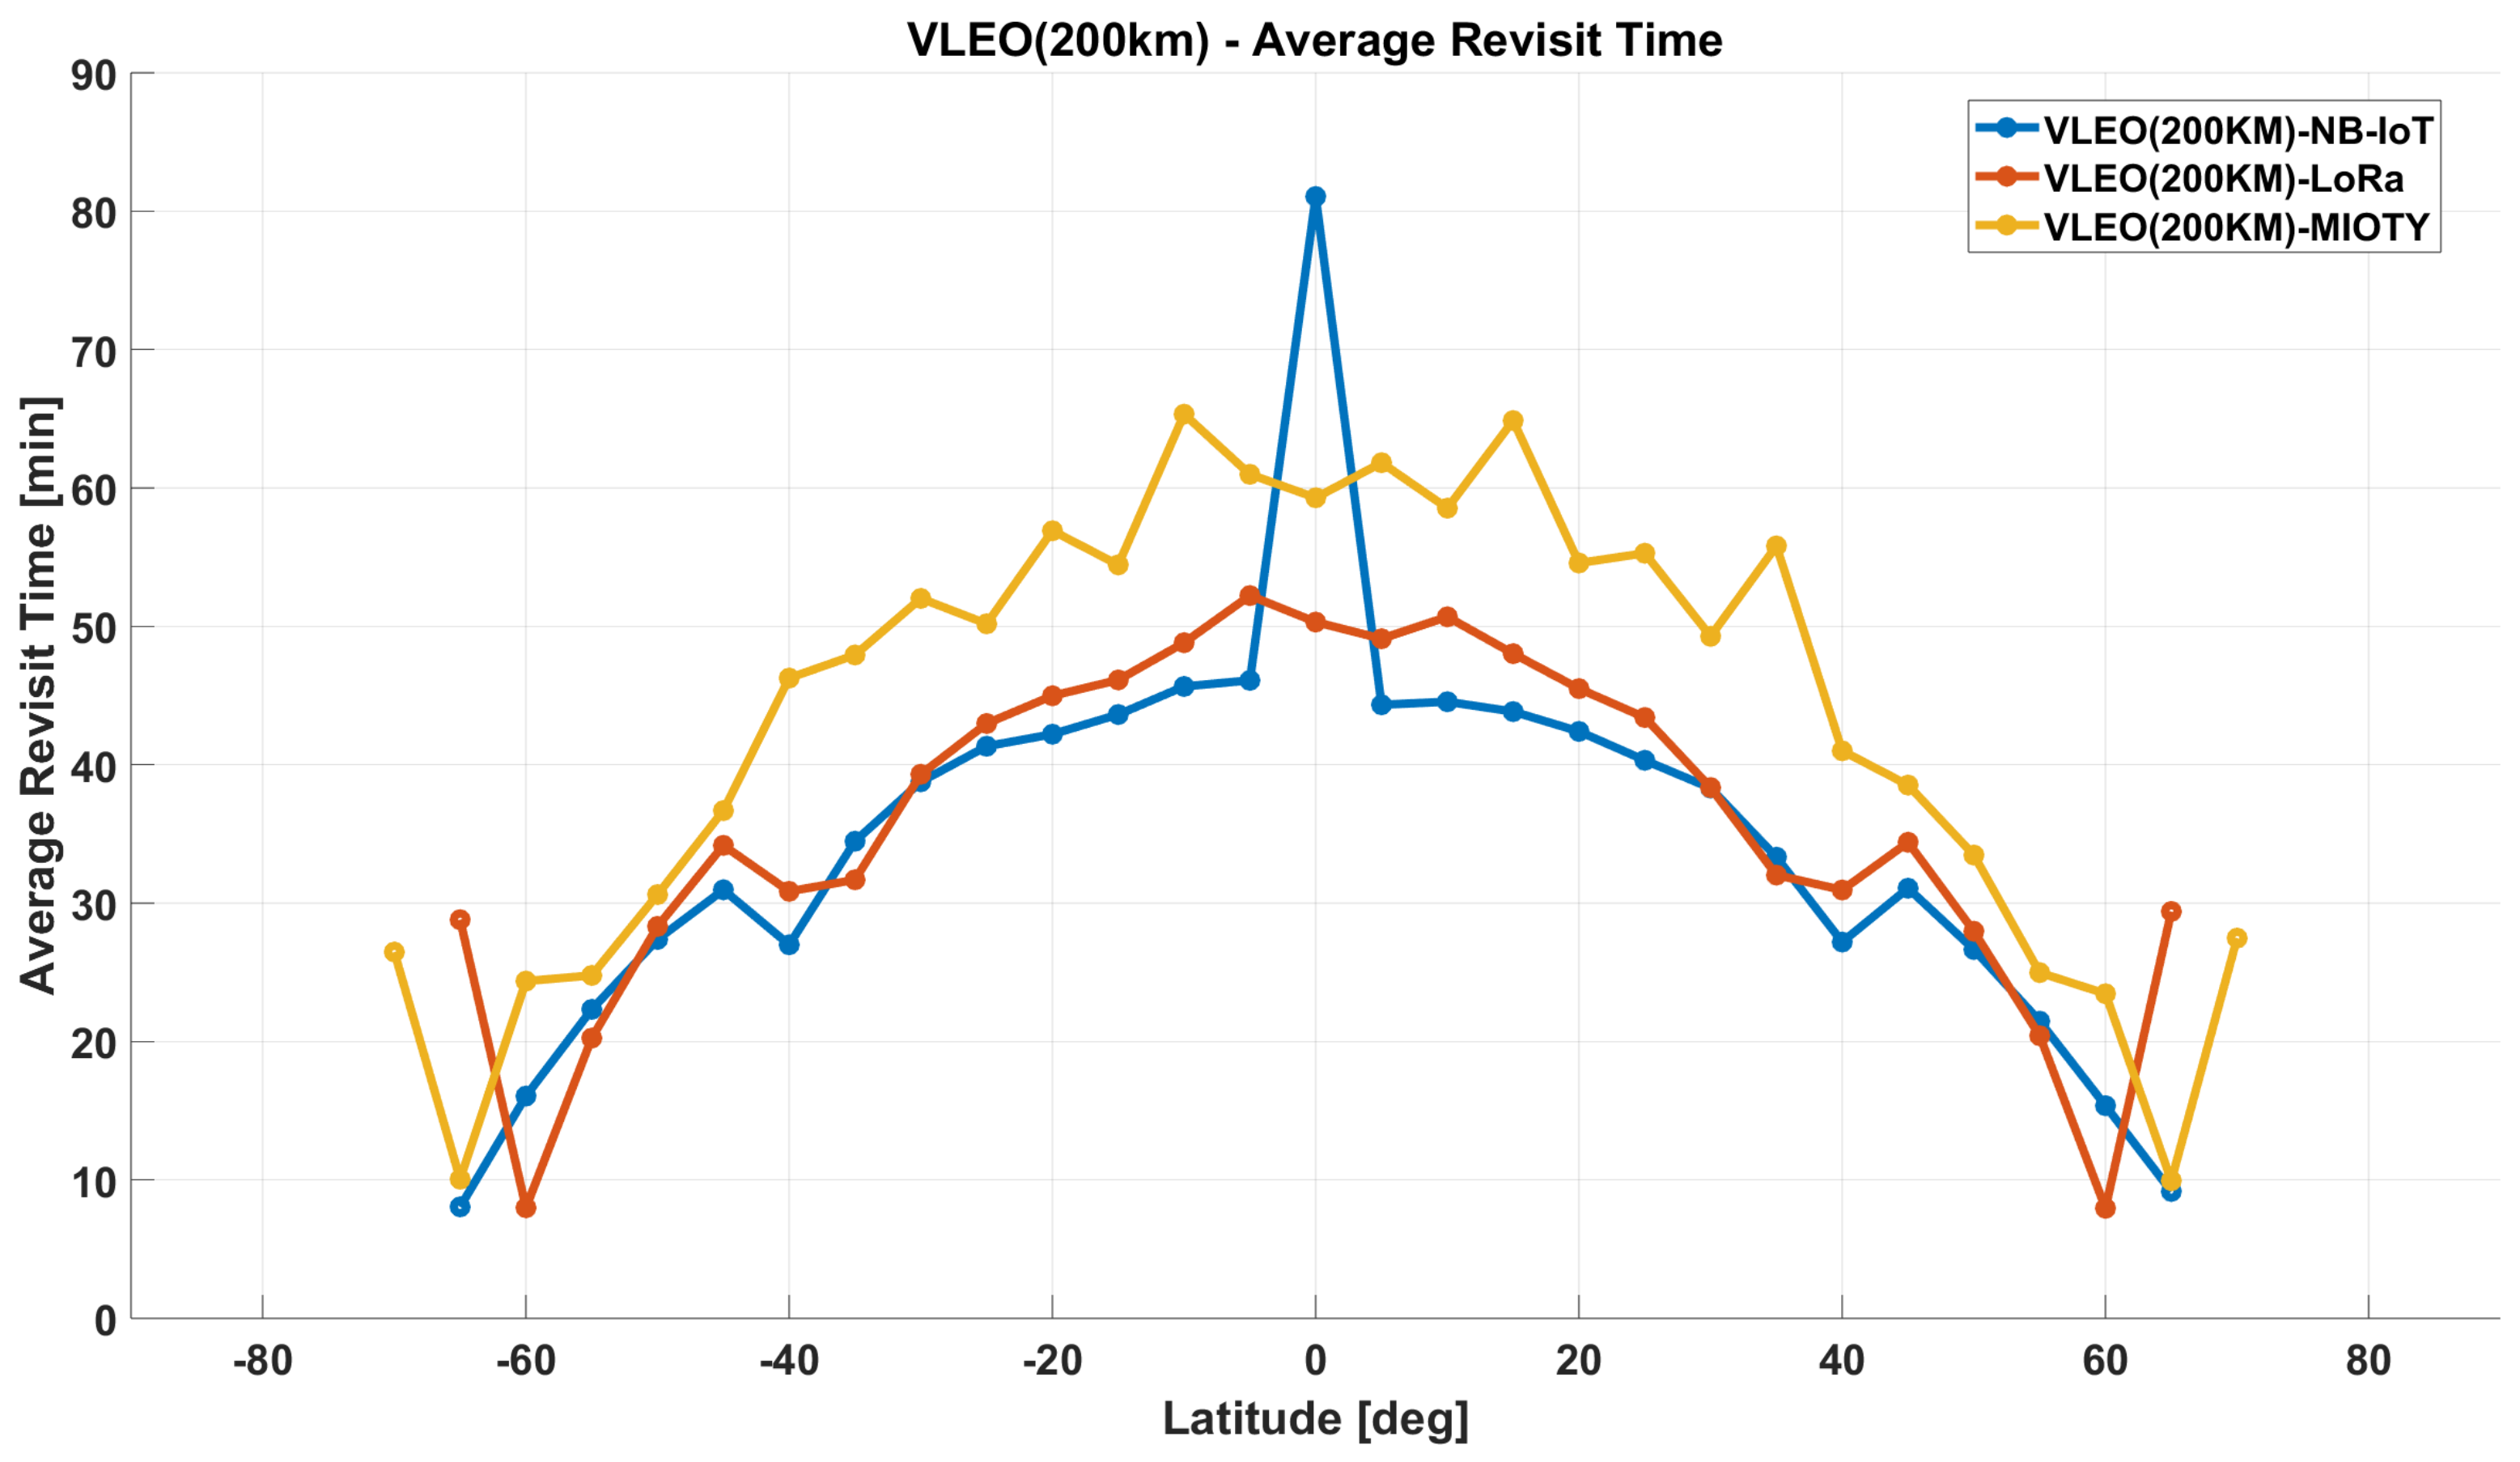
Additionally, to analyze revisit time variations by latitude, measurements were taken at 5° intervals along the latitude direction with the longitude fixed at 0°. Figure 18, Figure 19 and Figure 20 present the average revisit times of satellite constellations for three orbital configurations—LEO, VLEO (300 km), and VLEO (200 km)—as a function of latitude.
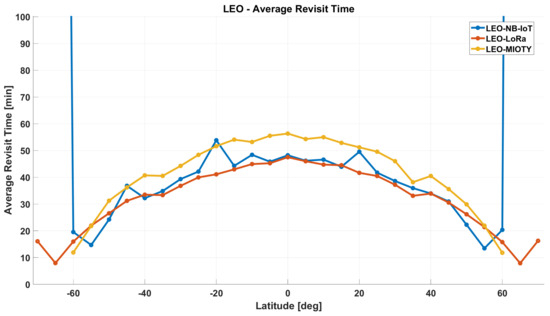
Figure 18.
Average revisit times of the LEO constellation by latitude.

Figure 19.
Average revisit times of the VLEO (300 km) constellation by latitude.

Figure 20.
Average revisit times of the VLEO (200 km) constellation by latitude.
Figure 18 and Figure 19 reveal a significant increase in the average revisit time for NB-IoT in high-latitude regions. This is attributed to the high inclination angles used in the LEO and VLEO (300 km) configurations for NB-IoT, which result in less frequent satellite passes at extreme latitudes. In general, as latitude approaches the equator, the average revisit time tends to increase. In Figure 18, Mioty exhibits a slightly higher average revisit time compared to the other technologies, while LoRa maintains the most stable performance across the entire latitude range. In contrast, Figure 19 shows that both NB-IoT and Mioty have higher average revisit times than LoRa, with a notable reduction in revisit time around latitudes between 50° and 60°—a region where the satellite inclination closely aligns with the observed latitude, leading to more frequent passes. Finally, Figure 20 displays a sharp increase in the average revisit time for NB-IoT near the equator, whereas Mioty maintains consistently high revisit times across all latitudes.
Focusing on the target region between 30° and 60° north latitude, all configurations satisfy the performance criterion of maintaining an average revisit time below 60 min. Moreover, most latitude ranges between 0° and 60° also meet this requirement, indicating robust and consistent performance across the analyzed scenarios.
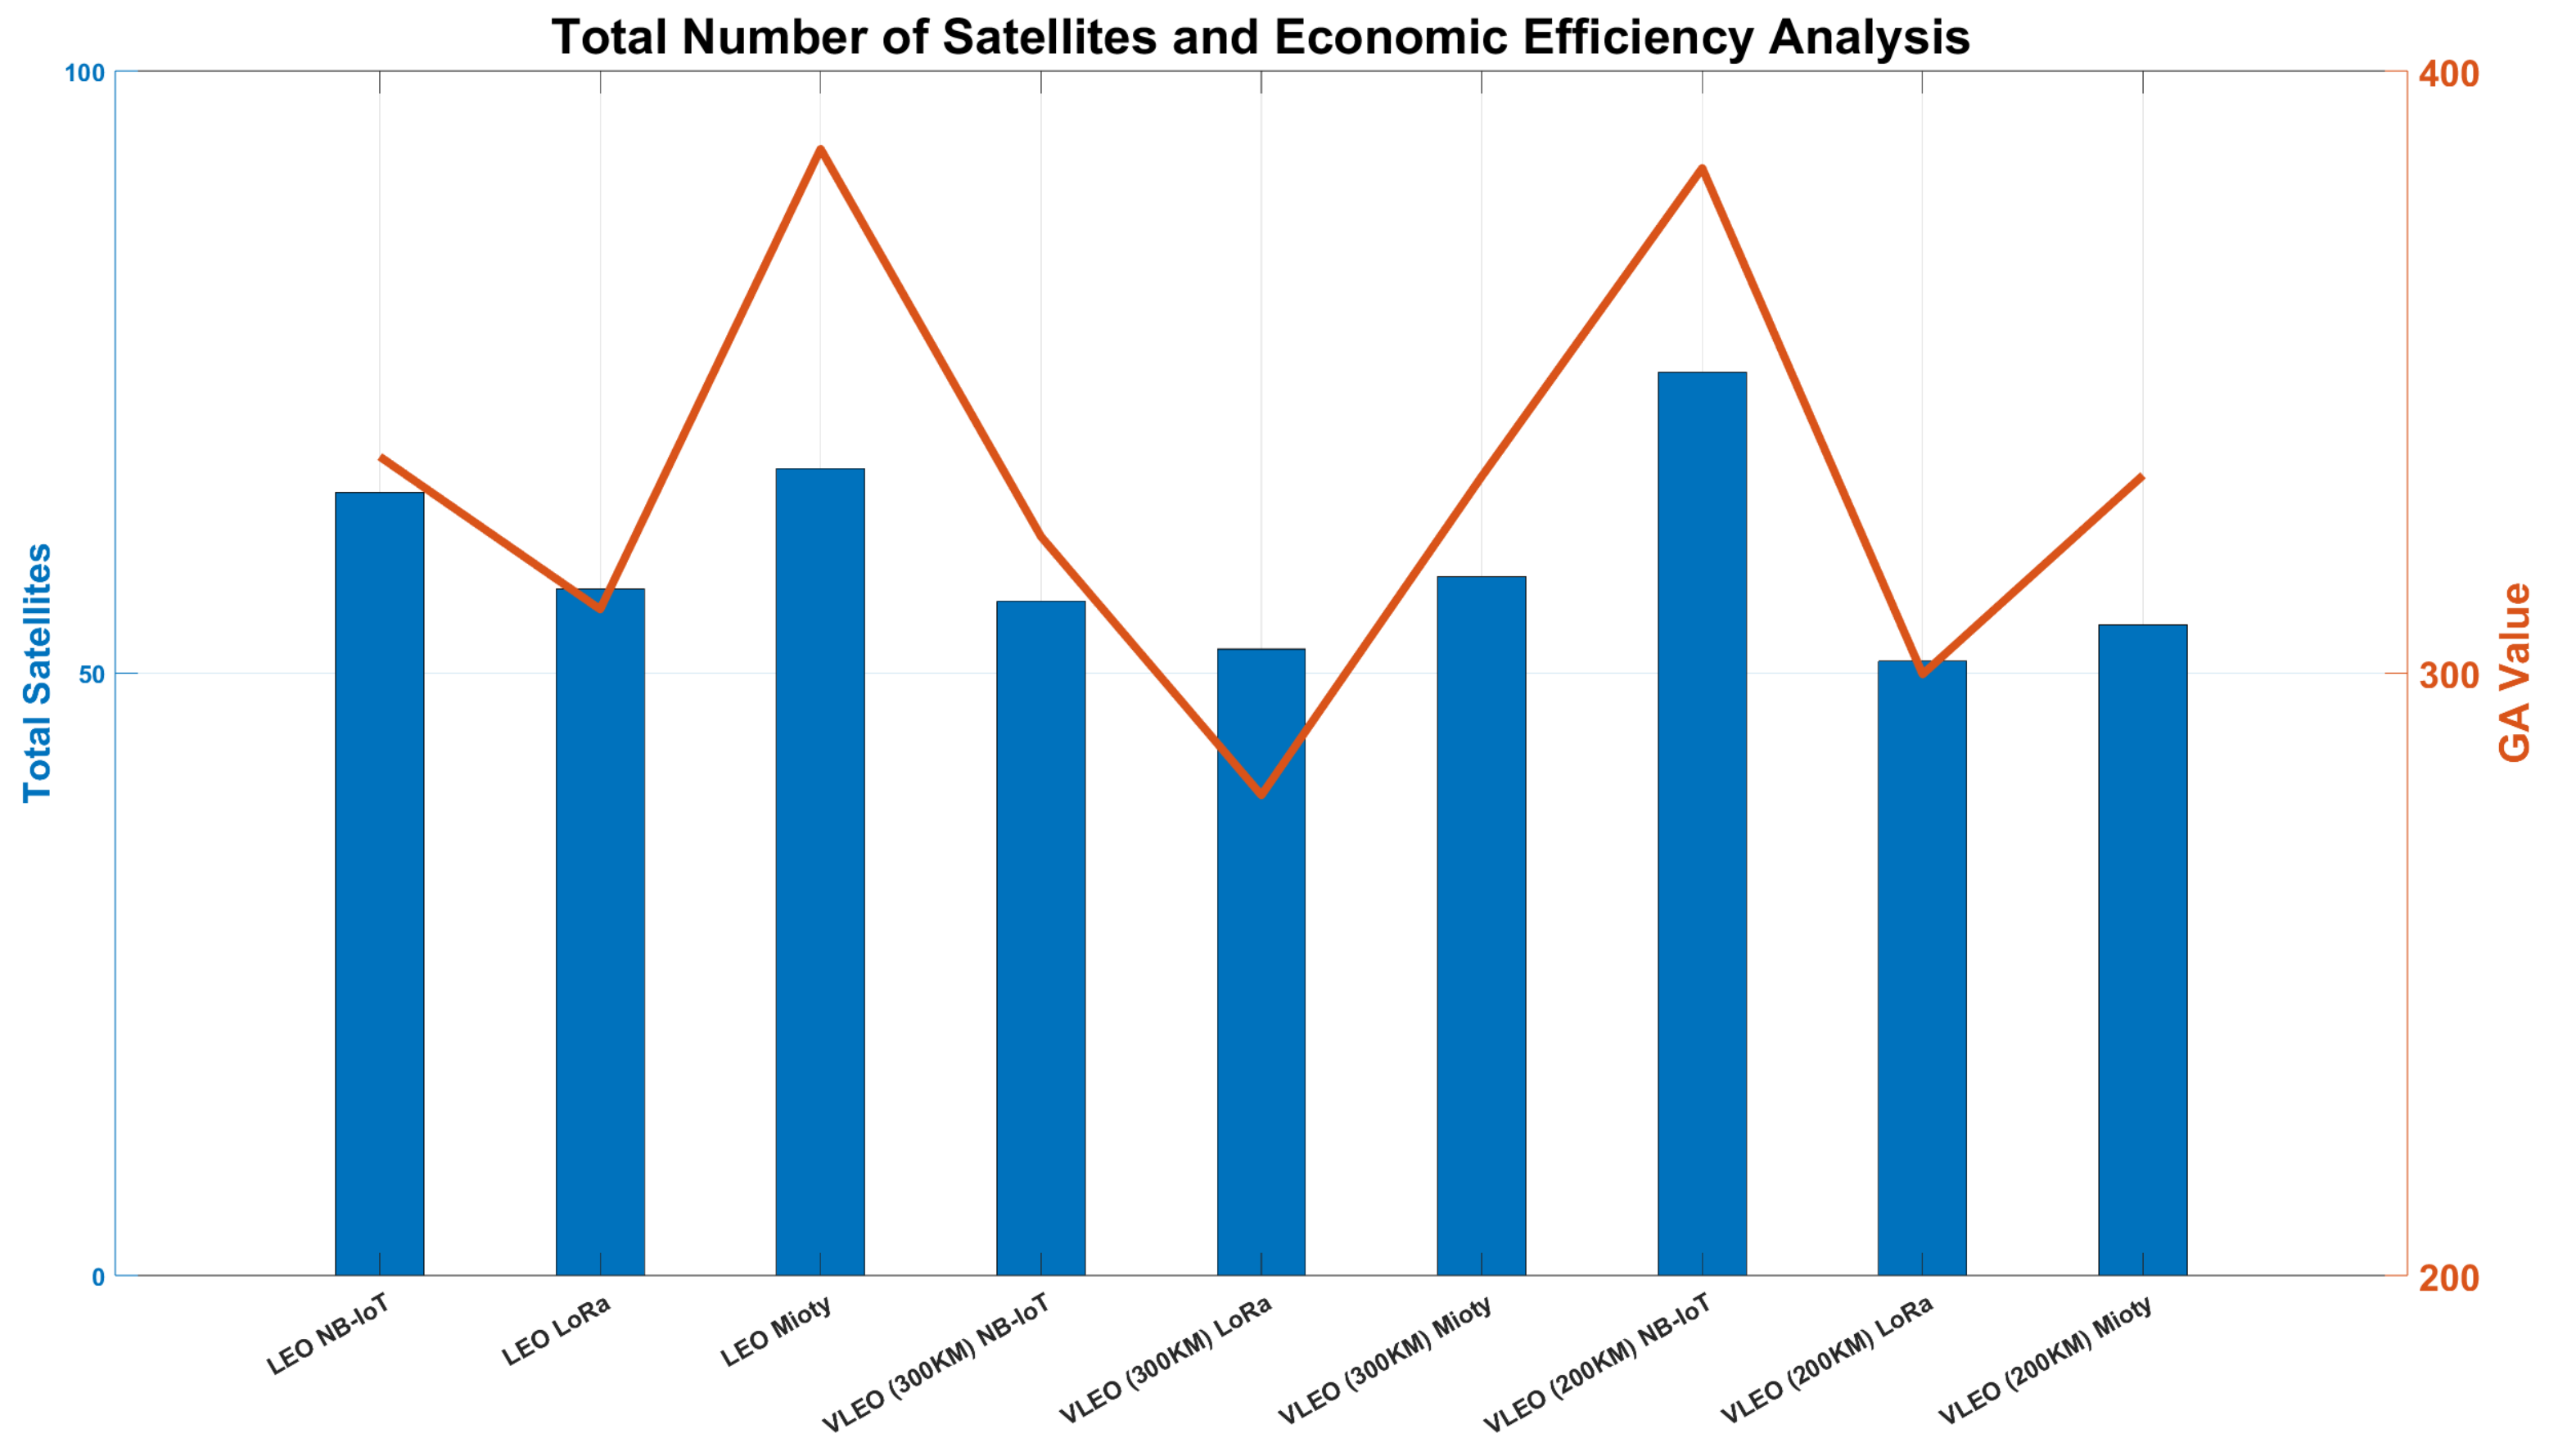
5.4. Total Number of Satellites and Economic Efficiency Analysis
Figure 21 shows that, under identical communication specifications, the VLEO (300 km) constellation requires the fewest satellites (52) and achieves the lowest GA fitness value (279.74). The GA value is a composite metric derived from the fitness function, which was designed to minimize the average revisit time while maximizing data transmission efficiency. In essence, a lower GA value indicates a more optimal configuration that balances performance and cost effectively.
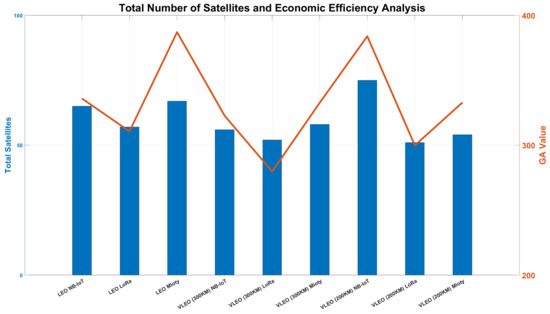
Figure 21.
Total number of satellites and economic efficiency analysis.
Specifically, the LoRa and Mioty constellations in both the VLEO (300 km) and VLEO (200 km) configurations demonstrate superior performance in terms of satellite count and overall efficiency compared to the LEO (600 km) configuration. In particular, the VLEO (200 km)-LoRa configuration deploys 51 satellites—one fewer than the VLEO (300 km) configuration—and achieves a competitive GA fitness value of 299.82, although its overall performance is slightly inferior to that of the 300 km configuration. While the launch costs at 200 km may be marginally lower, the higher commercial demand for the 300 km orbit likely minimizes this cost difference.
These results, derived from a balanced design approach that considers both data transmission efficiency and revisit time, suggest that VLEO configurations—particularly at 300 km—offer superior economic efficiency and performance compared to LEO setups.
5.5. Conclusion and Performance Summary
The GA-based satellite constellation optimization results confirm that the combination of VLEO (300 km) and LPWAN technologies generally provides superior performance across the evaluated metrics.
1. Service Quality Analysis (Revisit Time and Data Transmission Volume)
- Average Revisit Time: The VLEO (300 km)-LoRa configuration achieved the shortest average revisit time, demonstrating effective minimization of revisit intervals.
- Maximum Revisit Time: The LEO-NB-IoT configuration exhibited the shortest maximum revisit time, with VLEO (300 km)-LoRa and Mioty configurations following closely.
- Data Transmission Volume: The highest data transmission volume was recorded in the VLEO (300 km)-NB-IoT configuration, primarily due to NB-IoT’s higher bit rate.
2. Economic Efficiency Analysis (Satellite Count and GA Value)
- Satellite Count: The VLEO (300 km)-LoRa constellation required the fewest satellites and achieved the lowest GA value, indicating a highly efficient configuration.
- VLEO (200 km) Comparison: Although the VLEO (200 km)-NB-IoT configuration deployed one fewer satellite, its performance was slightly inferior, and any potential savings in launch cost are likely offset by the higher commercial demand for the 300 km orbit.
3. Interaction Between Orbit and Communication Technologies
- The VLEO (300 km) orbit consistently demonstrated better performance across all LPWAN technologies.
- LoRa maintained an optimal balance between revisit time and data transmission, while NB-IoT achieved higher data transmission but required more satellites.
- Mioty exhibited longer revisit times compared to LoRa and NB-IoT across all configurations.
Overall, these results indicate that the GA effectively optimizes satellite constellations to achieve a balanced trade-off between service quality and economic efficiency. The VLEO (300 km) setup, in particular, emerges as the most promising configuration, especially when paired with LoRa and NB-IoT.
6. Conclusions and Future Work
The optimization results suggest that the combination of VLEO (300 km) and LPWAN technologies, particularly LoRa and NB-IoT, offers a highly effective balance between service quality and economic efficiency. Our analysis, based on link margin calculations, confirms that VLEO (300 km) constellations provide superior performance in terms of revisit time, data transmission volume, and satellite count.
However, the current study does not fully account for the unique physical-layer characteristics of each communication technology—such as NB-IoT’s high bit rate, LoRa’s long-range capabilities, and Mioty’s scalability for massive IoT connectivity. Future work will address these limitations by incorporating detailed physical-layer simulations and exploring multiple altitude levels. Additionally, experimental validation in real-world environments will be pursued to refine our models further and ensure that the optimized configurations are both practically viable and cost-effective for NTN-based IoT systems.
Author Contributions
Conceptualization, C.L.; Methodology, C.L.; Software, C.L. and T.K.; Validation, C.L.; Formal analysis, C.L.; Data curation, C.J.; Writing—original draft, C.L.; Writing—review & editing, C.L.; Visualization, C.J.; Supervision, Z.Y.; Project administration, Z.Y. All authors have read and agreed to the published version of the manuscript.
Funding
This research was funded by the 2025 Korea Aerospace University Faculty Research Grant.
Data Availability Statement
Data are contained within the article.
Acknowledgments
This research was supported by the Distributed Space Systems Laboratory (OctoLab) at Korea Aerospace University. The authors would like to express their sincere gratitude to Zizung Yoon for his invaluable guidance throughout the study and also appreciate the support and collaboration provided by the lab members.
Conflicts of Interest
The authors declare no conflicts of interest.
References
- Geißler, S.; Lutu, A.; Wamser, F.; Favale, T.; Vomhoff, V.; Krolikowski, M. Untangling IoT Global Connectivity: The Importance of Mobile Signaling Traffic. IEEE Trans. Netw. Serv. Manag. 2024, 21, 4435–4449. [Google Scholar] [CrossRef]
- George, K.W. The Economic Impacts of the Commercial Space Industry. Space Policy 2019, 47, 181–186. [Google Scholar] [CrossRef]
- Qu, Z.; Zhang, G.; Cao, H.; Xie, J. Leo Satellite Constellation for Internet of Things. IEEE Access 2017, 5, 18391–18401. [Google Scholar] [CrossRef]
- Michaelis, I.; Styp-Rekowski, K.; Rauberg, J.; Stolle, C.; Korte, M. Geomagnetic Data from the GOCE Satellite Mission. Earth Planets Space 2022, 74, 135. [Google Scholar] [CrossRef]
- Al Homssi, B.; Al-Hourani, A.; Wang, K.; Conder, P.; Kandepan, S.; Choi, J.; Allen, B.; Moores, B. Next Generation Mega Satellite Networks for Access Equality: Opportunities, Challenges, and Performance. IEEE Commun. Mag. 2022, 60, 18–24. [Google Scholar] [CrossRef]
- Dakka, S.M. VLEO Satellites: A New Earth Observation Space Systems Commercial and Business Model. In Proceedings of the 36th International Communications Satellite Systems Conference (ICSSC 2018), Niagara Falls, ON, Canada, 15–18 October 2018. [Google Scholar]
- Chen, G.; Wu, S.; Deng, Y.; Jiao, J.; Zhang, Q. VLEO Satellite Constellation Design for Regional Aviation and Marine Coverage. IEEE Trans. Netw. Sci. Eng. 2023, 11, 1188–1201. [Google Scholar] [CrossRef]
- Walker, J.G. Satellite Constellations. J. Br. Interplanet. Soc. 1984, 37, 559. [Google Scholar]
- Shin, J.; Park, S.-Y.; Son, J.; Song, S.-C. Design of Regional Coverage Low Earth Orbit (LEO) Constellation with Optimal Inclination. J. Astron. Space Sci. 2021, 38, 217–227. [Google Scholar] [CrossRef]
- Lee, H.W.; Shimizu, S.; Yoshikawa, S.; Ho, K. Satellite Constellation Pattern Optimization for Complex Regional Coverage. J. Spacecr. Rocket. 2020, 57, 1309–1327. [Google Scholar] [CrossRef]
- 3GPP. Solutions for NR to Support Non-Terrestrial Networks (NTN); Technical Report (TR) 38.821, Release 16; 3GPP: Sophia Antipolis, France, 2019. [Google Scholar]
- Mekki, K.; Bajic, E.; Chaxel, F.; Meyer, F. A Comparative Study of LPWAN Technologies for Large-Scale IoT Deployment. ICT Express 2019, 5, 1–7. [Google Scholar] [CrossRef]
- Bor, M.C.; Vidler, J.; Roedig, U. LoRa for the Internet of Things. In Proceedings of the 13th International Conference on Embedded Wireless Systems and Networks (EWSN 2016), Graz, Austria, 15–17 February 2016; Junction Publishing: Graz, Austria, 2016; pp. 361–366. [Google Scholar]
- LoRa Alliance. LoRaWAN® Layer 2 Specification V1.0.4; LoRa Alliance: San Ramon, CA, USA, 2020. [Google Scholar]
- Liando, J.C.; Gamage, T.T.; Hossein, H.; Guan, Y. Known and Unknown Facts of LoRa: Experiences from a Large-Scale Measurement Study. ACM Trans. Sens. Netw. 2019, 15, 16. [Google Scholar] [CrossRef]
- Yang, D.; Zhang, X.; Huang, X.; Shen, L.; Chang, X.; Xing, G. Understanding Power Consumption of NB-IoT in the Wild: Tool and Large-Scale Measurement. In Proceedings of the 26th Annual International Conference on Mobile Computing and Networking, London, UK, 21–25 September 2020; pp. 1–13. [Google Scholar] [CrossRef]
- ETSI. Short Range Devices; Low Throughput Networks (LTN); Protocols for Radio Interface A; Technical Specification ETSI TS 103 357 V1.1.1; European Telecommunications Standards Institute: June 2018. Available online: https://www.etsi.org/deliver/etsi_ts/103300_103399/103357/01.01.01_60/ts (accessed on 12 March 2024).
- Singh, R.K.; Puluckul, P.P.; Berkvens, R.; Weyn, M. Energy Consumption Analysis of LPWAN Technologies and Lifetime Estimation for IoT Application. Sensors 2020, 20, 4794. [Google Scholar] [CrossRef]
- ETSI. Short Range Devices (SRD) Using Ultra-Narrow Band (UNB), Part 2: TS-UNB; ETSI TS 103 357-2 V2.1.1; ETSI: Sophia Antipolis, France, 2024. [Google Scholar]
- Kong, L.; Tan, J. Edge-Computing-Driven Internet of Things: A Survey. ACM Comput. Surv. 2022, 55, 174. [Google Scholar] [CrossRef]
- Gutierrez-Torre, A.; Bahadori, K. Automatic Distributed Deep Learning Using Resource-Constrained Edge Devices. IEEE Internet Things J. 2021, 9, 15018–15029. [Google Scholar] [CrossRef]
- Mishra, M.; Sen Gupta, G.; Gui, X. Investigation of Energy Cost of Data Compression Algorithms in WSN for IoT Applications. Sensors 2022, 22, 7685. [Google Scholar] [CrossRef] [PubMed]
- Nasif, A.; Othman, Z.A.; Sani, N.S.; Hasan, M.K.; Abudaqqa, Y. Huffman Deep Compression of Edge Node Data for Reducing IoT Network Traffic. IEEE Access 2024, 12, 122988–122997. [Google Scholar] [CrossRef]
- McMahan, B.; Moore, E. Communication-Efficient Learning of Deep Networks from Decentralized Data. In Artificial Intelligence and Statistics 2017; PMLR: Fort Lauderdale, FL, USA, 2017; pp. 1273–1282. [Google Scholar]
- Salh, A.; Ngah, R. Energy-Efficient Federated Learning with Resource Allocation for Green IoT Edge Intelligence in B5G. IEEE Access 2023, 11, 16353. [Google Scholar] [CrossRef]
- Rinaldi Junior, F.M.; Bianchi, R.A.; Prati, R.C.; Kolehmainen, K.; Soininen, J.-P.; Kamienski, C.A. Data Reduction Based on Machine Learning Algorithms for Fog Computing in IoT Smart Agriculture. Biosyst. Eng. 2022, 223, 142–158. [Google Scholar] [CrossRef]
- Sun, Z. Satellite Communications Systems, 6th ed.; Wiley: Chichester, UK, 2020. [Google Scholar]
- Semtech Corporation. AN1200.22—LoRa Modulation Basics; Rev. 3.0; Semtech: Camarillo, CA, USA, 2023. [Google Scholar]
- Ippolito, L.J., Jr. Satellite Communications Systems Engineering: Atmospheric Effects, Satellite Link Design and System Performance; John Wiley & Sons: Hoboken, NJ, USA, 2017. [Google Scholar]
- Kim, M.-G.; Jo, H.-S. Performance Analysis of NB-IoT Uplink in Low Earth Orbit Non-Terrestrial Networks. Sensors 2022, 22, 7097. [Google Scholar] [CrossRef] [PubMed]
- ETSI. LTE; Evolved Universal Terrestrial Radio Access (E-UTRA); Base Station (BS) Radio Transmission and Reception (3GPP TS 36.104 version 16.8.0 Release 16); Technical Specification ETSI TS 136 104 V16.8.0; European Telecommunications Standards Institute: January 2021. Available online: https://www.etsi.org (accessed on 12 January 2025).
- 3GPP. E-UTRA Radio Resource Control (RRC); Protocol Specification, Rel-14; 3GPP TS 36.331 V14.15.0; 3GPP TS 36.331 V14.15.0; 3GPP: Sophia Antipolis, France, 2017. [Google Scholar]
- Widyastuti, S.P.; Nur, L.O. Design and Realization of Rectangular Patch Microstrip Antenna for 921.5 MHz LoRa Frequency System Using Multiple Layer Substrate Method. In Proceedings of the 2022 IEEE Asia Pacific Conference on Wireless and Mobile (APWiMob), Bandung, Indonesia, 9–10 December 2022; pp. 1–6. [Google Scholar]
- Putra, N.A.H.; Edwar Hasbi, W.; Manggala, M.P.; Kusmara, D.U.; Putri, W.M. Design of Cubesat Microstrip Antenna with Metamaterial Structure for LoRa Communication. In Proceedings of the 2021 IEEE International Conference on Aerospace Electronics and Remote Sensing Technology (ICARES), Bali, Indonesia, 3–4 November 2021. [Google Scholar] [CrossRef]
- Hassan, R.; Cohanim, B.; de Weck, O.; Venter, G. A Comparison of Particle Swarm Optimization and the Genetic Algorithm. In Proceedings of the 46th AIAA/ASME/ASCE/AHS/ASC Structures, Structural Dynamics and Materials Conference, Austin, TX, USA, 18–21 April 2005; AIAA Paper 2005-1897; American Institute of Aeronautics and Astronautics: Reston, VA, USA, 2005. [Google Scholar] [CrossRef]
- Alluhaybi, A.; Psimoulis, P.; Remenyte-Prescott, R. An Evaluation of Optimisation Algorithms for the Optimal Selection of GNSS Satellite Subsets. Remote Sens. 2024, 16, 1794. [Google Scholar] [CrossRef]
- Carden, J.F.; Deacon, S.; Kessler, P.; Speth, P. Generation-based Evolutionary Tool for the Optimization of Constellations (GenETOC). In Proceedings of the IEEE Aerospace Conference, Big Sky, MT, USA, 6–13 March 2023. [Google Scholar]
- Pellnäs, A. Constellation Optimisation Using Genetic Algorithm. Master’s Thesis, KTH Royal Institute of Technology, Stockholm, Sweden, 2023. [Google Scholar]


Disclaimer/Publisher’s Note: The statements, opinions and data contained in all publications are solely those of the individual author(s) and contributor(s) and not of MDPI and/or the editor(s). MDPI and/or the editor(s) disclaim responsibility for any injury to people or property resulting from any ideas, methods, instructions or products referred to in the content. |
© 2025 by the authors. Licensee MDPI, Basel, Switzerland. This article is an open access article distributed under the terms and conditions of the Creative Commons Attribution (CC BY) license (https://creativecommons.org/licenses/by/4.0/).