Article

Modeling and Recognition of Latent False Data Injection Attacks on Distributed Cluster Control of Distribution Network

1
The State Key Laboratory of Power Transmission Equipment Technology, Chongqing University, Chongqing 400044, China
2
Modern Property Management Department, Chongqing City Management College, Chongqing 401331, China
*
Author to whom correspondence should be addressed.
Electronics 2025, 14(9), 1761; https://doi.org/10.3390/electronics14091761
Submission received: 11 March 2025 / Revised: 17 April 2025 / Accepted: 23 April 2025 / Published: 25 April 2025
(This article belongs to the Special Issue Latest Advances in Distributed Systems and Networked Control)

Abstract

:
The cyber–physical deep integration in distribution networks containing distributed generators (DGs) enables false data injection attacks (FDIAs) through data tampering in monitoring systems, posing cross-domain threats to power system security. Effective FDIA identification methods remain unavailable for distribution networks containing DGs under distributed cluster control. The cyber–physical interaction characteristics are systematically analyzed in the cyber–physical system (CPS) of distribution networks containing DGs under distributed cluster control. A latent FDIA model is established with a specific attack penetration pattern being revealed. The operational impact mechanism of latent FDIAs on distributed cluster control is theoretically elucidated. A synchronous detection signal-based localization methodology is developed for latent FDIAs, coupled with an attack signal computation algorithm. These innovations enable dynamic attack identification and proactive signal isolation, thereby facilitating subsequent defense operations by system operators. Simulation results confirm the effectiveness of the proposed dynamic identification method for latent FDIAs in distribution networks containing DGs.

1. Introduction

The penetration of DGs, particularly wind and photovoltaic systems, has driven rapid development in distribution networks containing DGs [1,2]. Concurrently, CPSs are being extensively deployed in power systems. In the distribution network CPS, data protocol conversion is implemented through interactive devices (e.g., gateways and switches), while communication security requirements are fulfilled via fiber optics and Ethernet, based on the data transmission specifications and collaborative objectives of the control center–communication network–control terminal–physical network architecture [3,4]. Through this framework, real-time grid state observation and effective reference values are enabled for the control center [5,6]. However, the deep cyber–physical coupling characteristics of CPSs create vulnerabilities for attackers to disrupt distribution network operations through cyber attacks [7]. Specifically, cyber attacks against distribution networks containing DGs may induce DG control failures, thereby compromising system security [8,9].
Two control paradigms are identified for DGs in distribution networks based on CPS communication architectures: centralized and decentralized control [10]. The centralized approach, featuring one-to-many communication, suffers from interference susceptibility and low reliability. Although decentralized control enables dedicated controller-based individual regulation through one-to-one communication, it fails to achieve coordinated optimization across multiple controlled objects. These limitations have prompted the adoption of distributed cluster control [11,12]. In this paradigm, peer-to-peer controlled objects receive reference values from the distribution network control center. Control information is propagated through local communication networks. State updates are computed in a distributed way by aggregating information from neighboring nodes according to predefined update rules [13]. This approach facilitates regional DG cluster management and reduces communication infrastructure requirements. Nevertheless, despite firewall configurations, authentication mechanisms, and encrypted service message protocols in existing systems, the wireless private network architecture between CPS access and terminal layers remains vulnerable to cyber attacks [14]. Specifically, FDIAs can be launched against distributed cluster control systems through manipulated electrical measurement data, ultimately disturbing normal grid operations [15].
FDIAs can either immediately compromise information systems to paralyze physical infrastructure or covertly infiltrate to seize control of physical systems [16]. Depending on malicious intent, FDIAs can be categorized into latent and disruptive phases. By constructing specific attack vectors to manipulate measurements in Supervisory Control and Data Acquisition (SCADA) systems, attackers induce deviations in system states while keeping tracking errors unchanged, thereby evading anomaly detection mechanisms in the distribution network Energy Management System (EMS) to implement latent attacks [17]. These attacks employ covert data manipulation and progressive disruption strategies [18], initially driving the system into vulnerable states through subtle disturbances, and subsequently triggering control failures via pre-injected signals to cause cascading failures.
Defending against multi-stage FDIAs has threefold coupled challenges: latent attacks dynamically optimize attack vector covariance matrices to achieve progressive data manipulation while preserving tracking error statistics, creating significant blind zones in conventional residual-based detection due to residual space compression [19]; the phase transition process dynamically correlates with vulnerability indices (e.g., line loading ratios and DG power fluctuations), compelling defenders to identify attack migration thresholds under multivariate state constraints; and most critically, latent signals persistently alter DG unit output characteristics through distributed control architectures, enabling subsequent destructive attacks to induce instability with low-energy perturbations [20]. This cross-phase synergy between coordinated attacks and system vulnerabilities necessitates defense strategies to simultaneously resolve multidimensional challenges encompassing latent attack recognition, vulnerability assessment, and dynamic response optimization within limited time windows, constituting a critical threat to distributed cluster control [21]. Therefore, identifying the latent FDIA is the key to preventing the distribution networks containing DGs from being further damaged.
Existing research predominantly focuses on attack–defense games and the post-disruption isolation of disruptive FDIAs [21,22], with limited attention to latent attacks. While [23] analyzes FDIA characteristics from attacker perspectives, it neglects latent–disruptive phase distinctions. Although an attack–defense game strategy is proposed in [24], cross-domain attack propagation mechanisms remain unaddressed. Current detection methods, summarized in [25], exhibit high communication dependencies, proving inadequate for distributed cluster control scenarios with requirements for real-time performance and low false alarm rates. Fundamental challenges persist, including unclear cyber–physical interaction mechanisms under latent attacks and suboptimal detection methodologies.
This paper establishes a latent FDIA model for distribution networks containing DGs under distributed cluster control, revealing an attack penetration pattern that compromises CPSs without affecting the active power output of DG clusters. A synchronous detection signal-based localization methodology and attack signal computation algorithm are developed to enable the distributed dynamic identification of latent FDIAs, thereby supporting proactive defense measures against potential system damages. The main contributions of this work are systematically articulated through three interconnected components. First, a CPS model embedding latent FDIAs is developed to capture the latent intrusion dynamics. Building upon this foundation, the propagation mechanism of latent attacks is analytically characterized. Furthermore, a dynamic identification framework incorporating adaptive signal isolation is proposed to mitigate attack impacts. Finally, the effectiveness and resilience of the methodology are rigorously validated through simulations with the IEEE 34-node distribution network benchmark.

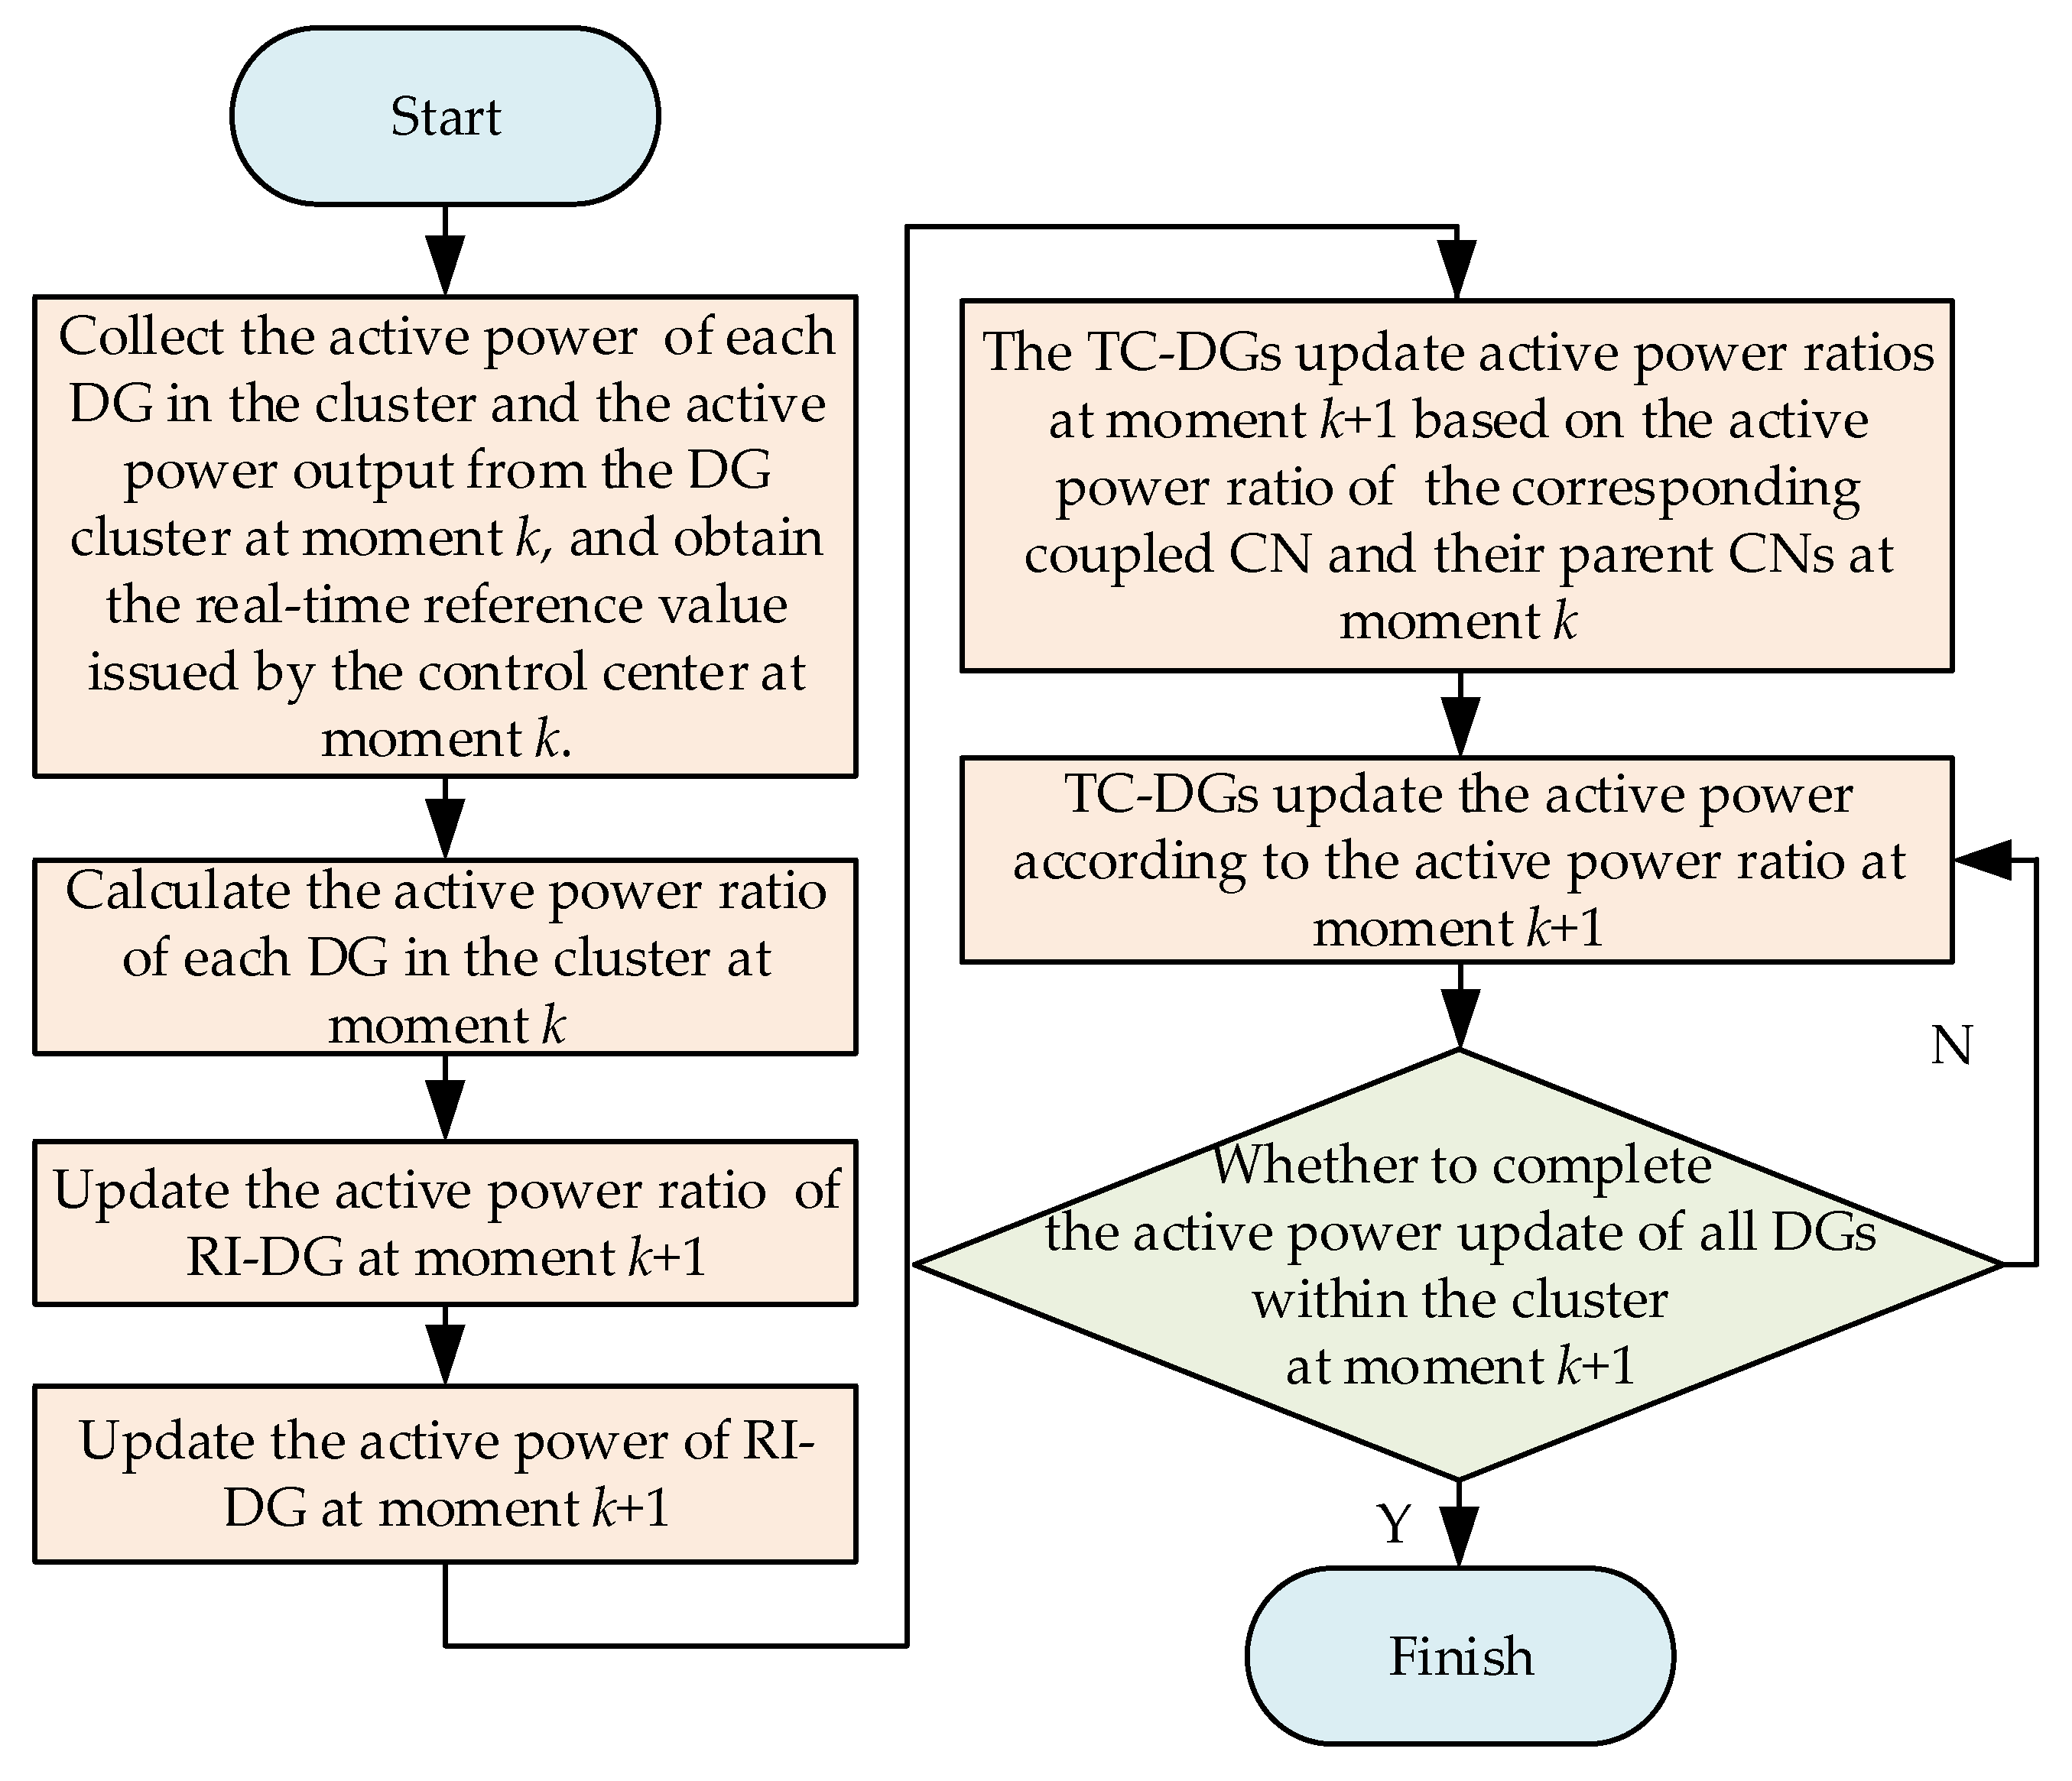
2. Cyber–Physical Interaction Characteristics in Distributed Cluster Control of Distribution Network

The increasing penetration of DGs is driving the evolution of traditional distribution networks into distribution networks centered on coordinated multi-type DG operations. Modern distribution networks exhibit significant compositional heterogeneity in DG portfolios, predominantly comprising inverter-interfaced units such as photovoltaics, direct-drive wind turbines, and fuel cells. These units’ output characteristics critically depend on inverter control strategies, where the real-time regulation of active/reactive current components enables the precise tracking of power reference values.
Under a distributed cluster control architecture, distribution networks containing DGs implement topological reconfiguration and resource aggregation through virtual power plant (VPP) technology. This approach dynamically aggregates geographically adjacent and control-compatible DG units into virtual clusters with unified regulation interfaces. The control center leverages a consensus algorithm to generate cluster-level power references, enabling distributed coordination among DG units via communication networks. This operational paradigm ensures equitable power sharing while driving the system toward globally optimal operating points through iterative state-update processes [26]. Notably, the escalating DG penetration intensifies cyber–physical coupling complexities. Inverter control latencies and communication delays directly influence cluster dynamic response characteristics, presenting critical technical challenges requiring breakthroughs in attack–defense mechanisms for distribution networks containing DGs.
The CPS architecture for distribution networks containing DGs under distributed cluster control is illustrated in Figure 1. The CPS architecture establishes bidirectional connectivity between cyber and physical layers through communication links. Based on communication topology interfaces, physical-layer DGs are classified into two categories: reference-interface DG (RI-DG) and topology-collaborative DG (TC-DG) [27,28]. These correspond to the reference-interface cyber node (RI-CN) and the topology-collaborative cyber node (TC-CN) in the cyber layer, respectively. The RI-CN serves as a unique cluster-level interface with the distribution network control center, while TC-CNs maintain direct/indirect communication with the RI-CN.
In Figure 1, DG1 is the RI-DG, and the cyber node CN1 is the RI-CN. DG2, DG3, and DG4 are TC-DGs. CN1 is connected to the control center. CN1 receives both real-time reference values from the control center and real-time output power from the cluster. The reference values of CN2, CN3, and CN4 come from CN1. Each CN sends the reference values to the corresponding DGs so that the output power of the DG cluster can track the reference values. For a distributed cluster of n DGs, the control objective can be written as follows:
f = min P P out P P ref 2
where P out is the active power output from the DG cluster; P ref is the active power reference value of the DG cluster; and P is the vector consisting of the active power of each DG in the cluster, which can be expressed as follows:
P = P D G 1 , P D G 2 , P D G 3 , , P D G n T
where PDG1, PDG2, …, and PDGn present the active power of each DG in the cluster, and n is the number of DGs in the cluster.
The individual DG active power ratio is defined as follows:
ξ i = P D G i P D G i , max
where ξ i is the active power ratio from the ith DG in the cluster; P D G i is the active power from the ith DG in the cluster; and P D G i , max is the active capacity from the ith DG.
To ensure synergistic power sharing while maintaining controllability, the active power ratio control objective is established as follows:
P D G 1 P D G 1 , max = P D G 2 P D G 2 , max = = P D G n P D G n , max = ξ *
where ξ * is the synergistic active power ratio of DGs.
A discrete-time leader–follower consensus algorithm is employed for distributed implementation. Designated as the leader, CN1 receives reference values issued by the control center and cluster power measurements and, at the same time, adjusts the active power ratio of the next moment k + 1 according to the active power ratio of the current moment k. When the active power output from the cluster is greater than the reference value, the active power ratio from DG1 tends to increase, and DG1 outputs more active power and also transmits the active power ratio information through the communication link, so that the TC-DG generates more active power to compensate for the active power output deficit of the DG cluster, and vice versa. When the active power output deficit of the DG cluster is larger, the variation in the active power ratio from DG1 is also larger. As the active power output deficit reduces to zero, the variation amplitude of the active power ratio from DG1 also reduces to zero accordingly, and finally, the active power ratio from DG1 completes the convergence. The RI-DG active power ratio ξ 1 is updated temporally through the following:
ξ 1 ( k + 1 ) = min max ξ 1 ( k ) +                                           ε ( P ref ( k ) P out ( k ) ) , 0 , 1
where ε is the convergence factor, which is between 0 and 1, and P out ( k ) and P ref ( k ) are the active power output from the DG cluster and the reference value at moment k, respectively. The difference between P out ( k ) and P ref ( k ) is the cluster active power control error at moment k, which, multiplied with the convergence factor, is the updating step of the active power ratio from DG1 at moment k + 1.
RI-CN is the pivotal node in the cyber layer, which needs to reliably update the active power ratio and pass it to the neighboring CNs through the communication link. For TC-DG, as a follower DG, the CN of TC-DG receives the active power ratio passed by the parent CN and updates the active power ratio at moment k + 1, which is weighted by computing the differences between the active power ratios of the parent CNs and the active power ratio of themselves at moment k to achieve the cooperative tracking of the active power ratio of the TC-DG to the parent DGs. When co-tracking the active power ratio to the parent DGs, the updating principle is as follows:
ξ ˙ j ( k + 1 ) = j Ω j a j j ξ j ( k ) ξ j ( k )
where j is the identifier of the TC-CN; j represents the parent CN identifier of the jth TC-CN in the communication topology; Ω j represents the set of all parent CNs directly governed by the jth TC-CN; a j - j is the communication coupling gain parameter between the jth and jth TC-CNs [29]; and ξ ˙ j ( k + 1 ) is the differential of the active power ratio from the jth TC-CN at moment k + 1.
When the cluster active power output converges to the reference value, the active power ratio of the RI-DG converges to a specific value. According to the level-by-level updating characteristic of the active output power ratio of the TC-DG, the convergence of the active power ratio of the RI-DG determines the convergence of the active power ratios of the child TC-DGs. All the remaining TC-DGs can also realize the level-by-level convergence of the active power ratio based on Equation (6). Eventually, the active power ratios of the DGs in the cluster converge to the same value.
Figure 2 delineates the operational workflow. Reference values are dispatched from cyber to physical layers, with power measurements fed back to the cyber layer. Following ratio updates at CN1, neighboring nodes (CN2 and CN3) perform localized computations using received ξ 1 and local measurements. Through the same mechanism, the updated power ratio ξ 2 is received by CN4, and the adjustment of ξ 4 is subsequently completed. This hierarchical update propagates through the communication network, ensuring coordinated power adjustments across all DGs. Final cluster output updates are completed when all nodal computations converge.

3. Latent False Data Injection Attack Modeling for Distributed Cluster Control of Distribution Network

FDIAs are implemented through the injection of attack-corrupted state variables into communication devices or links, thereby compromising measurement and transmission integrity. In a distribution network containing DGs under distributed cluster control, RI-CNs are typically equipped with enhanced defense mechanisms. Consequently, TC-CNs with weaker security configurations are preferentially targeted for FDIAs.
The latent FDIA is characterized by attack vectors that evade bad data detection (BDD) mechanisms in EMS while maintaining compliance with control objectives defined in Equations (1) and (4). This stealthy behavior prevents attack detection by system operators. At moment k0, the FDIA against the jth TC-DG active power ratio is mathematically formulated as follows:
ξ ^ j ( k 0 ) = ξ j ( k 0 ) + λ j a
where ξ ^ j is the visual result of the active power ratio of the jth TC-DG following the FDIA; the superscript ^ characterizes the variable following the attack signal; and λ j a signifies the injected attack signal.
The sampling frequency in DG cluster systems is typically set at 5–10 times the maximum effective frequency, exceeding Nyquist theorem requirements. This configuration not only effectively prevents truncation errors arising from integral approximation processes but also maintains rigorous power tracking accuracy with guaranteed stability margins under non-ideal operating conditions, including quantization noise and communication delays, as validated in [30].
Under FDIAs, the jth TC-DG active power ratio is updated at moment k0 + 1 as follows:
ξ ^ ˙ j ( k 0 + 1 ) = j Ω j a j - j ξ j - ( k 0 ) ξ ^ j ( k 0 ) ξ ^ j ( k 0 + 1 ) = ξ ^ ˙ j ( k 0 + 1 ) Δ t | k 0 k 0 + 1 + ξ ^ j ( k 0 ) + λ j a
The attack signal against the jth TC-DG persists at each sampling moment, so the active power ratio of the jth TC-DG is updated according to Equation (8) at any moment from moment k0 forward.
The persistent nature of attack signals ensures continuous ratio updates according to Equation (8). For child DGs of the jth TC-DG, the visualized active power ratio becomes:
ξ ^ ˙ j + ( k 0 + 1 ) = j Ω j a j j + ξ ^ j ( k 0 ) ξ j + ( k 0 ) ξ ^ j + ( k 0 + 1 ) = ξ ^ ˙ j + ( k 0 + 1 ) Δ t | k 0 k 0 + 1 + ξ j + ( k 0 )
where j+ represents the child CN identifier of the jth TC-CN in the communication topology.
The attack propagation mechanism is analytically revealed through Equations (7)–(9). The RI-DG active power ratio is initially altered at moment k0 + 1 when a TC-CN is compromised at moment k0. Cascading impacts propagate to the child DGs over subsequent time steps. And uncompromised TC-DGs maintain normal operations through Equation (8).
The hierarchical structure divides the DG cluster into nc levels, where attacks targeting the wth level require at least max(ncw, w − 1) time steps to affect all DGs. Crucially, the fundamental relationship between RI-DG active power ratio and cluster power deviation according to Equation (5) remains intact. After attack-induced deviations in the TC-DG’s active power ratio, provided that the aggregate power disturbance does not exceed the regulation capacity of the RI-DG, the following is shown:
ε k = k 0 e ( k ) < min ξ * , 1 ξ *
where e ( k ) is the active power output deviation of the cluster at moment k, e ( k ) = P out ( k ) P ref , and min ξ * , 1 ξ * is the upper limit of RI-DG’s regulating capacity.
Combining Equations (5), (6), (8), and (9) gives the following active power ratio steady-state deviation of the jth TC-DG:
Δ ξ ^ j , ss = λ j a Δ t a j j + ε λ j a P D G j , max ( 1 ε ) ( w 1 )
where Δ ξ ^ j , ss is active power ratio steady-state deviation of the jth TC-DG, Δ ξ ^ j , ss = lim k ξ ^ j ( k ) ξ * , and Δ t is the time interval between two neighboring sampling moments of the discrete control system.
Combining Equations (10) and (11) yields a sufficient condition for the attack signal to achieve latency:
λ j a < Δ t a j j min ξ * , 1 ξ * 1 ε P D G j , max ( 1 ε ) ( w 1 )
Despite attack-induced active power ratio shifts, convergence is still achieved due to the attack signal through the negative feedback regulation of the RI-DG in Equation (5) and the active power ratio tracking principle of the TC-DGs in Equation (6) as long as Equation (12) holds true. The sustained fulfillment of Equations (1) and (4) confirms the latent attack characteristics.

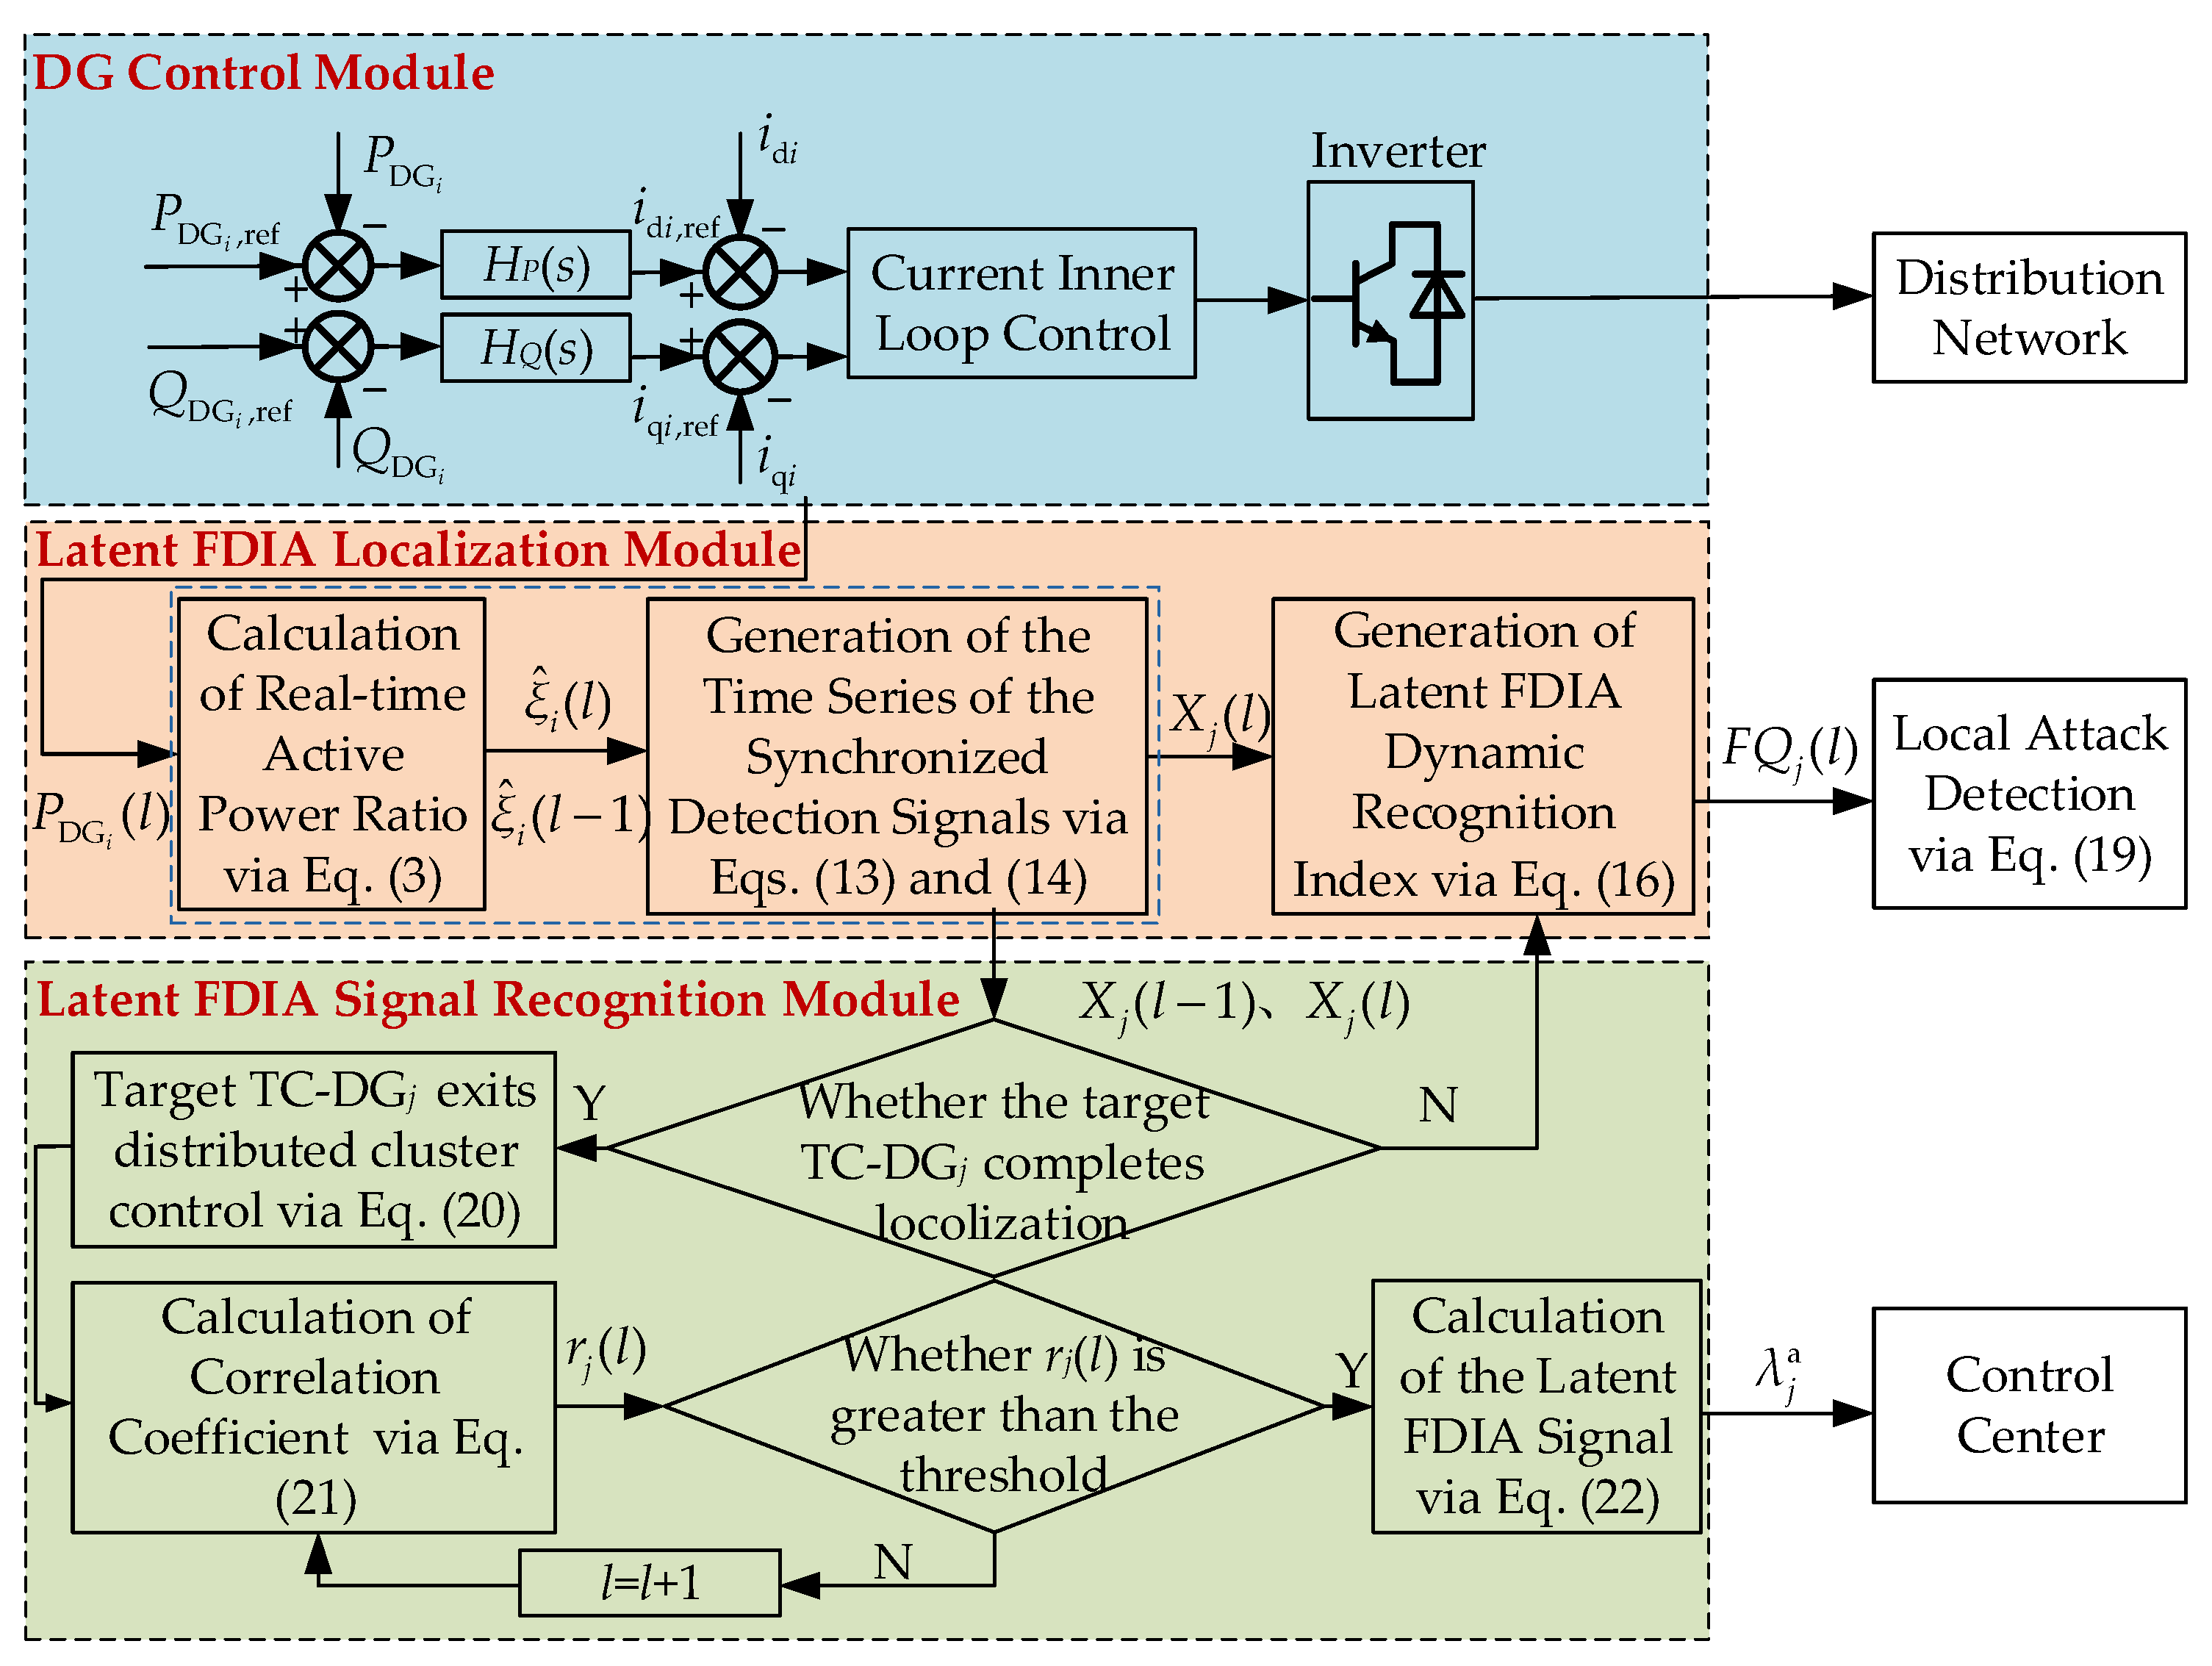
4. Latent False Data Injection Attack Recognition Method for Distributed Cluster Control of Distribution Network

4.1. Localization Methodology for Latent False Data Injection Attack

A synchronous detection signal-based localization methodology is proposed for latent FDIAs in distribution networks containing DGs under distributed cluster control, leveraging the attack’s persistent signal injection characteristics. The methodology consists of two sequential phases: synchronized detection signal generation and dynamic latent attack identification. Synchronized detection signals are generated in real-time using operational measurement data, followed by latent attack recognition index computation through a time-series analysis of these signals by TC-DGs.
The technical foundation lies in the behavioral divergence between attacked and normal TC-DGs. When a latent FDIA occurs at moment k0, the compromised jth TC-DG exhibits persistent attack signal superposition in active power ratio updates, as formalized by the following:
x j ( k ) = ξ ^ j ( k ) ξ ^ j ( k 1 ) j Ω j a j j ξ ^ j ( k 1 ) ξ ^ j ( k 1 ) Δ t | k 1 k
where x j ( k ) is the synchronized detection signal generated by the jth TC-DG at moment k. This signal remains non-zero for all time steps from moment k0 onwards due to continuous attack influence, while uncompromised TC-DGs are maintained as x j ( k ) = 0 through Equation (9).
Practical implementation challenges arise from information disturbances such as communication delays and packet loss [31], which may induce false-positive detection signals in unaffected TC-DGs. To address this, transient disturbances are distinguished from persistent attacks through dynamic time warping (DTW) distance analysis. Time series of synchronized detection signals are constructed as follows:
X j ( l ) = x j ( l m + 1 ) , x j ( l m + 2 ) , , x j ( l m + p ) , , x j ( l )
where X j ( l ) is the time series of the synchronized detection signal generated by the jth TC-DG at moment l, and x j ( l m + p ) is the pth element in the time series. The time-series length m is usually configured according to the following principle, where the synchronization detection signal computational window exceeds the maximum duration of the information interference:
m > m = F D 1 ( 1 α ) = ln α λ
where F D 1 ( ) is the inverse cumulative distribution function of D, D is the information disturbance duration, D is assumed to follow an exponential distribution with parameter λ, and its probability density function is f D ( d ) = λ e λ d [32]; 1 − α is the confidence level; and typical disturbances have λ 1 = 1.2 cycles [33]. Setting α = 0.05 yields a theoretical lower bound m , which is 3.6 cycles.
The DTW-based dynamic recognition index is formulated as follows:
F Q j ( l ) = α j d ( X j ( l ) , 0 )
where α j is an adjustment factor greater than zero, α j is set as m / m to maintain dimensional consistency between the index and its threshold while enabling a cross-comparison of recognition indices across multiple DGs within the cluster; and d ( X j ( l ) , 0 ) is the DTW distance between the time series of the synchronized detection signals and the zero series:
d ( X j ( l ) , 0 ) = min k = 1 N k b k
where the number of elements of both X j ( l ) and the zero series is m; N ( k ) is the number of sub-distance components in the DTW distance, which is between m and 2m − 1; and b k represents the distance between the pth element in the time series X j ( l ) and the qth element in the zero series, which is defined as follows:
b k = s p , q = x j ( l m + p ) 0
The subsequent term b k + 1 is derived from b k , which is obtained by selecting the minimum value from the set { s p , q + 1 , s p + 1 , q } . The starting and ending points of the DTW distance, b 1 and b N K , are initialized as s 1 , 1 and s m , m , respectively.
The DTW distance reflects the similarity of two synchronous detection signal time series. In the DTW distance, the two time series do not need to have the same length, so it is suitable for sequences that are not synchronized due to communication delays and packet loss [34]. A larger DTW distance indicates significant dissimilarity between the sequences, whereas a smaller value implies higher similarity. The latent FDIA dynamic recognition index, as formulated in Equation (16), exclusively computes the DTW distance between locally generated and stored synchronous detection signal time series of TC-DGs and a zero series. This design eliminates inter-node communication dependencies while enhancing computational efficiency to ensure real-time detection of the latent FDIA. Due to the persistent influence of attack signals, the dynamic recognition index of TC-DGs compromised by the latent FDIA consistently exceeds that of unaffected TC-DGs. Consequently, localization criteria are established through threshold comparisons:
F Q j ( l ) > K rel F Q th
where K rel is the reliability factor, and F Q th is the threshold value of the latent FDIA recognition index, which is calibrated from maximum disturbance-induced deviations during five-cycle simulations.
When the latent FDIA dynamic recognition index of the jth TC-DG satisfies Equation (19), it is determined that the jth TC-DG suffers from the latent FDIA, and the jth TC-CN generates a latent FDIA identifier γ j with the value of 1. Otherwise, the generated latent FDIA identifier is 0. The process of the localization method for the latent FDIA against distribution networks containing DGs under distributed cluster control is shown in Figure 3.
The active power ratio update rule for TC-DG is revised based on the localization result of the latent FDIA and discrepancies in the attack identifier, as follows:
ξ ˙ j ( k + 1 ) = h j j Ω j a j j g j j ξ j ( k ) ξ j ( k )
where h j is the latent FDIA recognition parameter of the jth TC-DG, h j = 1 γ j , and g j j is the coupling recognition parameter of the jth TC-DG with the parent DG, g j j = 1 γ j .
If the CPS of distribution networks containing DGs under distributed cluster control successfully identifies that the latent FDIA occurs in the jth TC-DG, then γ j = 1 , h j = 0 , and ξ ˙ j ( k + 1 ) = 0 , demonstrating that the jth TC-DG stops the co-tracking of the active power ratio of the parent DG. Meanwhile, the coupling recognition parameter g jj + of the jth TC-DG has a child DG equal to 0, demonstrating that the jth TC-DG cuts off the cluster communication connection with the child DG, and the active power ratios of the child DGs no longer track the active power ratio of the jth TC-DG.
The enhanced distributed cluster control strategy, as formulated in Equation (20), isolates the TC-DG compromised by the latent FDIA, thereby deactivating the affected TC-DG from the distributed cluster control. This isolation prevents the propagation of the latent FDIA signals injected into the compromised TC-DG within the DG cluster, enabling the system to operate with n − 1 DGs. If the child DGs that solely communicate with the target TC-DG exist, the differential term of the active power ratio for such child DGs becomes zero, resulting in the temporary deactivation from the cluster control. Upon completing the mitigation of the attack signal, the attack identifier of the target TC-DG is reset to zero, allowing both the target TC-DG and the child DGs to rejoin the distributed cluster control.

4.2. Recognition Method for Latent False Data Injection Attack Signal
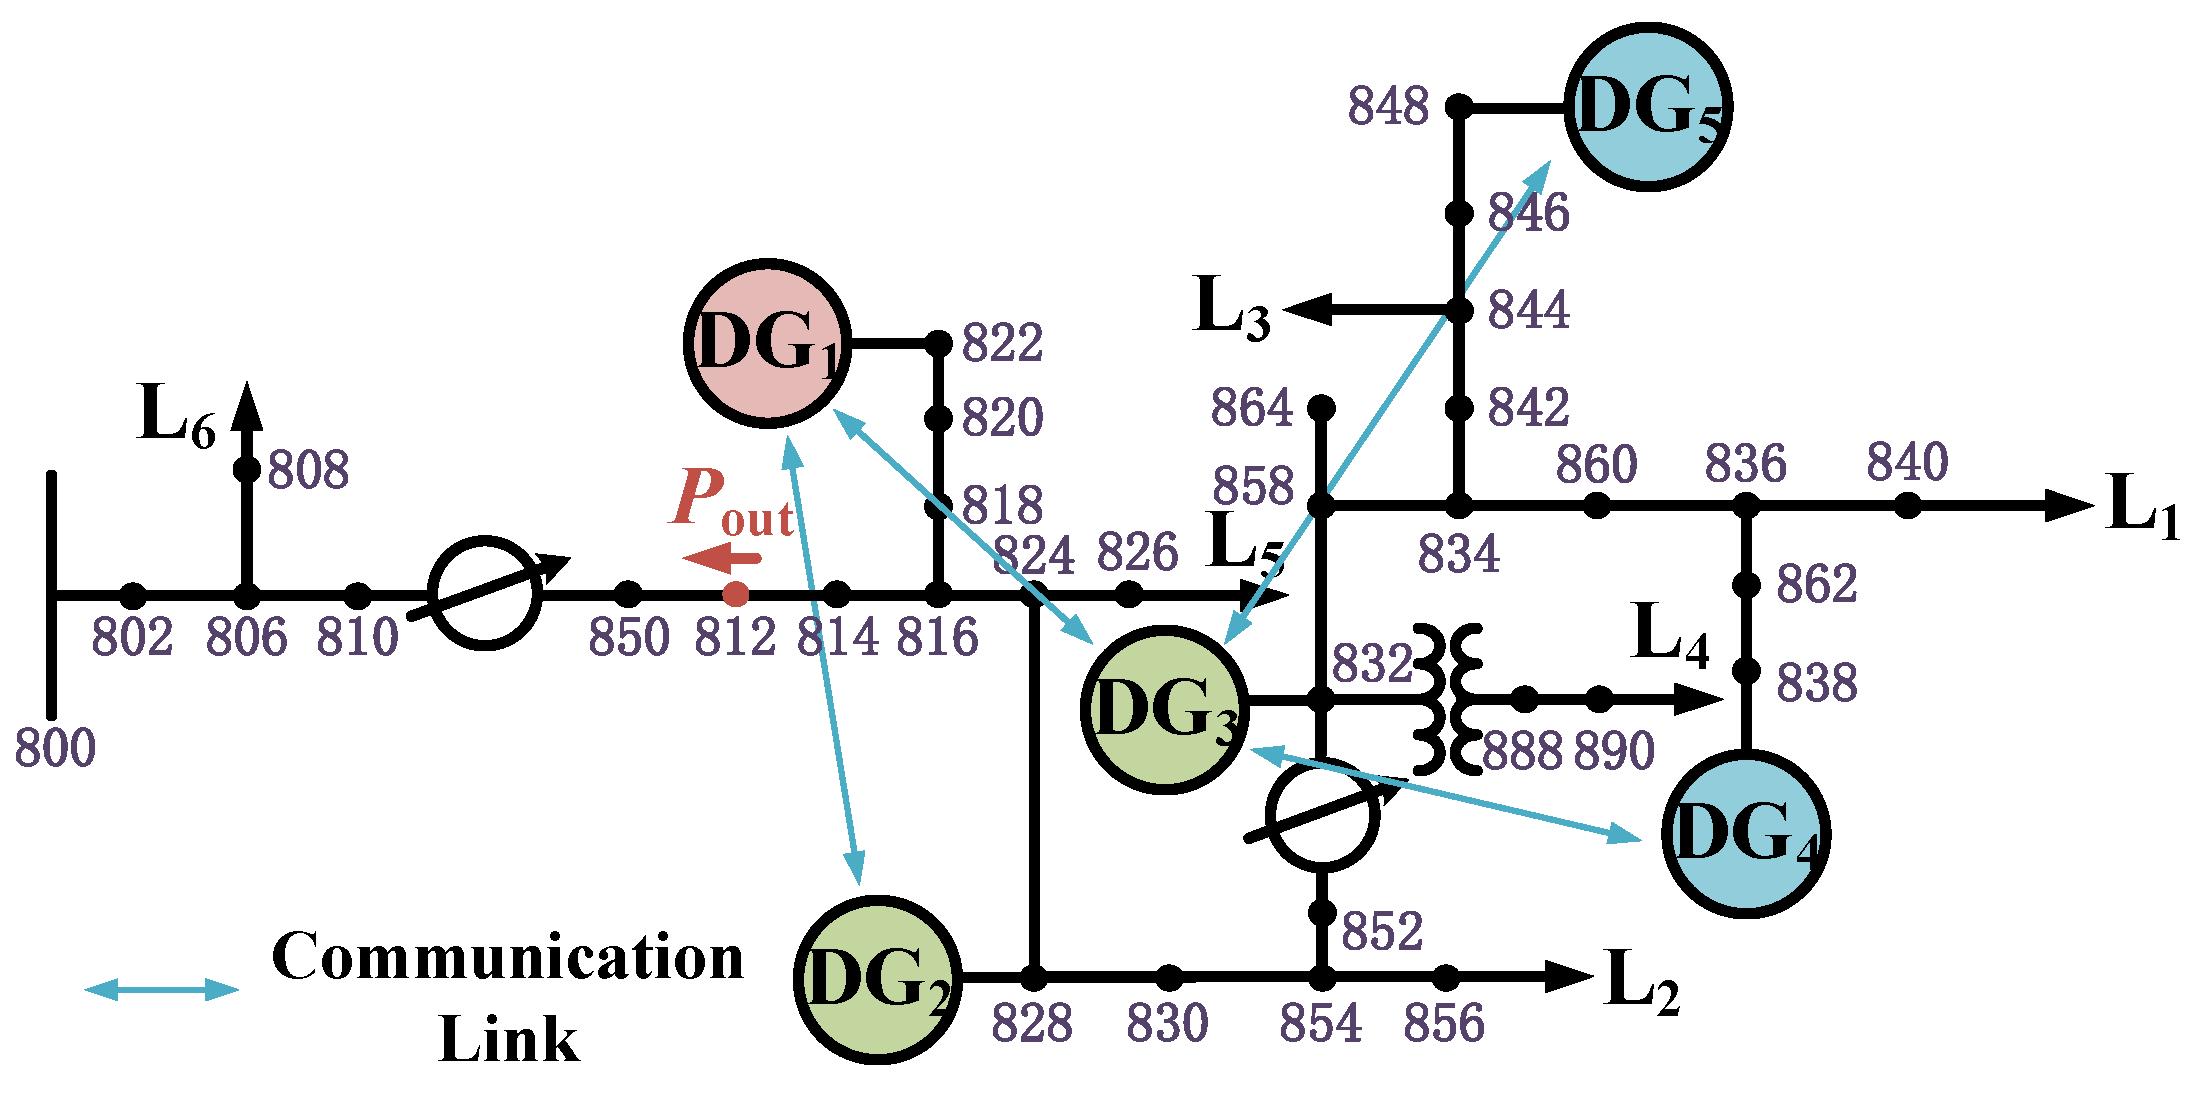
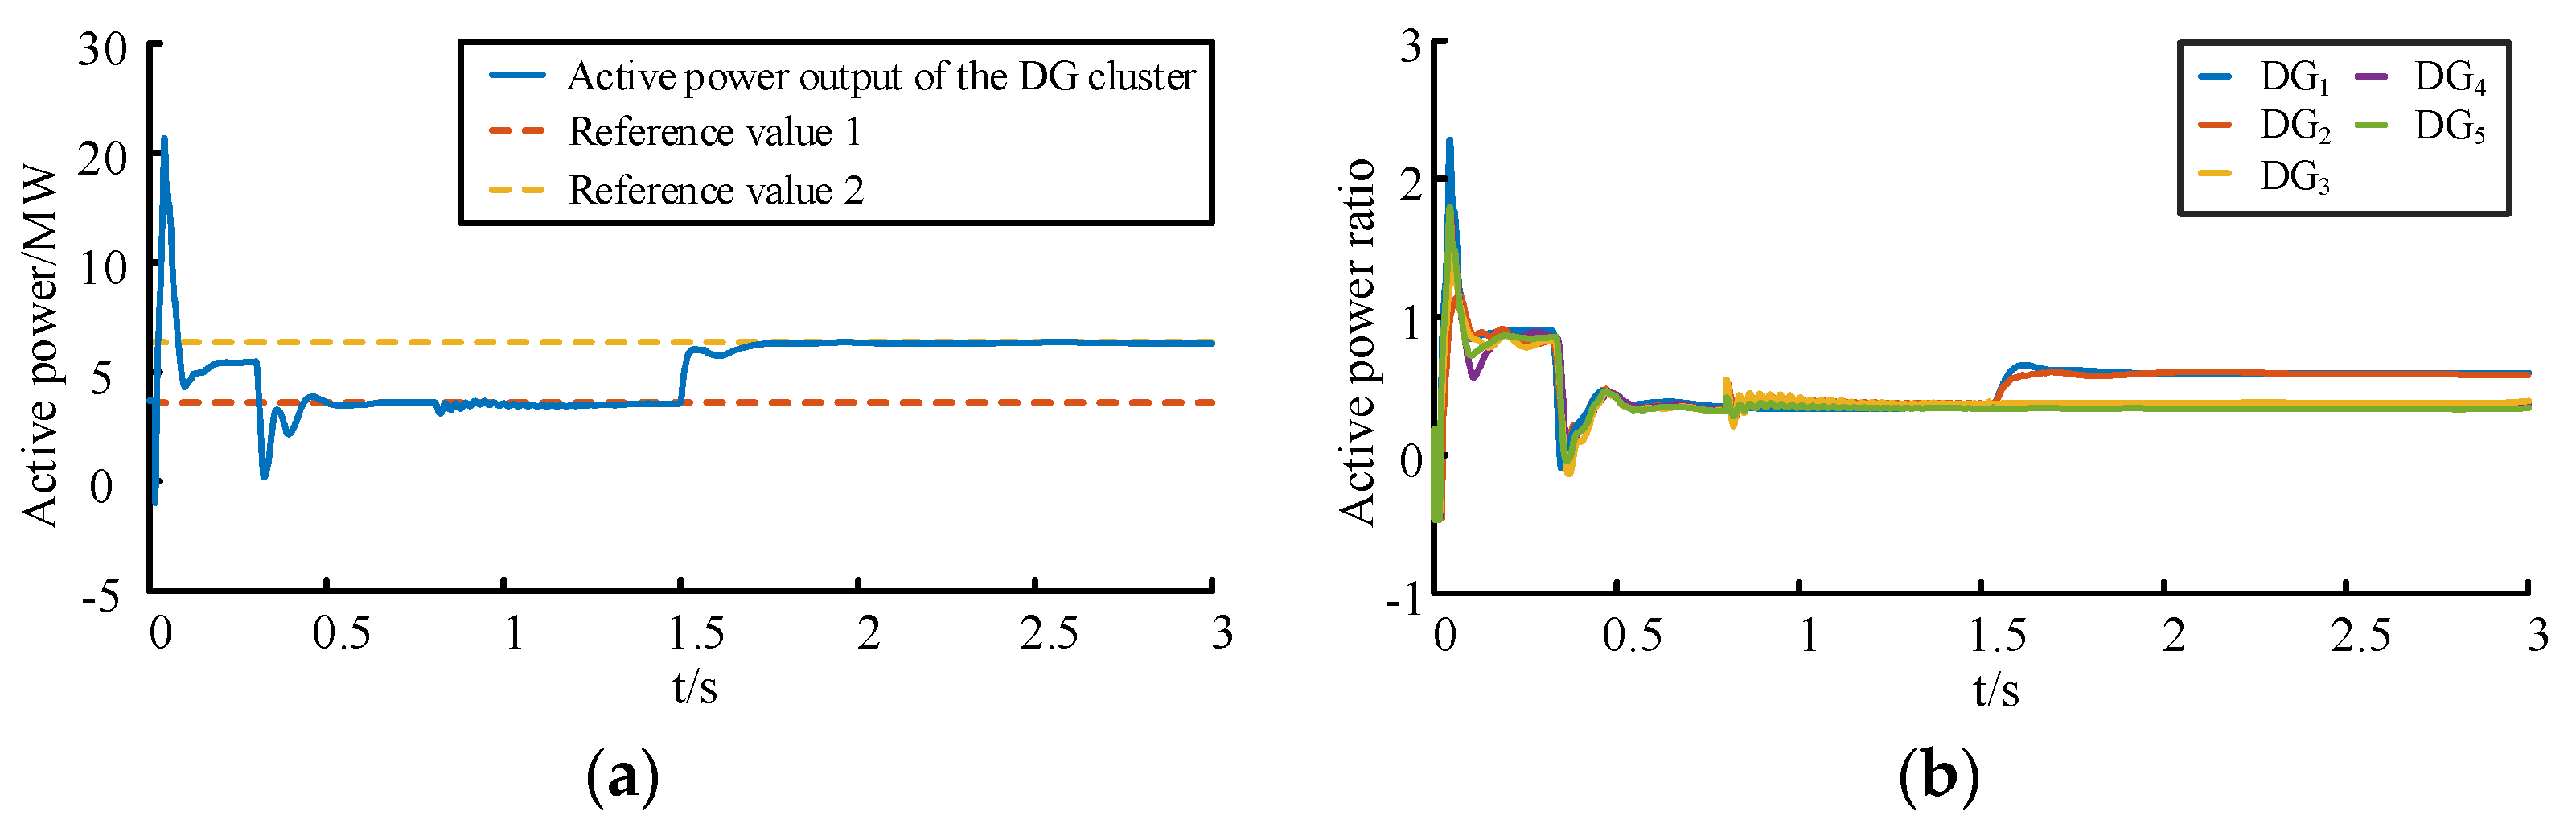
Based on the latent FDIA process in distribution networks containing DGs under distributed cluster control, this paper proposes a latent FDIA signal recognition method. After successfully locating and isolating the TC-DG following the latent FDIA, the correlation coefficient of the time series of continuous synchronous detection signals is used to compute the latent FDIA signal and upload it to the distribution network control center. It could make it easy for the manager to eliminate the potential hazards in the system by deploying the defense resources and preventing attackers from continuing to launch the disruptive FDIA based on the latent FDIA signal in order to disrupt the normal operation of distribution networks. If the latent FDIA occurs at moment k, after locating the latent FDIA, the time-series correlation coefficient of the synchronized detection signal generated by the target TC-DG at any two consecutive moments from moment k onwards is computed as follows:
r j ( l ) = p = 1 m x l 1 , j ( p ) x l , j ( p ) p = 1 m x l 1 , j 2 ( p ) p = 1 m x l , j 2 ( p )
where r j ( l ) is the correlation coefficient between l − 1 and l moments, which is between 0 and 1, and x l 1 , j ( p ) and x l , j ( p ) are elements in the time series of synchronized detection signals of TC-DGj at moments l − 1 and l.
The correlation coefficient of TC-CNj at moments l − 1 and l represents the degree of similarity of the time series X j ( l 1 ) and X j ( l ) . The closer the value of r j is to 1, the higher the correlation between the two time series. The time series of the synchronized detection signals generated by TC-CNj at moment l may have moments that do not follow the latent FDIA, demonstrating that X j ( l ) may contain zero elements. So, it is necessary to compute the correlation coefficients of the time series of TC-CNj at any two consecutive moments from moment k forward in order to obtain the time series that have all non-zero elements. Since this non-zero element is the synchronized detection signal under the latent FDIA, the latent FDIA signal can be computed by finding the average value of all non-zero elements in the time series.
The correlation coefficient r j ( l ) is compared with the threshold value r th , j to ensure that the elements in the time series X j ( l 1 ) and X j ( l ) are all non-zero elements. Based on the number of elements of the time series shown in Equation (14), the threshold value r th , j is determined based on the fact that X j ( l 1 ) contains m-1 non-zero elements while X j ( l ) consists entirely of non-zero elements. Only when r j ( l ) is greater than the threshold value are X j ( l 1 ) and X j ( l ) judged to be highly similar; at this time, all elements in X j ( l 1 ) and X j ( l ) are greater than zero, which can be used to compute the latent FDIA signal. If r j ( l ) is less than the threshold value, it is iterated to the next moment, the active power ratio at moment l + 1 is acquired, and the synchronized detection signal of the target TC-DGj is computed. Then, the time series X j ( l + 1 ) is updated, the correlation coefficient r j ( l + 1 ) between X j ( l ) and X j ( l + 1 ) is computed, and comparisons with the threshold value are continually made. The process is repeated until the correlation coefficient is greater than the threshold.
When r j ( l ) is greater than the threshold, the latent FDIA signal acting on the target TC-DGj can be obtained based on the non-zero element being the latent FDIA signal:
λ j a = 1 2 m p = 1 m x l 1 , j ( p ) + p = 1 m x l , j ( p )
The block diagram of the dynamic recognition for the latent FDIA is shown in Figure 4, which mainly includes the DG control module, the latent FDIA localization module, and the latent FDIA signal recognition module. The latent FDIA localization module incorporates synchronous detection signal generation and dynamic recognition index generation. Active power output data acquired from the DG controller are injected into this module, where the output power ratios of individual DGs are calculated in real time via Equation (3). Subsequently, the output power ratios of TC-DGs and their parent DGs are combined to generate synchronized detection signals through Equation (13). Following this, the time series of synchronized detection signals is constructed using Equation (14), and the latent FDIA dynamic recognition index is derived via Equation (16), enabling attack localization through Equation (19).
The latent FDIA signal recognition module comprises correlation coefficient computation, threshold discrimination, and attack signal calculation. Upon successful localization of the compromised TC-DG, the latent FDIA signal recognition protocol is activated. The targeted DGj disengages from distributed cluster control based on Equation (20) and computes the correlation coefficient using synchronized detection signal time series from two consecutive time steps via Equation (21). If the correlation coefficient exceeds the predefined threshold, the attack signal is calculated through Equation (22) and transmitted to the distribution network control center. Otherwise, the computation iterates with updated time-step data until the threshold condition is satisfied.
After acquiring the attack signal, the distribution network control center initiates defensive measures such as injecting suppression signals or switching to backup sensor data streams [35].

5. Case Study

The effectiveness of the proposed latent FDIA dynamic recognition method is validated through an IEEE 34-node test system implemented in MATLAB/Simulink R2022b. As illustrated in Figure 5, DGs are integrated at nodes 822, 828, 832, 838, and 848, adopting a distributed cluster control strategy. Active power output from the DG cluster to node 812 is centrally regulated through the control center. DG1 operates as the primary RI-DG with a 6 MW capacity, while DG2-3 and DG4-5 function as secondary and tertiary TC-DGs with 4 MW and 3 MW capacities, respectively. Constant power loads (0.6 MW each) are deployed with an RI-DG convergence coefficient of 0.1. The correlation coefficient threshold for synchronized detection signal time series is set at 0.99.
The cluster active power reference value is initially set to 3.5 MW, then modified to 6.5 MW at t = 1.5 s. An information disturbance of size 0.05 acts on DG4 at t = 0.6 s, with a disturbance period of five cycles. A persistent latent FDIA signal (amplitude = 0.2, which is satisfied with Equation (12)) is injected into the active power ratio of DG3 at t = 0.8 s. Figure 6 demonstrates normal operational characteristics: the cluster tracks the 3.5 MW reference by t = 0.51 s with all DG active power ratios converging to 0.325. Subsequent reference value switching to 6.5 MW triggers rapid retracking, achieving renewed convergence at 0.475. These results confirm that the control objectives in Equations (1) and (4) remain unaffected by reference value changes.
Information disturbance and attack impacts are analyzed in Figure 7. The information disturbance causes fluctuations in the cluster active power output and the active power ratio of each DG at t = 0.6 s, but the effect of the fluctuations caused by the information disturbance is also suppressed when it ends. Cluster active power fluctuations occur at t = 0.8 s following attack initiation, with final tracking achieved at t = 1.15 s (3.5 MW) and t = 2.04 s (6.5 MW). The active power ratio of DG3 exhibits 0.2 deviation at t = 0.8 s, propagating to other DGs as per Equations (7)–(9). Despite these transients, all ratios ultimately reconverge, confirming the non-disruptive nature of the latent attack. From Figure 7, it can be seen that the active power fluctuations caused by both latent attack and information disturbance can be suppressed by the synergistic mechanism shown in Equations (5) and (6), thus realizing the control objectives shown in Equations (1) and (4).
Further, comparative experiments are conducted using the latent FDIA dynamic recognition method proposed in this paper and the traditional residual constraint-based bad data detection method [36], and the simulation results are shown in Figure 8, respectively. In the method proposed in this paper, the detection mechanism employs a 12-element time series (m = 12) with an adjustment factor of α j = 0.3. Thresholds are calibrated using a maximum index from five-cycle disturbance simulations set at F Q th = 1.5. As shown in Figure 8a, pre-attack indices, including the duration of the information disturbance, remain reliably below thresholds. Post-attack DG3 indices persistently exceed thresholds despite reference switching-induced fluctuations at t = 1.5 s, demonstrating method robustness. In the residual detection method, the nodal active and reactive power injection vectors, as well as branch active power and reactive power vectors of the distribution network, are used as measurement vectors, while the voltage magnitude and phase angle of each node are used as state vectors. The two parameters of the measurement residual of six physical quantities, such as 822, 828, 832, 838, and 848 nodal active powers and 812-850 branch active powers, are calculated and judged whether they are out of bounds or not in order to recognize the occurrence of latent FDIAs. The detection threshold is determined as 3 based on the general false detection probability [7]. As shown in Figure 8b, the residuals are shown as a red solid line, and the residual fluctuation caused by the information disturbance acting on DG4 at t = 0.6 s and the latent attack signal acting on DG3 at t = 0.8 s cannot lead to the residual result overstepping the limit, which indicates that the detection of undesirable data of the distribution network based on the fixed residual constraints cannot identify the occurrence of the latent FDIA effectively. Combined with Figure 8a and Figure 8b, compared with the residual detection method, the proposed method in this paper can effectively recognize the occurrence of latent FDIAs and can distinguish between latent FDIAs and information disturbance with high recognition reliability.
Based on Equation (20), to improve the active power ratio update rule of each TC-DG at t = 1.5 s, DG3, DG4, and DG5 adjust active power ratios according to the results of localization. The active power output of the DG cluster and the active power ratio of each DG in the cluster are shown in Figure 9.
Attack isolation is implemented at t = 1.2 s through Equation (20). Figure 9 shows DG3-5 being deactivated from cluster control, freezing their power ratios at 3.25 MW. DG1-2 maintain normal operation, achieving 6.5 MW tracking by t = 1.89 s with a converged ratio of 0.625. This confirms effective attack containment without compromising overall control objectives.
Final validation computes attack signal magnitude through Equations (20) and (21). As shown in Table 1, the correlation coefficient between DG3’s 10th and 11th post-attack samples is 0.9901, which exceeds the 0.99 threshold. The computed attack signal magnitude (0.1977) shows minimal error (0.0023) from the actual injection (0.2), demonstrating high detection accuracy.

6. Conclusions

This study addresses the critical challenges of high concealment and severe threat potential posed by latent FDIAs targeting CPSs in distribution networks containing DGs under distributed cluster control. Through the establishment of a latent FDIA model for distribution networks containing DGs, three core research questions are systematically addressed:
(1) Mechanism of Attack Concealment: By analyzing the dynamic propagation process of latent FDIAs within the CPS of distribution networks containing DGs, this work reveals the cyber–physical coupling paths through which attack signals achieve covert infiltration via distributed cluster control architectures.
(2) Dynamic Discrimination Between Latent Attacks and Information Disturbances: Through quantitative analysis of physical-layer characteristic discrepancies, a synchronized detection signal model and a dynamic attack recognition model are established, demonstrating the proposed method’s capability to accurately identify latent attacks in distributed cluster control systems.
(3) Proactive Defense Requirements Against Latent Attacks: Experimental validation of attack localization and signal characterization accuracy confirms that the proposed method enables precise recognition of compromised DG and specific attack signals, providing reliable decision-making support for cluster operators to implement targeted defense measures.
The contributions of this research offer novel insights into eliminating potential security vulnerabilities in distributed control architectures. The established “modeling–identification–defense” technical framework effectively prevents latent attack signals from undermining the secure and stable operation of CPS.

Author Contributions

Conceptualization, J.O., Y.C., F.H. and Y.D.; methodology, J.O., Y.C. and F.H.; software, F.H. and Y.D.; validation, F.H.; formal analysis, J.O. and Y.C.; investigation, Y.C. and F.H.; resources, J.O. and Y.C.; data curation, Y.C. and F.H.; writing—original draft preparation, Y.C. and F.H.; writing—review and editing, J.O., Y.C., F.H. and Y.D.; visualization, F.H. and Y.D.; supervision, J.O. All authors have read and agreed to the published version of the manuscript.

Funding

This research was funded by the Science and Technology Project of State Grid Chongqing Electric Power Company, grant number SGCQDK00SBJS2310192.

Institutional Review Board Statement

Not applicable.

Informed Consent Statement

Not applicable.

Data Availability Statement

The data used to support the findings of this study are available from the corresponding author upon request.

Conflicts of Interest

The authors declare no conflicts of interest.

References

  1. Zhang, C.; Li, J.; Zhang, Y.; Xu, Z. Optimal Location Planning of Renewable Distributed Generation Units in Distribution Networks: An Analytical Approach. IEEE Trans. Power Syst. 2018, 33, 2742–2753. [Google Scholar] [CrossRef]
  2. Ouyang, J.; Chen, J.; Yuan, Y.; Xu, S. Loop-closing voltage fluctuation suppression method of distribution network based on active control of distributed generators. Electr. Power Autom. Equip. 2024, 44, 49–56. [Google Scholar]
  3. Lin, D.; Liu, Q.; Zeng, G.; Wang, Z.; Yu, T. Refined Modeling and Evaluation of Reliability for Cyber-Physical System of Distribution Network. Autom. Electr. Power Syst. 2021, 45, 92–101. [Google Scholar]
  4. Zhu, B.; Guo, Y.; Guo, C.; Jiang, Z.; Zhang, X.; Yuan, X. A survey of the security assessment and security defense of a cyber physical power system under cyber failure threat. Power Syst. Prot. Control. 2021, 49, 178–187. [Google Scholar]
  5. Ouyang, J.; Yu, J.; Long, X.; Diao, Y.; Wang, J. Coordination Control Method to Block Cascading Failure of a Renewable Generation Power System Under Line Dynamic Security. Prot. Control. Mod. Power Syst. 2023, 8, 12. [Google Scholar] [CrossRef]
  6. Luo, A.; Xu, Q.; Ma, F.; Chen, Y. Overview of power quality analysis and control technology for the smart grid. J. Mod. Power Syst. Clean Energy 2016, 4, 1–9. [Google Scholar] [CrossRef]
  7. Wei, S.; Xu, J.; Wu, Z.; Cheng, Y.; Hu, M. False Data Injection Attack Method Against State Estimation of Three-phase Unbalanced Distribution Network. High Volt. Eng. 2021, 47, 2367–2376. [Google Scholar]
  8. Nguyen, D.; Shen, Y.; Thai, M. Detecting Critical Nodes in Interdependent Power Networks for Vulnerability Assessment. IEEE Trans. Smart Grid 2013, 4, 151–159. [Google Scholar] [CrossRef]
  9. Liu, N.; Zhang, J.; Zhang, H.; Liu, W. Security Assessment for Communication Networks of Power Control Systems Using Attack Graph and MCDM. IEEE Trans. Power Deliv. 2010, 25, 1492–1500. [Google Scholar] [CrossRef]
  10. Li, P.; Cao, Y.; Xin, H.; Dai, P. Discussion on cooperative control architecture of cyber-physical distribution network system. Electr. Power Autom. Equip. 2017, 37, 2–7+5. [Google Scholar]
  11. Xin, H.; Lu, Z.; Liu, Y.; Gan, D. A Center-Free Control Strategy for the Coordination of Multiple Photovoltaic Generators. IEEE Trans. Smart Grid 2014, 5, 1262–1269. [Google Scholar] [CrossRef]
  12. Kim, T.; Sugie, T. Cooperative control for target-capturing task based on a cyclic pursuit strategy. Automatica 2007, 43, 1426–1431. [Google Scholar] [CrossRef]
  13. Li, J.; Xu, S.; Chu, Y.; Wang, H. Distributed average consensus control in networks of agents using outdated states. Iet Control. Theory Appl. 2010, 4, 746–758. [Google Scholar] [CrossRef]
  14. Zhang, Y.; Ni, M.; Sun, Y.; Li, M. Quantitative Risk Assessment of Cyber-Physical System for Cyber attacks in Distribution Network. Autom. Electr. Power Syst. 2019, 43, 12–22+33. [Google Scholar]
  15. Yang, T.; Xu, Z.; Zhao, Y.; Zhai, F. Review on Research of Attack and Defense Methods for Digitalized New Power System. Autom. Electr. Power Syst. 2024, 48, 112–126. [Google Scholar]
  16. Wang, Q.; Li, M.; Tang, Y.; Ni, M. A Review on Research of Cyber attacks and Defense in Cyber Physical Power Systems Part One Modelling and Evaluation. Autom. Electr. Power Syst. 2019, 43, 9–21. [Google Scholar]
  17. Sahoo, S.; Mishra, S.; Peng, C.; Dragicevic, T. A stealth cyber attack detection strategy for DC microgrids. IEEE Trans. Power Electron. 2019, 34, 8162–8174. [Google Scholar] [CrossRef]
  18. Mohammadhassani, A.; Teymouri, A.; Mehrizi-Sani, A.; Tehrani, K. Performance Evaluation of an Inverter-Based Microgrid Under Cyberattack. In Proceedings of the 2020 IEEE 15th International Conference of System of Systems Engineering (SoSE), Budapest, Hungary, 2–4 June 2020; pp. 211–216. [Google Scholar]
  19. Diaba, Y.; Khah, S.; Elmusrati, M. Cyber-physical attack and the future energy systems: A review. Energy Rep. 2024, 12, 2914–2932. [Google Scholar] [CrossRef]
  20. Li, P.; Liu, Y.; Xin, H.; Qi, D. Vulnerability Assessment for Cyber Physical System of Distribution Network in Distributed Cooperative Control Mode. Autom. Electr. Power Syst. 2018, 42, 22–29+59. [Google Scholar]
  21. Yang, Y.; Liu, W.; Li, C.; Liu, G.; Zhang, S.; Zhang, Y. Review of FDIA Detection Methods for Electric Power SCADA System. Proc. CSEE 2023, 43, 8602–8622. [Google Scholar]
  22. Xi, L.; Dong, L.; Cheng, C.; Tian, X.; Li, Z. Location detection of a false data injection attack in a cyber-physical power system based on a hybrid chimp optimized extreme learning machine. Power Syst. Prot. Control. 2024, 52, 46–58. [Google Scholar]
  23. Su, S.; Wu, C.; Ma, J.; Zeng, X. Attacker’s Perspective Based Analysis on Cyber Attack Mode to Cyber-Physical System. Power Syst. Technol. 2014, 38, 3115–3120. [Google Scholar]
  24. Wang, D.; Huang, L.; Liu, J.; Lü, L.; Ruan, Z.; Lü, L. Cyber-physical system defense strategy considering loaded false data injection attacks. Power Syst. Prot. Control. 2019, 47, 28–34. [Google Scholar]
  25. Yang, J.; Guo, Y.; Guo, C.; Chen, Z.; Wang, S. A review of dynamic security protection on a cyber physical power system considering model and data driving. Power Syst. Prot. Control. 2022, 50, 176–187. [Google Scholar]
  26. Wu, W.; Zhang, B.; Sun, H.; Wang, B.; Yang, Y.; Liu, H.; Lin, C.; Wang, S. Energy Management and Distributed Energy Resources Cluster Control for Active Distribution Networks. Autom. Electr. Power Syst. 2020, 44, 111–118. [Google Scholar]
  27. Bidram, A.; Davoudi, A.; Lewis, F.; Guerrero, J. Distributed Cooperative Secondary Control of Microgrids Using Feedback Linearization. IEEE Trans. Power Syst. A Publ. Power Eng. Soc. 2013, 28, 3462–3470. [Google Scholar] [CrossRef]
  28. Shafiee, Q.; Guerrero, J.; Vasquez, J. Distributed Secondary Control for Islanded Microgrids—A Novel Approach. IEEE Trans. Power Electron. 2014, 29, 1018–1031. [Google Scholar] [CrossRef]
  29. Kokiopoulou, E.; Frossard, P. Polynomial filtering for fast convergence in distributed consensus. IEEE Trans. Signal Process. 2016, 7, 342–354. [Google Scholar] [CrossRef]
  30. Xu, Q.; Jiang, W.; Blaabjerg, F.; Zhang, C.; Zhang, X.; Ferando, T. Backstepping Control for Large Signal Stability of High Boost Ratio Interleaved Converter Interfaced DC Microgrids With Constant Power Loads. IEEE Trans. Power Electron. 2020, 35, 5397–5407. [Google Scholar] [CrossRef]
  31. Hu, Z.; Su, R.; Veerasamy, V.; Huang, L.; Ma, R. Resilient Frequency Regulation for Microgrids Under Phasor Measurement Unit Faults and Communication Intermittency. IEEE Trans. Ind. Inform. 2025, 21, 1941–1949. [Google Scholar] [CrossRef]
  32. Li, T.; Su, S.; Yang, H.; Wen, F.; Wang, D.; Zhu, L. Attacks and Cyber Security Defense in Cyber-physical Power System. Autom. Electr. Power Syst. 2017, 41, 162–167. [Google Scholar]
  33. Guo, S.; Zhao, Z.; Zhang, Q. Failure rate model for optical fiber cable in electric power communication network based on Weibull distribution function. Power Syst. Prot. Control. 2017, 45, 92–99. [Google Scholar]
  34. Li, P.; Gu, W.; Wang, L.; Xu, B.; Wu, M. Dynamic equivalent modeling of two-staged photovoltaic power station clusters based on dynamic affinity propagation clustering algorithm. Int. J. Electr. Power Energy Syst. 2018, 95, 463–475. [Google Scholar] [CrossRef]
  35. Wang, Q.; Tai, W.; Tang, Y.; Ni, M. A Review on False Data Injection Attack Toward Cyber-physical Power System. Acta Autom. Sin. 2019, 45, 72–83. [Google Scholar]
  36. Ruan, Z.; Lu, L.; Liu, Y.; Liu, J.; Wang, D.; Huang, L. Coordinated attack model of cyber-physical power system considering false load data injection. Electr. Power Autom. Equip. 2019, 39, 181–187. [Google Scholar]
Figure 1. CPS architecture for a distribution network containing DGs under distributed cluster control.
Electronics 14 01761 g001
Figure 2. Updating process of DG active power under distributed cluster control.
Electronics 14 01761 g002
Figure 3. Localization process of the latent FDIA for a distribution network containing DGs.
Electronics 14 01761 g003
Figure 4. The block diagram of dynamic recognition for latent FDIA.
Electronics 14 01761 g004
Figure 5. Simulation system.
Electronics 14 01761 g005
Figure 6. Characteristics of the DG cluster under normal operation: (a) active power output from the DG cluster; (b) active power ratio of each DG in the cluster.
Electronics 14 01761 g006
Figure 7. Characteristics of the DG cluster under information disturbance and latent FDIA: (a) active power output from the DG cluster; (b) active power ratio of each DG in the cluster.
Electronics 14 01761 g007
Figure 8. Simulation results of different latent FDIA recognition methods: (a) dynamic recognition index of the latent FDIA; (b) residual recognition index of the latent FDIA.
Electronics 14 01761 g008
Figure 9. Characteristics of the DG cluster after isolation of the latent FDIA signal: (a) active power output from the DG cluster; (b) active power ratio of each DG in the cluster.
Electronics 14 01761 g009
Table 1. Correlation coefficient of synchronous detection signal time series.
lr3 (l)lr3 (l)
10.707170.9354
20.816580.9428
30.866090.9487
40.8944100.9896
50.9129110.9901
60.9258120.9911
Disclaimer/Publisher’s Note: The statements, opinions and data contained in all publications are solely those of the individual author(s) and contributor(s) and not of MDPI and/or the editor(s). MDPI and/or the editor(s) disclaim responsibility for any injury to people or property resulting from any ideas, methods, instructions or products referred to in the content.

