Article

Design of an Experimental Test Rig for Shrouded and Open Rotors for Small Rotary Wing Unmanned Aerial System

by
Abdallah Dayhoum
*,
Alejandro Ramirez-Serrano
and
Robert J. Martinuzzi
Mechanical and Manufacturing Engineering, University of Calgary, 2500 University Drive NW, Calgary, AB T2N 1N4, Canada
*
Author to whom correspondence should be addressed.
Electronics 2025, 14(8), 1584; https://doi.org/10.3390/electronics14081584
Submission received: 28 February 2025 / Revised: 27 March 2025 / Accepted: 10 April 2025 / Published: 14 April 2025
(This article belongs to the Special Issue Recent Advances in Robotics and Automation Systems)

Abstract

:
This study details the design and testing of a custom test rig for evaluating the performance of both open and shrouded rotors. The rig includes a two-axis load cell that is directly connected to the rotor to measure the rotor thrust separated from the total thrust when testing shrouded rotors and ensure accurate torque measurements, independent of external structural influences. Moreover, a main load cell is used to measure the total thrust for both configurations (open and shrouded rotor), as it is connected to the entire setup. Rotor RPM is monitored by capturing the voltage frequency from the BLDC motor, controlled using a Pololu Maestro Controller through the electronic speed controller. A shunt resistance is used to calculate the current through the electric Brushless Direct Current (BLDC) motor and by measuring the voltage, the electric power is calculated. By combining both mechanical and electrical power measurements, the BLDC motor’s efficiency is calculated. Automated data collection is conducted using National Instruments DAQ systems, with averaged measurements of thrust, torque, RPM, current, and voltage. Two rotors are tested to obtain performance data for both open and shrouded configurations. Additionally, a computational study is carried out to account for the aerodynamic effects of the rig’s structural elements. Uncertainty analysis is employed to assess the reliability of the experimental results by quantifying the numerical errors associated with both random and systematic errors encountered during the rotor’s performance evaluation.

1. Introduction

The rapid development of small Unmanned Aerial Systems (UASs) has been significantly driven by rotary-wing configurations, which offer efficient hovering and Vertical Take-Off and Landing (VTOL) capabilities [1,2]. These unique features have made rotary-wing UASs essential for a wide range of applications, including imaging, package delivery, construction, and rescue operations [3]. Additionally, they play a critical role in fields such as disease control and precision agriculture, where tasks like crop monitoring require both maneuverability and precision [4,5].
Rotor performance evaluation is crucial across various applications in propulsion and energy production. Optimizing rotor design is key to improving efficiency and meeting specific operational needs, from unmanned aerial vehicles to large commercial aircrafts [6]. Continuous advancements in rotor technology play a significant role in the progress of aerospace engineering [7,8].
While large-scale shrouded rotor testing is associated with significant costs due to facility and instrumentation requirements, small-scale experimental validation remains feasible and cost effective. These experiments, while crucial for understanding the aerodynamic performance of shrouded rotors, were often designed for specific applications [9,10]. Several experimental studies have been conducted to evaluate the performance of shrouded propellers in more complex configurations, such as when integrated into wings or full aircraft systems [11,12,13,14].
Measuring the total thrust generated by shrouded rotors, as well as separating the contributions of the rotor and the shroud, is crucial for detailed aerodynamic analysis and performance evaluation [15,16]. However, many experimental setups have focused on measuring the total thrust of the shrouded rotor system as a whole, often by connecting the entire configuration to a force sensor. While this approach provides a straightforward measurement of the total thrust, it does not allow for the separation of the individual contributions of the rotor and the shroud [17,18,19,20,21,22]. This limitation restricts the ability to analyze the specific aerodynamic interactions and efficiencies of each component.
In addition to thrust measurement challenges, torque measurement in shrouded rotor systems is often complicated by the influence of the test rig structural elements, struts, or the shroud itself. This can introduce inaccuracies in torque readings due to the swirl in the airflow, which tends to reduce the measured torque values [17,20,21].
Some studies have opted to measure the electrical power input to the system rather than the mechanical power output. This is typically achieved by capturing the electric current and voltage of the Brushless Direct Current (BLDC) motors used to drive the rotors [19,22]. While this method provides an indirect measure of power consumption, it does not accurately account for losses due to mechanical inefficiencies or aerodynamic interactions, limiting its utility for comprehensive performance analysis.
This study builds upon and extends the authors’ previous analytical, computational, and parametric investigations of shrouded rotor systems. Analytical modeling efforts have provided a framework for predicting shrouded rotor performance with improved accuracy [23]. Optimization studies have explored the rotor design parameters that enhance shrouded rotor efficiency in hovering flight [24]. Computational analyses have examined rotor–shroud aerodynamic interactions, including the effects of novel dual-exit shroud configuration [25]. Additionally, experimental studies have investigated the impact of blade number on performance in both open and shrouded rotor configurations [26].
In contrast, this paper introduces key experimental methodologies and contributions. A primary focus is the design and instrumentation of the experimental rig used for the previous shrouded rotor testing. The test rig features a simple measurement system capable of evaluating the efficiency of Brushless DC (BLDC) motors, a critical factor in motor selection for UAV applications. Understanding motor efficiency in the context of shrouded rotors provides valuable insights for optimizing propulsion system performance.
Furthermore, the test rig is designed to measure rotor thrust and total thrust separately. This capability enables a more detailed analysis of the contributions of both the rotor and the shroud to overall aerodynamic performance. In addition to experimental measurements, computational analyses are conducted to assess the aerodynamic impact of the test rig itself. This ensures that the experimental results are not significantly influenced by unintended flow disturbances caused by the setup, which enables direct comparison with analytical results. An uncertainty analysis is also performed to quantify both random and systematic errors in the experimental measurements, enhancing the reliability of the collected data.

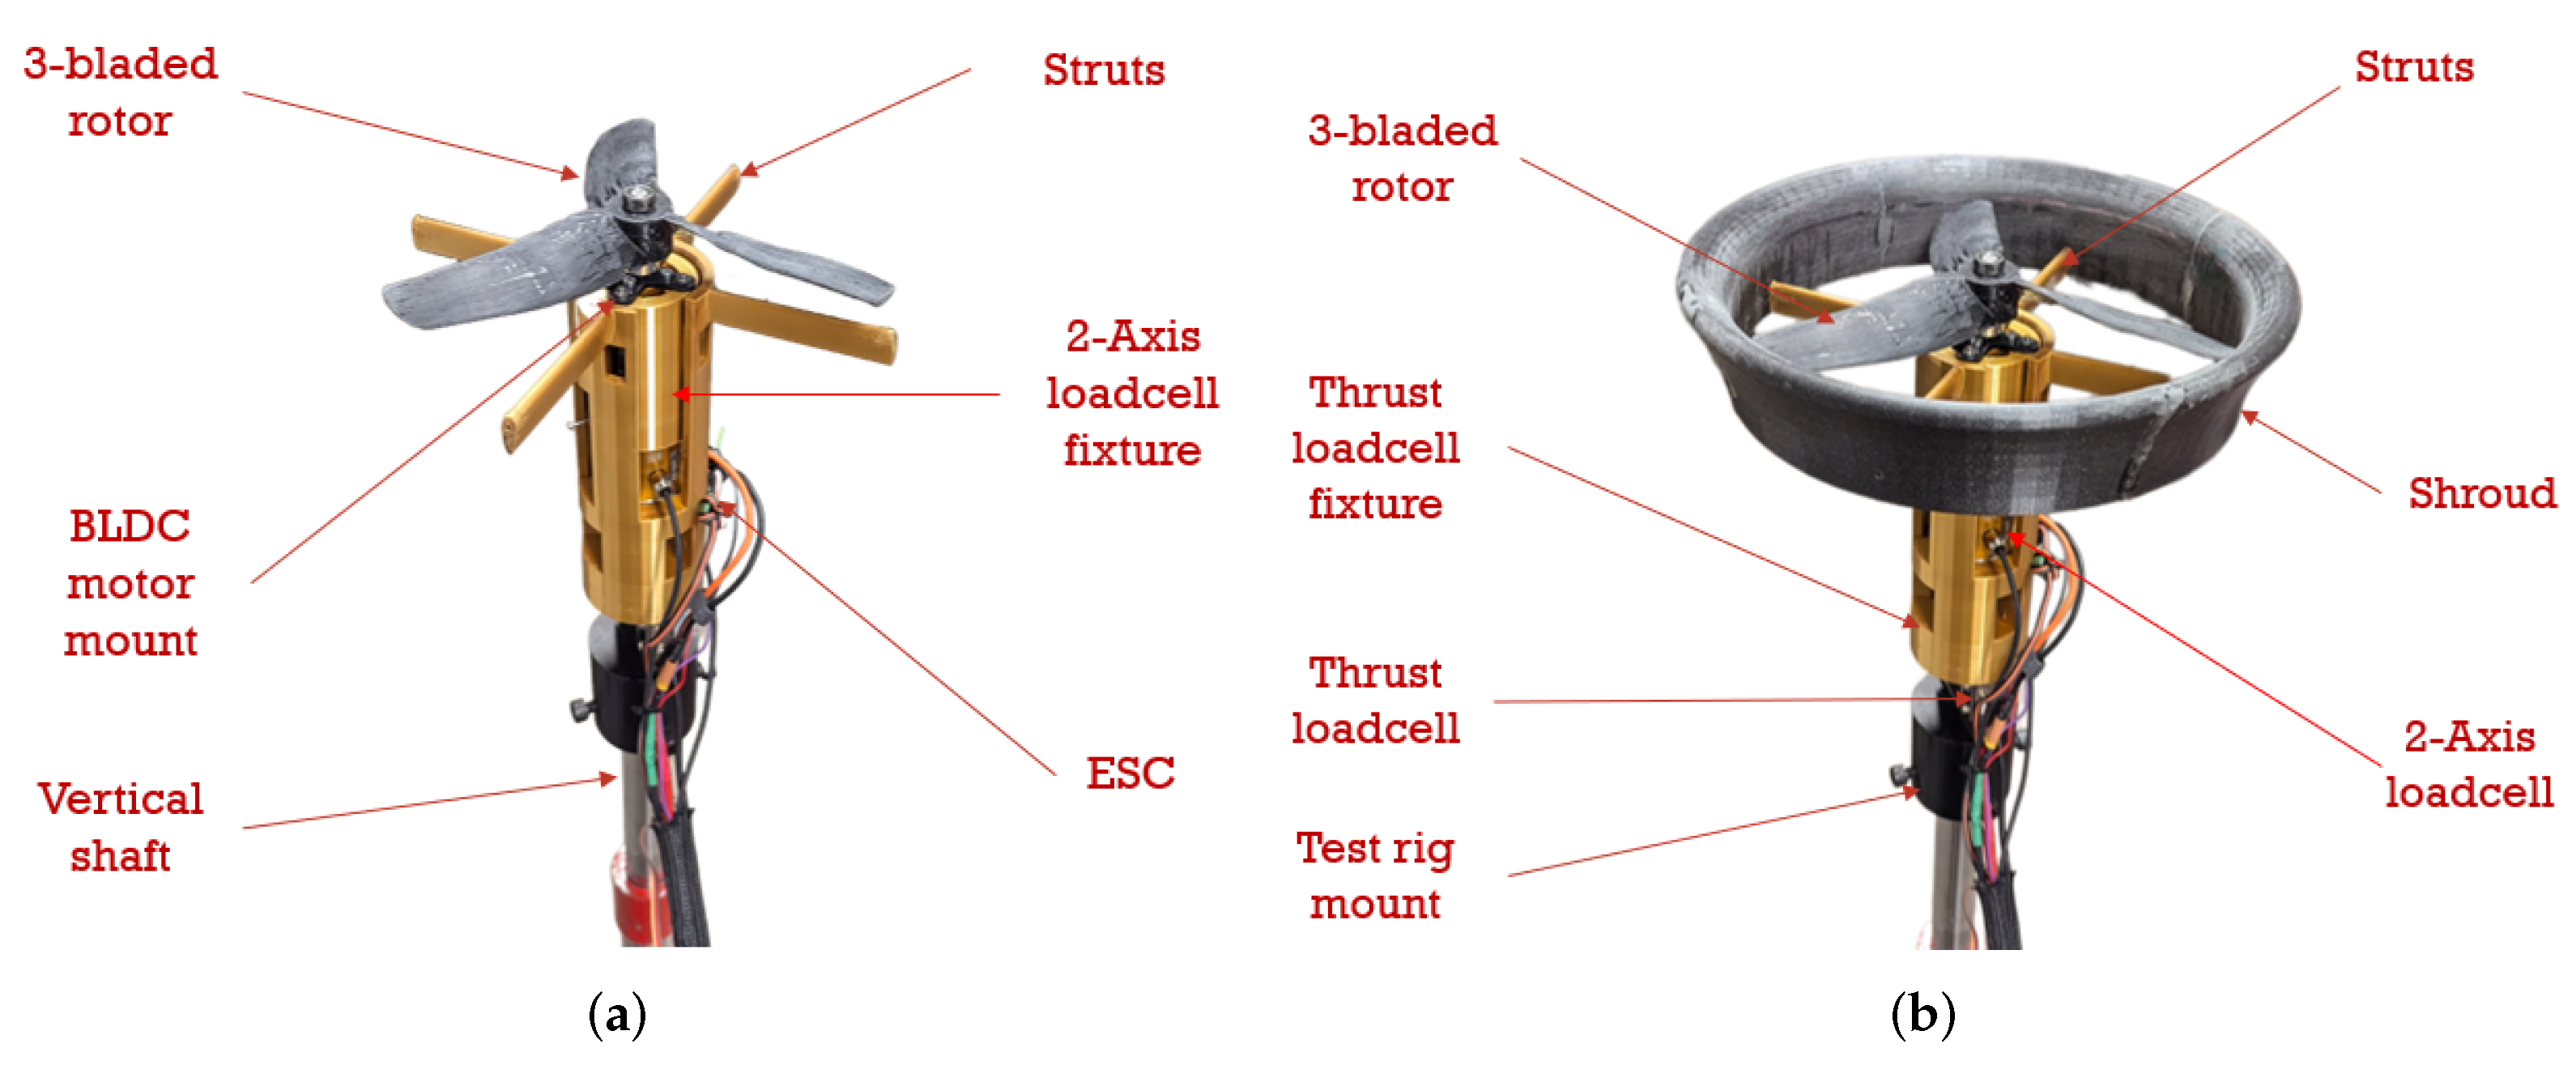
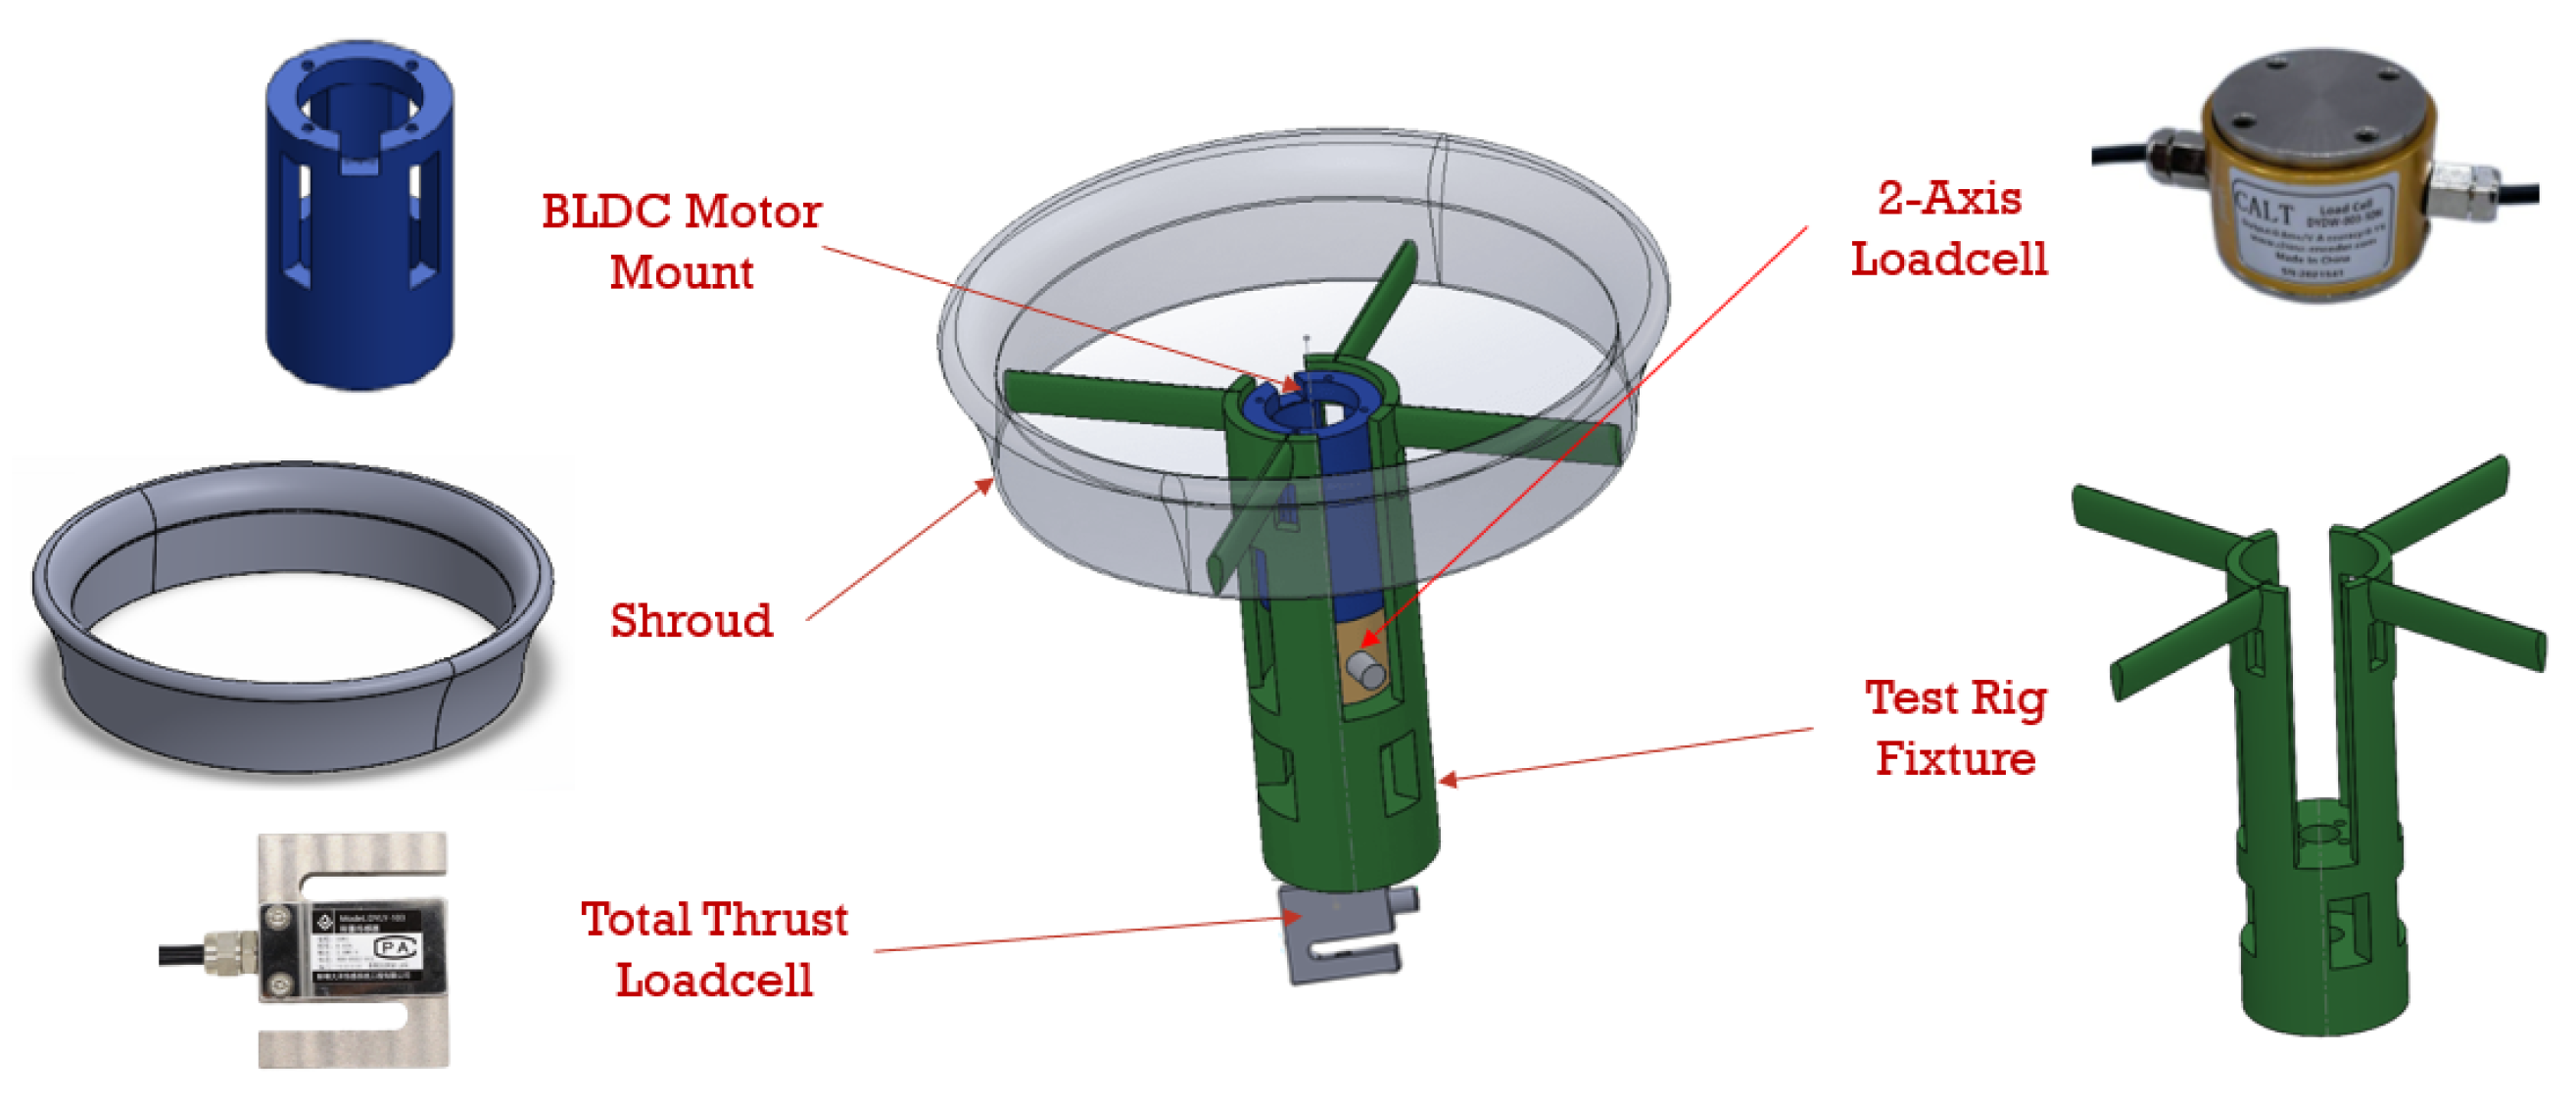
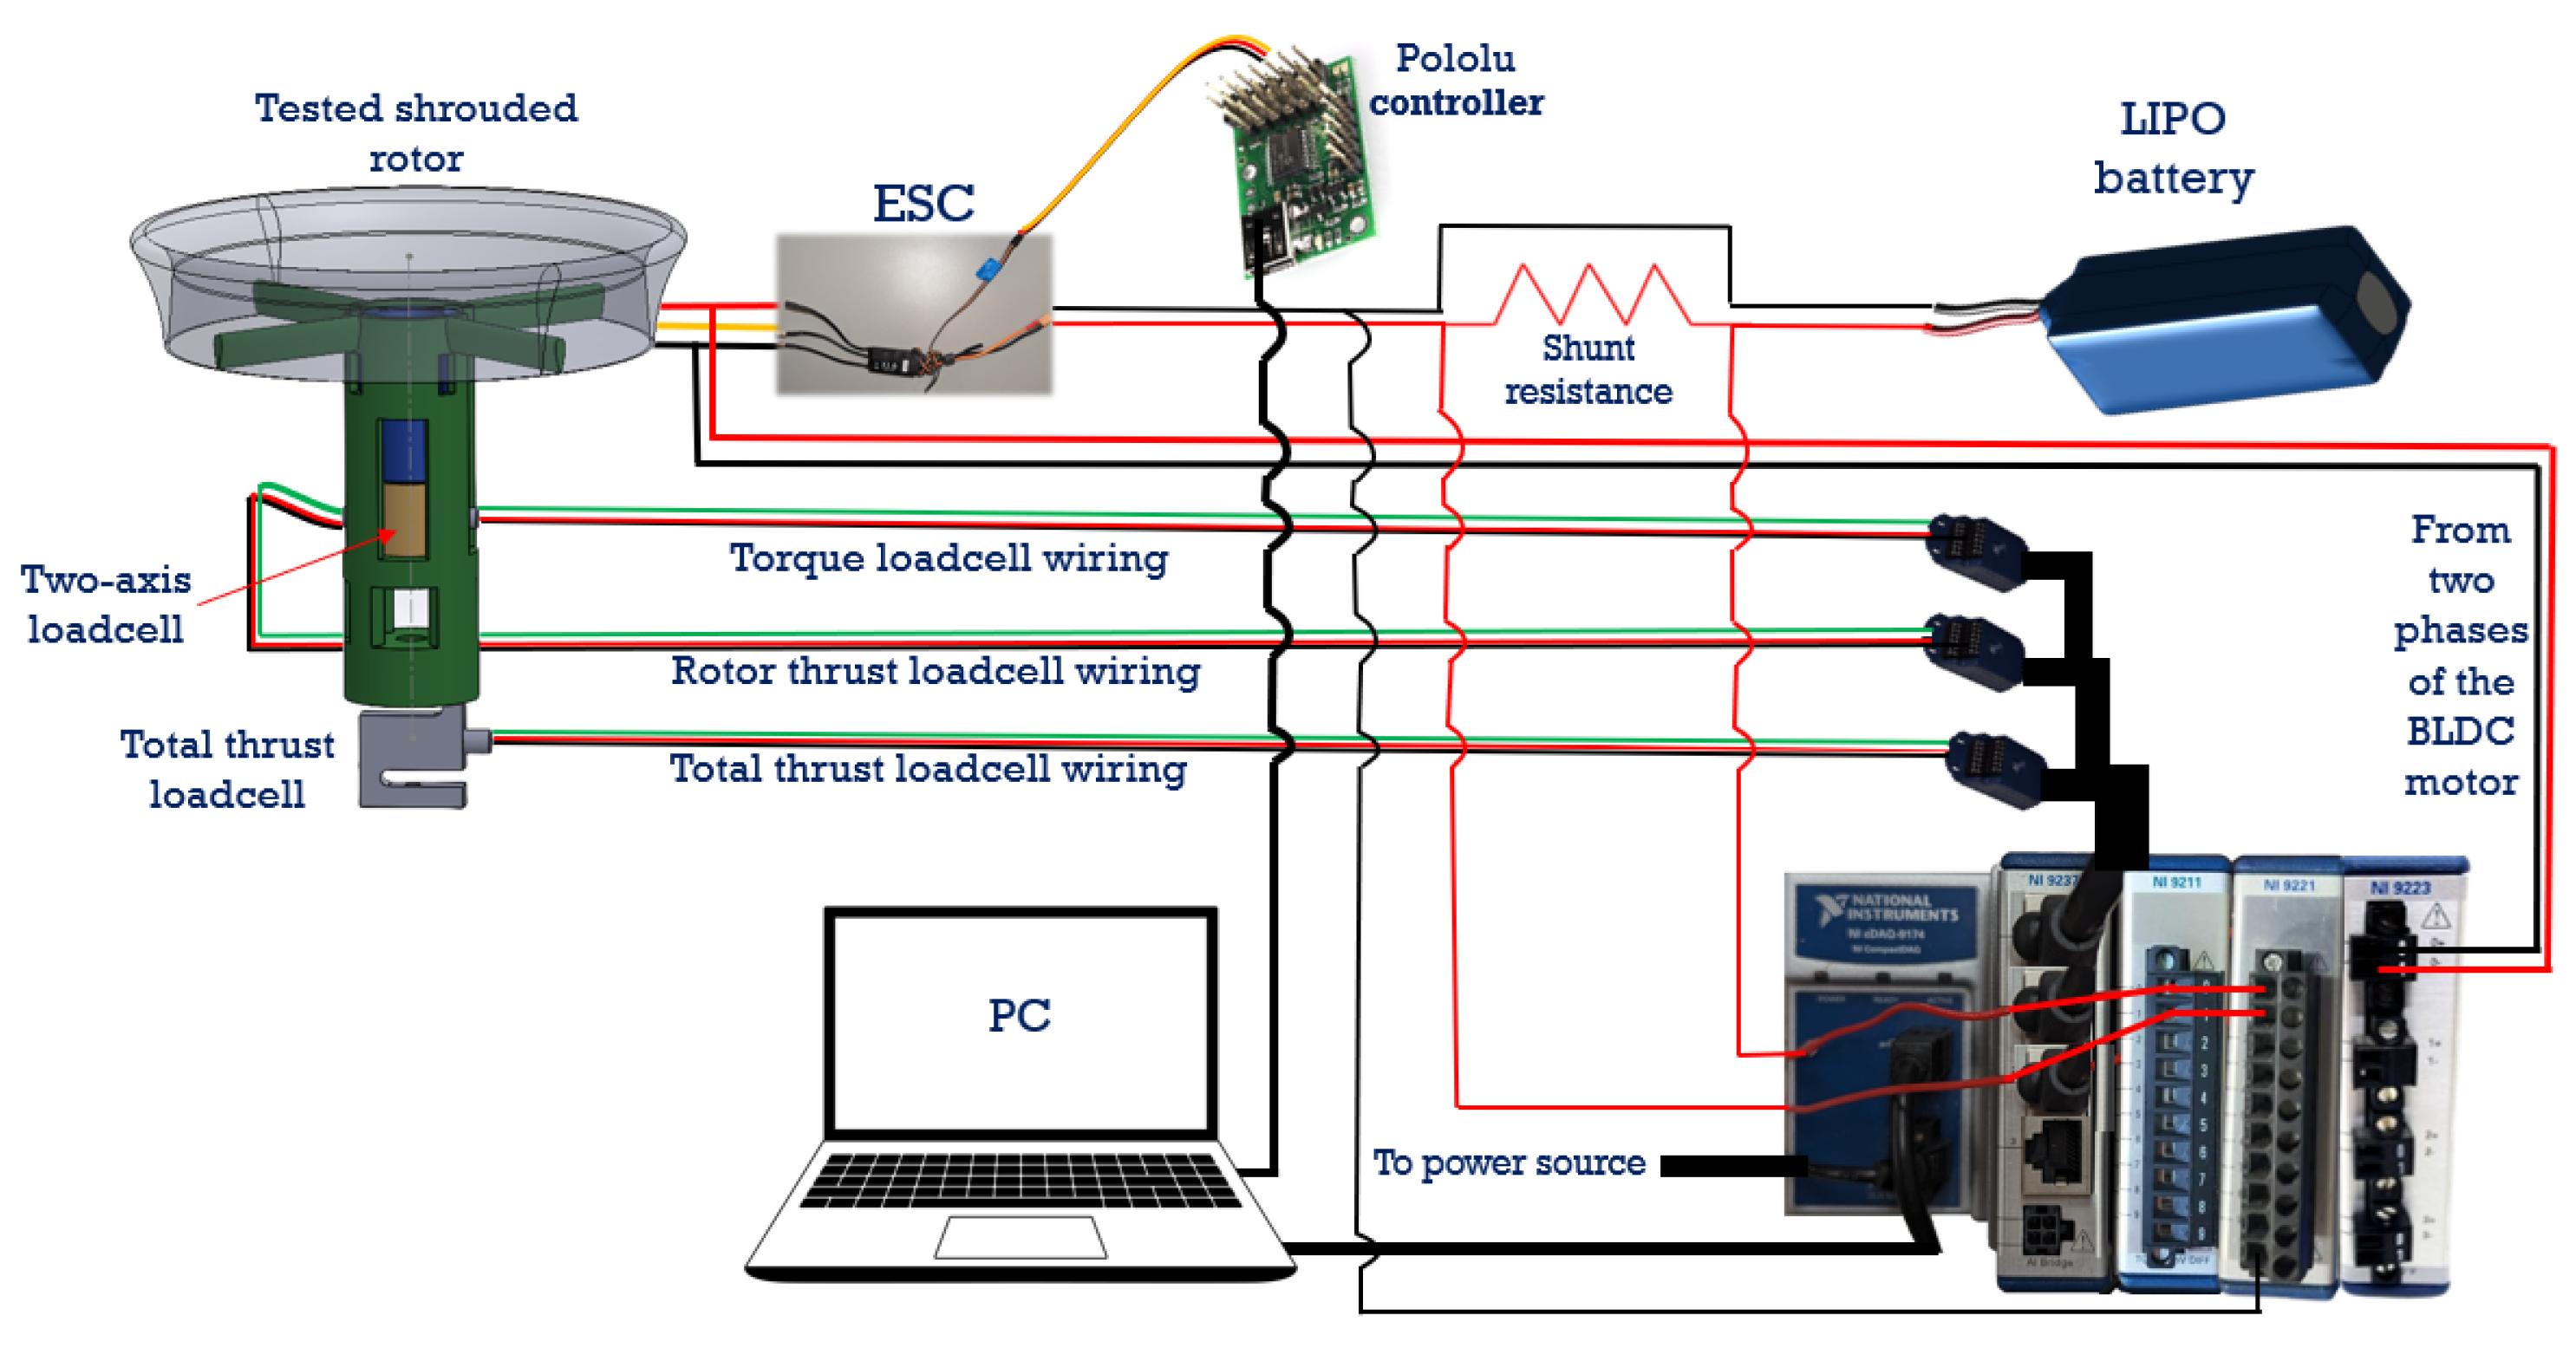
2. Experimental Setup

2.1. Test Rig Design

Custom test rig fixtures are designed and manufactured using 3D printing using PLA with 100% filament density to securely hold the open/shrouded rotor in place, as shown in Figure 1. Additionally, the used printing nozzle diameter is 0.3 mm, which grants good surface roughness. The struts supporting the shroud remain connected during open rotor tests, ensuring that the structural components affecting performance are consistent in both configurations. Furthermore, if the test rig is intended solely for open configurations, the struts can be modified to be detachable.
The shrouded rotor tested here is part of the Navig8 UAV’s tilt-rotor system (Figure 2a). While the primary force is axial (thrust dominant), the term ‘rotor’ is retained to emphasize its integration into a tilt-rotor architecture (for Navig8 UAV), as the distinction between rotors and propellers blurs due to multi-modal operation. The shroud, presented in Figure 2b, is optimized for hovering conditions and is designed for the Navig8 UAV [25].
The test rig is designed to meet specific performance requirements, including a hovering thrust of 20 N, a torque range of 0.3 N·m to 0.4 N·m, and an operating RPM of 10,000. To achieve these specifications, the BLDC motor (AXi 35 2826/10 Outrunner Brushless Motor, manufactured by Esprit Tech in Czech Republic ) is selected, which is rated for a maximum efficiency of 86%. The motor’s electrical specifications include a nominal voltage of 15 V and a maximum current draw of 50 A. Additionally, the motor’s compact size (35 mm diameter) is chosen to fit within the design constraints of the test rig while delivering the necessary performance. These design requirements are derived from the operational needs of the Navig8 UAV, ensuring that the test rig accurately reflects real-world performance conditions.
A two-axis load cell is directly connected to the rotor to measure both thrust and torque. This configuration ensures that the thrust and torque measurements accurately represent the rotor’s performance, free from external influences. The specifications of the two-axis load cell are detailed in Table 1. The main (total thrust) load cell, whose specifications are provided in Table 1 as well, supports the entire test assembly, both load cells are manufactured by CALT sensors in China. It ensures precise measurement of the total thrust for both open and shrouded rotor configurations.
Figure 3 illustrates the detailed connection setup of both load cells within the shrouded rotor configuration. The load cells are strategically placed to measure the forces and torques acting on the rotor system. Each load cell is firmly mounted to the structure to ensure precise data collection during testing. To maintain signal integrity and reduce electromagnetic interference, the wiring from the load cells is enclosed in a shielded conduit. To avoid physical interference between the rotor and shroud due to possible vibrations, a large tip clearance of 0.03 times the rotor radius is used in testing the shrouded rotor configuration.
National Instruments (NI) Data Acquisition (DAQ) systems are employed for automated data collection, with the cDAQ-9174 DAQ chassis serving as the central hub for integrating various measurement modules. The NI 9237 bridge input module is used to measure forces from both a two-axis load cell and a total thrust load cell, performing signal conditioning and analog-to-digital conversion of the strain gauge outputs. The NI 9223 captures the voltage frequency from any two phases of the Brushless DC (BLDC) motor, allowing for the computation of the motor’s RPM based on the electrical frequency, chassis and all the used modules are made by National Instruments in the United States of America. A schematic of the instrumentation is shown in Figure 4.
Given the motor speed range of 4000 to 8000 RPM, the NI 9223’s high sampling rate of 1 MS/s per channel ensures precise frequency capture, enabling accurate speed estimation. Additionally, the NI 9221 is used to monitor motor voltage, benefiting from its wide input voltage range (±60 V), while the NI 9211 measures the low-voltage drop across a shunt resistor to calculate the current flow using Ohm’s Law (I = V/R). These modules work together to provide a comprehensive measurement system for the real-time monitoring of motor performance and thrust generation.
Data acquisition is performed at a sampling frequency of 1 kHz for all channels, ensuring sufficient resolution to capture the data while minimizing noise. Each measurement is recorded over a duration of 15 s to achieve statistical reliability, and the data are averaged over this period to reduce random errors. Post-processing includes applying a low-pass filter with a cutoff frequency of 500 Hz to remove high-frequency noise and aligning the time-series data from different modules to ensure synchronization. RPM, thrust, and torque measurements are recorded simultaneously during each test. To achieve the required level of confidence, each test is repeated according to the corresponding sample size.
Rotor RPM measurement along with the torque allow for precise calculation of the mechanical power ( P = Q Ω ). It is important to note that precise measurement of the RPM is crucial for accurately determining deduced quantities such as mechanical power. Ensuring high-precision RPM measurement is therefore essential for reliable performance evaluation and optimization. RPM control is managed manually using a Pololu Maestro Controller, made by Pololu Robotics in the United States of America, which sends pulse width modulation (PWM) signals to the Avian 45-Amp Brushless Smart (SPMXAE1045) electronic speed controller (ESC), made by Horizon Hubby in the United States of America, providing fine control over motor speed and enabling accurate performance assessment.
The shunt resistance is employed to calculate the current passing through the BLDC motor. This low-value resistor is connected in series with the motor circuit, allowing a small voltage drop across it. By measuring the voltage drop, the current is calculated using Ohm’s law, where the current is the ratio of the measured voltage to the known resistance of the shunt ( I = V / R ). The electrical power consumed by the motor can be calculated as the product of the current and motor voltage ( P e l e c = V I ).
All experiments are performed under the operating conditions listed in Table 2. Ambient conditions, including atmospheric pressure ( p ) and temperature ( T ), are measured using a digital anemometer equipped with sensors for pressure and temperature. The air density is calculated from the equation of state, ρ = p / ( R T ) , where R is the universal gas constant. The digital anemometer used for measurements (Model BTMETER BT-100, made by Hold Peak in China) has an accuracy of ±0.5% for pressure and ±0.2 °C for temperature. Calibration is performed using a reference barometer and thermometer to ensure measurement precision.
During testing, a 10 min cool-down period is implemented between runs to prevent motor overheating and efficiency losses. This cool-down period also serves to mitigate potential thermal drift in the 2-axis load cell. Moreover, the load cell is positioned 30 mm downstream of the motor which is a sufficient distance to prevent significant convective heating. The load cell’s datasheet specifies a thermal sensitivity coefficient of ± 0.05 % per 10 °C, which introduces a source of systematic uncertainty. However, this effect is neglected in the present study due to the controlled cool-down process and the positioning of the load cell.
Varying the measuring direction in subsequent tests (conducting one test from 3000‘ rpm to 8000 rpm and the next from 8000 rpm to 3000 rpm) is performed for detecting the hysteresis effects and ensuring measurement reliability. This approach helps identify any discrepancies caused by system inertia, thermal variations, or non-linearities in the mechanical response. By incorporating this method, the study enhances the robustness of the findings, ensuring that the recorded data are not influenced by the order of operation.

2.2. Thrust and Torque Calibration

Thrust and torque measurement calibrations are essential for ensuring testing accuracy and reliability. Thrust calibration involves precisely measuring the rotor’s force under various conditions, while torque calibration determines the rotational load reaction necessary for maintaining mechanical power. The experimental setup undergoes accurate calibration through testing and analysis to validate performance and meet the design specifications. As shown in Figure 5, the calibration hardware includes mechanisms for both thrust and torque, with thrust assessed from the rotor’s center of rotation (Figure 5a) and torque calibrated using a pulley mechanism that transfers a known weight to a horizontal load at a known moment arm, d (Figure 5b).
To ensure accuracy and minimize bias errors, calibrations are performed before each test, reinforcing the reliability of the measured data.

2.3. Uncertainty Analysis

Uncertainty analysis is employed to validate the results of the experimental setup by quantifying numerical errors, including random (precision) errors and systematic (bias) errors. Random error estimates reflect the precision of the measurements and the inherent randomness in the rotor performance. Systematic errors are considered to ensure accuracy regarding the uncertainty associated with the measurement instruments.

2.3.1. Random (Precision) Error

Random errors are addressed by conducting repeated experiments to estimate and manage them effectively. The estimation of random errors is based on the principles of probability and statistics. This approach allows for a qualitative assessment of the measurement precision and provides insights into potential variations that may occur [27].
The averaged thrust and torque represent the mean values obtained from the recorded measurements. The arithmetic average, x ¯ , is calculated as per Equation (1), and the standard deviation of each sample S x is calculated according to Equation (2):
x ¯ = Σ i = 1 N x i N
where x i are the values of the measured sample, and N is the sample size:
S x = 1 N 1 i = 1 N ( x i x ¯ ) 2
The distribution (student-t) function t 2 , 95 = 4.303 is determined based on the chosen confidence level of (95% in the present case) and the sample size (three) [28]. The random uncertainty is calculated using Equation (3):
U r a n = t 2 , 95 S x N
A sample of the calculated uncertainty of the shrouded Rotor B is included in Appendix A in Table A1.

2.3.2. Systematic (Bias) Error
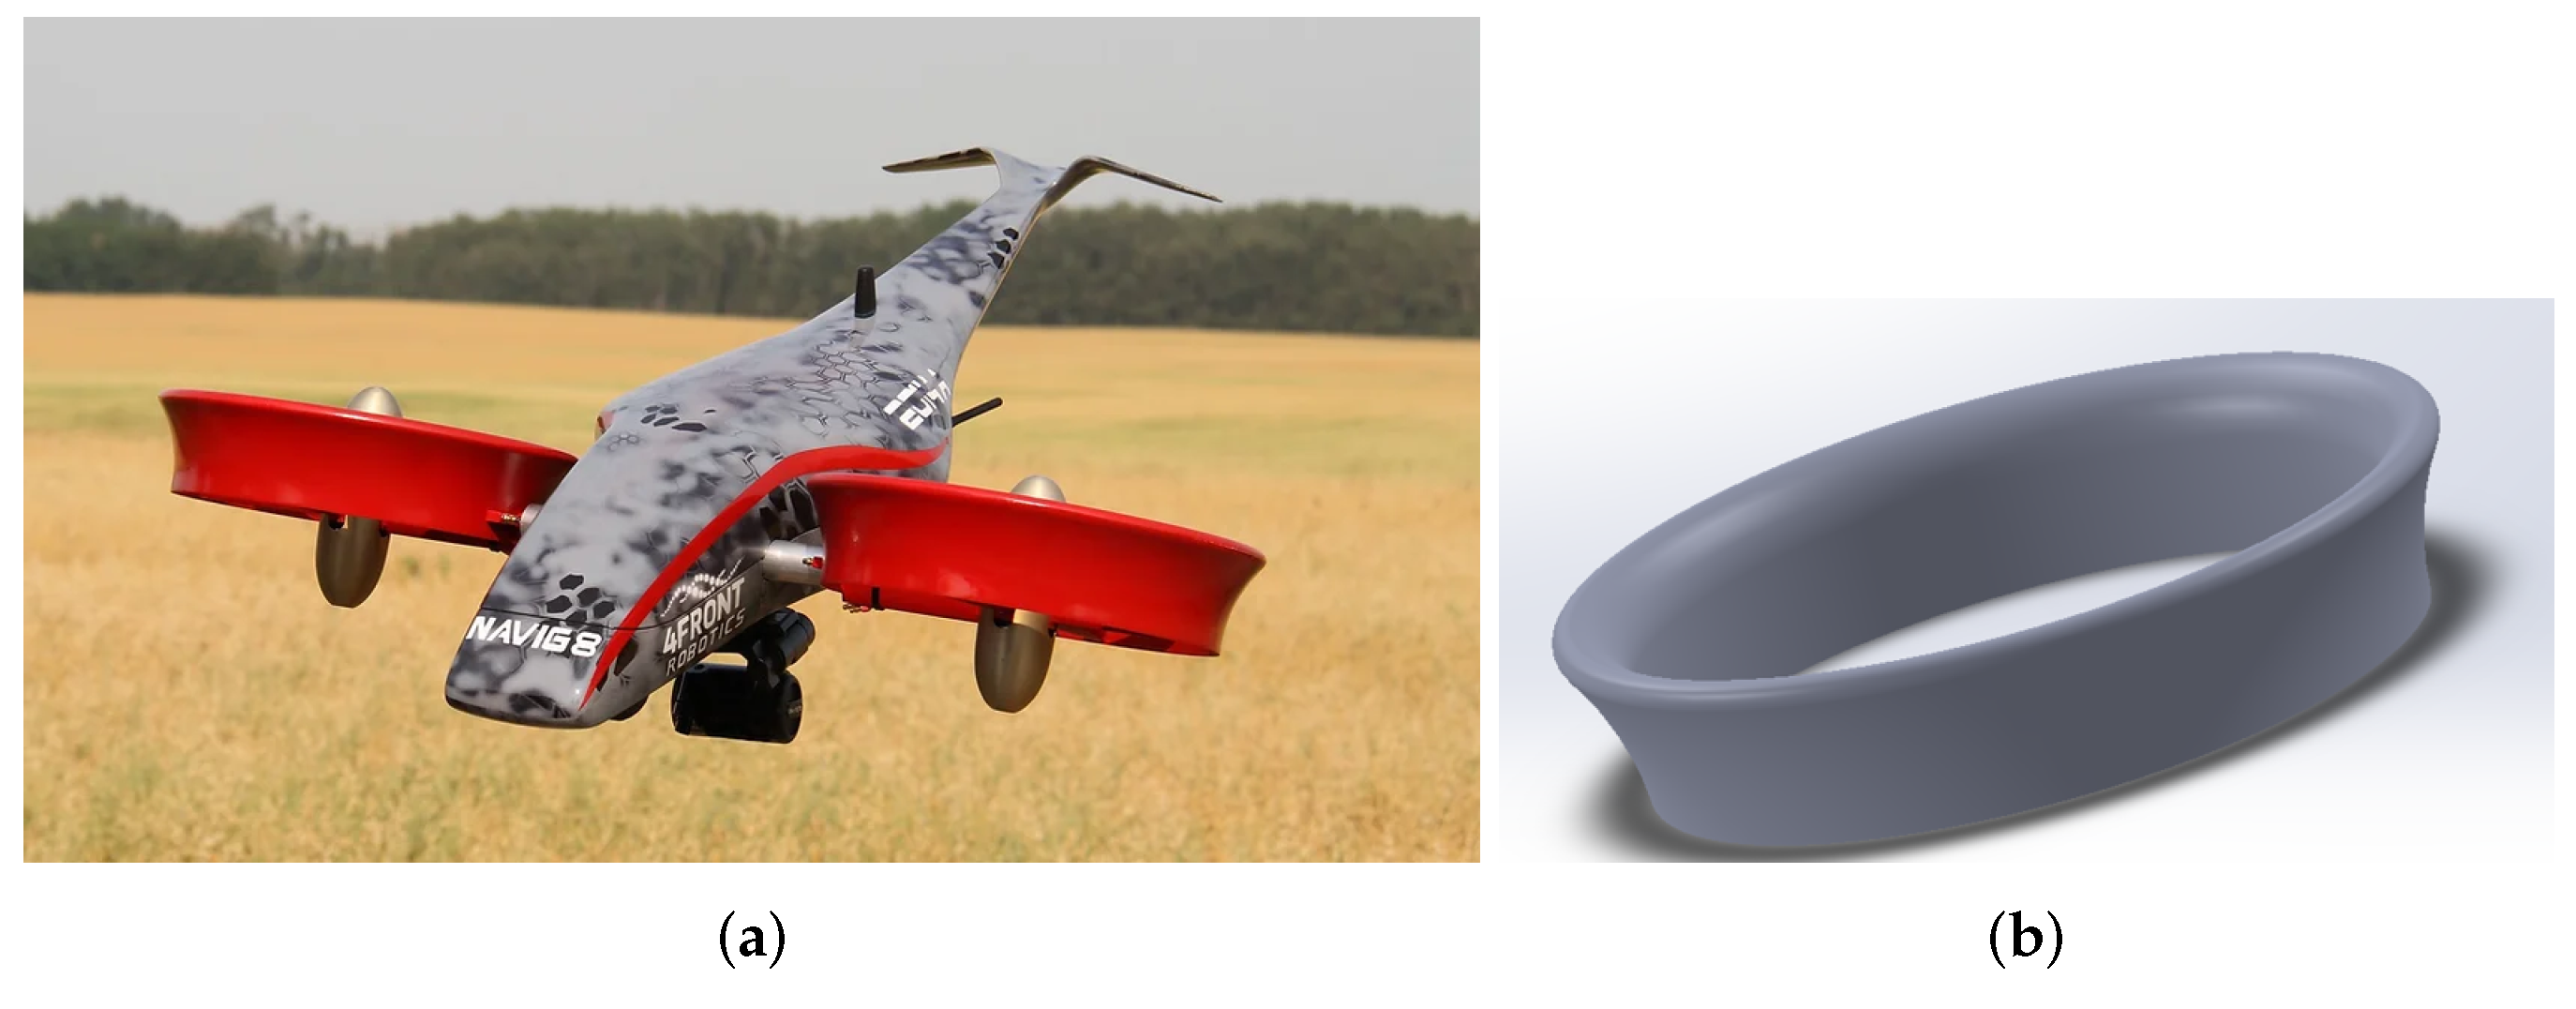
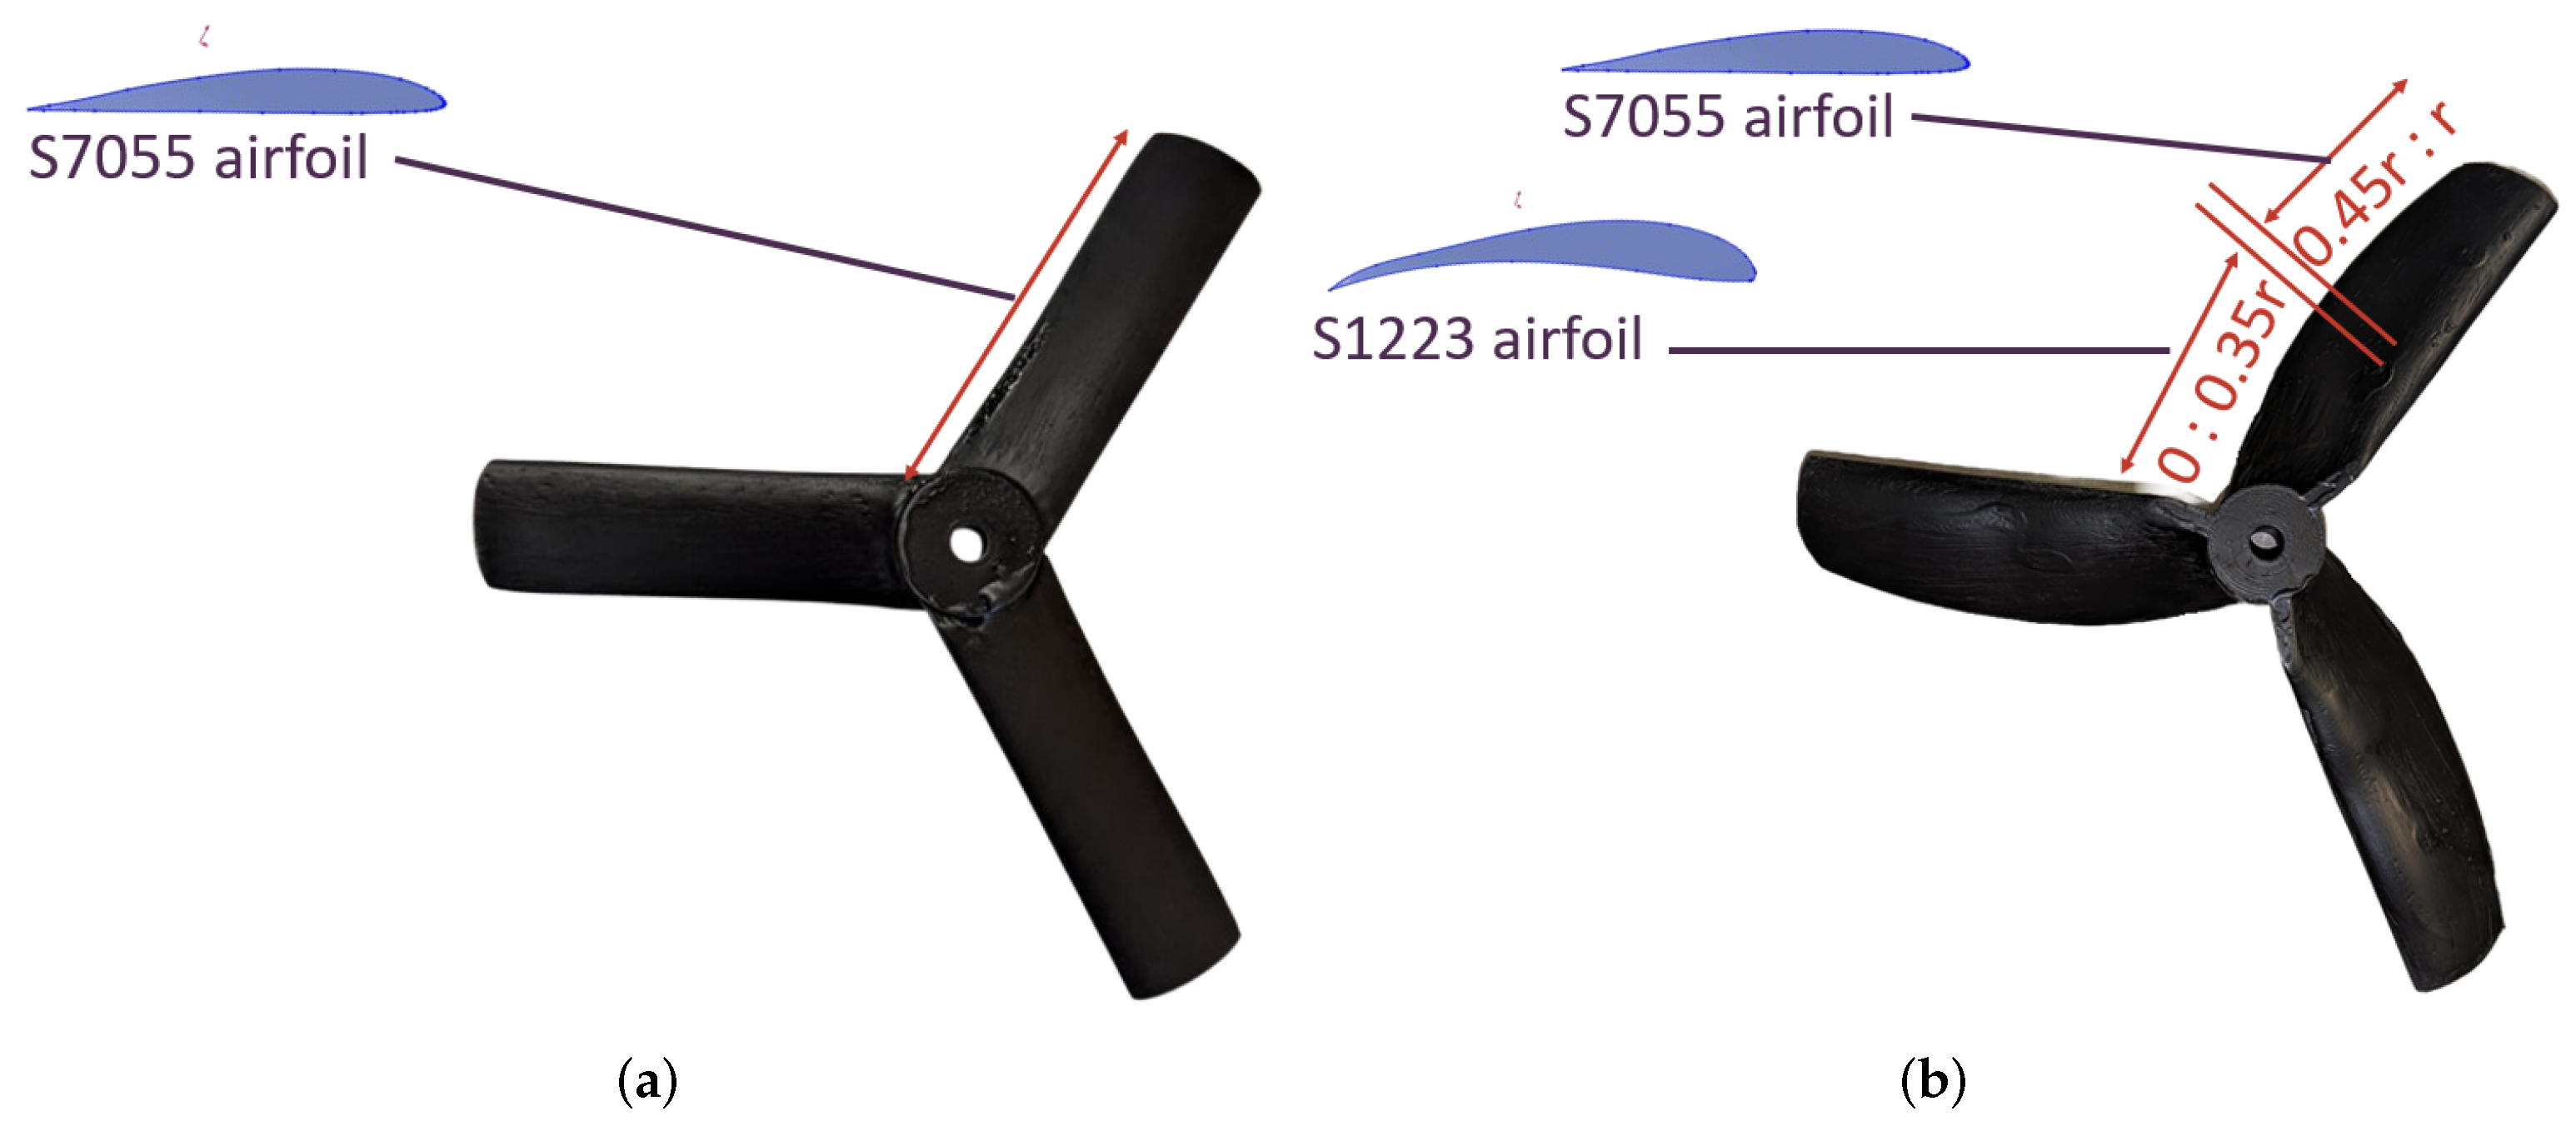
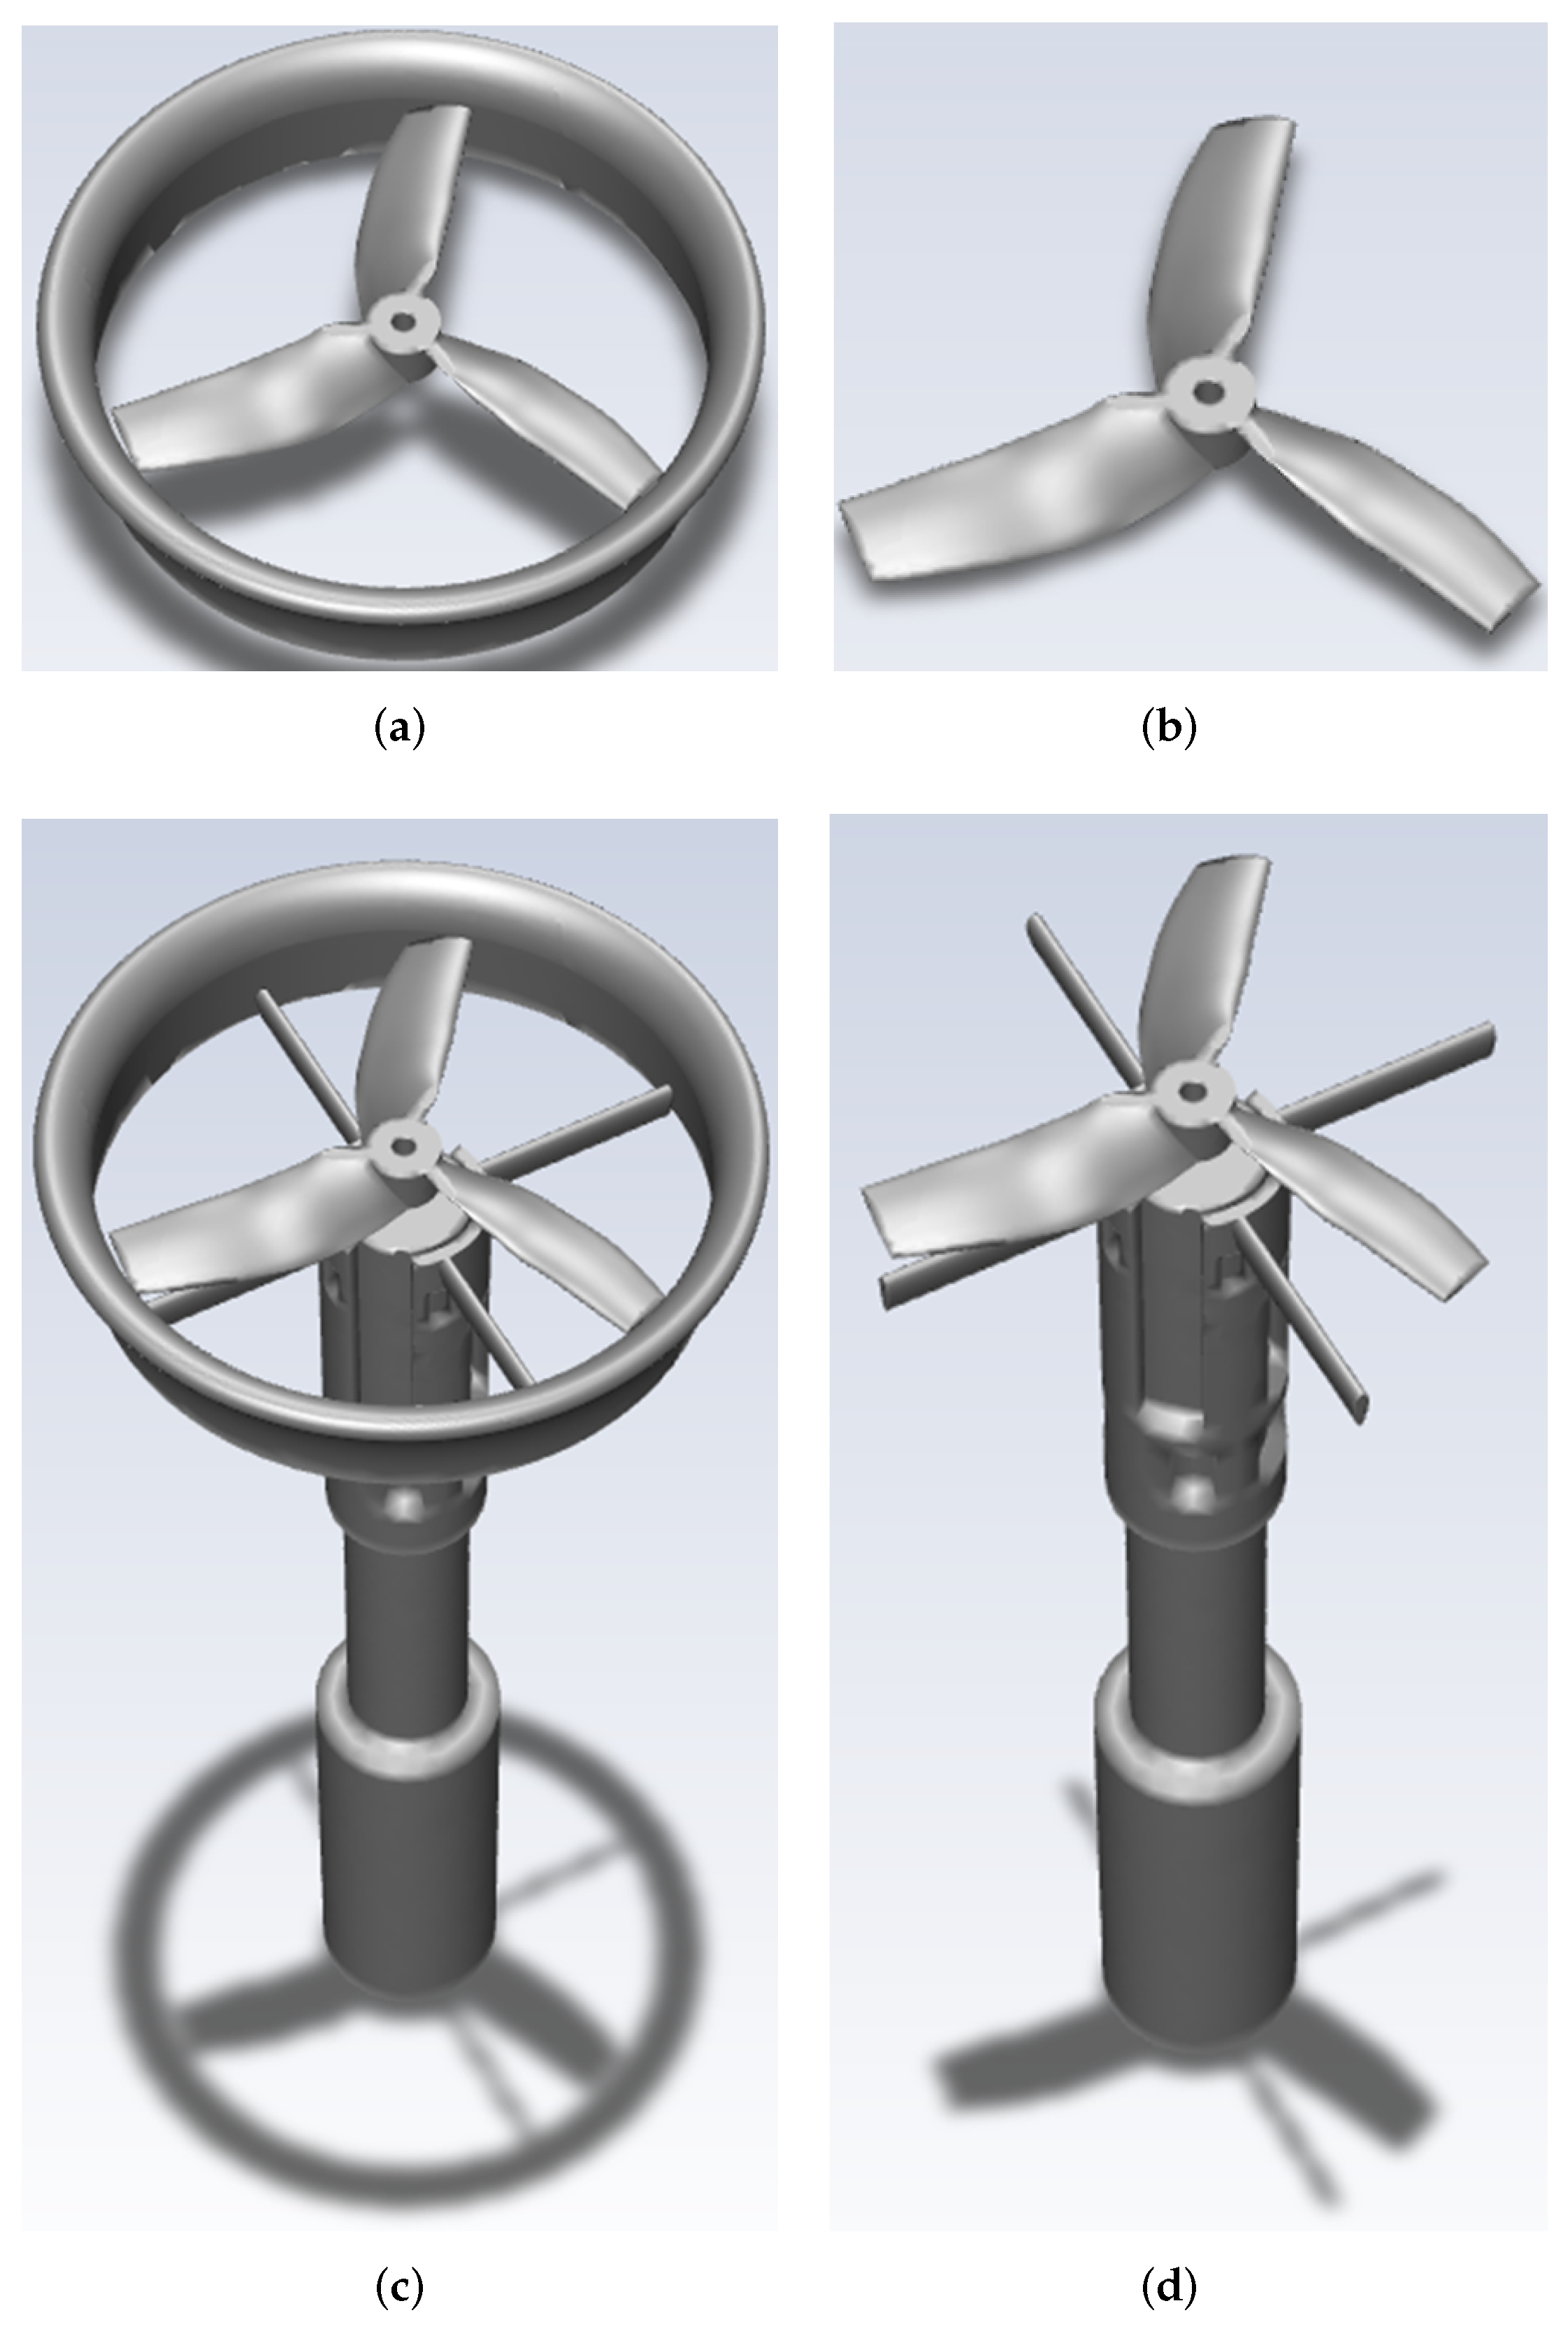
The systematic uncertainties specified in the instrument datasheets are 0.03% for the thrust sensors and 0.3% for the torque sensor. The RPM measurements have an accuracy of 0.3% of the reading value. The voltage and the current measurements have accuracies of 0.5% and 1%, respectively. When direct measurement of a parameter is not possible, it can be calculated instead. For instance, in this study, the mechanical and electrical power are determined through calculation, and uncertainties can also be estimated.
The individual measured values are used to compute the overall combined uncertainty through the propagation of error.
To calculate mechanical power (P [W]), the measured primary parameters are rotational speed ( Ω [rad/s]) and torque (Q [N · m]). The systematic uncertainty of mechanical power is defined as per Equation (4), based on a first-order Taylor series expansion [29]:
U s y s = P Ω δ Ω 2 + P Q δ Q 2
The sensitivities (partial derivatives) in Equation (4) ( P Ω and P Q ) define the relative change of the calculated parameter. Given that mechanical power can be determined using Equation (5), the systematic uncertainty of the mechanical power can be determined as per Equation (6):
P = Q × Ω
U s y s = Q δ Ω 2 + Ω δ Q 2
Thus, the combined uncertainty of the mechanical power is found to be ±1.42%. Similarly, the combined uncertainty for the electrical power is ±1.46%. The total experiment uncertainty is the combination of both random and systematic uncertainties (±2.88%).

3. Studied Rotors

For the validation of the test rig reliability, two rotors, Rotor A and Rotor B, with a radius of 1143 mm, are selected. Rotor A, shown in Figure 6a, has a non-optimized design with a fixed cross-sectional airfoil (S7055), a fixed chord of 33 mm, and has a constant twist distribution along the radius ( 8.5 ). Rotor B (Figure 6b) has optimized chord and twist distributions using third-degree polynomial functions [24].
For Rotor B, the S7055 airfoil is used for the inboard section (0–0.35 r) for low Reynolds numbers, the S1223 airfoil for the outboard section (0.45 r–r) at higher Reynolds numbers, and the 0.35–0.45 r region as a linear transition. Both rotors have no sweep, while the hub has an inner radius of 4.25 mm (suitable for the BLDC motor shaft) and an outer radius of 16.7 mm.

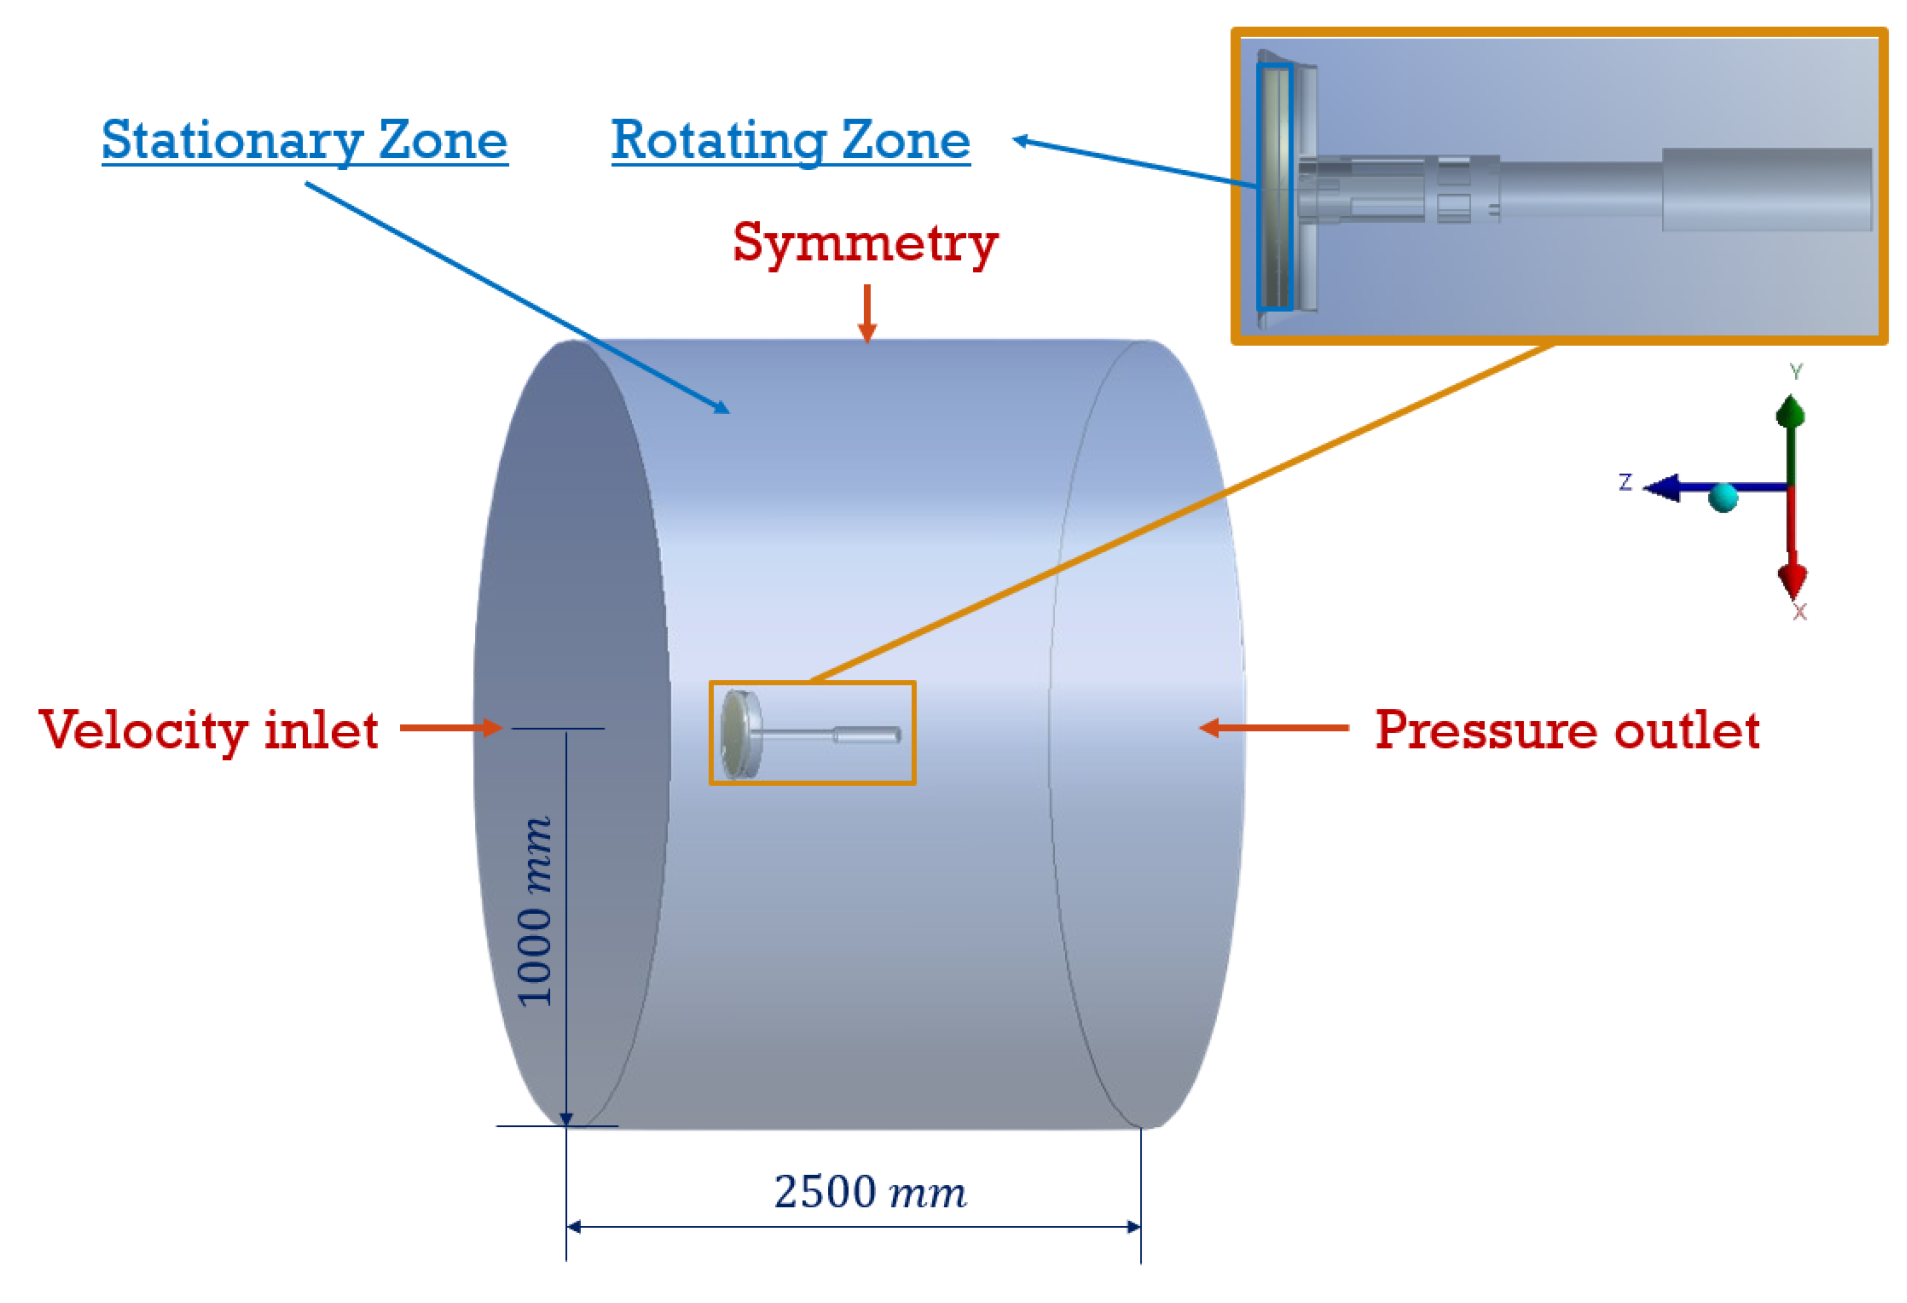
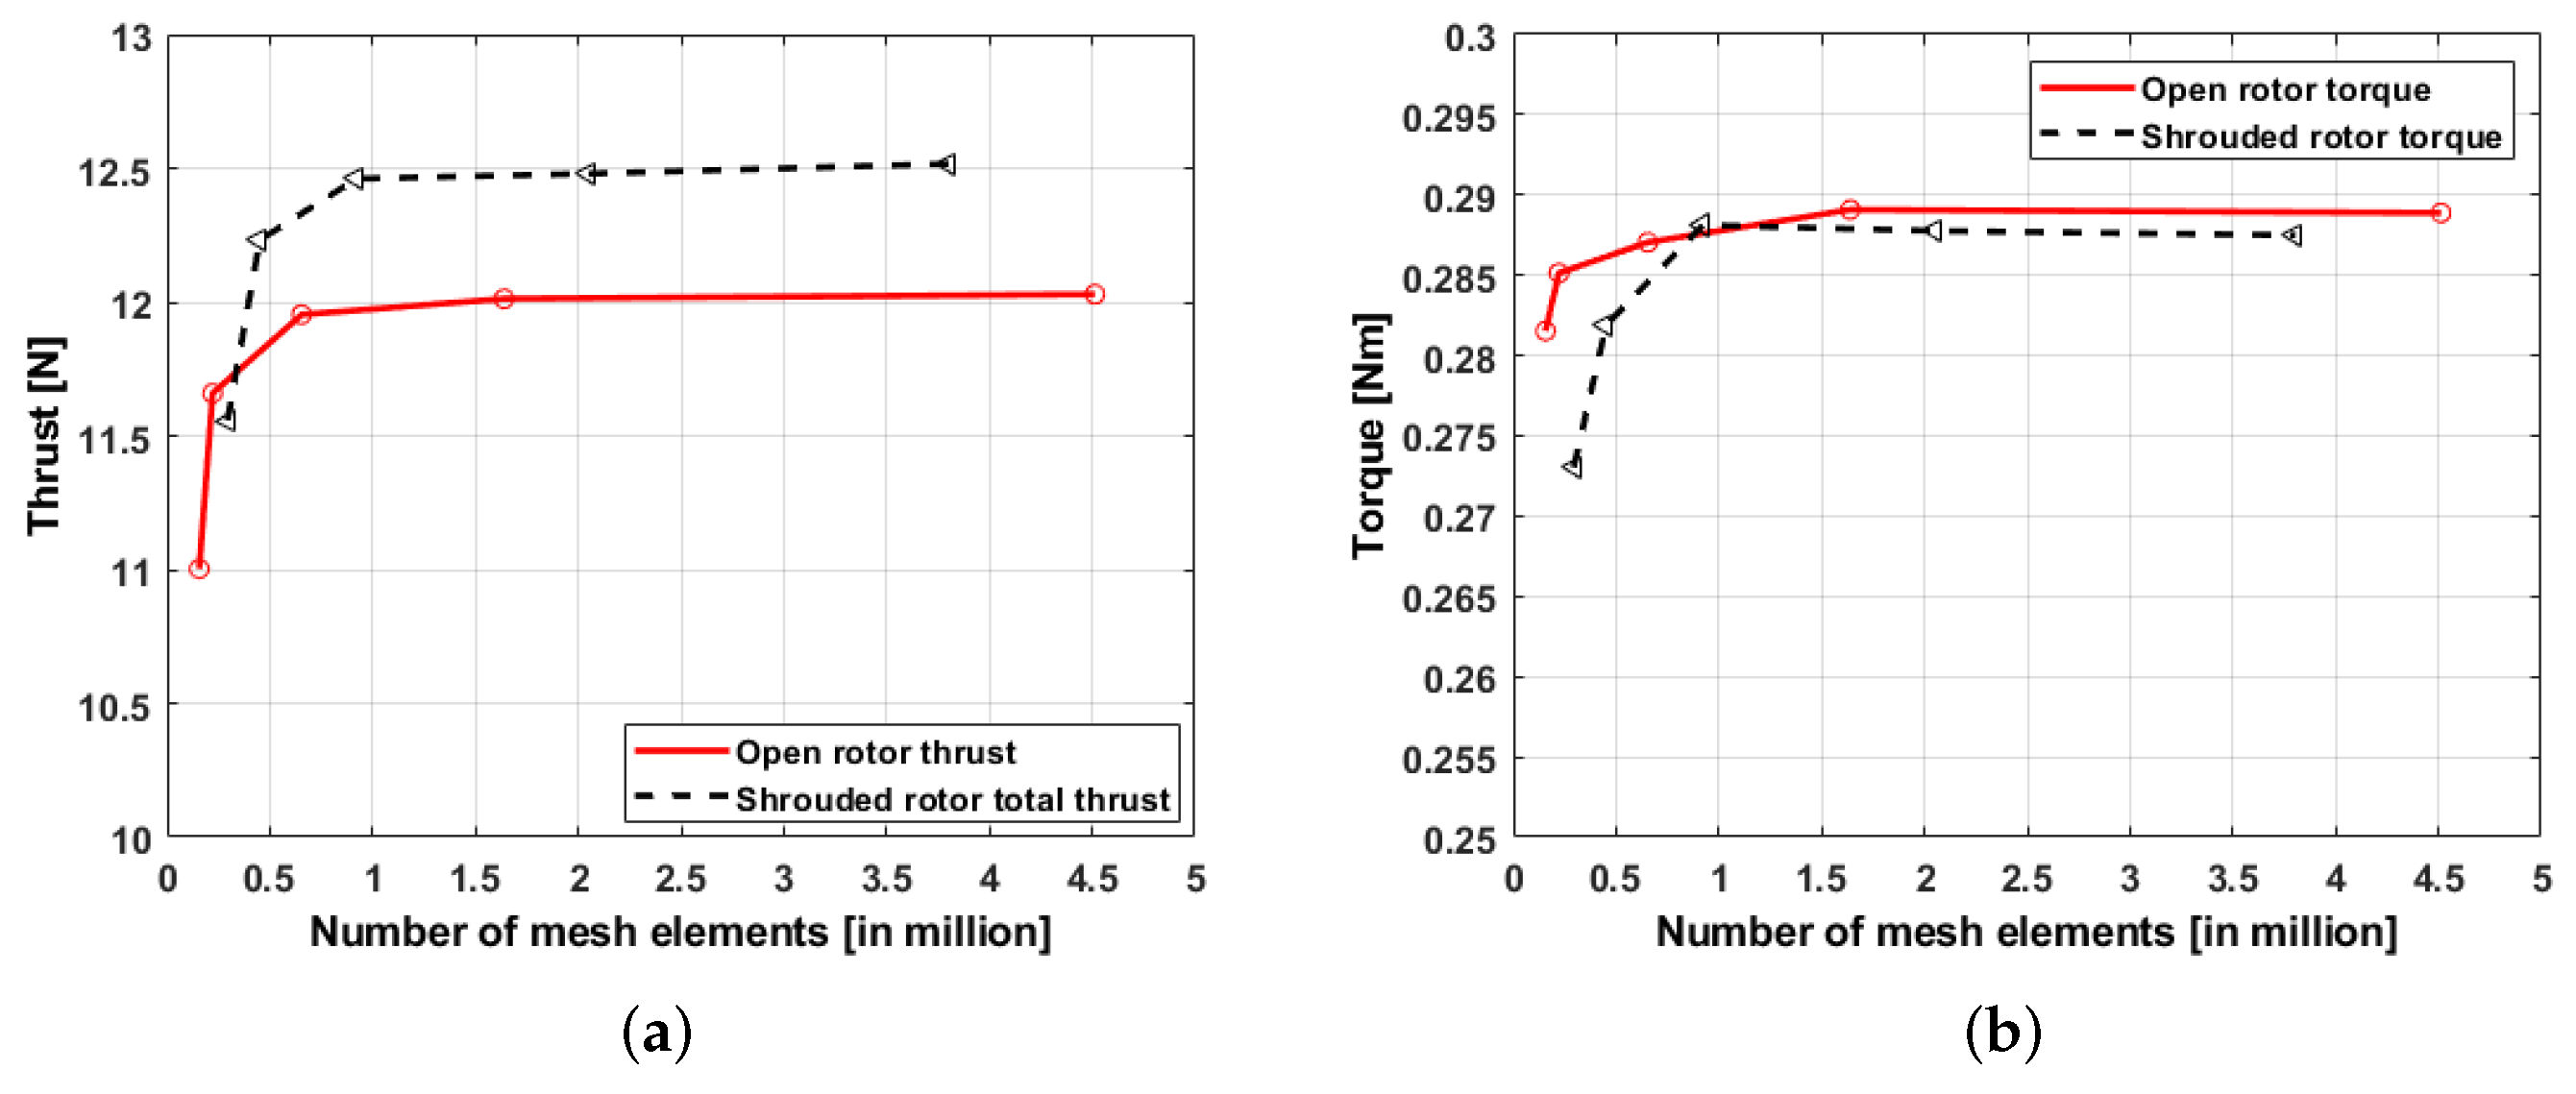
4. Computational Model

The ANSYS FLUENT CFD, 2024 R1, software is used to perform the simulations in a steady-state environment, using the Multiple Reference Frame (MRF) method to simulate the rotor rotation. Figure 7 illustrates the two simulated setups for shrouded and open rotors, both with and without the test rig. Two sub-domains are employed: a stationary domain, a cylinder of length 2500 mm and 2000 mm in diameter, containing the entire setup, and a rotating one that surrounds the rotor as shown in Figure 8. A velocity inlet is defined as the inlet boundary, while the outlet boundary is configured as a pressure outlet. All surfaces are designated with no-slip wall conditions.
A standard unstructured mesh consisting of tetrahedral cells is created for the entire flow domain (covering both stationary and rotating zones) using the ANSYS mesh tool. The mesh is refined near the rotor in the rotating region, with smaller cell sizes to capture detailed flow characteristics, and gradually coarsened toward the stationary region.
A CFD grid dependency study is performed to ensure that the simulation results are independent of the mesh size. The grid dependency study results, shown in Figure 9, illustrate the convergence behavior of thrust and torque as the number of mesh elements increases. In both subfigures, the thrust and torque values stabilize as the mesh becomes finer, indicating that further mesh refinement has a diminishing impact on the results. The open rotor and shrouded rotor configurations exhibit different convergence trends, with the shrouded rotor achieving higher thrust but following a similar pattern of stabilization. The results effectively demonstrate that the chosen mesh density is valid for reliable simulations. The selection of the finest mesh for this analysis, as indicated by the grid dependency study, suggests that further mesh refinement does not significantly alter the solution, confirming that the results are grid-independent.
The realizable k ϵ turbulence model is used for simulations due to its effectiveness in rotating flows with high Reynolds numbers and complex vortex structures. It balances accuracy and computational efficiency, effectively delaying flow separation and capturing essential flow dynamics [30,31,32].
All simulations are run for 5000 iterations to ensure convergence to a steady-state solution. The convergence criterion is defined by monitoring key parameters, such as thrust and torque, with residuals maintained below a threshold of 1 × 10 3 . The simulation conditions are summarized in Table 3.

5. Results and Discussion
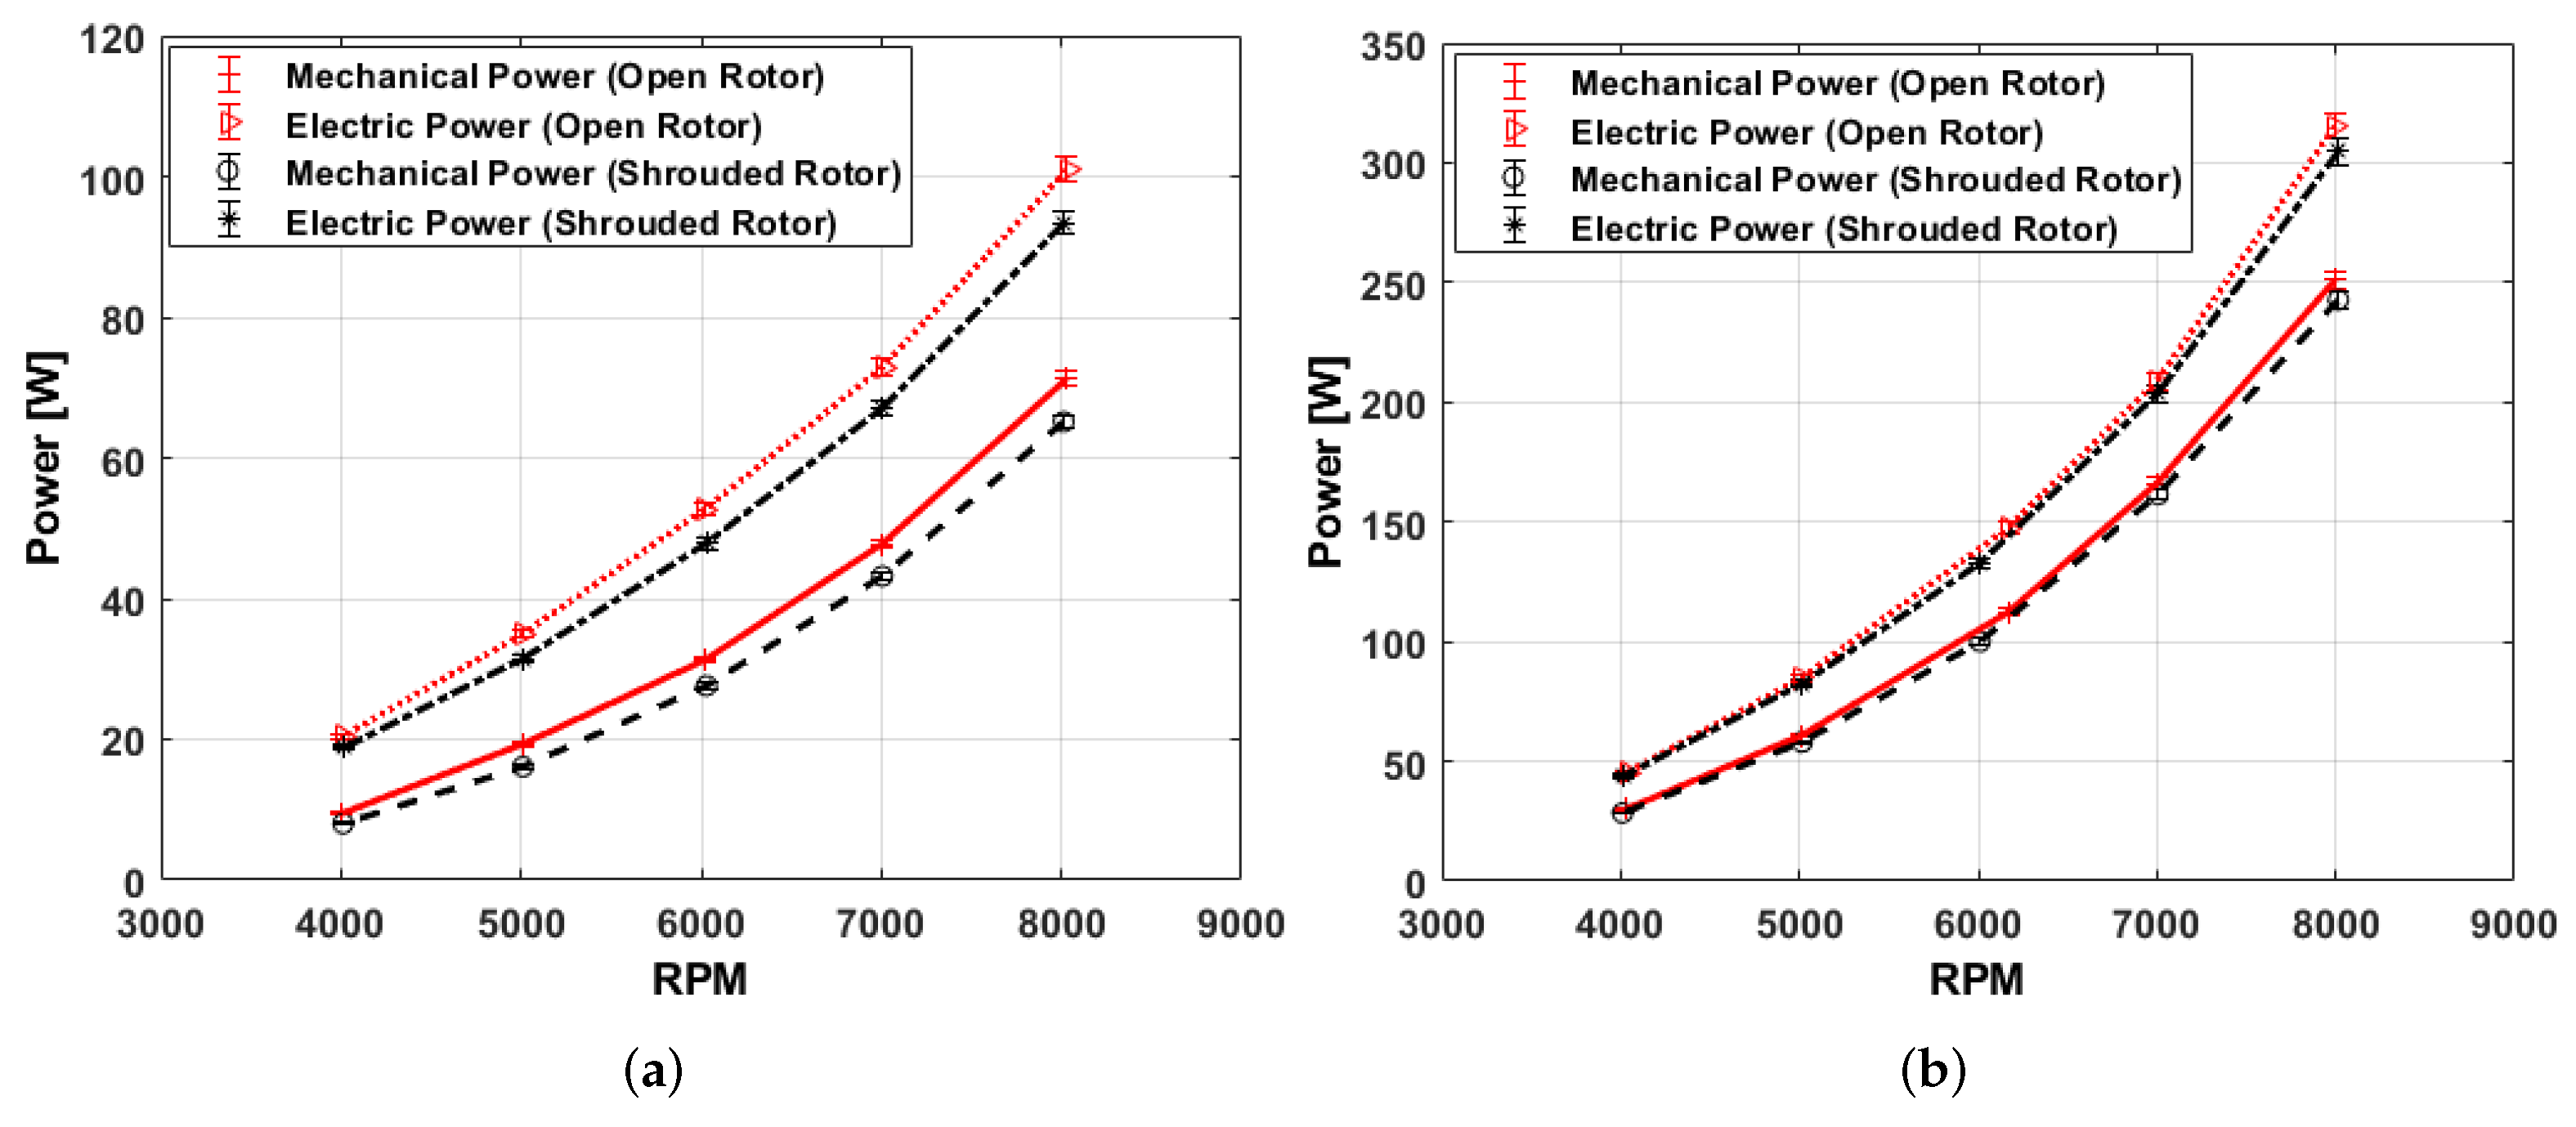
This section discusses the impact of the test rig on open and shrouded rotor performance by comparing the computational results of the open/shrouded rotor configuration with and without the test rig structural elements. The rotor thrust as well as the total thrust are presented separately for each rotor. Moreover, the mechanical and electrical power are presented to address the BLDC motor efficiency. The total uncertainties calculated in Section 2.3 are used to plot the error bars in the experimental graphs, providing a visual representation of the measurement precision.

5.1. Open Rotor

Figure 10a compares the thrust produced by open rotors A and B at various RPMs, incorporating experimental data and two CFD simulations: one excluding test rig effects and another including them. Accounting for test rig effects in the CFD model enhances agreement with the experimental thrust values with the largest difference between them across the RPMs being 6.45 % for Rotor A and 3.63 % for Rotor B. Figure 10b presents the torque measurements as a function of RPM for both open rotors. Consistent with the thrust results, both CFD simulations closely match the experimental torque data, with the simulation incorporating test rig effects showing slightly higher torque values, and the largest difference between them across the RPMs is found to be 4.84 % for Rotor A and 3.17 % for Rotor B.
The CFD simulation results indicate that the test rig significantly affects rotor thrust, while its impact on torque is minimal. The increase in thrust and torque with the test rig is due to flow confinement enhancing pressure recovery and wake redirection increasing induced velocity, with the blockage effects raising the dynamic pressure. This can be seen in Figure 11 which presents a comparative downwash velocity contour analysis (flow velocity in the longitudinal direction) of a rotor in two configurations: without a test rig (left) and with a test rig (right) at an RPM of 8000. The downwash velocity in the case of the presence of the test rig is clearly higher than that without the test rig.

5.2. Shrouded Rotor

Figure 12a,b present a comparative analysis of the simulated total thrust and torque, respectively, for shrouded Rotor A and Rotor B, both with and without the inclusion of the test rig, against the experimentally measured thrust values. The results demonstrate that the influence of the test rig on the total thrust generated by shrouded rotors is minimal, falling within an acceptable margin of error, being within the error bars. The largest difference between the CFD with test rig and the experimental results across the rotational velocities is 1.13 % for the thrust and 5.7 % for Rotor A. For Rotor B, the largest difference in the thrust is 1.3 % and 1.07 % for the torque.
This suggests that the aerodynamic interactions between the test rig and the shrouded rotors do not significantly alter the thrust output, allowing the test rig’s presence to be neglected in shrouded rotor experiments without compromising the accuracy of the results. This conclusion is supported by the close alignment between the simulated and experimentally measured thrust values, which indicates that the test rig’s structural and aerodynamic effects are negligible in the context of shrouded rotor performance.
For the shrouded rotor, the influence of the test rig is significantly reduced due to the presence of the shroud, which dominates the flow characteristics around the rotor. The shroud acts as a flow guide, containing and directing the wake, thereby minimizing the impact of the test rig as shown in Figure 13 at an RPM of 8000. Unlike the open rotor, where the wake expands freely and interacts with the rig, the shrouded configuration maintains a more stable and confined flow, reducing wake distortion and mitigating changes in induced velocity. Additionally, the pressure distribution around the shroud remains relatively unaffected, ensuring consistent aerodynamic performance with minimal interference from the rig. Shrouded rotors also mitigate tip vortices due to the close proximity of the shroud to the blades, further isolating the rotor from external disturbances. As a result, variations in thrust and torque due to the test rig are less pronounced, making the shrouded rotor a more robust configuration for experimental testing in controlled environments.

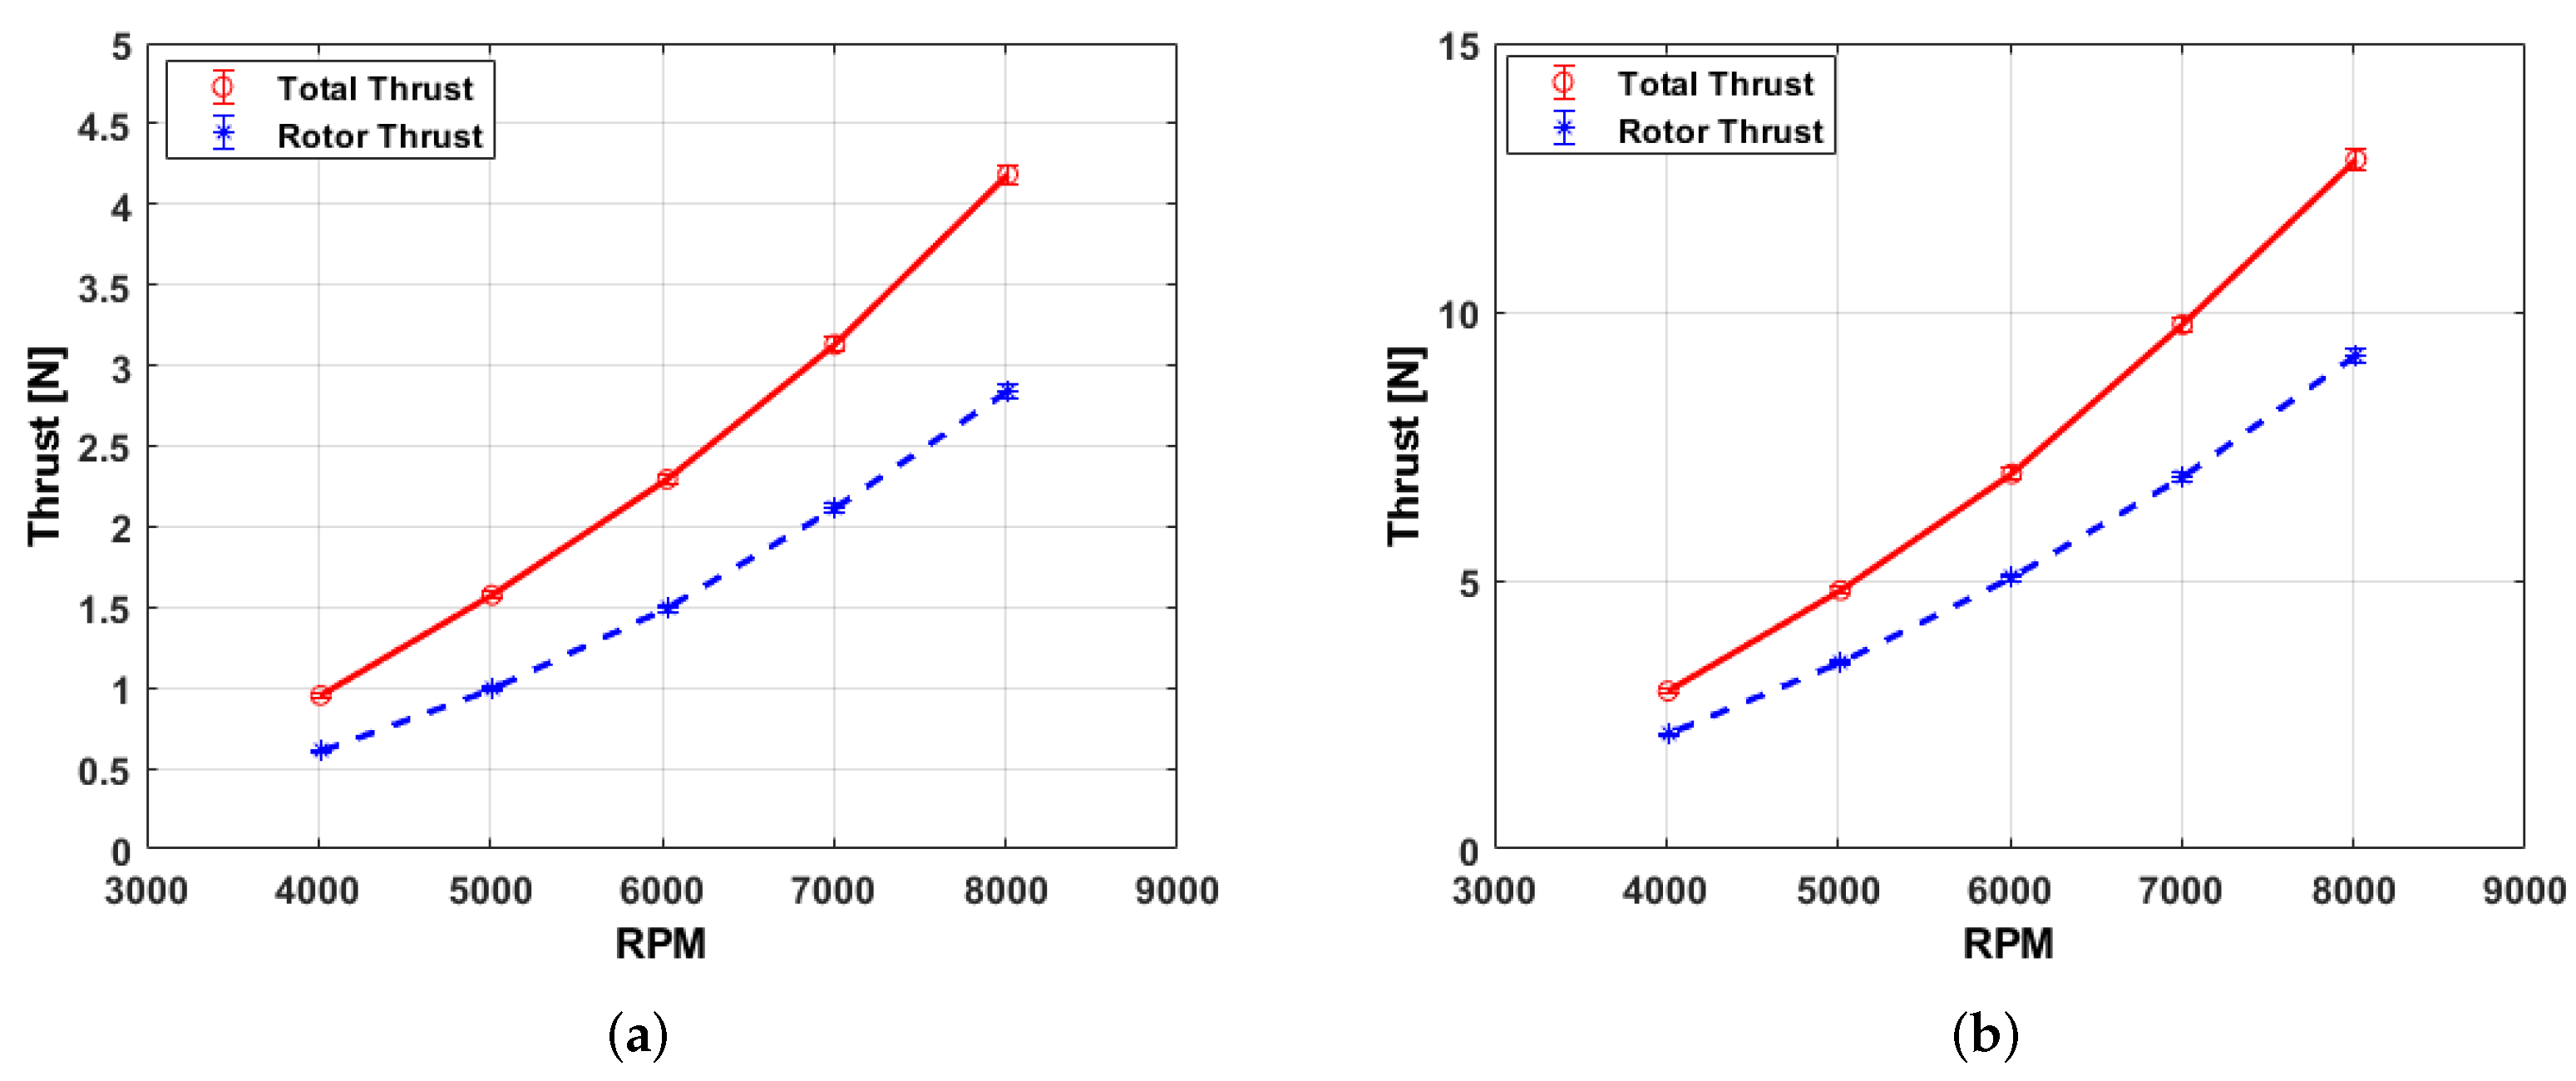
5.3. Total and Rotor Thrust for Shrouded Rotor Configuration

Figure 14a,b present the measured total thrust and rotor thrust for shrouded Rotor A and Rotor B, respectively, as obtained from the experimental setup. The test rig is designed to independently measure both total thrust and rotor thrust across a range of RPM values, enabling a detailed analysis of the aerodynamic performance of each rotor. The total thrust represents the combined aerodynamic force generated by the rotor and the shroud, while the rotor thrust specifically quantifies the contribution of the rotor blades alone, excluding the shroud’s effects. The plots clearly illustrate distinct curves for total thrust and rotor thrust as the RPM increases, highlighting the test rig’s precision in differentiating between these two measurements. Notably, the total thrust is consistently higher than the rotor thrust for both rotors, which is expected due to the additional aerodynamic contribution of the shroud. This consistent trend underscores the shroud’s role in enhancing overall thrust generation by accelerating and redirecting the airflow more efficiently than the rotor alone. The ability of the test rig to accurately capture these differences demonstrates its effectiveness in providing reliable data for evaluating shrouded rotor performance, offering valuable insights into the individual contributions of the rotor and shroud to the overall system.
When comparing the contribution from the rotor to the total thrust (rotor thrust alone) with the thrust of the open rotor, it is apparent that the open rotor thrust is higher. This can be attributed to the aerodynamic interaction between the rotor and the shroud in the shrouded configuration. The shroud increases the mass flow rate which increases the induced velocity at the rotor plane, reducing the effective angle of attack along the rotor blades. This reduction in the angle of attack leads to lower lift generation and, consequently, lower rotor thrust compared to the open rotor configuration. This is also reflected in the torque values, as the torque of the shrouded rotor is less than that of the open rotor. The lower torque is consistent with the reduced aerodynamic loading on the shrouded rotor blades due to the altered flow field. While the shrouded configuration results in lower rotor thrust, it is important to note that the total thrust (including the contribution from the shroud) is higher for the shrouded rotor due to the additional thrust generated by the shroud itself. This highlights the trade-off between rotor thrust and total thrust in shrouded rotor systems.

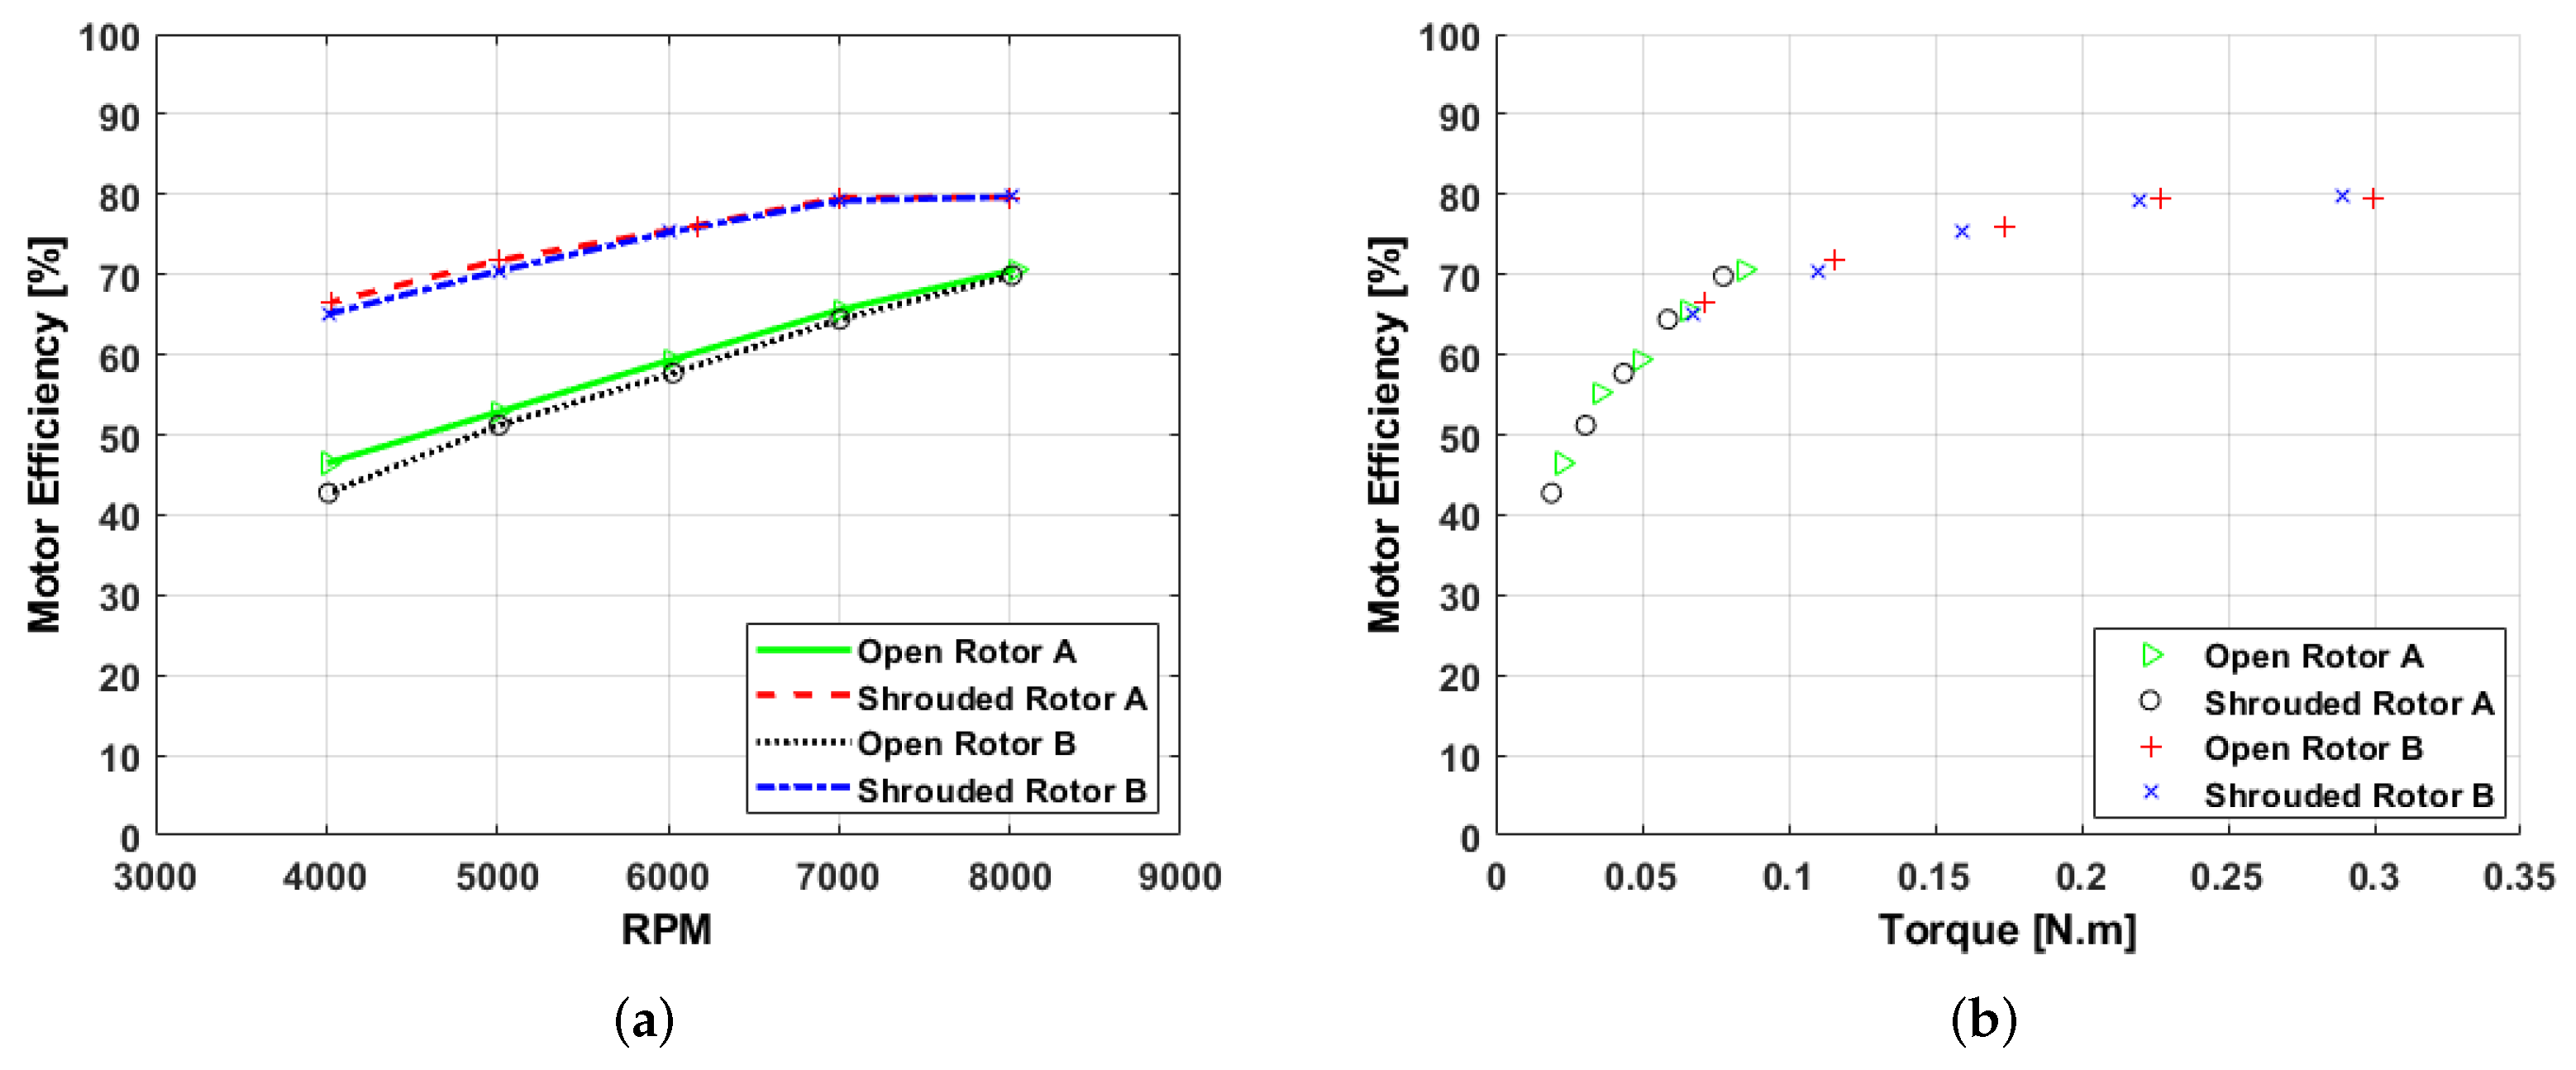
5.4. Aerodynamic and BLDC Motor Efficiencies

Aerodynamic hovering rotor efficiency is influenced by a multitude of factors, including disk area, solidity, blade aspect ratio, airfoil properties, and tip speed, making its definition and optimization a complex task. Figure 15a illustrates the relationship between thrust and mechanical power for Rotors A and B in both open and shrouded configurations, while Figure 15b presents the power loading (T/P), which serves as a measure of hovering efficiency. The results clearly highlight the superior performance of the shrouded rotor compared to the open rotor for Rotor B. This enhanced performance can be attributed to the fact that Rotor B is specifically optimized for operation with a shroud during its design phase.
In contrast, Rotor A, which features a basic, non-optimized design without consideration for shrouding, does not exhibit any significant performance or efficiency improvements when shrouded. This lack of improvement underscores the importance of designing rotors with the shroud in mind, as the aerodynamic interactions between the rotor and shroud are highly sensitive to design parameters. This suggests that the shroud, when applied to a non-optimized rotor, can introduce additional aerodynamic losses or inefficiencies that outweigh its potential benefits. These findings emphasize the critical importance of optimizing rotors for shrouded operation during the design phase. Simply adding a shroud to a non-optimized rotor does not guarantee improved performance or efficiency; instead, it may lead to sub-optimal results. Therefore, a complete design approach that integrates the rotor and shroud as a unified system is essential for achieving the full potential of shrouded rotor configurations.
In Figure 15b, the degradation in the thrust-to-mechanical-power ratio with increasing RPM can be attributed to the fundamental difference in how thrust and power scale with velocity. Thrust is primarily a function of the square of velocity, while mechanical power varies with the cube of velocity. As RPM increases, the velocity of the rotor blades increases accordingly, leading to a quadratic increase in thrust but a cubic increase in power. This means that at higher rotational speeds, power consumption grows at a much faster rate than thrust production, causing a decline in the overall thrust per unit mechanical power. This behavior suggests the existence of a preferable range in the RPM where the open/shrouded rotor operates at high efficiency. Operating within this range maximizes the thrust-to-power ratio, ensuring optimal performance with minimal energy consumption.
Figure 16 compares the mechanical and electrical power outputs of the two rotors (Rotor A and Rotor B), operating in both open and shrouded configurations. The open rotor configuration consumes higher mechanical power output compared to the shrouded rotor configuration at the same RPM, highlighting the performance enhancement provided by the shroud.
The efficiency of a BLDC motor, defined as the ratio of mechanical power to electrical power, is illustrated in Figure 17a for Rotor A and Rotor B operating in both open and shrouded configurations at various rotational speeds. The results indicate that the efficiency is influenced by load conditions, with Rotor A showing reduced efficiency due to its lower load range compared to Rotor B. Figure 17b illustrates the relationship between motor efficiency and load torque, which is a critical factor in selecting a motor that aligns with the designed load range. Understanding this relationship ensures the motor operates efficiently within the intended load parameters, optimizing performance and energy usage.

6. Conclusions

This study presented the design, manufacturing, and testing of a custom test rig aimed at accurately measuring the performance of both open and shrouded rotors. The rig is designed to minimize external structural influences on the measurements. The test rig uses a two-axis load cell for precise thrust and torque readings and an additional thrust load cell for capturing total thrust in shrouded rotor configurations. The setup allowed for a detailed evaluation of rotor performance in hovering regime, with data collected on thrust, torque, RPM, motor voltage, and current. The rig’s design proved effective in producing reliable experimental results based on the calculated uncertainty analysis.
The comparison between CFD simulations and experimental data highlighted the importance of considering the test rig’s aerodynamic influence, particularly in open rotor configurations. However, for shrouded rotors, the rig’s influence on total thrust was found to be small and can be neglected. The test rig’s design, which incorporates load cells to measure total and rotor thrust forces separately, is validated by the distinct curves for rotor and total thrust. These measurements demonstrate the rig’s capability to isolate rotor thrust from the total system’s thrust, which is critical for accurate evaluation of rotor performance in shrouded configurations.
The close agreement between the CFD results and experimental data highlights the value of experiments in validating numerical models. While the CFD simulations provided good predictions, the experimental measurements served as a crucial part of confirming their accuracy, particularly for complex aerodynamic systems like shrouded rotors. For instance, discrepancies between initial CFD predictions and experimental results led to refinements in the turbulence model selection and mesh resolution, ultimately improving the accuracy of the simulations. This iterative process demonstrates how experiments can guide the development of more reliable numerical models.
The results demonstrate that shrouded rotors can outperform open rotors when designed specifically for shrouded operation, as seen with Rotor B, which achieved higher thrust and efficiency due to its optimized design. Conversely, Rotor A, lacking such optimization, showed no significant performance gains when shrouded, underscoring the importance of tailored rotor–shroud integration during the design process. The shroud contributes significantly to the total thrust, compensating for the reduced rotor thrust caused by increased induced velocity in shrouded configurations. Overall, these insights emphasize the necessity of optimization for shrouded rotors to fully leverage their potential advantages in performance and efficiency.
While these findings focus primarily on hover conditions and aerodynamic performance, the central scope of this study, they provide foundational insights that could inform future work on transitional flight. Two limitations warrant future attention: firstly, the static mounting configuration cannot simulate transitional flight dynamics, and secondly, integrated thrust measurements lack complementary flowfield data. Future work will explore trade-offs in transitional flight, leveraging the design framework validated here.
The ability to measure the efficiency of a BLDC motor provides valuable analysis of how the motor responds to changes in load and speed, leading to identifying the optimal operating range. So, the motor can be fine-tuned to deliver peak efficiency, minimize energy losses, enhance overall performance, improve reliability, and reduce operating costs over the motor’s lifespan.

Author Contributions

All authors conducted the research, analyzed the data, and approved the final version. A.D. has conducted the experiments, simulations, and the analysis. A.R.-S. and R.J.M. have revised the work and developed the conclusions. All authors have read and agreed to the published version of the manuscript.

Funding

This research received no external funding.

Data Availability Statement

The original contributions presented in this study are included in the article. Further inquiries can be directed to the corresponding author.

Conflicts of Interest

The authors declare that the research was conducted in the absence of any commercial or financial relationships that could be construed as potential conflicts of interest.

Appendix A

Table A1. Random uncertainty percentages of the measured data for shrouded Rotor B.
RPMTotal ThrustRotor ThrustTorque
0.4671.0791.540.873
0.1670.7060.5481.36
0.4391.281.351.053
0.2520.8770.3600.198
0.1770.3840.6230.363

References

  1. Leishman, G.J. Principles of Helicopter Aerodynamics with CD Extra; Cambridge University Press: Cambridge, UK, 2006. [Google Scholar]
  2. Ruggiero, F.; Lippiello, V.; Ollero, A. Aerial manipulation: A literature review. IEEE Robot. Autom. Lett. 2018, 3, 1957–1964. [Google Scholar] [CrossRef]
  3. Ibrahim, N.A.; Zakaria, M.Y.; Kamal, A.M. Simulation of tilt-rotor UAV flight dynamics in horizontal flight. In Proceedings of the International Conference on Aerospace Sciences and Aviation Technology, The Military Technical College, Cairo, Egypt, 9–11 May 2023; Volume 20, pp. 1–14. [Google Scholar]
  4. Johnson, B.; Lind, R. High angle-of-attack flight dynamics of small UAVs. In Proceedings of the 47th AIAA Aerospace Sciences Meeting Including the New Horizons Forum and Aerospace Exposition, Orlando, FL, USA, 5–8 January 2009; p. 61. [Google Scholar]
  5. Ning, Z. Experimental Investigations on the Aerodynamic and Aeroacoustic Characteristics of Small UAS Propellers. Ph.D. Thesis, Iowa State University, Ames, IA, USA, 2018. [Google Scholar]
  6. Ma, T.; Wang, X.; Qiao, N.; Zhang, Z.; Fu, J.; Bao, M. A Conceptual Design and Optimization Approach for Distributed Electric Propulsion eVTOL Aircraft Based on Ducted-Fan Wing Unit. Aerospace 2022, 9, 690. [Google Scholar] [CrossRef]
  7. Graf, W.; Fleming, J.; Ng, W. Improving ducted fan UAV aerodynamics in forward flight. In Proceedings of the 46th AIAA Aerospace Sciences Meeting and Exhibit, Reno, NV, USA, 7–10 January 2008; p. 430. [Google Scholar]
  8. Seddon, J.M.; Newman, S. Basic Helicopter Aerodynamics; John Wiley & Sons: Hoboken, NJ, USA, 2011; Volume 35. [Google Scholar]
  9. Davis, D. Ducted Propulsors-Progress in the United Kingdom; Technical Report, SAE Technical Paper; SAE: Pittsburgh, PA, USA, 1975. [Google Scholar]
  10. Chang, I.C.; Rajagopalan, R. CFD analysis for ducted fans with validation. In Proceedings of the 21st AIAA Applied Aerodynamics Conference, Big Sky, MT, USA, 8–15 March 2003; p. 4079. [Google Scholar]
  11. Goodson, K.W.; Grunwald, K.J. Aerodynamic Characteristics of a Powered Semispan Tilting-Shrouded-Propeller VTOL Model in Hovering and Transition Flight; National Aeronautics and Space Administration: Washington, DC, USA, 1962; Volume 981.
  12. Mort, K.W.; Yaggy, P.F. Aerodynamic Characteristics of a 4-Foot-Diameter Ducted Fan Mounted on the Tip of a Semispan Wing; National Aeronautics and Space Administration: Washington, DC, USA, 1962; Volume 1301.
  13. Newsom, W.A. Aerodynamic Characteristics of Four-Duct Tandem VTOL-Aircraft Configurations; National Aeronautics and Space Administration: Washington, DC, USA, 1963.
  14. Spreemann, K.P. Wind Tunnel Investigation of Longitudinal Aerodynamic Characteristics of a Powered Four-Duct-Propeller VTOL Model in Transition; Technical Report; National Aeronautics and Space Administration: Washington, DC, USA, 1966.
  15. Ai, T.; Fan, W.; Xu, B.; Xiang, C.; Zhang, Y.; Zhao, Z. Aerodynamic analysis and modeling of coaxial ducted fan aircraft with the ceiling effect. Eng. Appl. Comput. Fluid Mech. 2021, 15, 1563–1584. [Google Scholar] [CrossRef]
  16. Li, H.; Chen, Z.; Jia, H. Experimental Investigation on Hover Performance of a Ducted Coaxial-Rotor UAV. Sensors 2023, 23, 6413. [Google Scholar] [CrossRef] [PubMed]
  17. Graf, W.E. Effects of Duct Lip Shaping and Various Control Devices on the Hover and Forward Flight Performance of Ducted Fan UAVs. Ph.D. Thesis, Virginia Tech, Blacksburg, VA, USA, 2005. [Google Scholar]
  18. Myers, L.M. Aerodynamic Experiments on a Ducted Fan in Hover and Edgewise Flight. Master’s Thesis, The Pennsylvania State University, University Park, PA, USA, 2009. [Google Scholar]
  19. Cho, L.; Lee, S.; Cho, J. Numerical and experimental analyses of the ducted fan for the small VTOL UAV propulsion. Trans. Jpn. Soc. Aeronaut. Space Sci. 2013, 56, 328–336. [Google Scholar] [CrossRef]
  20. Akturk, A.; Camci, C. Tip clearance investigation of a ducted fan used in VTOL unmanned aerial vehicles—Part I: Baseline experiments and computational validation. J. Turbomach. 2014, 136, 021004. [Google Scholar] [CrossRef]
  21. Han, H.; Xiang, C.; Xu, B.; Yu, Y. Experimental and computational analysis of microscale shrouded coaxial rotor in hover. In Proceedings of the 2017 International Conference on Unmanned Aircraft Systems (ICUAS), Miami, FL, USA, 13–16 June 2017; IEEE: Piscataway, NJ, USA, 2017; pp. 1092–1100. [Google Scholar]
  22. Wang, J.; Chen, R.; Lu, J. Experimental and numerical studies on the effect of airflow separation suppression on aerodynamic performance of a ducted coaxial propeller in hovering. Aerospace 2022, 10, 11. [Google Scholar] [CrossRef]
  23. Dayhoum, A.; Ramirez-Serrano, A.; Martinuzzi, R.J. Analytical Modeling of Shrouded Rotors in Hover with Experimental and Computational Validation. Actuators 2025, 14, 138. [Google Scholar] [CrossRef]
  24. Dayhoum, A.; Ramirez-Serrano, A.; Martinuzzi, R. Aerodynamic Optimization and Experimental Analysis of Shrouded Rotor Blades. In Proceedings of the Vertical Flight Society’s 80th Annual Forum & Technology Display (VFS 2024), Montreal, QC, Canada, 7–9 May 2024. [Google Scholar]
  25. Dayhoum, A.; Ramirez-Serrano, A.; Martinuzzi, R. Aerodynamic Investigation of Shrouded Rotors with Dual Exit Channels. Int. J. Mech. Eng. Robot. Res. (IJMERR) 2024, 13, 470–476. [Google Scholar]
  26. Dayhoum, A.; Ramirez-Serrano, A.; Martinuzzi, R. Number of Blades Influence on Rotor Performance in Open and Shrouded Configurations: Experimental Analysis. Aerospace 2024, 11, 644. [Google Scholar] [CrossRef]
  27. Bendat, J.S.; Piersol, A.G. Random Data: Analysis and Measurement Procedures; John Wiley & Sons: Hoboken, NJ, USA, 2011; Volume 729. [Google Scholar]
  28. Beyer, W.H. Handbook of Tables for Probability and Statistics; CRC Press: Boca Raton, FL, USA, 2019. [Google Scholar]
  29. Coleman, H.W.; Steele, W.G. Experimentation, Validation, and Incertainty Analysis for Engineers; John Wiley & Sons: Hoboken, NJ, USA, 2018. [Google Scholar]
  30. Siavash, N.K.; Najafi, G.; Hashjin, T.T.; Ghobadian, B.; Mahmoodi, E. An innovative variable shroud for micro wind turbines. Renew. Energy 2020, 145, 1061–1072. [Google Scholar] [CrossRef]
  31. Zakariaa, A.F.; Nasirb, M.F.M.; bin Mukhtar, A.; Ridzuand, M.N. Design Analysis of Open and Ducted Propellers in UAV Application. J. Kejuruter. SI 2022, 5, 119–125. [Google Scholar] [CrossRef]
  32. Siddiqi, Z.; Lee, J.W. Experimental and numerical study of novel Coanda-based unmanned aerial vehicle. J. Eng. Appl. Sci. 2022, 69, 76. [Google Scholar] [CrossRef]
Figure 1. Shrouded and open rotor fixtures [26]. (a) Open rotor test rig; (b) shrouded rotor test rig.
Electronics 14 01584 g001
Figure 2. Navig8 UAV with the used shroud design. (a) Navig8 UAV in flight. (b) The used shroud.
Electronics 14 01584 g002
Figure 3. Designed test rig.
Electronics 14 01584 g003
Figure 4. A schematic diagram of the instrumentation connections.
Electronics 14 01584 g004
Figure 5. Thrust and torque calibration mechanisms. (a) Thrust calibration. (b) Torque calibration.
Electronics 14 01584 g005
Figure 6. Selected rotors for the present study. (a) Rotor A. (b) Rotor B.
Electronics 14 01584 g006
Figure 7. Simulated shrouded rotor with and without test rig. (a) Shrouded rotor W/O test rig. (b) Open rotor W/O test rig. (c) Shrouded rotor with test rig. (d) Open rotor with test rig.
Electronics 14 01584 g007
Figure 8. Stationary and rotating domains used in the simulation.
Electronics 14 01584 g008
Figure 9. Grid dependency study results. (a) Total thrust convergence. (b) Torque convergence.
Electronics 14 01584 g009
Figure 10. Experimental plotted over Computational results with and without test rig for open Rotors A and B. (a) Thrust. (b) Torque.
Electronics 14 01584 g010
Figure 11. Downwash velocity contour for open rotor with and without the test rig.
Electronics 14 01584 g011
Figure 12. Experimental plotted over Computational results with and without test rig for shrouded Rotors A and B. (a) Total thrust. (b) Torque.
Electronics 14 01584 g012
Figure 13. Downwash velocity contour for shrouded rotor with and without the test rig.
Electronics 14 01584 g013
Figure 14. Measured total and rotor thrust of Rotor A and B. (a) Rotor A total and rotor thrust. (b) Rotor B total and rotor thrust.
Electronics 14 01584 g014
Figure 15. Performance and efficiency of the used open and shrouded rotors. (a) Thrust versus mechanical power. (b) Power loading at different rotational velocities.
Electronics 14 01584 g015
Figure 16. Mechanical and electrical power for Rotor A and B. (a) Rotor A mechanical and electrical power. (b) Rotor B mechanical and electrical power.
Electronics 14 01584 g016
Figure 17. BLDC motor efficiency while operating Rotor A and Rotor B. (a) BLDC motor efficiency versus RPM. (b) BLDC motor efficiency versus torque.
Electronics 14 01584 g017
Table 1. Load cell specifications.
ModelCALT DYDW-003CALT DYLY-103
MeasurandThrustTorqueTotal Thrust
Range0–98.1 N0–3 Nm0–98.1 N
Sensitivity0.9 mV/V0.5 mV/V2 mV/V
Accuracy0.3% rdg0.03% rdg
Non-Linearity0.1% F.S.0.1% F.S.
Table 2. Experimental operating conditions.
RotorAmbient Pressure [ Pa ] Temperature [ K ] Density [ kg / m 3 ]
A89,3002951.054
B89,8002961.057
Table 3. ANSYS fluent simulation conditions [23].
Turbulence ModelRealizable k ϵ
Wall TreatmentEnhanced Wall Function
SolverPressure based
Spatial Discretization
GradientLeast square cell based
Pressure MethodSecond Order
Turbulent kinetic EnergyFirst-Order Upwind
Turbulent Dissipation RateFirst-Order Upwind
Disclaimer/Publisher’s Note: The statements, opinions and data contained in all publications are solely those of the individual author(s) and contributor(s) and not of MDPI and/or the editor(s). MDPI and/or the editor(s) disclaim responsibility for any injury to people or property resulting from any ideas, methods, instructions or products referred to in the content.

