
NSC-YOLOv8: A Small Target Detection Method for UAV-Acquired Images Based on Self-Adaptive Embedding


Abstract
1. Introduction
- We incorporate an NDB based on dimensional transformations to the backbone. It lessens the information loss from downsampling in small object detection by better preserving important information in feature maps.
- We integrate an SAEB into the model, which self-adaptively embeds features that are prone to loss into the output features and minimizes the loss of low-dimensional features through a residual structure.
- We add a CARB to the model, which selectively extracts key features during the feature extraction process while effectively preserving important information in low-resolution data, thus enhancing the correlation of contextual features.
- We introduce a small-target detection head with extended receptive fields, enabling our model to effectively integrate deep and surface features. Because the compact detection head has fewer input channels, the parameters of the full detection head are reduced.
2. Related Work
2.1. Target Detection Models
2.2. YOLO Network
2.3. Small Object Detection
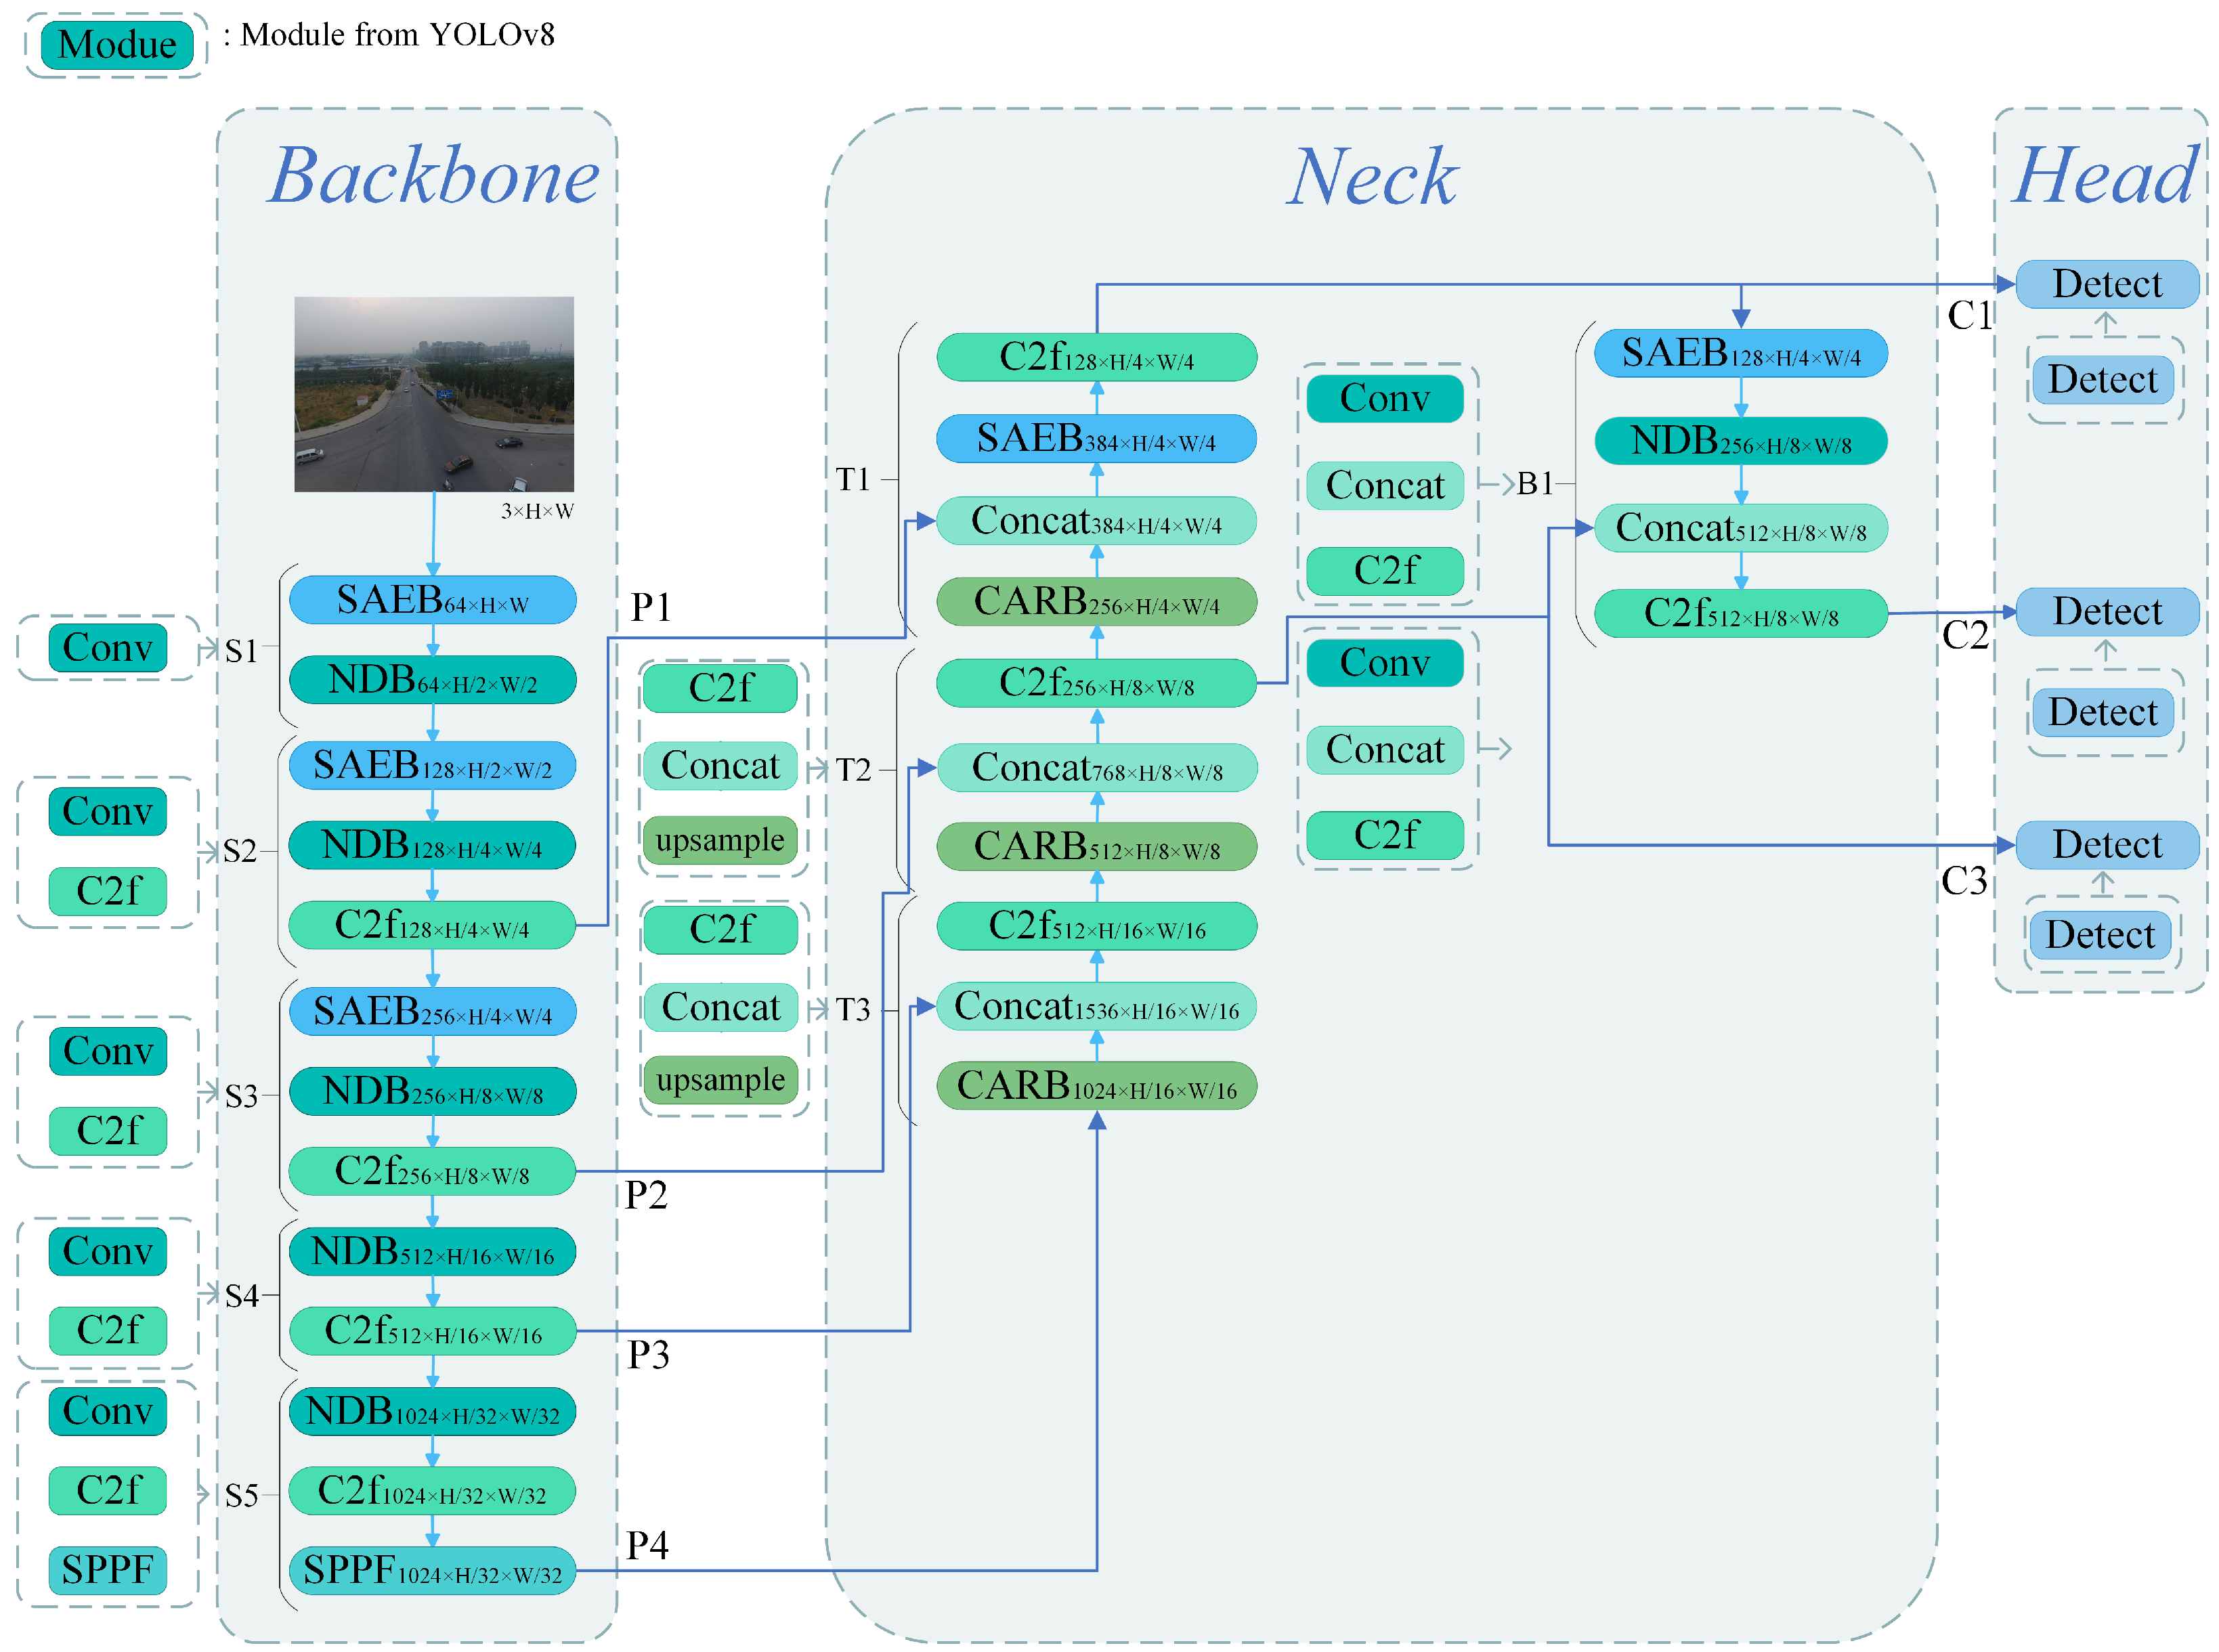
3. Methods
3.1. Backbone
NDB Module
3.2. Neck
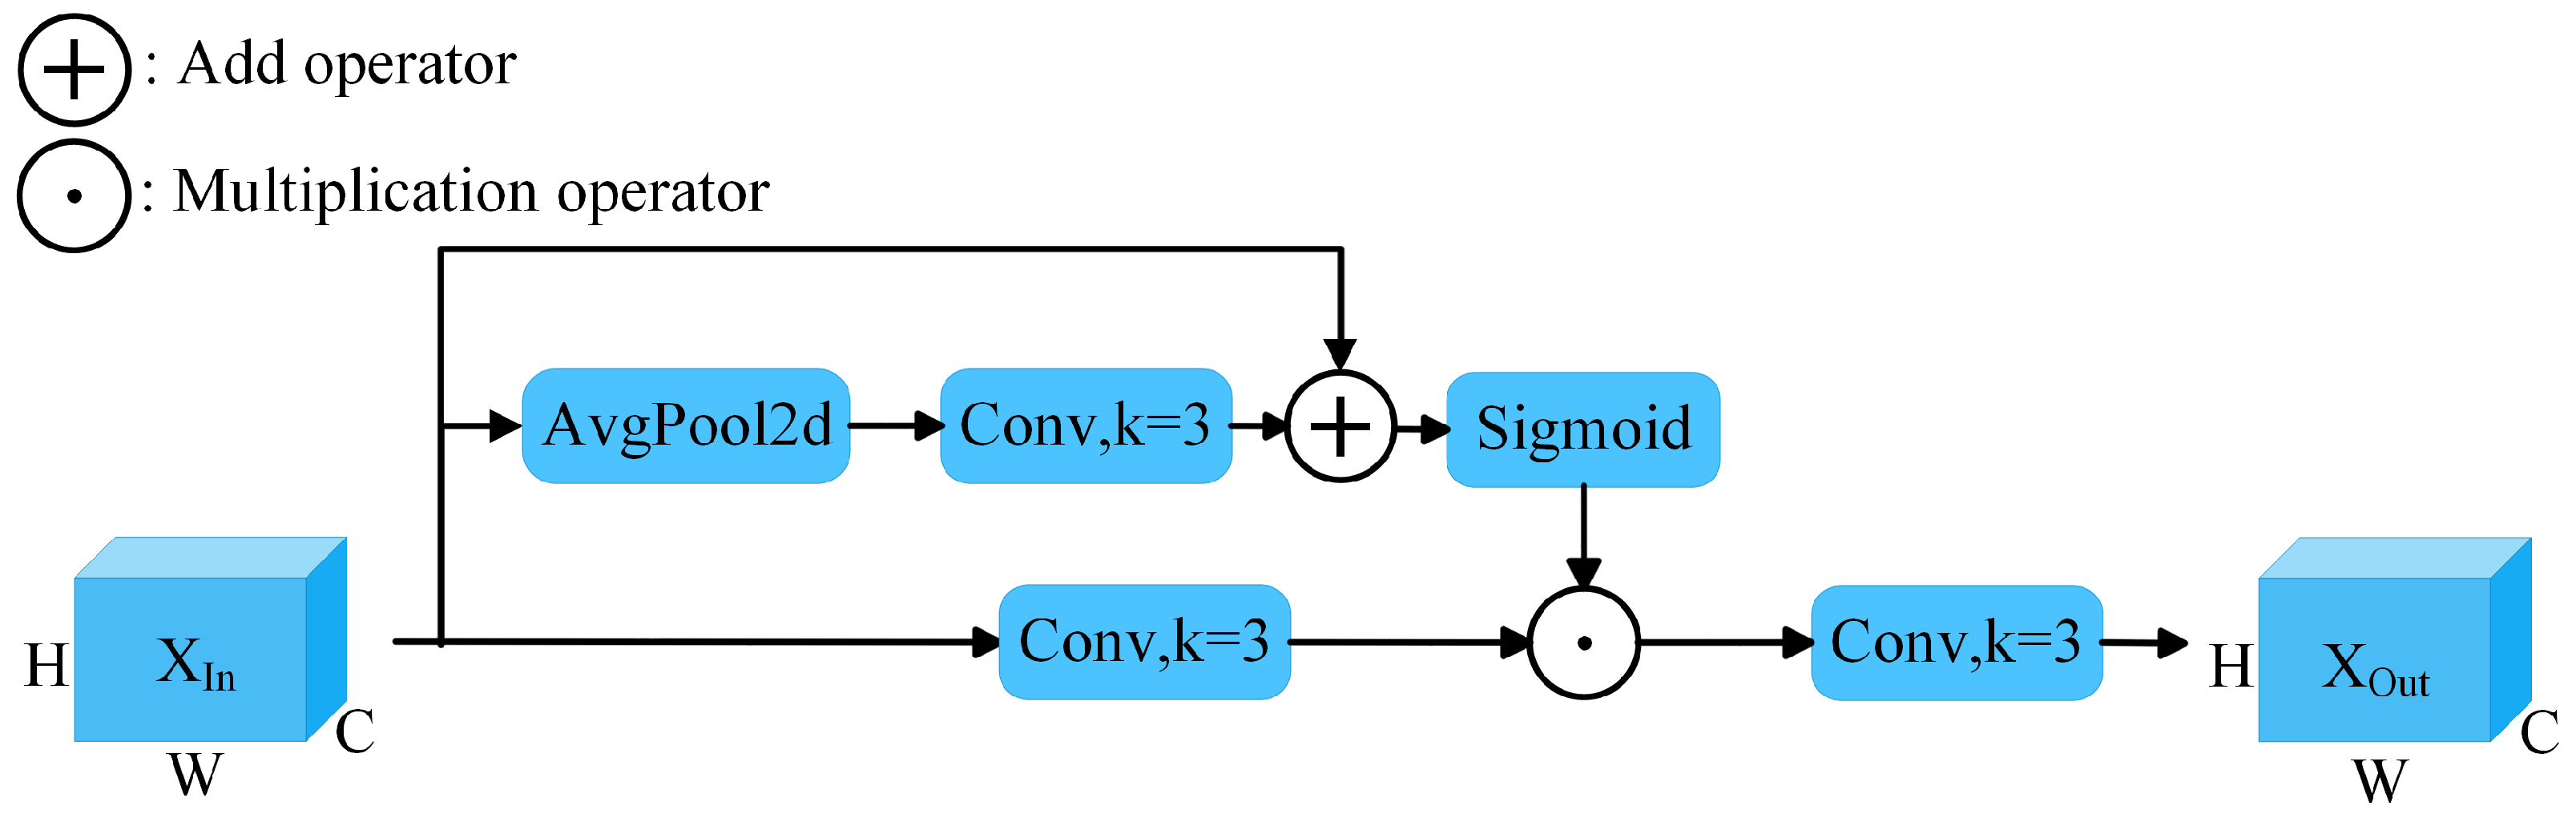
3.2.1. SAEB Module
3.2.2. CARB Module
3.3. Head
4. Experiments
4.1. Dataset and Settings
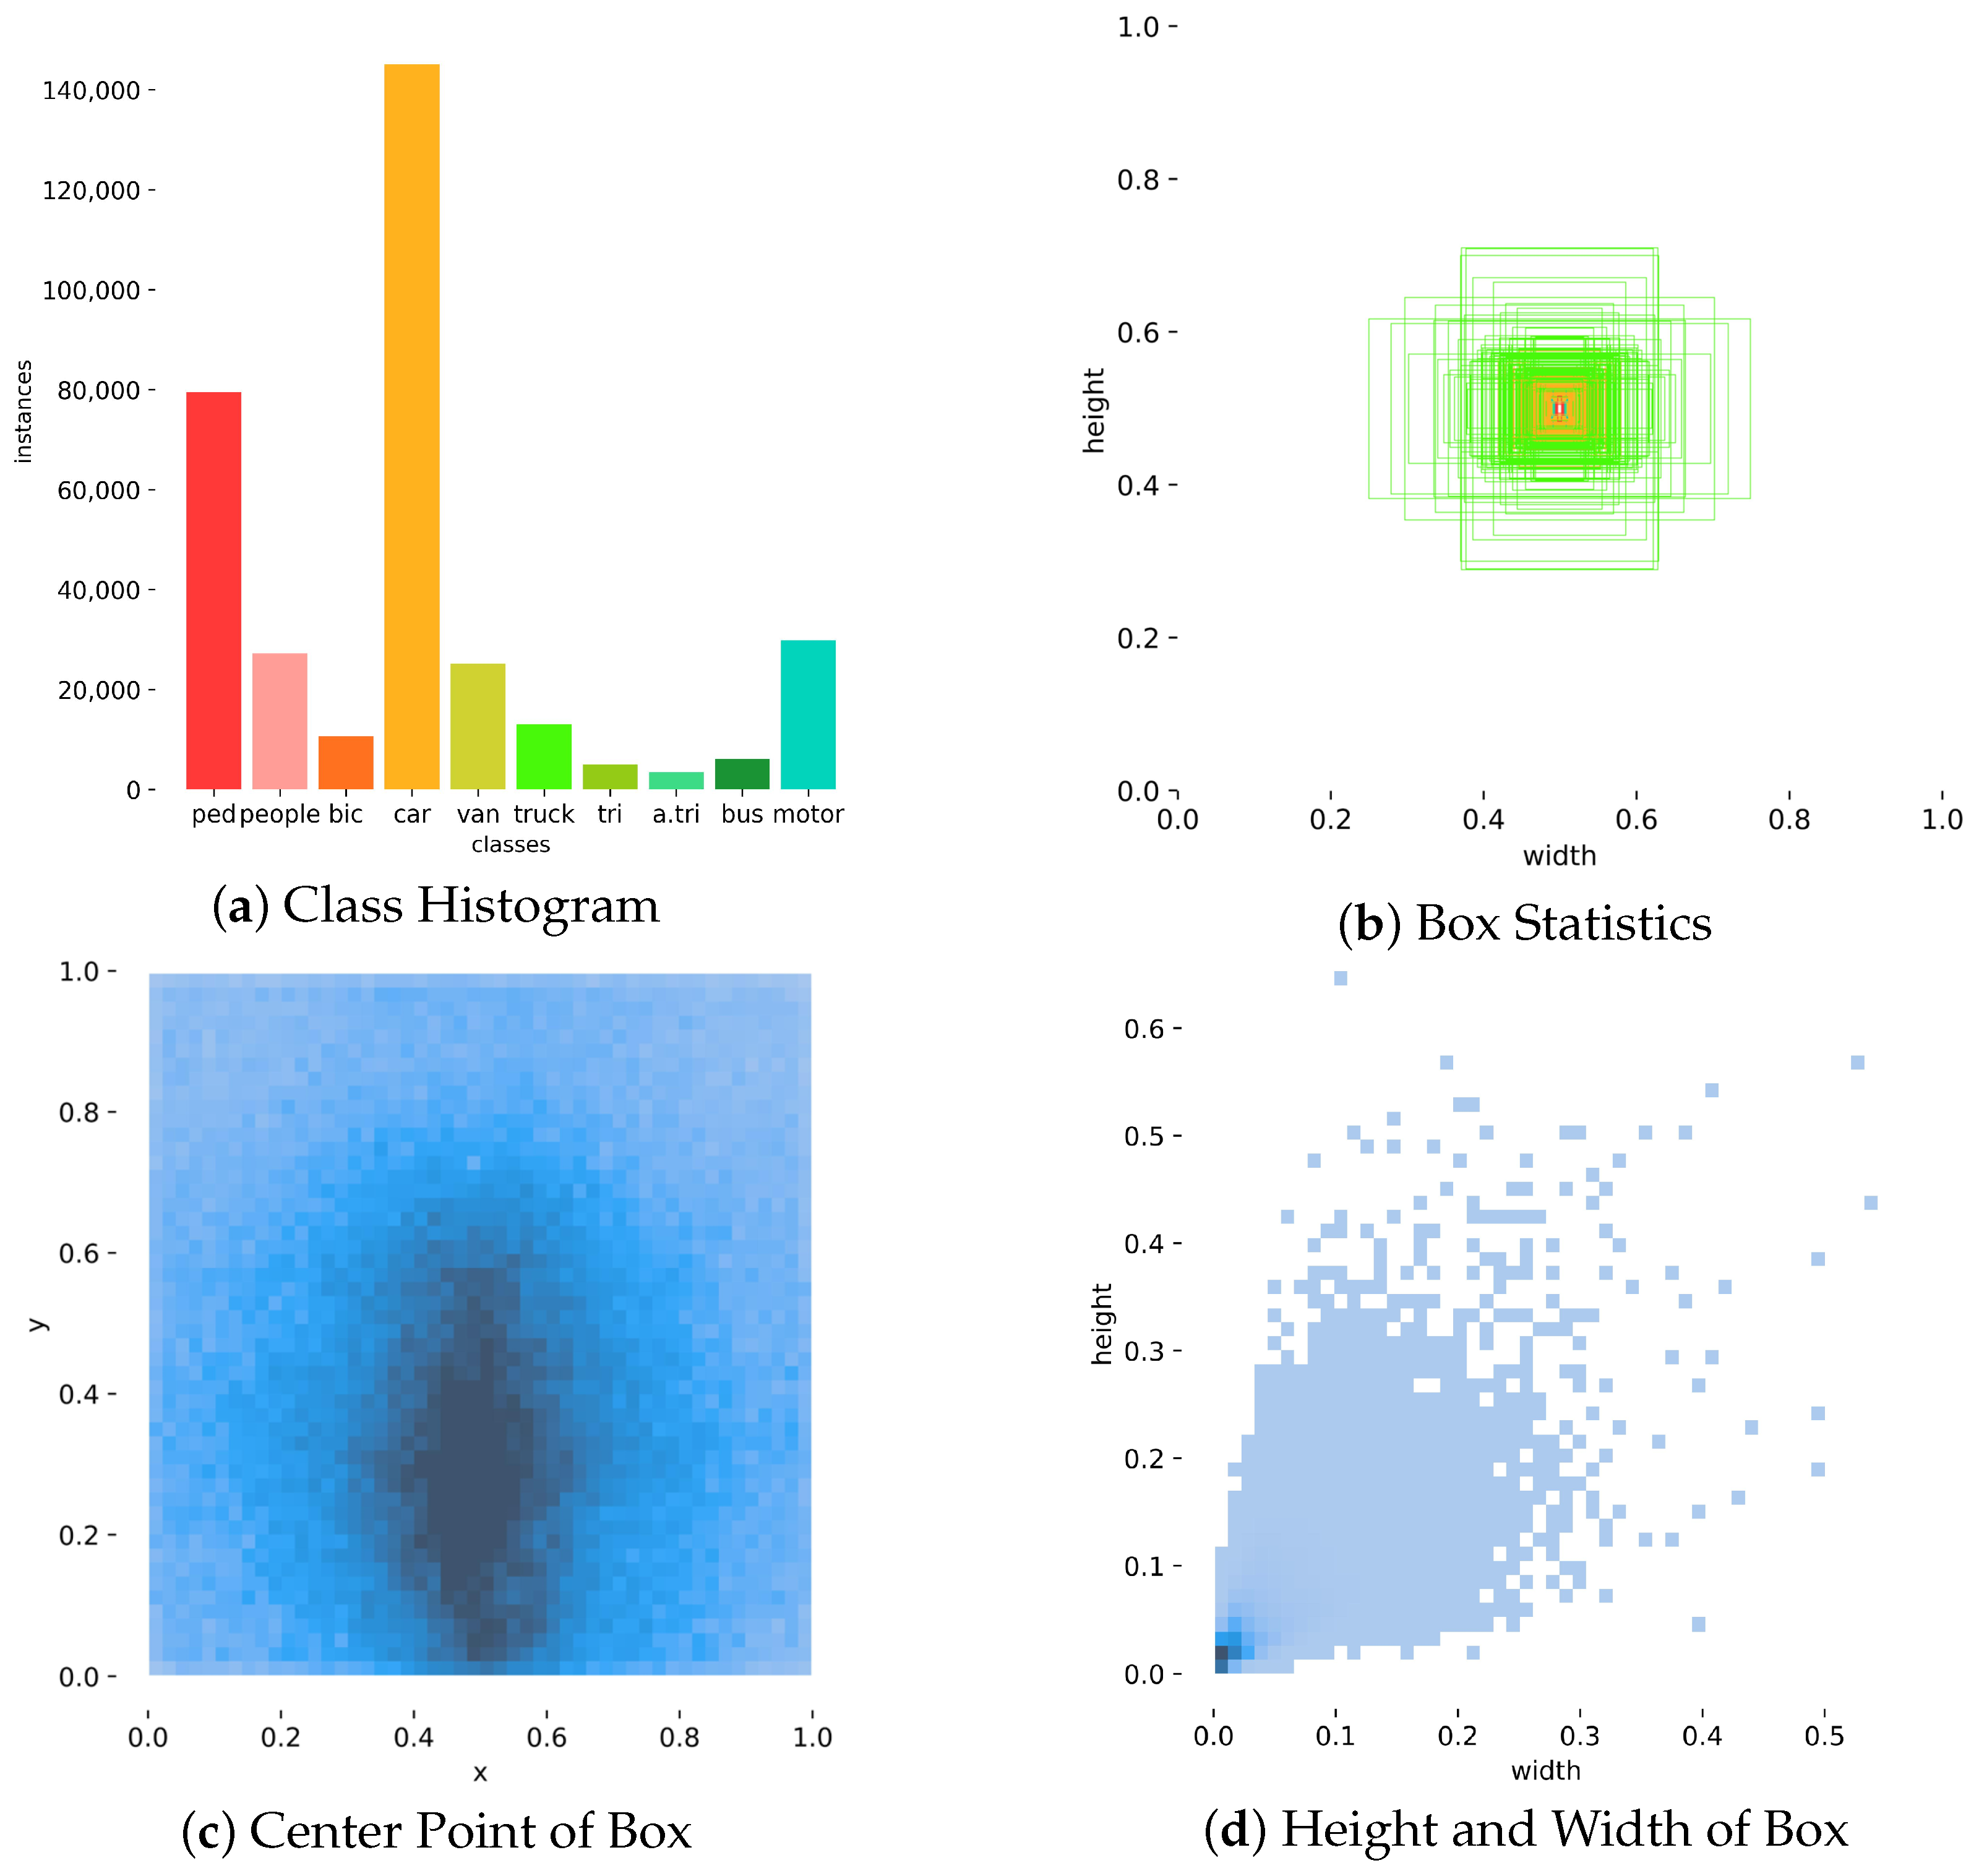
4.1.1. Dataset
4.1.2. Experimental Settings
4.1.3. Training Strategies
4.1.4. Evaluation Indicators
4.2. Ablation Experiment
4.2.1. Small Target Detection Head
4.2.2. Comparison of Loss Functions
4.2.3. Ablation of the NDB Module
4.2.4. Ablation of the SAEB Module
4.2.5. Ablation of the CARB Module
4.2.6. Overall Performance
4.3. Comparison Experiment
4.3.1. Comparison with YOLOv8
4.3.2. Comparison with the YOLO Series
4.3.3. Comparison with Existing Models

| Model | Precision (%) | Recall (%) | mAP@0.5 (%) | mAP@0.5–0.95 (%) |
|---|---|---|---|---|
| RetinaNet | - | - | 21.4 | 11.8 |
| Faster R-CNN | - | - | 41.8 | 21.8 |
| Cascade R-CNN [52] | - | - | 39.1 | 24.3 |
| ClusDet | - | - | 56.2 | 32.4 |
| HRDNet [53] | - | - | 62.0 | 35.5 |
| SAIC-FPN [54] | - | - | 62.3 | 35.7 |
| UAV-YOLOv8(s) | 54.4 | 45.6 | 47.0 | 29.2 |
| BGF-YOLOv10(n) | - | - | 32.0 | - |
| CMS-YOLOv7 [44] | - | - | 52.3 | 30.7 |
| DC-YOLOv8 [55] | 52.7 | 40.1 | 41.5 | 24.7 |
| Drone-YOLO [56] | - | - | 44.3 | 27.0 |
| Ours(n) | 56.0 | 44.4 | 46.6 | 27.9 |
| Ours(s) | 59.7 | 50.5 | 53.0 | 33.1 |
| Ours(m) | 61.8 | 52.9 | 55.5 | 34.7 |
| Ours(l) | 63.1 | 54.5 | 57.1 | 36.3 |
| Ours(x) | 65.2 | 55.0 | 58.3 | 37.4 |
4.3.4. Comparison with the Downsampling Module
4.3.5. Comparison with CBAM and SAEB
4.3.6. Comparison with the UAVDT Dataset
4.4. Visualization and Analysis
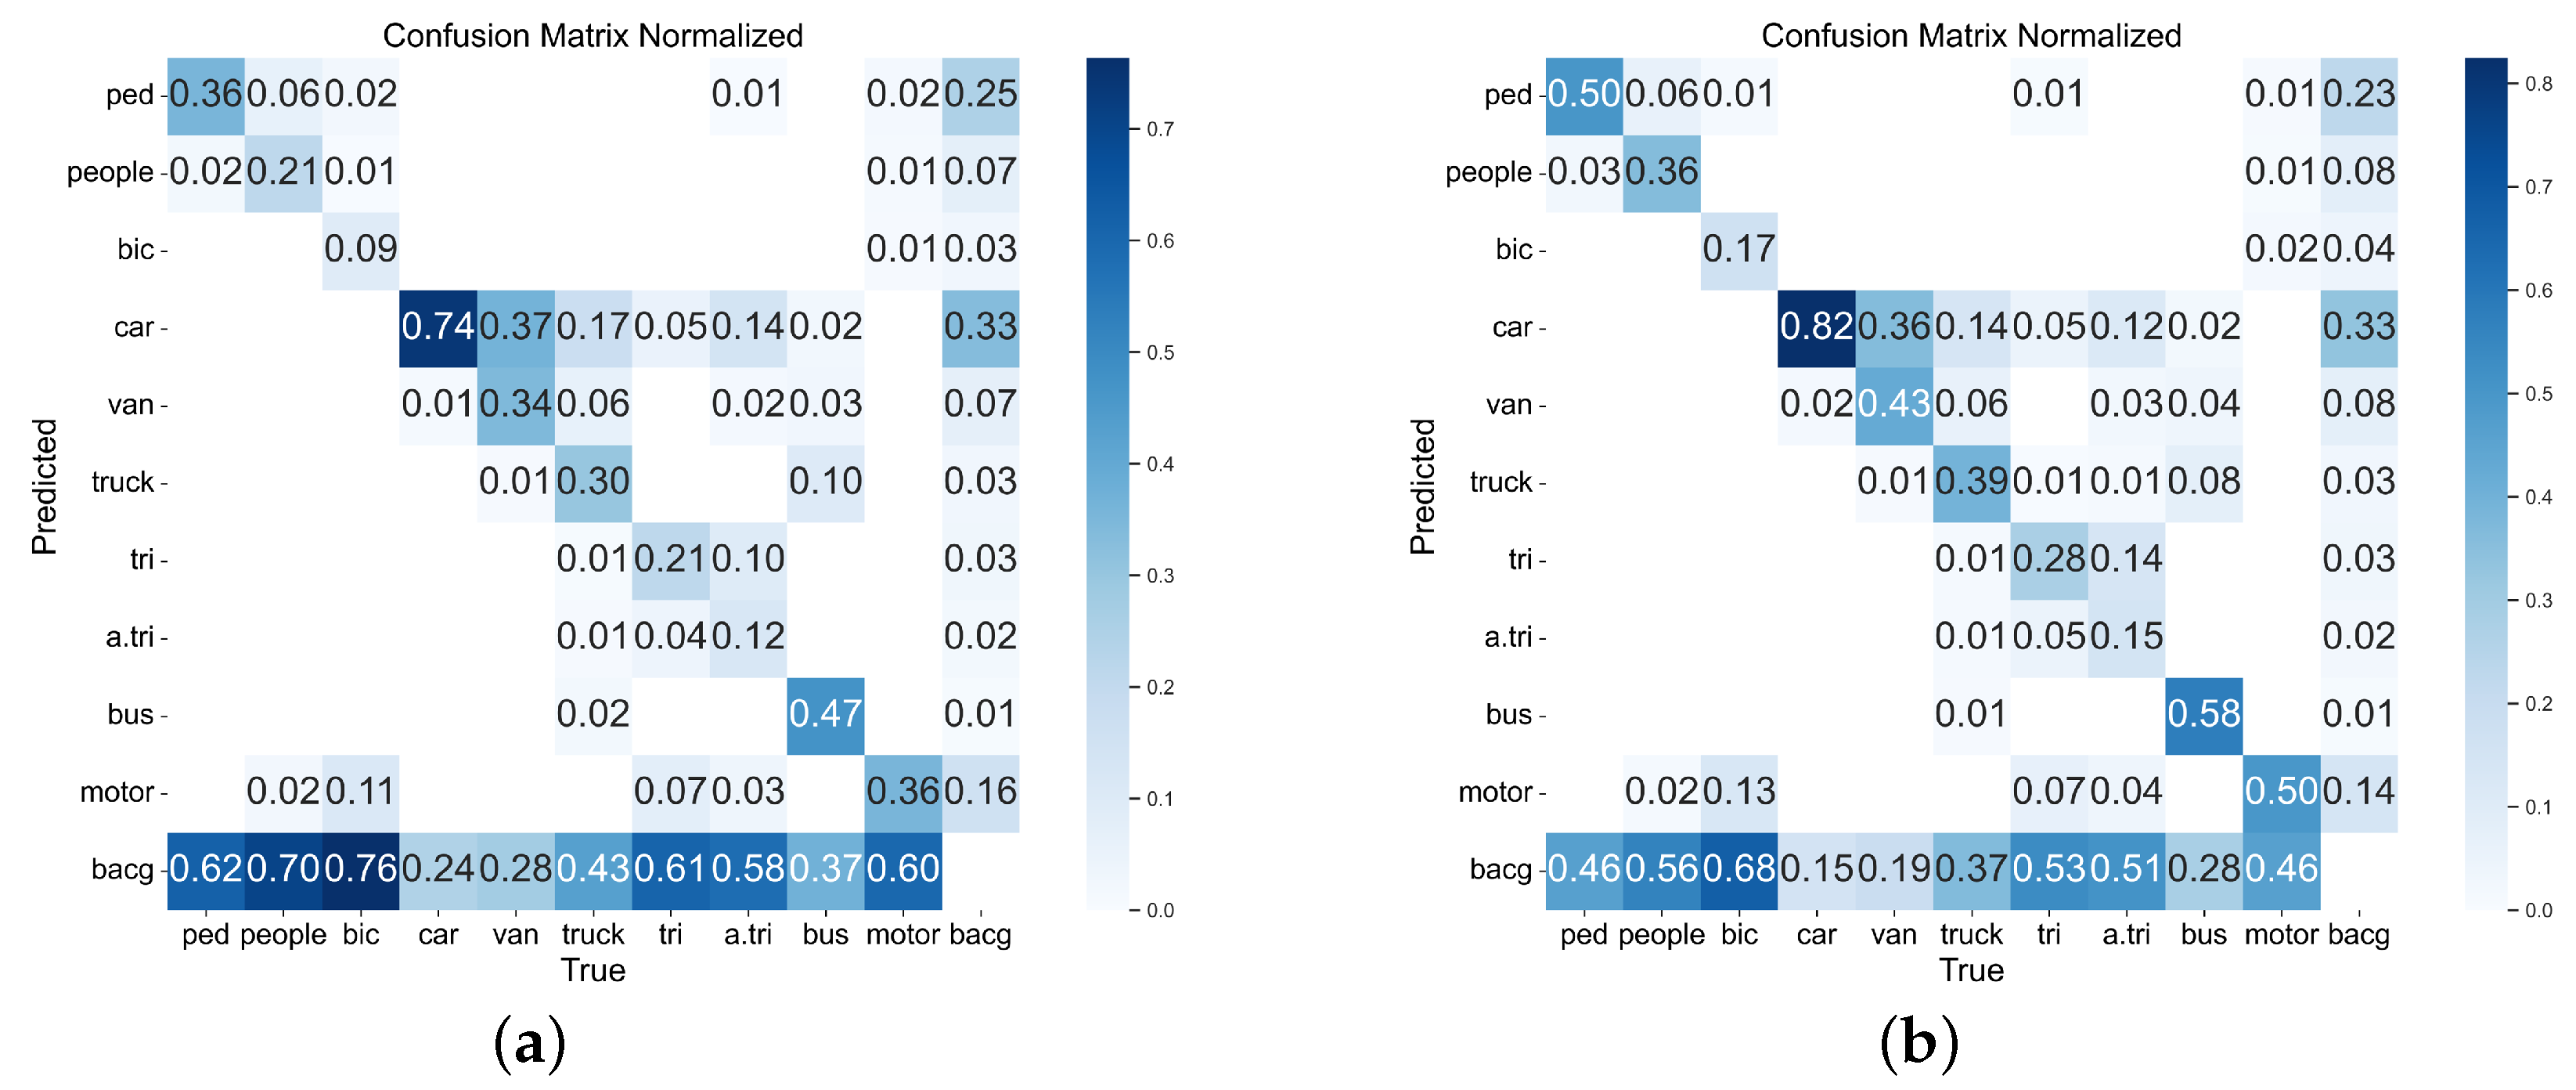
4.4.1. Confusion Matrix
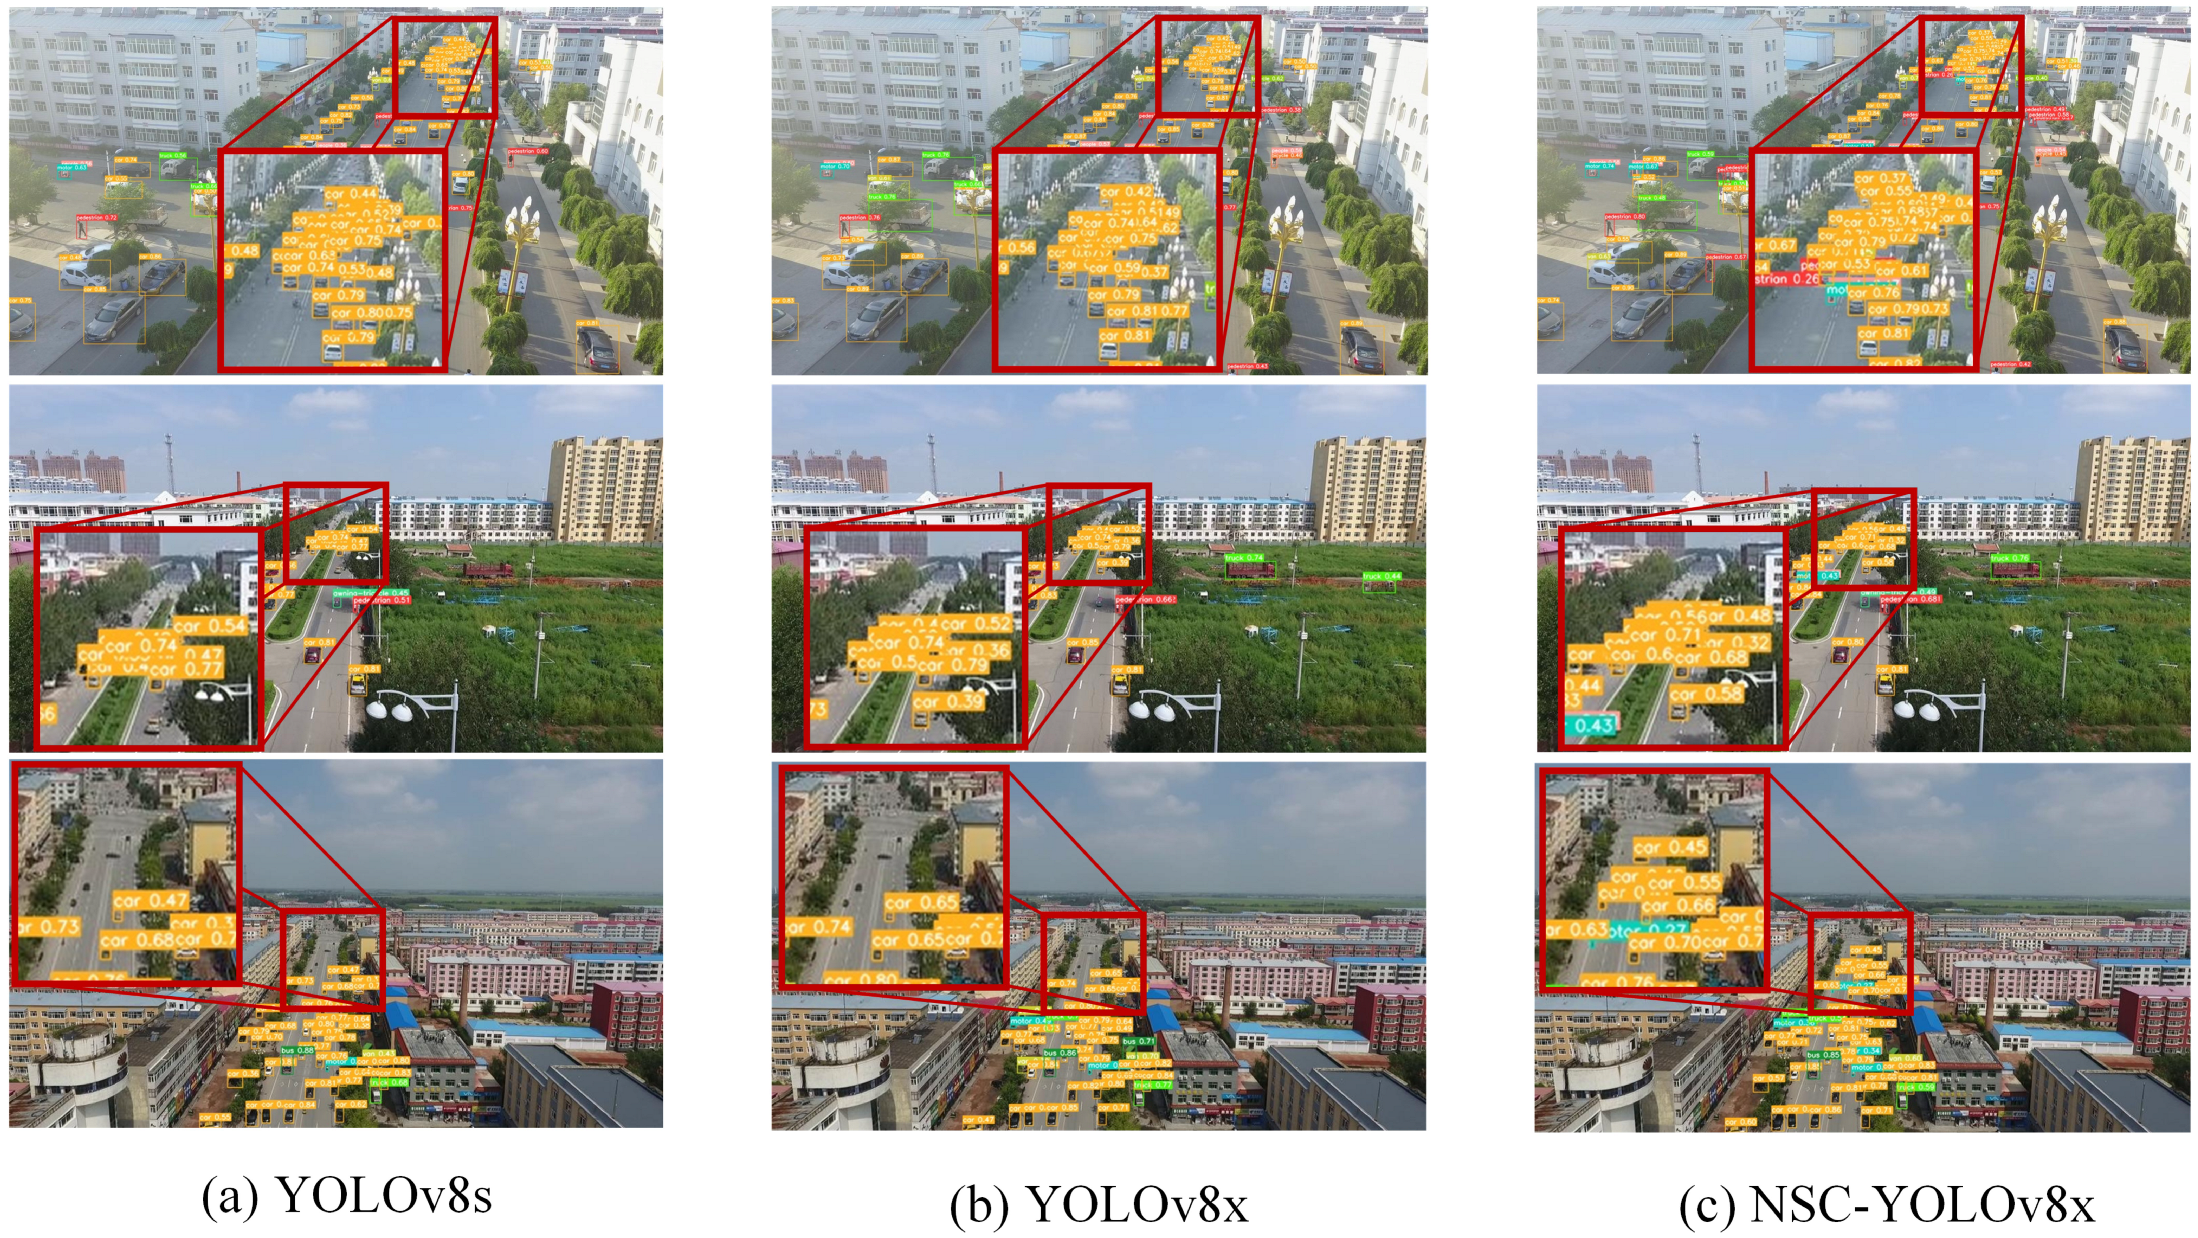
4.4.2. Inference Results
5. Conclusions
Author Contributions
Funding
Data Availability Statement
Acknowledgments
Conflicts of Interest
References
- Dong, J.; Zhang, Y. Optimization of Autonomous UAV Control Technology based on Computer Algorithms. In Proceedings of the 2022 IEEE International Conference on Advances in Electrical Engineering and Computer Applications (AEECA), Dalian, China, 20–21 August 2022; IEEE: Piscataway, NJ, USA, 2022; pp. 194–197. [Google Scholar]
- Lee, M.; Choi, M.; Yang, T.; Kim, J.; Kim, J.; Kwon, O.; Cho, N. A study on the advancement of intelligent military drones: Focusing on reconnaissance operations. IEEE Access 2024, 12, 55964–55975. [Google Scholar] [CrossRef]
- Puri, V.; Nayyar, A.; Raja, L. Agriculture drones: A modern breakthrough in precision agriculture. J. Stat. Manag. Syst. 2017, 20, 507–518. [Google Scholar] [CrossRef]
- Sowmya, V.; Janani, A.S.; Hussain, S.M.; Aashica, A.; Arvindh, S. Creating a resilient solution: Innovating an emergency response drone for natural disasters. In Proceedings of the 2024 10th International Conference on Communication and Signal Processing (ICCSP), Melmaruvathur, India, 12–14 April 2024; IEEE: Piscataway, NJ, USA, 2024; pp. 344–348. [Google Scholar]
- Zhang, R.; Galvin, R.; Li, Z. Drone-Based Geological Heritage Conservation and Exploration: Insights from Copper UNESCO Geopark. Geoheritage 2024, 16, 98. [Google Scholar] [CrossRef]
- Wang, H.; Wu, J.; Zhang, C.; Lu, W.; Ni, C. Intelligent security detection and defense in operating systems based on deep learning. Int. J. Comput. Sci. Inf. Technol. 2024, 2, 359–367. [Google Scholar] [CrossRef]
- Ahmari, R.; Hemmati, V.; Mohammadi, A.; Mynuddin, M.; Kebria, P.; Mahmoud, M.; Homaifar, A. Evaluating Trojan Attack Vulnerabilities in Autonomous Landing Systems for Urban Air Mobility. In Proceedings of the Automation, Robotics & Communications for Industry 4.0/5.0, Granada, Spain, 19–21 February 2025; p. 80. [Google Scholar]
- Xu, C.; Zhang, Y.; Chen, S. A Multi-Strategy Integrated Improved Yolov8n Algorithm and Its Application to Automatic Driving Detection. In Proceedings of the 2024 IEEE 7th International Conference on Information Systems and Computer Aided Education (ICISCAE), Dalian, China, 27–29 September 2024; IEEE: Piscataway, NJ, USA, 2024; pp. 330–336. [Google Scholar]
- Ahmari, R.; Hemmati, V.; Mohammadi, A.; Kebria, P.; Mahmoud, M.; Homaifar, A. A Data-Driven Approach for UAV-UGV Integration. In Proceedings of the Automation, Robotics & Communications for Industry 4.0/5.0, Granada, Spain, 19–21 February 2025; p. 77. [Google Scholar]
- Zhang, Y.; Lv, C.; Wang, D.; Mao, W.; Li, J. A novel image detection method for internal cracks in corn seeds in an industrial inspection line. Comput. Electron. Agric. 2022, 197, 106930. [Google Scholar] [CrossRef]
- Zhou, J.; Hao, M.; Zhang, D.; Zou, P.; Zhang, W. Fusion PSPnet image segmentation based method for multi-focus image fusion. IEEE Photonics J. 2019, 11, 6501412. [Google Scholar] [CrossRef]
- Vedaldi, A.; Zisserman, A. Vgg Convolutional Neural Networks Practical; Department of Engineering Science, University of Oxford: Oxford, UK, 2016; Volume 66. [Google Scholar]
- Ronneberger, O.; Fischer, P.; Brox, T. U-Net: Convolutional Networks for Biomedical Image Segmentation. In Proceedings of the Medical Image Computing and Computer-Assisted Intervention–MICCAI 2015: 18th International Conference, Munich, Germany, 5–9 October 2015; Proceedings, Part III 18. Springer: Cham, Switzerland, 2015; pp. 234–241. [Google Scholar]
- Akbari, Y.; Almaadeed, N.; Al-Maadeed, S.; Elharrouss, O. Applications, databases and open computer vision research from drone videos and images: A survey. Artif. Intell. Rev. 2021, 54, 3887–3938. [Google Scholar] [CrossRef]
- Wang, X.; He, N.; Hong, C.; Wang, Q.; Chen, M. Improved YOLOX-X based UAV aerial photography object detection algorithm. Image Vis. Comput. 2023, 135, 104697. [Google Scholar] [CrossRef]
- Liu, W.; Anguelov, D.; Erhan, D.; Szegedy, C.; Reed, S.; Fu, C.Y.; Berg, A.C. Ssd: Single Shot Multibox Detector. In Proceedings of the Computer Vision–ECCV 2016: 14th European Conference, Amsterdam, The Netherlands, 11–14 October 2016; Proceedings, Part I 14. Springer: Cham, Switzerland, 2016; pp. 21–37. [Google Scholar]
- He, K.; Zhang, X.; Ren, S.; Sun, J. Deep residual learning for image recognition. In Proceedings of the IEEE Conference on Computer Vision and Pattern Recognition, Las Vegas, NV, USA, 27–30 June 2016; pp. 770–778. [Google Scholar]
- Lin, T.Y.; Dollár, P.; Girshick, R.; He, K.; Hariharan, B.; Belongie, S. Feature pyramid networks for object detection. In Proceedings of the IEEE Conference on Computer Vision and Pattern Recognition, Honolulu, HI, USA, 21–26 July 2017; pp. 2117–2125. [Google Scholar]
- Redmon, J.; Divvala, S.; Girshick, R.; Farhadi, A. You only look once: Unified, real-time object detection. In Proceedings of the IEEE Conference on Computer Vision and Pattern Recognition, Las Vegas, NV, USA, 27–30 June 2016; pp. 779–788. [Google Scholar]
- Ren, S.; He, K.; Girshick, R.; Sun, J. Faster r-cnn: Towards real-time object detection with region proposal networks. Adv. Neural Inf. Process. Syst. 2015, 28, 91–99. [Google Scholar] [CrossRef]
- Jiang, P.; Ergu, D.; Liu, F.; Cai, Y.; Ma, B. A Review of Yolo algorithm developments. Procedia Comput. Sci. 2022, 199, 1066–1073. [Google Scholar] [CrossRef]
- Liu, Y.; Sun, P.; Wergeles, N.; Shang, Y. A survey and performance evaluation of deep learning methods for small object detection. Expert Syst. Appl. 2021, 172, 114602. [Google Scholar] [CrossRef]
- Kaur, R.; Singh, S. A comprehensive review of object detection with deep learning. Digit. Signal Process. 2023, 132, 103812. [Google Scholar] [CrossRef]
- Zou, Z.; Chen, K.; Shi, Z.; Guo, Y.; Ye, J. Object detection in 20 years: A survey. Proc. IEEE 2023, 111, 257–276. [Google Scholar] [CrossRef]
- Zhang, H.; Cloutier, R.S. Review on One-Stage Object Detection Based on Deep Learning. EAI Endorsed Trans. e-Learn. 2022, 7, 1–10. [Google Scholar] [CrossRef]
- Du, L.; Zhang, R.; Wang, X. Overview of two-stage object detection algorithms. J. Phys. Conf. Ser. 2020, 1544, 012033. [Google Scholar] [CrossRef]
- Girshick, R. Fast r-cnn. In Proceedings of the IEEE International Conference on Computer Vision, Santiago, Chile, 7–13 December 2015; pp. 1440–1448. [Google Scholar]
- Girshick, R.; Donahue, J.; Darrell, T.; Malik, J. Region-based convolutional networks for accurate object detection and segmentation. IEEE Trans. Pattern Anal. Mach. Intell. 2015, 38, 142–158. [Google Scholar] [CrossRef]
- Farhadi, A.; Redmon, J. Yolov3: An incremental improvement. In Proceedings of the Computer Vision and Pattern Recognition, Salt Lake City, UT, USA, 18–22 June 2018; Springer: Berlin/Heidelberg, Germany, 2018; Volume 1804, pp. 1–6. [Google Scholar]
- Bochkovskiy, A.; Wang, C.Y.; Liao, H.Y.M. Yolov4: Optimal speed and accuracy of object detection. arXiv 2020, arXiv:2004.10934. [Google Scholar]
- Wang, C.Y.; Bochkovskiy, A.; Liao, H.Y.M. YOLOv7: Trainable bag-of-freebies sets new state-of-the-art for real-time object detectors. In Proceedings of the IEEE/CVF Conference on Computer Vision and Pattern Recognition, Vancouver, BC, Canada, 17–24 June 2023; pp. 7464–7475. [Google Scholar]
- Tian, Y.; Ye, Q.; Doermann, D. Yolov12: Attention-centric real-time object detectors. arXiv 2025, arXiv:2502.12524. [Google Scholar]
- Zendehdel, N.; Chen, H.; Leu, M.C. Real-time tool detection in smart manufacturing using You-Only-Look-Once (YOLO) v5. Manuf. Lett. 2023, 35, 1052–1059. [Google Scholar] [CrossRef]
- He, P.; Chen, W.; Pang, L.; Zhang, W.; Wang, Y.; Huang, W.; Han, Q.; Xu, X.; Qi, Y. The survey of one-stage anchor-free real-time object detection algorithms. In Proceedings of the Sixth Conference on Frontiers in Optical Imaging and Technology: Imaging Detection and Target Recognition, Nanjing, China, 22–24 October 2023; SPIE: Bellingham, WA, USA, 2024; Volume 13156, p. 1315602. [Google Scholar]
- Zheng, Z.; Wang, P.; Liu, W.; Li, J.; Ye, R.; Ren, D. Distance-IoU loss: Faster and better learning for bounding box regression. In Proceedings of the AAAI Conference on Artificial Intelligence, New York, NY, USA, 7–12 February 2020; Volume 34, pp. 12993–13000. [Google Scholar]
- Zhang, H.; Cisse, M.; Dauphin, Y.N.; Lopez-Paz, D. mixup: Beyond empirical risk minimization. arXiv 2017, arXiv:1710.09412. [Google Scholar]
- Du, D.; Zhu, P.; Wen, L.; Bian, X.; Lin, H.; Hu, Q.; Peng, T.; Zheng, J.; Wang, X.; Zhang, Y.; et al. VisDrone-DET2019: The vision meets drone object detection in image challenge results. In Proceedings of the IEEE/CVF International Conference on Computer Vision Workshops, Seoul, Republic of Korea, 27–28 October 2019; pp. 0–0. [Google Scholar]
- Yang, F.; Fan, H.; Chu, P.; Blasch, E.; Ling, H. Clustered object detection in aerial images. In Proceedings of the IEEE/CVF International Conference on Computer Vision, Seoul, Republic of Korea, 27 October–2 November 2019; pp. 8311–8320. [Google Scholar]
- Liang, X.; Zhang, J.; Zhuo, L.; Li, Y.; Tian, Q. Small object detection in unmanned aerial vehicle images using feature fusion and scaling-based single shot detector with spatial context analysis. IEEE Trans. Circuits Syst. Video Technol. 2019, 30, 1758–1770. [Google Scholar] [CrossRef]
- Hong, M.; Li, S.; Yang, Y.; Zhu, F.; Zhao, Q.; Lu, L. SSPNet: Scale selection pyramid network for tiny person detection from UAV images. IEEE Geosci. Remote. Sens. Lett. 2021, 19, 8018505. [Google Scholar] [CrossRef]
- Deng, C.; Wang, M.; Liu, L.; Liu, Y.; Jiang, Y. Extended feature pyramid network for small object detection. IEEE Trans. Multimed. 2021, 24, 1968–1979. [Google Scholar] [CrossRef]
- Tong, Z.; Chen, Y.; Xu, Z.; Yu, R. Wise-IoU: Bounding box regression loss with dynamic focusing mechanism. arXiv 2023, arXiv:2301.10051. [Google Scholar]
- Sunkara, R.; Luo, T. No more strided convolutions or pooling: A new CNN building block for low-resolution images and small objects. In Proceedings of the Joint European Conference on Machine Learning and Knowledge Discovery in Databases, Grenoble, France, 19–23 September 2022; Springer: Cham, Switzerland, 2022; pp. 443–459. [Google Scholar]
- Qin, J.; Yu, W.; Feng, X.; Meng, Z.; Tan, C. A UAV Aerial Image Target Detection Algorithm Based on YOLOv7 Improved Model. Electronics 2024, 13, 3277. [Google Scholar] [CrossRef]
- Wang, A.; Chen, H.; Liu, L.; Chen, K.; Lin, Z.; Han, J. Yolov10: Real-time end-to-end object detection. Adv. Neural Inf. Process. Syst. 2024, 37, 107984–108011. [Google Scholar]
- Wang, G.; Chen, Y.; An, P.; Hong, H.; Hu, J.; Huang, T. UAV-YOLOv8: A small-object-detection model based on improved YOLOv8 for UAV aerial photography scenarios. Sensors 2023, 23, 7190. [Google Scholar] [CrossRef]
- Rezatofighi, H.; Tsoi, N.; Gwak, J.; Sadeghian, A.; Reid, I.; Savarese, S. Generalized intersection over union: A metric and a loss for bounding box regression. In Proceedings of the IEEE/CVF Conference on Computer Vision and Pattern Recognition, Long Beach, CA, USA, 16–17 June 2019; pp. 658–666. [Google Scholar]
- Zhang, Y.F.; Ren, W.; Zhang, Z.; Jia, Z.; Wang, L.; Tan, T. Focal and efficient IOU loss for accurate bounding box regression. Neurocomputing 2022, 506, 146–157. [Google Scholar] [CrossRef]
- Gevorgyan, Z. SIoU loss: More powerful learning for bounding box regression. arXiv 2022, arXiv:2205.12740. [Google Scholar]
- Mei, J.; Zhu, W. BGF-YOLOv10: Small object detection algorithm from unmanned aerial vehicle perspective based on improved YOLOv10. Sensors 2024, 24, 6911. [Google Scholar] [CrossRef]
- Zhang, J.; Yang, X.; He, W.; Ren, J.; Zhang, Q.; Zhao, Y.; Bai, R.; He, X.; Liu, J. Scale optimization using evolutionary reinforcement learning for object detection on drone imagery. In Proceedings of the AAAI Conference on Artificial Intelligence, Vancouver, BC, Canada, 20–27 February 2024; Volume 38, pp. 410–418. [Google Scholar]
- Cai, Z.; Vasconcelos, N. Cascade r-cnn: Delving into high quality object detection. In Proceedings of the IEEE Conference on Computer Vision and Pattern Recognition, Salt Lake City, UT, USA, 18–23 June 2018; pp. 6154–6162. [Google Scholar]
- Liu, Z.; Gao, G.; Sun, L.; Fang, Z. HRDNet: High-resolution detection network for small objects. In Proceedings of the 2021 IEEE International Conference on Multimedia and Expo (ICME), Shenzhen, China, 5–9 July 2021; IEEE: Piscataway, NJ, USA, 2021; pp. 1–6. [Google Scholar]
- Zhou, J.; Vong, C.M.; Liu, Q.; Wang, Z. Scale adaptive image cropping for UAV object detection. Neurocomputing 2019, 366, 305–313. [Google Scholar] [CrossRef]
- Lou, H.; Duan, X.; Guo, J.; Liu, H.; Gu, J.; Bi, L.; Chen, H. DC-YOLOv8: Small-size object detection algorithm based on camera sensor. Electronics 2023, 12, 2323. [Google Scholar] [CrossRef]
- Zhang, Z. Drone-YOLO: An efficient neural network method for target detection in drone images. Drones 2023, 7, 526. [Google Scholar] [CrossRef]


| Environmental | Configuration |
|---|---|
| CPU | i5-12400F |
| Memory | 16 G |
| Operating Systems | Windos 10 |
| GPU | NVIDIA GeForce RTX 3090 |
| GPU Memory | 24 G |
| Python IDE | pycharm |
| Python Version | 3.10.15 |
| Deep Learning Framework | Pytorch1.12.1 + Cuda11.3 |
| Hyperparameter | Allocation |
|---|---|
| Epochs | 200 |
| Batch Size | 6 |
| Input Image Size | 640 × 640 |
| Momentum | 0.932 |
| Learning Rate | 0.01 |
| Final Learning rate | 0.005 |
| Weight Decay | 0.0005 |
| Optimizer | SGD |
| Model | Precision (%) | Recall (%) | mAP@0.5 (%) | mAP@0.5– 0.95 (%) | (%) | (%) | (%) | Param (M) |
|---|---|---|---|---|---|---|---|---|
| YOLOv8s | 52.4 | 39.7 | 41.3 | 24.7 | 32.0 | 46.11 | 2.03 | 11.1 |
| 56.7 | 44.5 | 46.7 | 28.2 | 38.0 | 46.10 | 2.08 | 7.2 |
| Model | Precision (%) | Recall (%) | mAP@0.5 (%) | mAP@0.5–0.95 (%) |
|---|---|---|---|---|
| +CIoU | 56.68 | 44.47 | 46.71 | 28.19 |
| +DIoU | 56.44 | 45.13 | 47.29 | 28.45 |
| +GloU [47] | 56.82 | 44.63 | 47.32 | 28.48 |
| +EloU [48] | 56.54 | 44.79 | 46.97 | 28.22 |
| +SloU [49] | 56.46 | 44.71 | 47.30 | 28.48 |
| +WloU v1 | 56.24 | 44.71 | 46.99 | 28.22 |
| +WloU v2 | 56.79 | 45.10 | 47.36 | 28.38 |
| +WloU v3 | 57.08 | 45.15 | 47.59 | 28.71 |
| Model | Precision (%) | Recall (%) | mAP@0.5 (%) | mAP@0.5–0.95 (%) | GFLOPs |
|---|---|---|---|---|---|
| Baseline | 57.1 | 45.1 | 47.6 | 28.7 | 46.6 |
| +S1-NDB | 56.4 | 44.9 | 47.4 | 28.8 | 50.0 |
| +S2-NDB | 57.6 | 45.4 | 48.1 | 29.3 | 50.1 |
| +S3-NDB | 57.8 | 44.7 | 47.7 | 29.0 | 50.1 |
| +S4-NDB | 56.2 | 44.8 | 47.2 | 28.6 | 50.1 |
| +S5-NDB | 56.1 | 44.1 | 46.7 | 28.2 | 50.1 |
| +B1-NDB | 56.8 | 45.5 | 47.9 | 29.1 | 50.1 |
| +ALL-NDB | 57.5 | 46.1 | 48.7 | 29.9 | 75.8 |
| Model | Precision (%) | Recall (%) | mAP@0.5 (%) | mAP@0.5–0.95 (%) | GFLOPs |
|---|---|---|---|---|---|
| Baseline | 57.1 | 45.1 | 47.6 | 28.7 | 46.6 |
| +S1-SAEB | 57.0 | 45.7 | 47.9 | 28.9 | 50.6 |
| +S2-SAEB | 56.3 | 45.5 | 48.1 | 29.0 | 50.6 |
| +S3-SAEB | 56.8 | 46.2 | 48.1 | 29.2 | 50.5 |
| +T1-SAEB | 58.9 | 46.4 | 49.8 | 30.5 | 81.8 |
| +B1-SAEB | 56.1 | 46.3 | 48.0 | 28.8 | 50.6 |
| +ALL-SAEB | 58.7 | 47.5 | 50.4 | 30.9 | 97.4 |
| Model | Precision (%) | Recall (%) | mAP@0.5 (%) | mAP@0.5–0.95 (%) | GFLOPs |
|---|---|---|---|---|---|
| Baseline | 57.1 | 45.1 | 47.6 | 28.7 | 46.6 |
| +T1-CARB | 58.58 | 45.94 | 47.28 | 28.79 | 46.7 |
| +T2-CARB | 57.13 | 46.43 | 48.61 | 29.07 | 46.7 |
| +T3-CARB | 57.59 | 46.27 | 48.45 | 28.75 | 46.7 |
| +ALL-CARB | 57.78 | 46.81 | 48.93 | 29.18 | 46.7 |
| Model | DetectHead | WIoUv3 | NBD | SAEB | CARB | mAP@0.5 (%) | mAP@0.5–0.95 (%) | GFLOPs |
|---|---|---|---|---|---|---|---|---|
| YOLOv8s | 41.3 | 24.7 | 28.5 | |||||
| ✓ | 46.7 | 28.2 | 46.6 | |||||
| ✓ | ✓ | 47.6 | 28.7 | 46.6 | ||||
| ✓ | ✓ | ✓ | 48.7 | 29.9 | 75.8 | |||
| ✓ | ✓ | ✓ | ✓ | 52.9 | 32.7 | 157.7 | ||
| ✓ | ✓ | ✓ | ✓ | ✓ | 53.0 | 33.1 | 157.8 |
| Model | Precision (%) | Recall (%) | mAP@0.5 (%) | mAP@0.5– 0.95 (%) | Param (M) | (%) | FPS | GFLOPs |
|---|---|---|---|---|---|---|---|---|
| YOLOv8n | 45.2 | 33.6 | 34.3 | 19.8 | 3.0 | 28.2 | 127.0 | 8.1 |
| Ours(n) | 56.0 | 44.4 | 46.6 | 27.9 | 2.6 | 36.6 | 69.3 | 43.1 |
| YOLOv8s | 52.4 | 39.7 | 41.3 | 24.7 | 11.1 | 32.0 | 133.6 | 28.6 |
| Ours(s) | 59.7 | 50.5 | 53.0 | 33.1 | 9.9 | 38.7 | 53.3 | 157.8 |
| YOLOv8m | 55.7 | 43.9 | 45.7 | 28.0 | 25.8 | 33.3 | 91.3 | 78.7 |
| Ours(m) | 61.8 | 52.9 | 55.5 | 34.7 | 22.8 | 39.0 | 37.6 | 364.9 |
| YOLOv8l | 58.3 | 45.5 | 47.7 | 29.9 | 43.6 | 33.8 | 72.3 | 164.9 |
| Ours(l) | 63.1 | 54.5 | 57.1 | 36.3 | 39.9 | 39.8 | 29.9 | 672.8 |
| YOLOv8x | 59.8 | 46.8 | 49.4 | 30.7 | 68.1 | 34.8 | 58.4 | 257.4 |
| Ours(x) | 65.2 | 55.0 | 58.3 | 37.4 | 62.3 | 40.7 | 21.6 | 1050.3 |
| Model | Precision (%) | Recall (%) | mAP@0.5 (%) | mAP@0.5–0.95 (%) |
|---|---|---|---|---|
| YOLOv3 | 54.0 | 43.6 | 41.9 | 23.3 |
| YOLOv4 | 36.0 | 48.6 | 42.1 | 25.7 |
| YOLOv5 | 46.4 | 34.6 | 34.4 | 19.0 |
| YOLOv7 | 51.4 | 42.1 | 39.9 | 21.6 |
| YOLOv8(s) | 52.4 | 39.7 | 41.3 | 24.7 |
| YOLOv10(n) | - | - | 29.0 | - |
| Ours(n) | 56.0 | 44.4 | 46.6 | 27.9 |
| Ours(s) | 59.7 | 50.5 | 53.0 | 33.1 |
| Ours(m) | 61.8 | 52.9 | 55.5 | 34.7 |
| Ours(l) | 63.1 | 54.5 | 57.1 | 36.3 |
| Ours(x) | 65.2 | 55.0 | 58.3 | 37.4 |
| Allocation | Ours | Reference [51] | |
|---|---|---|---|
| Hyperparameter | |||
| Momentum | 0.932 | 0.9 | |
| Learning Rate | 0.01 | 0.01 | |
| Final Learning Rate | 0.005 | 0.01 | |
| Drop-Out Rate | 0.5 | 0.5 | |
| Weight Decay | 0.0005 | 0.0005 | |
| Optimizer | SGD | SGD | |
| Dataset | Visdrone2019-DET | Visdrone2019-DET | |
| Metrics | mAP&mAP@50 | mAP&mAP@50 | |
| Model | Precision (%) | Recall (%) | mAP@0.5 (%) | mAP@0.5– 0.95 (%) | (%) | Param (M) | FPS |
|---|---|---|---|---|---|---|---|
| +ALL-AdPool | 55.2 | 45.3 | 46.8 | 26.2 | 34.9 | 8.1 | 78.4 |
| +ALL-NDB | 57.5 | 46.1 | 48.7 | 29.9 | 35.7 | 8.3 | 75.5 |
| Model | Precision (%) | Recall (%) | mAP@0.5 (%) | mAP@0.5– 0.95 (%) | (%) | Param (M) | FPS |
|---|---|---|---|---|---|---|---|
| +ALL- CBAM | 52.9 | 41.9 | 43.0 | 25.5 | 36.0 | 8.2 | 72.8 |
| +ALL- SAEB | 58.7 | 47.5 | 50.4 | 30.9 | 37.9 | 8.9 | 66.9 |
| Model | Precision (%) | Recall (%) | mAP@0.5 (%) | mAP@0.5– 0.95 (%) | (%) | Param (M) | FPS |
|---|---|---|---|---|---|---|---|
| YOLOv8n | 97.4 | 96.5 | 98.9 | 78.6 | 38.9 | 3.0 | 195.6 |
| Ours(n) | 98.4 | 96.9 | 99.2 | 83.1 | 40.1 | 2.6 | 112.8 |
Disclaimer/Publisher’s Note: The statements, opinions and data contained in all publications are solely those of the individual author(s) and contributor(s) and not of MDPI and/or the editor(s). MDPI and/or the editor(s) disclaim responsibility for any injury to people or property resulting from any ideas, methods, instructions or products referred to in the content. |
© 2025 by the authors. Licensee MDPI, Basel, Switzerland. This article is an open access article distributed under the terms and conditions of the Creative Commons Attribution (CC BY) license (https://creativecommons.org/licenses/by/4.0/).
Share and Cite
Chen, D.; Chen, D.; Zhong, C.; Zhan, F. NSC-YOLOv8: A Small Target Detection Method for UAV-Acquired Images Based on Self-Adaptive Embedding. Electronics 2025, 14, 1548. https://doi.org/10.3390/electronics14081548
Chen D, Chen D, Zhong C, Zhan F. NSC-YOLOv8: A Small Target Detection Method for UAV-Acquired Images Based on Self-Adaptive Embedding. Electronics. 2025; 14(8):1548. https://doi.org/10.3390/electronics14081548
Chicago/Turabian StyleChen, Dongmin, Danyang Chen, Cheng Zhong, and Feng Zhan. 2025. "NSC-YOLOv8: A Small Target Detection Method for UAV-Acquired Images Based on Self-Adaptive Embedding" Electronics 14, no. 8: 1548. https://doi.org/10.3390/electronics14081548
APA StyleChen, D., Chen, D., Zhong, C., & Zhan, F. (2025). NSC-YOLOv8: A Small Target Detection Method for UAV-Acquired Images Based on Self-Adaptive Embedding. Electronics, 14(8), 1548. https://doi.org/10.3390/electronics14081548