Article

Microreactor Set-Ups for Screening of Droplet-Encapsulated Catalyst Particles: Fluidic and Electronic Interfacing

by
Jeroen C. Vollenbroek
1,
Anne-Eva Nieuwelink
2,
Johan G. Bomer
1,
Albert van den Berg
1,
Bert M. Weckhuysen
2,
Mathieu Odijk
1 and
Roald M. Tiggelaar
3,*
1
BIOS Lab-on-a-Chip, MESA+ Institute, University of Twente, Drienerlolaan 5, 7522 NB Enschede, The Netherlands
2
Inorganic Chemistry and Catalysis, Debye Institute for Nanomaterials Science and Institute for Sustainable and Circular Chemistry, Utrecht University, Heidelberglaan 8, 3584 CS Utrecht, The Netherlands
3
NanoLab Cleanroom, MESA+ Institute, University of Twente, Drienerlolaan 5, 7522 NB Enschede, The Netherlands
*
Author to whom correspondence should be addressed.
Electronics 2025, 14(8), 1506; https://doi.org/10.3390/electronics14081506
Submission received: 18 December 2024 / Revised: 20 March 2025 / Accepted: 4 April 2025 / Published: 9 April 2025
(This article belongs to the Section Microelectronics)

Abstract

:
The use of microfluidics for analysis of biological and chemical compounds is flourishing, with droplet microfluidics being well suited for high-throughput single substance analysis. Nowadays, many new experimental set-ups are reported that combine various fields and expertise, including, among others, microfluidics, optics, electronics, chemistry, biology, etc. This work aims to highlight the engineering effort that goes into the development and realization of experimental set-ups for obtaining ‘good’ scientific data. High quality research and results stand or fall with the quality of the set-ups that are used for obtaining said results. Unfortunately, replication of these custom-made set-ups (as well as reproducibility/gathering of data) may be hampered if not all parts are sufficiently/detailed documented in the (Electronic) Supplementary Information ((E)SI). In this work, we present detailed descriptions of the fluidic, electronic, and optical interfacings that are developed to make a microfluidic platform for the high-throughput, fluorescent-based screening of Fluidic Catalytic Cracking (FCC) catalyst particle acidity and the subsequent sorting of the most active catalyst particles.

1. Introduction

In the current era, there is an ongoing trend that researchers are encouraged to present the novelty and impact of their work by showing ‘good’ results. Similarly, upon writing scientific proposals, applicants have to focus on the end goals and the related aims of their work. As a consequence, lots of time and effort is spent on drafting and polishing figures with the aim to present data/results in the best way possible; nowadays, 3D-representations have apparently become the common standard. This is understandable because often it is good results that determine the success of scientific research projects. To achieve such good results, ample time, resources, and effort are invested into the design and construction of equipment, machinery, and dedicated set-ups. For example, the field of microfluidics and microreactors is highly application-driven, but realization of such microfluidic devices relies on the micro/nano-fabrication technology. Furthermore, to verify the functionality of these devices, often in-house designed and realized custom set-ups are used for obtaining electronic readout and control [1,2,3], as well as for benefiting from the advantages of optical imaging technologies [4,5]. Unfortunately, the set-ups and engineering aspects that are a necessity for acquiring novel and publishable results with microfluidic devices are not always provided in full detail in the experimental section or results section of scientific publications. This is, among other reasons, because the mention of such detailed information does not comply with the article format of various journals/publishers. For this reason, it might be listed in the supporting information (occasionally in an incomplete or (too) brief way). To some extent, this ‘lack of detailed information’ might hamper independent verification of published results by other researchers, since the required set-up(s) cannot be reproducibly reconstructed. From the perspective of results-driven research, this might be understandable or logical, but from an engineer’s perspective, it can be frustrating to see the importance of their work/effort moved out of the spotlight. Also, for rapidly emerging papers on AI, neural networks, and communication modeling, it is important to diligently document the used models [6,7]. It is important to stress the point that this contribution is certainly not meant as any form of criticism to authors nor journals of such publications, as it is inherent to our overall publication culture. In fact, authors are often not sufficiently incentivized by publishers, editors, and referees to add this information to the main section of articles and are often instructed to insert ‘engineering aspects’ as (Electronic) Supplementary Information ((E)SI). Whereas the main article is usually published in a template layout, the (E)SI is often published ‘as delivered’, without editorial formatting or having been given the proper attention it deserves. This frequently results in (E)SI’s that only contain a few figures with a minimum amount of text.
Furthermore, we believe that unintended incompleteness (or absence) of the above-mentioned ‘engineering information’ occurs more for scientific journals with a high (≥10) impact factor (IF) compared to ‘low’ (<10) journals due to differences in scopes/focus between these classes of journals. Examples of missing engineering aspects might be the mixing ratio of pre-polymer and curing agent as used for the fabrication of polydimethylsiloxane (PDMS) structures/devices, not reporting how tubing is connected to a developed reactor, or not listing which type of pump is used for flowing fluids through a reactor. In general, journals with a lower IF contain more publications explicitly discussing set-up descriptions, and as such are more focused on engineering aspects. Contributions in these journals include, for example, detailed device designs, CAD-model sketches, fabrication aspects as well as descriptions of (home-built) set-ups, and other device-related details [3,8,9,10,11,12,13,14,15,16].
We have analyzed eight recent (from 2022 and later) papers in the field of droplet microfluidics that comprise custom-built set-ups in order to assess how detailed their documentation regarding ‘engineering aspects’ is [17,18,19,20,21,22,23,24]. We were pleased to conclude that overall, a high level of details was reported; however, we have found aspects for improvement. In order to not criticize individual contributions, in the following, we mention our findings in a generalized fashion. Good aspects are the reporting of design sketches (including dimensions and design documents), electronic components, software architecture descriptions, pictures/images of set-ups and relevant software panels, and simulations. However, it is noticed that especially in cases where chemistry was applied, some (important) aspects were regrettably missing. For example, a possible pre-treatment of surfaces and the actual treatment times for salinization protocols (which can be difficult to make work if the surface is not activated and/or in the presence of moisture) were not always reported in full detail. Similarly, the mixing ratio (and type) of epoxy used was missing, which may affect high temperature/pressure microfluidic applications [25]. Other missing aspects that stood out were mask designs for fluidic channel layouts, process flows (i.e., machine settings in case of lithography/cleanroom processes), details of camera settings, and descriptions of input for simulations (such as tables with relevant material parameters, the physics modules and boundary conditions per face/vertice in COMSOL Multiphysics 5.2, etc.). In fact, we understand that it takes a lot of meticulous note-taking and documentation to include all details/aspects, and therefore we have provided a checklist at the end of this contribution which could be of use to assist with documentation before starting an experiment or protocol. In general, we recommend using an electronic lab journal and datalogging system that makes it easier to add all relevant documentation in a repository (i.e., GitHub, Zenodo, etc.).
The key message of this contribution is to give due credit to the engineering, which is essential but is frequently not completely documented. In fact, we want to emphasize the importance and significance of complete reporting of all possible aspects, to make new scientific developments/microfluidic platforms reproducible and meaningful. By means of this contribution, we aim to share and promote the importance of including engineering details required to obtain valuable experimental data and inspire/encourage readers to do the same (for which we provide a checklist). With this contribution, in combination with our previous papers [26,27], we intend to make it possible for readers to reproduce or replicate (parts of) set-ups and/or interfacing: although custom-designed, all parts are based on widely available, standard (and therefore relatively inexpensive) components. We hope this contribution will serve as an example and at least spark discussion among scientists on how much detail is actually “not enough”, “sufficient”, or “too much” to report. For example, we encourage considerations such as the following. Should the amount of sunlight in the lab be reported? To this, our answer is yes, if it changes the temperature of your electrochemical sensor. Should the complete optical system be cleaned and be inspected on dust before each experiment? Should the age of your optical filters be mentioned? The method of storing your chemicals? The temperature of your soldering iron? As such, this contribution does not contain a theoretical section but will aptly focus on the materials/methods and results/discussion, which are the key results of this contribution.
We illustrate our point by describing in full detail two custom designed experimental set-ups for screening of the acidity and/or dielectrophoretic sorting of single catalyst particles using microfluidic devices. In this work, we present detailed descriptions of the fluidic, electronic, and optical interfacings that are developed to make a microfluidic platform for the high-throughput, fluorescent-based screening of Fluidic Catalytic Cracking (FCC) catalyst particle acidity and the subsequent sorting of the most active catalyst particles.

2. Materials and Methods

The focus of this work is to provide detailed descriptions (viz. engineering aspects) of developed set-ups to microreactors used for screening of catalyst particles encapsulated in droplets, i.e., electronic, fluidic, and optical interfacing. As a consequence, this section, ‘Materials and Methods’, is embedded in the section entitled ‘Results and Discussion’.

3. Results and Discussion

In the following two subsections, various engineering aspects of platforms used for the screening of microreactor-based droplet-encapsulated catalyst particles are described, which are essential for obtaining ‘good’ results.

3.1. Acidity Screening Platform

This section describes the interfacing and set-up that is used for operating a droplet microreactor platform for high-throughput (~2.4 s a particle is screened) fluorescence-based acidity screening of FCC ECAT particles at 95 °C [26]. In short, a microreactor was designed in which single catalyst particles are encapsulated in droplets. These particles are preloaded with 4-methoxystyrene, which oligomerizes inside the particle at the aforementioned temperature and forms a fluorescent product. The fluorescence of a particle depends on its acidity and the signal intensity of each particle is detected. Since all particles experience identical reaction conditions, the platform is used to investigate the acidity of catalyst particles in a statistically relevant way. The developed silicon–glass microreactor (see Figure 2 in [26]) has three integrated microheaters and two temperature sensors to control the temperature and an optical window for fluorescence detection (the design file (in CleWin v6.0 software) and process flow for fabrication are available in the ‘Supplementary Files’). A thermal simulation is carried out to estimate the required power to heat up fluids in a microchannel.

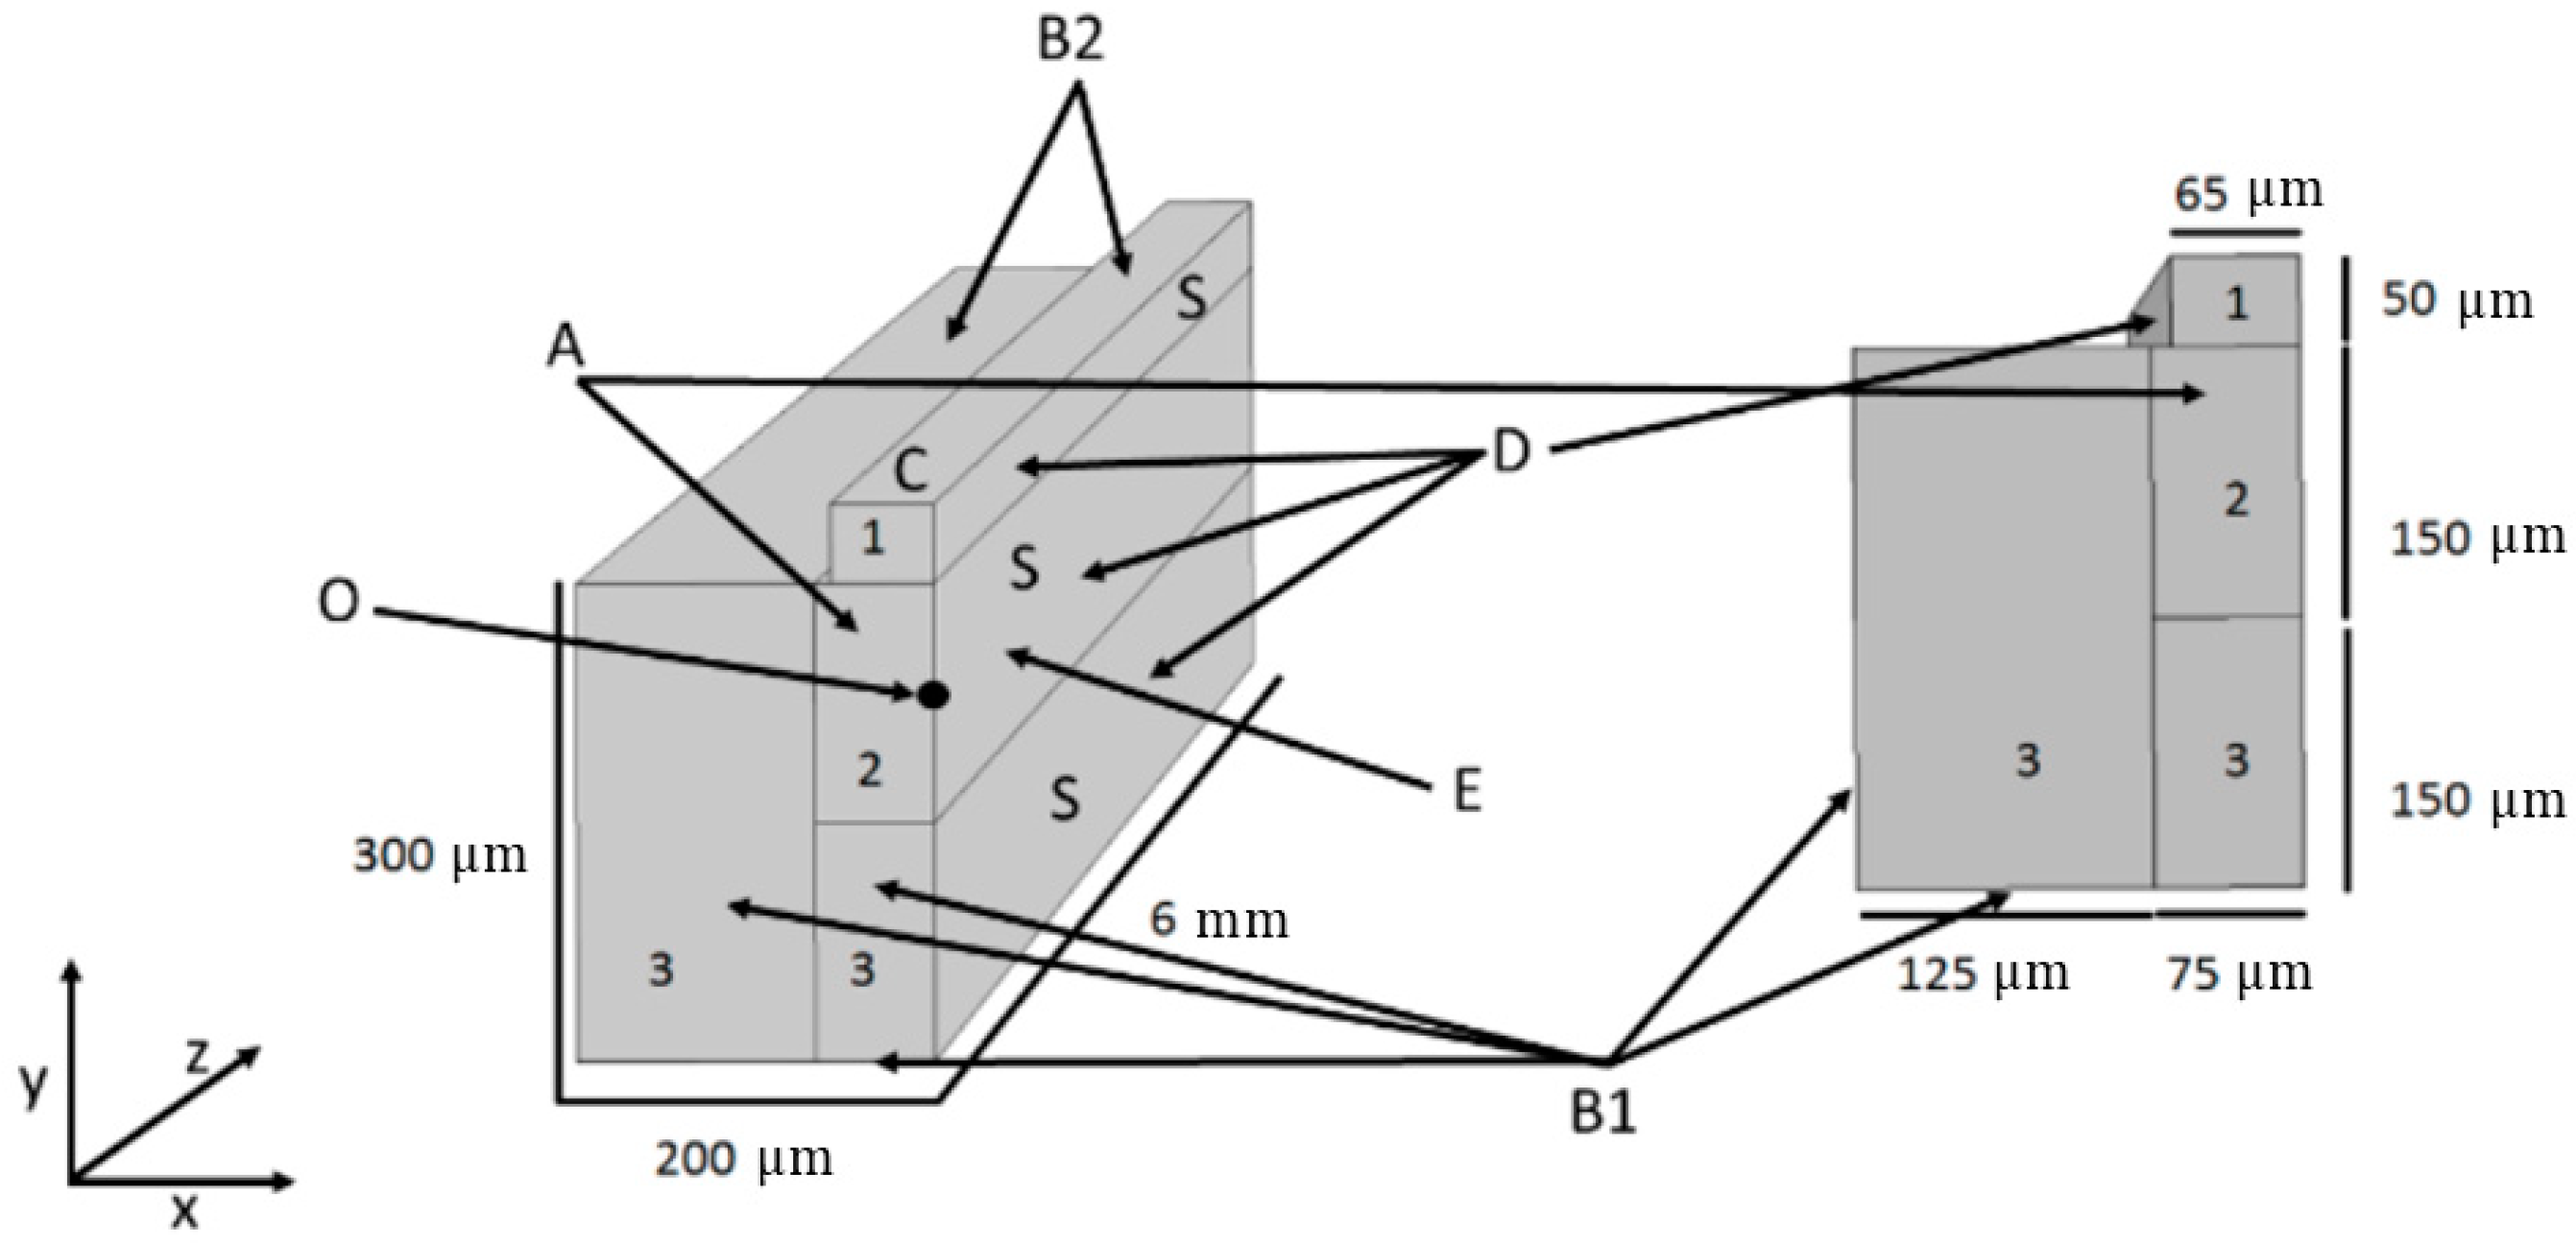
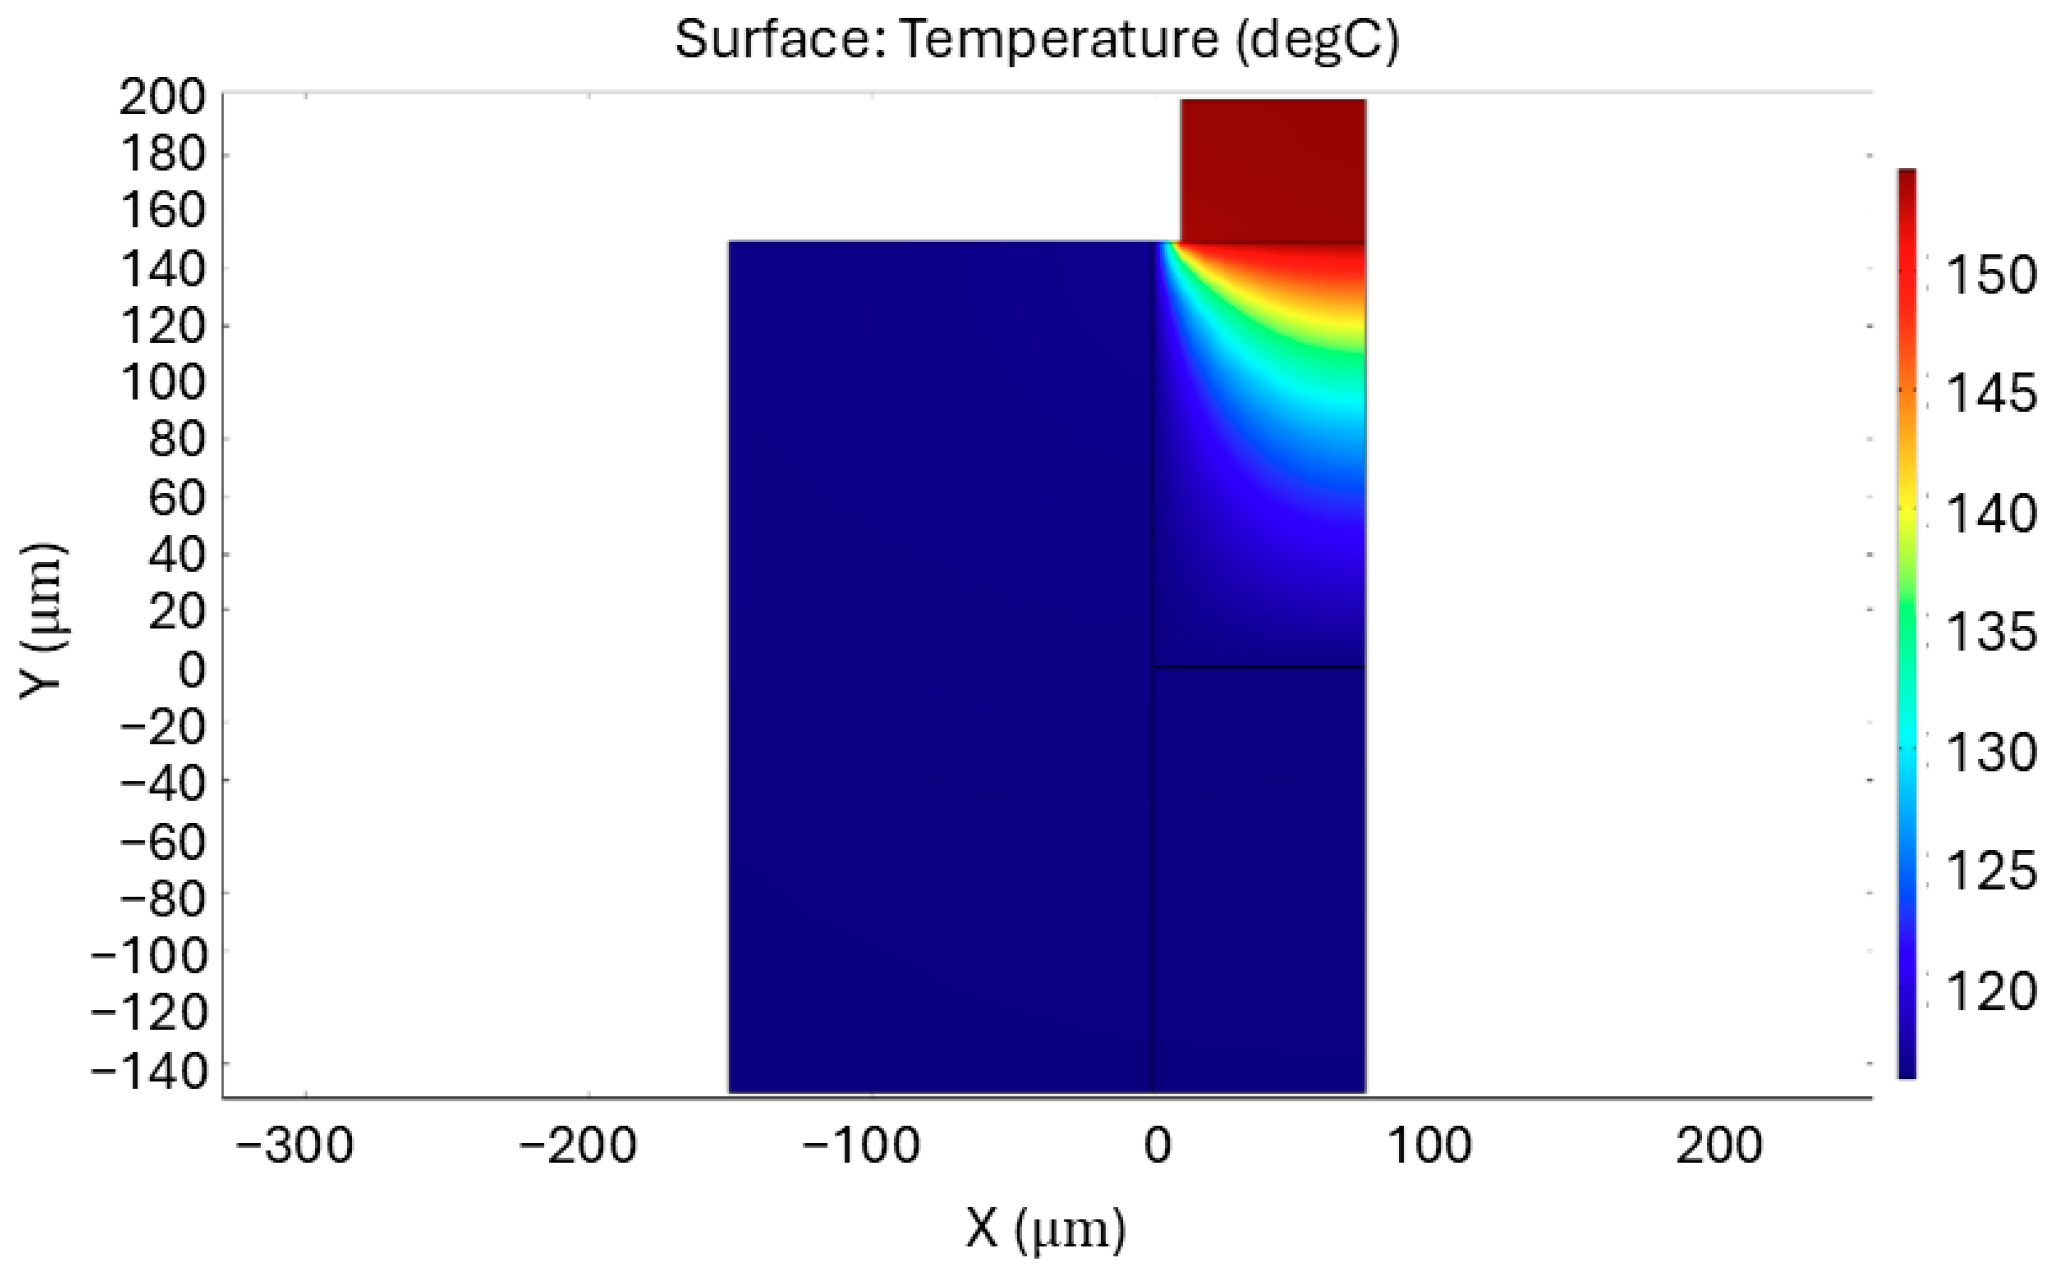
3.1.1. Thermal Simulation of Heating of a Fluidic Channel in a Silicon–Glass Microreactor

For an estimation of the amount of power that is needed to heat up the fluids in the fluidic channel of the silicon–glass microreactor used in this platform, a COMSOL simulation has been performed. Figure 1 shows the geometry of the microreactor. Because of the symmetry of both heater and channel, only half of the channel is simulated. All surfaces marked with an ‘S’ are the symmetry planes of the simplified model. Further included in the geometry are the silicon substrate (3), the fluid (water) present in the channel (2), and the platinum microheater (1).
In the simulation, the heat transfer module, laminar flow model, and multiphysics for non-isothermal flow are used. The formula for the stationary heat equation is given in Equations (1) and (2):
ρCp u ∙ ∇T + ∇ ∙ q = Q
q = −k∇T
where ρ is the density in kgm−3, Cp is the heat capacity at constant pressure in Jkg−1K−1, T is the temperature in K, q is the heat flux in Wm−2, Q is the volumetric heat flux in Wm−3, and u is the velocity vector in ms−1. Note that bold variables/parameters u and q are vectors and other variables/parameters are scalars or mathematical operators. For the laminar flow domain, a parabolic flow profile is present at the inlet. The formula used for the determination of the laminar flow profile is given in Equation (3), taken from [28].
v z = 9 4 Q f HW ( 1 4 ( y 0 + Δ y H ) 2 ) ( 1 4 ( x 0 + Δ x W ) 2 )
where vz is the velocity in the z-direction in ms−1, H is the height of the channel in m, W is the width of the channel in m, y0 and z0 are the origin of the channel (indicated with an ‘O’ in Figure 1), and Qf is the flow rate in m3s−1. The walls of the channel were given no slip condition, meaning that v = 0 at the walls.
The boundary conditions used in the simulation are listed as follows (and clarified in Figure 1). Inlet velocity profile (A): Equation (3) is used as formula for the velocity profile of the flow. Heat flux condition (B1 and B2): the heat flux is the outflow of heat normal to the surface area. The convective heat flux is given by q0 = h(Text − T), where h is the heat transfer coefficient in Wm−2K−1 and Text and T are the temperatures outside and inside the device in K. Calculations gave an estimation for the heat loss as if the simulated geometry was the size of the design, resulting in a heat transfer coefficient of 953 Wm−2K−1 for surfaces marked by B1, and a smaller heat transfer coefficient for surfaces in normal contact with air, B2, with a heat transfer coefficient of 10 Wm−2K−1. Heat source (C): the platinum element is modeled as a heat source with an empirically determined power of 300 mW. Thermally insulating (D): the symmetry plane and the sides of the heater were made thermally insulating. No viscous stress (E): the symmetry surface of the channel is given a no viscous stress condition to allow the fluid to have a velocity at this surface, therefore creating half of a parabolic flow profile. The material properties and parameters used in the simulation are listed in Table 1.
The simulation outcome—a cross-section of the fluidic channel and the corresponding temperature profile inside this channel—is shown in Figure 2. Because the temperature is uniform along the length of the channel, this can be at any point on the z-axis. This temperature is in the range of the temperature range required for the reaction. Based on this, the power per unit area for the platinum heat source in the simulation is related to the total contact area between the heaters and the channel in the design. This leads to an estimated microheater power of 1.13 W.
To summarize, the simulations show that due to the microscale (small volumes and heat capacity) and the use of silicon, which is a very good heat conductor, the influence of flow is negligible and heat-up and cool-down is rapid (milliseconds) [29]. Furthermore, the use of droplets causes circulation inside the droplets, thus mixing the fluid and creating a very homogeneous temperature. Finally, we have calibrated the temperature sensors integrated in the silicon–glass microreactor with nanoparticles that exhibit temperature-dependent luminescence [29], and this showed the accuracy of the temperature sensors, where they matched the temperature even significantly downstream in a reliable way.
The presented silicon–glass microreactor is used for reaction temperatures up to 150 °C; however, it is noted that in such microdevices, reactions can be performed until ~500 °C. Above this temperature, the integrated platinum microheaters are destroyed [30]. However, upon use of external heating methods [31,32], e.g., silicon and quartz/sapphire as device materials [33], (local) reaction temperatures up to 1000 °C are within reach.

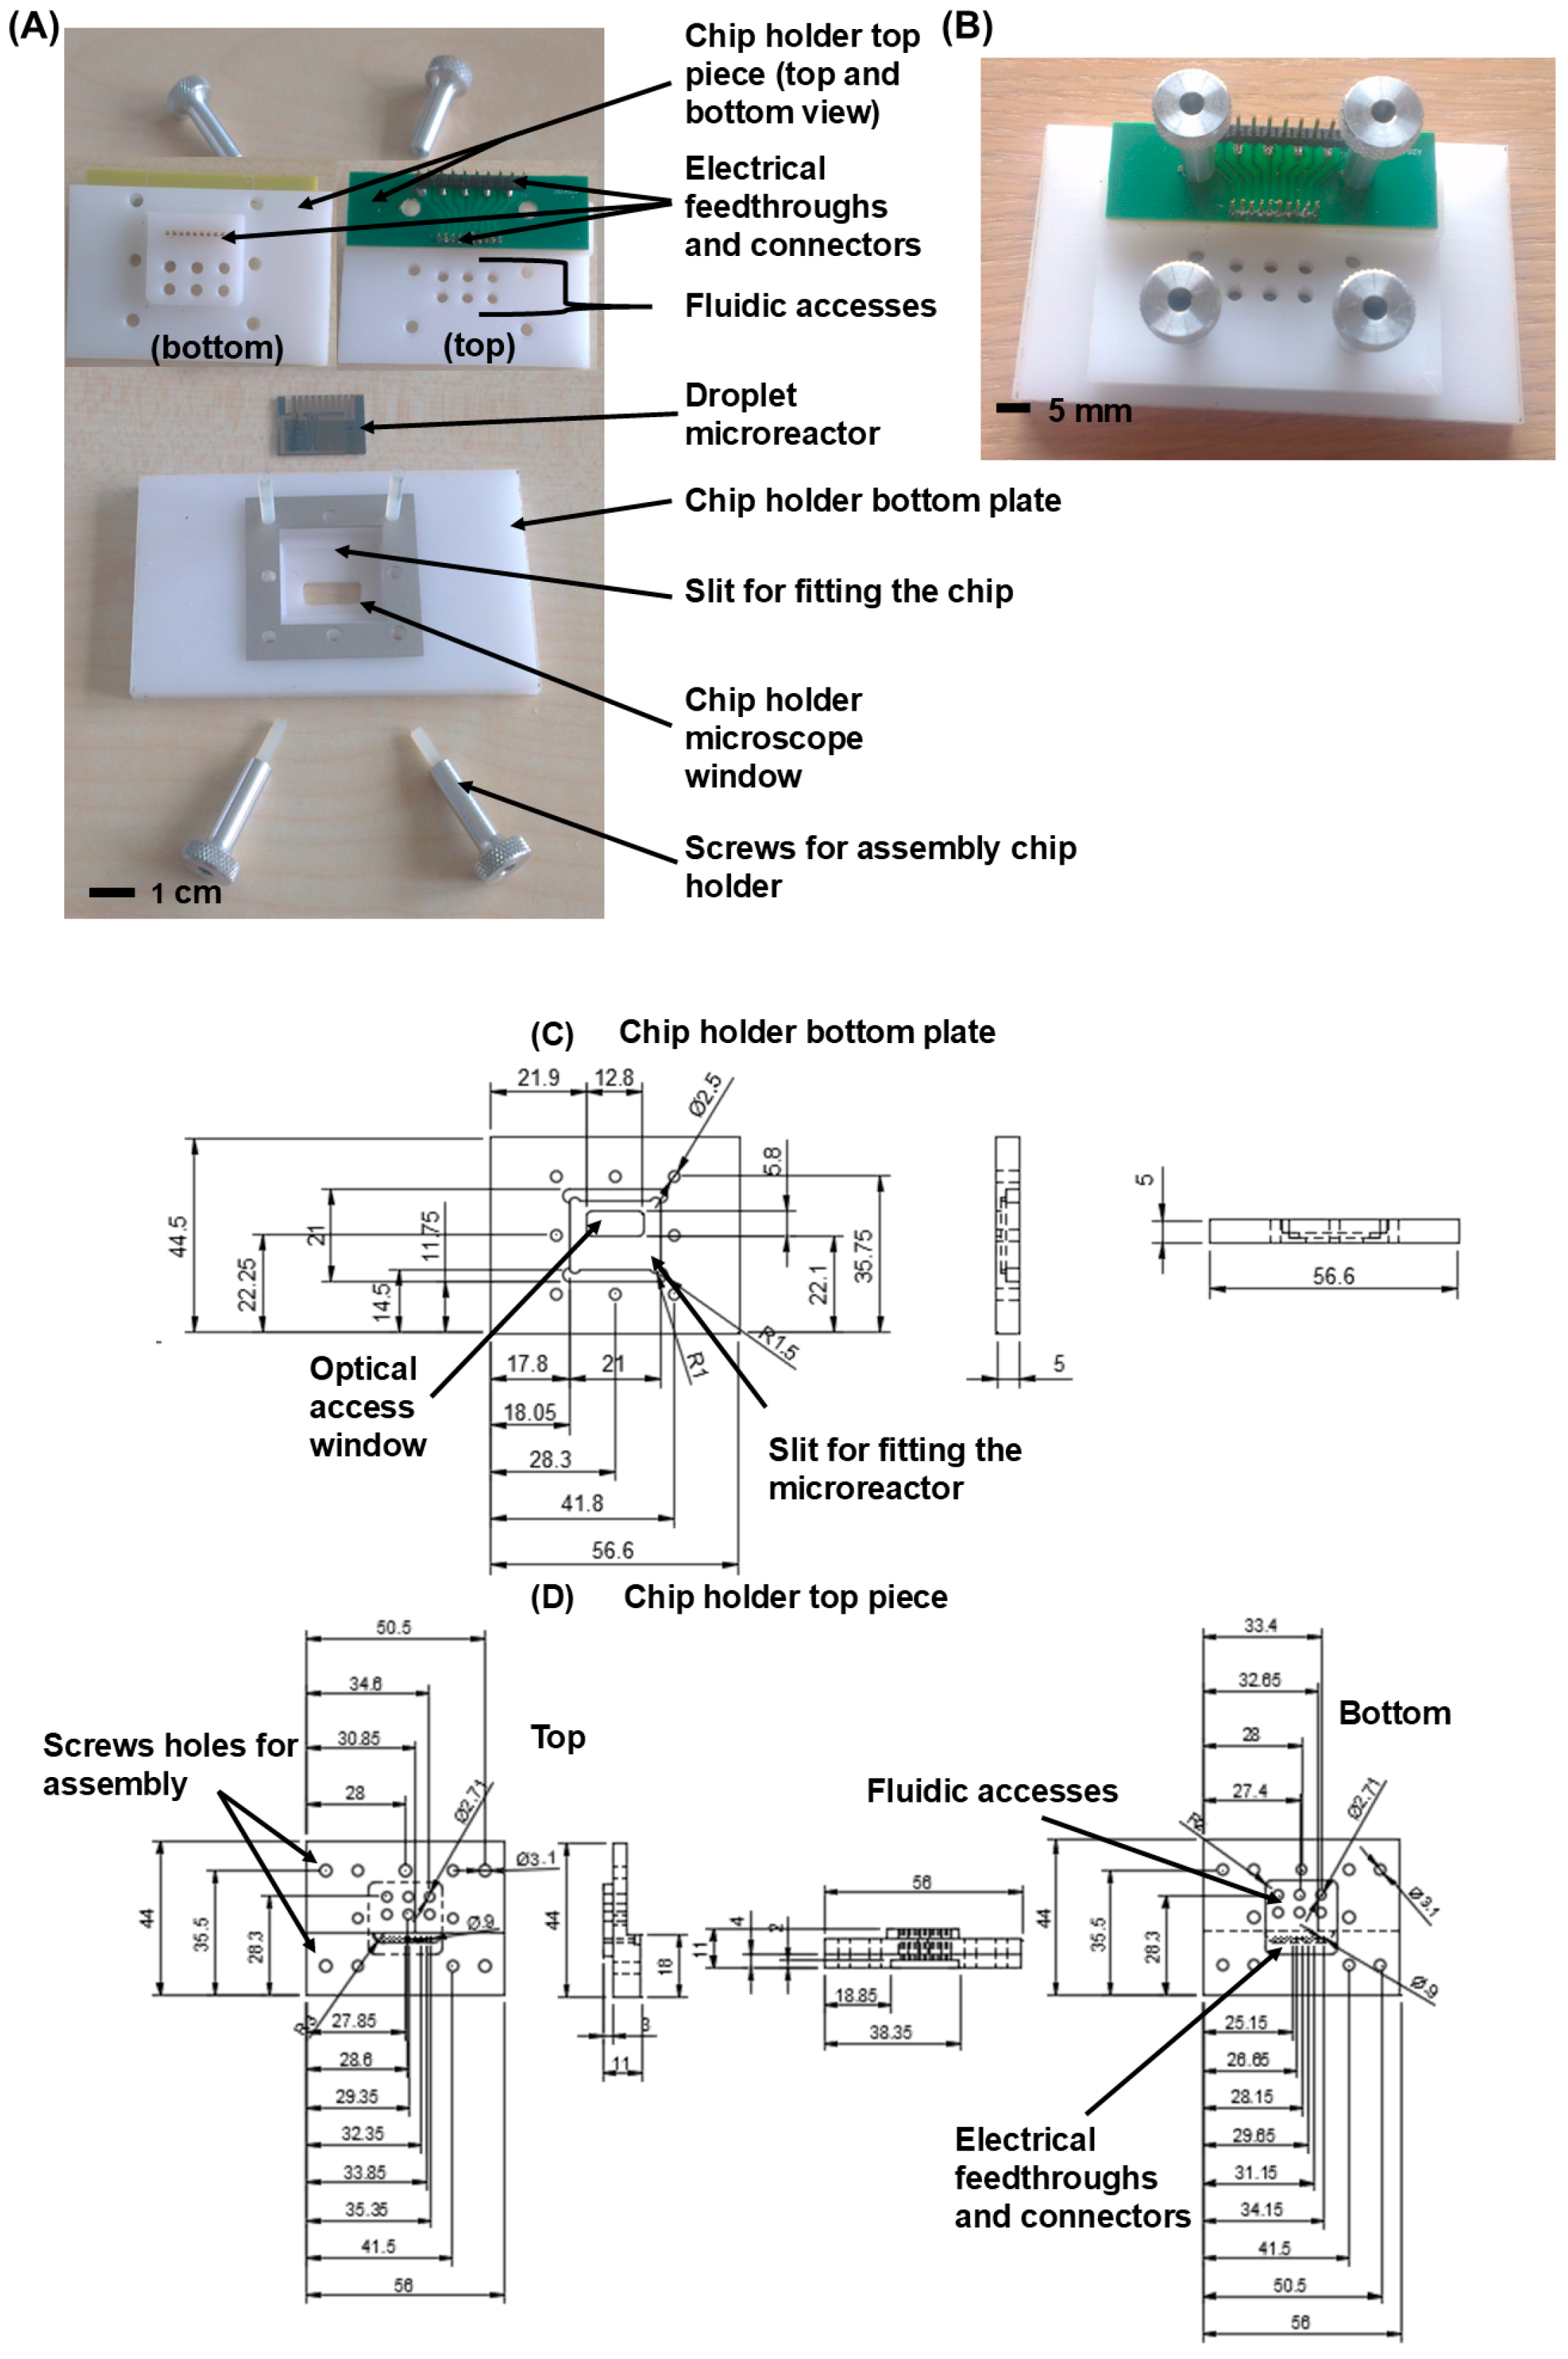
3.1.2. Fluidic Set-Up and Electronic Interfacing

A custom-designed chip holder is used to drive fluid through the microreactor and to provide electronic interfacing. The home-built chip holder (Figure 3) consists of a plastic (white Delrin) bottom plate and white Delrin top piece, chosen for its low thermal conductivity. The top piece of this holder has electrical feedthroughs with gold-plated pogo pins (0959-0-54-20-72-14-11-0, Mill-Max, Oyster Bay, NY, USA) with rounded tips to electrically connect the electrodes in the microreactor and enable interfacing with the myRIO DAQ. The (Solidworks 2016) designs of the top and bottom part of the holder are available in the ‘Supplementary Files’.
A syringe pump (Cetoni GmbH, Korbussen, Germany) is used to control two Hamilton syringes (Hamilton, Bonaduz, Switzerland) that create droplets in the micro-reactor. A 1 mL syringe is used for the dispersed phase and a 0.5 mL syringe for the continuous phase. Fluorinert FC-40 (3M, Delft, The Netherlands) oil is used as the continuous-phase and dispersed-phase paraffin oil (Sigma Aldrich, Zwijndrecht, The Netherlands). Flowrates of 5 µL/min (dispersed phase) and 9 µL/min (continuous phase) are used. The fluidic interfacing between the syringes and the microreactor (positioned in a holder) is constructed by means of fused silica tubing. A capillary (ID 250 µm, OD 360 µm; Polymicro, Molex, Lisle, IL, USA) is connected to the tip of each syringe using a fluidic connector (P-882; IDEX-HS, Inacom Instruments, Overberg, The Netherlands) and to the microreactor using a NanoPort ferrule (N-123-03; IDEX-HS) and nut (F-123-H, IDEX-HS). The home-built holder for the chip (Figure 3) consists of a plastic (white Delrin) bottom plate and white Delrin top piece, chosen for its low thermal conductivity. This Delrin chip holder is used for fluidic and electronic interfacing to the microreactor. The top piece of this holder has electrical feedthroughs with gold-plated pogo pins (0959-0-54-20-72-14-11-0, Mill-Max, Oyster Bay, NY, USA) with rounded tips to electrically connect the electrodes in the microreactor and enable interfacing with the myRIO DAQ. The (Solidworks) designs of the top and bottom part of the holder are available in the ‘Supplementary Files’.
To prevent the FCC particles from sedimentation inside the syringe, a small Teflon-coated magnet (Z283800, Sigma Aldrich, Zwijndrecht, The Netherlands) is added inside the 1 mL Hamilton syringe containing the particles and reactant (4-methoxystyrene; Sigma Aldrich, Zwijndrecht, The Netherlands). On the outside of this syringe, a neody-mium magnet (Q-20-10-05-N; supermagnete.de, Gottmadingen, Germany) is positioned which is mounted on a DC electromotor (472-M22E-13; Mouser Electronics, Eindhoven, The Netherlands). This motor rotates the small Teflon magnet inside the syringe and thereby stirs the particles. The electromotor is powered by an Agilent E3631A DC power supply (Middelburg, The Netherlands). In fact, the syringe containing the catalyst particles is positioned vertically, i.e., with the tip downwards, such that gravity pulls the particles to the outlet of the syringe. Moreover, a vibrational motor (619-28821; Mouser Electronics, Eindhoven, The Netherlands) is attached to the tip using electrical shrink wrap. The vibrational motor is connected to a 9 V battery to shake the tip of the syringe and prevent particles from becoming stuck inside the tip of the syringe.
For measuring the fluorescence of a single catalyst particle (encapsulated in a droplet), a Leica DMi 5000 M (Leica Microsystems B.V., Amsterdam, The Netherlands) inverse microscope with a 10× objective is used, which is equipped with a Hg lamp. For fluorescence measurements, a BGR filter cube is used with three excitation bands (420 nm ± 30 nm, 495 nm ± 15 nm, 570 nm ± 20 nm) and three emission bands (465 nm ± 20 nm, 530 nm ± 30 nm, 640 nm ± 40 nm). To capture the fluorescent images, a Hamamatsu Orca Flash4.0 V2 camera (Hamamatsu Photonics K.K, Shizuoka, Japan) is used. The exposure time of the camera is 1 millisecond and videos are captured at a framerate of 200 fps.

3.1.3. Electrical Circuit for Readout and Control of the Microheaters and Temperature Sensors

A custom-designed printed circuit board (PCB) is made for the read-out of both temperature sensors (TS1 and TS2, respectively) and heater actuation, viz. to control the temperature of the microreactor. The schematics of the read-out circuitry and heater control as well as PCB are shown in Figure 4.
A four-point measurement is used to read-out both temperature sensors. A voltage regulator (LM317TG; Farnell, Utrecht, The Netherlands) is used as a current source for the read-out, where the output current is controlled via Equation (4).
I out = 1.25 R 1
Iout should not heat up the temperature sensors and is therefore set at a value of 2 mA, resulting in a value for R1 of 625 Ω. The bias current results in a voltage drop across the sensor structures, which is amplified using an instrumentation amplifier (AD620ANZ; Farnell, Utrecht, The Netherlands). The gain of the amplifier can be calculated using Equation (5).
Gain = 49400 R gain + 1
The gain is chosen such that a temperature of 250 °C would result in the maximum voltage (5 V) that can be read by the 12-bit ADC of the myRIO, resulting in a gain of 82, which results in Rgain = 610 Ω. These values determine the resolution of the system, which is 0.15 °C for the complete sensor circuitry.
The heaters are controlled with a Proportional Integral (PI) controller that is made in LabVIEW 2016 and runs on the myRIO (the used LabVIEW code is available in the ‘Supplementary Files’). The control loop compares the measured temperature to the setpoint temperature. If the difference between those two values is large, the PI loop will dissipate more power in the heater. The controller attempts to reach the setpoint temperature by adjusting the gain based on the current value of the measured difference. The Integral part is used to adjust this gain by taking past values into account. Pulse-width modulation (PWM) of a 1 kHz square wave is used to control the power dissipation in the heater structures by changing the duty cycle. Figure 4B shows the electrical circuit layout.
The output of the myRIO PWM port is applied to the gate of a NMOS transistor (FDN5630; Farnell, Utrecht, The Netherlands) which acts as a switch between the Agilent DC power source (25 V), a PMOS transistor (NTB5605PT4G; Farnell, Utrecht, The Netherlands), and the heaters. The PMOS is closed when no PWM signal is applied, or the signal is low (0 V), because both the gate and source voltage of the PMOS are at 25 V from the power supply. The drain and heater are at 0 V. When the NMOS signal becomes high (5 V), the NMOS opens and the gate voltage of the PMOS drops, opening the PMOS as well and applying the power supply voltage over the heater. The temperature sensors provide the feedback for the PI control loop to calculate the difference between the setpoint and the actual temperature. Figure 4C–E show the actual PCB and the eagle routing layers for the front- and backside.

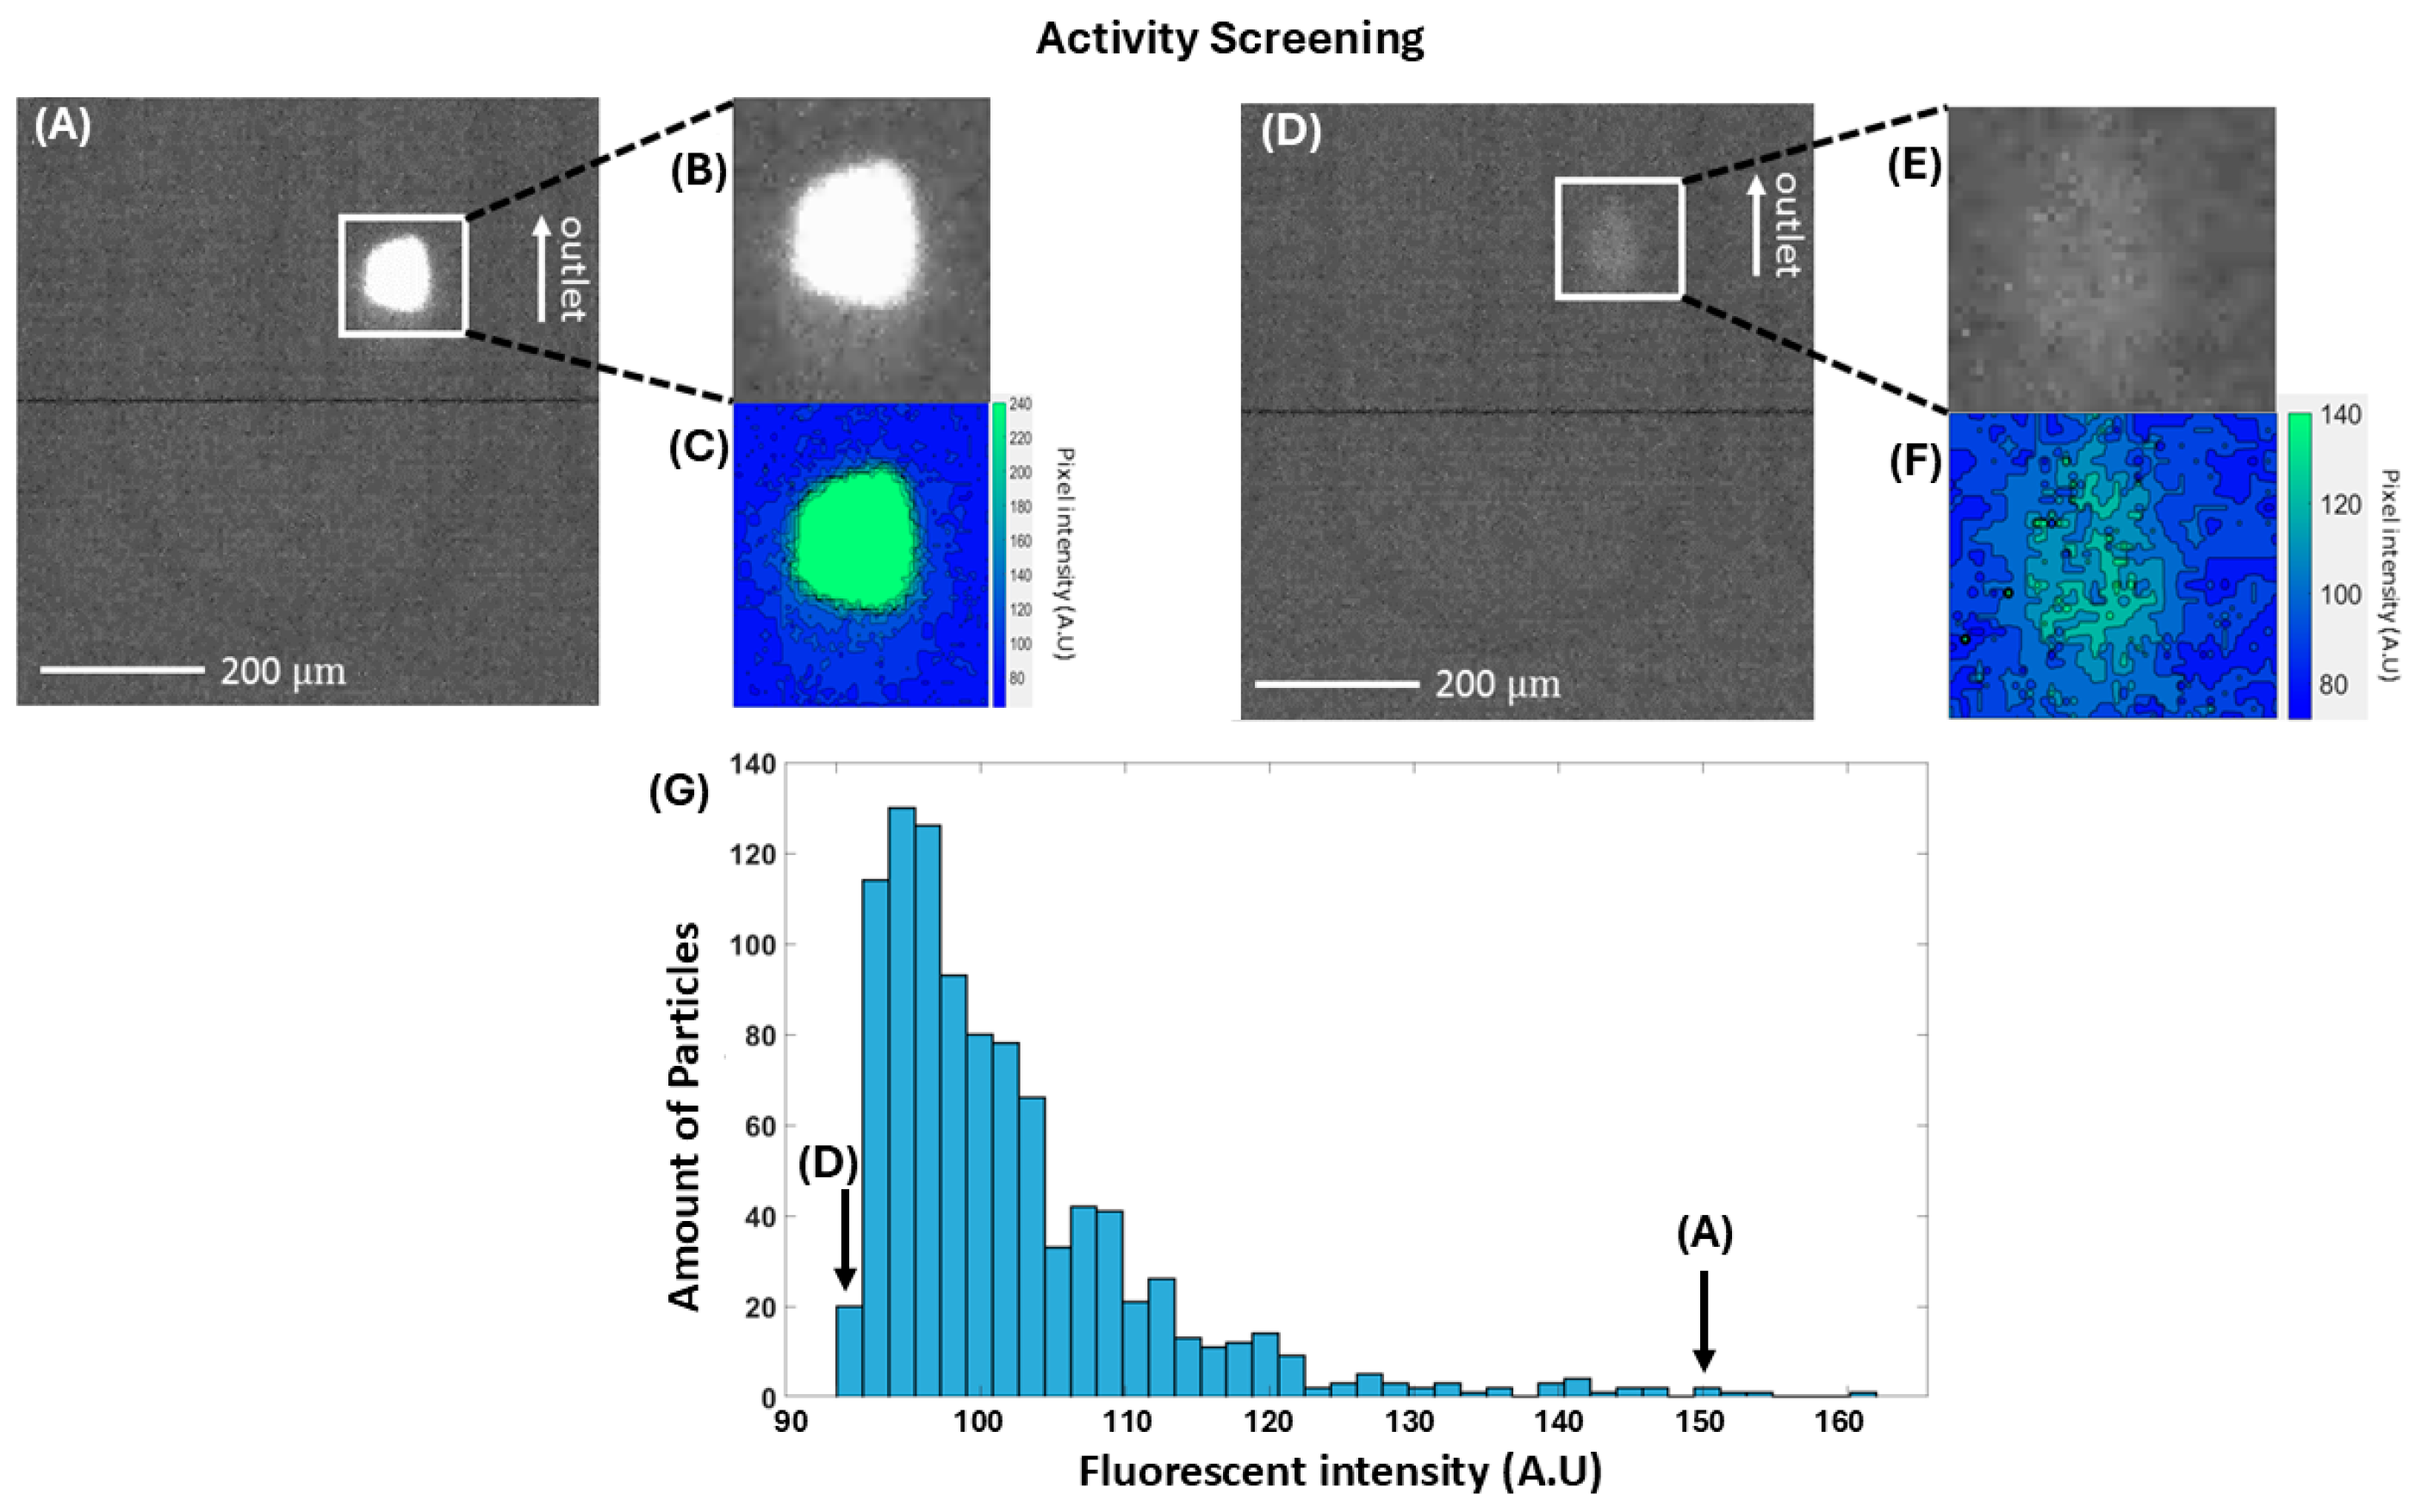
3.1.4. Fluorescence Measurements

In Figure 5A–F, the fluorescence detection of FCC ECAT particles is shown, where the background intensity was determined at 90 (a.u.). Particles could be detected when they exhibited a fluorescence signal above this threshold. This means that particles that showed no fluorescence at all cannot be detected with this platform, which explains the drop-off in Figure 5G for the amount of particles at intensities just above the threshold.

3.2. Dielectrophoretic Sorting Platform

This section discusses the set-up, electronics, and control, as developed for the fluorescence-based sorting of Fluidic Catalytic Cracking Equilibrium Catalyst (FCC ECAT) particles in a microreactor using dielectrophoresis (DEP) [27]. In short, a platform was designed that can activate electrodes (by applying a potential to them) to generate an electric field gradient for the dielectrophoretic sorting of droplets containing catalyst particles, i.e., guiding particles (encapsulated in droplets), into different channels depending on their fluorescent signal. In fact, this platform was used for two different staining probes [18]. For both probes, training data were acquired to determine the threshold voltage. For the first probe (4-methoxystyrene) 51/54 (true accepted, 94.4%) particles were correctly sorted, i.e., their corresponding electrical signal was above the threshold, and it was subsequently sorted into the correct outlet. The other 3/54 (false rejected, 5.6%) of the particles were not sorted into the correct outlet. Of the particles that did not exceed the threshold, 133/134 (true rejected, 99.3%) were rightfully rejected, whereas 1/134 (false accepted, 0.7%) particles were falsely accepted. For the other probe (4-fluorostyrene), all (6/6) particles exceeding the threshold were rightfully sorted (true accepted, 100%) and all (36/36) particles that were below the threshold were rightfully rejected (true rejected, 100%).
A glass microreactor (shown in Figure 1 of [27]) is used to encapsulate each individual particle into on-chip generated droplets (the design file (in CleWin v6.0 software) and process flow for fabrication are available in the ‘Supplementary Files’). The FCC particles contain fluorescent probe molecules that are formed based on the acidity of the particles. The more acidic a particle, the better it can perform the cracking process. When the encapsulated particles flow along the detection spot, the fluorescence signal is detected by an optical set-up and is fed through to a photo-multiplier tube (PMT) which converts the light intensity into a correlating voltage. This voltage is measured by a microcontroller, which controls whether a particle-containing droplet is sorted (based on the magnitude of the measured voltage vs. a threshold voltage). When the fluorescence signal of a particle does not exceed this threshold value, the dielectrophoretic force will not be activated and the particle flows, by default, into the ‘non-sorted’ outlet. In contrast, when the converted voltage of a particle exceeds the threshold, the DEP electrodes will be activated (by an electronic switch; 600 VDC applied to the DEP electrodes), such that the dielectrophoretic force directs a particle into the ‘sorted’ outlet. In this way, encapsulated catalyst particles can be sorted based on their acidity. In order to obtain a functioning platform, an optical set-up, a piece of custom electronics, and LabVIEW-based control software (2016) are used that enable activation of these DEP electrodes.

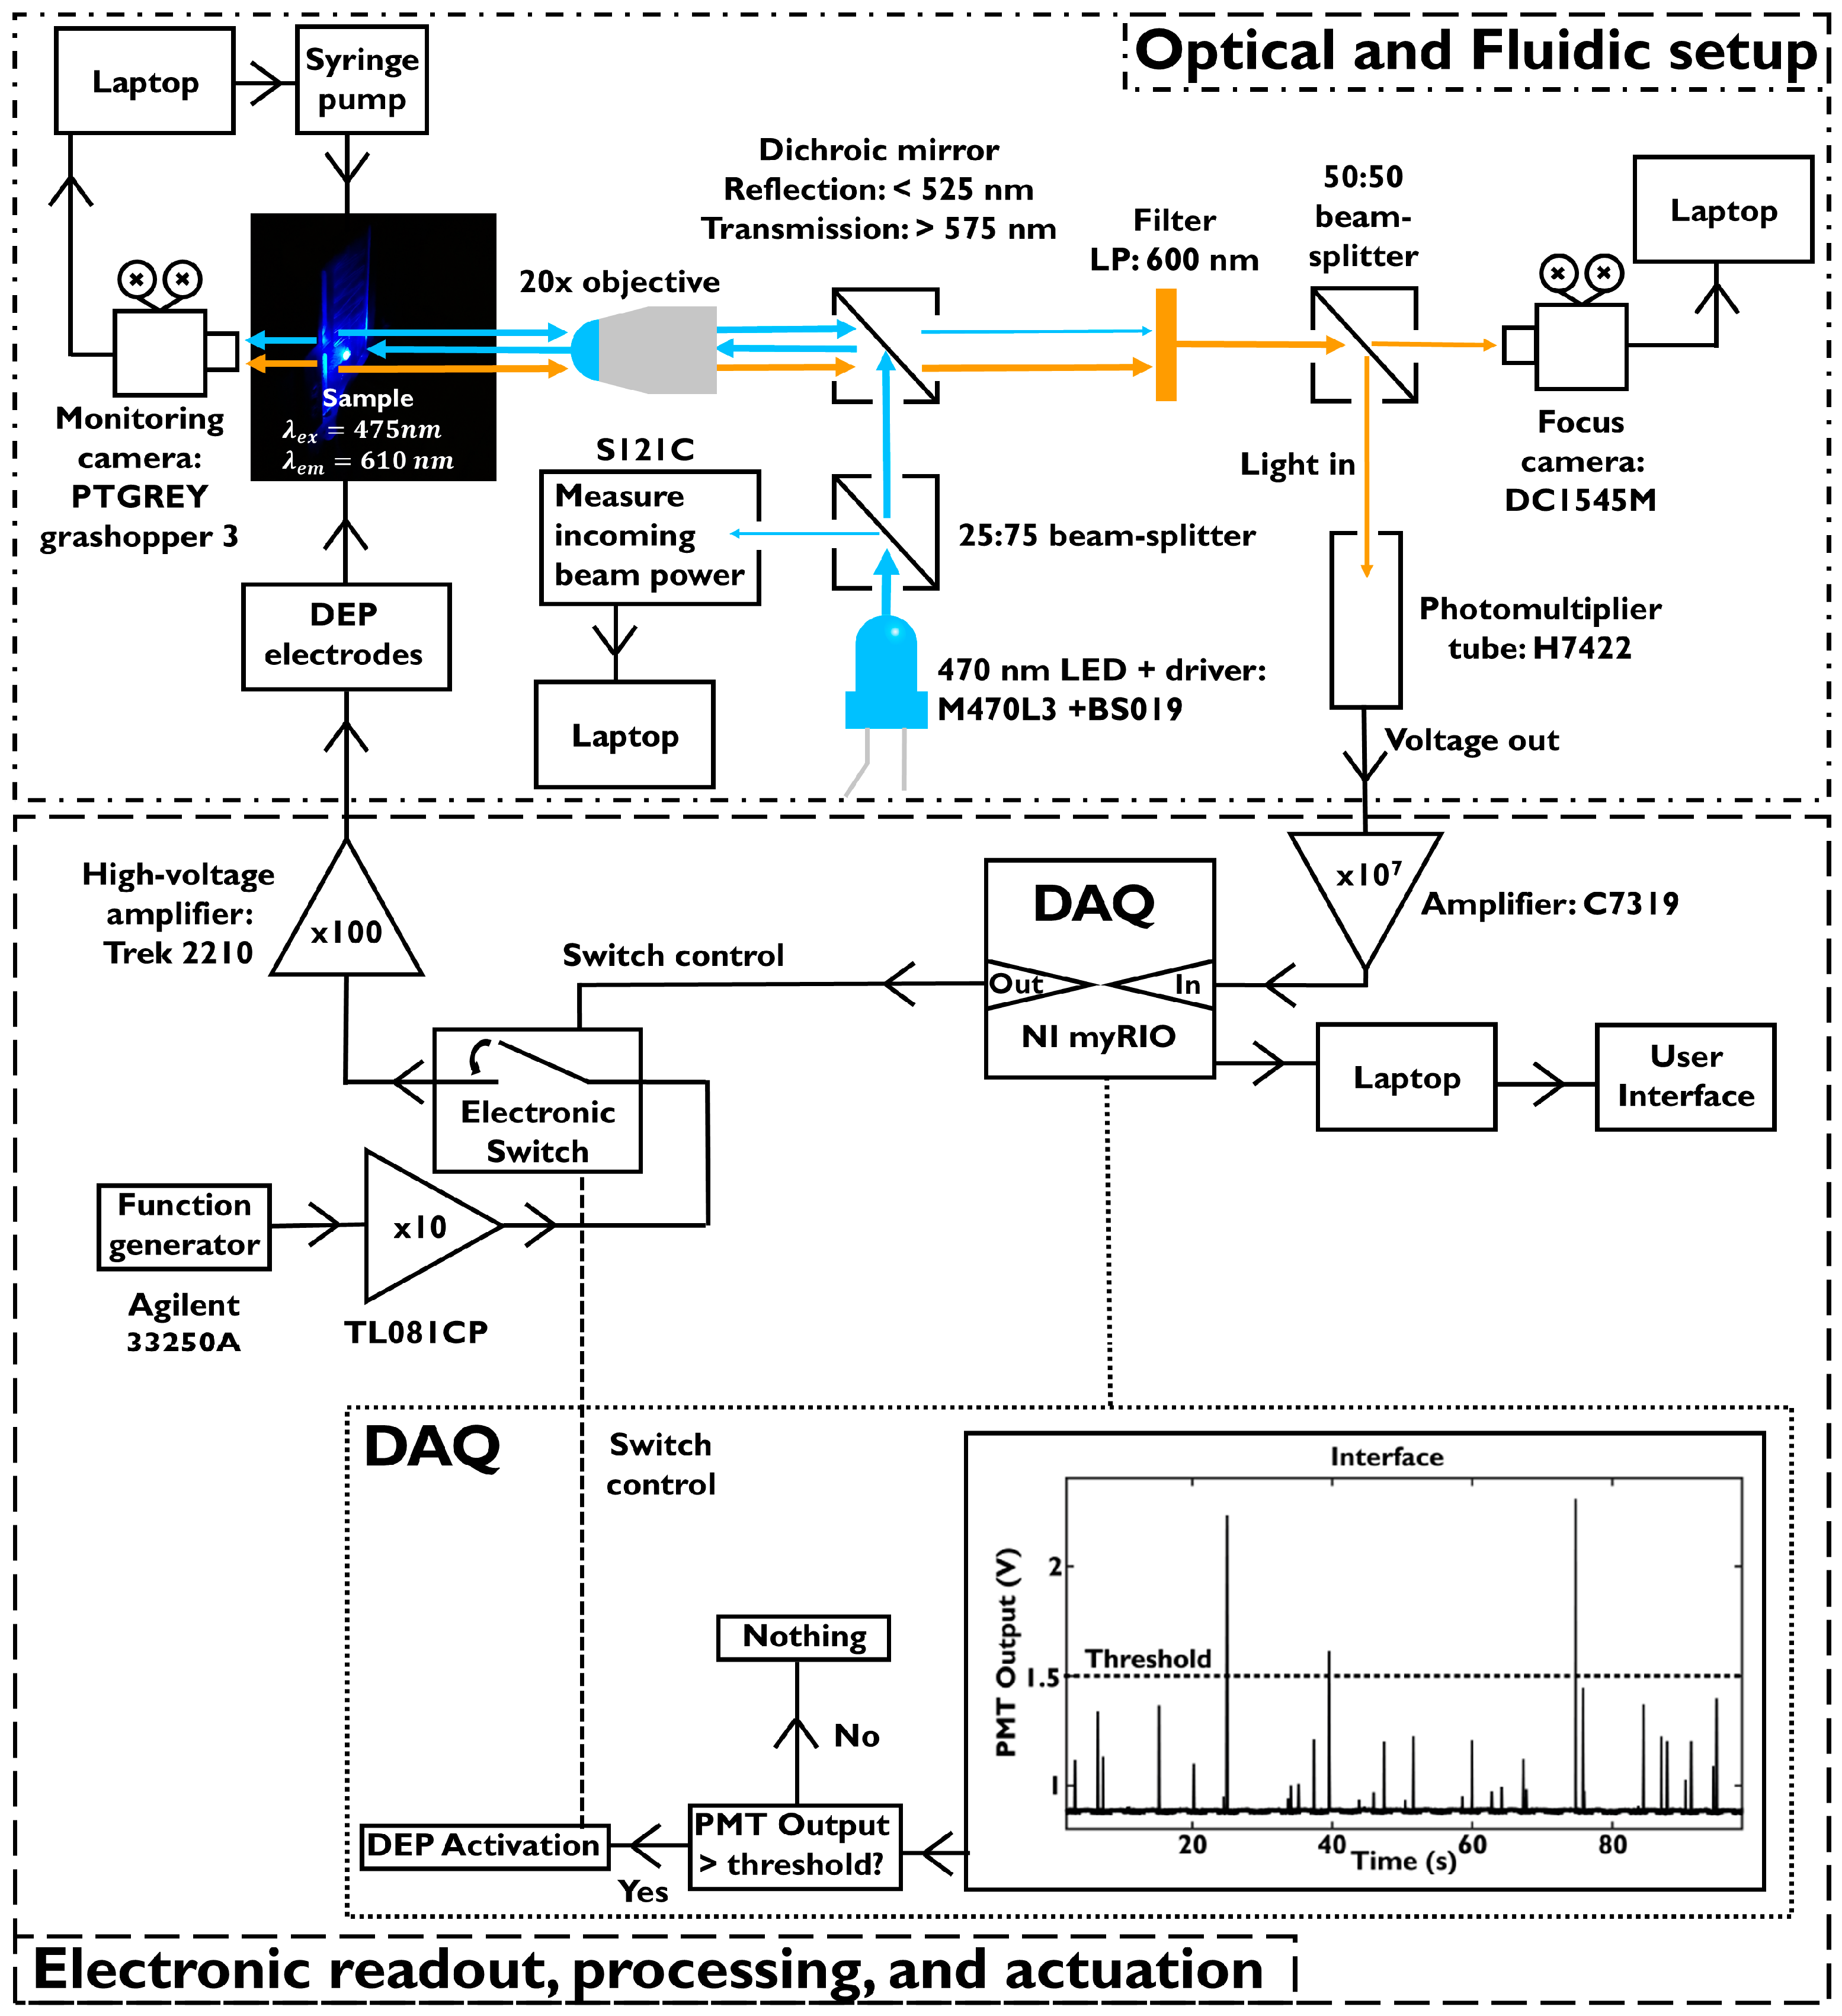
3.2.1. Fluidic Set-Up and Optical/Electronic Interfacing

For the fluidic connections to the microreactor, a Micronit Microtechnologies ‘side connect’ holder is used with a custom-made insert body. FFKM (Perlast) perfluoroelastomer ferrules (Micronit, Enschede, The Netherlands) are used to provide a leak-free connection between the tubing and the microreactor. This insert body, shown in Figure 6A,C, is designed using Solidworks and milled in black Delrin using a Datron Neo next milling machine (Datron, Darmstadt, Germany). The dimensions are 40 × 25 × 5 mm (l × b × h), with a 2 mm edge on the inside to support the microreactor. The center of the insert body is open to have optical access to the microreactor from both sides (i.e., top and bottom). At the sides where the ‘side connectors’ are located, holes (diameter 1.5 mm) are drilled into the holder for the screws that attach the beige/brown ‘side connector’, as shown in Figure 6A,C. This figure further shows the holes on the top of the insert body that allow mounting of the electrode connector. An additional holder is fabricated in order to position the microreactor vertically in front of the optical set-up. This ‘vertical holder’ (shown in Figure 6A,B) has an opening for optical access and holes (1.8 mm diameter) for guiding/alignment pins that fit in the side connect holder. The designs of both the chip holder and vertical holder are available in the ‘Supplementary Files’.
For driving the fluids into the microreactor, a syringe pump (Cetoni GmbH, Korbussen, Germany) is used which controls two glass syringes (Hamilton, Bonaduz, Switzerland): one syringe (0.5 mL) for the particle/droplet-phase mixture and one (5 mL) for the FC-40 continuous phase. The particle containing syringe is chosen such that a small magnet fitted inside to stir the particle mixture and to prevent sedimentation, as described in detail in Section 3.1.1. The used flowrates are 1.5 µL/min and 180 µL/min for the dispersed and continuous phases, respectively. Since the flowrate of the continuous phase is much higher, a larger volume syringe is used. Polymer tubing (Tefzel, OD = 1/16″, ID = 0.02″, IDEX-HS, Oak Harbor, WA, USA) is attached to these syringes using fluidic connectors (P-704-01 and F100, IDEX-HS) to introduce the liquid phases into the microreactor.
A home-built set-up is used for the optical detection of the fluorescent signal of particles. This optical interface is adapted from [34]; new filters and a light source are installed to suit the catalyst particle sorting application. The used fluorescent molecules—4-methoxystyrene and 4-fluorostyrene—are excited by 470 nm light when the particle passes the detection spot and subsequently emits light around 610 nm. Both the excitation and emission light are picked up/focused by the same objective (20×/0.4 HCX PL FLUOTAR, Leica, Wetzlar, Germany). The excitation light source is a blue LED (M470L3, Thorlabs, Munich, Germany) that is controlled by a driver (LEDD1B, Thorlabs). To ensure that for each experiment, an identical optical power is used for excitation, a beam splitter (BS019, Thorlabs) is introduced after the LED, by means of which 25% is of the light is directed towards a photodiode (S121C, Thorlabs) and an optical power sensor module (PM100-USB, Thorlabs). The remaining 75% of the light is reflected by a dichroic mirror (DMLP-550R, Thorlabs) and is used for sample excitation. The emitted light, coming from the sample, is not reflected by the dichroic mirror, since it is transparent for wavelengths above 575 nm. The small amount of excitation light that passes through this mirror is filtered out afterwards by a low pass filter (MF620-52, Thorlabs) with a cut-off of 600 nm. The remaining light signal light emitted by the sample is split by a 50:50 beam splitter (BS013, Thorlabs), where 50% of the light is directed to the PMT (H7422, Hamamatsu, Herrsching am Ammersee, Germany). The resulting photocurrent is converted into a voltage, amplified (10 VµA−1, C7319, Hamamatsu), and subsequently fed into a data acquisition board (DAQ; myRIO, National Instruments). The other 50% of the emitted light is directed towards a CMOS camera (DC1545M, Thorlabs). The optical path lengths from the beam splitter to the PMT and the CMOS camera are the same to ensure the focus is the same for both the PMT and CMOS. Prior to experiments, this camera is used to find the middle of the microfluidic channel (where the droplets flow) and to focus correctly on the droplets. However, this camera is not used during the experiments because it is neither fast nor sensitive enough to detect the emitted light. In fact, a second camera (PTGREY grasshopper 3, FLIR Integrated Imaging Solutions GmbH, Ludwigsburg, Germany) positioned at backside of the microreactor, compared to the objective as shown in Figure 6A, is used to monitor the particle sorting behavior. Videos are taken at a framerate of 90 fps and the shutter time is set at 7.075 ms.

3.2.2. Software for the Processing of the PMT Data and DEP Electrode Activation

For the signal processing and DEP electrode activation, a myRIO DAQ (National Instruments, Austin, TX, USA) is used. This DAQ contains LabVIEW software (2016) that reads in all the electrical signals and performs processing. The developed LabVIEW code is available in the ‘Supplementary Files’.

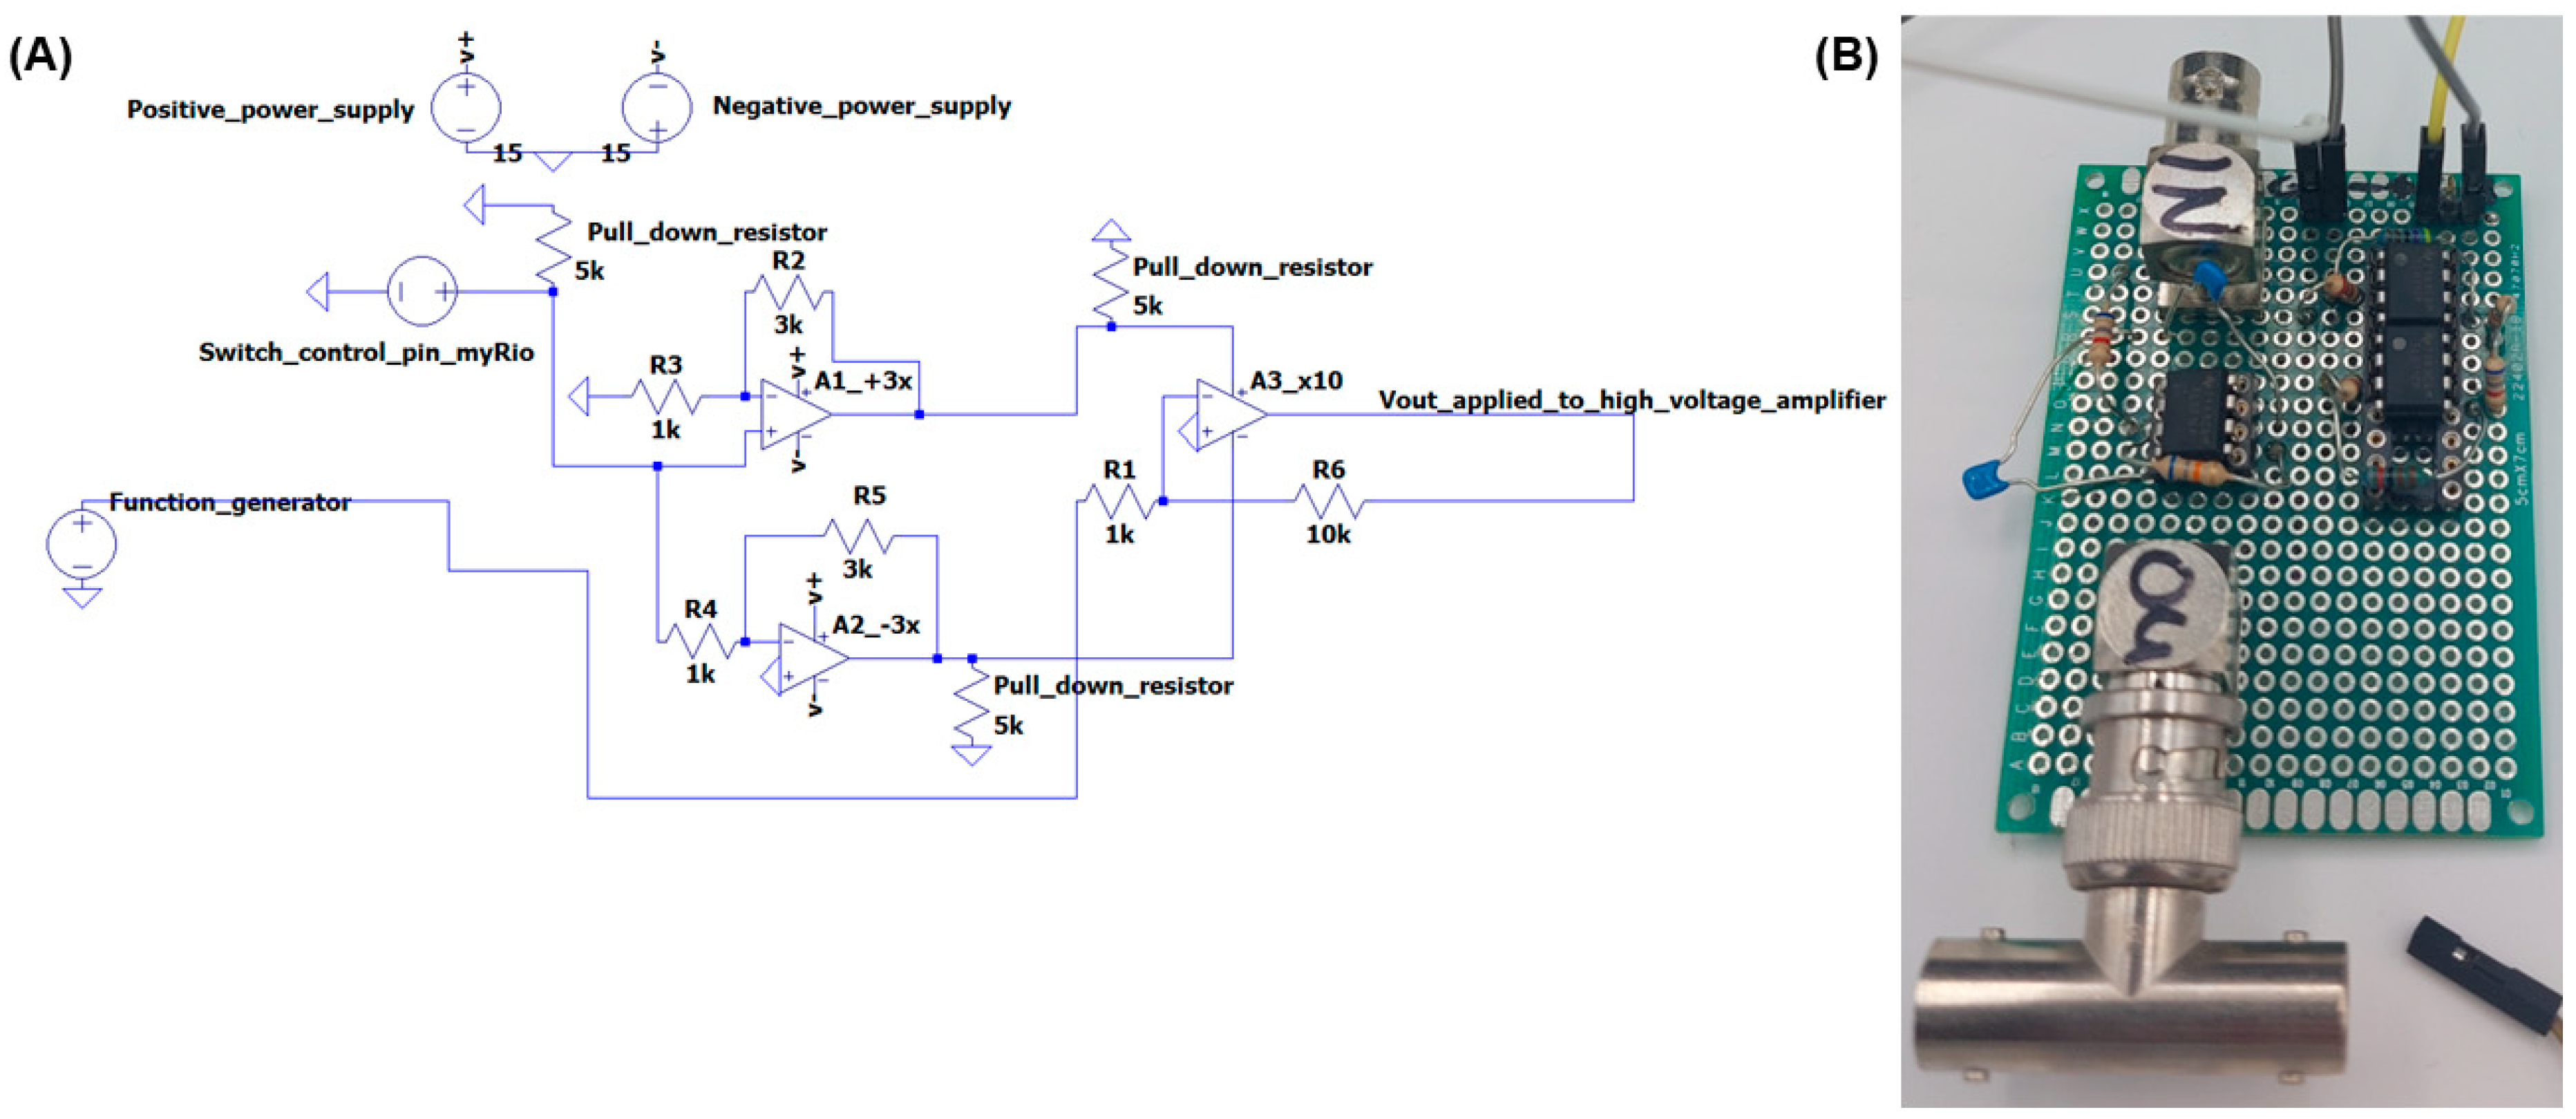
3.2.3. Circuitry for Activation of the DEP Electrodes

The aforementioned electronic switch is custom made and, upon activation, electrically connects a function generator (Agilent 33250A, Keysight, Amsterdam, The Netherlands) to the DEP electrodes such that the trajectory of highly fluorescent particles is manipulated (due to the generated dielectrophoretic force) towards the ‘sorted’ outlet. When the switch closes, the signal is fed into an amplifier (100×, Trek model 2210, Trek Inc., Lockport, NY, USA) before being applied to the DEP electrodes. We warn the reader that this is a high-voltage device (max. 1000 V) and safety regulations have to be considered prior to use. The circuitry of the switch (and an image of the experimental PCB) is shown in Figure 7.
As shown in Figure 7, the circuit consists of three operational amplifiers (opamps, TL081CP, Texas Instruments, Dallas, TX, USA), of which the first two are symmetrically in power by the +15 V and −15 V power supply ports of the myRIO DAQ. These two opamps amplify the DEP pulse from the myRIO output port (3.3 V) by a factor +3 for one (non-inverting) amplifier and a factor −3 for the other (inverting) amplifier. A pull-down resistor is connected to the DEP pulse pin to regulate the signal back to 0 V when the DEP trigger signal goes from active to inactive. The amplified DEP trigger is used to power the third opamp that amplifies the signal from the function generator by a factor 10. This signal is then applied to the Trek 2210 amplifier. Pull-down resistors are added to the power lines of the third opamp. The DEP trigger can be set in the software. It was found that a trigger signal of 95 ms during which 600 VDC is applied to the DEP electrodes is most optimal for the sorting of droplets.
Figure 8 shows the combination of the optical and fluidic set-up and the electronics, including software decision making. For the training of the platform, we let the PMT detect multiple particles over time. These data were used to obtain the background signal (0.92 V) and create a histogram that shows the distribution of the maximum of the voltage peak versus the peak heights (Figure 9). This histogram shows the same distribution as with the fluorescence intensity detection set-up for the activity screening (Figure 5 in Section 3.1.4). This confirms that both platforms are capable of detecting the population distribution for the same fluorescent probe (4-methoxystyrene).

4. Conclusions

With this work, we hope to inspire scientists to provide the necessary detail of (custom-made) set-ups and interfaces that are often of crucial importance when working with microreactors and microfluidic devices. We are of the opinion that if not in the main article, then more details should definitely be discussed in the ((E)SI). The results obtained with these systems are often the main focus of scientific articles, but these results are built upon the effort and engineering that went into these set-ups. This work described the electronic, fluidic, and optical interfacing to platforms used for high-throughput screening of the activity of individual catalyst particles encapsulated in droplets. A variety of engineering details of the developed experimental set-ups are presented, which are a necessity for achieving desired ‘good’ experimental results. As a guideline, we composed a checklist (bulleted list below) that is meant as a support or reminder for authors to check whether all required information for a paper, especially related to custom set-ups and protocols, is present.
  • Custom Equipment
    • Design Documents: CAD models, blueprints, and sketches.
    • Simulations: Schematic of the model, physics/formula involved, boundary conditions and assumptions, simulation outcome, correlation with experiments.
    • Calibration and Verification: Calibrate and verify custom-made sensors.
    • Software: Provide code and functional description.
    • Images: Provide photos and sketches of the complete set-up.
  • Chemical Protocols
    • Step-by-Step Images: Upon visible color/structure changes, include photos.
    • Detailed Method: List chemicals, quantities/amounts, and conditions.
  • Electronic Circuit Design
    • Schematics: Include circuit diagrams and PCB design.
    • Component List: Provide part numbers and specifications.
  • Cleanroom Mask Design
    • Mask Layout: Include high-resolution images or design files.
    • Design Rules: Provide dimensions, tolerances, and process constraints.
    • Fabrication Details: Describe materials used and manufacturing steps (process flow).
  • Lab journal
    • Obsidian (or other digital lab journal files) that can be put on, e.g., GitHub.

Supplementary Materials

The following supporting information can be downloaded at: https://www.mdpi.com/article/10.3390/electronics14081506/s1, Designs and process flows for both microreactors, developed LabVIEW codes and Solidworks files of custom (parts of) chip holders for both platforms, i.e., acidity screening of individual catalyst particles and dielectrophoretic sorting of single catalyst particles. References [27,35] are cited in the supplementary materials.

Author Contributions

Conceptualization, J.C.V., A.-E.N. and M.O.; methodology, J.C.V., J.G.B. and R.M.T.; software, J.C.V.; investigation, J.C.V. and A.-E.N.; writing—original draft preparation, J.C.V. and R.M.T.; writing—review and editing, J.C.V., A.-E.N., A.v.d.B., B.M.W., M.O. and R.M.T.; supervision, M.O. and R.M.T.; funding acquisition, A.v.d.B., B.M.W. and M.O. All authors have read and agreed to the published version of the manuscript.

Funding

This work was supported by the Netherlands Center for Multiscale Catalytic Energy Conversion (MCEC), an NWO gravitation program funded by the Ministry of Education, Culture and Science of the government of the Netherlands.

Data Availability Statement

Data are contained within the article.

Acknowledgments

The authors would like to acknowledge Jan van Nieuwkasteele (University of Twente) for his invaluable help in setting up the Hamamatsu camera and attached computer, which enabled fast data processing for fluorescence detection.

Conflicts of Interest

The authors declare no conflicts of interest.

References

  1. Li, Y.; Lin, B.; Ge, L.; Guo, H.; Chen, X.; Lu, M. Real-time spectroscopic monitoring of photocatalytic activity promoted by graphene n a microfluidic reactor. Sci. Rep. 2016, 6, 28803. [Google Scholar] [CrossRef]
  2. Wang, N.; Tan, F.; Zhao, Y.; Tsoi, C.C.; Fan, X.; Yu, W.; Zhang, X. Optofluidic UV-Vis spectrophotometer for online monitoring of photocatalytic reactions. Sci. Rep. 2016, 6, 28928. [Google Scholar] [CrossRef] [PubMed]
  3. Stasiewicz, K.A.; Jakubowska, I.; Moś, J.; Kosturek, R.; Kowiorski, K. In-line gas sensor based on the optical fiber taper technology with a graphene oxide layer. Electronics 2023, 12, 830. [Google Scholar] [CrossRef]
  4. Hengoju, S.; Shvydkiv, O.; Tovar, M.; Roth, M.; Rosenbaum, M.A. Advantages of optical fibers for facile and enhanced detection in droplet microfluidics. Biosens. Bioelectron. 2022, 200, 113910. [Google Scholar] [CrossRef] [PubMed]
  5. Zhou, P.; He, H.; Ma, H.; Wang, S.; Hu, S. A review of optical imaging technologies for microfluidics. Micromachines 2022, 13, 274. [Google Scholar] [CrossRef] [PubMed]
  6. Ye, H.; Zhang, Y.; Liu, H.; Li, X.; Chang, J.; Zheng, H. Light recurrent unit: Towards an interpretable recurrent neural network for modeling long-range dependency. Electronics 2024, 13, 3204. [Google Scholar] [CrossRef]
  7. Barkalov, A.; Lemeshko, O.; Persikov, A.; Yeremenko, O.; Titarenko, L. Evaluation of traffic engineering routing models based on type of service in communication networks. Electronics 2024, 13, 3638. [Google Scholar] [CrossRef]
  8. Laudadio, G.; De Smet, W.; Struik, L.; Cao, Y.; Noël, T. Design and application of a modular and scalable electrochemical flow microreactor. J. Flow Chem. 2018, 8, 157–165. [Google Scholar] [CrossRef]
  9. Camacho López, C.O.; Fejes, Z.; Viskolcz, B. Microreactor assisted method for studying isocyanate-alcohol reaction kinetics. J. Flow Chem. 2019, 9, 199–204. [Google Scholar] [CrossRef]
  10. Zhang, C.; Zhang, J.; Luo, G. Kinetics determination of fast exothermic reactions with infrared thermography in a micoreactor. J. Flow Chem. 2020, 10, 219–226. [Google Scholar] [CrossRef]
  11. Pimparkar, K.; Yen, B.; Goodell, J.R.; Martin, V.I.; Lee, W.-H.; Porco, J.A., Jr.; Beeler, A.B.; Jensen, K.F. Development of a photochemical microfluidics platform. J. Flow Chem. 2011, 2, 53–55. [Google Scholar] [CrossRef]
  12. Rismanian, M.; Said Saidi, M.; Kashaninejad, N. A microfluidic concentration gradient generator for simultaneous delivery of two reagents on a millimeter-sized sample. J. Flow Chem. 2020, 10, 615–625. [Google Scholar] [CrossRef]
  13. Wang, F.; Zhu, J.; Hu, X.; Chen, L.; Zuo, Y.; Yang, Y.; Jiang, F.; Sun, C.; Zhao, W.; Han, X. Rapid nitrate determination with a portable lab-on-chip device based on double microstructured assisted reactors. Lab Chip 2021, 21, 1109–1117. [Google Scholar] [CrossRef]
  14. Cook, S.R.; Musgrove, H.B.; Throckmorton, A.L.; Pompano, R.R. Microscale impeller pump for recirculating flow in organs-on-chip and microreactors. Lab Chip 2022, 22, 605–620. [Google Scholar] [CrossRef]
  15. Epps, R.W.; Felton, K.C.; Coley, C.W.; Abolhasani, M. Automated microfluidic platform for systematic studies of colloidal perovskite nanocrystals: Towards continuous nano-manufacturing. Lab Chip 2017, 23, 4040–4047. [Google Scholar] [CrossRef]
  16. Chen, X.; Zhang, C.; Liu, B.; Chang, Y.; Pang, W.; Duan, X. A self-contained acoustofluidic platform for biomarker detection. Lab Chip 2022, 20, 3817–3826. [Google Scholar] [CrossRef] [PubMed]
  17. Filatov, N.A.; Denisov, I.A.; Evstrapov, A.A.; Bukati, A.S. Open-source pressure controller based on compact electro-pneumatic regulators for droplet microfluidics applications. IEEE Trans. Instrum. Meas. 2022, 71, 4003910. [Google Scholar] [CrossRef]
  18. Yakimov, A.S.; Denisov, I.A.; Bukatin, A.S.; Lukyanenko, K.A.; Belousov, K.I.; Kukhtevich, I.V.; Esimbekov, E.N.; Evstrapov, A.A.; Belobrov, P.I. Droplet microfluidic device for chemoenzymatic sensing. Micromachines 2022, 13, 1146. [Google Scholar] [CrossRef]
  19. Jõemaa, R.; Gyimah, N.; Ashraf, K.; Pärmanets, K.; Zaft, A.; Scheler, O.; Rang, T.; Pardy, T. CogniFlow-Drop: Integrated modular system for automated generation of droplets in microfluidic applications. IEEE Access 2023, 11, 104905–104929. [Google Scholar] [CrossRef]
  20. Anshori, I.; Sarwono, F.Z.; Faiq, M.A.; Putra, N.K.; Suwardy, J.; Purwidyantri, A.; Prabowo, B.A. From design to performance: 3D printing-enabled optimization of low-cost droplet microfluidics. IEEE Sens. J. 2024, 24, 63–70. [Google Scholar] [CrossRef]
  21. van der Loh, M.; Schiffmann, M.; Polack, M.; Wink, K.; Belder, D. Coupling of droplet-on-demand microfluidics with ESI/MS to study single-cell catalysis. RSC Adv. 2024, 14, 25337–25346. [Google Scholar] [CrossRef] [PubMed]
  22. Liao, W.; Wu, Z.; Liu, L.; Lu, Q.; Wang, P.; Huang, X.; Xu, Z. Piezoelectric-synchronized step emulsification for facile generation of microdroplet library with fluid-independent drop size regulation regime. Chem. Eng. J. 2024, 493, 152520. [Google Scholar] [CrossRef]
  23. Yu, D.; Hu, R.; Han, L.; Yang, J.; He, L. Principle and experimental study of a combined teardrop and heart-shaped channel bluffbody valveless piezoelectric pump. Rev. Sci. Instrum. 2024, 95, 065003. [Google Scholar] [CrossRef]
  24. Liao, W.; Wu, Z.; Lu, Q.; Wang, P.; Xu, Z.; Huang, X. Fluctuation-resistant microfluidic droplet generator based on multichannel constant flow regulator. Chem. Eng. Sci. 2025, 305, 121103. [Google Scholar] [CrossRef]
  25. Suryawanshi, P.L.; Gumfekar, S.P.; Bhanvase, B.A.; Sonawane, S.H.; Pimplapure, S. A review on microreactors: Reactor fabrication, design and cutting-edge applications. Chem. Eng. Sci. 2018, 189, 431–448. [Google Scholar] [CrossRef]
  26. Vollenbroek, J.C.; Nieuwelink, A.-E.; Bomer, J.G.; Tiggelaar, R.M.; Van den Berg, A.; Weckhuysen, B.M.; Odijk, M. Droplet microreactor for high-throughput fluorescence-based measurements of single catalyst particle acidity. Microsyst. Nanoeng. 2023, 9, 39. [Google Scholar] [CrossRef] [PubMed]
  27. Nieuwelink, A.-E.; Vollenbroek, J.C.; Tiggelaar, R.M.; Bomer, J.G.; Van den Berg, A.; Odijk, M.; Weckhuysen, B.M. High-throughput activity screening and sorting of single catalyst particles with a droplet microreactor using dielectrophoresis. Nat. Catal. 2021, 4, 1070–1079. [Google Scholar] [CrossRef]
  28. Zhong, B.L.R.; Pan, X.; Jiang, L.; Dai, Z.; Qin, J. Simply and reliably integrating micro heaters / sensors in a monolithic PCR-CE microfluidic genetic analysis system. Electrophoresis 2009, 30, 1297–1305. [Google Scholar] [CrossRef]
  29. Geitenbeek, R.G.; Vollenbroek, J.C.; Weijgertze, H.M.H.; Tregouet, C.B.M.; Nieuwelink, A.-E.; Kennedy, C.L.; Weckhuysen, B.M.; Lohse, D.; van Blaaderen, A.; van den Berg, A.; et al. Luminescence thermometry for in situ temperature measurements in microfluidic devices. Lab Chip 2019, 19, 1236–1246. [Google Scholar] [CrossRef]
  30. Tiggelaar, R.M.; Sanders, R.G.P.; Groenland, A.W.; Gardeniers, J.G.E. Stability of thin platinum films implemented in high-temperature microdevices. Sens. Actuators A 2009, 152, 39–47. [Google Scholar] [CrossRef]
  31. Gavoille, T.; Pannacci, N.F.; Bergeot, G.; Marliere, C.; Marre, S. Microfluidic approaches for accessing thermophysical properties of fluid systems. React. Chem. Eng. 2019, 4, 1721–1739. [Google Scholar] [CrossRef]
  32. Eggart, D.; Zimina, A.; Cavusoglu, G.; Casapu, M.; Doronkin, D.E.; Lomachenko, K.A.; Grunwaldt, J.-D. Versatile and high temperature spectroscope cell for operando fluorescence and transmission x-ray absorption spectroscopic studies of heterogeneous catalysts. Rev. Sci. Instrum. 2021, 92, 023106. [Google Scholar] [CrossRef] [PubMed]
  33. Razzaq, T.; Kappe, C.O. Continuous flow organic synthesis under high temperature/high-pressure conditions. Chem. Asian, J. 2010, 5, 1274–1289. [Google Scholar] [CrossRef] [PubMed]
  34. Van den Brink, F.T.G.; Phisonkunkasem, T.; Asthana, A.; Bomer, J.G.; Van den Maagdenberg, A.M.J.M.; Tolner, E.A.; Odijk, M. A miniaturized push-pull-perfusion probe for few-second sampling of neurotransmitters in the mouse brain. Lab Chip 2019, 19, 1332–1343. [Google Scholar] [CrossRef]
  35. Vollenbroek, J.C.; Bomer, J.G.; van den Berg, A.; Odijk, M.; Nieuwelink, A.E.; Weckhuysen, B.M.; Geitenbeek, R.G.; Meijerink, A.; Tiggelaar, R.M. Design and characterization of a microreactor for monodisperse catalytic droplet generation at both elevated temperatures and pressures. In Proceedings of the 2017 IEEE 12th International Conference on Nano/Micro Engineered and Molecular Systems (NEMS), Los Angeles, CA, USA, 9–12 April 2017; pp. 746–751. [Google Scholar] [CrossRef]
Figure 1. Geometry used in the COMSOL simulation showing used materials (platinum (1), water (2), and silicon (3)), dimensions, and boundary conditions. Boundary conditions are the inlet parabolic velocity profile for the fluidic channel (A), heat loss modeled as an outflux of 953 Wm−2K−1 (B1) and 10 Wm−2K−1 (B2), heat source of 300 mW (C), thermally insulating surfaces (D), and no viscous stress (E) on the appointed channel wall. (O) The origin of the channel. (S) The symmetry plane of the geometry.
Electronics 14 01506 g001
Figure 2. Cross-sectional simulation image of the fluidic channel with microheater. The image shows the temperature distribution within the channel. The power applied to the heater during the simulation was 1.13 W. Image taken at z = 200 µm.
Electronics 14 01506 g002
Figure 3. (A) Exploded view of the chip holder showing all the individual components. (B) The assembled chip holder. (C,D) CAD drawing (with all dimensions) of the chip holder bottom plate and top piece.
Electronics 14 01506 g003
Figure 4. (A) Electrical read-out circuit used for measurement and amplification of the voltage across both temperature sensor structures (TS1 and TS2; Copyright © 2023, the author(s), under Creative Commons CC-BY License. Adapted from the SI of [17]). (B) Heater actuation circuit. (C) Image of the PCB that is used for read-out and control of the temperature sensors and microheaters. (D) Routing on the frontside of the PCB as designed in eagle. (E) Routing on the backside of the PCB as designed in eagle.
Electronics 14 01506 g004
Figure 5. (A) Fluorescence intensity of one of the ‘brightest’ particles. (B) A zoom-in of the detection region that was made in the software and (C) a heatmap of the fluorescent intensities of the detection region. (D) A particle that is barely visible above the background signal (average value of 90 (a.u.). (E) A zoom-in of the detection region and (F) a heatmap of this particle. (G) A histogram of the intensity distribution of 967 detected particles, including indications where (A) and (D) are in this histogram.
Electronics 14 01506 g005
Figure 6. (A) Images of the microreactor side connect holder (top row) and the vertical chip holder holder (bottom row) for placement of the microreactor in front of the optical set-up (B,C) CAD drawings (with all dimensions) of the chip holder and the chip holder body.
Electronics 14 01506 g006
Figure 7. (A) Electronic circuit used as electronic switch to activate the DEP electrodes (adapted from [27]). (B) Image of the experimental PCB used for the DEP pulse activation.
Electronics 14 01506 g007
Figure 8. Top: Detailed schematic of the optical and fluidic set-up. Bottom: Schematic of the electronic processing and internal decision scheme of the DAQ and DEP activation.
Electronics 14 01506 g008
Figure 9. Left side: The training set for determining the background (0.92 V) and spread in the PMT read-out for fluorescent particles. Right side: The histogram for the distribution of 401 particles. The distribution is very similar to the histogram obtained with the activity screening platform, showing that both platforms can detect the activity distribution using a fluorescent probe of the same catalyst population.
Electronics 14 01506 g009
Table 1. Material parameters used for the simulation of the heat transfer coefficient of the silicon–glass microreactor.
Thermal Conductivity (Wm−1K−1)Density
(kgm−3)
Thermal Capacity (Jkg−1K−1)
Water0.614185.5
Silicon302329700
Platinum71.621,450133
Disclaimer/Publisher’s Note: The statements, opinions and data contained in all publications are solely those of the individual author(s) and contributor(s) and not of MDPI and/or the editor(s). MDPI and/or the editor(s) disclaim responsibility for any injury to people or property resulting from any ideas, methods, instructions or products referred to in the content.

