Article

Research on Target Detection Algorithm for Complex Traffic Scenes Based on ADVI-CFAR

1
College of Communication and Information Technology, Xi’an University of Science and Technology, Xi’an 710054, China
2
Xi’an Key Laboratory of Network Convergence Communication, Xi’an 710054, China
*
Author to whom correspondence should be addressed.
Electronics 2025, 14(7), 1474; https://doi.org/10.3390/electronics14071474
Submission received: 4 March 2025 / Revised: 3 April 2025 / Accepted: 4 April 2025 / Published: 6 April 2025

Abstract

:
To address the issue of reduced target detection accuracy due to interfering targets and clutter reference cells in complex traffic scenarios, we propose the ADVI-CFAR (Adaptive Discriminant Variation Index Constant False Alarm Rate) detection algorithm. Considering that the non-uniformity of the background environment leads to significant variations in signal power magnitude, we introduce a background power transition point to evaluate the uniformity of the background environment within the reference window. Moreover, in complex background environments, clutter distributions often exhibit skewness rather than a Gaussian distribution. We incorporate the higher-order statistical skewness of the clutter to calculate the background power threshold index, thereby improving the accuracy of background power estimation. Then, based on the transition points and clutter power index, the background environment is classified, and an appropriate detection threshold calculation method is chosen for target detection. We conduct a simulation analysis in uniform, non-uniform, and clutter edge environments, and the results show that the identification accuracy exceeds 95% for all three background environments. At a detection probability of 50%, the performance loss is 0.08 dB in uniform environments and 0.36 dB in multi-target environments. When the false alarm probability is set to 10 4 , the ADVI-CFAR algorithm significantly suppresses false alarms, with the false alarm peak occurring at 10 3.52 . Real data from urban traffic scenarios validate the method, showing that it achieves a high detection accuracy for target detection in real traffic scenarios and effectively meets the radar target detection requirements in practical traffic environments.

1. Introduction

Target detection is a critical component of intelligent transportation monitoring systems, providing essential information to the system by accurately identifying and locating targets in traffic. Millimeter-wave radar [1], as one of the key sensors in intelligent transportation systems, detects and identifies targets by receiving signals reflected from objects [2]. However, there are various types of traffic targets and vehicles in complex traffic environments. When millimeter-wave radar receives echo signals, it must not only detect actual vehicles on the road [3,4] but also handle clutter signals from the surrounding environment. These complex interference signals affect target echo signals, leading to false alarms or missed detections. As a key technique in millimeter-wave radar target detection, constant false alarm rate (CFAR) detection technology helps maintain a constant false alarm probability within a specified range, thereby ensuring the highest detection probability. Therefore, research into CFAR detection technology is crucial to improving the detection accuracy of millimeter-wave radar.
Regarding the algorithms related to constant false alarm detection technology, scholars both domestically and internationally have conducted extensive research. Traditional constant false alarm rate (CFAR) algorithms are divided into mean-based CFAR and ordered CFAR algorithms, with some scholars having conducted studies on these two types of CFAR algorithms. Safa A et al. [5] proposed a low-complexity radar detector for indoor drone obstacle avoidance. Compared with Order Statistic CFAR (OS-CFAR) and other multi-target CFAR algorithms, it improves the detection probability while reducing the computational complexity, making it suitable for real-time applications. Rihan M Y et al. [6] proposed a Censored Mean Clutter Map CFAR (CM-CM-CFAR) algorithm based on a hybrid of Censored Mean Level Detector CFAR (CMLD-CFAR) and Clutter Map CFAR (CM-CFAR), which solves the problem of the decreased detection performance of the CMLD-CFAR algorithm in multi-target and clutter edge environments. Jiménez L P J et al. [7] proposed a general Cell-Averaged CFAR (CA-CFAR) detection model for Weibull distribution clutter, which solves the limitation of fixed shape parameters in previous CA-CFAR analysis and simplifies the model but limits the scope of application. Sun BB et al. [8] proposed an improved CA-CFAR detector. First, the non-uniform points are eliminated, and the non-uniform environment is transformed into a uniform environment. Then, CA-CFAR is used to detect whether the unit to be tested is a target.
With the rise of adaptive CFAR algorithms, they have demonstrated outstanding performance in target detection, with stronger adaptability. Scholars have conducted extensive research on adaptive algorithms. Boudemagh N et al. [9] proposed an automatic screening CFAR (AC-CFAR) detector for heterogeneous environments, which dynamically selects the most suitable traditional CFAR detection method according to background irregularities and has high detection performance for clutter edges and interfering targets in the environment. Zhang X et al. [10] proposed a skewness-to-mean ratio CFAR detector for non-uniform Weibull clutter environments. This method uses skewness and the mean ratio to adaptively select the optimal reference window, improves target detection performance in multi-target environments, and reduces false alarms at the clutter edge. Subramanian, R. et al. [11] proposed a Robust Variability Index CFAR (RVI-CFAR) detector to improve the detection performance in complex scenarios such as those with multiple targets or clutter edges by using variability index (VI) multi-stage optimized threshold estimation. Coluccia A et al. [12] proposed a customized adaptive CFAR detection algorithm, which uses a customized CFAR feature plane to provide a detector that can perform well under matching and mismatching conditions to ensure its adaptability. Yang X et al. [13] proposed a method based on cell average clutter map (CA-CM) CFAR to improve traditional CFAR detection by dynamically adjusting the detection threshold based on the clutter variability index. Wang X et al. [14] proposed a robust variation index CFAR detector (RWVI-CFAR) combined with an automatic outlier external value review maximum likelihood CFAR (AOCML-CFAR) strategy to address the challenge of target and clutter edge interference. Ni L et al. [15] proposed a cascaded filter adaptive CFAR detector, which combines the advantages of multiple CFAR techniques through a two-stage detection process and effectively enhances the detection performance in multi-target and clutter edge scenes. Qu C et al. [16] proposed an adaptive CFAR detector based on the quadratic sum of sample autocovariance, which solves the challenges of clutter and weak target detection by removing complex clutter modeling and theoretical threshold derivation and has strong resistance to interference in multi-target environments. Xiangwei M et al. [17] proposed an improved rank and non-parametric CFAR method to solve the problem of unstable false alarm rate control in clutter edge conditions, but the performance is poor in high-dynamic-range environments. Madjidi H et al. [18] proposed a bilateral automatic truncated CFAR detector to solve the detection challenges in heterogeneous clutter environments, but its performance has certain limitations in extreme clutter scenarios where edge and interfering targets coexist. Liu K et al. [19] proposed a CFAR detection algorithm based on clutter knowledge (CK-CFAR) to improve the detection performance of radar in a non-uniform dynamic clutter environment.
Scholars have also explored target detection algorithms tailored to specific scenarios and signal characteristics. Yang B et al. [20] proposed a CFAR algorithm based on the Monte Carlo principle (MC) for moving target detection using millimeter-wave radar in road traffic environments. Cao Z et al. [21] proposed a new CFAR detection algorithm based on sparse adaptive correlation maximization (SACM-CFAR) to detect targets by utilizing the correlation between the linear measurement of the radar intermediate frequency (IF) signal and the perception matrix. Wei Z et al. [22] proposed a region-based CFAR framework that utilizes the high spatiotemporal resolution of millimeter-wave radar to improve detection accuracy and significantly enhance the detection performance in SISO and MIMO radar systems.
In summary, researchers have proposed various improvements to address the limitations of CFAR algorithms, significantly enhancing target detection accuracy and interference resistance. Furthermore, methods such as adaptive threshold adjustment, attention mechanisms, and non-parametric detection have bolstered the robustness of CFAR algorithms in complex backgrounds and multi-target environments. However, in real-world traffic scenarios, the complexity of the target detection background remains a challenge, and existing methods still suffer from reduced detection accuracy, as well as false alarms and missed detections, particularly for small vehicle targets.
In response to the issue of the low detection accuracy of CFAR algorithms in real traffic scenes, this paper proposes an improved algorithm based on the traditional variable index CFAR (VI-CFAR) detector. The proposal is developed through an in-depth analysis of the characteristics of target signals in traffic environments. The main contributions of this paper are as follows:
  • Introduction of background power transition points. By accurately calculating the background power of different signal units within the reference window, we determine whether the background environment of the reference window is homogeneous, providing a prior condition for subsequent background environment classification, thus offering more accurate background environmental information for target detection.
  • Introduction of higher-order statistical skewness of clutter signals. In real environments, the distribution of background clutter often does not strictly follow a Gaussian distribution, particularly in complex environments such as traffic monitoring, where the clutter distribution may exhibit skewness (i.e., non-zero skewness). Higher-order statistical skewness can more precisely describe the distribution characteristics of clutter signals, thereby effectively improving the accuracy of background clutter power estimation.
  • Improvement of adaptive threshold generation rules. The traditional VI-CFAR threshold decision rule is modified, with the OS-CFAR algorithm, which performs better in multi-target environments, replacing the SO-CFAR algorithm, thus enhancing the performance of the target detection algorithm.

2. Radar Signal Modeling and Algorithm Analysis

2.1. Radar Signal Modeling

Assume that the number of transmitting antennas is M and that the number of receiving antennas is N. The transmission is carried out according to the order of T X 1 , T X 2 , , T X M , and the transmission starts from T X 1 to T X M , with the end result being an MIMO period [23]. According to the MIMO virtual array extension method, we can extend the M transmitting antennas and N receiving antennas into an M × N virtual array. The array is arranged as shown in Figure 1. Assuming that there is a remote target, based on the TDM transmission method, in a noisy environment, the radar signal transmitted [24] by the antenna S T at the k-th frequency is expressed as
S T ( t ) = A exp j 2 π L f 0 t ( k 1 ) T + μ 2 t ( k 1 ) T 2 + φ 0 , t ( k 1 ) T , T + ( K 1 ) T
where A is the transmission signal bandwidth; f 0 is the initial frequency; φ 0 is the initial phase; and μ is the modulation frequency, expressed as
μ = B T
where T is the linear frequency modulation period, and B is the frequency modulation bandwidth.
In order to obtain more detailed target information, information must be retrieved from the return signal. We mix the return signal with the transmitted signal and obtain the target signal after filtering out the noise through the low-pass filter. Based on the MIMO virtual array extension method, the difference in the received signals at the n-th virtual array element is expressed as
S I F ( t , n ) = S I F ( t ) exp j φ n t
where φ n represents the phase information of the n-th virtual element. By processing the echo signal of the receiving antenna, the beat signal is extracted using 2D-FFT, and, finally, the extracted result is used for target detection through the CFAR detector to obtain the target information.
In radar signal detection, the target detection process is a binary hypothesis problem [25]. When only noise is present in the return signal, the hypothesis is H 0 (no target). If the target signal is also present, the hypothesis is H 1 (target present). The judgment method is expressed as
H 0 : x ( t ) = n ( t ) H 1 : x ( t ) = s ( t ) + n ( t )
Assuming that the radar echo signal amplitude follows a Gaussian distribution and is exponentially distributed after square-law detection, the probability density function (PDF) of the exponential distribution model is
f ( x ) = 1 λ exp x λ , x 0
where λ is the total power of each element, and x is the value of the return signal bandwidth. If in H 0 , the hypothesis is λ for the total noise power; if in H 1 , the hypothesis is λ for the target model, with clutter and noise power. In the communication environment, the target model generally follows Swerling I and Swerling II models. This is expressed as
λ = μ , H 0 ( 1 + s ) μ , H 1
When the noise power is μ 0 , the false alarm probability P f a and detection probability P d are expressed as
P f a = V T p ( x | H 0 ) d x
P d = V T p ( x | H 1 ) d x
where v T is the optimal detection threshold, expressed as
V T = μ 0 ln ( P f a )

2.2. VI-CFAR Algorithm

The VI-CFAR algorithm evaluates the background environment characteristics of the target under test by analyzing the change indices V I A and V I B of the front and rear halves of the detection window, as well as the mean ratio M R , and it selects the optimal algorithm that adapts to the environment. The algorithm then calculates the threshold factor C V I and the background clutter power V I , ultimately generating a detection threshold, which is compared with the unit under test to determine the presence of a target. A block diagram of the VI-CFAR algorithm is shown in Figure 2.
In Figure 2, V I A and V I B represent the second-order statistics related to the difference and the mean value of the reference windows A and B, respectively. D is the test unit, P is the protection unit, A and B are the background power values for the front and rear halves of the windows, V I is the final background power estimation value, C V I is the threshold factor, and T is the detection threshold. Reference [11] introduces the detailed computation process of V I for the VI-CFAR algorithm. We can express V I as
V I = 1 + σ ^ 2 μ ^ 2
where σ 2 is the variance, and μ 2 is the mean value. The mean and variance are expressed as
σ ^ 2 = 1 n 1 i = 1 n ( X i X ¯ ) 2
μ ^ = 1 N / 2 i = 1 N / 2 X i
where X i represents the N / 2 distance unit elements, which is the mean of a reference half-window, and n is the number of reference units in the half-window.
When the background environment is determined to be uniform, the threshold factor is calculated based on the reference window selected according to the CA-CFAR algorithm as follows:
C N = P f a 1 N 1
In non-uniform environments, VI-CFAR ideally selects half of the reference window to estimate the clutter power. Therefore, the threshold factor is calculated based on the CA-CFAR of N / 2 reference windows as follows:
C N / 2 = P f a 1 / ( N / 2 ) 1
The mean ratio M R of the front and back reference windows can be defined as
M R = X ¯ A X ¯ B = i A X i i B X i
After obtaining the two statistics, the background clutter environment is judged by comparing them with the hypothesis test thresholds K V I and K M R . The discrimination method can be expressed as follows:
V I K V I Homogeneous environment V I > K V I Non-Homogeneous environment
K M R 1 M R K M R Equal average M R > K M R 1 and M R > K M R Unequal average
In the background environment judgment process, the statistical quantities V I A and V I B on the left and right sides are compared with the hypothesis testing thresholds K V I . The judgment is based on whether the environment is homogeneous or non-homogeneous, which helps distinguish multiple target environments. The mean ratio M R is used to describe the difference between the mean values of the reference windows on the left and right, and the judgment element is based on whether it falls within the noise environment or the target environment. The selection of the thresholds K V I and K M R is crucial for detection performance. When the threshold is large, it may lead to a misjudgment of the homogeneous environment; when it is small, the opposite could happen. Reference [26] proposes an optimized threshold selection strategy: K V I should ensure that the false alarm rate in homogeneous environments and the probability of detection under set thresholds are balanced, while K M R requires the mean threshold error to be lower than 0.1. The rule for generating the adaptive threshold of VI-CFAR is shown in Table 1.
The VI-CFAR detector combines the characteristics of CA-CFAR, the Greatest of Constant False Alarm Rates (GO-CFAR), and the Smallest of Constant False Alarm Rates (SO-CFAR). However, the detection performance of the VI-CFAR detector is limited by the quality of the selected threshold generation strategy and the inherent performance of the chosen strategy. In clutter edge environments, if the number of reference cells with high-level clutter is small, the VI-CFAR detector may mistakenly identify the clutter edge environment as a multi-target environment, resulting in an increased false alarm rate. In multi-target environments, if the number of interference targets in the front and rear reference windows differs, VI-CFAR may incorrectly classify reference windows with a higher number of interference targets as homogeneous environments and those with fewer interference targets as non-homogeneous environments, leading to a detection threshold calculation based on the reference window with fewer interference targets, which, in turn, reduces the detection probability. In practical traffic scenarios, the complexity of background environmental changes, the number of interference targets, and the number of reference cells that contain clutter all significantly impact the detection performance of the VI-CFAR detector.

3. The ADVI-CFAR-Based Target Detection Algorithm

In response to the limitations of the VI-CFAR algorithm in real traffic scenarios, the ADVI-CFAR detector refines the method for background environment classification within the reference windows, thus improving detection performance in non-homogeneous environments and enabling the millimeter-wave radar to achieve better detection performance in complex traffic environments. ADVI-CFAR first calculates whether there are significant power fluctuations in the front and rear reference windows to determine whether the background environment is homogeneous. It then improves the original variability index by incorporating higher-order statistical parameters, such as skewness, to assess changes in the clutter pattern further. This, in combination with transitional points, is used to classify the background environment. Finally, based on the classification results, different threshold generation methods are selected to optimize detection. This approach significantly improves the radar’s ability to distinguish the background environment, improving the detection performance in challenging real-world traffic environments.
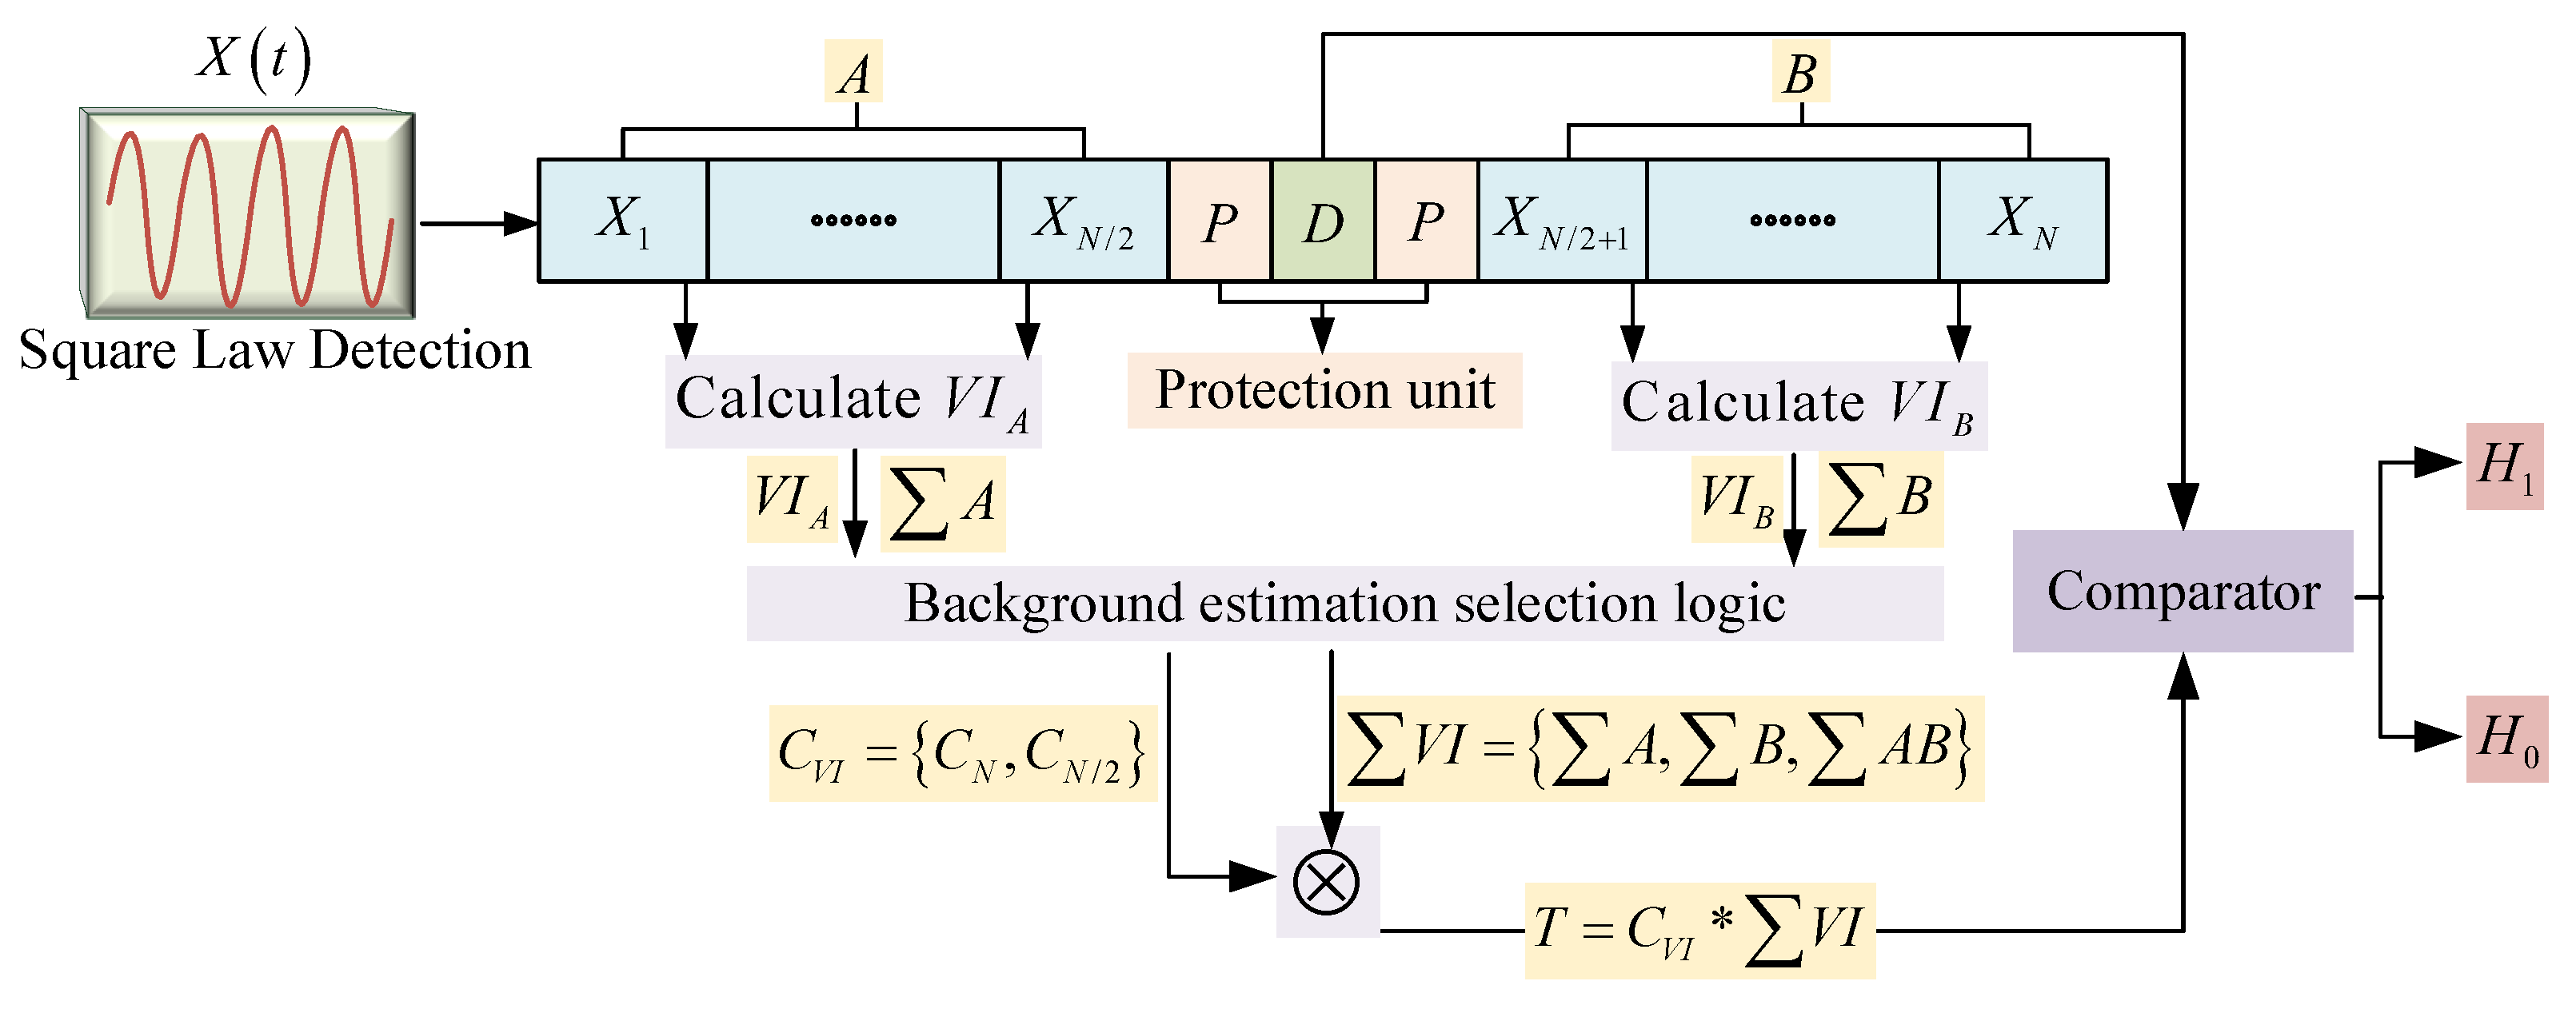
Assume that the reference window consists of N reference cells, divided into the front half of reference window A and the rear half of reference window B. The clutter echoes follow a Gaussian distribution, and the sampling of each reference cell, after passing through a square-law detector, follows an exponential distribution. Its probability density function (PDF) is given by
f ( x ) = 1 λ exp x λ
where λ is the estimated background noise power of the reference cell X and can be expressed as
λ = λ t 1 + σ I + σ C
where λ t is the estimated thermal noise power, σ I is the interference-to-noise ratio (INR), and σ C is the clutter-to-noise ratio (CNR).
To calculate the position of the transition point p [9], we need to assess whether there is a significant increase or decrease in power within the reference window. Since the reference cells are not sorted, both power increases and decreases may exist. The transition variable p is used to measure the signal variation and is expressed as
p = j + 1 if X j + 1 > T j i = 1 j X i , or ( X j + 1 + X j + 2 + X j + 3 ) 3 1 j T j i = 1 j X i 0 otherwise
where X j is the j-th signal in the reference window, and T j is the threshold factor of CA-CFAR, calculated as follows:
T j = P f a 1 j 1
where P f a is the desired false alarm rate. By measuring the signal change in the reference window by the transition variable, the discrimination method can be expressed as
p = 0 Homogeneous environment p 0 Non-Homogeneous environment
If p = 0 , there is no transition in the signal variation within the reference window, and it is classified as a homogeneous environment, potentially a uniform environment. If p 0 , a transition point in the signal variation is detected within the reference window, and it is classified as a non-homogeneous environment, potentially a clutter edge environment or a multi-target environment.
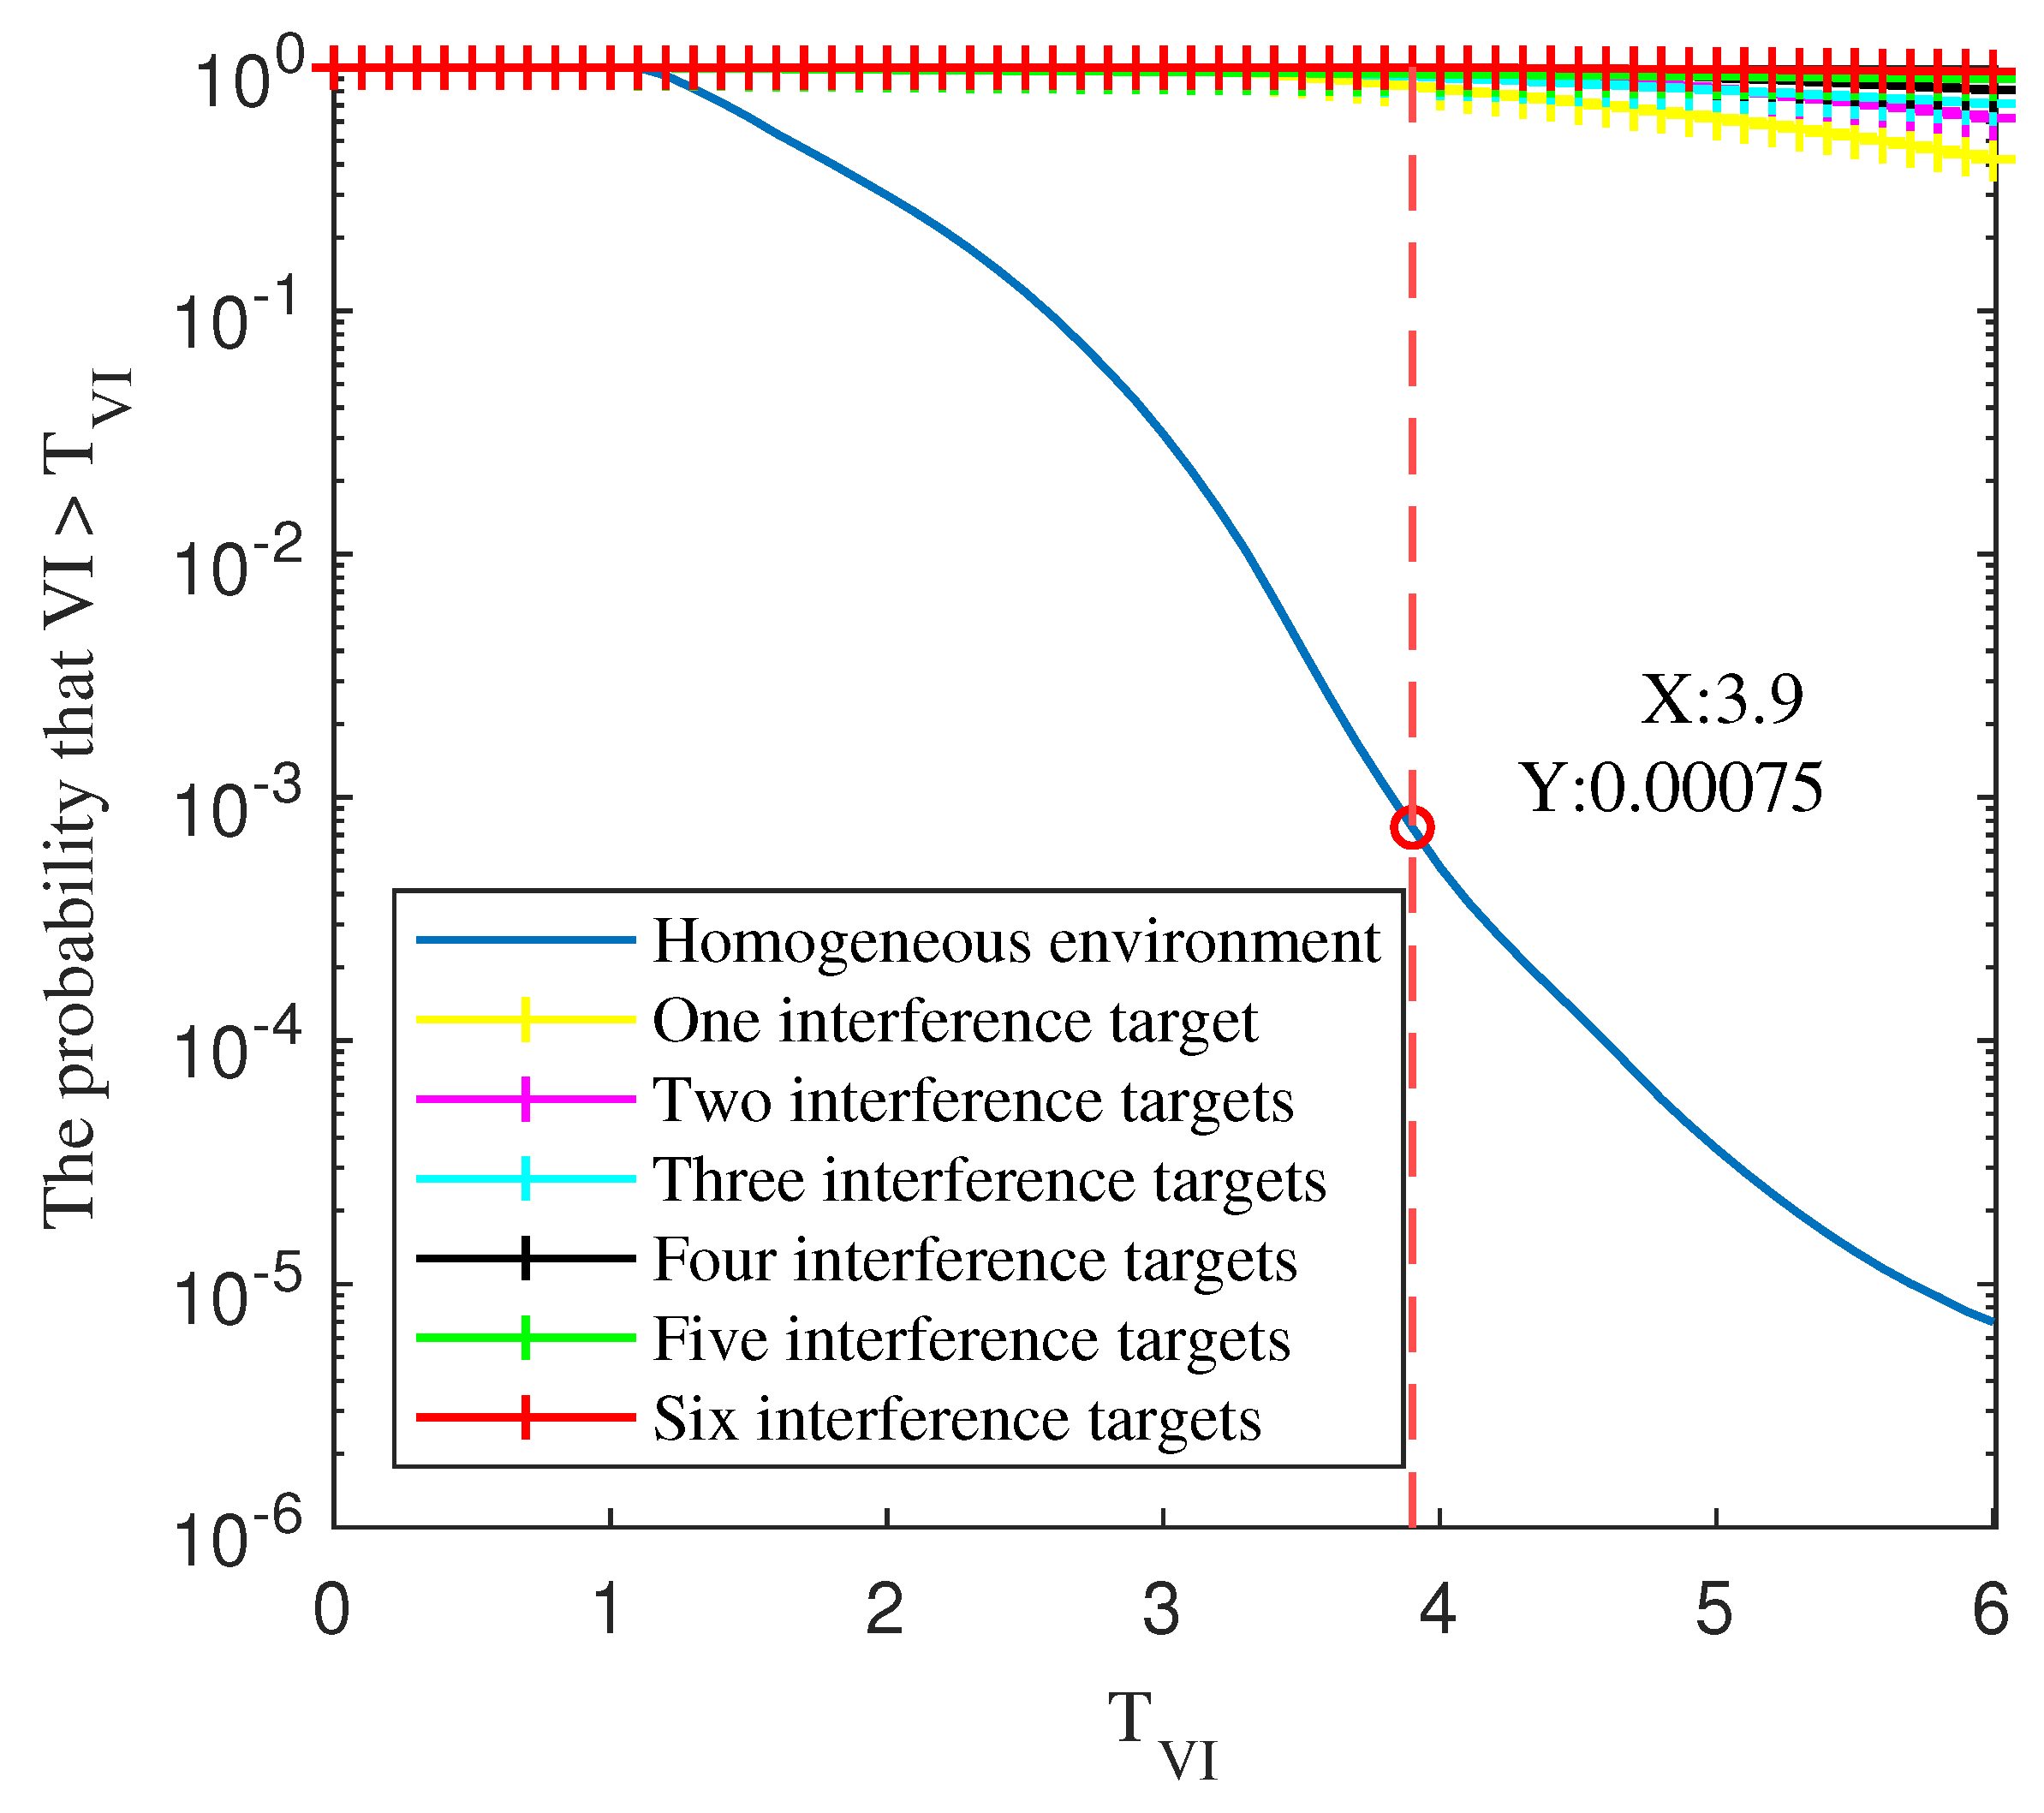
The variability index and threshold are compared by incorporating the transition variable results. The traditional VI-CFAR algorithm calculates the variability index based on the mean and standard deviation of the signal. However, the background clutter distribution in real environments often does not strictly follow a Gaussian distribution, especially in complex environments such as traffic monitoring, where the clutter distribution may exhibit skewness [10] (i.e., non-zero skewness). When an interfering target is in the reference window, the signal skewness will increase significantly, as shown in Figure 3.
To address this, we extend the original variability index calculation method by incorporating higher-order statistical moments, specifically skewness, to assess changes in the clutter pattern further. This allows for a more precise differentiation of the background environment.
In the VI-CFAR algorithm, the variability index V I calculation method is expressed as
V I = 1 + μ ^ 2 σ ^ 2
where μ ^ and σ ^ 2 represent the overall mean and variance of the reference window’s magnitude starting from the transition point and are expressed as
μ ^ = 1 N p + 1 i = p N X i
σ ^ = 1 N p + 1 i = p N ( X i μ ^ ) 2
To improve the sensitivity of the variability index in the background environment, higher-order statistical moments, specifically skewness γ ^ , are introduced to measure the signal distribution characteristics. The calculation method is expressed as
γ ^ = 1 ( N p + 1 ) σ ^ 3 i = p N ( X i μ ^ ) 3
After adding Equation (26) to (23) and rearranging it, the improved variability index V I ^ is expressed as
V I ^ = 1 + μ ^ 2 σ ^ 2 + γ ^
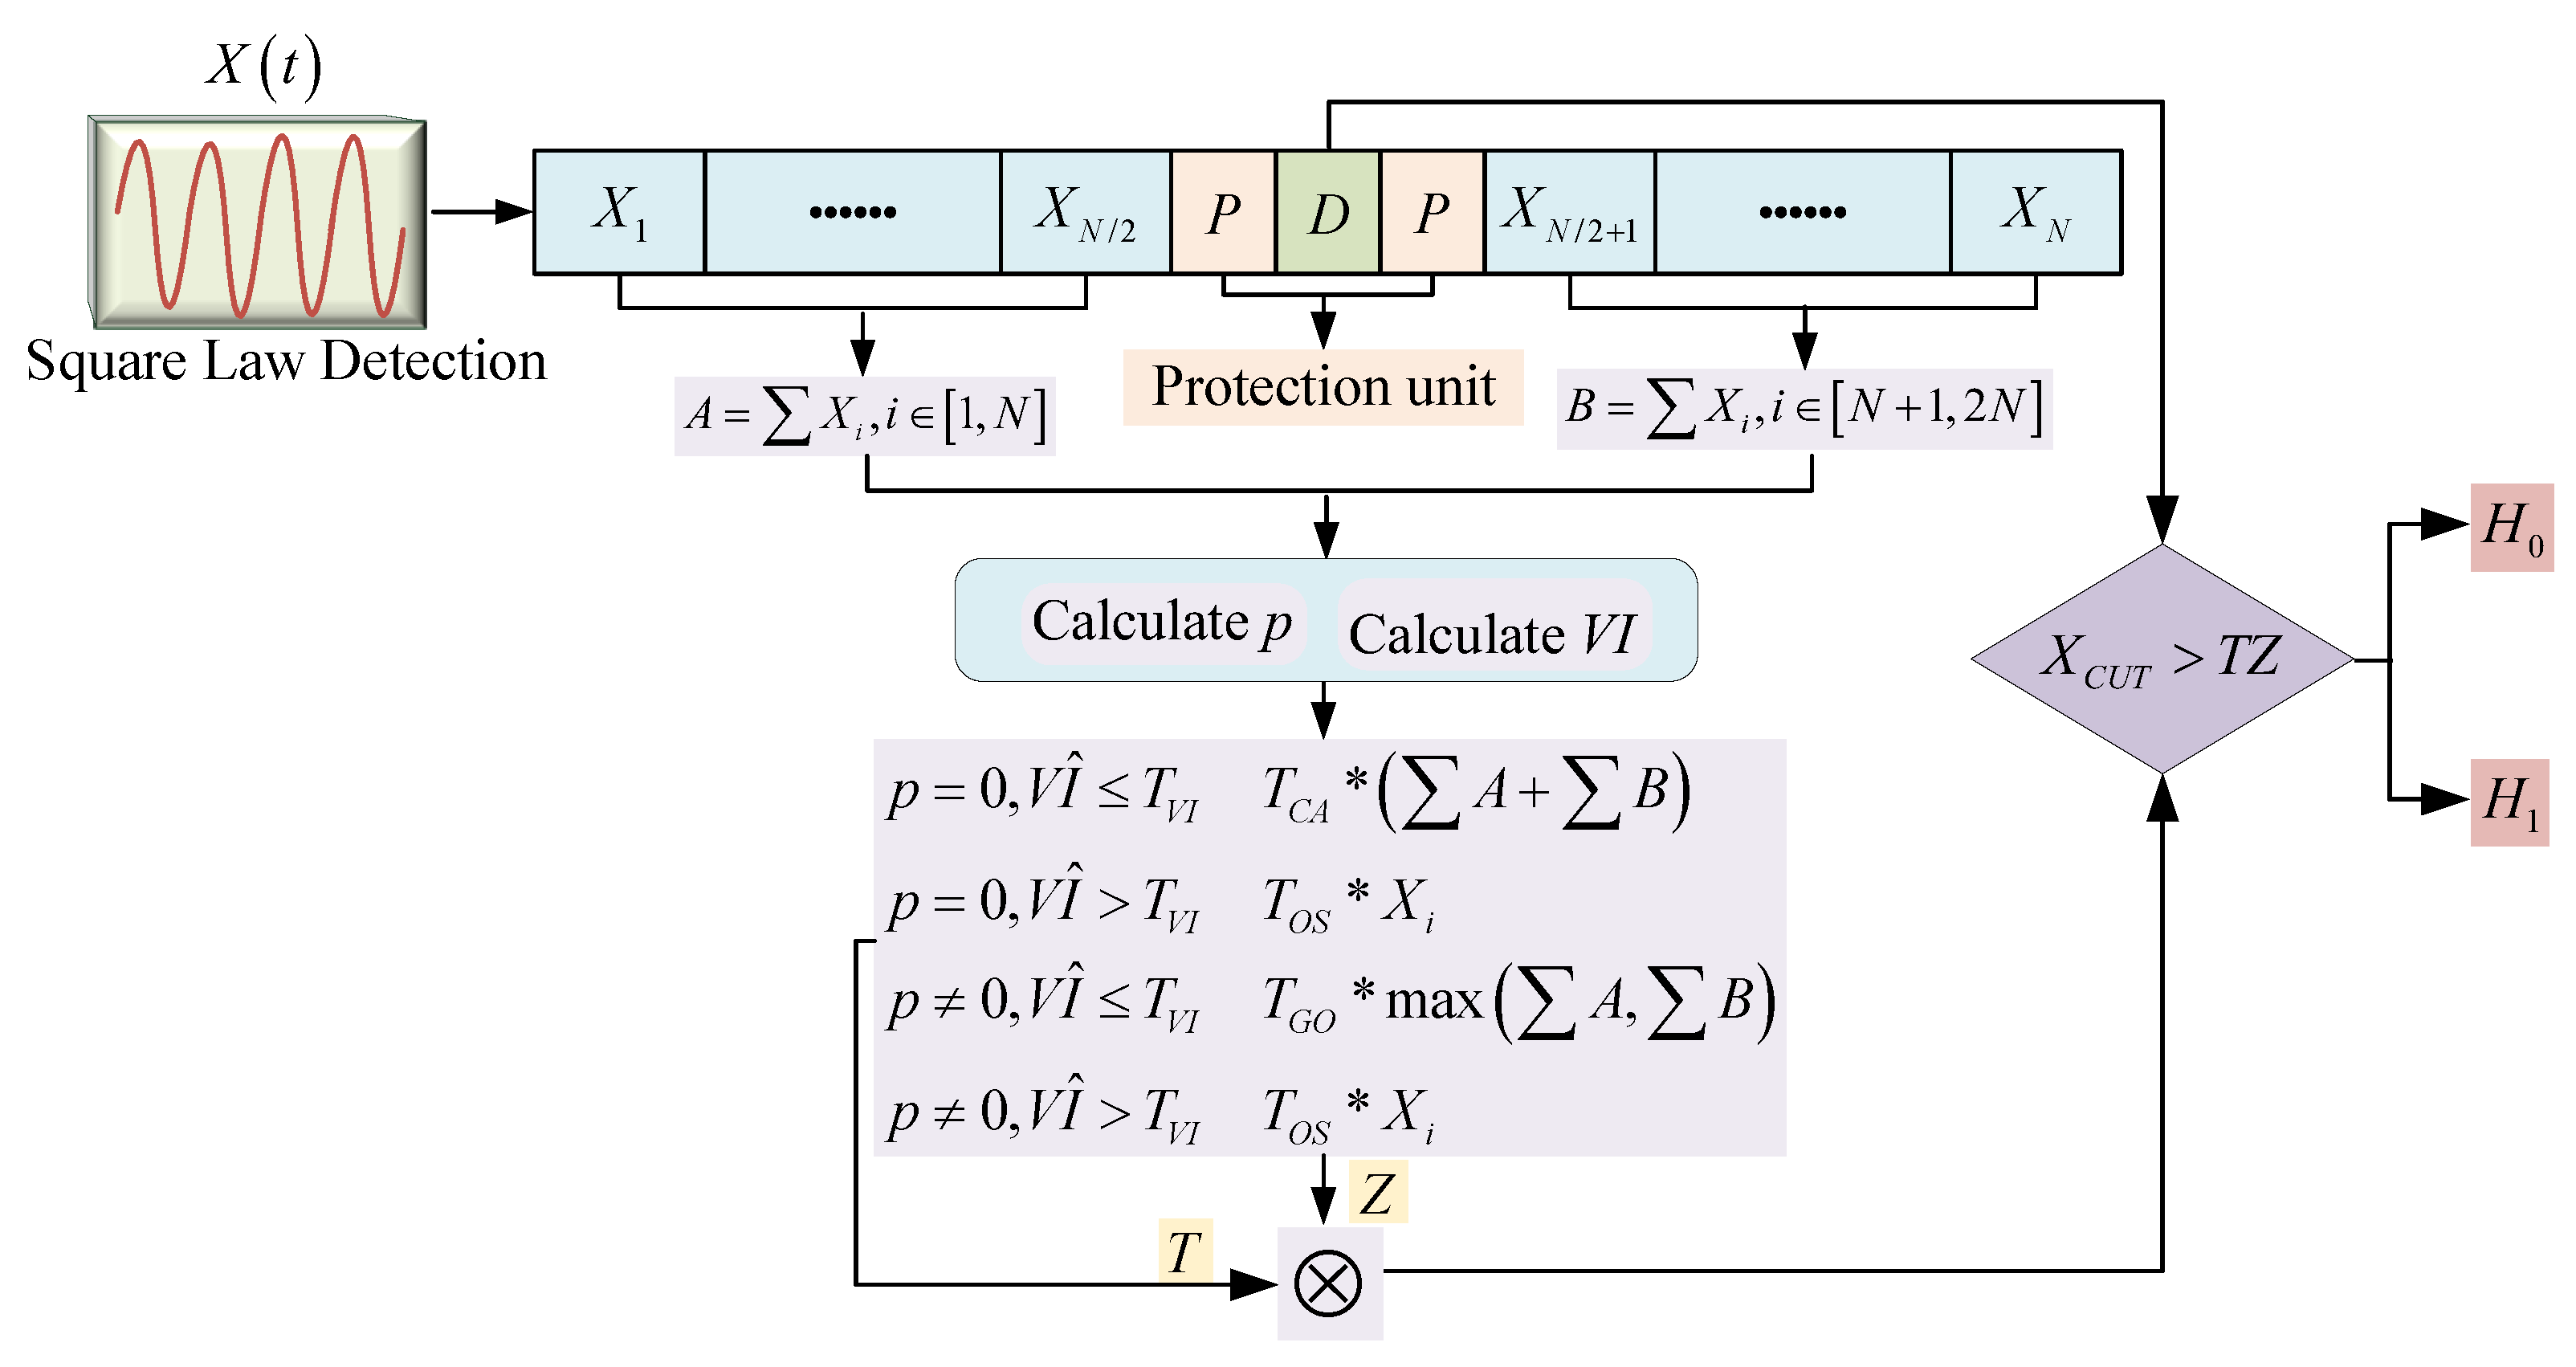
By combining the transition variable, an appropriate method for calculating the detection threshold is selected. The improved variability index V I ^ is then compared with the threshold T V I . A processing flowchart of the ADVI-CFAR algorithm is shown in Figure 4.
The decision rule for comparing the variability index V I ^ with the threshold T V I is as follows:
V I ^ T V I Homogeneous environment V I ^ > T V I Non-Homogeneous environment
Based on the calculated V I ^ value, the homogeneity of the current environment is judged. Suppose that the V I ^ value is greater than the threshold T V I . In that case, the current environment exhibits strong non-homogeneity, meaning that the reference window is either in a clutter edge environment or contains interference targets. Conversely, if the V I ^ value is less than the threshold, the background environment of the current reference window is homogeneous. The detection threshold generation method is shown in Table 2.
Since the OS-CFAR algorithm has better detection performance in a multi-target environment, the SO-CFAR detection algorithm in the traditional VI-CFAR algorithm is replaced by the OS-CFAR algorithm for target detection.
When p = 0 and V I ^ T V I , there is no transition in the background environment, and the signal amplitude of the reference cells within the reference window is uniform. Therefore, the background environment is classified as a homogeneous environment. Since CA-CFAR demonstrates good detection performance in homogeneous environments, the detection threshold is calculated using T C A * ( A + B ) .
When the INR is low, the method used in this paper for detecting transitions fails to recognize the existence of the transition point in the reference window, and the result is p = 0 . When p = 0 and V I ^ > T V I , there is no transition in the background environment, and the reference window’s bandwidth is homogeneous. Therefore, the background environment is likely a multi-target environment. Since OS-CFAR demonstrates good detection performance in multi-target environments, it replaces the SO-CFAR algorithm in the traditional VI-CFAR algorithm. This method uses T O S * X i to calculate the detection threshold, where X i is the signal at the i-th reference window.
When p 0 and V I ^ T V I , there is a transition in the background environment, and the reference window’s bandwidth value starting from the transition point is homogeneous. Therefore, the background environment is classified as a cluttered edge environment. Since GO-CFAR provides good false alarm suppression in clutter edge environments, the virtual alarm rate is lower, so the detection threshold is calculated using T G O * max ( A , B ) .
When p 0 and V I ^ > T V I , the background environment contains transitions, with the reference unit starting from the transition point. The background environment is identified as a multi-target environment due to the non-uniformity of the clutter. Since the background environment is identified as a multi-target scenario, the OS-CFAR method, which performs well in multi-target environments, is used for target detection. Therefore, the detection threshold is calculated using T O S * X i , j .
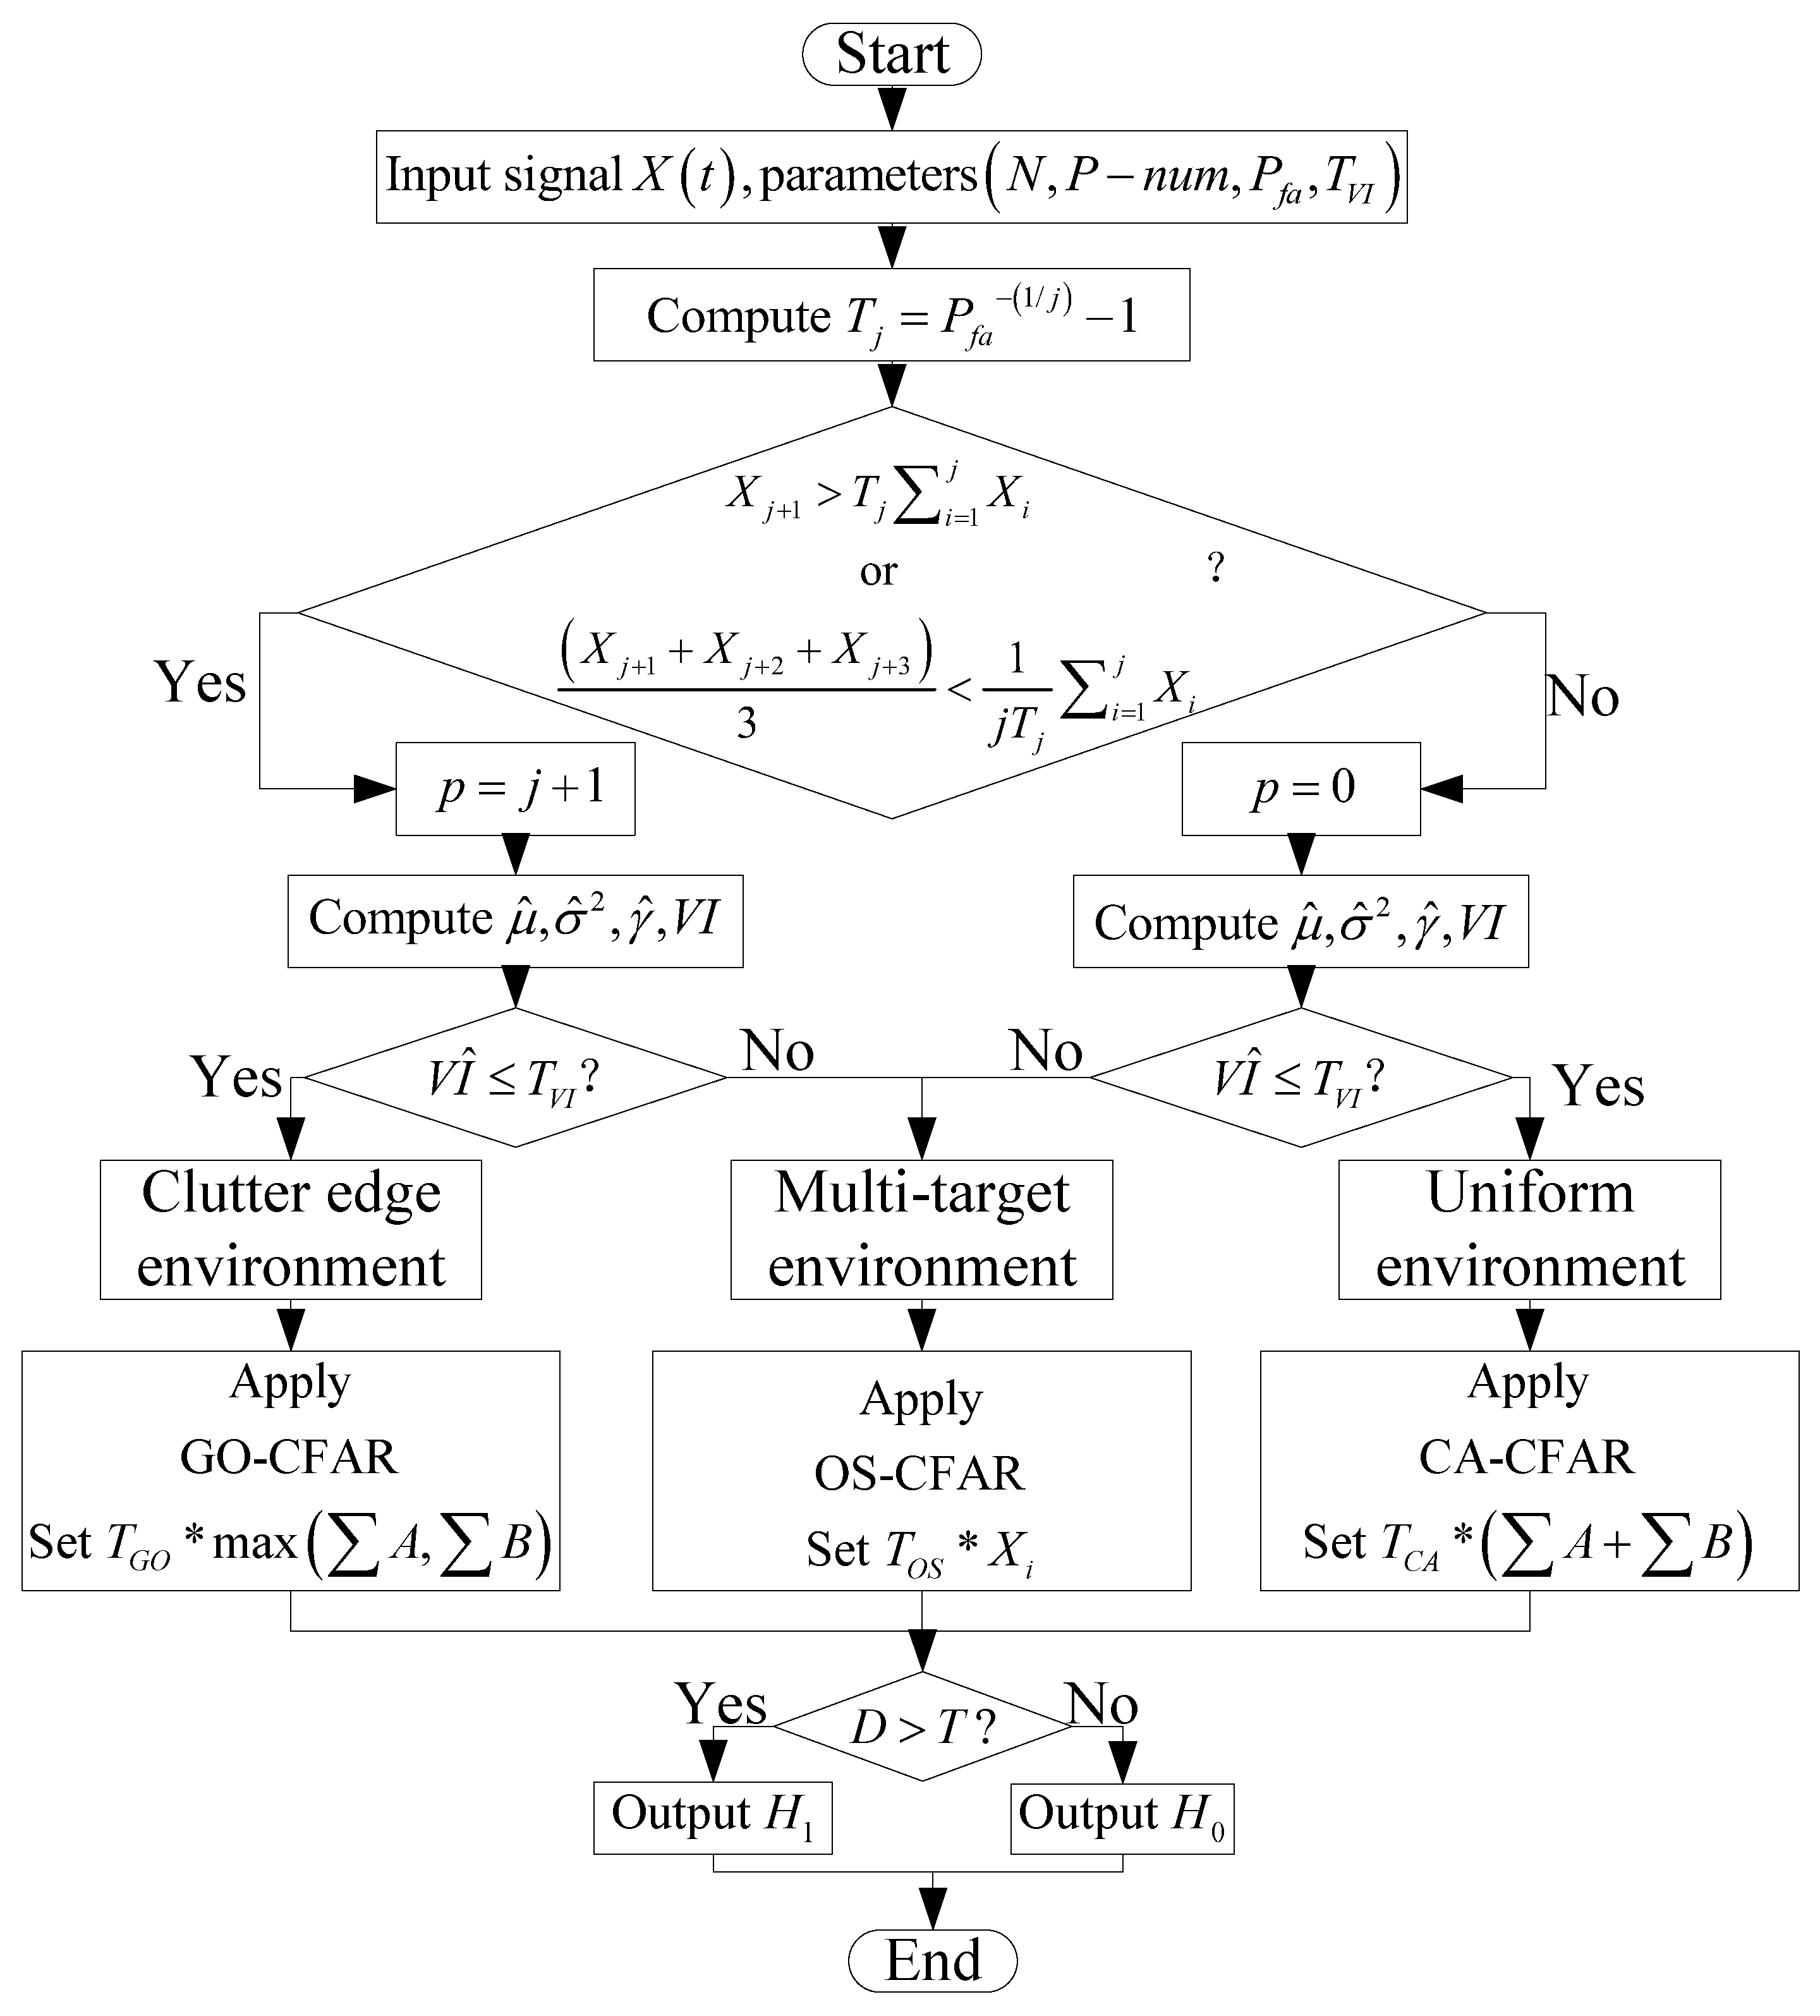
A flowchart of the ADVI-CFAR algorithm is shown in Figure 5.

4. Simulation and Experimental Analysis Results

This section analyzes the background environment recognition accuracy and detection performance of the ADVI-CFAR algorithm through computer simulations. Monte Carlo experiments compare the target detection performance of CA-CFAR, GO-CFAR, OS-CFAR, VI-CFAR, and ADVI-CFAR in different background environments. Finally, real-world scene data are used to validate the ADVI-CFAR algorithm, ensuring its reliability.

4.1. Algorithm Parameter Design

The detection threshold T V I in the ADVI-CFAR algorithm significantly impacts the detector’s performance. When the T V I value is high, ADVI-CFAR is more likely to classify many multi-target environments as clutter environments, which leads to a decrease in the detection probability P d for multi-target environments. However, when T V I is low, ADVI-CFAR may erroneously classify clutter edge environments as homogeneous, increasing false alarms. Therefore, the algorithm is set with N = 30 and INR = 20 dB, and the Monte Carlo method is used to determine the impact of T V I on the environmental recognition rate, reducing the influence of different numbers of interference targets on the ADVI-CFAR algorithm. Figure 6 shows the probability that the variability index V I ^ is greater than the threshold T V I (i.e., the probability that the background environment is correctly identified as non-homogeneous) in environments with homogeneous conditions and 1 to 6 interference targets.
Figure 6 shows that, when T V I = 3.9 , the recognition accuracy for a single interference target environment is approximately 84.53%; for two interference targets, it is about 94.82%; for three interference targets, it is 99.45%; for four interference targets, it is approximately 99.73%; for five interference targets, it is 99.87%, and for six interference targets, it is about 99.37%. Meanwhile, the recognition accuracy for the homogeneous environment is about 99.92%. Therefore, the detection threshold selected in this study is T V I = 3.9 .

4.2. Simulation Analysis

To validate the target detection performance of the algorithm, a series of computer-based numerical simulation experiments and result analyses are conducted, followed by the collection of real-world data to further verify the algorithm’s effectiveness. Computer simulation software is used to perform the simulation analysis of the ADVI-CFAR algorithm. In the simulation experiments, the clutter echoes follow a Gaussian distribution, while the targets are modeled as Swerling I and Swerling II targets, both following an exponential distribution. The reference window length for CA-CFAR, GO-CFAR, OS-CFAR, and VI-CFAR is set to 30, with six guard cells. The proportional value for OS-CFAR is set to 0.75, and the background environment decision thresholds in VI-CFAR are K V I = 4.76 and K M R = 1.806 .

4.2.1. Background Environment Recognition Performance

For the ADVI-CFAR algorithm’s background environment recognition probability, 1000 simulation experiments were conducted. In the multi-target environment, the number of interference targets was set to 4, randomly distributed within the reference cells. In the clutter edge background, the clutter transitioned from the 15th reference cell to the 16th reference cell, moving from a low-clutter region to a high-clutter region. The simulation results are shown in Figure 7.
Figure 7a shows the detection probability of the proposed detector for a homogeneous background environment. The detector achieves a probability of 95.68% in correctly identifying the background as homogeneous, while the probability of misclassifying the homogeneous environment as a clutter edge environment is 4.32%. Figure 7b illustrates the detection probability of the proposed detector in a multi-target background environment with varying Signal-to-Clutter Ratio (SCR) levels. When the SCR is 10 dB, the detector’s recognition probability is 47.56%. As the SCR increases to 10 dB, the recognition probability exceeds 98%. Figure 7c depicts the detection probability of the proposed detector for a clutter edge environment under different Clutter-to-Clutter Ratio (CCR) values. When the CCR is 5 dB, the detector’s recognition probability is 56.09%. As the CCR increases to 15 dB, the detection probability reaches 98.77%.

4.2.2. Object Detection Performance

For target detection performance in different background environments, the scenarios are set as a homogeneous background, a multi-target background, and a clutter edge background. A total of 1000 Monte Carlo simulations are conducted to compare the performance of different algorithms in these varied environments.
  • Uniform environment
    In the homogeneous environment, a single stationary target is set as the detection target. The ADVI-CFAR algorithm is used to detect the target, and the detection results are shown in Figure 8. To compare the detection performance of CFAR algorithms in a homogeneous environment under different SCRs, Monte Carlo simulations are conducted. The comparison results from the Monte Carlo experiments are presented in Figure 9, showing how the detection performance varies with changes in the SCR for different CFAR algorithms in a homogeneous environment.
    The results in Figure 8 and Figure 9 show that, in a homogeneous environment, the ADVI-CFAR algorithm exhibits a higher target recognition accuracy. Among the compared algorithms, the ADVI-CFAR algorithm outperforms GO-CFAR, OS-CFAR, and VI-CFAR. CA-CFAR demonstrates the best performance in homogeneous environments. Since the ADVI-CFAR algorithm, after classifying the environment as homogeneous, uses the CA-CFAR detection algorithm for threshold detection, its detection performance in homogeneous environments is second only to that of CA-CFAR. When P d = 50 % , the detection probability loss of CA-CFAR compared to that of other CFAR algorithms is as shown in Table 3.
  • Multi-target environment.
    In the multi-target environment, four targets with varying SCR values ranging from 10 to 20 dB are set as the detection targets. The SCRs of the four targets are randomly chosen within this range. The ADVI-CFAR detection results are shown in Figure 10. Monte Carlo simulations are conducted to compare the detection performance of CFAR algorithms in a multi-target environment under different SCR conditions. The results of the Monte Carlo comparison are presented in Figure 11, illustrating how the detection performance of the CFAR algorithms varies with the changes in the SCR in the multi-target environment.
    The results in Figure 10 and Figure 11 indicate that the ADVI-CFAR algorithm is able to fully detect the targets in the multi-target environment, achieving the same detection accuracy as the OS-CFAR and VI-CFAR algorithms. However, both the CA-CFAR and GO-CFAR algorithms fail to detect one target. In the multi-target environment, the ADVI-CFAR algorithm performs better than CA-CFAR and GO-CFAR, and its performance is essentially the same as that of the VI-CFAR algorithm. The OS-CFAR algorithm performs the best in the multi-target environment. Since the ADVI-CFAR algorithm identifies the background environment as a multi-target environment and then uses OS-CFAR for threshold detection, the performance of the ADVI-CFAR algorithm in the multi-target environment is second only to that of OS-CFAR. When P d = 50 % , the detection probability loss of OS-CFAR compared to that of other CFAR algorithms is as shown in Table 4.
  • Clutter edge environment.
    The simulated clutter edge environment is achieved by moving a reference window from the noise region (i.e., when the number of clutter reference cells is 0) to the clutter region (i.e., when the number of clutter reference cells is N). The detection target is set in the low-clutter region of the clutter edge. The ADVI-CFAR detection results are shown in Figure 12. For CNR = 5 dB and CNR = 10 dB, Monte Carlo simulations are conducted to compare the detection performance of different CFAR algorithms in the clutter edge environment. The results are presented in Figure 13.
    The results in Figure 12 and Figure 13 indicate that, in the clutter edge environment, only the ADVI-CFAR and GO-CFAR algorithms are able to successfully detect the target, while the other algorithms fail to detect the target. Through the Monte Carlo simulations, the performance of the different algorithms in the clutter edge environment is compared. In Figure 13a, when the CNR = 5 dB, if the measured cell is in the noise region (i.e., the number of clutter cells is less than N/2), the GO-CFAR algorithm has the lowest false alarm rate. The ADVI-CFAR algorithm has a slightly higher false alarm rate than GO-CFAR but a lower false alarm rate than CA-CFAR, OS-CFAR, and VI-CFAR. When the measured cell is in the clutter region (i.e., the number of clutter cells is greater than N/2), the GO-CFAR algorithm exhibits the best false alarm suppression, while the false alarm peak suppression ability of ADVI-CFAR is second only to that of GO-CFAR, outperforming VI-CFAR, CA-CFAR, and OS-CFAR. In Figure 13b, when the CNR = 15 dB, if the measured cell is in the noise region (i.e., the number of clutter cells is less than N/2), the GO-CFAR detector shows the best detection performance. The ADVI-CFAR algorithm has a slightly higher false alarm rate than GO-CFAR but a lower false alarm rate than CA-CFAR, OS-CFAR, and VI-CFAR. When the measured cell is in the clutter region (i.e., the number of clutter cells is greater than N/2), the false alarm peak suppression ability decreases in the following order: GO-CFAR, ADVI-CFAR, VI-CFAR, CA-CFAR, and OS-CFAR. When P f a = 10 4 , the different CNR values corresponding to the CFAR algorithms for the peak of false alarms are as shown in Table 5.
To verify the variation in detection probability P d under different false alarm probabilities P f a , Receiver Operating Characteristic (ROC) curves of the different CFAR algorithms are plotted at SNR = 20 dB to illustrate the trade-off between P d and P f a . As shown in Figure 14, we observe that the ROC performance improves with increasing P f a . When P f a = 10 4 , the detection probability P d of the ADVI-CFAR algorithm reaches the highest level within the studied range P f a , maintaining a detection probability of 90%. In terms of overall ROC performance, the algorithms rank in the following descending order: ADVI-CFAR, VI-CFAR, OS-CFAR, CA-CFAR, and GO-CFAR.

4.2.3. Actual Test Verification

To further verify the feasibility of the proposed method in real radar systems, vehicle target echo data collected from actual millimeter-wave radar in a real-world scenario is used for validation. The data collection scene is a bidirectional four-lane urban road in Xi’an, with the radar placed above a pedestrian bridge, facing the lanes to collect data. The detection targets include stationary vehicles along the roadside, moving vehicles on the road, and small vehicles in non-motorized lanes. The parameters of the millimeter-wave radar are provided in Table 6.
The real-world scenario is shown in Figure 15. We selected stationary vehicles parked by the roadside, moving vehicles on the road, and small vehicle targets on the bicycle lanes for real-world scene validation (Figure 16). For the convenience of target classification, we collectively refer to non-motorized vehicles, such as bicycles, motorcycles, and electric bikes, as small vehicle targets. After performing 2D-FFT processing on the radar-received echo data, the ADVI-CFAR algorithm was used for target detection to verify the effectiveness of our method in the actual scene (Figure 17).
The computational complexity [27] (O) of the ADVI-CFAR algorithm is determined by the number of test units A and the reference window length N. CA-CFAR and GO-CFAR are mean-type CFAR algorithms, and the mean calculation part mainly accounts for the amount of computation required. The OS-CFAR algorithm needs to sort the disordered echo data when performing statistical sorting, which increases the computational complexity. Since the algorithm types selected in the algorithm selection part of the VI-CFAR algorithm are all mean-type algorithms, condition judgment and mean calculation mainly account for the amount of computation required. The ADVI-CFAR algorithm selects the algorithm after judging the background environment; this includes the OS-CFAR algorithm, which needs to arrange data, so the amount of computation increases. A comparison of computational complexity is shown in Table 7.
In the simulation and experimental results, it is evident that the millimeter-wave radar target detection algorithm using the ADVI-CFAR detector is effective in detecting multiple stationary or moving targets with varying signal-to-noise ratios in complex, cluttered traffic environments, which include strong interference from streetlights, trees, and other obstacles. The algorithm achieves high accuracy and effectively reduces issues such as missed detection and false alarms in complex traffic environments. This validates the feasibility of the proposed algorithm and demonstrates its capability to meet the demands of real-world traffic applications.

5. Conclusions

To address the issues of the false detections and missed detections of vehicle targets in clutter edge environments in real traffic scenarios, a new ADVI-CFAR algorithm for clutter edge environments is proposed. This algorithm improves the traditional variability index calculation method and, through careful parameter design, reduces the impact of interference targets on the detection probability of the constant false alarm rate (CFAR) algorithm. Additionally, the algorithm improves the accuracy of background environment classification by detecting transition points, thereby enhancing the target detection precision of the CFAR algorithm. Simulation analysis and real-world test results indicate that, compared to traditional CFAR detectors, the ADVI-CFAR target detection algorithm sacrifices little performance in homogeneous environments while significantly improving detection performance in multi-target and clutter edge environments. This makes it well suited to meet the target detection needs in real traffic scenarios. However, in actual traffic scenarios, our algorithm still has some unresolved issues. Weak interference clutter leads to unclear background power transition points, and complex target signal structures lead to deviations in variability index calculation; the detection threshold cannot adapt to sudden environmental changes or radar state drift online; and a single type of sensor has environmental limitations. In order to improve the overall detection robustness and environmental adaptability of target detection algorithms in traffic scenarios, deep learning and multi-sensor fusion can be used as the next research direction in the future.

Author Contributions

F.T. conceived the idea and performed the simulations. T.W. and S.W. performed the simulations and experiments and wrote the main manuscript text. W.F. proofread the paper. All authors have read and agreed to the published version of the manuscript.

Funding

This work was supported in part by the Project of Science and Technology of Shaanxi 2020GY-029.

Institutional Review Board Statement

Not applicable.

Informed Consent Statement

Not applicable.

Data Availability Statement

Data is contained within the article.

Conflicts of Interest

The authors declare no conflicts of interest. The funders had no role in the design of the study; in the collection, analyses, or interpretation of data; in the writing of the manuscript; or in the decision to publish the results.

References

  1. Sakaguchi, K.; Fukatsu, R.; Yu, T.; Fukuda, E.; Mahler, K.; Heath, R.; Fujii, T.; Takahashi, K.; Khoryaev, A.; Nagata, S. Towards mmWave V2X in 5G and beyond to support automated driving. IEICE Trans. Commun. 2021, 104, 587–603. [Google Scholar]
  2. Tian, F.; Guo, X.; Fu, W. Target Tracking Algorithm Based on Adaptive Strong Tracking Extended Kalman Filter. Electronics 2024, 13, 652. [Google Scholar] [CrossRef]
  3. Yang, D.; Jiang, K.; Zhao, D.; Yu, C.; Cao, Z.; Xie, S.; Xiao, Z.; Jiao, X.; Wang, S.; Zhang, K. Intelligent and connected vehicles: Current status and future perspectives. Sci. China Technol. Sci. 2018, 61, 1446–1471. [Google Scholar] [CrossRef]
  4. Brisken, S.; Ruf, F.; Höhne, F. Recent evolution of automotive imaging radar and its information content. IET Radar Sonar Navig. 2018, 12, 1078–1081. [Google Scholar]
  5. Safa, A.; Verbelen, T.; Keuninckx, L.; Ocket, I.; Hartmann, M.; Bourdoux, A.; Catthoor, F.; Gielen, G.G.E. A low-complexity radar detector outperforming OS-CFAR for indoor drone obstacle avoidance. IEEE J. Sel. Top. Appl. Earth Obs. Remote Sens. 2021, 14, 9162–9175. [Google Scholar] [CrossRef]
  6. Rihan, M.Y.; Nossair, Z.B.; Mubarak, R.I. An improved CFAR algorithm for multiple environmental conditions. Signal Image Video Process. 2024, 18, 3383–3393. [Google Scholar]
  7. Jiménez, L.P.J.; García, F.D.A.; Alvarado, M.C.L.; Fraidenraich, G.; de Lima, E.R. A general CA-CFAR performance analysis for Weibull-distributed clutter environments. IEEE Geosci. Remote Sens. Lett. 2022, 19, 1–5. [Google Scholar] [CrossRef]
  8. Sun, B.B.; Shen, T.; Li, H.P.; Cui, X.R.; Chen, Y.K. Improved CA-CFAR Algorithm Based on LFMCW Radar Multi-Target Detection. Laser Optoelectron. Prog. 2021, 58, 364–371. [Google Scholar]
  9. Boudemagh, N.; Hammoudi, Z. Automatic censoring CFAR detector for heterogeneous environments. AEU-Int. J. Electron. Commun. 2014, 68, 1253–1260. [Google Scholar]
  10. Zhang, X.; Zhang, R.; Sheng, W.; Ma, X.; Han, Y.; Cui, J.; Kong, F. Intelligent CFAR detector for non-homogeneous Weibull clutter environment based on skewness. In Proceedings of the 2018 IEEE Radar Conference (RadarConf18), Oklahoma City, OK, USA, 23–27 April 2018; pp. 322–326. [Google Scholar]
  11. Subramanyan, R.; Kalpathi, R.R. Robust variability index CFAR for non-homogeneous background. IET Radar Sonar Navig. 2019, 13, 1775–1786. [Google Scholar]
  12. Coluccia, A.; Fascista, A.; Ricci, G. Design of customized adaptive radar detectors in the CFAR feature plane. IEEE Trans. Signal Process. 2022, 70, 5133–5147. [Google Scholar]
  13. Yang, X.; Huo, K.; Su, J.; Zhang, X.; Jiang, W. An anti-FOD method based on CA-CM-CFAR for MMW radar in complex clutter background. Sensors 2020, 20, 1635. [Google Scholar] [CrossRef] [PubMed]
  14. Wang, X.; Li, Y.; Zhang, N. A robust variability index CFAR detector for Weibull background. IEEE Trans. Aerosp. Electron. Syst. 2022, 59, 2053–2064. [Google Scholar]
  15. Ni, L.; Xu, W.; Wang, H.; Zhang, F.; Xu, D.; Cao, J. A Cascade-filtered Adaptive CFAR Detector in Low Small Target Detecting. In Proceedings of the 2024 IEEE International Conference on Signal, Information and Data Processing (ICSIDP), Zhuhai, China, 22–24 November 2024; pp. 1–4. [Google Scholar]
  16. Qu, C.; Chen, J.; Wang, X.; Hu, J.; Yin, J. An Adaptive CFAR Target Detector Based on the Quadratic Sum of Sample Autocovariances. IEEE Signal Process. Lett. 2025, 32, 786–790. [Google Scholar]
  17. Meng, X.; Meng, Y. Modified rank sum nonparametric CFAR to combat clutter edge. EURASIP J. Adv. Signal Process. 2023, 2023, 75. [Google Scholar]
  18. Madjidi, H.; Laroussi, T.; Detouche, N. Two-sided automatic censoring CFAR detector based on the interquartile range in a heterogeneous Weibull clutter. Phys. Commun. 2024, 65, 102396. [Google Scholar]
  19. Liu, K.; Li, Y.; Wang, P.; Peng, X. A CFAR detection algorithm based on clutter knowledge for cognitive radar. IEICE Trans. Fundam. Electron. Commun. Comput. Sci. 2023, 106, 590–599. [Google Scholar]
  20. Yang, B.; Zhang, H. A CFAR algorithm based on Monte Carlo method for millimeter-wave radar road traffic target detection. Remote Sens. 2022, 14, 1779. [Google Scholar] [CrossRef]
  21. Cao, Z.; Li, J.; Song, C.; Xu, Z.; Wang, X. Compressed sensing-based multitarget CFAR detection algorithm for FMCW radar. IEEE Trans. Geosci. Remote Sens. 2021, 59, 9160–9172. [Google Scholar]
  22. Wei, Z.; Li, B.; Feng, T.; Tao, Y.; Zhao, C. Area-based CFAR target detection for automotive millimeter-wave radar. IEEE Trans. Veh. Technol. 2022, 72, 2891–2906. [Google Scholar]
  23. Hu, X.; Li, Y.; Lu, M.; Wang, Y.; Yang, X. A multi-carrier-frequency random-transmission chirp sequence for TDM MIMO automotive radar. IEEE Trans. Veh. Technol. 2019, 68, 3672–3685. [Google Scholar] [CrossRef]
  24. Tian, F.; Liu, W.; Fu, W.; Huang, X. Motion Parameter Estimation Based on Overlapping Elements for TDM-MIMO FMCW Radar. IEICE Trans. Commun. 2023, 106, 705–713. [Google Scholar]
  25. García, F.D.A.; Rodriguez, A.C.F.; Fraidenraich, G.; Filho, J.C.S. CA-CFAR detection performance in homogeneous Weibull clutter. IEEE Geosci. Remote Sens. Lett. 2018, 16, 887–891. [Google Scholar] [CrossRef]
  26. Smith, M.E.; Varshney, P.K. Intelligent CFAR processor based on data variability. IEEE Trans. Aerosp. Electron. Syst. 2002, 36, 837–847. [Google Scholar]
  27. Rao, Y.; Zhou, J.; Wan, X.; Gong, Z.; Ke, H. CFAR for Passive Radar Based on Dynamic Ordered Matrix. J. Electron. Inf. Technol. 2021, 43, 1154–1161. [Google Scholar]
Figure 1. MIMO antenna array structure diagram.
Electronics 14 01474 g001
Figure 2. Block diagram of the VI-CFAR algorithm.
Electronics 14 01474 g002
Figure 3. Distribution of clutter skewness in different background environments.
Electronics 14 01474 g003
Figure 4. Block diagram of the ADVI-CFAR algorithm.
Electronics 14 01474 g004
Figure 5. Flowchart of the ADVI-CFAR algorithm.
Electronics 14 01474 g005
Figure 6. Comparison of background environment discrimination probability.
Electronics 14 01474 g006
Figure 7. Background environment recognition accuracy results. (a) Uniform background recognition probability. (b) Multi-target background recognition probability. (c) Clutter edge background recognition probability.
Electronics 14 01474 g007
Figure 8. Uniform environment test results.
Electronics 14 01474 g008
Figure 9. Performance comparison of uniform environment detectors. (a) Monte Carlo experiment results. (b) Local magnification result.
Electronics 14 01474 g009
Figure 10. Multi-target environment detection results.
Electronics 14 01474 g010
Figure 11. Performance comparison of multi-target environment detectors. (a) Monte Carlo experiment results. (b) Local magnification result.
Electronics 14 01474 g011
Figure 12. Clutter edge detection results.
Electronics 14 01474 g012
Figure 13. Performance comparison of detectors in clutter edge environments (a) CNR = 5 dB. (b) CNR = 10 dB.
Electronics 14 01474 g013
Figure 14. ROC curve comparison.
Electronics 14 01474 g014
Figure 15. Test scenario. (a) Single-target static scene. (b) Multi-target motion scene. (c) Small target vehicle scene.
Electronics 14 01474 g015
Figure 16. Test results. (a) Single-target static scene. (b) Multi-target motion scene. (c) Small target vehicle scene.
Electronics 14 01474 g016
Figure 17. Measured radar azimuth map. (a) Single-target static scene. (b) Multi-target motion scene. (c) Small target vehicle scene.
Electronics 14 01474 g017
Table 1. VI-CFAR adaptive threshold generation rules.
A TypeB TypeHalf-Window MeanAdaptive ThresholdCFAR Algorithm
HHY C N A B CA-CFAR
HHN C N / 2 max ( A , B ) GO-CFAR
HN- C N / 2 A CA-CFAR
NH- C N / 2 B CA-CFAR
NN- C N / 2 min ( A , B ) SO-CFAR
A represents the first half-window, B represents the second half-window, H represents a homogeneous environment, and N represents a non-homogeneous environment. In the half-window mean, Y indicates that the means of the A and B half-windows are the same, and N indicates that the means are different.
Table 2. ADVI-CFAR detection threshold generation method.
p VI ^ Method of ChoiceDetection Threshold
p = 0 V I ^ T V I CA-CFAR T C A * ( A + B )
p = 0 V I ^ > T V I OS-CFAR T O S * X γ
p 0 V I ^ T V I GO-CFAR T G O * max ( A , B )
p 0 V I ^ > T V I OS-CFAR T O S * X γ
Table 3. Detection probability loss in uniform environment.
Algorithm NameDetection Probability Loss (dB)
ADVI-CFAR0.08
GO-CFAR0.18
OS-CFAR0.49
VI-CFAR0.36
Table 4. Detection probability loss in multi-target environments.
Algorithm NameDetection Probability Loss (dB)
ADVI-CFAR0.35
GO-CFAR3.62
CA-CFAR2.26
VI-CFAR0.74
Table 5. False alarm probability of CFAR algorithms in clutter edge environment.
Algorithm Namelog P fa (CNR = 5 dB)log P fa (CNR = 10 dB)
ADVI-CFAR−2.12−3.52
GO-CFAR−2.37−3.86
CA-CFAR−1.76−2.53
VI-CFAR−1.94−3.12
OS-CFAR−1.58−2.26
Table 6. Millimeter-wave radar parameters.
Radar ParametersMeasured Values
Carrier frequency f 0 ( G H z ) 60
Modulation period T ( μ s ) 45
FM bandwidth B ( M H z ) 200
Number of chirps N d 128
Distance resolution (m)0.75
Speed resolution (m/s)0.108
Angular resolution (°)2.7
Table 7. Computational complexity results.
CFAR AlgorithmComputational Complexity (O)
CA-CFAR N A
GO-CFAR N A
OS-CFAR ( log N ) N A
VI-CFAR N A
ADVI-CFAR ( log N ) N A
Disclaimer/Publisher’s Note: The statements, opinions and data contained in all publications are solely those of the individual author(s) and contributor(s) and not of MDPI and/or the editor(s). MDPI and/or the editor(s) disclaim responsibility for any injury to people or property resulting from any ideas, methods, instructions or products referred to in the content.

