Article

A Multimodal Artificial Intelligence Model for Depression Severity Detection Based on Audio and Video Signals

College of Computer and Control Engineering, Northeast Forestry University, Harbin 150040, China
*
Author to whom correspondence should be addressed.
Electronics 2025, 14(7), 1464; https://doi.org/10.3390/electronics14071464
Submission received: 28 February 2025 / Revised: 25 March 2025 / Accepted: 29 March 2025 / Published: 4 April 2025

Abstract

:
In recent years, artificial intelligence (AI) has increasingly utilized speech and video signals for emotion recognition, facial recognition, and depression detection, playing a crucial role in mental health assessment. However, the AI-driven research on detecting depression severity remains limited, and the existing models are often too large for lightweight deployment, restricting their real-time monitoring capabilities, especially in resource-constrained environments. To address these challenges, this study proposes a lightweight and accurate multimodal method for detecting depression severity, aiming to provide effective support for smart healthcare systems. Specifically, we design a multimodal detection network based on speech and video signals, enhancing the recognition of depression severity by optimizing the cross-modal fusion strategy. The model leverages Long Short-Term Memory (LSTM) networks to capture long-term dependencies in speech and visual sequences, effectively extracting dynamic features associated with depression. Considering the behavioral differences of respondents when interacting with human versus robotic interviewers, we train two separate sub-models and fuse their outputs using a Mixture of Experts (MOE) framework capable of modeling uncertainty, thereby suppressing the influence of low-confidence experts. In terms of the loss function, the traditional Mean Squared Error (MSE) is replaced with Negative Log-Likelihood (NLL) to better model prediction uncertainty and enhance robustness. The experimental results show that the improved AI model achieves an accuracy of 83.86% in depression severity recognition. The model’s floating-point operations per second (FLOPs) reached 0.468 GFLOPs, with a parameter size of only 0.52 MB, demonstrating its compact size and strong performance. These findings underscore the importance of emotion and facial recognition in AI applications for mental health, offering a promising solution for real-time depression monitoring in resource-limited environments.

1. Introduction

The incidence of depression has been rising steadily along with the intensified social pressure globally [1]. Typically, patients with depression are suffered by a persistent low mood or irritability, disrupted sleep and appetite, loss of interest in work or social activities, frequent crying, and, in severe cases, suicidal ideation [2]. This has not only severely affected their health and daily life as individuals, but also exerted a negative impact on society. According to the data from the World Health Organization (WHO), depression was ranked as the fourth cause of mental health issues in 2020 [3], and by 2030, it is projected to become the second cause of death worldwide [4]. Due to the uneven distribution of healthcare resources, long consultation cycles, and high costs, many patients are unable to be treated timely and effectively. Even worse, current depression detection methods rely primarily on clinicians’ expertise and traditional measurement scales, so that some patients cannot receive adequate care, which thus has caused serious consequences. Previous studies have shown that extracting the relevant features from facial micro-expressions and speech signals will provide substantial information for depression detection, making real-time automated depression detection feasible [5,6,7]. With this backdrop, deep learning techniques have been introduced more and more for depression detection. In the domain of facial video-based depression recognition, Cen et al. developed a multitask facial activity framework that provides strong support for micro-expression recognition [7]. Given that depression-related video datasets are often based on conversations with prominent temporal characteristics and considerable variations across different facial regions, Li et al. and Han et al. introduced multi-head attention mechanisms incorporating spatiotemporal information, proving to have an outstanding performance on public datasets [8,9]. Building on these studies, Zhang et al. further proposed a lightweight network for automated depression detection by integrating temporal differences and attention mechanisms [10].
In addition to facial video data, vocal information has also played a crucial role. France et al. analyzed various acoustic features, such as pitch, amplitude modulation, pre- phonation, and power distribution, to objectively distinguish depression from suicidal tendencies [5]. More recently, Pan et al. designed a multi-feature deep supervision speech learning network that enhances the extraction of acoustic features, hence improving the robustness of depression detection [11].
In terms of multimodal learning, He et al. introduced innovative data input modes and improved CNNs to enhance multimodal depression recognition [12]. Similarly, Niu et al. proposed a feature fusion method with attention mechanisms, demonstrating a powerful detection performance across different tasks [13].
Several challenges still exist in automatic depression detection. First, due to privacy concerns and ethical issues, the available datasets are limited for depression samples. In this case, it is vital for our model to mitigate overfitting and handling class imbalance [12]. Second, the majority of the existing research has been conducted on detecting whether an individual has depression, instead of assessing depression severity. Depression severity evaluation, however, is significant for clinical diagnosis and treatment, as it provides essential information for physicians to develop personalized treatment plans.
In fact, the current detection models are typically large and difficult to be deployed in resource-constrained environments for lightweight and real-time monitoring. Even worse, variations in the length and subject matter of interviews in public datasets, coupled with privacy and ethical restrictions, make it hard to extract features of a specific topic. Participants may also exhibit disguised facial expressions, which will also make feature extraction complicated. Apparently, direct extraction methods may result in the loss of critical information.
In response to the aforementioned challenges, this paper proposed a multimodal depression severity detection network. First, to tackle the issue of the depression severity assessment, the PHQ-8 scale, building on the previous research and clinical trials, was employed to supplement validation. By incorporating an innovative data preprocessing method and an improved LSTM-based multimodal network for both language and image inputs, the accuracy of the model was enhanced while its size was reduced, facilitating lightweight deployment and real-time monitoring. The specific contributions of this study are as follows:
(1)
We proposed a multimodal depression detection network that automatically estimates severity by extracting key facial and vocal features. It effectively addresses class imbalance and overfitting. The experiments show that the proposed architecture has a superior performance, with 83.86% accuracy, MAE of 0.1271, and MSE of 0.2133.
(2)
By applying model optimization techniques, the size and computational complexity of the proposed network are substantially reduced. This optimization enables lightweight deployment, making it feasible to implement the system in resource-constrained or mobile environments.
(3)
Through the integration of high detection accuracy, efficient data processing, and real-time deployability, this work delivers a practical solution for intelligent mental health monitoring. It provides valuable insights and technological foundations for advancing smart healthcare systems, particularly in mental health assessment and early intervention.
The remainder of the paper is structured as follows: In Section 2, previous works are reviewed, covering data preprocessing, unimodal inputs of video and audio, and multimodal inputs. Section 3 details the proposed data preprocessing methods, the improved LSTM-based multimodal model, and efforts toward lightweight deployment. Section 4 presents the experimental setup and results, while Section 5 wraps up with the conclusions.

2. Related Works

This study focuses on data preprocessing methods, video signal extraction, audio signal extraction, and multimodal fusion. In this section, we briefly review previous works and highlight the differences between our approach and those in earlier studies.
The eight-item Patient Health Questionnaire (PHQ-8) was used as an auxiliary tool to assess depression severity. Depression levels of patients were evaluated based on their PHQ-8 scores, with the classification criteria detailed in Table 1 [14].
Due to the privacy concerns associated with depression, the relevant data are often scarce and the sample distribution tends to be imbalanced. Previous research has explored various data preprocessing approaches to address these issues. In studies utilizing the DAIC-WOZ public dataset, the researchers analyzed biases in interview prompts, enabling the model to focus on specific facial regions. By leveraging these biases, the model’s F1 score was improved to 0.90, demonstrating the critical importance of topic selection for effective model training [15]. Misgar et al. proposed a preprocessing method based on a custom time-efficiency enhancement algorithm, achieving a peak accuracy of 98.65% on augmented data, thereby validating the effectiveness of the custom augmentation approach [16]. Perlman et al. developed a method for harmonizing variable transformations across different datasets by integrating clinical trial data on depression, which was used for feature selection and showed promising results in testing [17].
Building on these data preprocessing methods and considering the need for lightweight deployment, this study proposed a topic segmentation approach. Through approximate topic segmentation and down sampling, effective feature extraction was achieved.
In the realm of video feature extraction, the researchers improved model accuracy by focusing on specific portions of the dataset. Han et al. identified that certain keyframes within a sequence are particularly crucial for distinguishing between depression and healthy states [9]. They introduced a temporal attention model to emphasize these keyframes, achieving favorable results on public datasets. Similarly, Gong et al. proposed an improved approach by constructing multimodal feature vectors based on topic modeling [18]. It involved segmenting by topics and extracting features individually, making “topic tracking” feasible and offering new insights for depression detection.
In terms of audio signal extraction, extensive research has been conducted. Given the unique characteristics of audio signals, which often include unavoidable silent segments during recording, the researchers typically remove these silent segments and concatenate the remaining audio fragments into a new file. This preprocessing has enhanced quality of audio signals and accuracy of the model. Wang et al. found that extracting features such as Mel-frequency cepstral coefficients (MFCCs), short-term energy, and spectral entropy from audio signals would significantly increase the accuracy of depression detection, with validation on public datasets [19].
However, in practice, an excessive focus on extracting specific features can lead to overly complex models, which are often large and challenging to deploy for real-time detection. Additionally, if interviewers excessively guide respondents to display depression-related expressions, the naturalness and validity of the interviews may be compromised. Therefore, in our model design, a global perspective is adopted, avoiding undue emphasis on particular features to enhance its generalization capability and reduce the risk of overfitting.
In terms of multimodal processing, previous studies have made significant strides and achieved promising results. Studies have shown that visual and corresponding auditory information in video data can aid in the detection and assessment of depression. For instance, Cohn et al. employed manual FACS and SVM in conjunction with AMM and logistic regression on speech to achieve depression detection, demonstrating the feasibility of automated depression assessment [20]. Yang et al. utilized a histogram of displacement ranges (HDRs) to describe facial information, while speech information was learned using paragraph vectors (PVs) to capture sentence-level distributed representations [21]. They then estimated sub-scores of the PHQ-8 and used these estimates as input for a deep learning network to predict the total PHQ-8 score, achieving high accuracy on public datasets. Similarly, Jan, Meng et al. extracted various visual features from facial expression images and captured auditory expressions through spectral low-level descriptors and Mel-frequency cepstral coefficients (MFCCs) from short audio clips, and these features were integrated using regression techniques [22].

3. Method

3.1. Dataset Construction

Extended Distress Analysis Interview Corpus (E-DAIC) is an expanded dataset designed to support the diagnosis of psychological distress conditions, such as anxiety, depression, and post-traumatic stress disorder. It consists of semi-clinical interviews intended to develop a computer agent capable of interviewing individuals and identifying verbal and non-verbal indicators of mental illness.
The data in this dataset were collected through interviews conducted by a virtual animated interviewer named Ellie. One part of the interviews was conducted in a “Wizard of Oz” (WoZ) setting, where the virtual agent was controlled by a human interviewer in a separate room. The other portion of the interviews was conducted by an AI-controlled agent, which operated autonomously using various automatic perception and behavior generation modules.
The dataset was divided into training, development, and testing sets, on the prerequisite of maintaining overall speaker diversity within each set, including age, gender distribution, and scores from the Patient Health Questionnaire (PHQ-8). The training and development sets contained a mixture of WoZ and AI-controlled scenarios, while the testing set consisted exclusively of the data collected by the AI-controlled agent.
The dataset comprised a total of 275 samples, with each sample’s depression severity assessed based on self-reported scores from the PHQ-8 scale. Depression severity for each participant was classified using the methods outlined in Table 1. During the experiment, the data were divided into training, development, and testing sets according to the partitions provided by the dataset. Specifically, the training set contained 163 samples, while both the development set and the testing set consisted of 56 samples [23]. Examples from the dataset are illustrated in Figure 1 and Figure 2.
The figure displays the distribution of scores from the PHQ-8 scale across different individuals, illustrating the cumulative number of participants for each score. It allows for the observation of the cumulative count of individuals scoring at or below each score, as well as the distribution of scores at specific levels. It reveals that the number of individuals with higher scores is relatively low, indicating a scarcity of samples representing moderate to severe depression.
According to the classification criteria provided in Table 1, the samples were categorized based on different levels of depression severity. The accompanying charts illustrate the number of samples at each level of depression severity and their gender distribution. They reveal that the number of samples with higher levels of depression is relatively limited, with a notable gender imbalance. These factors may impact both the training and predictive performances of the model and thus need to be carefully considered during model design and analysis.
These charts provide a clear representation of the distribution of different scores and depression severity levels within the dataset, serving as a foundational reference for further analysis of depression severity and for subsequent detection efforts.

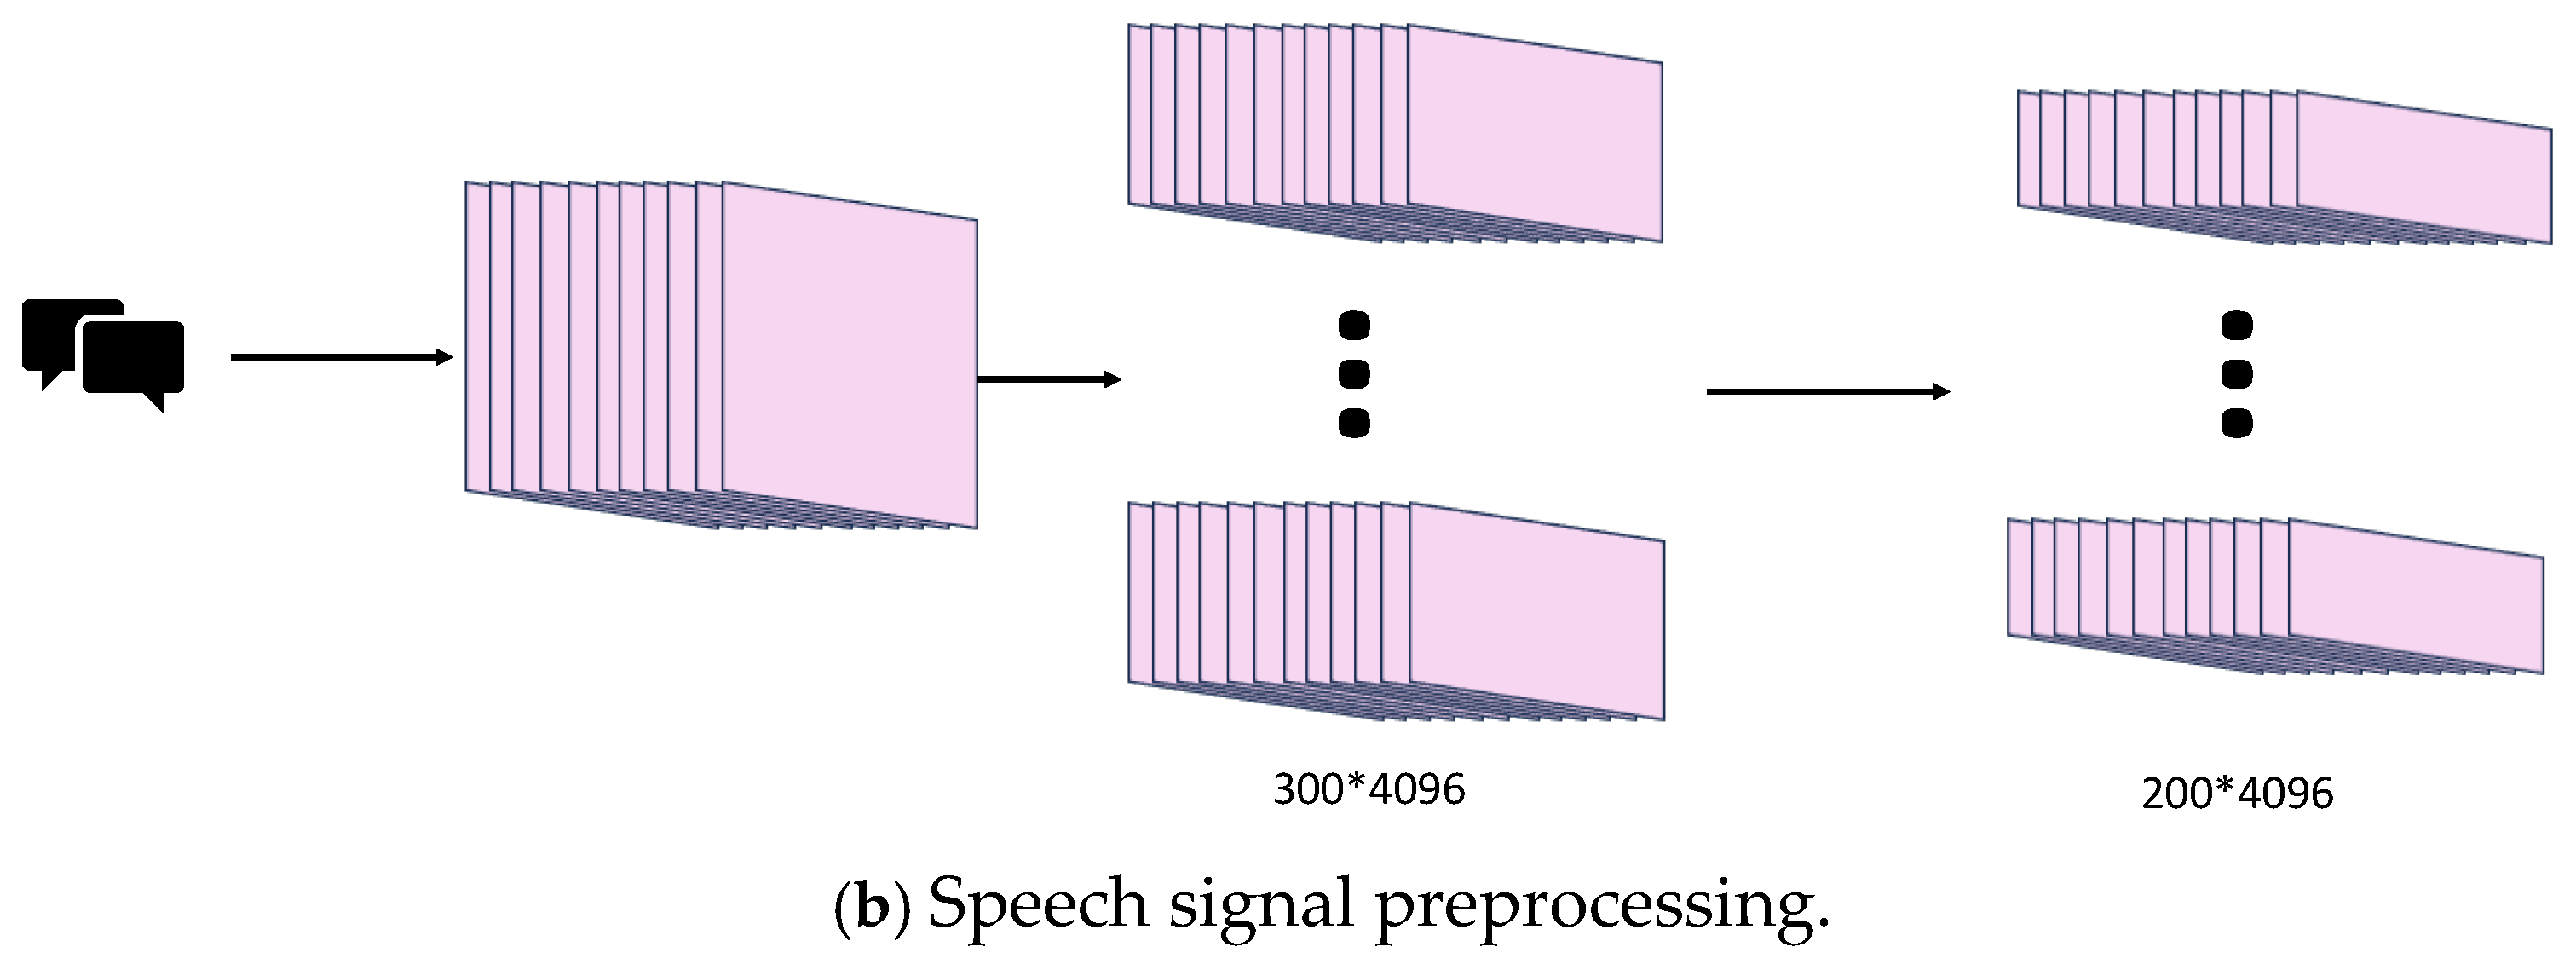
3.2. Data Preprocessing

During data preprocessing, facial video data from the DAIC-WOZ dataset were processed using the OpenFace toolkit to extract Action Units (AUs). These AU values were then normalized and standardized, with the results presented in Table 2:
The normalization and standardization process for AU values is detailed in Equations (1) and (2).
x = x m i n x m a x x m i n x
where x is the original data, m i n x the minimum value in the data, m a x x the maximum value in the data, and x normalized the normalized data.
x = x μ σ
where x is the original data, m i n x the minimum value in the data, m a x x the maximum value in the data, and x normalized the normalized data. Through the aforementioned procedures, not only can the convergence of the model be accelerated, but the risks of gradient explosion and gradient vanishing can also be effectively mitigated.
When interacting with a human interviewer, interviewees typically respond with polite facial expressions, such as smiling. However, such expressions are often absent when the interviewer is a robot. In addition, some interviewees may feel nervous in front of a human interviewer, which introduces interference into our judgment process. To address this, we trained separate models based on the type of interviewer—human or robot—and obtained two sets of results accordingly. A Mixture of Experts (MoE) model was then employed to fuse these outcomes. Traditional MoE models only assign weights to the outputs of different experts. In contrast, the MoE model proposed in this study also took into account the uncertainty of each expert, thereby reducing the influence of experts with high uncertainty. Expert weights were computed, each expert network predicted both a mean and an uncertainty, and the information was then fused, effectively diminishing the impact of inaccurate experts. Through the aforementioned procedures, not only can the convergence of the model be accelerated, but the risks of gradient explosion and gradient vanishing can also be effectively mitigated.
For processing speech signals, features were extracted with a VGG network. Specifically, the original speech signals were first preprocessed through denoising, normalization, and framing operations to ensure quality and consistency. After that, they were input into a pre-trained VGG network. Through the successive stacking of multiple convolutional and pooling layers, the network incrementally extracted high-level features from the speech signals. During this process, the network could effectively capture spectral information, temporal characteristics, and other subtle differences in the speech signals. Ultimately, 4096 processed neuron features were obtained from the VGG network.
In addition to the preprocessing of the dataset itself, a series of additional data processing steps was performed, as illustrated in Figure 3:
Due to the personalized nature of the interviews and how each participant would respond to the topics, inconsistencies in the data length were observed, because directly inputting data of different sizes into the same model could result in a loss of data features. To solve this issue, effective data processing methods were implemented. Given the variability in the amount of data per participant, a data segmentation approach was employed. Topic modeling typically requires complex algorithms, such as Latent Dirichlet Allocation (LDA) and network regularization [24]. Since short-term audio signals can be largely considered as stationary processes with relatively constant features [25], we segmented the face video data into chunks of 5000 frames and the audio data into chunks of 300 frames. In this way, we could focus on the themes within each data segment, reduce the risk of overfitting, and improve generalization capability of the model. In addition, it would accelerate model convergence, allowing it to learn important features from the data more efficiently.
Subsequently, the data were down sampled, with the aim to reduce complexity of the model, thereby enhancing training speed and facilitating real-time monitoring and lightweight deployment. It could also balance the data distribution across different classes, improving the model’s performance on minority classes in imbalanced datasets. By decreasing the complexity and size of the data, down sampling further mitigated the risk of overfitting, creating a model with improved generalization capabilities.

3.3. Video and Audio Signal Processing

Based on the analysis presented here and the results from previous studies, it was determined through experimental validation that the multimodal LSTM network yielded the best performance. It can effectively capture spatiotemporal features associated with depression severity and integrate data from various modalities, thereby enhancing both accuracy and generalization capability. It is illustrated in Figure 4:
Its specific implementation is detailed in Equation (3).
h t = L S T M x t , h t 1 , c t 1
where x t represents the input at the current time step, h t 1 the hidden state from the previous time step, c t 1 the cell state from the previous time step, and h t the output at the current time step.
Specifically, the LSTM network comprises an input gate, a forget gate, and an output gate, to manage the flow of information through retaining relevant information while discarding irrelevant details in long sequences of data. In particular, the output gate can regulate the amount of information from the current cell state that is output, as described by Equation (4):
i t = σ W i h t 1 , x t + b i
where i t represents the activation value of the input gate, W i the weight matrix, h t 1 , x t the concatenation of the previous hidden state and the current input, b i the bias, and σ the sigmoid activation function.
The forget gate determines how much information from the current cell state should be retained, as detailed in Equation (5):
f t = σ W f h t 1 , x t + b f
where f t represents the activation value of the forget gate, and other symbols are defined the same as those for the input gate.
Combining the results from the input gate and the forget gate, the LSTM network also includes cell state updates, as detailed in Equations (6) and (7):
C ~ t = t a n h W C h t 1 , x t + b C
C t = f t     C t 1 + i t     C ~ t
where C ~ t represents the new cell state, the previous cell state and C t the updated cell state.
Finally, the results of the output gate were obtained to determine the amount of information in the hidden state for the output, as shown in Equations (8) and (9):
o t = σ W o h t 1 , x t + b o
h t = o t     t a n h C t
where h t represents the hidden state at the current time step, and other symbols are defined the same as those in the input gate.
However, a significant challenge facing the facial video analysis module was the presence of masked or deceptive expressions within the data [26,27]. For instance, when discussing family-related topics, participants might smile, but this might not accurately reflect their mental state. Such discrepancies could interfere with feature extraction and the detection of depression severity. Additionally, the varying degrees to which participants adapted to the interview environment, as well as differences in their demeanor and state during each session, might further prompt them to display masked expressions. These factors complicated the accurate extraction of micro-expressions and increased the difficulty of detecting depression and assessing its severity.
Furthermore, the variation in interview topics introduced significant differences in the facial video and audio signals across different samples, further complicating the feature extraction process.
Additionally, the varying degrees to which participants adapted to the interview environment, as well as differences in their demeanor and state during each session, might further prompt them to display masked expressions. These factors complicated the accurate extraction of micro-expressions and increased the difficulty in detecting depression and assessing its severity. Furthermore, the variation in interview topics introduced significant differences in the facial video and audio signals across different samples, further complicating the feature extraction process.
When interacting with a human interviewer, participants tend to smile out of politeness, whereas such expressions are typically absent when speaking to a robotic interviewer. Moreover, some participants may experience anxiety in the presence of a human interviewer, which introduces additional noise into the analysis. To address this, we trained separate models based on the type of interviewer—human or robot—resulting in two sets of outputs. These results were then fused using a Mixture of Experts (MoE) model. Traditional MoE models only assign weights to the outputs of different experts. However, the MoE model proposed in this study also considered the uncertainty of each expert, thereby reducing the influence of those with high uncertainty. Specifically, expert weights were computed, each expert network predicted both a mean and an uncertainty, and this information was fused to diminish the impact of inaccurate experts [28,29,30]. Specifically, the implementation is formulated as follows.
Initially, separate training was performed on interviews conducted by a robot and those conducted by a human interviewer, leading to the formulation of Equation (10) and Equation (11).
y r = f L S T M X r
y b = f L S T M X b
where y r represents the training result from interviews conducted by a human interviewer, while y b denotes the training result from interviews conducted by a robot.
The expert weights were computed using a gating network, as shown in Equation (12).
g x , z = S o f t m a x W g x , z + b g
where W g and b g are the parameters of the gating network. x represents the features extracted by the LSTM, z indicates whether the interviewer is a human or robot, and g x , z denotes the weight distribution over the experts.
In the next step, the expert networks are employed to estimate the predictive mean and associated uncertainty.
μ i ,   σ i = f e x p e r t i H
where μ i denotes the predictive mean generated by the expert networks, and σ i represents the associated predictive uncertainty.
Finally, the uncertainty information is integrated to reduce the influence of unreliable experts, as shown in Equations (14) and (15).
μ f i n a l = i = 1 N g i μ i
σ f i n a l = i = 1 N g i σ i
where μ f i n a l denotes the predictive mean generated by the expert networks, and σ f i n a l represents the associated predictive uncertainty.
The final output was derived by aggregating the predictions of multiple experts through a weighted average, where the weights were determined by the gating network.
In addition to the existing approach, additional targeted strategies were introduced to further alleviate overfitting. First, to mitigate the risk of overfitting, we reduced the size of the module while introducing a Dropout mechanism. Also, a weight decay mechanism was incorporated into the Adam optimizer, applying a penalty to the model’s weights to prevent them from becoming excessively large. This approach effectively reduced complexity of the model, thereby lowering the likelihood of overfitting.
More than that, we also employed the Focal Loss function to cope with class imbalance. By assigning higher weights to underrepresented samples, the adverse effects of class imbalance on model training were mitigated, thereby improving its overall performance. What is more, to enable real-time detection and lightweight deployment, a gradient accumulation strategy was exercised to optimize computational efficiency.
The specific implementation is outlined as follows. This study highlighted a five-class classification problem, with the cross-entropy loss function formulated as follows:
C E y , p = c = 1 5 y c l o g p c
where y = y 1 , y 2 , y 3 , y 4 , y 5 represents the true label vector and p = p 1 , p 2 , p 3 , p 4 , p 5 denotes the predicted probability vector output by the model. A modulation factor was incorporated to solve class imbalance. The formula is presented in Equation (17).
F L p t = α 1 p t γ l o g p t
where p t represents the model’s predicted probability for the correct class, α the balancing factor used to adjust the contribution of different classes to the total loss, and γ the focusing parameter to adjust the contribution of hard-to-classify samples to the loss.

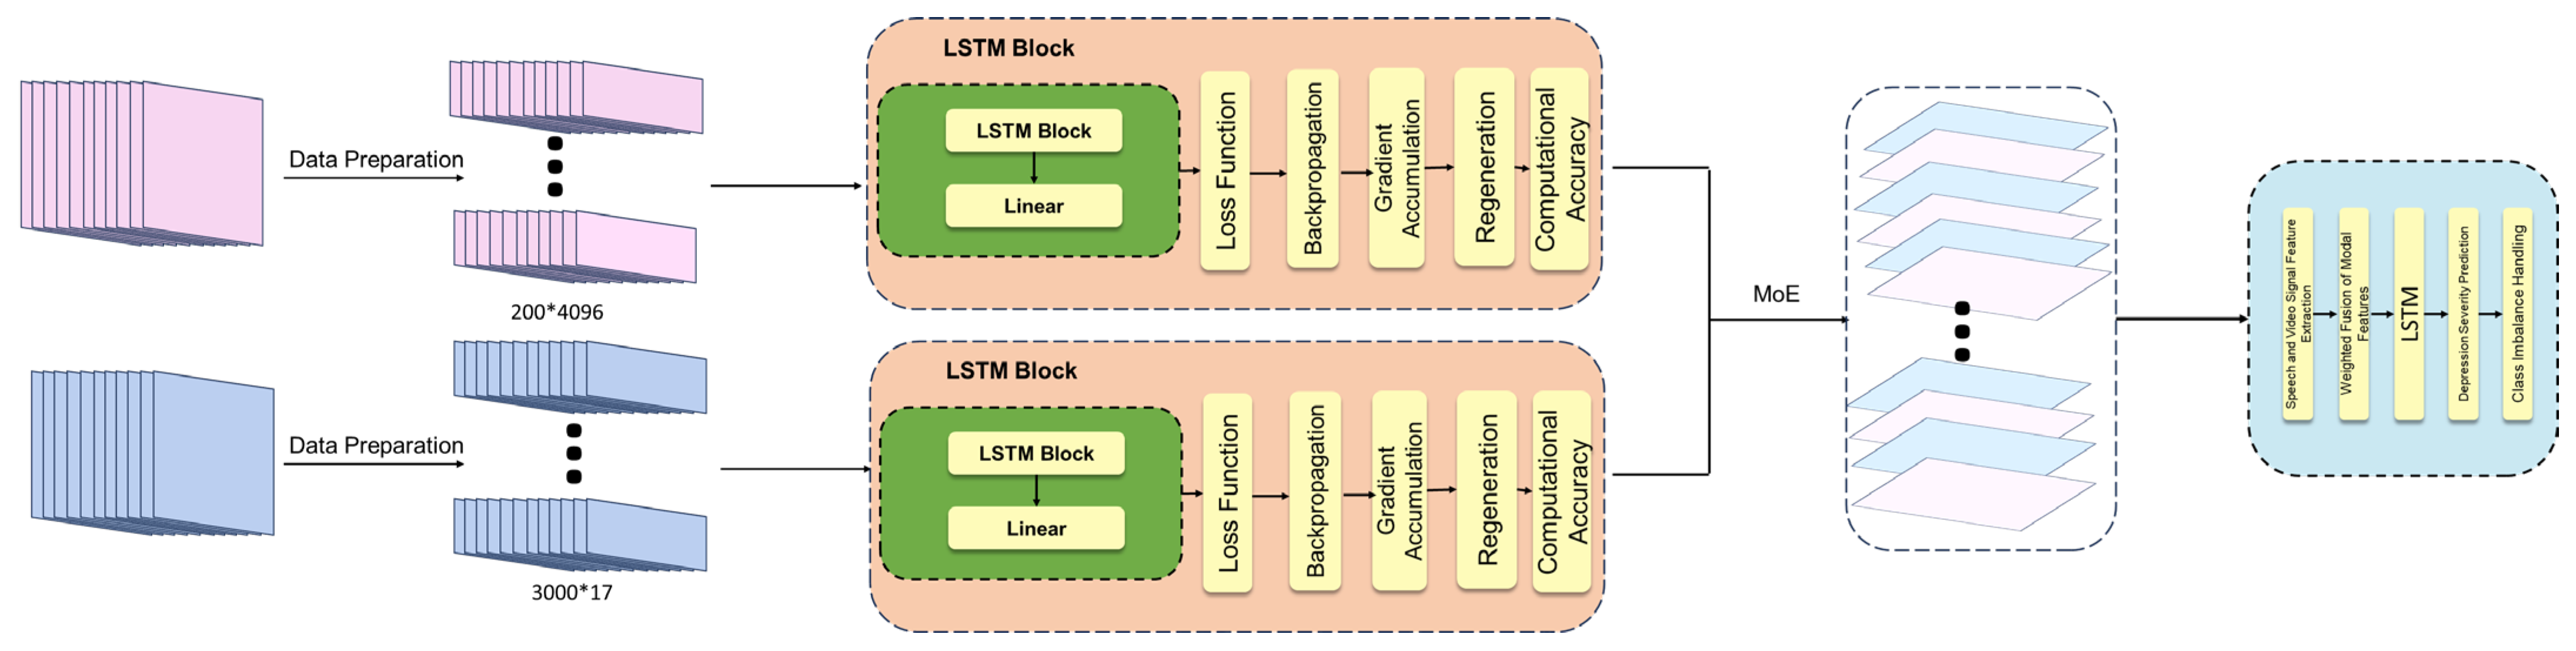
3.4. Multimodal Model

In the preceding section, we demonstrated how the LSTM network and the Mixture of Experts (MoE) model were used to predict depression severity based on audio and video signals. In the following section, we introduce the multimodal aspects of the proposed model. The overall process is illustrated in Figure 5.
In terms of multimodal feature extraction, the Visual–Linguistic Model (VLM) was employed to extract features from both audio and video signals [31,32], as shown in Equations (18) and (19).
f v = E n c o d e r v X v
f a = E n c o d e r a X a
The processed audio and video vectors were first obtained after feature extraction.
Unlike traditional VLM processing, the features of each modality are fused after being weighted, with the weights learned through a gating network. The output is then normalized using a sigmoid function, which helps better balance the influence of each modality. This is illustrated in Equations (20)–(22).
f f i n a l = α v f v + α a f a
α v = σ g v
α a = σ g a
Specifically, α v and α a are the modality weights generated by the gating network, where g v and g a are the corresponding outputs before normalization, and σ represents the sigmoid function.
In the final stage, the extracted and fused features are input into the LSTM model for prediction, as presented in Equation (23).
F f u s i o n = L S T M f f i n a l
Here, F f u s i o n denotes the vector obtained after multimodal fusion.
The model predicts the depression severity score based on the extracted features, as illustrated in Equation (24).
y = σ W F f u s i o n + b
In this formulation, W denotes the weight matrix of the fully connected layer, while b represents the corresponding bias term.
Finally, Focal Loss was employed to address class imbalance. While the traditional Mean Squared Error (MSE) loss assumes a fixed error and does not account for predictive uncertainty, the Negative Log-Likelihood (NLL) loss function inherently models such uncertainty. This enables the model to assign more relaxed weights to highly uncertain data, thereby improving robustness. The formulation is shown in Equation (25).
L = α t 1 p t γ l o g p t
Here, p t presents the predicted probability for the true class, α t is the class weight coefficient used to address the imbalance between positive and negative samples, and γ is the focusing parameter that controls the rate at which the loss for well-classified examples is down-weighted, typically set to 2.

4. Results

To validate the proposed model, the experiments were conducted under the conditions specified in Table 3.

4.1. Conventional Network Experiments

Depression severity detection is often conducted in resource-constrained environments, such as hospitals, where real-time monitoring is required. Therefore, the network was designed for enhancing detection accuracy and enabling lightweight deployment.
In previous studies, many models have incorporated attention mechanisms, yet with considerable size, which posed challenges for lightweight deployment and real-time detection. To deal with this issue, we aim to explore model architectures that can reduce the size without significantly compromising accuracy.
In the early stages of our experiments, traditional machine learning models, such as Random Forests and Support Vector Machines were employed. Yet, they struggled to capture effective features and failed to meet the requirements for detecting depression severity, due to the fact that each participant’s interview varied in topic and duration. Consequently, we resorted to deep learning methods, which are better suited to capturing complex patterns and temporal information within the data.
Therefore, we selected convolutional approaches. By leveraging convolutional layers, we aimed to extract more meaningful features, spatially and temporally, from the data. This allowed us to better handle the variability in interview topics and durations, improving the model’s ability to identify relevant patterns for depression severity detection. We then designed the network using a ResNet architecture, which shall, according to Singh et al., include an initial convolutional layer, multiple residual block groups, a global average pooling layer, and a fully-connected layer [33]. The specific implementation of the residual block is presented by Equation (26):
y = R e L U F x + x
Due to the unsatisfactory training results initially, innovative preprocessing methods were applied to the experimental data, which remained suboptimal despite seeing an improved accuracy. Subsequently, a deeper network was constructed by stacking multiple residual blocks, which, sadly, led to significant overfitting. Consequently, we decided to replace the model in order to further enhance performance.

4.2. Conventional LSTM Experiments

In the initial experiments, a model based on the ResNet framework was trained. However, the results indicate that this framework performs poorly on the datasets, particularly in capturing temporal information. This might be because ResNet is good at extracting spatial features, while the datasets contain substantial spatiotemporal information. As a result, ResNet could give full play to its ability to leverage the temporal features of the data, thereby lowering the overall performance of the model.
Based on this observation, the LSTM network was chosen. It is able to effectively capture and retain critical information in the long-time series data while discarding irrelevant content through the collaborative function of input, forget, and output gates. It is superior in handling data with temporal dependencies.
Actually, in the experiments, it was able to effectively capture the temporal features in the data, generating a significant improvement in training accuracy. However, despite the enhanced performance on the training set, it still exhibited shortcomings on the test set, particularly in terms of generalization. Our observations show that it is prone to overfitting during training, which will adversely affect its performance on the test set.

4.3. Enhanced LSTM Experiments

To mitigate the risk of overfitting, the first strategy was to use Dropout. For each training iteration, a binary mask matrix was randomly generated for each layer to determine which neurons would be dropped out. This process is implemented as shown in Equation (27).
m l ~ B e r n o u l l i p
where m l represents the mask matrix for the l layer, and p is the probability of retaining neurons (in this study, p = 0.5 ).
Next, the generated mask matrices were used to adjust the outputs of the neurons. Specifically, for the input h l and weights W l of the l layer, the output h l + 1 is computed as shown in Equations (28) and (29).
h ~ l = m l h l
h l + 1 = f W l h ~ l + b l
where h ~ l represents the input with Dropout applied, f the activation function, b l the bias term, and the element-wise multiplication.
During the testing phase, a series of adjustments were made to the network to maintain input consistency. The specific approach is shown in Equation (30).
h t e s t l + 1 = p h t r a i n l + 1
Moreover, the Adam optimizer was introduced, which allowed for adaptive learning rates for each parameter, hence effectively adjusting update steps based on the parameter’s needs. This makes it particularly useful for dealing with sample imbalance in this study, as it can provide more controlled updates. It can also offer a more stable convergence process and demonstrate greater robustness when dealing with sparse gradients. Initialization was performed, with the learning rate set to α = 0.001, and typical values for β1 = 0.9, β2 = 0.999, and ϵ = 10−8.
The gradient of the loss function at the time step with respect to the parameter is calculated as shown in Equation (31).
g t = θ L θ t
Subsequently, the first-order and second-order moment estimates are updated, as shown in Equations (32) and (33).
m t = β 1 m t 1 + 1 β 1 g t
v t = β 2 v t 1 + 1 β 2 g t 2
Due to the initial bias in m t and v t , corrections are required, as illustrated in Equations (34) and (35).
m ^ t = m t 1 β 1 t
v ^ t = v t 1 β 2 t
Finally, the corrected estimates are used to update the parameters, as shown in Equation (36).
θ t + 1 = θ t α m ^ t v ^ t + ϵ
Through the aforementioned improvements, the proposed multimodal depression severity detection network effectively reduced overfitting and enhanced generalization. The experimental results on public datasets demonstrate that the network can perform well, validating its effectiveness and reliability.

4.4. Experimental Results and Discussion

In the context of depression detection, lightweight deployment and accuracy are of paramount importance. Accordingly, the proposed model was assessed from both the lightweight and accuracy metrics. In terms of lightweight deployment, the evaluation metrics are presented in Table 4.
The lightweight depression severity detection model proposed in this study achieved a significant reduction in model size. Compared to the DMSN model introduced by de Melo et al., it reduced the number of parameters substantially, demonstrating superior optimization for a lightweight design [34]. This improvement not only decreases the storage requirements, but also enhances the computational efficiency, making the model more suitable for deployment in resource-constrained environments. Additionally, the reduced model size reduces the inference time, improves the response speed, and facilitates real-time detection and deployment.
In contrast, previous studies typically did not perform the fine-grained processing of the dataset—for example, separating interviews conducted by humans and robots for independent training and later fusion. Instead, they often applied Transformer-based models directly to the raw data [35,36]. While such approaches are simple, they tend to result in large models that are difficult to deploy in lightweight or real-time scenarios.
Simultaneously, attention was also given to accuracy-related metrics. To provide a comprehensive evaluation, several metrics were selected, defined, and described in Equations (37)–(40). They enabled an effective assessment of the strengths and weaknesses of the model, providing a basis for its further optimization and improvement.
A c c u r a c y = N u m b e r   o f   C o r r e c t   P r e d i c t i o n s T o t a l   N u m b e r   o f   P r e d i c t i o n s
M S E = 1 n i = 1 n y i y ^ i 2
R M S E = M S E = 1 n i = 1 n y i y ^ i 2
M A E = 1 n i = 1 n y i y ^ i
where n represents the number of samples, y i the true value of the i sample, and y ^ i the predicted value of the i sample.
In this experiment, we tested not only the LSTM network, but also employed ResNet for supplementary validation to ensure the comprehensiveness and reliability of the results. Our findings are summarized in Table 5 and Table 6, which illustrate the performances of both models across various evaluation metrics.
The figures above present the evaluation metrics for various models, highlighting the differences in performance. Notably, traditional machine learning models exhibited significantly lower accuracy and, therefore, were excluded.
The table above illustrates the differences between the experimental results of our experience and those of previous studies.
The figures above present the evaluation metrics for various models, highlighting the performance differences. Notably, traditional machine learning models exhibited significantly lower accuracy and, therefore, were excluded from the reporting of other evaluation metrics.
As shown in the table above, the LSTM-based multimodal depression detection model achieves a 21.86% higher accuracy over that presented by Shen et al. in audio data detection [37]. Additionally, the proposed model achieved a 1.86% improvement in accuracy over the model proposed by Gautam [18], and a 2.56% increase compared to the recently published DepITCM model [39]. Due to the normalization and standardization of the data conducted prior to analysis, both the root mean square error (RMSE) and mean absolute error (MAE) were notably low, with the best results being 0.3566 and 0.1271, respectively. These results indicate that the proposed model has significantly exceled in enhancing accuracy and reducing errors.
From the table, it is evident that the results obtained with the LSTM network are significantly superior to those using the ResNet network. This disparity is primarily because the depression severity detection datasets derived from interviews contained substantial spatiotemporal information. The LSTM network is capable of retaining long-term dependencies and mitigating the vanishing gradient problem inherent in traditional RNNs. Furthermore, it excels in capturing long-range dependencies in input data, which is crucial for accurately detecting the depression severity.
To sum up, the LSTM network outperformed the ResNet network in classification accuracy and showed significantly better results in the evaluation metrics, such as Mean Squared Error (MSE), Root Mean Squared Error (RMSE), and Mean Absolute Error (MAE), than the latter. This can primarily be attributed to:
Firstly, the LSTM network was designed to capture long-term dependencies in time series data and thus gained an advantage in terms of accuracy. However, when applied to classification tasks, such as quantifying the depression severity, it may exhibit higher error metrics (e.g., MSE, RMSE, and MAE).
Secondly, it is sensitive to noise and outliers in the sequence data. Given that the datasets in this study were obtained from interviews, which involved significant individual and thematic variability, such noise and outliers might substantially increase errors in classification tasks. This sensitivity could lead to a poorer performance in metrics such as MSE, RMSE, and MAE. As a result, the LSTM network may excel in capturing long-term dependencies, but it could exhibit higher errors when dealing with noisy data.
Finally, datasets related to depression typically have a limited number of samples, particularly for those involving depression-specific cases. This would increase the risk of overfitting in the LSTM network.
In the process of depression severity detection, accuracy metrics are crucial. Therefore, accuracy graphs were plotted as shown in Figure 6, Figure 7 and Figure 8.
From Figure 6 and Figure 7, it can be observed that the classification accuracy curve for audio signals is notably smoother than that of video signals. This can be primarily attributed to the complexity of the video data and the impact of disguised expressions. Individuals might show different facial expressions when interacting with AI from working with real humans, posing a greater challenge for the model in predicting each specific data point. This increased the risk of overfitting and reduced the robustness of the model. Moreover, the high dimensionality and informational complexity of the video data make it more susceptible to overfitting, resulting in an unstable performance on the test data.
By contrast, the audio data generally exhibit lower information density and dimensionality. This may limit the classification performance and result in the lower accuracy of the model, but the reduced complexity can effectively mitigate the risk of overfitting and enhance the generalization ability of the model. Additionally, the lower noise levels inherent in the audio data contribute to improved robustness, leading to greater stability of the model in applications.
Although the classification accuracy of audio signals may be lower than that of video signals, their reduced dimensionality and information density contribute to the enhanced stability and generalization ability of the model. Consequently, the model demonstrated greater reliability in applications.
In Figure 8, the accuracy curve shows a relatively smooth upward trend, with high accuracy on the whole. This has further validated that the network performs well in operation, supported by the complementary validation of both audio and video signals.

5. Conclusions

In this study, a multimodal depression severity recognition system based on an LSTM network was designed and implemented. By improving the data preprocessing pipeline, including topic segmentation, handling datasets with different topics, and processing disguised expressions, the optimized LSTM network effectively reduced the risk of overfitting and significantly enhanced the generalization capability of the model. By leveraging multimodal fusion techniques, we successfully reduced the model’s size while achieving effective feature extraction. The experimental results on both public and private datasets demonstrate that the model excels in lightweight design and real-time accurate detection. Based on the comprehensive research and experimental findings, it is concluded that the proposed data preprocessing methods and the LSTM-based multimodal network are superior in depression severity recognition. In our future research, we will work on the following tasks:
(1)
Further exploration will be conducted into utilizing deep learning methods to identify features of depression severity, with the goal of enhancing the model’s recognition capabilities.
(2)
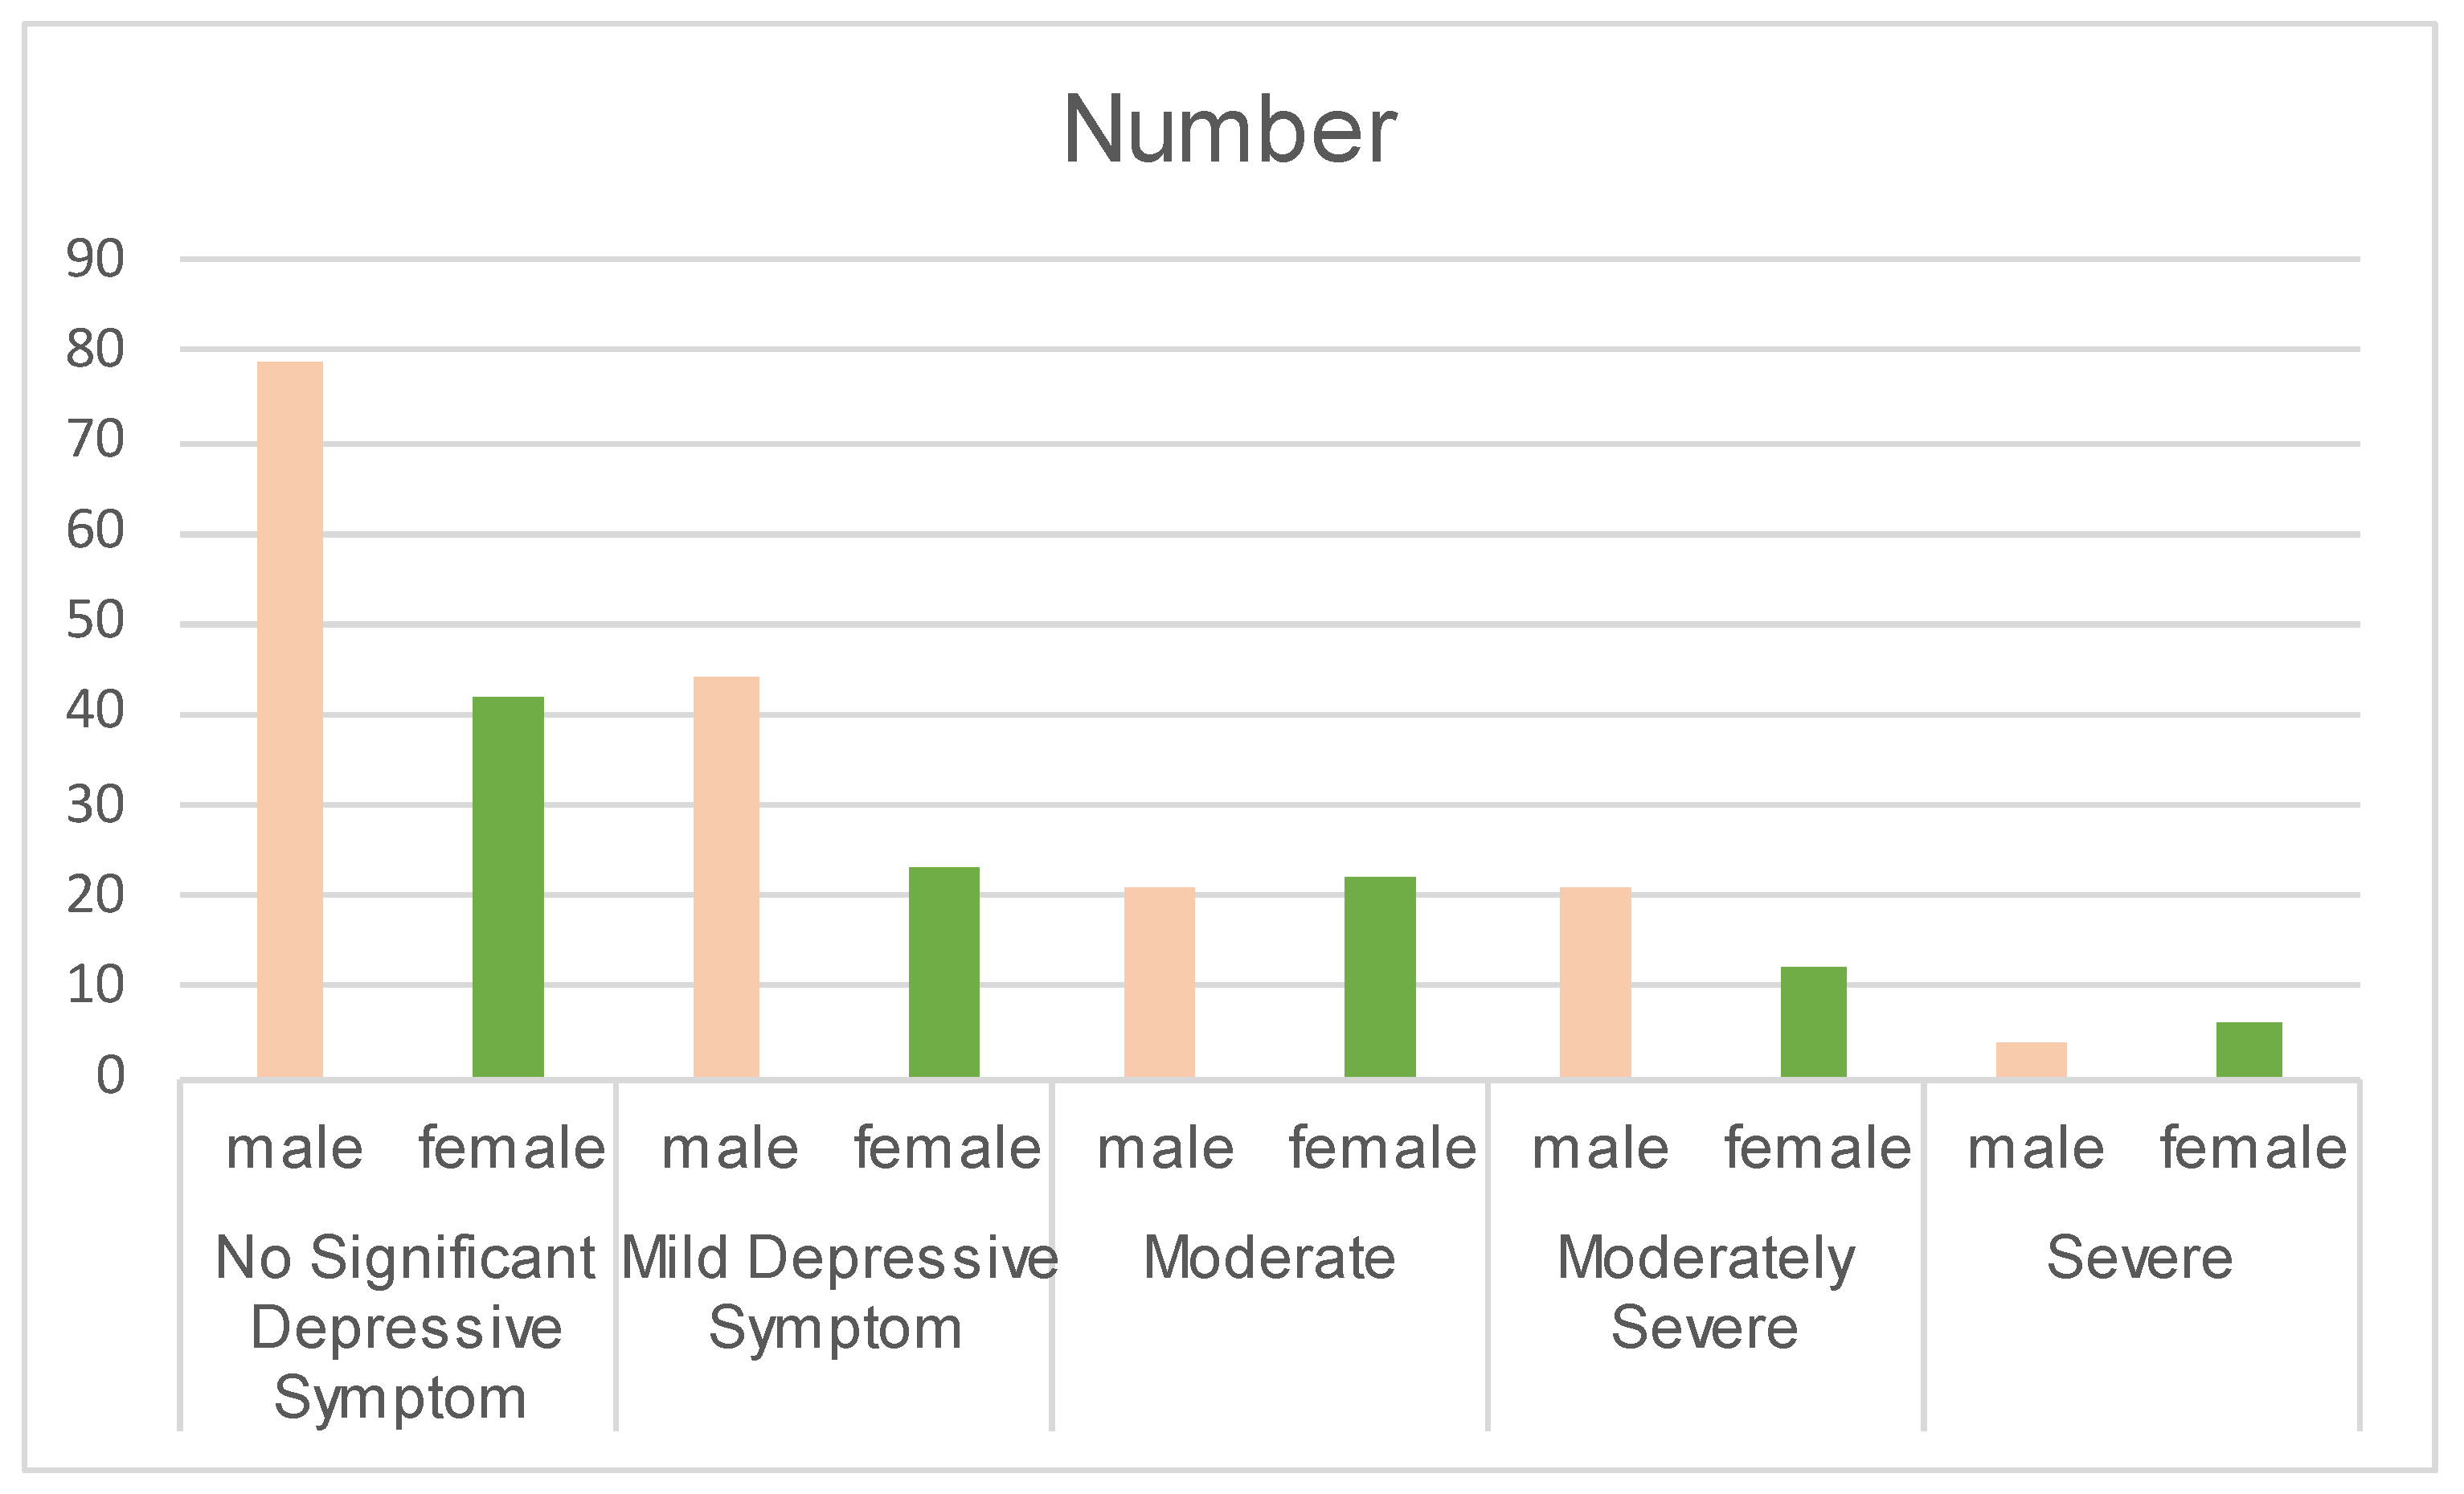
Considering the significant gender imbalance in the dataset, as well as the differences in depression prevalence, symptom manifestation, and suicide risk between males and females, the future research will emphasize the impact of gender on depression severity detection.
(3)
We will continue collaborate with hospitals, psychological counseling centers, and related institutions to implement automated depression severity detection technologies, ultimately contributing to smart healthcare solutions.
(4)
Depression in youth is both prevalent and disabling, often serving as a precursor to chronic and recurrent disorders and impairments in adulthood. However, the issue of depression among children and adolescents has not received sufficient attention from society. Therefore, the future research will place greater emphasis on depression in children and adolescents.

Author Contributions

L.Z.: Conceptualization, Software, Formal analysis, and Writing—review and editing; S.Z.: Conceptualization, Methodology, and Investigation. X.Z.: Data curation, Visualization, and Investigation; Y.Z.: Conceptualization, Methodology, Software, Formal analysis, Investigation, and Writing—original draft. All authors have read and agreed to the published version of the manuscript.

Funding

This work was supported by the College Students’ Innovative Entrepreneurial Training Plan Program (Project No. 202410225039).

Data Availability Statement

Data is contained within the article.

Conflicts of Interest

The authors declare no conflicts of interest. The funders had no role in the design of the study; in the collection, analyses, or interpretation of data; in the writing of the manuscript; or in the decision to publish the results.

References

  1. Rakel, R.E. Depression. Prim. Care 1999, 26, 211–224. [Google Scholar] [CrossRef] [PubMed]
  2. Belmaker, R.H.; Agam, G. Major Depressive Disorder. N. Engl. J. Med. 2008, 358, 55–68. [Google Scholar] [CrossRef] [PubMed]
  3. World Health Organization. The Global Burden of Disease: 2004 Update; World Health Organization: Geneva, Switzerland, 2008. [Google Scholar]
  4. World Health Organization. Depression and Other Common Mental Disorders: Global Health Estimates; World Health Organization: Geneva, Switzerland, 2017. [Google Scholar]
  5. France, D.; Shiavi, R.; Silverman, S.; Silverman, M.; Wilkes, M. Acoustical Properties of Speech as Indicators of Depression and Suicidal Risk. IEEE Trans. Biomed. Eng. 2000, 47, 829–837. [Google Scholar] [CrossRef] [PubMed]
  6. Shan, Z.; Cheng, S.; Wu, F.; Pan, X.; Li, W.; Dong, W.; Xie, A.; Zhang, G. Electrically Conductive Two-Dimensional Metal-Organic Frameworks for Superior Electromagnetic Wave Absorption. Chem. Eng. J. 2022, 446, 137409. [Google Scholar] [CrossRef]
  7. Cen, S.; Yu, Y.; Yan, G.; Yu, M.; Guo, Y. Multi-Task Facial Activity Patterns Learning for Micro-Expression Recognition Using Joint Temporal Local Cube Binary Pattern. Signal Process. Image Commun. 2022, 103, 116616. [Google Scholar] [CrossRef]
  8. Li, Y.; Liu, Z.; Zhou, L.; Yuan, X.; Shangguan, Z.; Hu, X.; Hu, B. A Facial Depression Recognition Method Based on Hybrid Multi-Head Cross Attention Network. Front. Neurosci. 2023, 17, 1188434. [Google Scholar] [CrossRef]
  9. Han, Z.; Shang, Y.; Shao, Z.; Liu, J.; Guo, G.; Liu, T.; Ding, H.; Hu, Q. Spatial-Temporal Feature Network for Speech-Based Depression Recognition. IEEE Trans. Cogn. Dev. Syst. 2023, 16, 308–318. [Google Scholar] [CrossRef]
  10. Zhang, S.; Zhang, X.; Zhao, X.; Fang, J.; Niu, M.; Zhao, Z.; Yu, J.; Tian, Q. MTDAN: A Lightweight Multi-Scale Temporal Difference Attention Networks for Automated Video Depression Detection. IEEE Trans. Affect. Comput. 2023, 15, 1078–1089. [Google Scholar] [CrossRef]
  11. Pan, Y.; Shang, Y.; Wang, W.; Shao, Z.; Han, Z.; Liu, T.; Guo, G.; Ding, H. Multi-Feature Deep Supervised Voiceprint Adversarial Network for Depression Recognition from Speech. Biomed. Signal Process. Control 2024, 89, 105704. [Google Scholar] [CrossRef]
  12. He, L.; Niu, M.; Tiwari, P.; Marttinen, P.; Su, R.; Jiang, J.; Guo, C.; Wang, H.; Ding, S.; Wang, Z.; et al. Deep Learning for Depression Recognition with Audiovisual Cues: A Review. Inf. Fusion 2022, 80, 56–86. [Google Scholar] [CrossRef]
  13. Niu, M.; Tao, J.; Liu, B.; Huang, J.; Lian, Z. Multimodal Spatiotemporal Representation for Automatic Depression Level Detection. IEEE Trans. Affect. Comput. 2023, 14, 294–307. [Google Scholar] [CrossRef]
  14. Kroenke, K.; Strine, T.W.; Spitzer, R.L.; Williams, J.B.; Berry, J.T.; Mokdad, A.H. The PHQ-8 as a Measure of Current Depression in the General Population. J. Affect. Disord. 2009, 114, 163–173. [Google Scholar] [CrossRef] [PubMed]
  15. Burdisso, S.; Reyes-Ramírez, E.; Villatoro-Tello, E.; Sánchez-Vega, F.; Monroy, A.L.; Motlicek, P. DAIC-WOZ: On the Validity of Using the Therapist’s Prompts in Automatic Depression Detection from Clinical Interviews. arXiv 2024, arXiv:2404.14463. [Google Scholar]
  16. Misgar, M.; Bhatia, M. Hopping-Mean: An Augmentation Method for Motor Activity Data Towards Real-Time Depression Diagnosis Using Machine Learning. Multimedia Tools Appl. 2024, 1–19. [Google Scholar] [CrossRef]
  17. Perlman, K.; Mehltretter, J.; Benrimoh, D.; Armstrong, C.; Fratila, R.; Popescu, C.; Tunteng, J.-F.; Williams, J.; Rollins, C.; Golden, G.; et al. Development of a Differential Treatment Selection Model for Depression on Consolidated and Transformed Clinical Trial Datasets. Transl. Psychiatry 2024, 14, 263. [Google Scholar] [CrossRef]
  18. Gong, Y.; Poellabauer, C. Topic Modeling Based Multi-Modal Depression Detection. In Proceedings of the 7th Annual Workshop on Audio/Visual Emotion Challenge, Mountain View, CA, USA, 23 October 2017; Association for Computing Machinery: New York, NY, USA, 2017; pp. 69–76. [Google Scholar]
  19. Wang, Z.; Chen, L.; Wang, L.; Diao, G. Recognition of Audio Depression Based on Convolutional Neural Network and Generative Antagonism Network Model. IEEE Access 2020, 8, 101181–101191. [Google Scholar] [CrossRef]
  20. Cohn, J.F.; Kruez, T.S.; Matthews, I.; Yang, Y.; Nguyen, M.H.; Padilla, M.T.; Zhou, F.; De la Torre, F. Detecting Depression from Facial Actions and Vocal Prosody. In Proceedings of the 2009 3rd International Conference on Affective Computing and Intelligent Interaction and Workshops, Amsterdam, The Netherlands, 10–12 September 2009; pp. 1–7. [Google Scholar]
  21. Yang, L.; Jiang, D.; Xia, X.; Pei, E.; Oveneke, M.C.; Sahli, H. Multimodal Measurement of Depression Using Deep Learning Models. In Proceedings of the 7th Annual Workshop on Audio/Visual Emotion Challenge, Mountain View, CA, USA, 23 October 2017; pp. 53–59. [Google Scholar]
  22. Jan, A.; Meng, H.; Gaus, Y.F.B.A.; Zhang, F. Artificial Intelligent System for Automatic Depression Level Analysis Through Visual and Vocal Expressions. IEEE Trans. Cogn. Dev. Syst. 2017, 10, 668–680. [Google Scholar] [CrossRef]
  23. He, T.; Huang, W. Automatic Identification of Depressive Symptoms in College Students: An Application of Deep Learning-Based CNN (Convolutional Neural Network). Appl. Math. Nonlinear Sci. 2024, 9, 1–15. [Google Scholar] [CrossRef]
  24. Blei, D.M.; Ng, A.Y.; Jordan, M.I. Latent Dirichlet Allocation. J. Mach. Learn. Res. 2003, 3, 993–1022. [Google Scholar]
  25. Sharma, G.; Umapathy, K.; Krishnan, S. Trends in Audio Signal Feature Extraction Methods. Appl. Acoust. 2020, 158, 107020. [Google Scholar] [CrossRef]
  26. Mo, F.; Zhang, Z.; Chen, T.; Zhao, K.; Fu, X. MFED: A Database for Masked Facial Expression. IEEE Access 2021, 9, 96279–96287. [Google Scholar] [CrossRef]
  27. Huc, M.; Bush, K.; Atias, G.; Berrigan, L.; Cox, S.; Jaworska, N. Recognition of Masked and Unmasked Facial Expressions in Males and Females and Relations with Mental Wellness. Front. Psychol. 2023, 14, 1217736. [Google Scholar] [CrossRef]
  28. Shazeer, N.; Maziarz, K.; Davis, A.; Le, Q.; Hinton, G.; Dean, J. Outrageously Large Neural Networks: The Sparsely-Gated Mixture-of-Experts Layer. arXiv 2017, arXiv:1701.06538. [Google Scholar]
  29. Jacobs, R.A.; Jordan, M.I.; Nowlan, S.J.; Hinton, G.E. Adaptive Mixtures of Local Experts. Neural Comput. 1991, 3, 79–87. [Google Scholar] [CrossRef] [PubMed]
  30. Ding, R.; Lu, H.; Liu, M. DenseFormer-MoE: A Dense Transformer Foundation Model with Mixture of Experts for Multi-Task Brain Image Analysis. IEEE Trans. Med. Imaging 2025. [Google Scholar] [CrossRef]
  31. Pan, J.; Liu, C.; Wu, J.; Liu, F.; Zhu, J.; Li, H.B.; Chen, C.; Ouyang, C.; Rueckert, D. MedVLM-R1: Incentivizing Medical Reasoning Capability of Vision-Language Models (VLMs) via Reinforcement Learning. arXiv 2025, arXiv:2502.19634. [Google Scholar]
  32. Luo, T.; Cao, A.; Lee, G.; Johnson, J.; Lee, H. Probing Visual Language Priors in VLMs. arXiv 2025, arXiv:2501.00569. [Google Scholar]
  33. Singh, A.; Kumar, D. Detection of Stress, Anxiety, and Depression (SAD) in Video Surveillance Using ResNet-101. Microprocess. Microsyst. 2022, 95, 104681. [Google Scholar] [CrossRef]
  34. de Melo, W.C.; Granger, E.; Lopez, M.B. Facial Expression Analysis Using Decomposed Multiscale Spatiotemporal Networks. Expert Syst. Appl. 2024, 236, 121276. [Google Scholar] [CrossRef]
  35. Zhou, Y.; Yu, X.; Huang, Z.; Palati, F.; Zhao, Z.; He, Z.; Feng, Y.; Luo, Y. Multi-Modal Fused-Attention Network for Depression Level Recognition Based on Enhanced Audiovisual Cues. IEEE Access 2025, 13, 37913–37923. [Google Scholar] [CrossRef]
  36. Kou, Y.; Ge, F.; Chen, D.; Shen, L.; Liu, H. An Enhanced Cross-Attention Based Multimodal Model for Depression Detection. Comput. Intell. 2025, 41, e70019. [Google Scholar] [CrossRef]
  37. Shen, Y.; Yang, H.; Lin, L. Automatic Depression Detection: An Emotional Audio-Textual Corpus and A GRU/BiLSTM-Based Model. In Proceedings of the ICASSP 2022—2022 IEEE International Conference on Acoustics, Speech and Signal Processing (ICASSP), Singapore, 23–27 May 2022. [Google Scholar]
  38. Liu, Z.; Yuan, X.; Li, Y.; Shangguan, Z.; Zhou, L.; Hu, B. PRA-Net: Part-and-Relation Attention Network for Depression Recognition from Facial Expression. Comput. Biol. Med. 2023, 157, 106589. [Google Scholar] [CrossRef]
  39. Zhang, L.; Liu, Z.; Wan, Y.; Fan, Y.; Chen, D.; Wang, Q.; Zhang, K.; Zheng, Y. DepITCM: An Audio-Visual Method for Detecting Depression. Front. Psychiatry 2025, 15, 1466507. [Google Scholar] [CrossRef]
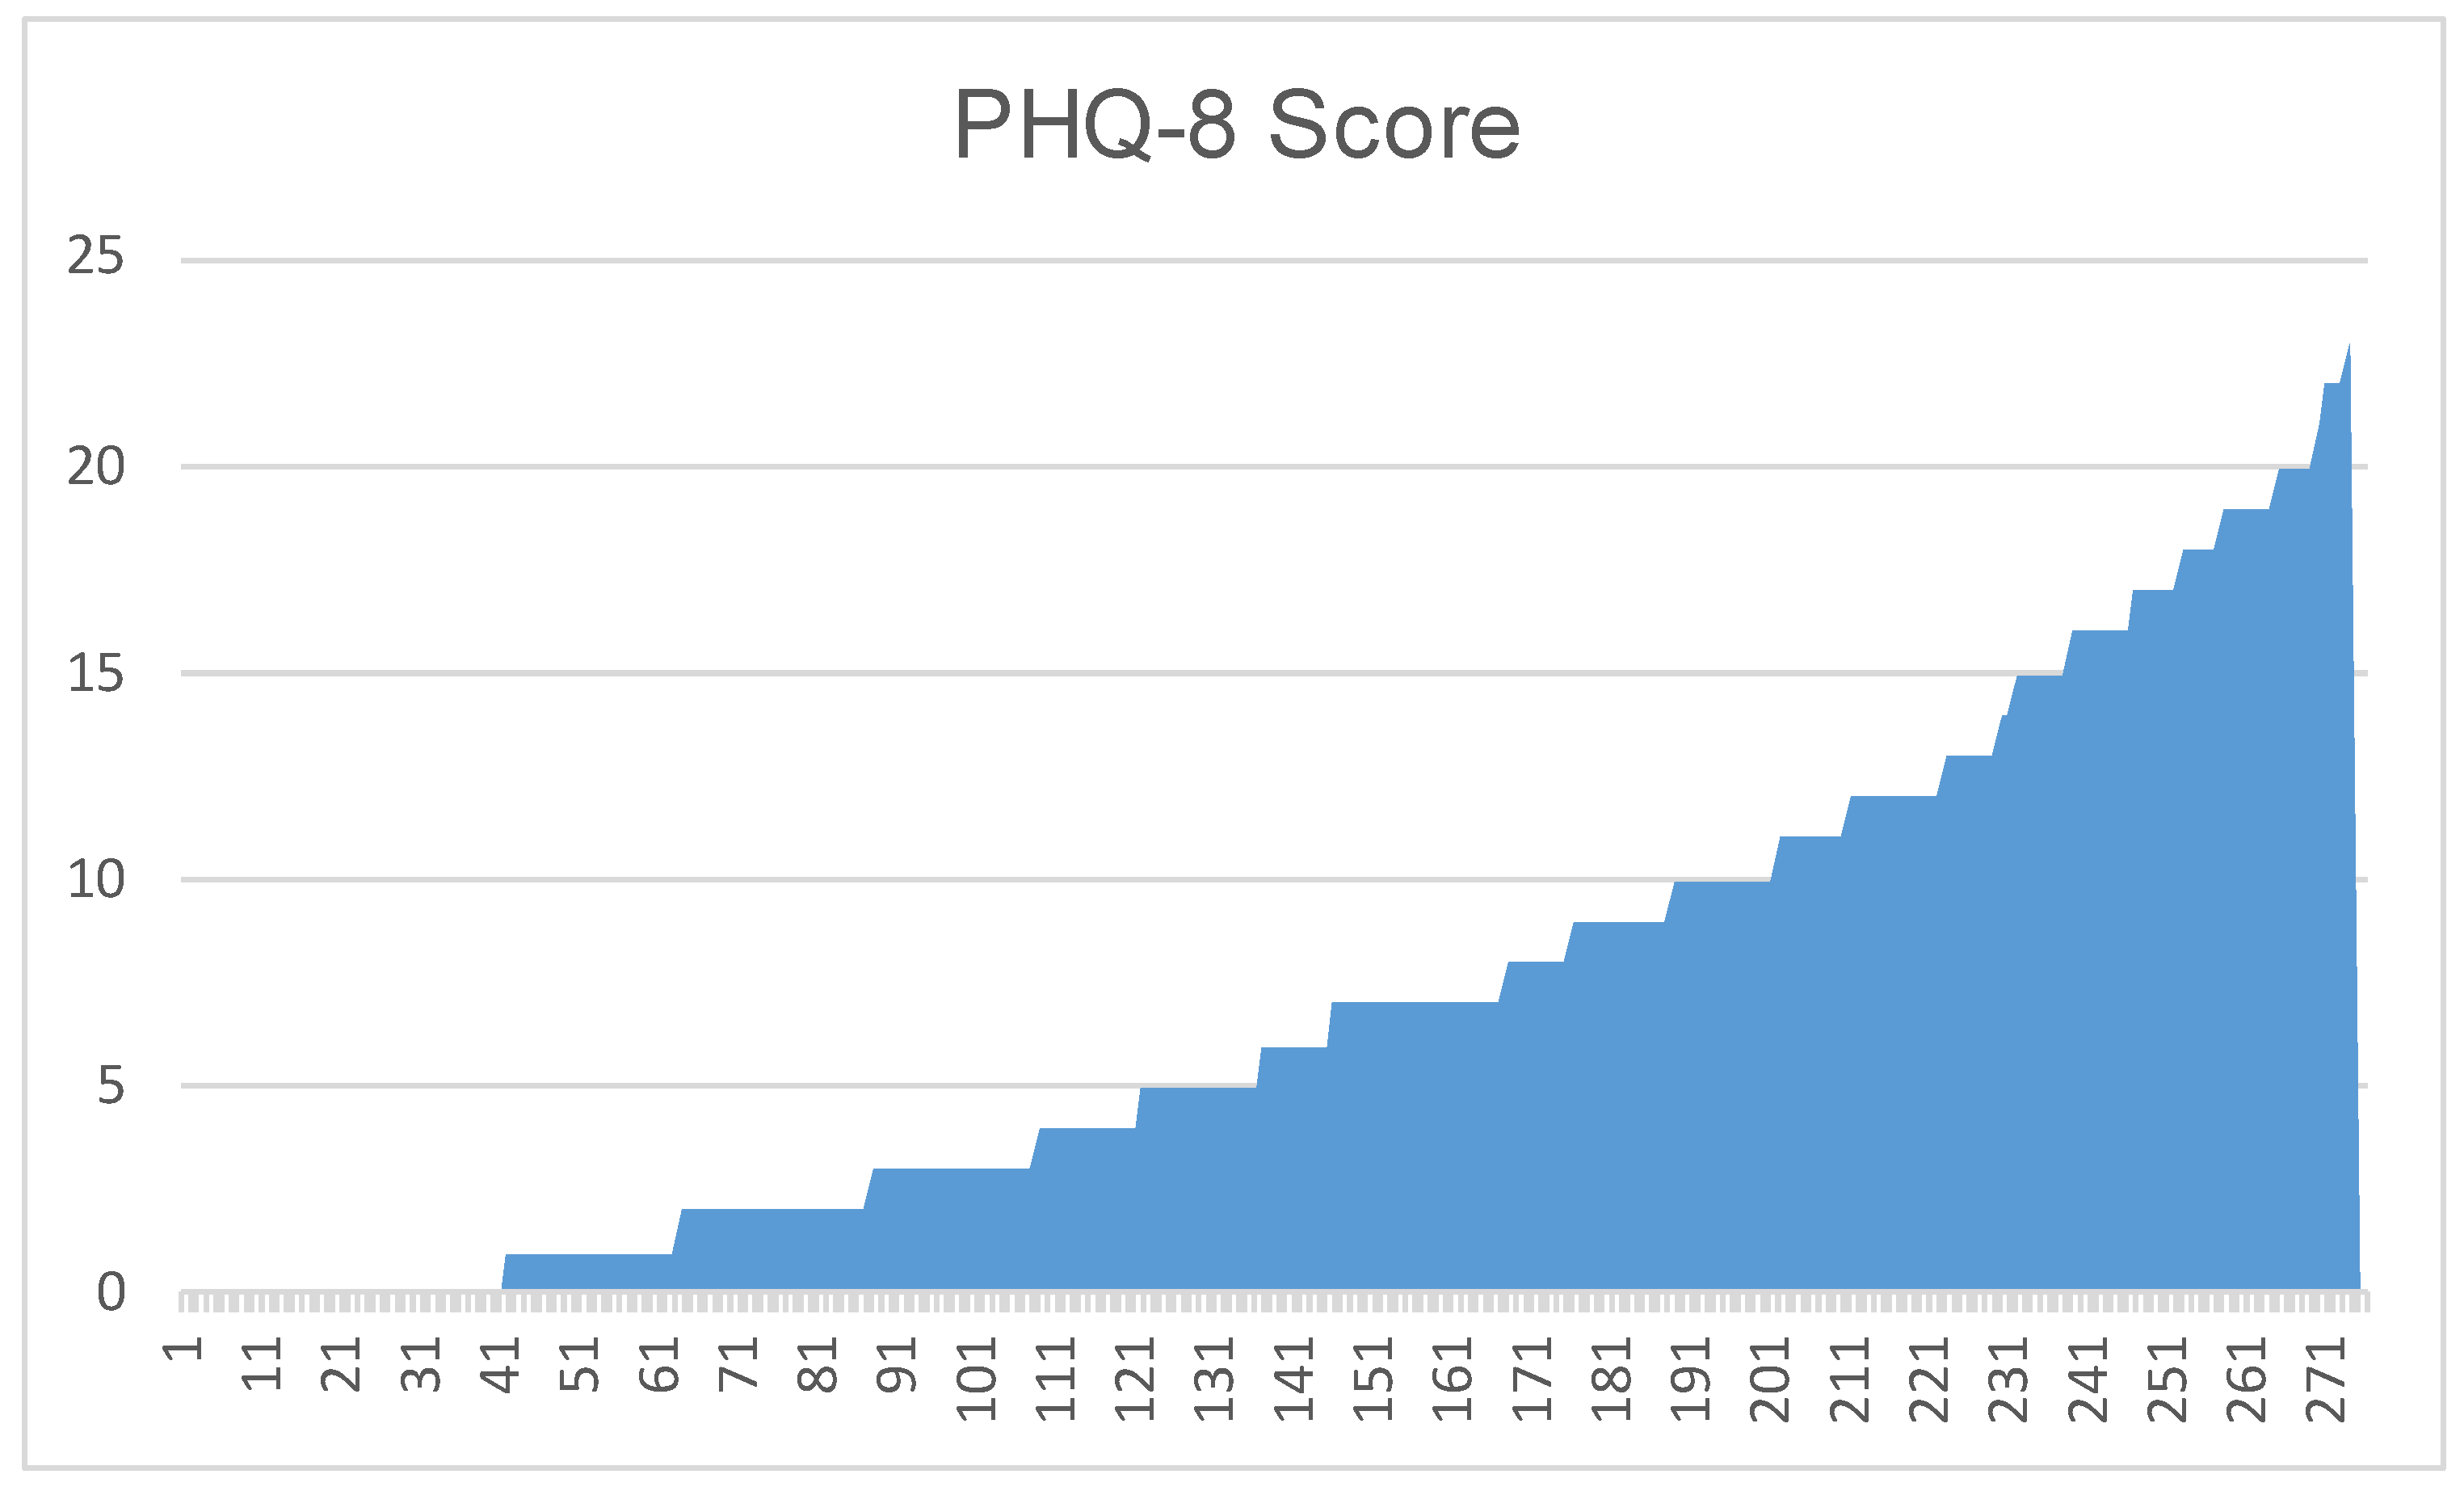
Figure 1. Correspondence table between PHQ-8 score and the total number of people in the E-DAIC dataset.
Electronics 14 01464 g001
Figure 2. Distribution of depression levels in the E-DAIC dataset table.
Electronics 14 01464 g002
Figure 3. Schematic diagram of data preprocessing.
Electronics 14 01464 g003aElectronics 14 01464 g003b
Figure 4. Video/speech signal predictive model of depression.
Electronics 14 01464 g004
Figure 5. Flow diagram of experiment.
Electronics 14 01464 g005
Figure 6. Speech signal accuracy curve.
Electronics 14 01464 g006
Figure 7. Video signal accuracy curve.
Electronics 14 01464 g007
Figure 8. Multimodal accuracy curves.
Electronics 14 01464 g008
Table 1. PHQ-8 score and corresponding depression degree.
PHQ-8 Score (/)Severity Level
0–4No Significant Depressive Symptom
5–9Mild Depressive Symptom
10–14Moderate
15–19Moderately Severe
20–24Severe
Table 2. DAIC-WOZ dataset face video information processed by Openface toolbox results.
Action Unit (/) DescriptionAction Unit (/) Description
1Inner Brow Raiser2Outer Brow Raiser
4Brow Lowerer5Upper Lid Raiser
6Cheek Raiser7Lid Tightener
9Nose Wrinkler10Upper Lip Raiser
12Lip Corner Puller14Dimpler
15Lip Corner Depressor17Chin Raiser
20Lip Stretcher23Lip Tightener
25Lips Part26Jaw Drop
45Blink
Table 3. Experimental environment.
PlatformDetailed Information
Processing UnitAMD Ryzen 7 7700 8-Core Processor
Graphics BoardNVIDIA GeForce RTX 4090 D
Python3.11.7
Pytorch-cuda12.1
Torchvision0.18.1
Table 4. Lightweight valuation indicators.
Evaluation IndicatorsResult
FLOPs0.468 (GFLOPs)
Average inference time per batch0.001655 (second)
Total params128,905
Total mult-adds (UnitS.MEGABYTES)642.00
Input size0.34 (MB)
Forward/backward pass size4.00 (MB)
Params size0.52 (MB)
Estimated total size4.86 (MB)
Size of memory footprint0.49 (MB)
Table 5. Evaluation indicators.
ModalityNetwork TypeTest
MSE
(/)
RMSE
(/)
MAE
(/)
Accuracy (%)
AudioRandom Forest
ResNet

1.9293

1.3890

0.0372
23.96%
60.87%
LSTM5.30662.30360.035079.13%
VideoRandom Forest
ResNet

2.6644

1.6323

0.0337
20.53%
66.09%
LSTM4.57692.13940.034680.87%
Multi-ModelLSTM0.21330.35660.127183.86%
Table 6. Comparison of experimental results with previous studies.
ModalityNetwork TypeTest
MSE
(/)
RMSE
(/)
MAE
(/)
Accuracy (%)
Audio


Video


Multi-Model
Multimodal LSTM [37]
AVTF-TBN [38]
Proposed method
Speaking HDR-DCNN [21]
AVTF-TBN [29]
Proposed method
Topic modeling [18]
DepITCM [39]
AVTF-TBN [29]
Proposed method


1.9293


4.5769


0.2133


1.3890


2.1394
4.99
4.89

0.3566


0.0372


0.0346
3.96
4.62

0.1271
71%
61%
60.87%
82%
62%
80.87%

81.3%
57%
83.86%
Disclaimer/Publisher’s Note: The statements, opinions and data contained in all publications are solely those of the individual author(s) and contributor(s) and not of MDPI and/or the editor(s). MDPI and/or the editor(s) disclaim responsibility for any injury to people or property resulting from any ideas, methods, instructions or products referred to in the content.

