Article

A Graph-Enhanced Dual-Granularity Self-Attention Model for Next POI Recommendation

School of Computer Engineering and Science, Shanghai University, 99 Shangda Road, Shanghai 200444, China
*
Author to whom correspondence should be addressed.
Electronics 2025, 14(7), 1387; https://doi.org/10.3390/electronics14071387
Submission received: 3 March 2025 / Revised: 27 March 2025 / Accepted: 27 March 2025 / Published: 30 March 2025

Abstract

:
The growth of location-based social network (LBSN) services has resulted in a demand for location-based recommendation services. The next point of interest (POI) recommendation is identified as a core service of LBSNs. It is designed to provide personalized POI suggestions by analyzing users’ historical check-in data. General methods model users’ check-in sequences by directly applying attention mechanisms. However, they often overlook the importance of global information from other users’ behaviors, and the embeddings of check-ins are not sufficiently effective. This approach fails to capture the collective influence of multiple check-ins. To address this issue, we propose a graph enhanced dual-granularity self-attention model (GEDGSA) that can model users’ preferences from both fine-grained and coarse-grained perspectives to improve prediction performance. First, a graph-enhanced embedding module is designed to capture common transition patterns among all users to obtain initial POI features. Second, the virtual trajectory construction operation is introduced to transform multiple check-ins into coarse-grained virtual check-in items. The GEDGSA learns user check-in sequences from both fine-grained and coarse-grained perspectives. Finally, our method experiments on the Foursquare-NYC and Foursquare-TKY datasets, demonstrating that it outperforms most existing methods.

1. Introduction

With the proliferation of GPS-supported mobile devices, LBSN services have become increasingly popular in recent years. These services generate a substantial amount of check-in data containing location information. The next POI recommendation is considered one of the core services of LBSNs [1]. Its goal is to analyze users’ preferences by mining useful information from check-in data to predict the next POI that users might visit [2].
The next POI recommendation is regarded as a sequence prediction task by the majority of approaches due to its timeliness. Recurrent neural networks (RNNs) and their variants are widely utilized for capturing sequential dependencies due to their excellent sequence modeling capabilities [3,4]. Graph neural networks (GNNs) have attracted attention for their ability to effectively model spatiotemporal data and enhance model expressiveness. For example, in [5], GCN is used to consider enriched contextual information from sequences of relevant neighboring check-ins. The attention mechanism has shown strong capabilities in sequence modeling because it can effectively capture the importance of different parts of sequence data. Some studies [6,7] have incorporated attention mechanisms to model users’ check-in data, thereby analyzing both users’ long-term and short-term preferences. Other methods [8,9] have introduced variants of attention mechanisms, such as self-attention and multi-head attention. Multi-head attention allows for parallel computation through multiple attention heads, extracting information from different subspaces and enhancing the model’s expressive power. Self-attention enables each item in the sequence to attend to all other items, thereby better understanding the contextual information when modeling. These variants significantly improve model performance.
It should be noted that most existing models analyze user behavior solely based on individual check-in data. The collaborative effects of other users are often neglected when modeling user preferences. Constrained by data sparsity, the method of modeling only from the user’s own data often fails to achieve optimal effectiveness. However, we argue that general check-in transition patterns exist across different users. These patterns can be learned by jointly analyzing data from all users to enhance the representation of the initial embedding. Moreover, not all historical check-ins are meaningful for modeling users’ preferences. Noise may be generated by the incorporation of irrelevant historical check-ins in models based solely on RNNs. Attention mechanisms can mitigate noise by assigning varying levels of importance to different items within the sequence. However, due to the inherent characteristics of attention mechanisms, attention scores can only be computed for individual items in the check-in sequence. The collective influence of multiple consecutive items as a collective cannot be effectively calculated.
In summary, the GEDGSA model is proposed to address the challenges involved in analyzing users’ preferences. First, a global POI transition graph is constructed using observable historical check-in data from all users. This graph captures general mobility patterns, which help to alleviate data sparsity. Second, user preferences are modeled by separating long-term and short-term preferences. Given the excellent performance of long short-term memory (LSTM) in sequence modeling, LSTM is employed to learn users’ short-term preferences. This approach leverages the strengths of LSTM while avoiding the gradient vanishing problem in modeling long sequences. To address noise interference, self-attention mechanisms are considered for modeling users’ long-term preferences. Additionally, the dual-granularity self attention (DGSA) module is proposed to analyze the check-in sequence from both fine-grained and coarse-grained perspectives. This module considers both the individual significance of each check-in item and the collective importance of groups of check-ins. Finally, users’ long-term and short-term preferences are integrated in a personalized manner. The main contributions of this paper are summarized as follows:
  • To address the ineffectiveness of check-in embedding, a global POI transition graph is constructed to capture initial POI features that contain general movement patterns from users. The initial features are then integrated into spatial–temporal information from user trajectories to obtain more effective embeddings of users’ check-in sequences.
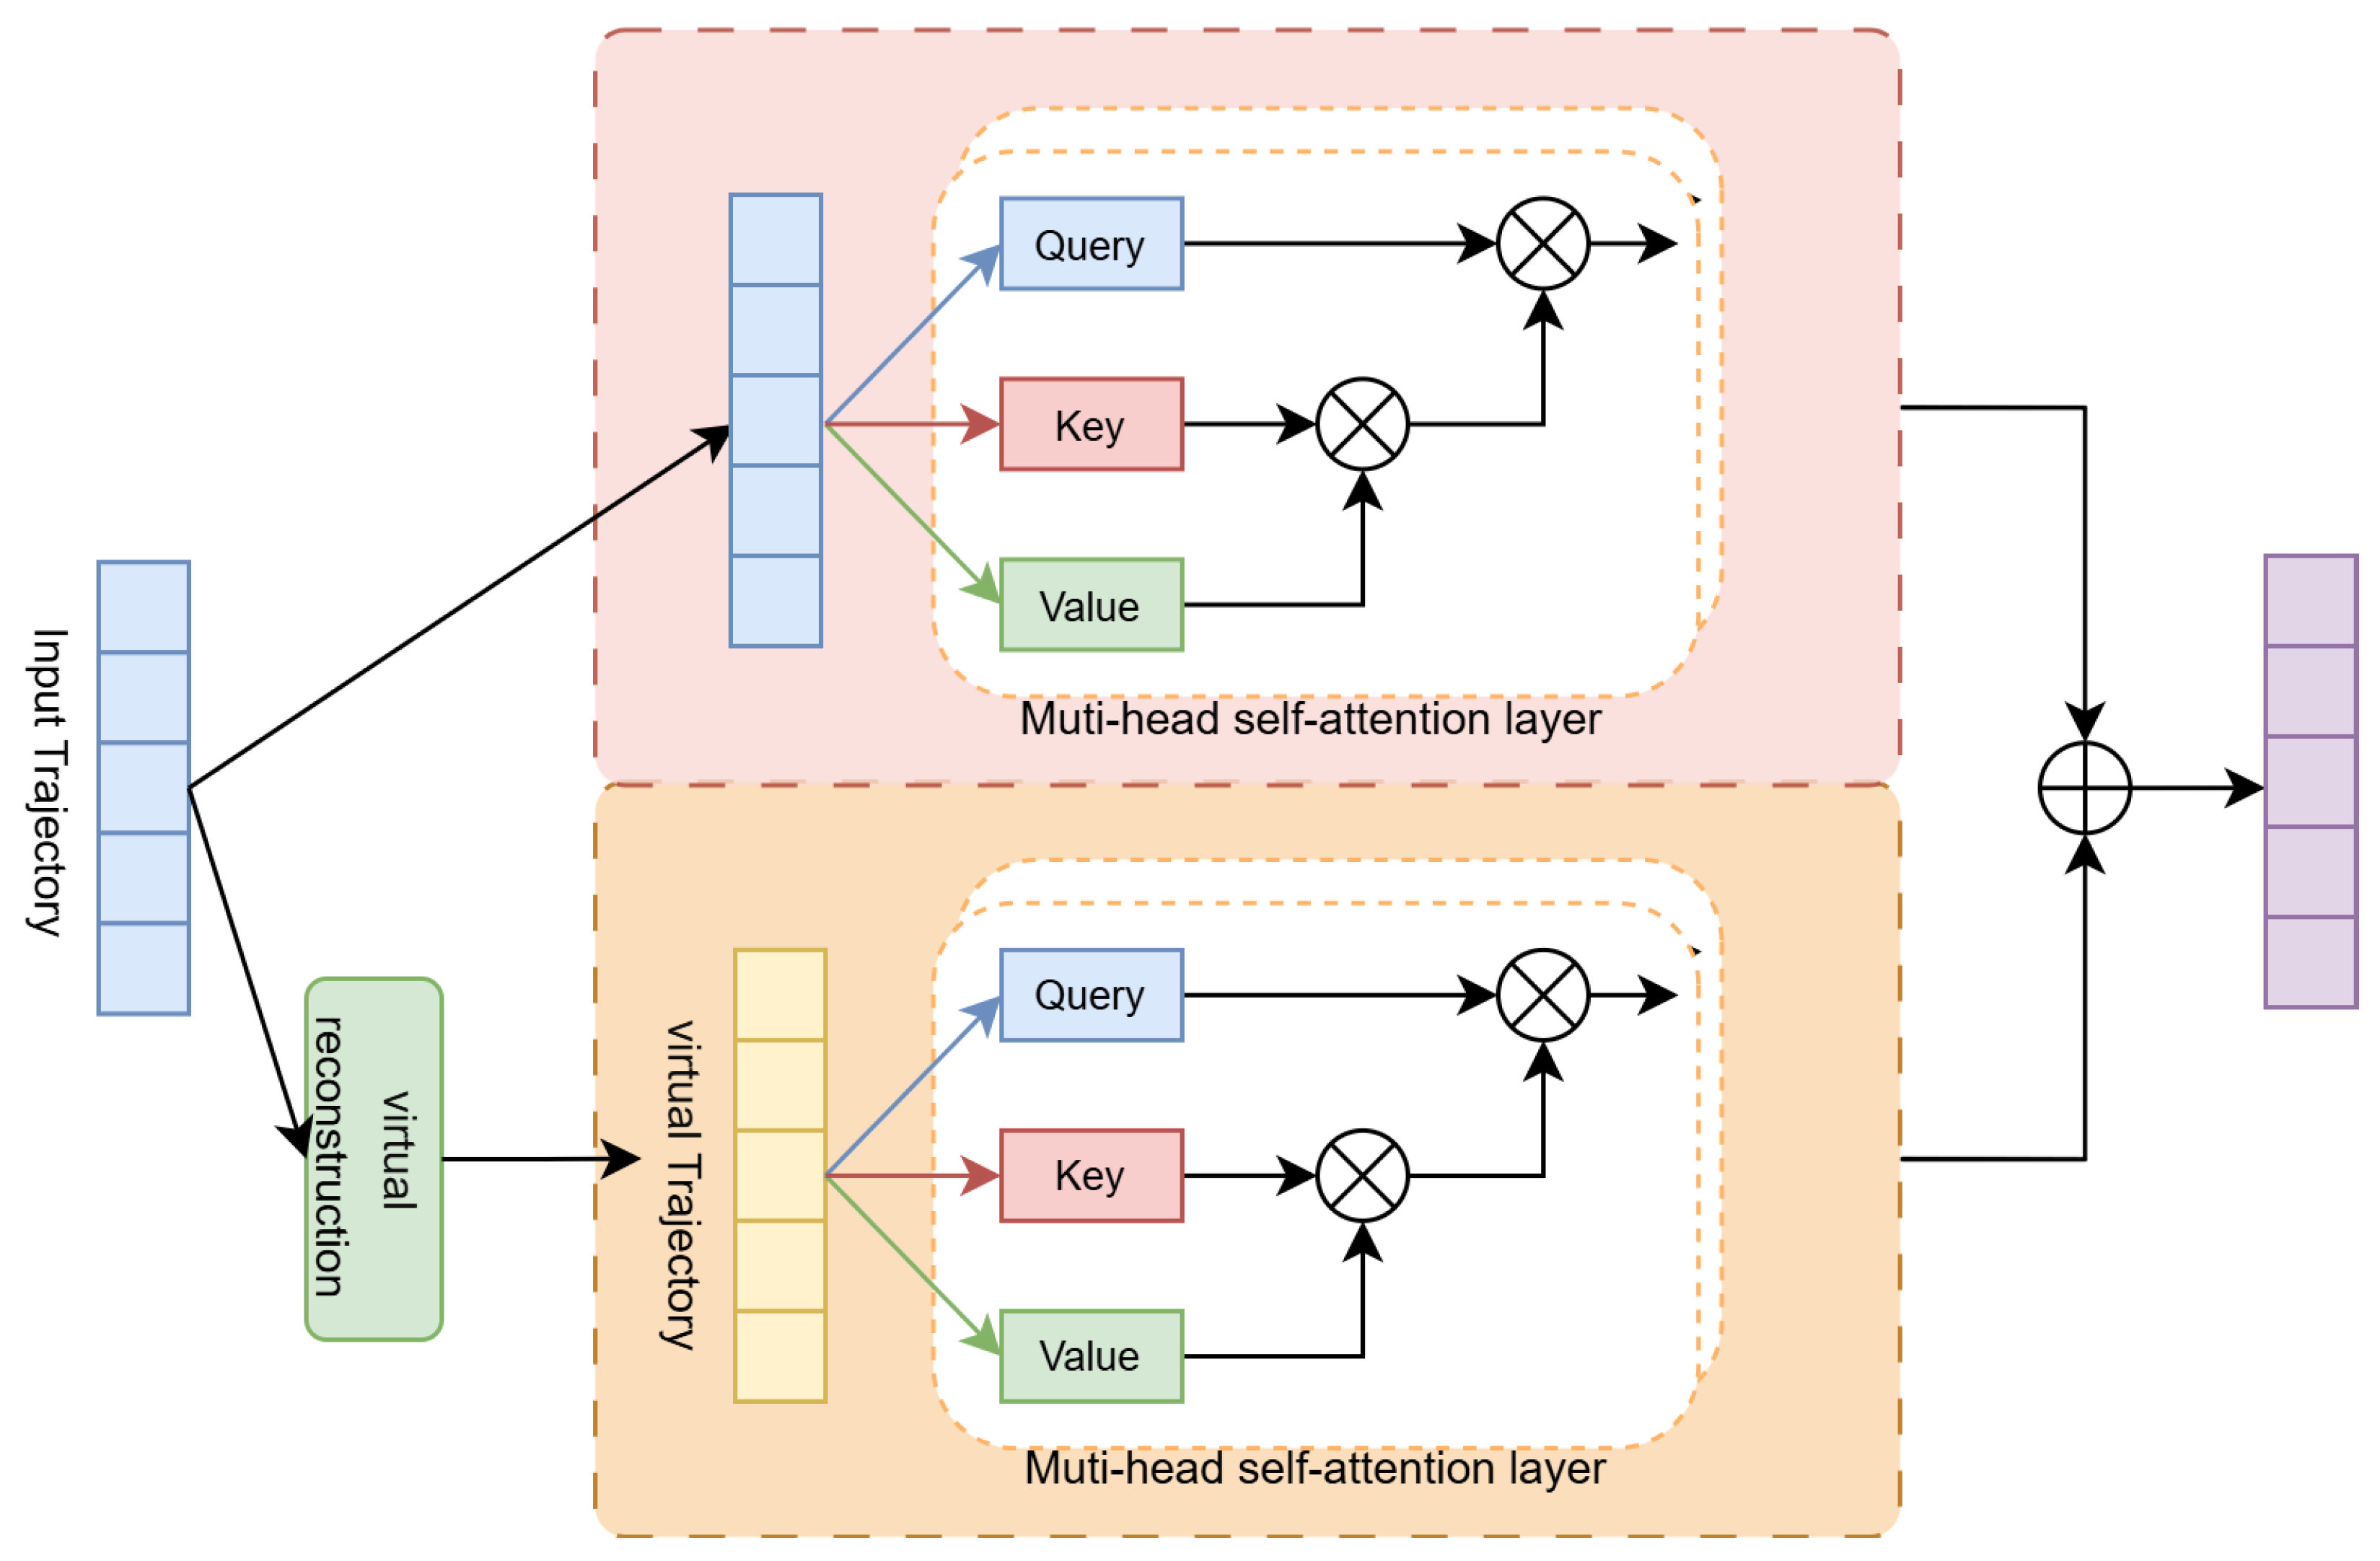
  • The proposed DGSA module includes both fine-grained and coarse-grained self-attention layers. The coarse-grained self-attention layer has a virtual trajectory construction operation, which transforms multiple check-in items into a coarse-grained virtual check-in. In this way, the collective influence of multiple check-ins within the sequence can be modeled to analyze users’ preferences.
  • Experiments conducted on the Foursquare-NYC and Foursquare-TKY [10] datasets demonstrate that our proposed method outperforms most existing methods.
The remainder of this paper is organized as follows. Section 2 provides an overview of related work on the next POI recommendation. Section 3 describes the task and provides some definitions. An overview of the proposed model (GEDGSA) is introduced in Section 4. Section 5 presents and analyzes the experimental results. Finally, the paper is concluded in Section 6.

2. Related Work

2.1. POI Recommendation

Traditional POI recommendation tasks aim to provide users with a list of POIs in which they may be interested. Collaborative filtering (CF) and matrix factorization (MF) methods were primarily utilized in early research. Liu et al. [11] introduced a model for learning geographical preferences whereby users’ preferences for different geographical locations are derived from their historical behavior. Gao et al. [12] adopted a content-aware approach to consider the content information of POI for recommendation. Similarly, Lian et al. [13] employed a content-aware collaborative filtering method to combine user geographical locations with interesting content information. However, the performance of these models was limited due to data sparsity issues. Subsequent research found that integrating spatiotemporal information into user check-in sequences helps alleviate data sparsity issues. Li et al. [14] proposed Rank-geofm to integrate spatiotemporal information into users’ check-in sequences, followed by correctly ranking POIs for factorization. Zhao et al. [15] employed Geo-Teaser to capture users’ movement trajectories in space and time for POI prediction through geographical-temporal sequence embeddings. However, due to the severe sparsity of user check-in data, these traditional methods still face challenges related to insufficient data.

2.2. Next POI Recommendation

Compared to traditional POI recommendations, the next POI recommendation focuses more on identifying the next POI that users may visit. It is crucial to pay attention to the temporal relationship in the check-in sequence. Early research extensively utilized Markov chains to simulate sequence influences. Cheng et al. [16] proposed a personalized Markov chain model to decompose users’ behavior within sequence data and predict the next POI in a time sequence. Similarly, Zhang et al. [17] utilized Markov chains to simulate sequential influence propagation and predict sequential transmission probabilities. Subsequent studies [18,19] employed matrix factorization models to model sequence data using relations among users, POIs, and time.
However, the modeling capabilities of these early methods were relatively limited. RNNs and their variants are widely used for the next POI recommendation due to their excellent sequence modeling capabilities. Liu et al. [20] proposed ST-RNN to integrate spatial and temporal information into the RNN during the learning process. This integration is achieved through the use of geographic distance transformation matrices and time transformation matrices for spatiotemporal modeling. Yang et al. [21] proposed an approach leveraging both user trajectories and social networks to complement one another. RNN and gate recurrent unit (GRU) models were employed to capture the sequential dependencies in user movement trajectories as they were generated. Another method [22] enhanced ordinary LSTM models through the introduction of a spatiotemporal gating mechanism. The spatial and temporal intervals of user historical trajectory data are modeled to capture spatiotemporal information.

2.3. Long and Short-Term Preference Modeling for POI Recommendation

Modeling long-term and short-term preferences is a common technique in recommendation systems. Users’ preferences are modeled by analyzing their historical behavioral data. The attention mechanism can automatically focus on important information in input sequences. It was applied to model users’ preferences in the next POI recommendation tasks. Jiang et al. [23] introduced a two-layer hierarchical attention network (SHAN) to capture the spatiotemporal information of user check-in sequences. This approach allows for the modeling of both long-term and short-term preferences, reflecting users’ dynamic preferences. Li et al. [24] presented a standard LSTM model to mine users’ short-term trajectories. Wu et al. [3] proposed PLSPL, which utilized the attention mechanism to learn users’ long-term preferences and employed LSTM to learn users’ short-term preferences; these preferences are then combined through personalized linear layers. Qu et al. [25] enhanced the learning of spatiotemporal relationships between user check-ins by incorporating grid-difference and time-sensitivity learning mechanisms into the attention network.
Inspired by the approaches described above, we first constructed a global POI transition graph of user movements based on check-in data from all users to uncover common patterns in user check-ins. This alleviates modeling difficulties caused by the scarcity of individual user check-in data. Additionally, user preferences are learned simultaneously from both fine-grained and coarse-grained perspectives through the DGSA module. Virtual check-in trajectories are constructed for users by reconstructing multiple consecutive check-ins into a single coarse-grained check-in. This approach considers both the individual significance of each check-in item and the collective importance of groups of check-ins. Finally, users’ long-term and short-term preferences are integrated in a personalized manner.

3. Problem Definition

In this section, the next POI recommendation problem will be introduced, and relevant concepts and definitions will be provided. Let U = { u 1 , u 2 , , u N } be a set of users, L = { l 1 , l 2 , , l M } be a set of POIs, and T = { t 1 , t 2 , , t K } be a set of slots, where M, N, and K are the total number of users, locations, and slots, respectively. Each POI l L is denoted by a tuple l = < I D , c a t > of a unique ID and POI category label, respectively. The main notations and their explanations are listed in Table 1. The definitions of key concepts are as follows.
Definition 1
(User). A user is uniquely identified by an identifier.
Definition 2
(POI). A POI is a unique geographical location, and it can be defined as a two-tuple l = < I D , c a t > , which represents its unique ID and POI category label, respectively.
Definition 3
(Check-in). A check-in can be defined as a four-tuple q =   < u , l , t > , representing where the user u has visited a POI l of category c at time slot t.
Definition 4
(Check-in Sequence). A check-in sequence can be represented as a set of check-in records ordered by a timestamp, which is defined as S u = ( q 1 u , q 2 u , q 3 u , ) . It contains all the check-in activities of the user u U , where q i u represents the i-th check-in record.
Definition 5
(Time Slot). The fine granularity of timestamps makes it difficult to model and capture the temporal behavior patterns of users. The check-in timestamps are mapped to time slots T.
For the next POI recommendation model proposed in this paper. The main goal is to provide the target user with a list of possible POIs they may visit next by exploring the check-in records. More formally, given a set of historical trajectories { S i u } u U , and a set of historic check-ins S u of user u, where q i u represents the i-th check-in record. The goal of the next POI recommendation is to select the top-N POIs from the set L, which the user u is most likely to visit at the next timestamp.

4. Proposed Method

4.1. Model Structure Overview

The proposed model GEDGSA is employed to solve the problem of the next POI recommendation. The overall framework is illustrated in Figure 1. The model consists of three modules: (1) The graph-enhanced embedding module constructs a global POI transition graph using the check-in data from all users. The graph learns general transition patterns, enhancing the representation of POI embedding vectors. (2) The user’s preference modeling module captures users’ long-term preferences using DGSA, while LSTM is utilized to model users’ short-term preferences. (3) The POI recommendation module makes predictions for the user’s next check-in POI and POI category, which are generated through two multi-layer perceptron (MLP) layers. These predictions form a personalized POI recommendation list via joint training.
The fundamental idea of our method is to analyze users’ historical check-in data and the contextual information it contains. This analysis aims to obtain POI embedding vectors that encapsulate critical information. These vectors are integrated into the user’s check-in trajectory to derive a feature vector for user trajectories, enabling the learning of user preferences. This enables the prediction of POIs that users may find interesting and the generation of personalized POI recommendation lists. First, a global POI transition graph is constructed based on all users’ historical check-in data. Subsequently, the graph convolutional network (GCN) is trained to generate POI feature embeddings that reflect the general transition patterns of users. The POI spatiotemporal feature embeddings are then combined to obtain the final POI embedding vectors. Next, the user trajectory is input into the user preference learning module. In this module, an LSTM model is employed to learn users’ short-term preferences, and DGSA is utilized to learn their long-term preferences. Finally, users’ long-term and short-term preferences are integrated using personalized weight vectors, resulting in their final preferences. The MLP is then utilized to generate POI predictions.

4.2. Graph-Enhanced Embedding Module

Dense embedding vectors containing more information are first generated by this module from user IDs, POI IDs, category IDs, and timestamps. Then, a global POI transition graph is constructed based on the historical check-in sequences of all users. This graph is used to learn the general transition patterns of user movements, resulting in POI feature vectors that encapsulate these patterns. Finally, it integrates the spatiotemporal information from the user’s historical trajectory to derive the feature vector of the user’s check-in sequence.

4.2.1. Multimodal Feature Embedding

Due to the high sparsity of one-hot vectors representing user IDs, POI IDs, and category IDs, the efficiency of model learning is affected. Based on word2vec [26], these sparse vectors are mapped into low-dimensional feature vectors, denoted as e u R d , e l R d ,   e c R d , respectively. The timestamp information of check-ins is continuous and difficult to embed directly, requiring it to be first mapped into 48 time slots before embedding. Specifically, the 24 h of a day are divided into 24 time slots, with the timestamps mapped to the corresponding time slots. Additionally, the time slots for weekends are first mapped similarly and then increased by 24 slots to distinguish them from weekdays. Finally, the time slot is denoted as e t R d . The embeddings of POI IDs and category IDs are combined through element-wise addition, which initializes the node embedding features of the subsequent global graph.

4.2.2. Learning with POI Transfer Graph

The scarcity of user check-in data often leads to overfitting when modeling and learning are based solely on individual user data. It is recognized that users in the same area frequently display common characteristics in their activities. For instance, on weekdays, many users tend to follow a typical pattern. They commute to work in the morning, dine at a restaurant for lunch, return home for a nap, go back to work in the afternoon, and then engage in entertainment activities after work. This illustrates a common transition pattern shared by many users. By learning these public transition patterns and integrating them into individual models, we can effectively mitigate the overfitting issues arising from data scarcity.
As shown in Figure 2, the historical check-in sequences of all users are used to build a global POI transition graph. The graph is defined as a directed graph G g = V g , E g , where V g = L contains the set of all POIs in L that have been checked in by users. E g indicates the edge set, where each directed edge e g E g corresponds to pairs of POIs continuously visited by users in the check-in sequence. The weight of each edge reflects the frequency of consecutive check-ins at the POIs. It is defined as shown in Equation (1).
w i j = N ( l i l j ) k N ( i ) N ( l i l k ) ,
where N ( l i l j ) is the number of times users consecutively check in from l i to l j , and N ( i ) is the set of neighboring locations of l i .
The GCN is utilized to better represent the topological information in the graph. First, the adjacency matrix A g R N × N is constructed based on the global POI transition graph. Self-loops are then added to the adjacency matrix to ensure that each node can transmit information to itself during information propagation, thus preserving its features. Subsequently, the degree matrix is updated to compute the normalized adjacency matrix. It is defined as shown in Equations (2)–(4).
A ˜ = A + I N ,
D ˜ i i = j = 1 N A i j ˜ ,
A ^ = D ˜ 1 2 A ˜ D ˜ 1 2 ,
where D ˜ is the degree matrix, and I N is the identity matrix of G g . The input node feature matrix is denoted as H T ( 0 ) = X T .
The neighborhood information of nodes is aggregated with their embedding information through GCN layers to better integrate the structural information of the graph. The propagation rule between GCN layers is defined as Equation (5).
H ( l ) = σ ( A ^ H ( l 1 ) W ( l ) + b ( l ) ) ,
where H ( l 1 ) denotes the input signals of the l-th layer. W ( l ) represents the model weights matrix of the l-th layer. b ( l ) denotes the corresponding bias at the l-th layer. σ is a leaky ReLU activation function.
Finally, the spatiotemporal information from user trajectories is integrated into the POI embedding vectors obtained through GCN, which will be used for subsequent user preference modeling.

4.3. Long-Term Preference Learning

The DGSA is proposed to learn users’ long-term preferences, as illustrated in Figure 3. Due to the inherent characteristics of attention mechanisms, attention can only be computed at the level of individual check-ins when modeling check-in sequences. The attention score is calculated for each check-in individually rather than for multiple consecutive check-ins as a whole. To address this, the construction of virtual trajectories is introduced to capture this collective influence. This allows the model to simultaneously represent user preferences from both fine-grained and coarse-grained perspectives. Finally, by stacking layers of multi-head self-attention mechanisms, more complex interaction patterns among users are captured.

4.3.1. DGSA Layer

Considering the long-range dependencies characteristic of long-term sequences, attention mechanisms are chosen to learn long-term preferences. This helps to avoid gradient vanishing and reduces the impact of noisy data. Due to the complexity of long-term preferences, a multi-head self-attention mechanism is employed to model long sequences. Each head in the multi-head attention mechanism is capable of focusing on different parts of the sequence or various types of relationships. This capability allows the mechanism to capture more complex relational patterns and enhance the model’s expressiveness. The self-attention mechanism enables each item in the sequence to attend to all other items, thereby providing a more comprehensive understanding of the contextual information. Fine-grained self-attention layers are used to capture individual influences within the sequence, while coarse-grained self-attention layers capture collective influences. By modeling at two levels of granularity, user preferences implicit in the sequence information can be analyzed more accurately.
The multi-head attention mechanism captures information from different subspaces through multiple parallel self-attention heads. For fine-grained self-attention layers, the query, key, and value matrices are first calculated for each attention head based on the input vector X R N × d . Next, the attention scores are computed for each head, and finally, the outputs of all heads are concatenated, as shown in Equations (6)–(8).
Q h f = X W h Q , K h f = X W h K , V h f = X W h V ,
A t t h f ( Q h f , K h f , V h f ) = s o f t m a x ( Q h f ( K h f ) T d / h ) ,
F i n e A t t ( Q , K , V ) = C o n c a t ( A t t 1 f , A t t 2 f , , A t t n f ) W O ,
where W h Q , W h K , and W h V are learnable weight matrices corresponding to “query”, “key”, and “value”, respectively. h is the number of multi-head attention mechanism heads.
Unlike the fine-grained self-attention layer, the coarse-grained self-attention layer is designed to capture the collective influence of multiple check-in items. Due to the inherent limitations of the attention mechanism, this influence cannot be directly calculated. Therefore, the operation of constructing virtual trajectories is proposed. Collective influence typically arises from consecutive check-in items. Therefore, each coarse-grained virtual check-in item in the new virtual trajectory is transformed from multiple consecutive check-in items.
Given the input sequence X = [ X 1 , X 2 , , X N ] , each check-in item is first transformed. This transformation involves combining it with the preceding and following check-ins to create a coarse-grained virtual check-in item. The operation is defined as in Equations (9)–(11):
X = [ X 1 , X 2 , , X N ] ,
X i = [ X i 1 , X i , X i + 1 ] ,
X i t = f t ( X t ) ,
where f t is the transformation function used to convert multiple consecutive check-ins into a new virtual check-in item to generate a coarse-grained representation. In this paper, this function is achieved through a linear layer. For the first and last check-in items in the sequence, zero-padding is applied to maintain dimensional consistency with other items during transformation. After all check-ins are converted into coarse-grained virtual check-in items, a new virtual check-in sequence is formed. The virtual check-in sequence is then analyzed using a multi-head self-attention mechanism. An importance score for each virtual check-in item is calculated, representing the collective influence of multiple check-ins as a group. Formally, the coarse-grained self-attention layer scores are calculated as Equations (12)–(14):
Q h c = f t ( X ) W h Q , K h c = f l ( X ) W h K , V h c = f l ( X ) W h V ,
A t t h c ( Q h c , K h c , V h c ) = s o f t m a x ( Q h c ( K h c ) T d / h ) ,
C o a r s e A t t ( Q , K , V ) = C o n c a t ( A t t 1 c , A t t 2 c , , A t t h c ) W O ,
where W h Q , W h K , and W h V are learnable weight matrices corresponding to “query”, “key”, and “value”, respectively. h is the number of multi-head attention mechanism heads.

4.3.2. Stacking DGSA Layers

One essential issue is that as the model deepens, training may become increasingly challenging. Layer normalization and residual connections are commonly employed in the design of deep neural networks to enhance training stability and accelerate model convergence. Consequently, layer normalization and residual connections are incorporated into DGSA layers. Additionally, dropout regularization is utilized to prevent overfitting during training, which involves randomly dropping neurons throughout the training process. The stack operation is shown in Equations (15)–(17).
O l = S D G S A ( O l 1 ) , l [ 1 , 2 , , L ] ,
S D G S A ( O 1 ) = L a y e r N o r m ( D 1 + D r o p o u t ( F C ( D 1 ) ) ,
F C ( D 1 ) = L U ( W 1 D 1 + b 1 ) W 2 + b 2 ,
where L denotes the number of DGSA layers. Furthermore, the input for the first DGSA layer is derived from the output of the multimodal feature embedding and fusion module. Finally, the output vector of the DGSA is represented as P l , denoting users’ long-term preferences.
The impact of check-in items is analyzed from both fine-grained and coarse-grained perspectives using DGSA layers. Both individual and collective importance scores are computed for each check-in item. The multi-head attention mechanism reduces noise introduced by the construction of virtual trajectories. It also enables each head to model sequence information from distinct aspects, enhancing the model’s expressive power.

4.4. Short-Term Preference Learning

Given the excellent performance of LSTM in sequence modeling, LSTM is employed to learn users’ short-term preferences. This approach leverages the strengths of LSTM while avoiding the gradient vanishing problem in modeling long sequences. The modeling of users’ short-term preferences using LSTM is discussed as Equations (18)–(23):
i t = σ ( W i [ h t 1 , x t ] + b i ) ,
f t = σ ( W f [ h t 1 , x t ] + b f ) ,
c ˜ t = tanh ( W c [ h t 1 , x t ] + b c ) ,
c t = f t c t 1 + i t c ˜ t ,
o t = σ ( W o [ h t 1 , x t ] + b o ) ,
h t = o t tanh ( c t ) ,
where x t denotes the input vector. h t represents the hidden state at time step t. i t , f t , and o t represent the input gate, forget gate, and output gate of the time step, determining what information to store, forget, and output, respectively. c ˜ t denotes the candidate cell state at time step t, and c t represents the cell state at time step t. ⊙ denotes element-wise multiplication of two vectors. Finally, the output vector of the LSTM model is represented as P s , which indicates the users’ short-term preference.
Considering the personalized preference dependencies among different users, the integration of long-term and short-term preferences involves learning personalized weights for each user. Specifically, personalized weights are learned for each user to apply to the long-term preference vector, reflecting each user’s unique dependency patterns. The final probability for the next POI is subsequently obtained through a linear combination of the personalized weights and preference vectors, as shown in Equation (24).
P = α * P l + P s ,
where P l represents user’s long-term preference, P s represents user’s short-term preference, and α is a learnable parameter that involves weights for each user.

4.5. Model Training

The modeling of preferences for different users has been discussed. To predict users’ next action, two separate MLPs are employed: one for predicting the next POI and another for predicting the category. Users’ preference vectors are inputted into both the next POI prediction MLP and the next category prediction MLP. This process generates probabilities for each candidate POI and candidate category in the recommendation list, as shown in Equations (25) and (26).
Y ^ p o i = W p o i P + b p o i ,
Y ^ c a t = W c a t P + b c a t ,
where W p o i and W c a t represent the weights in the MLP. In this paper, the binary cross-entropy loss is employed as the loss function, with an additional regularization term to prevent overfitting during training. The loss function computes the weighted sum of the losses associated with the next POI prediction and the next category prediction. It is defined as shown in Equations (27)–(29).
L p o i = i = 1 M j = 1 N Y p o i log ( Y ^ p o i ) + ( 1 Y p o i ) log ( 1 Y ^ p o i ) ,
L c a t = i = 1 M j = 1 N Y c a t log ( Y ^ c a t ) + ( 1 Y c a t ) log ( 1 Y ^ c a t ) ,
L = L p o i + μ L c a t + λ | | Θ | | 2 2 ,
where Y p o i and Y c a t represent the next POI and category that the user visits actually, respectively. μ represents the scaling factor for the category loss. | | Θ | | 2 2 is the regularization term to avoid overfitting.
A neural network model for the next POI recommendation has been constructed through the joint recommendation and training design described above. This model accounts for the user’s historical check-in sequence and its associated spatiotemporal context information. The probability of the user checking into various POIs within the candidate set at the next timestamp is then predicted.

5. Experiments

5.1. Datasets

GEDGSA was evaluated on the publicly available datasets Foursquare-NYC and Foursquare-TKY [10]. Each check-in record in the dataset includes a user ID, a POI ID, a category ID, a timestamp, and the latitude and longitude of the POI, among others. Prior to conducting the experiments, preprocessing was performed on the data to reduce noise interference by removing POIs and users with fewer than 10 check-ins. The statistics of the preprocessed data are presented in Table 2. Subsequently, the data was divided by user, and each user’s check-in data was sorted in ascending order of time. The first 80% of each user’s check-in records were then used as the training set, while the remaining 20% served as the test set.

5.2. Baseline Models

To illustrate the effectiveness of GEDGSA, several relevant next POI recommendation models are selected as baseline comparisons. The descriptions of the baseline models are provided as follows:
LSTM [27] is a variant of the RNN model commonly employed for processing sequence data. It addresses the issue of vanishing gradients often encountered in traditional RNN models.
ST-RNN [20] utilizes time transformation and distance transformation matrices to model the spatiotemporal aspects of POIs and captures user behavior patterns through an RNN model.
SHAN [28] is a two-layer hierarchical attention network is used to learn the implicit user preferences within check-in sequences. The first layer is designed to capture users’ long-term preferences, while the second layer integrates both long-term and short-term preferences.
DeepMove [6] utilizes an attention mechanism and RNN modules to learn users’ long-term and short-term preferences.
PLSPL [3] employs an attention mechanism to learn users’ long-term preferences and LSTM to learn their short-term preferences, combining both through personalized linear layers.

5.3. Evaluation Metrics

Hit@k and MAP@k are common metrics in recommender systems. Hit@k indicates the number of correct samples predicted within the top k recommendations in the test set and is used to measure the accuracy of the model’s predictions. MAP@k indicates the ranking of correct samples i in the model’s recommendation list and is used to measure the performance of the model in ranking recommendations. The higher both metrics are, the better performance they have. The formulas for these metrics are presented as shown in Equations (30) and (31).
H i t @ k = 1 N u = 1 N | S u ( k ) V u | | V u | ,
M A P @ k = 1 N u = 1 N | S u ( k ) V u | p o s s i o n ,
where N represents the number of users in the test set. k = { 1 , 5 , 10 , 20 } represents the length of the recommended POI list by the model. S u ( k ) denotes the top-k POIs recommended to user u. V u represents the set of POIs that user u visits actually at the next timestamp in the test set.

5.4. Parameter Settings

The key hyperparameter settings in the model are as follows: The embedding dimension for both users and POIs is set to 128. The maximum input length for the check-in sequence is limited to 50. The model incorporates 48 time slots for time intervals. For the GCN model, three hidden layers were utilized, comprising 32, 64, and 128 channels in each layer, respectively. Additionally, Dropout was enabled with a rate of 0.3. The DGSA module is stacked with two layers and utilizes the Adam optimizer with a learning rate of 1 × 10 3 and a weight decay rate of 5 × 10 3 . Both the fine-grained and coarse-grained self-attention mechanisms employ two attention heads.

5.5. Comparison with Baselines

The results of the performance comparison between our model and the baseline models across the two datasets are presented in Table 3. Our method outperforms all baseline methods across all metrics and both datasets. Taking HIT@5 and MAP@5 as examples, DGSALS achieves improvements of 16.14% and 11.63% over the best baseline method for NYC and 12.76% and 8.24% for TKY, respectively.
The time and distance transformation matrix are employed by ST-RNN to model the spatiotemporal aspects of POIs, integrating this information through an RNN model. However, matrix operations are limited in capturing contextual information within sparse data. RNNs frequently encounter gradient vanishing when processing long sequences, constraining their ability to model long-term sequence features. A hierarchical attention mechanism is employed by SHAN to model user preferences in sequence data. This effectively mitigates the gradient vanishing issue often encountered with long sequences. By assigning variable importance to sequence items, SHAN reduces noise, yielding more accurate preference modeling. Nonetheless, the attention mechanism’s inability to encode positional information may lead to overlooking temporal dependencies, which are crucial in next POI recommendation tasks. The LSTM model, a variant of RNN, effectively mitigates the gradient vanishing issue in long sequences and preserves temporal information. It is particularly well-suited for handling sequential data and modeling both long-term and short-term patterns. As a result, it achieves higher performance metrics than ST-RNN and SHAN on two datasets.
DeepMove employs GRU and an attention mechanism to process mobile trajectory data. The spatiotemporal dependencies are captured by the GRU, and the attention mechanism enables the model to automatically focus on the most relevant trajectory information. PLSPL employs an attention module to model users’ long-term preferences and utilizes two LSTM modules to learn short-term preferences. Finally, a personalized linear layer integrates both aspects effectively. Both DeepMove and PLSPL demonstrate commendable performance. However, they overlook collaborative effects from other users’ check-in data, which could enhance individual user data. Additionally, they neglect the collective importance of check-ins when using attention mechanisms.
In this paper, a global POI transition graph is constructed using observable historical check-in data from all users. This graph captures general mobility patterns, which help to alleviate data sparsity. User preferences are modeled using LSTM and attention mechanisms. To address the limitations of conventional self-attention, the DGSA module is proposed to analyze the check-in sequence from both fine-grained and coarse-grained perspectives. This module considers both the individual significance of each check-in item and the collective importance of groups of check-ins. Virtual trajectories are constructed to model check-in sequences at a coarse-grained level, emphasizing collective check-in significance. Finally, personalized weight parameters are incorporated to adjust the balance between long-term and short-term preferences, accommodating varying dependencies across users.

5.6. Ablation Study

In order to verify the effectiveness of the proposed model (GEDGSA) and the roles and contributions of different modules in our model, four degraded models are derived by dismantling the modules of GEDGSA:
  • GEDGSA-G: Removing the global POI transition graph disregards the influence of global information from other users, embedding POIs directly for user preference modeling. The experimental results demonstrate the effectiveness of the global POI transition graph. The graph reveals common patterns in user mobility by extracting information from other users.
  • GEDGSA-S: Removing the short-term preference modeling module, employing only LSTM to model user preferences. The experimental results demonstrate the importance of LSTM in capturing temporal information from check-in sequences for user preference modeling.
  • GEDGSA-L: Removing the long-term preference modeling module, relying solely on the short-term modeling module to capture the user’s preference. Comparing its results with the complete model highlights the importance of the role of attention mechanisms. It can mitigate noise by assigning varying levels of importance to different items within the sequence.
  • GEDGSA-C: Removing the coarse-grained self-attention layer from long-term preference modeling, neglecting the collective influence of grouped check-ins, and considering only the individual impact of each check-in on target item. By comparing the results of this method, it can be proved that modeling user preferences by constructing virtual check-in items is effective. Analyzing user check-in sequences from a coarse-grained perspective further enhances this effectiveness.
In each experiment, the parameters remained consistent with those of the complete model, with only one module removed. The experimental results are shown in Table 4.
The results demonstrate that the complete model GEDGSA achieves the best performance on nearly all evaluation metrics across both datasets. However, the HIT@10 performance of the GEDGSA model on the NYC dataset is slightly lower than that of the GEDGSA-C model. Among these, the GEDGSA-L model performs the worst, indicating that the removal of long-term preference modeling significantly impacts performance. This can be attributed to the fact that, although the model learns common patterns of POI transitions through the global POI transition graph, it reflects collective preferences only to a limited extent. Furthermore, it fails to personalize long-term preference modeling for individual users, thus inadequately capturing their specific preferences. The performance of GEDGSA being inferior to that of GEDGSA-C on HIT@10 in the NYC dataset may be due to the model’s high complexity. This complexity likely results in overfitting due to the limited amount of data available in the NYC dataset. Additionally, other components contribute to the final recommendation results.

5.7. Hyperparameter Analysis

This section explores the impact of various hyperparameter values on the performance of the GEDGSA model, primarily focusing on two hyperparameters: (1) d i m , the dimension of the embedding feature vector; (2) μ , the scaling factor for the category loss in the loss function.
The results for the hyperparameter dim are presented in Figure 4. In the experiments, the value of dim is set to 32, 64, 96, 128, 160, or 192. It is observed that when d i m = 32 , the performance is relatively poor across both datasets. This is likely due to the small dimension, which hinders the learned feature vectors from effectively representing the current contextual information. As the dimension increases, the performance of the GEDGSA model gradually improves and stabilizes, with d i m = 128 approaching maximum performance.
The experiment of μ is conducted on the FourSquare-NYC dataset using different values ranging from 0.0 to 1.0, and the experimental results are shown in Table 5. The results indicate that when μ = 0.3 , the performance approaches optimal levels. Consequently, the value of μ is set to 0.3 in this paper.

6. Conclusions

In this paper, a graph-enhanced dual-granularity self-attention (GEDGSA) model is proposed for the next POI recommendation. A global POI transition graph is constructed by the model using the historical check-in data of all users. Common transition patterns are captured in this graph to enhance the embedded representations of user check-in sequences. Additionally, user preferences are modeled by the DGSA module from both fine-grained and coarse-grained perspectives. A virtual trajectory construction operation is introduced in the coarse-grained self-attention layer. This operation converts multiple check-ins into a single coarse-grained virtual check-in to simulate collective influences. The effectiveness of these operations is demonstrated through ablation experiments conducted in the experimental section. Since the global POI transition graph inherently reflects the spatiotemporal relationships between POIs. The spatiotemporal information from check-in data was not embedded into the graph for learning.

Author Contributions

Conceptualization, H.W.; methodology, H.W.; software, H.W.; validation, H.W.; formal analysis, H.W.; investigation, H.W.; resources, H.W.; data curation, H.W.; writing—original draft preparation, H.W.; writing—review and editing, M.X.; visualization, H.W.; supervision, M.X.; project administration, M.X.; funding acquisition, M.X. All authors have read and agreed to the published version of the manuscript.

Funding

This research was funded by the National Natural Science Foundation of China, grant numbers 61074135, 61303096, and 71101086.

Data Availability Statement

The data presented in this study are available in the references [10].

Conflicts of Interest

The authors declare that they have no conflicts of interest to report regarding the present study.

References

  1. Shi, H.; Chen, L.; Xu, Z.; Lyu, D. Personalized location recommendation using mobile phone usage information. Appl. Intell. 2019, 49, 3694–3707. [Google Scholar] [CrossRef]
  2. Han, P.; Shang, S.; Sun, A.; Zhao, P.; Zheng, K.; Zhang, X. Point-of-interest recommendation with global and local context. IEEE Trans. Knowl. Data Eng. 2021, 34, 5484–5495. [Google Scholar]
  3. Wu, Y.; Li, K.; Zhao, G.; Qian, X. Personalized long-and short-term preference learning for next POI recommendation. IEEE Trans. Knowl. Data Eng. 2020, 34, 1944–1957. [Google Scholar]
  4. Zhang, Z.; Li, C.; Wu, Z.; Sun, A.; Ye, D.; Luo, X. NEXT: A neural network framework for next POI recommendation. Front. Comput. Sci. 2020, 14, 314–333. [Google Scholar]
  5. Zhang, J.; Liu, X.; Zhou, X.; Chu, X. Leveraging graph neural networks for point-of-interest recommendations. Neurocomputing 2021, 462, 1–13. [Google Scholar] [CrossRef]
  6. Feng, J.; Li, Y.; Zhang, C.; Sun, F.; Meng, F.; Guo, A.; Jin, D. Deepmove: Predicting human mobility with attentional recurrent networks. In Proceedings of the 2018 World Wide Web Conference, Geneva, Switzerland, 23–27 April 2018; pp. 1459–1468. [Google Scholar]
  7. Luo, Y.; Liu, Q.; Liu, Z. STAN: Spatio-temporal attention network for next location recommendation. In Proceedings of the Web Conference 2021, New York, NY, USA, 17–21 May 2021; pp. 2177–2185. [Google Scholar]
  8. Bashir, S.R.; Raza, S.; Misic, V.B. BERT4Loc: BERT for Location—POI recommender system. Future Internet 2023, 15, 213. [Google Scholar] [CrossRef]
  9. Yang, S.; Liu, J.; Zhao, K. GETNext: Trajectory flow map enhanced transformer for next POI recommendation. In Proceedings of the 45th International ACM SIGIR Conference on Research and Development in Information Retrieval, New York, NY, USA, 11–15 July 2022; pp. 1144–1153. [Google Scholar]
  10. Yang, D.; Zhang, D.; Zheng, V.W.; Yu, Z. Modeling user activity preference by leveraging user spatial temporal characteristics in LBSNs. IEEE Trans. Syst. Man Cybern. Syst. 2014, 45, 129–142. [Google Scholar] [CrossRef]
  11. Liu, B.; Fu, Y.; Yao, Z.; Xiong, H. Learning geographical preferences for point-of-interest recommendation. In Proceedings of the 19th ACM SIGKDD International Conference on Knowledge Discovery and Data Mining, New York, NY, USA, 11–14 August 2013; pp. 1043–1051. [Google Scholar]
  12. Gao, H.; Tang, J.; Hu, X.; Liu, H. Content-aware point of interest recommendation on location-based social networks. In Proceedings of the AAAI Conference on Artificial Intelligence, San Francisco, CA, USA, 25–29 January 2015; AAAI Press: Palo Alto, CA, USA, 2015; Volume 29. [Google Scholar]
  13. Lian, D.; Ge, Y.; Zhang, F.; Yuan, N.J.; Xie, X.; Zhou, T.; Rui, Y. Content-aware collaborative filtering for location recommendation based on human mobility data. In Proceedings of the 2015 IEEE International Conference on Data Mining, Atlantic City, NJ, USA, 14–17 November 2015; IEEE: New York, NY, USA, 2015; pp. 261–270. [Google Scholar]
  14. Li, X.; Cong, G.; Li, X.L.; Pham, T.A.N.; Krishnaswamy, S. Rank-geofm: A ranking based geographical factorization method for point of interest recommendation. In Proceedings of the 38th International ACM SIGIR Conference on Research and Development in Information Retrieval, Santiago, Chile, 9–13 August 2015; pp. 433–442. [Google Scholar]
  15. Zhao, S.; Zhao, T.; King, I.; Lyu, M.R. Geo-teaser: Geo-temporal sequential embedding rank for point-of-interest recommendation. In Proceedings of the 26th International Conference on World Wide Web Companion, Geneva, Switzerland, 3–7 April 2017; pp. 153–162. [Google Scholar]
  16. Cheng, C.; Yang, H.; Lyu, M.R.; King, I. Where you like to go next: Successive point-of-interest recommendation. In Proceedings of the Twenty-Third International Joint Conference on Artificial Intelligence, Beijing, China, 3–9 August 2013; AAAI Press: Palo Alto, CA, USA, 2013; pp. 2605–2611. [Google Scholar]
  17. Zhang, J.D.; Chow, C.Y.; Li, Y. Lore: Exploiting sequential influence for location recommendations. In Proceedings of the 22nd ACM SIGSPATIAL International Conference on Advances in Geographic Information Systems, Dallas, TX, USA, 4–7 November 2014; pp. 103–112. [Google Scholar]
  18. Liu, Y.; Liu, C.; Liu, B.; Qu, M.; Xiong, H. Unified point-of-interest recommendation with temporal interval assessment. In Proceedings of the 22nd ACM SIGKDD International Conference on Knowledge Discovery and Data Mining, San Francisco, CA, USA, 13–17 August 2016; pp. 1015–1024. [Google Scholar]
  19. Zhao, S.; Zhao, T.; Yang, H.; Lyu, M.; King, I. STELLAR: Spatial-temporal latent ranking for successive point-of-interest recommendation. In Proceedings of the AAAI Conference on Artificial Intelligence, Phoenix, AZ, USA, 12–17 February 2016; AAAI Press: Palo Alto, CA, USA, 2016; pp. 315–321. [Google Scholar]
  20. Liu, Q.; Wu, S.; Wang, L.; Tan, T. Predicting the next location: A recurrent model with spatial and temporal contexts. In Proceedings of the AAAI Conference on Artificial Intelligence, Phoenix, AZ, USA, 12–17 February 2016; Schuurmans, D., Wellman, M.P., Eds.; AAAI Press: Palo Alto, CA, USA, 2016; Volume 30. [Google Scholar]
  21. Yang, C.; Sun, M.; Zhao, W.X.; Liu, Z.; Chang, E.Y. A neural network approach to jointly modeling social networks and mobile trajectories. ACM Trans. Inf. Syst. (TOIS) 2017, 35, 1–28. [Google Scholar] [CrossRef]
  22. Zhao, P.; Luo, A.; Liu, Y.; Xu, J.; Li, Z.; Zhuang, F.; Sheng, V.S.; Zhou, X. Where to go next: A spatio-temporal gated network for next poi recommendation. IEEE Trans. Knowl. Data Eng. 2020, 34, 2512–2524. [Google Scholar] [CrossRef]
  23. Jiang, S.; He, W.; Cui, L.; Xu, Y.; Liu, L. Modeling long-and short-term user preferences via self-supervised learning for next poi recommendation. ACM Trans. Knowl. Discov. Data 2023, 17, 1–20. [Google Scholar]
  24. Li, Q.; Xu, X.; Liu, X.; Chen, Q. An attention-based spatiotemporal GGNN for next POI recommendation. IEEE Access 2022, 10, 26471–26480. [Google Scholar] [CrossRef]
  25. Ou, J.; Jin, H.; Wang, X.; Jiang, H.; Wang, X.; Zhou, C. STA-TCN: Spatial-temporal attention over temporal convolutional network for next point-of-interest recommendation. ACM Trans. Knowl. Discov. Data 2023, 17, 1–19. [Google Scholar] [CrossRef]
  26. Mikolov, T. Efficient estimation of word representations in vector space. arXiv 2013, arXiv:1301.3781. [Google Scholar]
  27. Graves, A. Long short-term memory. In Supervised Sequence Labelling with Recurrent Neural Networks; Springer: Berlin/Heidelberg, Germany, 2012; pp. 37–45. [Google Scholar]
  28. Ying, H.; Zhuang, F.; Zhang, F.; Liu, Y.; Xu, G.; Xie, X.; Xiong, H.; Wu, J. Sequential recommender system based on hierarchical attention network. In Proceedings of the IJCAI International Joint Conference on Artificial Intelligence, Stockholm, Sweden, 13–19 July 2018; AAAI Press: Palo Alto, CA, USA, 2018; pp. 3926–3932. [Google Scholar]
Figure 1. The overall framework of GEDGSA.
Electronics 14 01387 g001
Figure 2. The construction process of the global POI transition graph.
Electronics 14 01387 g002
Figure 3. The framework of the DGSA module.
Electronics 14 01387 g003
Figure 4. Impact of hyperparameter dim.: (a) d i m on Foursquare-NYC; (b) d i m on Foursquare-TKY.
Electronics 14 01387 g004
Table 1. Table of important symbols.
NotationContentDescription
U { u 1 , u 2 , , u N } The set of users
L { l 1 , l 2 , , l M } The set of POIs
T { t 1 , t 2 , , t K } The set of time slots
S u ( q 1 u , q 2 u , q 3 u , ) Check-in sequence for user u
q t u < u , l , t > The check-in of user u at t
G g < V g , E g > global POI transition graph
Table 2. Statistics of datasets.
DatasetUsersPOIsCategoriesRecords
NYC10835135314147,938
TKY22937873288447,570
Table 3. Results of GEDGSA and baselines.
DatasetModelHit@1Hit@5Hit@10Map@1Map@5Map@10
NYCST-RNN0.11030.21710.25800.14710.16140.1636
LSTM0.11470.24240.29160.16290.16950.1718
SHAN0.13530.17790.18960.15100.15260.1545
DeepMove0.14080.29460.36300.19750.20710.2101
PLSPL0.15590.32520.39530.21720.22660.2302
GEDGSA0.2401 0.48660.55960.33350.34360.3466
TKYST-RNN0.12040.24370.29270.16670.17330.1767
LSTM0.13390.27370.32950.18680.19420.1975
SHAN0.10840.15270.1840.12660.12870.1296
DeepMove0.12820.24880.29230.17350.17940.1820
PLSPL0.15710.33210.40200.22120.23070.2352
GEDGSA0.21280.45970.54080.30360.31460.3197
Bold values indicate the best performance across all models for each metric.
Table 4. Ablation study results of GEDGSA.
DatasetModelHit@1Hit@5Hit@10Map@5Map@10Map@20
NYCGEDGSA-G0.23920.48010.55220.33080.34070.3439
GEDGSA-S0.23080.48200.55860.32650.33740.3408
GEDGSA-L0.22810.45240.51250.31190.32010.3224
GEDGSA-C0.23180.48480.5605 0.32690.33720.3403
GEDGSA0.24010.48660.55960.33350.34360.3466
TKYGEDGSA-G0.21150.45010.53380.29890.31040.3147
GEDGSA-S0.20890.45050.53900.30140.31330.3171
GEDGSA-L0.18140.38160.46050.25610.26670.2707
GEDGSA-C0.21020.45400.53990.30070.31250.3172
GEDGSA0.21280.45970.54080.30360.31460.3197
Bold values indicate the best performance across all models for each metric.
Table 5. Impact of hyperparameter μ .
μ Hit@1Hit@5Hit@10MAP@5MAP@10MAP@20
0.00.23550.48660.55860.32970.33970.3428
0.10.23820.48480.56050.33150.34180.3444
0.20.23550.48660.56140.33030.34030.3443
0.30.2401 0.48660.55960.33350.34360.3466
0.40.23550.49030.55960.33230.34170.3449
0.50.23730.48660.56230.33180.34200.3448
0.60.23920.48750.56140.32890.34080.3458
0.70.23920.48660.55960.32820.34250.3456
0.80.23920.48940.55960.33220.34170.3449
0.90.23360.48940.55860.33190.34110.3433
1.00.23180.48290.56140.32810.33990.3419
Bold values indicate the optimal performance for each metric across different values of μ .
Disclaimer/Publisher’s Note: The statements, opinions and data contained in all publications are solely those of the individual author(s) and contributor(s) and not of MDPI and/or the editor(s). MDPI and/or the editor(s) disclaim responsibility for any injury to people or property resulting from any ideas, methods, instructions or products referred to in the content.

