Article

Low-Voltage Series Arc Fault Detection Based on Multi-Feature Fusion and Improved Residual Network

1
State Key Laboratory of Intelligent Power Distribution Equipment and System, Hebei University of Technology, Tianjin 300401, China
2
Provincial and Ministerial Co-Construction Collaborative Innovation Center on Reliability Technology of Electrical Products, Tianjin 300401, China
3
College of Electrical and Electronic Engineering, Wenzhou University, Wenzhou 325035, China
*
Author to whom correspondence should be addressed.
Electronics 2025, 14(7), 1325; https://doi.org/10.3390/electronics14071325
Submission received: 6 March 2025 / Revised: 21 March 2025 / Accepted: 25 March 2025 / Published: 27 March 2025

Abstract

Deep learning-based image classification techniques have been widely utilized in low-voltage AC series-type fault arc detection. However, the transformation of signals into images frequently leads to significant loss of current signal characteristics, thereby compromising arc recognition accuracy. Additionally, uncharacterized signal content may be lost due to multiple factors, including sensor bandwidth limitations, sensor-event distance, and the topological configuration of the circuit where the fault originated. To address this challenge, a novel framework for identifying series-type low-voltage AC fault arcs is presented, which integrates the Markov transfer field (MTF) with multi-feature fusion and an improved residual neural network (ResNet18). This approach employs fast Fourier transform (FFT) to compute magnitude and phase data and then converts the original current signals, magnitude spectrograms, and phase spectrograms into MTF images. An adaptive weighted averaging strategy is subsequently applied to fuse these MTF images, generating composite discriminative features that preserve both amplitude and phase information from the original signals. The proposed system incorporates a convolutional block-based attention mechanism (CBAM) into the ResNet18 architecture to enhance feature representation while reducing training complexity. Extensive experimental evaluations on a diverse dataset demonstrate that the developed method achieves an impressive recognition accuracy of 99.88% for series fault arcs. This result validates the effectiveness of the proposed framework in maintaining critical signal characteristics and improving detection precision compared to existing approaches.

1. Introduction

In recent years, the industrial utilization of electrical equipment and household appliances has proliferated [1]. However, with the passage of time, prolonged overload operations and aging of electrical circuits have led to insulation breakdowns, consequently triggering arc faults, which in turn result in safety hazards [2]. Arc faults manifest in various forms including series, parallel, and ground fault arcs [3]. Particularly, when the latter two types occur, the circuit’s current typically exceeds 75 A. To address this issue, circuit breakers equipped with isolation protection capabilities have been developed. It is worth noting that series arc faults stand out as the primary culprits behind electrical fires [4]. Unlike other fault types, series arc faults occur under load conditions where the presence of these loads tends to limit the fault current, rendering it similar to normal current flow. This presents a challenge for conventional line protection methodologies [5].
Thus, the detection of series arc faults emerges as a pivotal focus of ongoing research. There are three principal research directions concerning series fault arcs.
Firstly, when an arc occurs, it gives rise to light, sound, electromagnetic waves, pressure and other phenomena, which can be utilized for identification. For instance, in reference [6], an electromagnetic acoustic sensing system is employed to detect and identify series fault arcs. In the literature [7], internal sound signals of the switchgear are collected in real time via MEMS sound sensors. Subsequently, after wavelet packet decomposition, noise reduction and reconstruction based on singularity spectrum analysis, purer sound signals are obtained and applied to arc fault classification, effectively diminishing casualties and property losses caused by switchgear failures. In the literature [8], a multi-sensor data fusion algorithm is proposed to enhance the detection accuracy of arc faults, achieving the fusion of sensing signals acquired from temperature sensors, acoustic sensors and arc intensity sensors. The adaptive weighted fusion algorithm overcomes the uncertainty of individual sensors, realizes the extraction of arc fault features from homogeneous sensors, and provides accurate test sample data for the neural network fusion algorithm. In the literature [9], a synchronous fusion detection method for fault arc optics, electricity and magnetism is invented: using the increment of ultraviolet light intensity within a specific band and the voltage gradient composition or logic generated during the arc starting stage as a starting criterion; using the correlation similarity between the increment of visible light intensity and the zero-sequence transient current trend increment during the arc ignition stage as an exit, thereby realizing the synchronous photoelectric and magnetic detection of grounding fault arcs in switchgear and breaking through the bottleneck of detecting grounding weak current fault components. The detection of series fault arcs based on physical phenomena has the merits of simplicity and rapidity in operation. However, it demands high field environment conditions and cannot be deployed on a large scale. Most of the protection devices are only suitable for installation in distribution cabinets [10].
Secondly, the arcing phenomenon is modeled and analyzed. Mary’s model, Cassie’s model and Schwarz’s model are widely adopted methods for detecting series arc faults. In the literature [11], an improved Mayr arc modeling method based on dual-temperature magnetohydrodynamic arc simulation is proposed. The relative error between the VFTO simulation results of the improved Mayr arc model and the measured results is small, and the computational accuracy is high. In the literature [12], the Schwarz arc model is used to simulate and compare nonlinear load circuits, and the characteristics of voltage and current waveforms during fault circuits are analyzed. The wavelet analysis algorithm is utilized to decompose the current and calculate the energy in different frequency bands, achieving favorable detection results. In the literature [13], a Mayr–Cassie combinatorial model with arc current as the variable is constructed. Through experimental verification, this model can accurately reflect the arc characteristics and identify the fault arc. Although the use of arc mathematical models for arc identification offers high identification accuracy, in practical engineering, this arc model scheme, due to a large number of parameters, leads to a longer detection time, which is not conducive to accident prevention and is mostly used for theoretical research.
Thirdly, normal and fault voltage and current signals are collected, and the collected signals are processed by various methods. Subsequently, fault arc features are sought for detection and identification, and numerous new algorithms are emerging in this research direction. In the literature [14], an arc segmentation simulation model is established to analyze the effect of arc resistance on the fault characteristics of the load terminal voltage. From the selection of the optimal number of wavelet decomposition layers and wavelet basis functions, an arc fault detection method using wavelet energy spectrum entropy is proposed. This method makes use of the aberration caused by the fault arc voltage on the load terminal voltage to detect the fault and overcomes the problem of the difficulty in determining the fault characteristic frequency band by using the wavelet energy spectrum entropy. In the literature [15], an arc identification method based on the absolute difference between the current neighboring wave and randomness is proposed according to the arc stochastic characteristics of the fault’s current mutation amplitude and current variation. This method can effectively detect series arc faults with good adaptability. In the literature [16], a series arc fault detection method based on multi-feature fusion and improved SVM is proposed. The collected current signals are analyzed in the time domain, frequency domain and time–frequency domain to construct the series arc feature index set. Then, the series arc feature index set is used as the input vector of the SVM, and the SVM is optimized using the particle swarm algorithm to improve the accuracy of the classification model. The detection method based on the voltage and current waveforms or time–frequency domain feature changes during the occurrence of series fault arcs is the current mainstream research method [17].
In addition, it is worthwhile to learn from the troubleshooting methods used in different fields. The literature [18] presents a novel acoustic emission (AE)-based pipeline monitoring approach, integrating empirical wavelet transform (EWT) for adaptive frequency decomposition with customized one-dimensional DenseNet architecture to achieve precise leak detection and size classification. The literature [19] presents a fault diagnosis technique for milling machines based on acoustic emission (AE) signals and a hybrid deep learning model optimized with a genetic algorithm.
Traditional electrical protection devices, such as fuses and circuit breakers, are only capable of detecting large currents resulting from short circuits, overloads, ground faults, or parallel arc faults. For series arc faults, these devices are often ineffective, and effective detection is difficult to achieve. So, series arc fault detection devices need to be further investigated. This paper proposes a method that combines a multi-feature fusion of Markov transition field (MTF) with an enhanced residual neural network (ResNet18). While MTF has shown excellent results in bearing fault detection, its application in arc fault detection is less explored. This method utilizes fast Fourier transform to compute magnitude and phase data, which are then converted into images using MTF. The resulting three MTF images—representing the original data, magnitude, and phase—are fused via weighted averaging to create new recognition features for each current signal. The improved ResNet18, enhanced with the convolutional block attention module (CBAM), is employed for recognition to boost learning speed and accuracy. The method effectively detects series arcs and achieves high recognition accuracy.

2. Data Collection and Analysis

Series arc faults can occur in both AC and DC systems. In AC systems, the primary arc signatures originate from rapid extinguishing and/or re-ignition events at voltage zero crossings. By contrast, DC series faults are more challenging to detect due to the absence of zero crossing points. Although 220/380 V AC dominates low-voltage distribution networks, DC systems are employed in specialized applications such as photovoltaic installations and electric vehicle charging stations. Consequently, this paper focuses on low-voltage (LV) AC series arc fault detection.
This study primarily focuses on household loads, which operate under relatively mild environmental conditions. The testing apparatus was constructed in compliance with the GB/T 31143-2014 ‘Electrical Fire Monitoring System Part IV: Arc Fault Detector’ standard [20]. Specifically, the environmental parameters include:a temperature range of −5 °C to +40 °C, a maximum relative humidity of 50% at 40 °C, and an external magnetic field intensity not exceeding five times the Earth’s geomagnetic field in any direction.
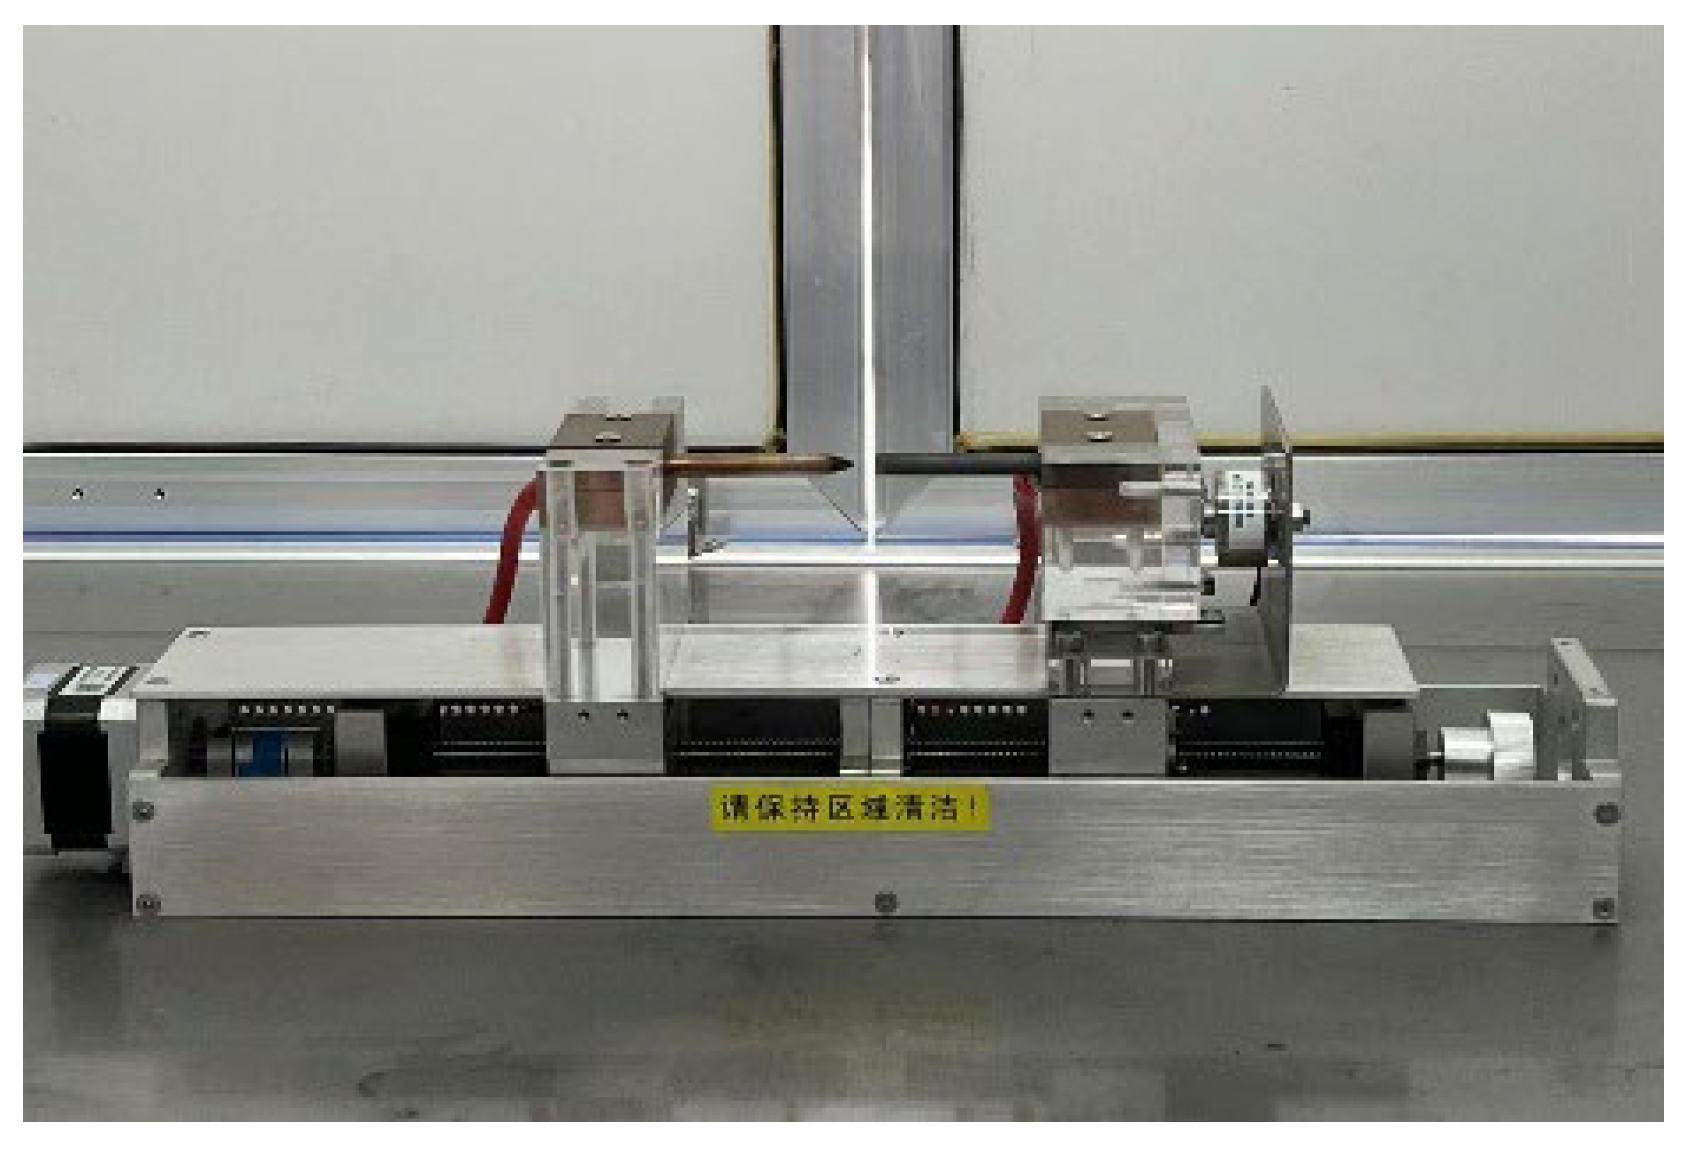
The arc fault generation unit comprises a carbon rod and a copper rod connected to a stepper motor. Upon initiating the power supply, the stepper motor separates the two rod poles, creating an arc between them due to air breakdown. The arc fault generator is illustrated in Figure 1.
The oscillographic recorder captures loop current signals during both normal operation and arc faults, which are subsequently transmitted to a computer for in-depth analysis. Given that arc fault protection primarily targets residential environments, various household appliances were chosen as experimental loads. Following tests conducted on the experimental platform, circuit current signals from eight types of typical loads (refer to Table 1) were recorded. These loads encompass most scenarios of low-voltage electrical appliance usage in daily life and adhere to the specifications outlined in the GB/T 31143-2014 standard.
These loads are grouped into four categories based on their characteristics. Resistive loads are categorized as such because their current closely resembles a sine wave. Motor-type loads include air compressors (capacitor start), electric hand drills, and vacuum cleaners due to their large inrush currents during startup. Gas discharge lamp loads, represented by halogen and fluorescent lamps, exhibit arc-like current characteristics. Lastly, electronic lamp dimmer and switching mode power supply loads fall into the power electronics enabled load category due to their wide bandwidth harmonics.
Based on the constructed platform, current signals from eight loads are gathered, including resistors, capacitor-started air compressors, electric hand drills, vacuum cleaners, halogen lamps, fluorescent lamps, electronic dimmer lamps, and switching power supplies. The time domain signals of these loads are shown in Figure 2, Figure 3, Figure 4, Figure 5, Figure 6, Figure 7, Figure 8 and 
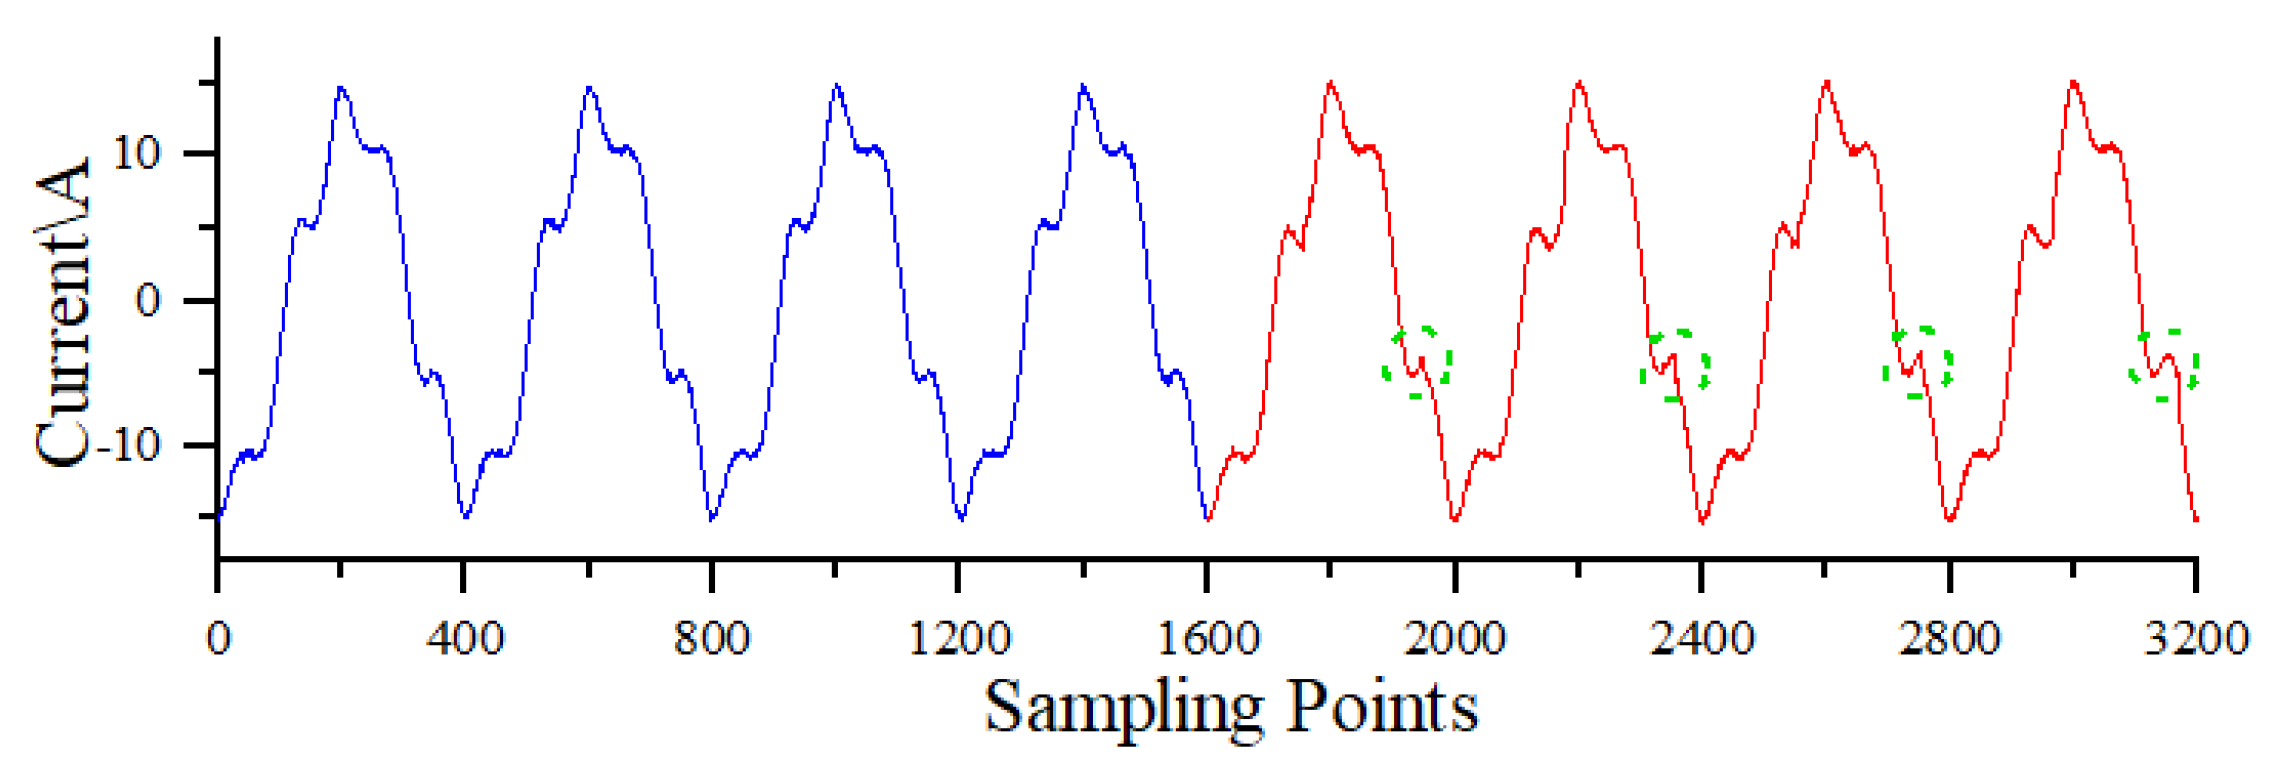
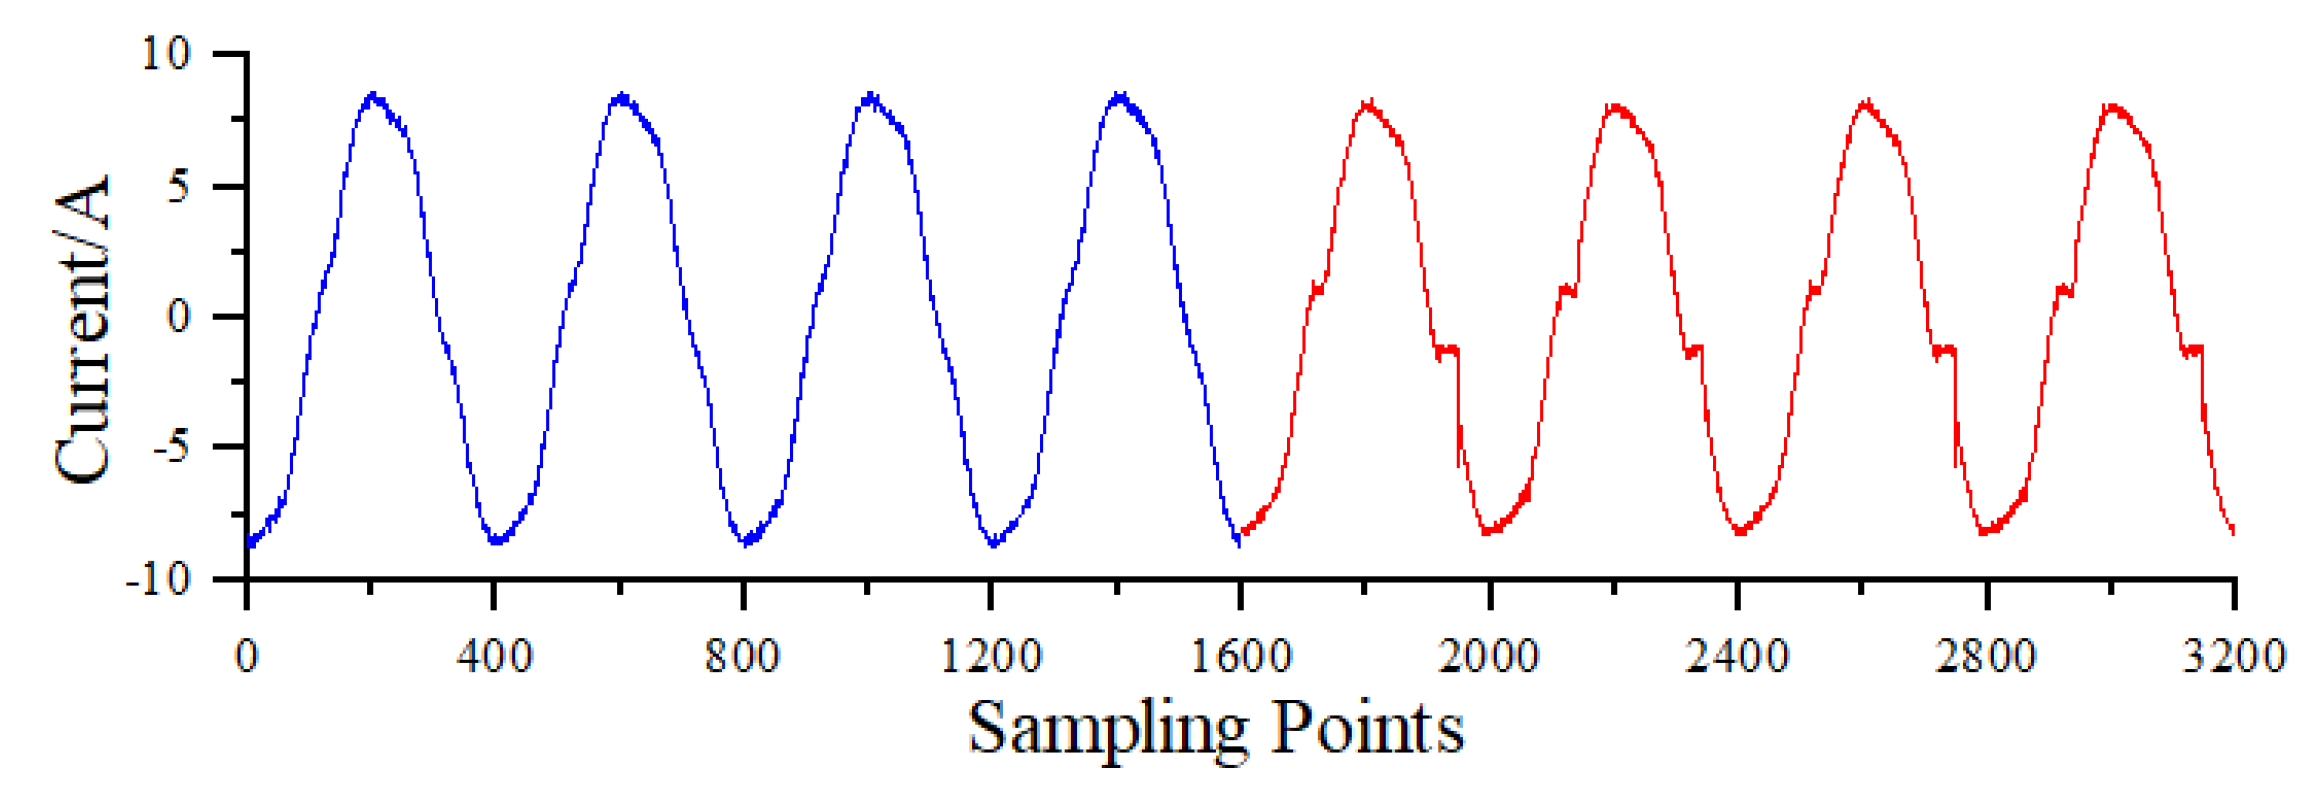
Figure 9, where the blue waveforms indicate the normal state and the red waveforms indicate the arc-fault state.
Figure 2 illustrates the current waveform of a purely resistive load. Under normal circuit conditions, the resistive load current exhibits a standard sinusoidal waveform, with the current changing continuously and smoothly over time without distortion or abnormal fluctuations, indicating circuit stability. During an arc fault, the current waveform demonstrates a distinct “zero rest” phenomenon at the current zero crossing. This “zero rest” characteristic serves as a key basis for series arc fault detection, aiding in the identification of fault states in practical circuits.
Figure 3, Figure 4 and Figure 5 illustrate the current waveforms of motor-type loads. Figure 3 illustrates the current waveforms of an air compressor under normal operation and during an arcing fault. The blue normal current waveform exhibits a periodic “multi-peak” pattern, attributed to the nonlinear characteristics of the single-phase induction motor in the air compressor and the influence of its internal electromagnetic field, causing multiple current fluctuations within a cycle. When an arc fault occurs in the line, the current waveform’s peaks deviate from the normal cyclic pattern; the green dotted line in the figure marks the “spikes”, demonstrating abrupt current changes at these positions distinct from the normal waveform.
Figure 4 illustrates the current waveform of a handheld drill load. As an inductive load, the handheld drill’s inductive components impede current changes, causing slight distortion at the current zero crossing while maintaining an overall regular sinusoidal form. During a line arcing fault, the waveform exhibits a distinct “zero rest” phenomenon at the zero crossing, accompanied by severe distortion.
Figure 5 illustrates the current waveform of a vacuum cleaner’s load. With an AC motor inside the vacuum cleaner, carbon brushes separate from the commutator during each phase change, generating a “benign arc” that creates a “zero rest” characteristic similar to fault arcs. This waveform typifies the vacuum cleaner’s normal operation, reflecting a regular motor operation and phase change process. During a line arc fault, the current waveform exhibits numerous “burrs” at the zero crossing on top of the normal waveform, accompanied by unstable current amplitude fluctuations. The term “benign arc” refers to arcs that do not disrupt normal load operation.
Figure 6 and Figure 7 illustrate the current waveforms of fluorescent and halogen lamps, respectively. The gas discharge process in these lamps introduces current interference, causing slight waveform aberration even under normal line conditions—resulting in non-perfect sinusoidal waveforms. During an arc fault, while the “zero rest” phenomenon at the zero crossing is less pronounced, the current waveform exhibits more severe distortion compared to the normal state.
Figure 8 illustrates the current waveforms of a 60° dimming lamp load under normal operation and during an arc fault. Operating at a 60° conduction angle, the thyristor in the dimmable lamp conducts and cuts off at specific angles, resulting in rapid current rise during 60–180° of the first half-cycle and steep current fall during 240–360° of the second half-cycle. This forms a symmetrical chopper-like waveform—characteristic of the dimmable lamp’s normal operation under 60° dimming. During a line arc fault, the waveform exhibits a “flat shoulder” at the zero crossing atop the original symmetrical chopper pattern, with aggravated overall distortion.
Figure 9 depicts the current waveforms of an electronic switching power supply under normal load and arcing fault conditions. Inside the electronic switching power supply, high-frequency power electronics continuously perform on–off operations to regulate the output voltage. This high-frequency action leads to severe distortion of the current waveform. Nevertheless, despite the distortion, the current waveform still maintains periodicity. When an arc fault occurs, two significant changes take place. Firstly, the distortion of the current waveform is further exacerbated, and a distinct “zero rest” phenomenon emerges at the zero-crossing point. Secondly, the current waveform loses its original periodic nature, with the current peaks fluctuating irregularly.

3. Multi-Feature Fusion Recognition Method

3.1. Presentation of Features

3.1.1. Markov Transfer Field

Markov transition field (MTF) has been prevalently employed in the realm of bearing fault detection, achieving remarkable results. The underlying principle of MTF lies in the conversion of one-dimensional time series signals into two-dimensional matrices [21]. In the process of bearing fault detection, the acquired signal pertains to a one-dimensional time domain vibration signal. Notably, this signal shares the same modality as the current cycle signal engendered by series arc fault detection. Hence, within the scope of this paper, MTF is applied to series arc fault detection. The encoding of image pixel points is executed in accordance with Markov transfer probability [22].
The innovative application of the Markov transfer field (MTF) in arc-fault detection is manifested in the following aspects.
I. Signal Transformation and Feature Enhancement
The MTF converts a one-dimensional current time-series signal into a two-dimensional image by means of a Markov chain state-transfer probability matrix. This conversion not only captures spatial and temporal dependencies but also enhances nonlinear features. In doing so, it overcomes the limitations of traditional time–frequency domain analysis.
II. Signal Preprocessing and Classification Chain
In combination with variational modal decomposition (VMD) preprocessing, the quality of the signal is improved. An integrated “signal reconstruction—image coding—intelligent classification” technical chain is constructed. Within this chain, residual neural networks are employed to perform end-to-end image classification, enabling the full integration of multi-dimensional features.
III. Practical Application Advantages
In practical scenarios, the MTF shows remarkable adaptability to complex loads, a strong anti-interference ability, and scalability. This is attributed to the fusion of original features with amplitude and phase information. Consequently, it effectively resolves the misclassification and omission issues associated with traditional methods, significantly enhancing the robustness and generalization ability of arc-fault detection.
The transition process of the Markov transition field is shown in Figure 10, and it is divided into the following four steps.
For the time series X = (xt, t = 1, 2, …, T), its image coding steps are as follows:
1. Divide the time series X(t) into Q quartiles (with the same amount of data within each quartile);
2. Change each data in the time series to its corresponding quantile number [23];
3. Constructing the transfer matrix W (wij denotes the frequency of transfer of quantile i to j);
W = w 11 w 1 Q w 21 w 2 Q w Q 1 w Q Q
4. Constructing Markov transfer fields.
M = w i , j   x 1 q i , x 1 q j w i , j   x 1 q i , x 2 q j w i , j   x 1 q i , x n q j w i , j   x 2 q i , x 1 q j w i , j   x 2 q i , x 2 q j w i , j   x 2 q i , x n q j w i , j   x n q i , x 1 q j w i , j   x n q i , x 2 q j w i , j   x n q i , x n q j
Figure 10. Flowchart of MTF-based image conversion.
Electronics 14 01325 g010

3.1.2. Calculation of Amplitude and Phase

The FFT converts the signal from the time domain to the frequency domain so that raw information such as magnitude and phase, which are difficult to observe in the time domain, can be extracted [24].
Let the original data be a time series vector d = [d1, d2, …, dn]; with n samples, the FFT is applied to obtain the real part sequence r = [r1, r2, …, rn] and the imaginary part sequence I = [i1, i2, …, in]. The amplitude M = [m1, m2,…, mn] and the phase P = [p1, p2, …, pn] are calculated as follows [25].
m n = r n 2 + i n 2
p n = tan 1 i n r n

3.1.3. Average Weighted Fusion

In this paper, the image size is set to 100 × 100. Figure 11 illustrates the multi-feature fusion process using a standard one-cycle sample from an electric drill. The amplitude spectrum and phase spectrum of the original signal are obtained through fast Fourier transform, and then the MTF transform is performed on the original signal, amplitude spectrum, and phase spectrum separately. Here, RDMTF represents the transformation of the original current signal, AMTF denotes the transformation of the amplitude signal, and PMTF corresponds to the transformation of the phase signal. Three categories of color images are generated by MTF using the original current signal’s amplitude and phase signals as inputs [26]. These images undergo weighted average fusion to compute the average value for each pixel across the three images, creating a new composite image [27]. The weighted average fusion strategy was selected for two synergistic rationales: (1) to achieve effective integration of multimodal MTF features through computationally efficient operations that preserve critical spatial-frequency components, and (2) to avoid introducing additional learnable parameters that could compromise system stability given our hardware constraints. Given three color images, img1, img2 and img3, with pixel values (R1, G1, B1), (R2, G2, B2) and (R3, G3, B3), respectively, the weighted average for each pixel is calculated using Equation (5).
R = w 1 R 1 + w 2 R 2 + w 3 R 3 G = w 1 G 1 + w 2 G 2 + w 3 G 3 B = w 1 B 1 + w 2 B 2 + w 3 B 3
where w1, w2, and w3 are weights, and their sum is 1. Set up w 1 = w 2 = w 3 = 1 / 3 .
Eventually, the generated R, G, B channel images are then fused into a single image for recognition.

3.2. Improved ResNet18

3.2.1. Residual Network

ResNet (Residual Network), a groundbreaking network model, was introduced by Kaiming He and colleagues at Microsoft Research in 2015 [28]. This model is distinguished by its innovative use of residual blocks to construct the network. Figure 12 shows the residual module [29].
This design offers the advantage of preserving information flow from previous layers even if some layers do not significantly transform the input, thereby minimizing gradient loss [30]. This connection can be mathematically expressed as Equation (6):
H(x) = F(x) + x
In ResNet, H(x) represents the output of the current layer, F(x) symbolizes the transformation applied by the current layer, and x stands for the input received from the preceding layer. By aggregating the transformations with the inputs, ResNet ensures the preservation of information from the previous layer and its transmission to the following layer, thereby avoiding significant gradient loss. The introduction of skip connections enables ResNet to support a deeper network architecture, enhancing the flow of gradients during training [31]. Consequently, ResNet can more effectively learn complex features, leading to improved model performance.
Residual blocks, or ‘Resblocks’, constitute the fundamental elements of a residual network [32]. However, a complete residual network architecture involves more than just these blocks. It starts with a downsampling and pooling layer, followed by a sequence of multiple residual blocks, and culminates in a pass through a fully connected layer for output [33]. The ResNet18 architecture exemplifies this structure, as illustrated in the schematic of the ResNet18.

3.2.2. Convolutional Block Attention Module

The comprehensive flowchart of CBAM is depicted in Figure 13. The input, F, follows two paths: one traverses through the channel attention module, resulting in channel weights Mc after normalization, while the other proceeds directly and is multiplied by Mc to yield F’. Subsequently, the output, F’, also bifurcates: one path enters the spatial attention module, undergoes a series of processes including normalization to obtain spatial weights Ms, and is then multiplied by F’. Ultimately, the feature map, F”, is obtained [34].
The CBAM attention mechanism integrates both channel and spatial attention mechanisms [35]. The channel attention mechanism learns importance weights for each feature channel, enhancing those that help differentiate between classes while reducing the influence of irrelevant ones. This helps the network focus on extracting and utilizing key features [36]. The spatial attention mechanism manages pixel-level information, assigning higher weights to critical pixels for classification and lowering attention to less relevant ones. This enables the network to more accurately localize and exploit regions of the image crucial to the classification task [37]. The combined effect of these mechanisms significantly boosts model performance, leading to improved classification and generalization capabilities.

4. Experimental Procedure and Results Analysis

4.1. Divide the Data to Create a Dataset

A substantial amount of experimental data were acquired through experiments conducted on the series arc fault experimental platform. One-dimensional time domain signals of each load were differentiated to distinguish normal waveform from fault waveform. With eight different loads, each having two states (normal and fault), the final dataset comprises 16 categories. The sampling frequency was set at 20 kHz, translating to 400 sample points per cycle. Thus, each category of data consists of 400,000 sample points, where one cycle corresponds to one sample, resulting in 1000 samples per category and a total of 16,000 samples in the dataset. The entire dataset was randomly partitioned into three sets—training, validation, and test sets—using an 8:1:1 ratio. Each category of data is labeled as indicated in Table 2. Finally, the segmented 1D time domain dataset is converted into corresponding 2D images using MTF.
Given the critical influence of experimental platform configuration (hardware and software) on measurement accuracy, Table 3 documents the detailed environmental parameters, including hardware specifications and software configurations.

4.2. Model Evaluation Metrics

For categorization, the result would be as follows. (i) Positive is predicted to be positive (True Positive, TP); (ii) negative is predicted to be negative (True Negative, TN); (iii) positive is predicted to be negative (False Negative, FN); and (iv) negative is predicted to be positive (False Positive, FP). In this paper, four evaluation metrics are used: accuracy (Acc), precision (P), recall (R), and the F1 score. The formulas for these metrics are provided as follows: accuracy is indicated by Equation (7), precision by Equation (8), recall by Equation (9), and the F1 score by Equation (10) [38]:
Acc = T P + T N T P + T N + F P + F N
P = T P T P + F P
R = T P T P + F N
F 1 = 2 1 P + 1 R

4.3. Validation of Multi-Feature Fusion Methods

In order to comprehensively and effectively showcase the distinct advantages brought by multi-feature fusion, this paper conducts a meticulous and in-depth comparison. Specifically, it focuses on contrasting the recognition accuracy of three separate and individual features with that achieved through the integration of multiple features. By doing so, we can directly observe and quantify the potential enhancements and improvements that occur when features are combined. The results are presented in Table 4.
Table 4 shows that in the ResNet18-based model, the amplitude feature method alone (AMTF) achieved 96.36% accuracy, the current feature method alone (RDMTF) reached 96.78%, the phase method alone (PMTF) attained 96.83%, and the multi-feature fusion method achieved 98.13%. This demonstrates that combining the three features of the original signal enriches the feature information and improves recognition accuracy.
Figure 14 illustrates the accuracy curves for the training set of the three individual features compared with the multi-feature fusion method. The curves reveal that, as the number of iterations increases, the multi-feature fusion approach converges more quickly and effectively than the other three methods. This indicates that the multi-feature fusion method enhances the feature information of the load, leading to faster convergence and improved results during model training.

4.4. Validation of Improved Model Recognition Effect

To assess the optimization effect of CBAM on the model, we first compare the recognition performance of the model with and without CBAM, using multi-feature fusion images as input. Based on the dataset split during preprocessing, the bit size is set to 100. Excessive training can cause the model to memorize noise and overfit, focusing on a narrow feature range, which negatively impacts generalization. Conversely, too few training rounds may prevent optimal recognition. Therefore, the number of training rounds is set to 500. Results without the attention mechanism are shown in Figure 15.
Figure 15 shows significant fluctuations in the recognition accuracy of the model validation set, indicating a poor fit to the training set. In contrast, Figure 16 presents the results after incorporating the attention mechanism into the ResNet18 model, which demonstrates improved performance.
After 500 rounds of training, as depicted in Figure 16, it is evident that the accuracy curve of the validation set, following an initial fluctuation with increasing training rounds, closely aligns with the overall accuracy curve of the training set. This observation suggests the absence of overfitting or underfitting.
Figure 17 shows the confusion matrix for the original Resnet18 model test set and Figure 18 shows the confusion matrix for the improved Resnet18 model test set:
To provide a more intuitive comparison of recognition accuracy and other metrics before and after model improvement, the two confusion matrices are analyzed in detail through the table. The results indicate that the accuracy and loss values of the improved arc fault recognition model have significantly enhanced compared to those of the pre-improvement model.
Table 5 provides a clear comparison of recognition accuracy and various metrics for all faulty arcs, both before and after model improvement. Prior to improvement, the model exhibited significant recognition errors for the resistor fault signal (Label 2) and the halogen lamp fault signal (Label 8), leading to decreased overall accuracy. After model enhancement, which focused on improving attention to critical features, these issues were addressed. Consequently, the recognition accuracy of the improved model increased by 0.812%, and the F1 score improved by 0.815% compared to the pre-improvement results.
The ultimate goal of arc fault detection is to ensure that the circuit breaker reliably interrupts the circuit when an arc fault occurs. If the circuit breaker is installed on the main bus, a fault in any single appliance could cut power to all devices, leading to unnecessary disruptions. Therefore, it is crucial to detect faults at the appliance level and have the corresponding circuit breaker respond appropriately.
To evaluate this, Figure 17 and Figure 18 present confusion matrix data and Table 6 provides a visual comparison of the model performance before and after the improvement. The comparison shows significant improvements in identifying various electrical fault signals, with the improved precision increasing by 0.504%, recall increasing by 1.125%, F1 values increasing by 0.815%, and accuracy increasing by 0.812% over the pre-improvement period. It is worth noting that the metrics for resistance and halogen lamp failure have improved significantly, indicating that the improved model has made great strides.
As shown in Table 7, the improved model achieves significantly higher accuracy and faster training while introducing only a 9.8% increase in parameters and a 12.1% increase in GFLOPs.
To further validate the efficacy of the approach proposed in this paper, we compare it with three methods outlined in the literature [39,40]. Among these, the feature vectors obtained post-wavelet decomposition serve as inputs to the enhanced AlexNet model as described in the literature [39], while the literature [14] used a method for detecting arc faults at the load end based on the entropy of the wavelet energy spectrum, and literature [40] utilizes a deep long short-term memory (LSTM) network.
The results of this study demonstrate that the CBAM-ResNet18 model integrated with multi-feature fusion proposed herein outperforms the combined methods presented in the aforementioned literature, as summarized in Table 8.

5. Conclusions

This paper delves into a multi-feature fusion method and puts forward a low-voltage series arc fault identification approach grounded in MTF and an enhanced ResNet18 model. By leveraging the fast Fourier transform to extract the amplitude and phase features of the original signal, and computing Markov matrices for raw data, amplitude, and phase, we create a fused image by averaging and weighting these matrices. This not only enhances the recognition of signals with similar currents but also provides a more comprehensive representation of the fault characteristics.
Furthermore, the integration of the CBAM attention mechanism into the ResNet18 model significantly boosts the model’s recognition rate and accuracy. In practical applications, this enhanced method can play a crucial role in safeguarding low-voltage electrical systems. It can effectively prevent potential electrical fires caused by series arc faults, thereby ensuring the safety of electrical equipment and personnel.
Compared with existing common identification methods, the methodology in this paper not only achieves a higher recognition rate and accuracy but also demonstrates advantages in terms of computational efficiency and cost-effectiveness. This could potentially lead to more widespread adoption in the industry, promoting the development of more reliable and cost-efficient arc fault detection systems.
In the academic realm, this study enriches the research on low-voltage series arc fault identification methods, providing new ideas and references for future research in this field.

Author Contributions

Conceptualization, H.W. and J.K.; methodology, H.W. and J.K.; validation, H.W.; formal analysis, H.W.; investigation, H.W.; resources, H.W. and Y.L.; writing—original draft preparation, H.W. and J.K.; writing—review and editing, Y.L.; visualization, H.W.; supervision, J.K. and Y.L.; project administration, J.K.; fundingacquisition, H.W. and Y.L. All authors have read and agreed to the published version of the manuscript.

Funding

The work of Haitao Wang was supported in part by Natural Science Foundation of Hebei Province (No. E2024202063).The work of Haitao Wang was supported in part by S&T Program of Hebei (No. 24464401D).The work of Yigang Lin was supported in part by Zhejiang Provincial Natural Science Foundation funded project (No. LY23E070001).The work of Yigang Lin was supported in part by Wenzhou major scientific and technological innovation research project (No. ZG2024020).

Data Availability Statement

The data presented in this study are available on request from the corresponding author due to Data relate to unpublished follow-up studies.

Conflicts of Interest

The authors declare no conflicts of interest.

References

  1. Meng, Y.; Li, X.; Wu, Z.; Wang, C.; Chen, S. Time-frequency domain characteristics of DC fault arcs in photovoltaic systems and their composite modeling. High Volt. Appar. 2022, 58, 23–30+40. [Google Scholar]
  2. Cui, R.; Zhang, Z.; Tong, D.; Cui, J. Aero-AC series arc fault detection based on improved empirical wavelet transform multi-feature fusion. Trans. China Electrotech. Soc. 2022, 37, 3148–3161. [Google Scholar]
  3. Tang, S.; Diao, X.; Chen, L.; Zhang, J.; Yao, F. Research on the detection method of DC series weak fault arc in photovoltaic power generation system. Chin. J. Sci. Instrum. 2021, 42, 150–160. [Google Scholar]
  4. Hou, Q. Research on the Detection Method of Low-Voltage AC Series Arc Faults. Master’s Thesis, Yancheng Institute of Technology, Yancheng, China, 2024. [Google Scholar]
  5. Geng, W. Research on Low-Voltage AC Series Arc Fault Detection Technology. Master’s Thesis, Harbin Institute of Technology, Harbin, China, 2022. [Google Scholar]
  6. Vasile, C.; Ioana, C. Arc fault detection and localization by electromagnetic-acoustic remote sensing. In Proceedings of the 2016 Radio and Antenna Days of the Indian Ocean, Reunion, France, 10–13 October 2016; IEEE: Piscataway, NJ, USA, 2016; pp. 1–4. [Google Scholar]
  7. Gou, X.; Hu, Q.; Zhang, S. Research on Arc Sound Detection System for Switchgear. Mech. Electr. Inf. 2020, 5–6. [Google Scholar] [CrossRef]
  8. Xu, Q.; Zhang, J.; Xu, D.; Li, R.; Zhang, J. Multi-sensor data fusion algorithm for high accuracy arc fault detection. J. Shanghai Univ. (Nat. Sci. Ed.) 2014, 20, 165–173. [Google Scholar]
  9. Shu, H.; Dong, J.; Song, J.; Li, H.; Huang, L.; Hu, Q. Arc Light Detection and Protection by Synchronous Fusion of Opto-electromagnetics. Distrib. Util. 2021, 38, 21–28. [Google Scholar]
  10. Wu, Z.; Han, Y.; Chen, C. Research on Characteristics of AC Series Fault Arcs Based on Holo-Hilbert Spectral Analysis. Electr. Energy Manag. Technol. 2024, 8–16. [Google Scholar] [CrossRef]
  11. Cui, J.; Sun, S.; Zhang, G.; Chen, Y.; Cui, B. Extra-fast transient overvoltage simulation based on dual-temperature magnetohydrodynamic arc simulation with an improved Mayr arc model. Trans. China Electrotech. Soc. 2024, 39, 5149–5161. [Google Scholar]
  12. Li, W.; Qu, N.; Zhang, S.; Zheng, T. Simulation study of series arc fault based on wavelet analysis and Schwarz model. Fire Sci. Technol. 2020, 39, 1260–1263. [Google Scholar]
  13. Yang, M.; Long, Y.; Fan, S.; Ma, G.T. Simulation and analysis of arc grounding fault based on combined Mayr and Cassie arc models. Electr. Meas. Instrum. 2019, 56, 8–13. [Google Scholar]
  14. Gao, H.; Wang, W.; Shang, T.; Zhai, G. Series-type arc fault detection based on wavelet energy spectrum entropy. Adv. Technol. Electr. Eng. Energy 2022, 41, 63–71. Available online: https://ateee.iee.ac.cn/CN/10.12067/ATEEE2201020 (accessed on 23 March 2025).
  15. Ding, Y.; Chen, Y.; Sun, L.; Cheng, Q.; Liu, Z. AC series arc fault identification based on neighbouring wave current difference and randomness. Power Syst. Prot. Control 2023, 51, 169–178. [Google Scholar]
  16. Guo, M.; Wu, N.; Guo, X.; Lu, J.; Chen, W. Series arc fault detection method based on multi-feature fusion and SVM. Power Capacit. React. Power Compens. 2024, 45, 137–149. [Google Scholar]
  17. Wu, H. Deep Learning Based DC Series Fault Arc Identification Study. Master’s Thesis, Shenyang University of Technology, Shenyang, China, 2024. [Google Scholar]
  18. Saleem, F.; Ahmad, Z.; Siddique, M.F.; Umar, M.; Kim, J.-M. Acoustic Emission-Based Pipeline Leak Detection and Size Identification Using a Customized One-Dimensional DenseNet. Sensors 2025, 25, 1112. [Google Scholar] [CrossRef]
  19. Umar, M.; Siddique, M.F.; Ullah, N.; Kim, J.-M. Milling machine fault diagnosis using acoustic emission and hybrid deep learning with feature optimization. Appl. Sci. 2024, 14, 10404. [Google Scholar] [CrossRef]
  20. GB/T 31143-2014; General Requirements for arc Fault Protection Devices (AFDD). China Standard Press: Beijing, China, 2014.
  21. Yan, J.; Kan, J.; Luo, H. Rolling bearing fault diagnosis based on Markov transition field and residual network. Sensors 2022, 22, 3936. [Google Scholar] [CrossRef]
  22. Wang, M.; Wang, W.; Zhang, X.; Iu, H.H.-C. A new fault diagnosis of rolling bearing based on Markov transition field and CNN. Entropy 2022, 24, 751. [Google Scholar] [CrossRef]
  23. Ding, S.; Rui, Z.; Lei, C.; Zhuo, J.; Shi, J.; Lv, X. A rolling bearing fault diagnosis method based on Markov transition field and multi-scale Runge-Kutta residual network. Meas. Sci. Technol. 2023, 34, 125150. [Google Scholar] [CrossRef]
  24. Li, W. Series Arc Fault Detection Based on Multidimensional Features and Lightweighting Algorithm. Master’s Thesis, Nanjing University of Aeronautics and Astronautics, Nanjing, China, 2022. [Google Scholar]
  25. Ren, Z.; Nan, Z. Research on series-type fault arc identification method based on improved CNN. Control Eng. China 2022, 29, 263–270. [Google Scholar]
  26. Yang, Y.; Huang, L.; Li, P.; Sheng, L.; Lv, Z.; Yang, S. Arc fault detection method based on multi-dimensional feature extraction. J. Electron. Meas. Instrum. 2021, 35, 107–115. [Google Scholar]
  27. Hu, C. Study on Low-Voltage Series Arc Fault Detection Based on Multimodal Feature Analysis. Master’s Thesis, Shenyang Aerospace University, Shenyang, China, 2023. [Google Scholar]
  28. Li, B.; Shu, Y. Three-phase series fault arc detection method based on deep confidence network. Proc. CSU-EPSA 2023, 35, 20–28. [Google Scholar]
  29. Gao, X.; Zhou, G.; Zhang, J.; Zeng, Y.; Feng, Y.; Liu, Y. Fault Arc Detection Based on Channel Attention Mechanism and Lightweight Residual Network. Energies 2023, 16, 4954. [Google Scholar] [CrossRef]
  30. Alaeddine, H.; Jihene, M. Wide deep residual networks in networks. Multimed. Tools Appl. 2023, 82, 7889–7899. [Google Scholar]
  31. Zhang, K.; Sun, M.; Han, T.X.; Yuan, X.; Guo, L.; Liu, T. Residual networks of residual networks: Multilevel residual networks. IEEE Trans. Circuits Syst. Video Technol. 2017, 28, 1303–1314. [Google Scholar]
  32. Li, B.; Yang, Y. Arc detection of household loads based on improved AlexNet model. J. Transduct. Technol. 2023, 36, 1928–1934. [Google Scholar]
  33. Jiang, H.; Bai, G.; Zhou, Z.; Deng, Q.; Teng, J.; Zhang, Y.; Zhou, L.; Zhou, Z. Arc fault detection based on one-dimensional cavity convolutional neural network. J. Tsinghua Univ. (Sci. Technol.) 2024, 64, 492–501. [Google Scholar]
  34. Wang, Y.; Chen, H.; Liu, J.; Chai, X.; Lu, L.; Chen, Y. Partial discharge identification of oil-paper insulation of converter transformer based on Markov transfer field and CBAM-CNN. Eng. J. Wuhan Univ. 2023, 56, 1245–1254. [Google Scholar]
  35. Zhang, L.; Duan, L. Cross-scenario transfer diagnosis of reciprocating compressor based on CBAM and ResNet. J. Intell. Fuzzy Syst. 2022, 43, 5929–5943. [Google Scholar]
  36. Zhao, X.; Tuo, B.; Hui, Y. Deep learning with CBAM-based CNN for batch process quality prediction. Meas. Sci. Technol. 2023, 34, 115123. [Google Scholar]
  37. Fu, Q. Research on Fault Arc Detection Algorithm of Convolutional Neural Network Based on Attention Mechanism. Master’s Thesis, China University of Mining and Technology, Beijing, China, 2022. [Google Scholar]
  38. He, J. Research on Low Voltage Ac Series Arc Fault Detection Method Based on Time-Frequency Domain Feature Analysis. Master’s Thesis, Harbin Institute of Technology, Harbin, China, 2023. [Google Scholar]
  39. Yu, Q.; Hu, Y.; Yang, Y. Arc fault detection based on wavelet features and deep learning. J. Electron. Meas. Instrum. 2020, 34, 100–108. [Google Scholar]
  40. Yu, Q.; Lu, W.; Yang, Y. Multi-branch series fault arc detection method based on deep long-short time memory network. J. Comput. Appl. 2021, 41, 321–326. [Google Scholar]
Figure 1. Fault Arc Generator.
Electronics 14 01325 g001
Figure 2. Pure resistive load current waveform.
Electronics 14 01325 g002
Figure 3. Air compressor load current waveform.
Electronics 14 01325 g003
Figure 4. Hand-held electric drill load current waveform.
Electronics 14 01325 g004
Figure 5. Vacuum cleaner load current waveform.
Electronics 14 01325 g005
Figure 6. Fluorescent lamp load current waveforms.
Electronics 14 01325 g006
Figure 7. Halogen lamp load current waveforms.
Electronics 14 01325 g007
Figure 8. Dimming lamp 60° load current waveforms.
Electronics 14 01325 g008
Figure 9. Electronic switching power supply load current waveforms.
Electronics 14 01325 g009
Figure 11. Multi-feature fusion process diagram.
Electronics 14 01325 g011
Figure 12. Residual module.
Electronics 14 01325 g012
Figure 13. Overall flow.
Electronics 14 01325 g013
Figure 14. Training set accuracy curves for 4 features.
Electronics 14 01325 g014
Figure 15. Accuracy curve of original training set and validation set.
Electronics 14 01325 g015
Figure 16. Improved training set and validation set accuracy curves.
Electronics 14 01325 g016
Figure 17. Confusion matrix of classification results before improvement.
Electronics 14 01325 g017
Figure 18. Confusion matrix for improved classification results.
Electronics 14 01325 g018
Table 1. Typical load parameters.
LoadsRated ParametersLoad Group
ResistancesRMS loop current 3 AResistive Loads
Capacitor Start Motor230 V/65 × (1 ± 10%) AMotor Type Loads
Electric Hand Drill600 W
Vacuum Cleaner230 V/(5~7) A
Halogen Lamps300 WGas Discharge Lamps Loads
Fluorescent Lamps2 × 40 W
Electronic Lamp Dimmer 60°600 WPower Electronics-enabled Loads
Switch Mode Power690 W
Table 2. Corresponding labels for load work types.
LoadsSignal TypeLabels
Electric Hand DrillArc0
Normal1
ResistancesArc2
Normal3
Switch Mode PowerArc4
Normal5
Capacitor Start MotorArc6
Normal7
Halogen LampsArc8
Normal9
Electronic Lamp Dimmer 60°Arc10
Normal11
Vacuum CleanerArc12
Normal13
Fluorescent LampsArc14
Normal15
Table 3. Software environment and hardware configuration.
Software and HardwareEnvironment/Models
CPU11th Gen Intel(R) Core(TM) i5-11400H@2.70 GHz
GPUNVIDIA GeForce RTX 3050 Laptop (Memory 4G)
Operating SystemWindows 11
Python3.10.15
Deep Learning FrameworksTensorFlow 2.6.0
CUDA11.5
cudnn8.3.0
Table 4. ResNet18 recognition results for four features.
ModelFeaturePrecision (%)Recall (%)F1 (%)Accuracy (%)
Resnet18RDMTF96.5394.7595.6396.78
AMTF96.2195.8896.0496.36
PMTF97.1796.9397.0596.83
Multi-feature Fusion98.2397.8698.0498.13
Table 5. Recognition results for ResNet18 and CBAM-ResNet18.
LoadsPrecisionRecallF1AccuracyOverall Accuracy
Resnet18Resistances11110.9782
Capacitor Start Motor0.800.960.87200.86
Electric Hand Drill0.98970.960.97460.9969
Vacuum Cleaner1111
Halogen Lamps0.75730.780.76850.9706
Fluorescent Lamps0.98020.990.98510.9981
Electronic Lamp Dimmer 60°1111
Switch Mode Power1111
CBAM-ResNet18Resistances11110.9988
Capacitor Start Motor10.990.99500.9994
Electric Hand Drill0.990.990.990.9988
Vacuum Cleaner1111
Halogen Lamps1111
Fluorescent Lamps10.990.99500.9988
Electronic Lamp Dimmer 60°1111
Switch Mode Power1111
Table 6. Comparison of recognition results between ResNet18 and CBAM-ResNet18.
ModelPrecision (%)Recall (%)F1 (%)Accuracy (%)
ResNet1899.37198.75099.06099.063
CBAM-ResNet1899.87599.87599.87599.875
Table 7. Comparison of recognition results before and after improvement.
ModelNumber of ParametersGFLOPsAccuracyTraining Speed (One Round)
ResNet1811.69 million1.8194.25%66 s
CBAM-ResNet1812.84 million2.0399.88%26 s
Table 8. Comparison of classification performance of different methods.
ModelFeature Extraction MethodNumber of Model ParametersAccuracy(%)
Improving AlexNet [39]Wavelet Transform7.2 × 10395.98%
Wavelet Energy Spectrum Entropy [14]Raw Data Characteristics1.2 × 10399.21%
LSTM [40]Raw Data Characteristics7.2 × 10494.88%
CBAM-ResNet18Multi-feature Fusion1.6 × 10499.88%
Disclaimer/Publisher’s Note: The statements, opinions and data contained in all publications are solely those of the individual author(s) and contributor(s) and not of MDPI and/or the editor(s). MDPI and/or the editor(s) disclaim responsibility for any injury to people or property resulting from any ideas, methods, instructions or products referred to in the content.

