1. Introduction
The rail clamp, also known as the track joint clamp, is a fastening device used to connect two sections of rail, typically used in conjunction with fishplate bolts to support the connection and stability of rails. The high-frequency vibrations generated during high-speed train operation can loosen the bolts, leading to a loss of fastening effect. If the rail connection becomes unstable, it could result in train derailment during high-speed travel, which would have dire consequences. Therefore, it is particularly important to monitor the condition of the bolts regularly. Traditional methods for detecting loose track bolts generally require manual on-site inspections, including visual inspections, hammer-sounding methods, and torque measurement methods. However, for railways with a large number of bolts spread over a wide area, manual inspections are time-consuming and labor-intensive, and repetitive mechanical work makes it inevitable for people to overlook certain details.
To address the disadvantages of manual inspection in the field of bolt-loosening detection, some scholars have proposed the use of sensors to collect bolt condition information for automated monitoring. For example, ultrasonic sensors have been employed to detect the tightness of the bolts in connected structures [
1,
2]. Most of these ultrasonic methods are based on pulse echo technology, where ultrasonic pulses are emitted and received to measure the round-trip time of the pulses through the bolt. Different axial forces cause slight variations in travel time, allowing for the identification of bolt tightness. Another approach uses piezoelectric impedance technology to monitor bolt fastening [
3], by installing piezoelectric materials on the head of the bolt and utilizing the electromechanical coupling effect of the piezoelectric material to detect changes in the preload. These methods can be used to obtain accurate results and effectively identify bolt loosening. However, owing to the high installation and maintenance costs of detection devices and difficulty in resolving signal attenuation issues, they are not easily scalable for large-scale deployment. Additionally, some methods use acoustic signals generated by tapping [
4] and vibration signals [
5] to identify bolt loosening. However, these methods are susceptible to noise and it is difficult to improve their robustness.
With the development of computer vision technology and artificial intelligence, image-based bolt loosening identification has become a feasible solution that benefits from ease of deployment and cost-effectiveness. Detection methods based on visual technology can be classified into external marker comparison methods and self-feature comparison methods. External marker comparison methods typically require pre-marking on bolts, and the changes in the markers are monitored to determine the condition of the bolt. Deng Xinjian et al. [
6] proposed a bolt loosening recognition method based on marked ellipses and points, which integrates computer vision and geometric imaging theories to calculate the loosening angle of marked bolts; Ji Wang et al. [
7] proposed a cascade deep convolutional neural network to extract marker line features on bolts to detect loosening. They used an improved SSD network to locate bolts and PFN to extract marker line regions, and finally determined whether the bolts were loose based on the angle of the marker lines. Jun Luo et al. [
8] suggested installing a regular hexagonal cap on the nut as a reference object and detecting the difference between the hexagonal cap and nut to determine the loosening angle. These external marker-based methods rely on marker recognition, susceptible to environmental influences, and are unsuitable for outdoor environments.
Self-feature comparison methods usually focus more on the recognition of the features of bolts, such as edge characteristics. Tianyi Wu et al. [
9] proposed a high-resolution cross-scale transformer deep learning backbone to construct a bolt 3D model and extract high-precision key-points. Then, a monocular vision measurement model was established to obtain the exposed length of the bolt and evaluate its connection loosening status. Thanh-Canh Huynh et al. [
10] developed a deep learning algorithm based on regional convolutional neural networks, automatically detecting and cropping bolts in connection images combining the Hough line transformation to extract nut edges to calculate the rotation angle of the bolt, and finally determining the loosening by comparing it with a preset threshold. Lu Qizhe et al. [
11] proposed a bolt-loosening angle detection method based on machine vision and deep learning. The method first constructs a virtual lab in Unreal Engine 5 to automatically generate and label the synthetic datasets. The YOLOv7 framework was then used to train datasets accurately to recognize bolt key points under different angles and lighting conditions. Finally, the loosening angle was calculated using the key points and their adjacent positional relationships. Daoyuan Song et al. [
12] proposed a bolt loosening detection method based on Canny edge detection. The marker regions were extracted through the HSV color space and processed with expansion, erosion, and intermediate filtering, followed by applying the Canny edge detector for edge segmentation, and loosening was determined by fitting the edge slope. Young-Jin Cha et al. [
13] proposed a visual bolt loosening detection method. This method captures bolt images using a smartphone camera, extracts features such as bolt head dimensions through image processing techniques like the Hough transform, trains a linear support vector machine classifier to distinguish between tightened and loosened bolts, and evaluates the algorithm’s performance using leave-one-out cross-validation.
During the installation of rail clamps, fish-tail bolts usually need to be installed alternately in opposite directions to maintain balance. To ensure the safety of train operation, inspection cameras cannot be installed inside the track, therefore they can only be placed outside the track to capture images at a downward angle. However, images captured from such an oblique perspective often result in the loss of some bolt features, making it difficult to restore rigid geometric characteristics and extract and filter effective corner features.
Despite the growing application of computer vision-based methods in bolt loosening detection, there is currently no dedicated approach specifically designed for detecting fish-tail bolt looseness in railway environments. The unique challenges posed by railway infrastructure, such as the oblique perspectives of inspection cameras and the structural characteristics of fish-tail bolts, make it difficult to directly apply existing methods.
With the rapid advancement of computer vision and deep learning, image-based detection techniques have emerged as a promising solution, offering numerous advantages, including low operational and maintenance costs, strong generalization capability, and non-contact monitoring. By strategically deploying detection devices at key railway locations—such as stations, bridges, and tunnel entrances—real-time monitoring can be achieved, significantly reducing both time and labor costs while effectively preventing potential safety hazards that may arise from undetected bolt loosening. Moreover, continuous monitoring of bolt loosening in critical areas enhances railway safety and provides valuable data for fish-tail bolt quality assessment and preventive maintenance. By analyzing loosening trends, maintenance teams can take proactive measures to reinforce or replace bolts before failures occur, ultimately extending component lifespan and reducing maintenance costs. Given these benefits, developing an accurate and efficient fish-tail bolt loosening detection method is of great significance for railway safety and operational efficiency.
In summary, for fish-tail bolt loosening detection in the context of an oblique perspective scene, current computer vision-based methods for bolt loosening detection face the following two significant issues:
Restoring the rigid geometric features of the bolt from an oblique perspective is challenging, making it difficult to map the relative angles to true angles.
Extracting and filtering the corner features of the bolt from an oblique perspective is also problematic.
To address the difficulty in angle mapping, this study combines the rigid characteristics of rail clamps with perspective projection algorithms. By constructing and querying a standard clamp size database, an adaptive correction method of “one transformation, two corrections” was designed based on the size characteristics of rail clamps. To tackle the issue of extracting and filtering corner features, this paper combines the angular characteristics of bolts under tilted perspectives and proposes an approach that employs the Lightweight OpenPose network to integrate spatial positional features of bolt edges, enabling angle recognition of key bolt edges based on Gaussian ring-shaped smooth labels.
The remainder of this paper is organized as follows.
Section 2 provides a detailed introduction to the methods and processes involved in bolt loosening detection.
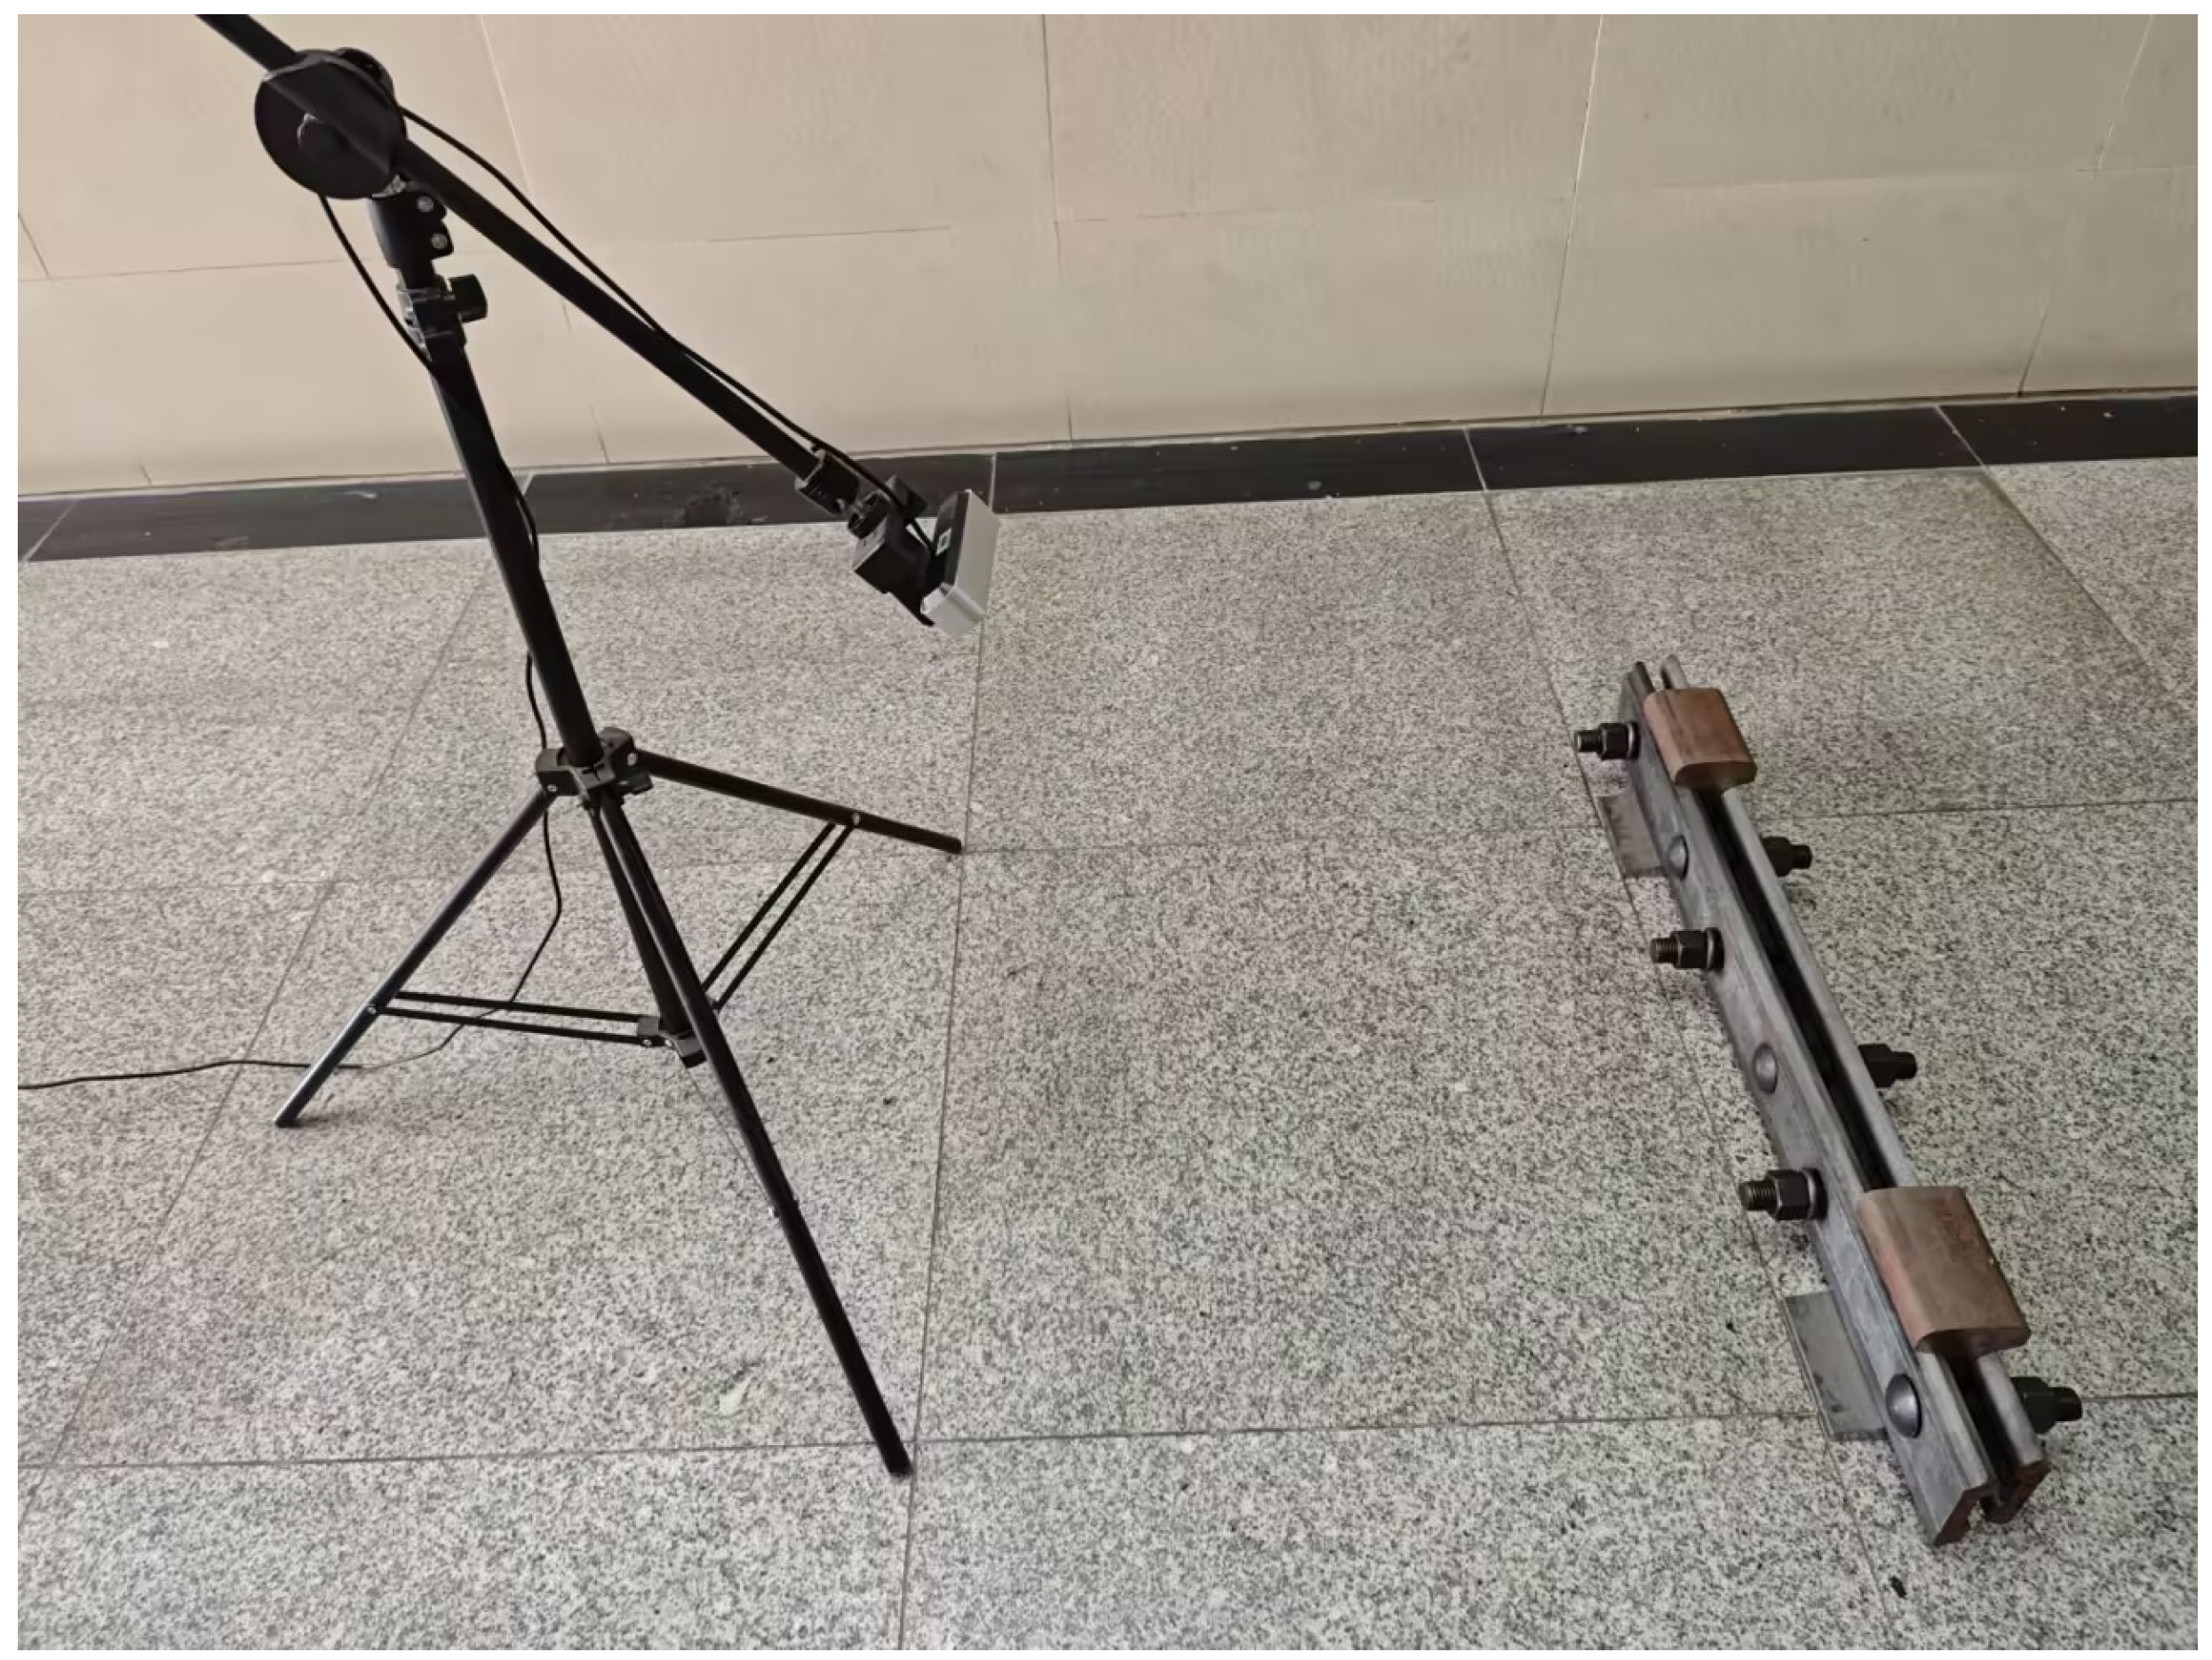
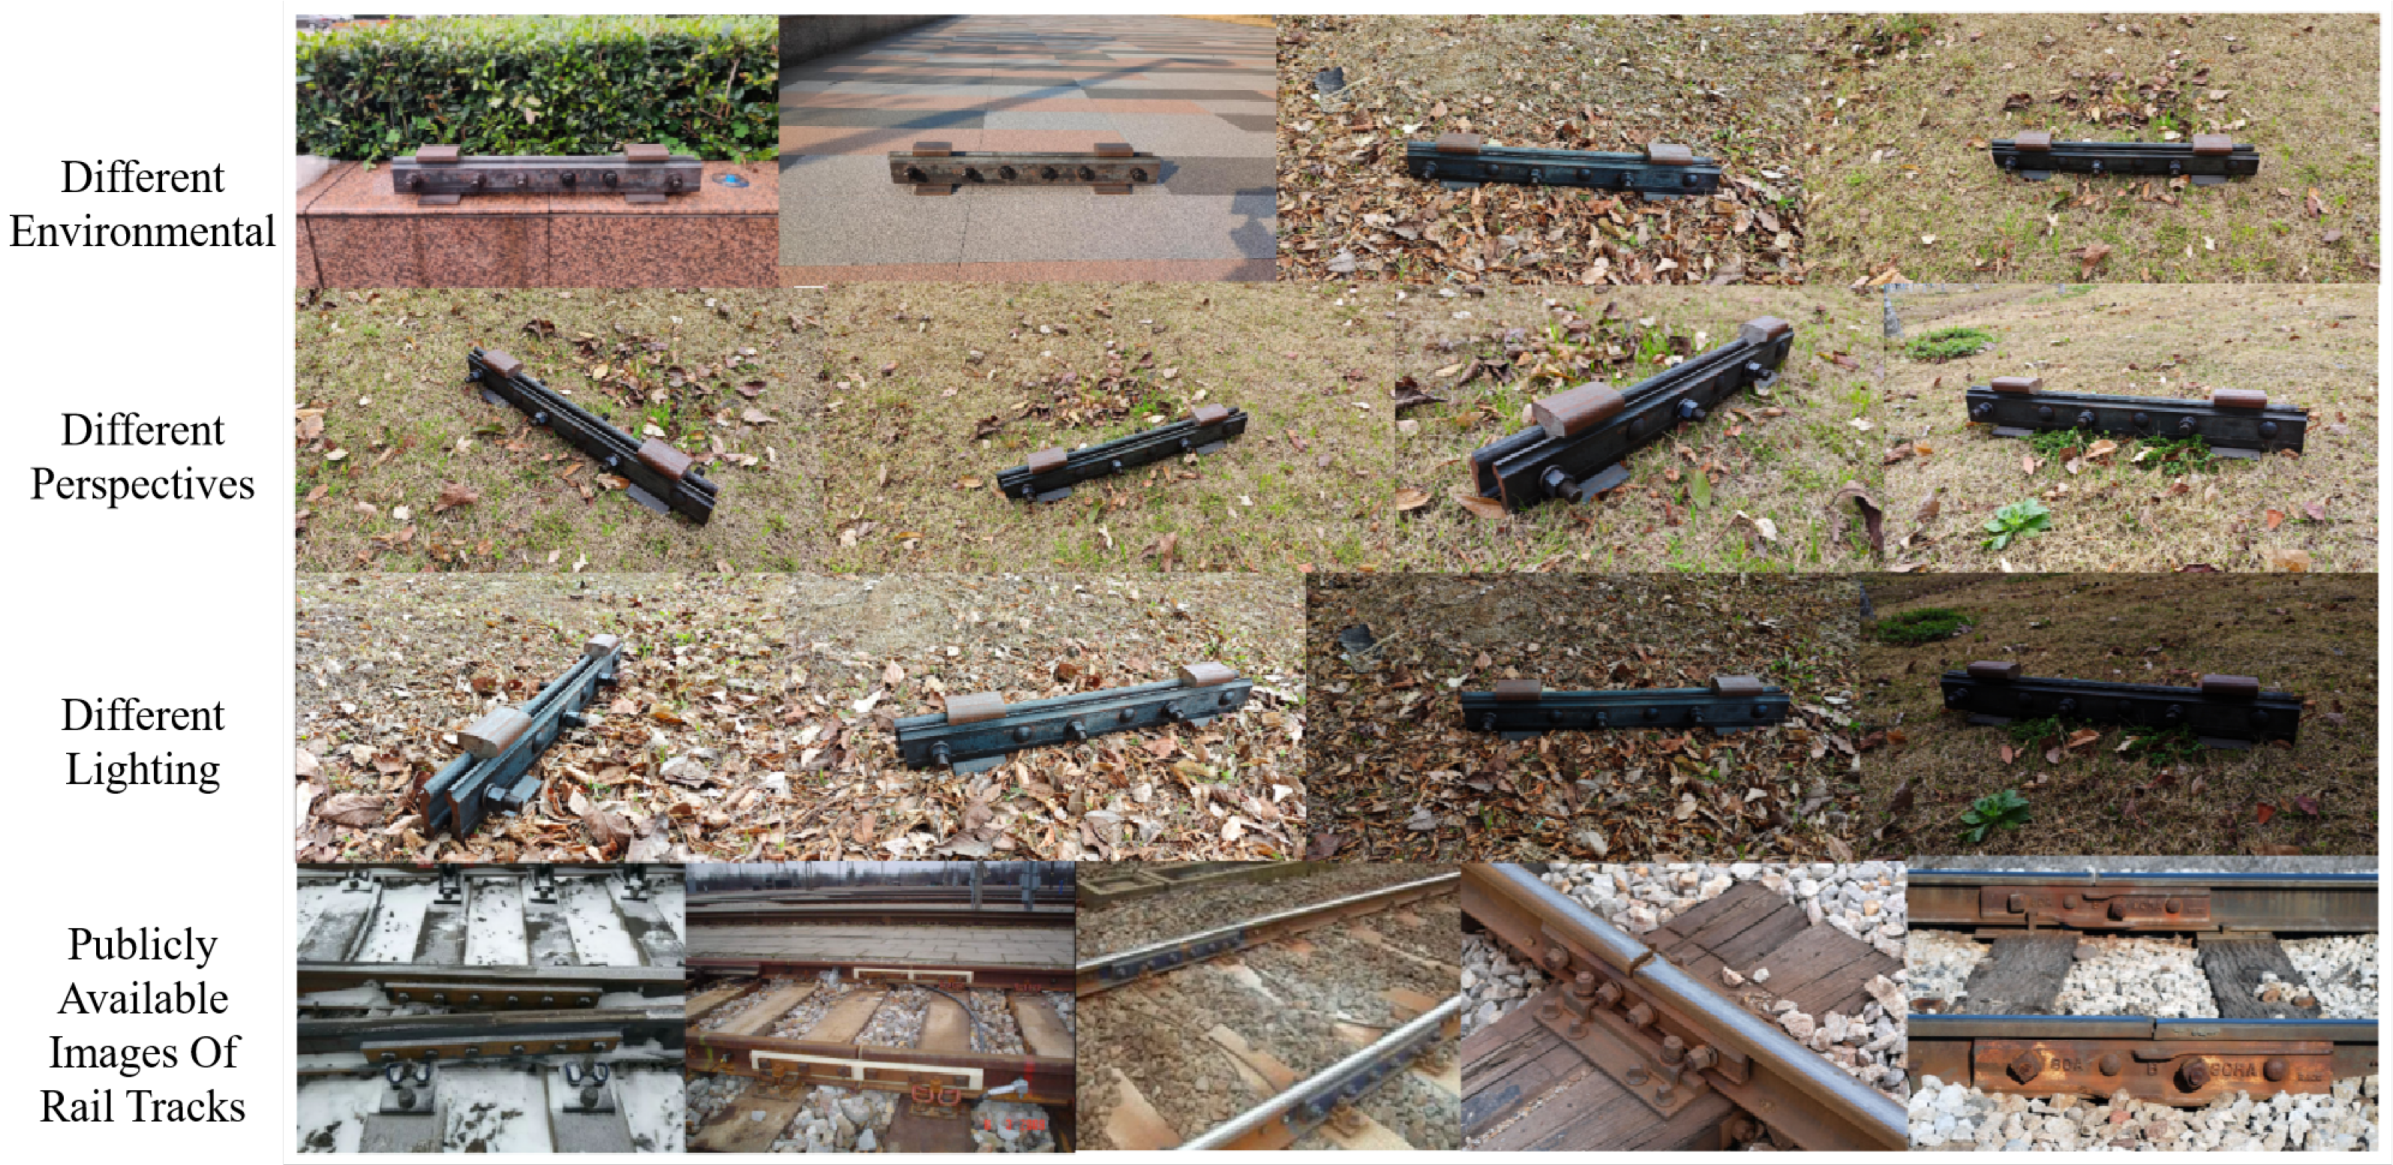
Section 3 covers the experiments and analysis, including the platform setup, data collection, and analysis of experimental results. Finally,
Section 4 concludes the paper.
2. Methodology
2.1. Unique Angle of the Bolt
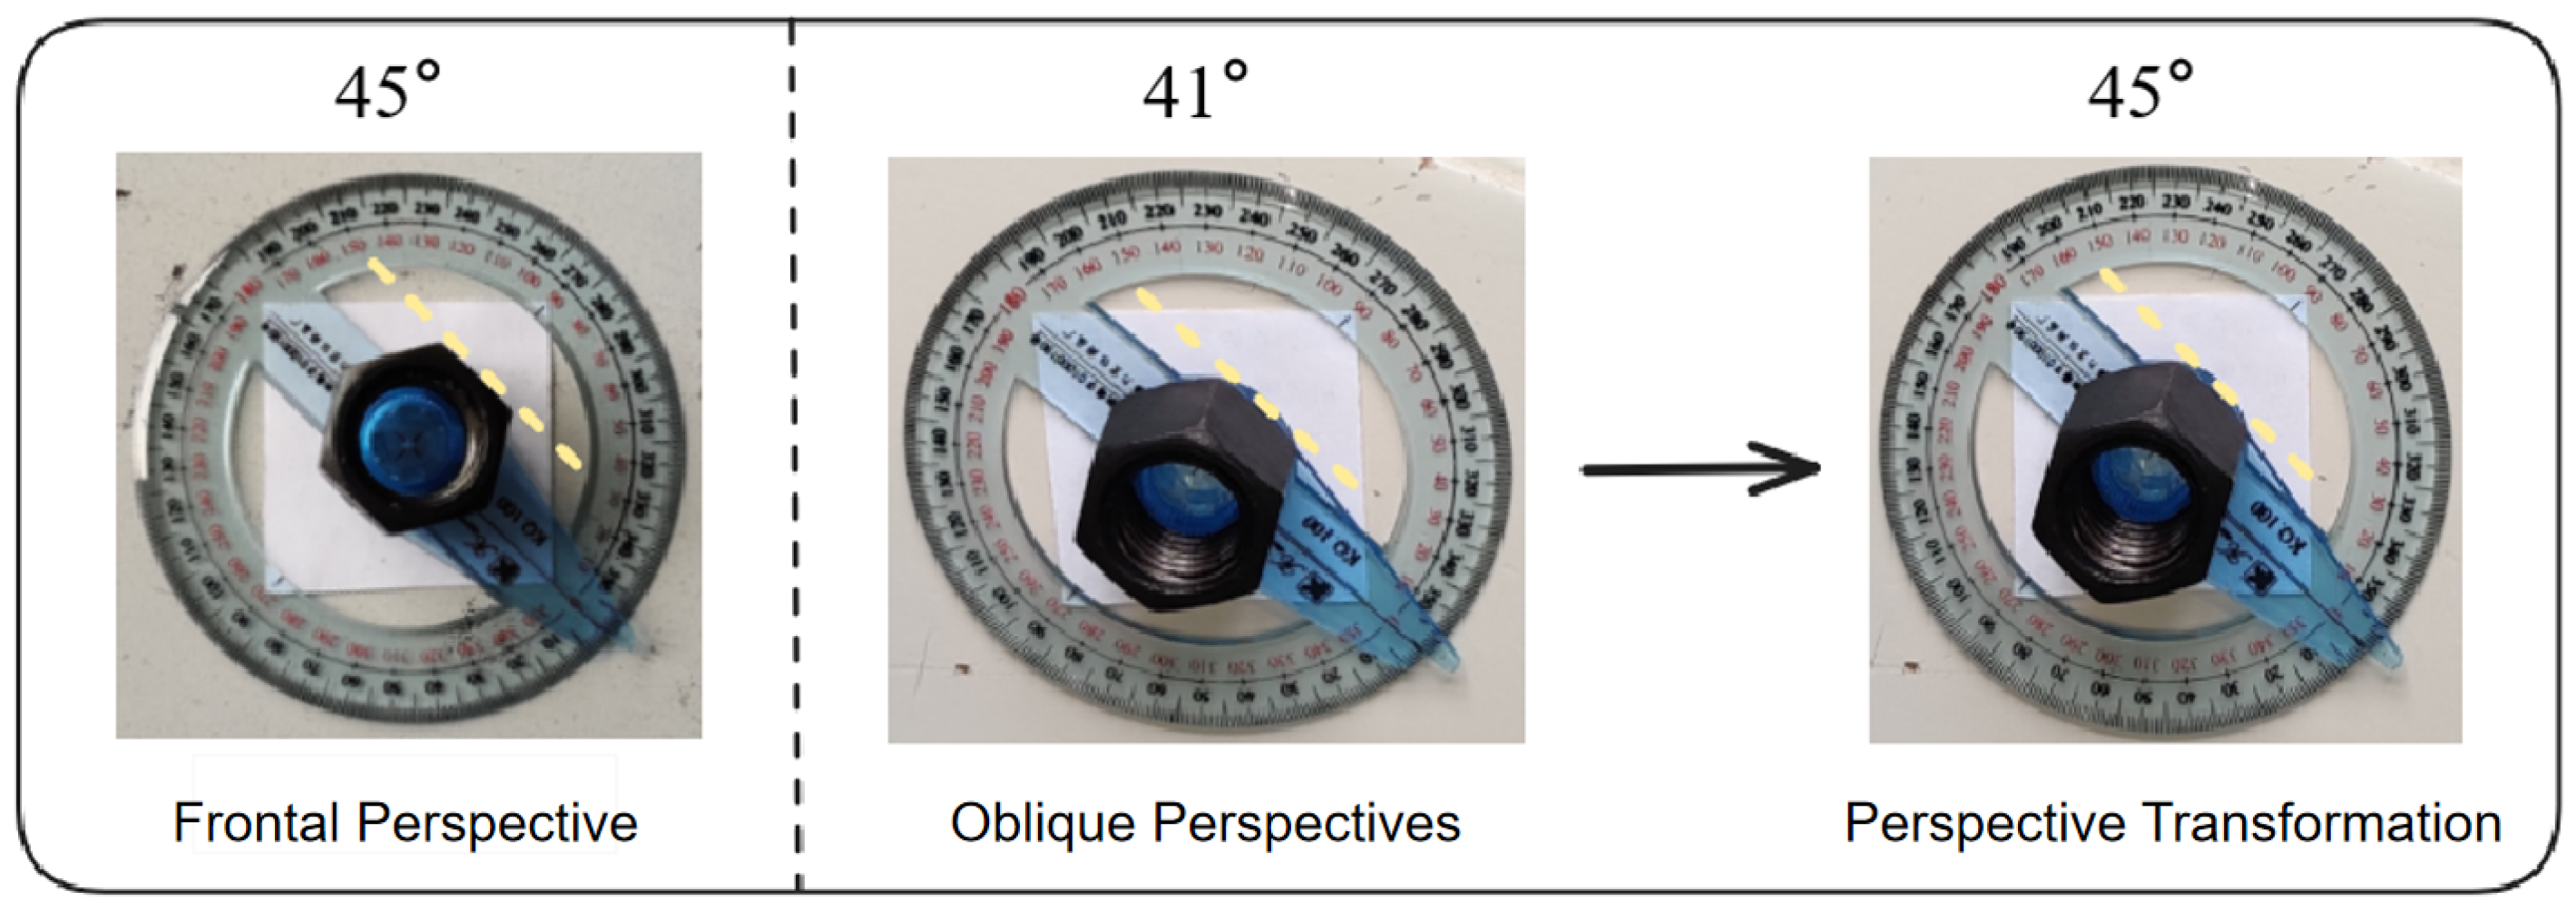
When observed from the front, the fish-tail bolt has a regular hexagon shape, which perfectly overlaps with its previous state after a 60° rotation. This indicates that without marking the bolt, its orientation can be defined to identify the rotational angle within a 60° range. Within this range, the angle of any edge of the bolt accurately reflects its overall angle. Owing to the fact that fish-tail bolts are typically installed in opposite directions and for the safety of train operation, cameras cannot be installed within the tracks for photography. Therefore, bolts within the tracks need to be photographed and inspected from outside the tracks at an oblique angle. However, under an oblique perspective, although the bolt’s central symmetry allows it to align with its previous state after a 60° rotation, the edges of the bolt are no longer able to directly reflect its overall angle due to the influence of perspective projection. To solve this problem, we can utilize perspective transformation to restore the geometric relationship of some edges of the bolt in a frontal view, a process illustrated in
Figure 1. By identifying the angles of the key edges of the bolt image after perspective transformation from different oblique perspectives, we can obtain the true angle of the bolt.
2.2. Bolt Loosening Detection Procedure
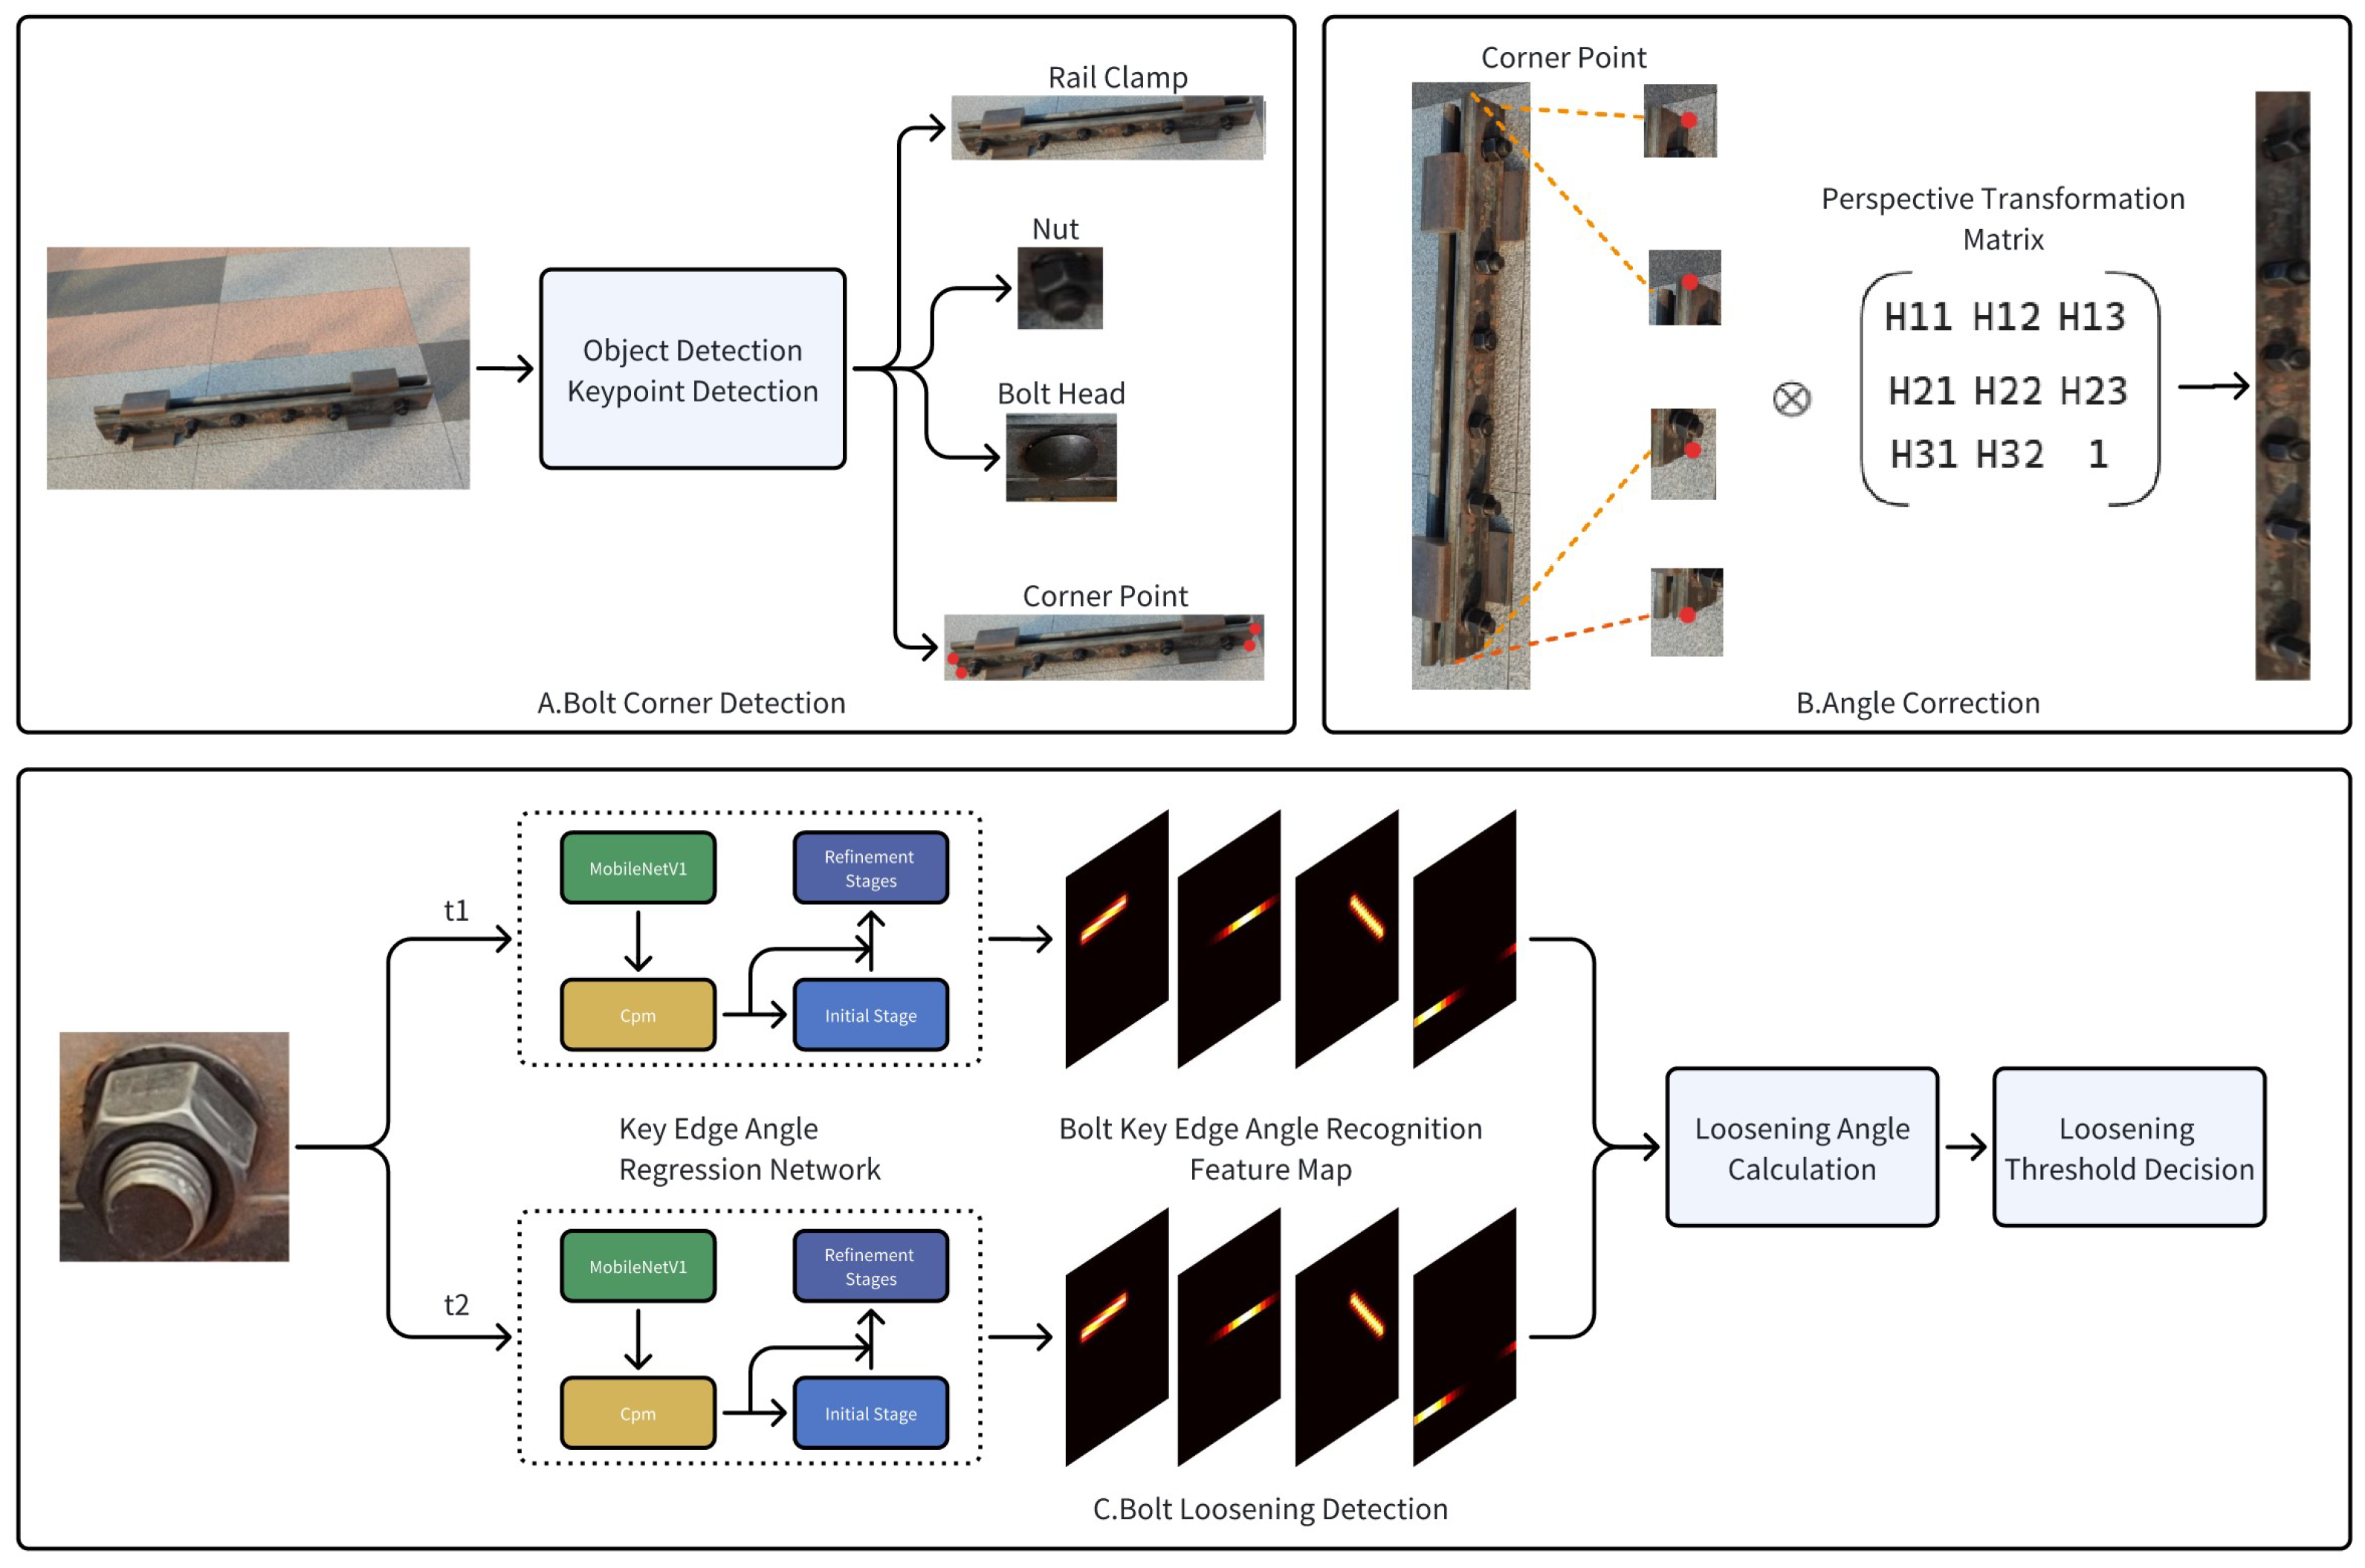
The core of the fish-tail bolt loosening detection method proposed in this study is to compare the differences in the key edge angles of the bolt between different time frames to determine whether the bolt has loosened, provided that differences exceed a certain threshold. The detection process is illustrated in
Figure 2 and consists of three sequential steps: fish-tail bolt localization, bolt image rectification, and bolt loosening detection.
Initially, object detection and keypoint extraction were performed on the captured rail images, identifying the rail clamp, nut, bolt head, and corner points of the rail clamp edges. Subsequently, based on the corner coordinates and the positional relationship of the bolt bounding boxes, combined with the size standards of the rail clamp, perspective transformation was applied to the image to restore the geometric relationship lost owing to the tilted viewing angles between the bolt’s key edges and the stretcher bar. Subsequently, the transformed bolt image was cropped, and the key edge angles were identified. In the figure, and represent different time frames. By comparing the angle differences of the same bolt position at different time frames, bolt loosening can be detected. To reduce false detections caused by angle recognition errors, a loosening threshold is introduced. A bolt is only determined to be loose if the angle difference reaches the predefined threshold. Through repeated experiments, this threshold is set to three times the minimum average error of the key edge angle recognition model.
2.3. Object Detection
Object detection is a computer vision algorithm used to identify the location of specific objects in an image. In this study, we employed an object detection algorithm to locate rail clamps and fish-tail bolts. Object detection algorithms can be broadly classified into two categories: one-stage and two-stage. Two-stage object detection typically involves two separate steps: candidate region extraction and target information regression. Conversely, one-stage object detection omits candidate region extraction and directly predicts the location and category information of a target through regression. While two-stage object detection often achieves higher accuracy in complex scenes, it also requires higher computational overhead. For simpler scenes such as rail clamp and fish-tail bolt detection, one-stage object detection algorithms are undoubtedly a better choice.
Among the one-stage object detection algorithms, the YOLO series [
14] stands out because of its excellent balance of speed and accuracy, making it a preferred choice for many object detection scenarios. In this study, we selected YOLOv8n to detect rail clamps and bolts. Although YOLOv8 [
15] is not the latest version of the YOLO series, its exceptional stability makes it a top choice for current object detection algorithms.
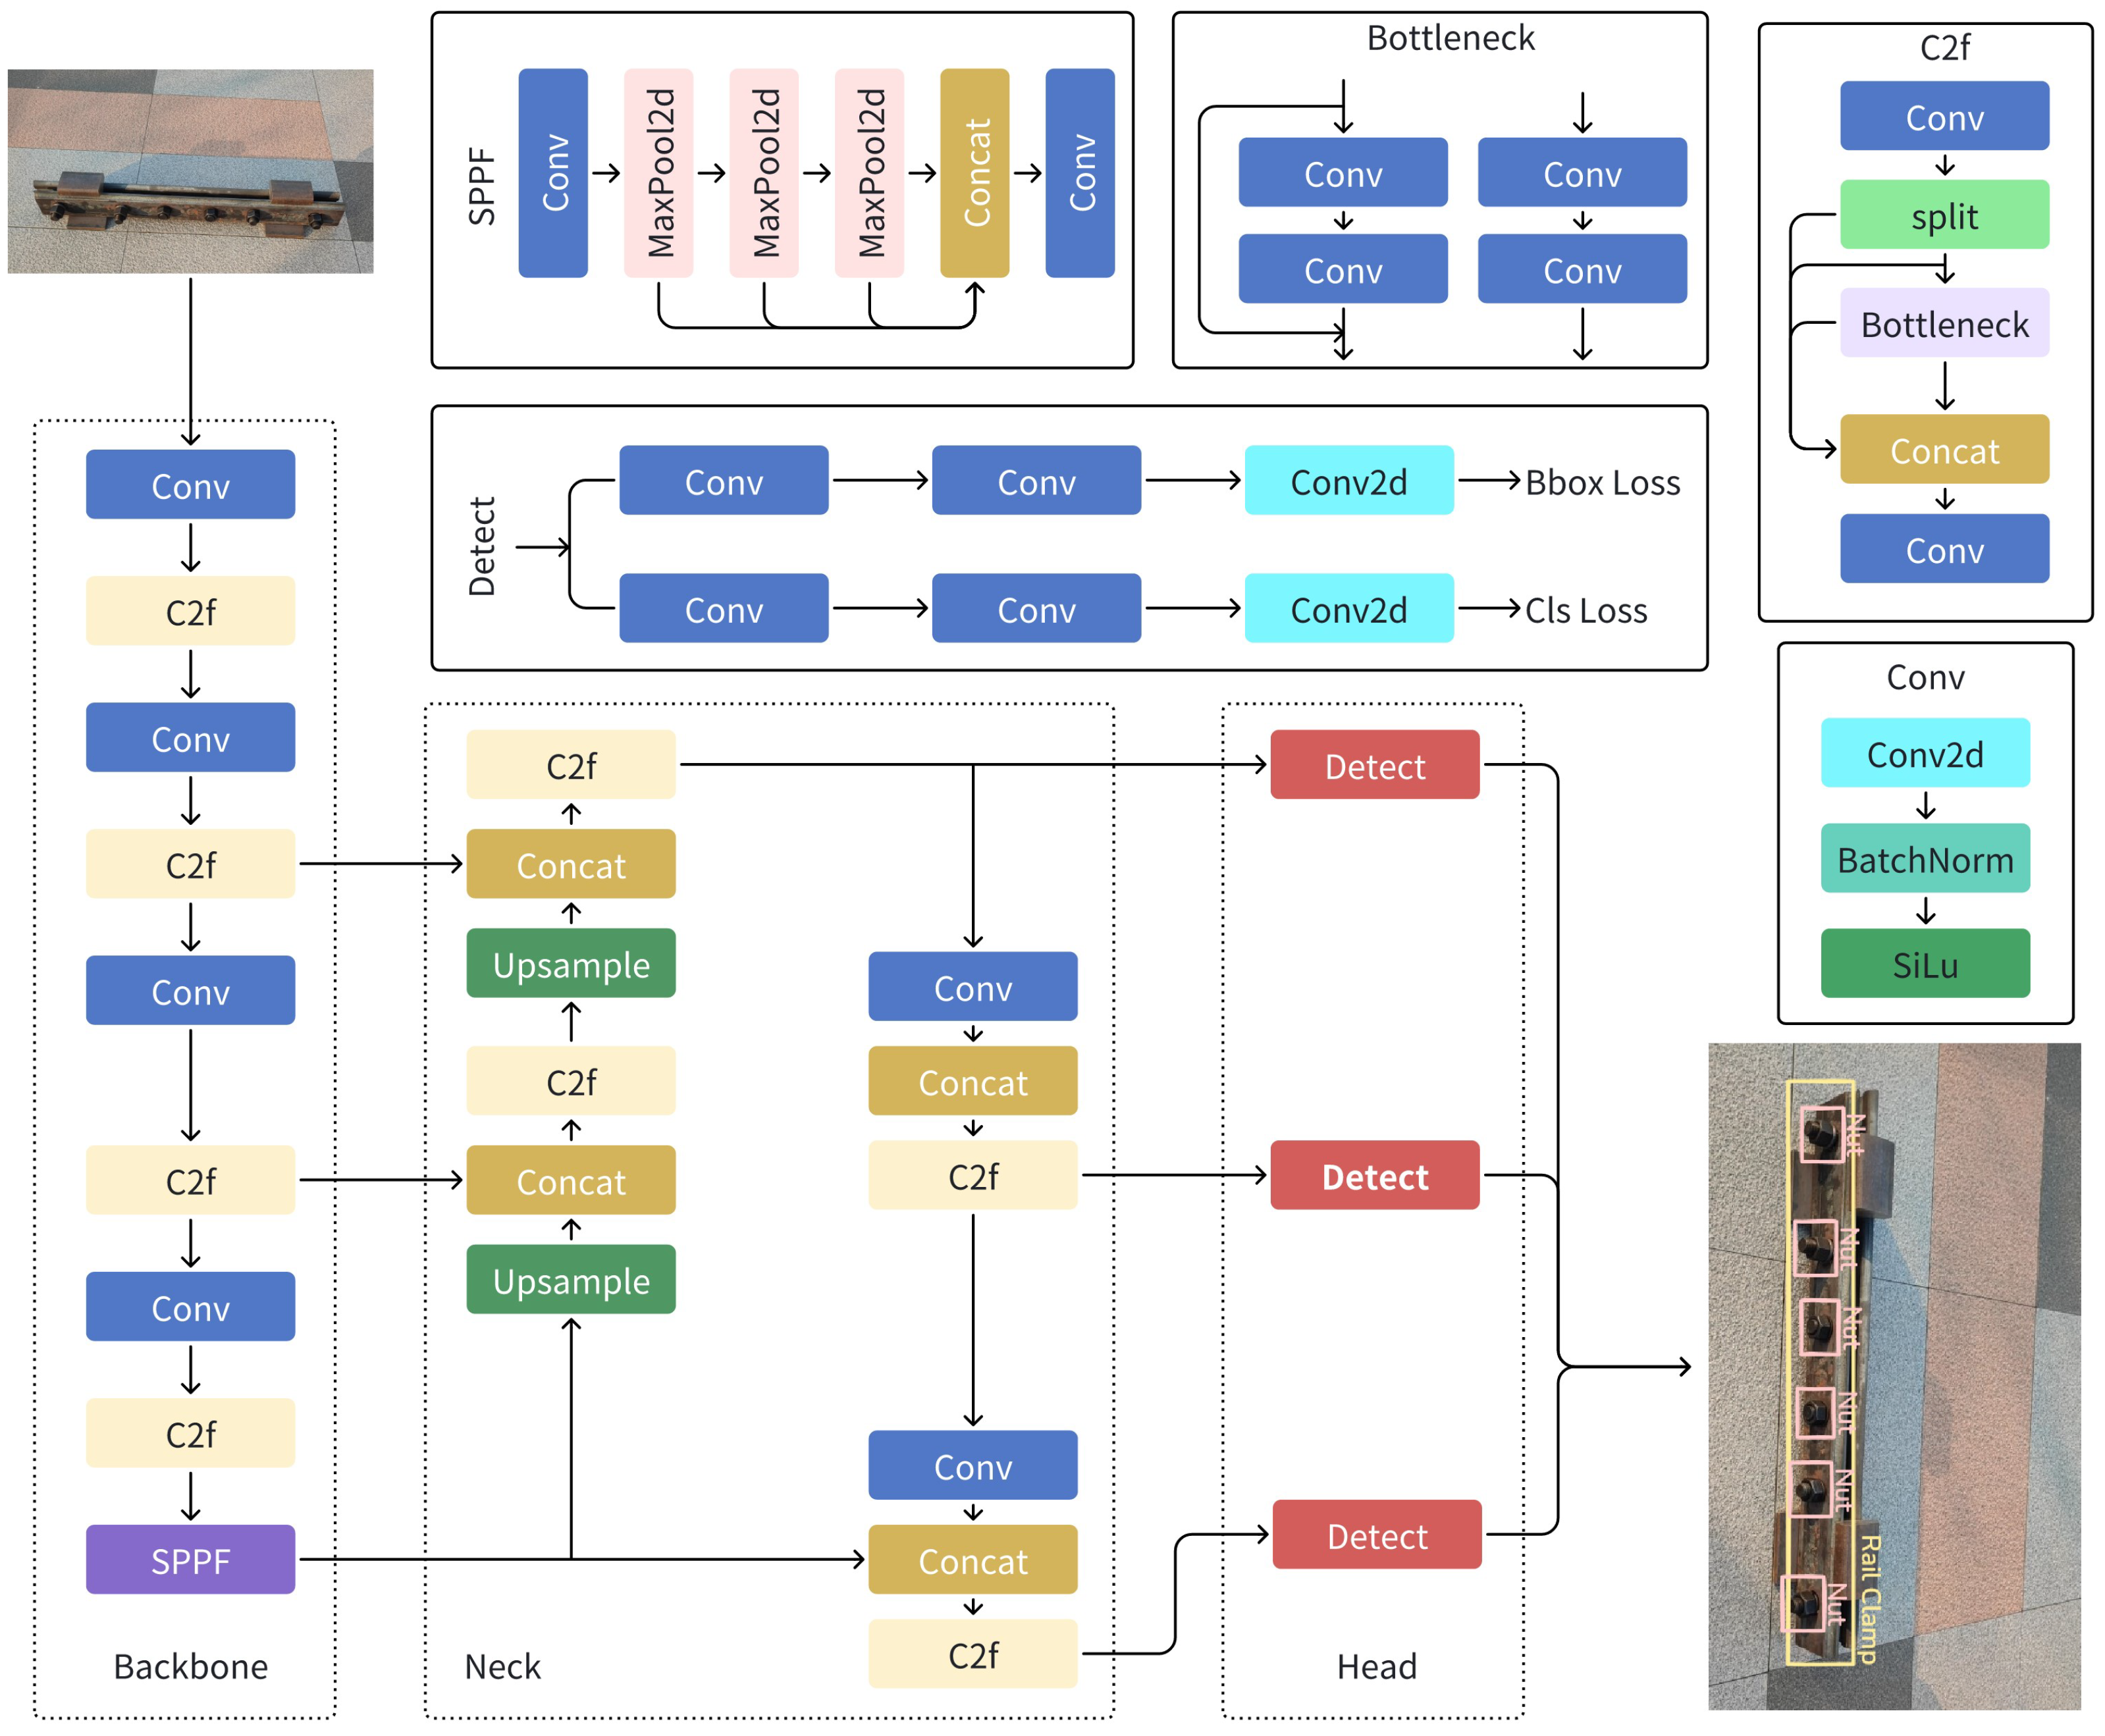
Figure 3 illustrates the network structure of YOLOv8, which is divided into three parts: backbone, neck, and head networks. The image was first resized to 640 × 640 and input into the backbone network for feature extraction. The backbone network then outputs feature maps of three scales, 80 × 80, 40 × 40, and 20 × 20, to the neck network. The neck network performs feature fusion and enhancement on these three scales of feature maps and similarly outputs three scales of feature maps to the head network. Finally, the head network predicted the target locations and categories of small, medium, and large objects in the image based on the three scales of the feature maps through two separate branches. Due to the fusion of features from different scales and separate predictions for targets of different sizes, YOLOv8 achieved good results for small targets that are difficult to detect.
2.4. Angle Correction
In images of rails captured from an inclined angle, the geometric relationship between the bolts and rail clamps is not represented as it would be in images taken perpendicular to the bolts (orthographic projection). Therefore, the angle of the bolt edges did not accurately reflect the true angle of the bolts. To obtain the true angle of the bolts, it is necessary to use a perspective transformation [
16] to restore the geometric relationship between the bolts and rail clamps under orthographic projection. Perspective transformation is a mathematical tool that maps image coordinate points to a new view plane, and the mapping formula can be expressed as:
Here,
represents the homogeneous coordinates of the original image,
represents the homogeneous coordinates of the transformed image, and
H is a
perspective transformation matrix. Although the
H matrix has nine unknowns, the normalization of the transformed homogeneous coordinates at the end ensures that multiplying anything other than zero on the right side of the equation does not affect the result. When solving for the
H matrix, it is common to multiply the
H matrix by
, constraining the number in the third row and third column of the
H matrix to one, and the homogeneous coordinates of the original image are generally initialized to one. Therefore, the perspective transformation formula can also be expressed as:
The above formula can be expressed in the form of the following system of equations:
A pair of coordinates before and after mapping can provide two equations in the
H matrix; at least four pairs of coordinates are required to solved the eight unknowns in the
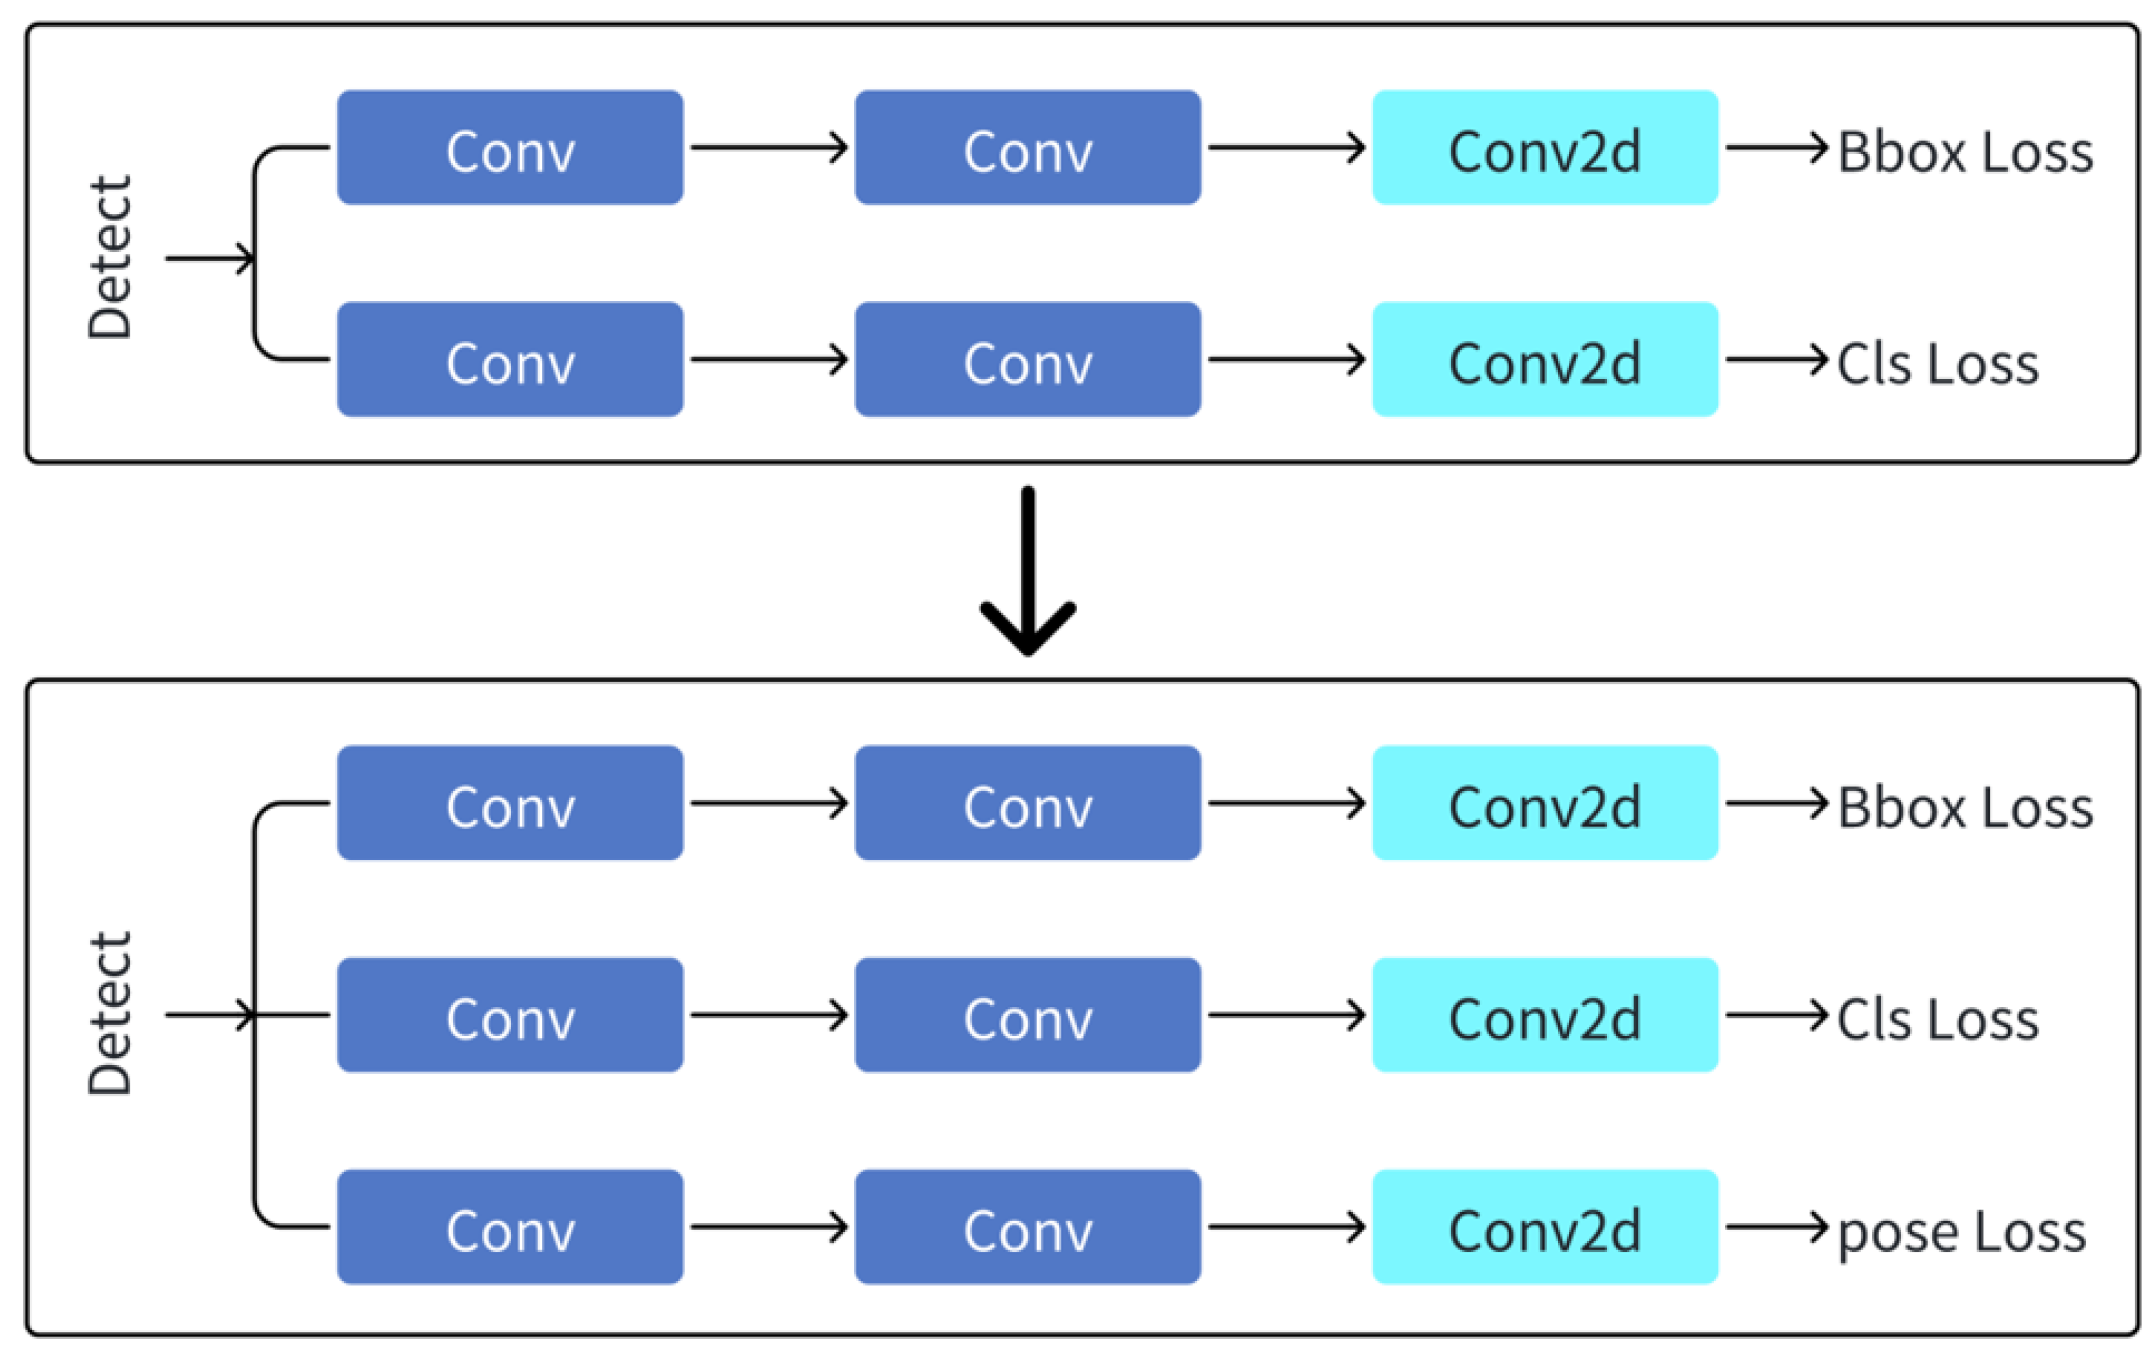
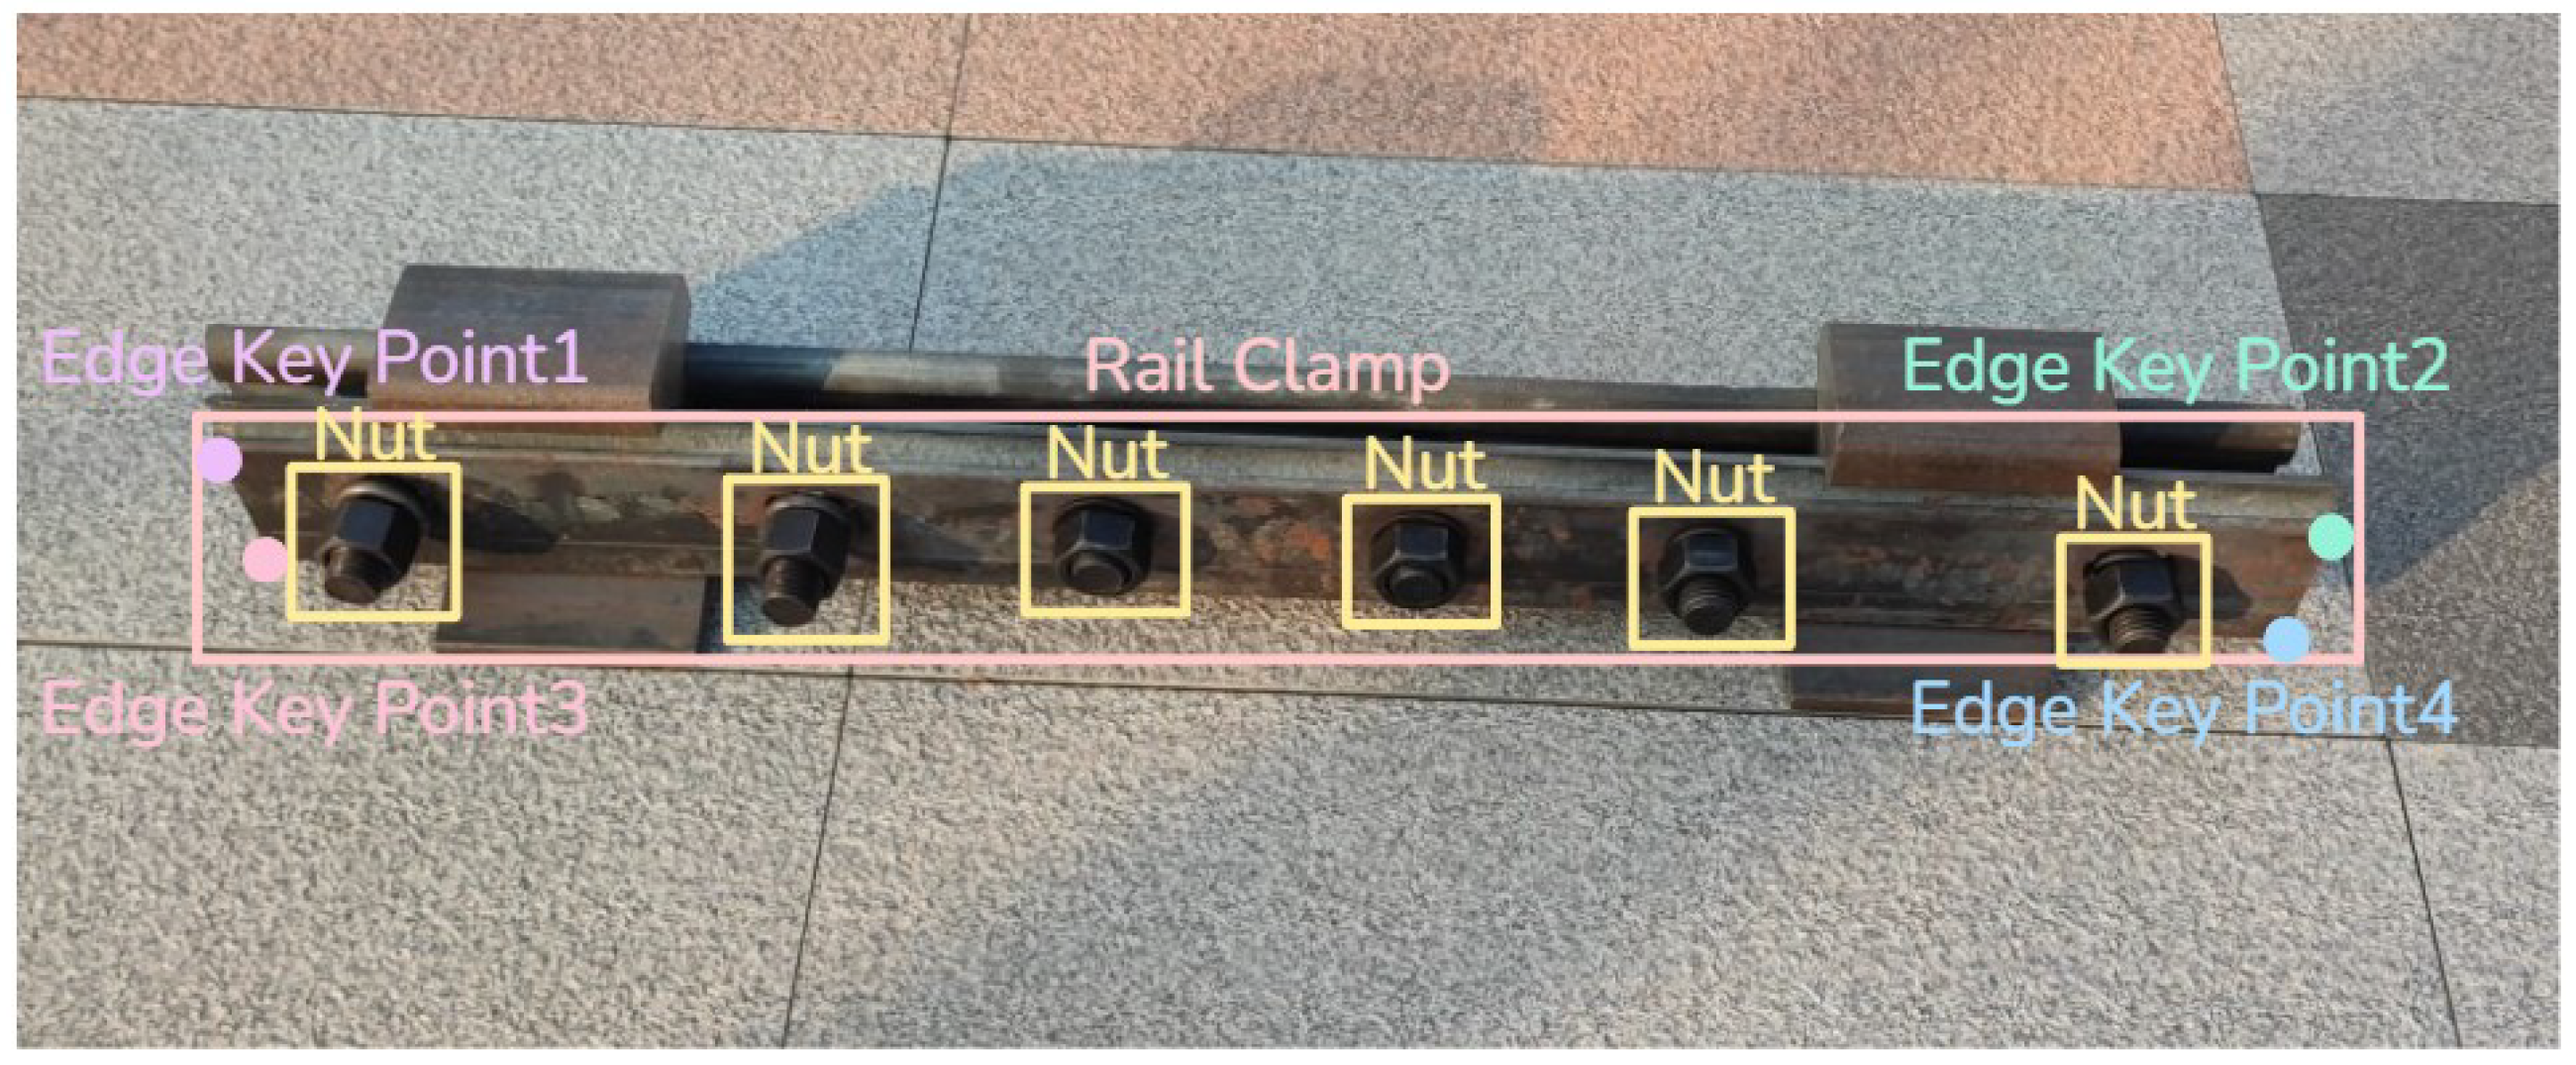
H matrix. Here, the four coordinates before mapping are the four corner points of the rail clamp, whereas the four coordinates after mapping are generated based on the dimensions of the clamp with the top-left corner as the origin. This study used keypoint detection to obtain the four corner coordinates of the rail clamp without the need for additional model algorithms. As shown in
Figure 4, by adding a keypoint detection branch to the output branches of the YOLOv8 head network and referencing YOLO-Pose [
17], it is possible to detect the four corner points of the rail clamp while detecting the clamp itself. The newly added keypoint prediction branch has a structure identical to that of other two branches, and the number of output channels is the number of keypoints multiplied by three.
After obtaining the four corner coordinates of the rail clamp, it was also necessary to generate the corner coordinates in a frontal view. To achieve this, we need to determine the dimensions of the clamp. Different rail clamps have their own standard sizes, so it is necessary to perform a “one transformation, two correction” using the bolt target detection box. One transformation refers to the initial use of the four corner points of the rail clamp target box as mapped coordinates to perform a perspective transformation on the bolt positions, restoring their horizontal positional relationships. Then, using the horizontal positional relationship of the bolts, that is the proportional relationship of the x coordinates of the centers of each bolt target box, combined with the number of bolts within the rail clamp, the rail clamp model can be determined. The four corner coordinates of the mapping are then generated based on the width and height of the rail clamp to perform a second perspective transformation, correcting the image.
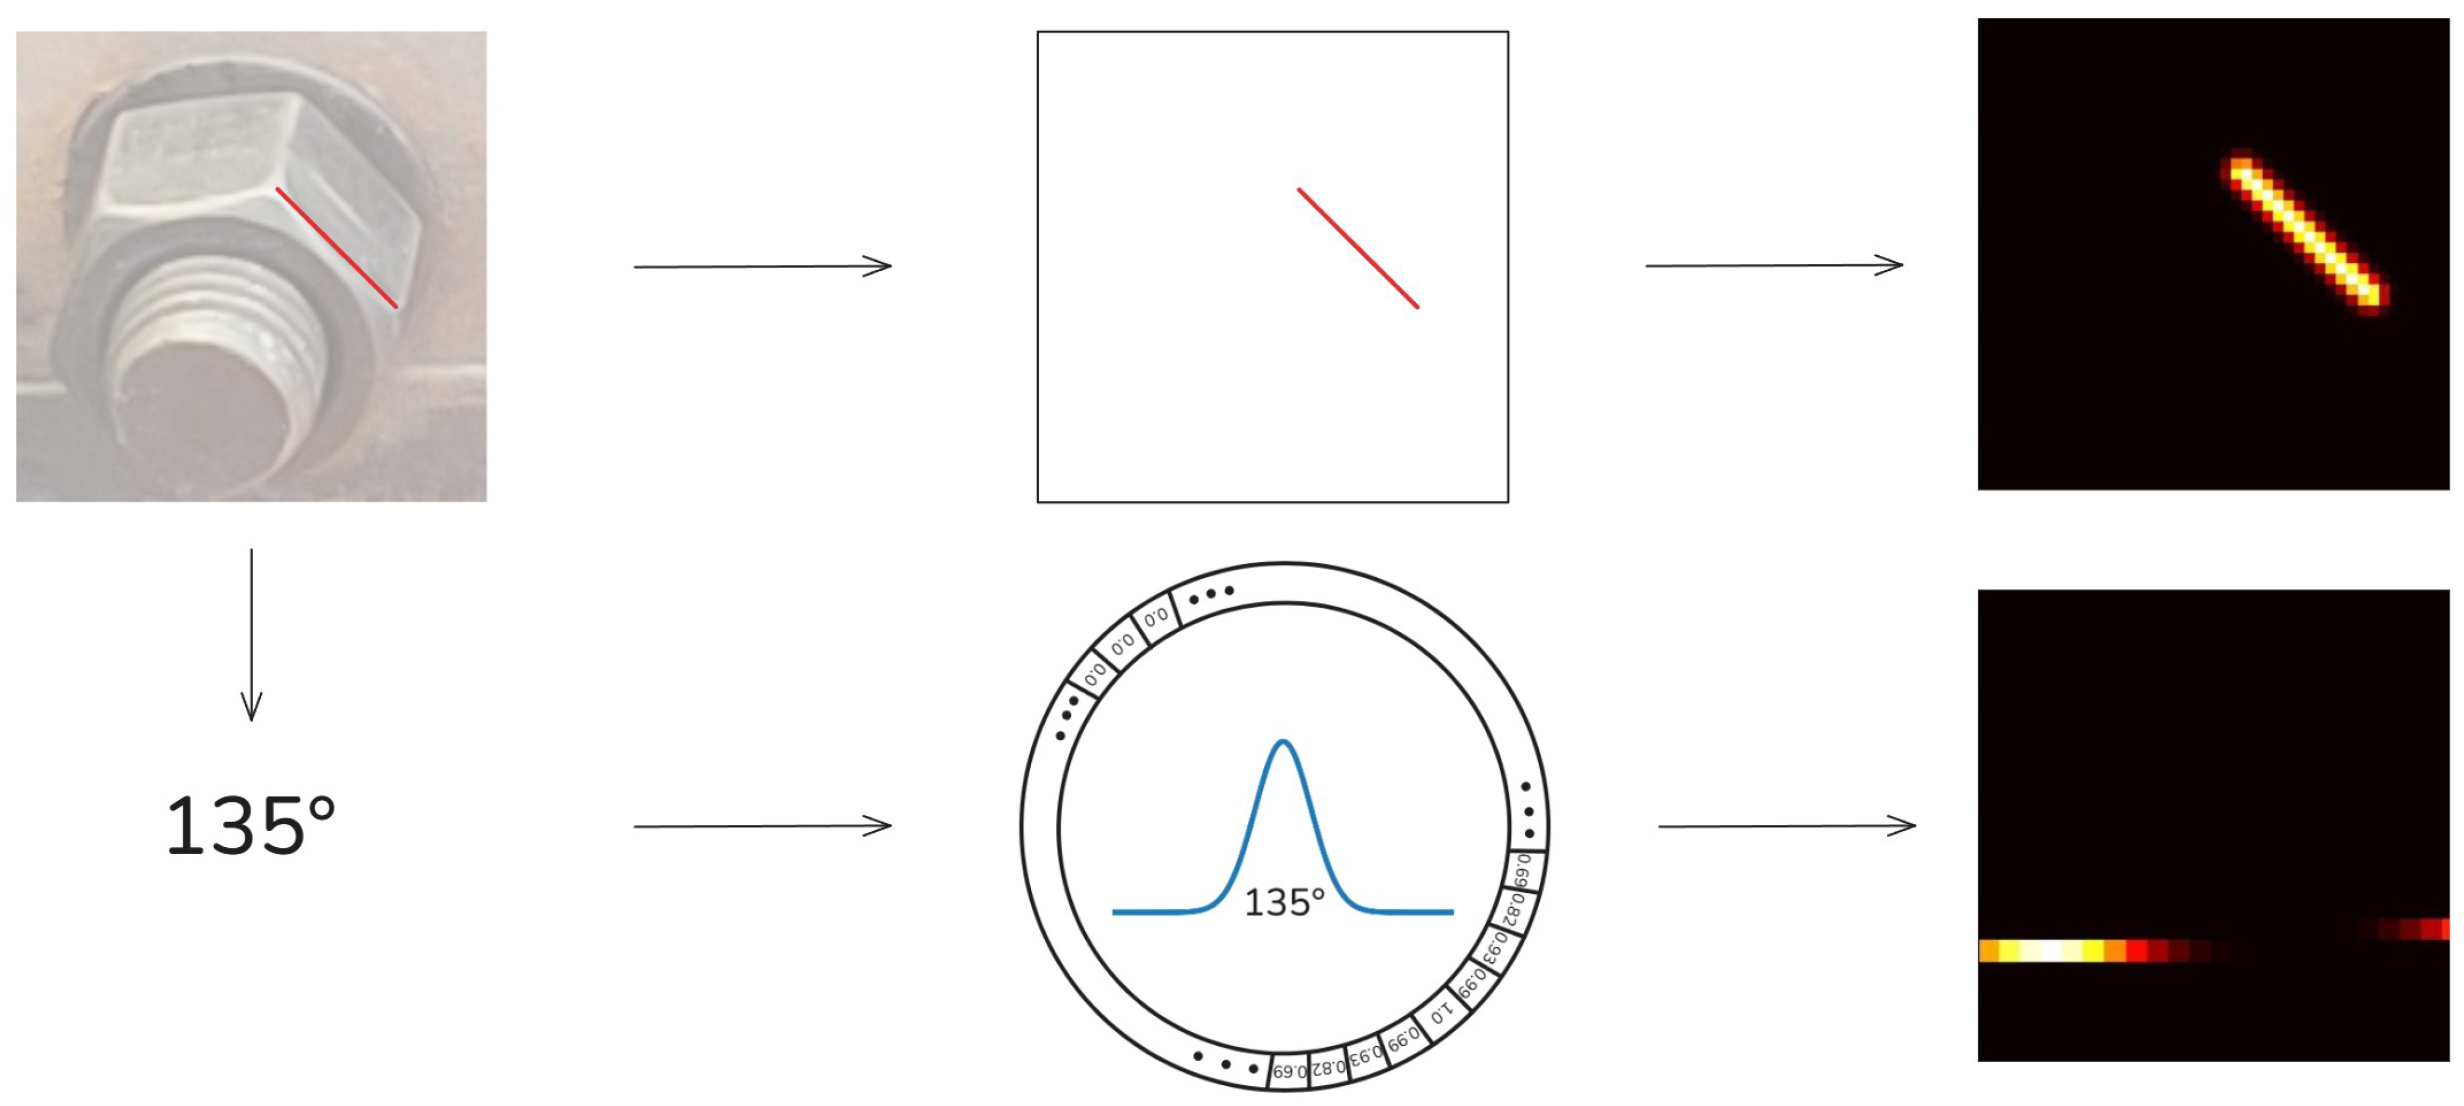
2.5. Angle Recognition of Key Bolt Edges
In traditional approaches, methods such as edge detection and line detection are typically employed to locate, filter, and recognize angles of bolt edges. However, experiments revealed that robustness struggles to improve due to the influence of viewing angles and lighting conditions. Additionally, under tilted perspectives, distinct bolt edges are challenging to differentiate and filter. Consequently, we aimed to develop an algorithm capable of distinguishing, localizing, and recognizing angles of bolt key edges while exhibiting strong robustness to varying perspectives and illumination environments. Deep learning algorithms based on convolutional neural networks (CNNs) emerged as a compelling choice.
Directly using regression networks to predict angles of bolt key edges, however, risks overfitting and training instability due to the periodic nature of angular data. To address this, our angle prediction design draws inspiration from Gaussian Circular Smooth Labels (GCSL) [
18], where each angle is assigned a smoothed label value and converted into a feature map for prediction. For network architecture, we incorporate the multi-stage refinement philosophy and large receptive field concepts from OpenPose [
19,
20], alongside the lightweight design of Lightweight OpenPose [
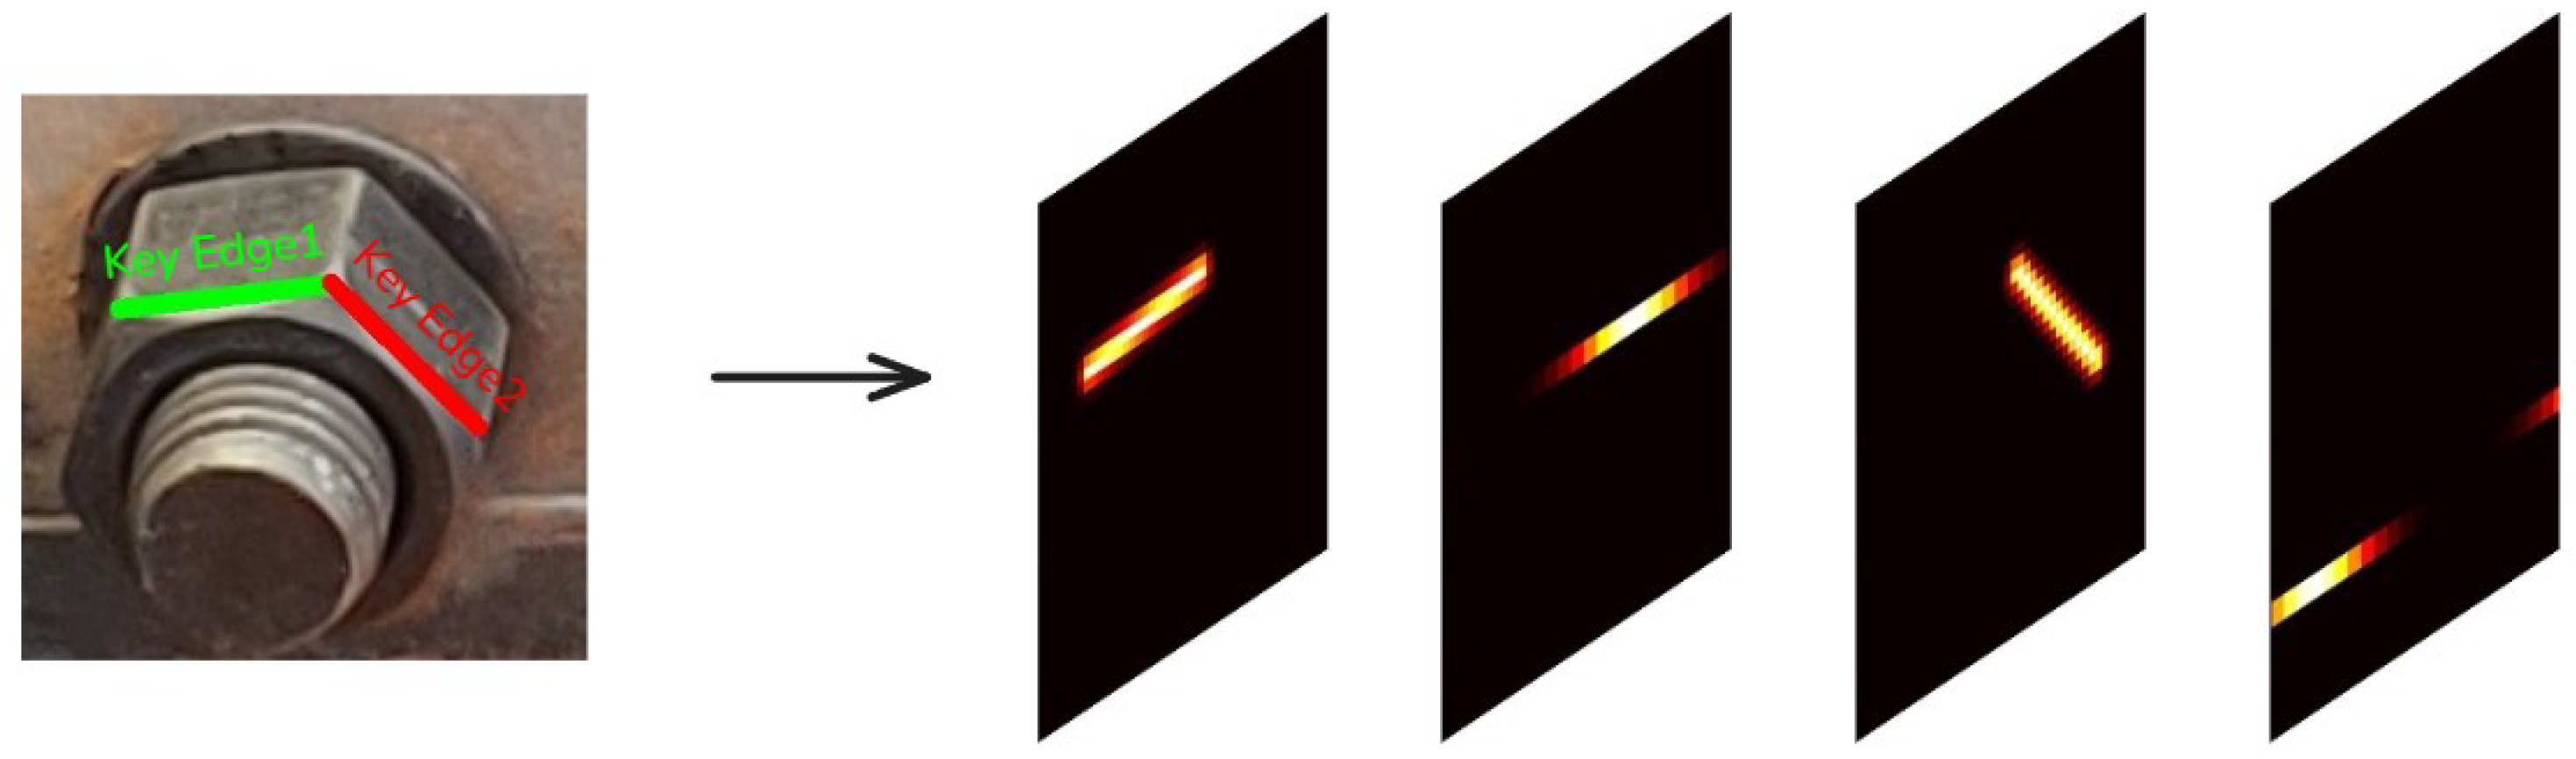
21], integrating spatial positional information of bolt key edges to refine angle learning. As shown in
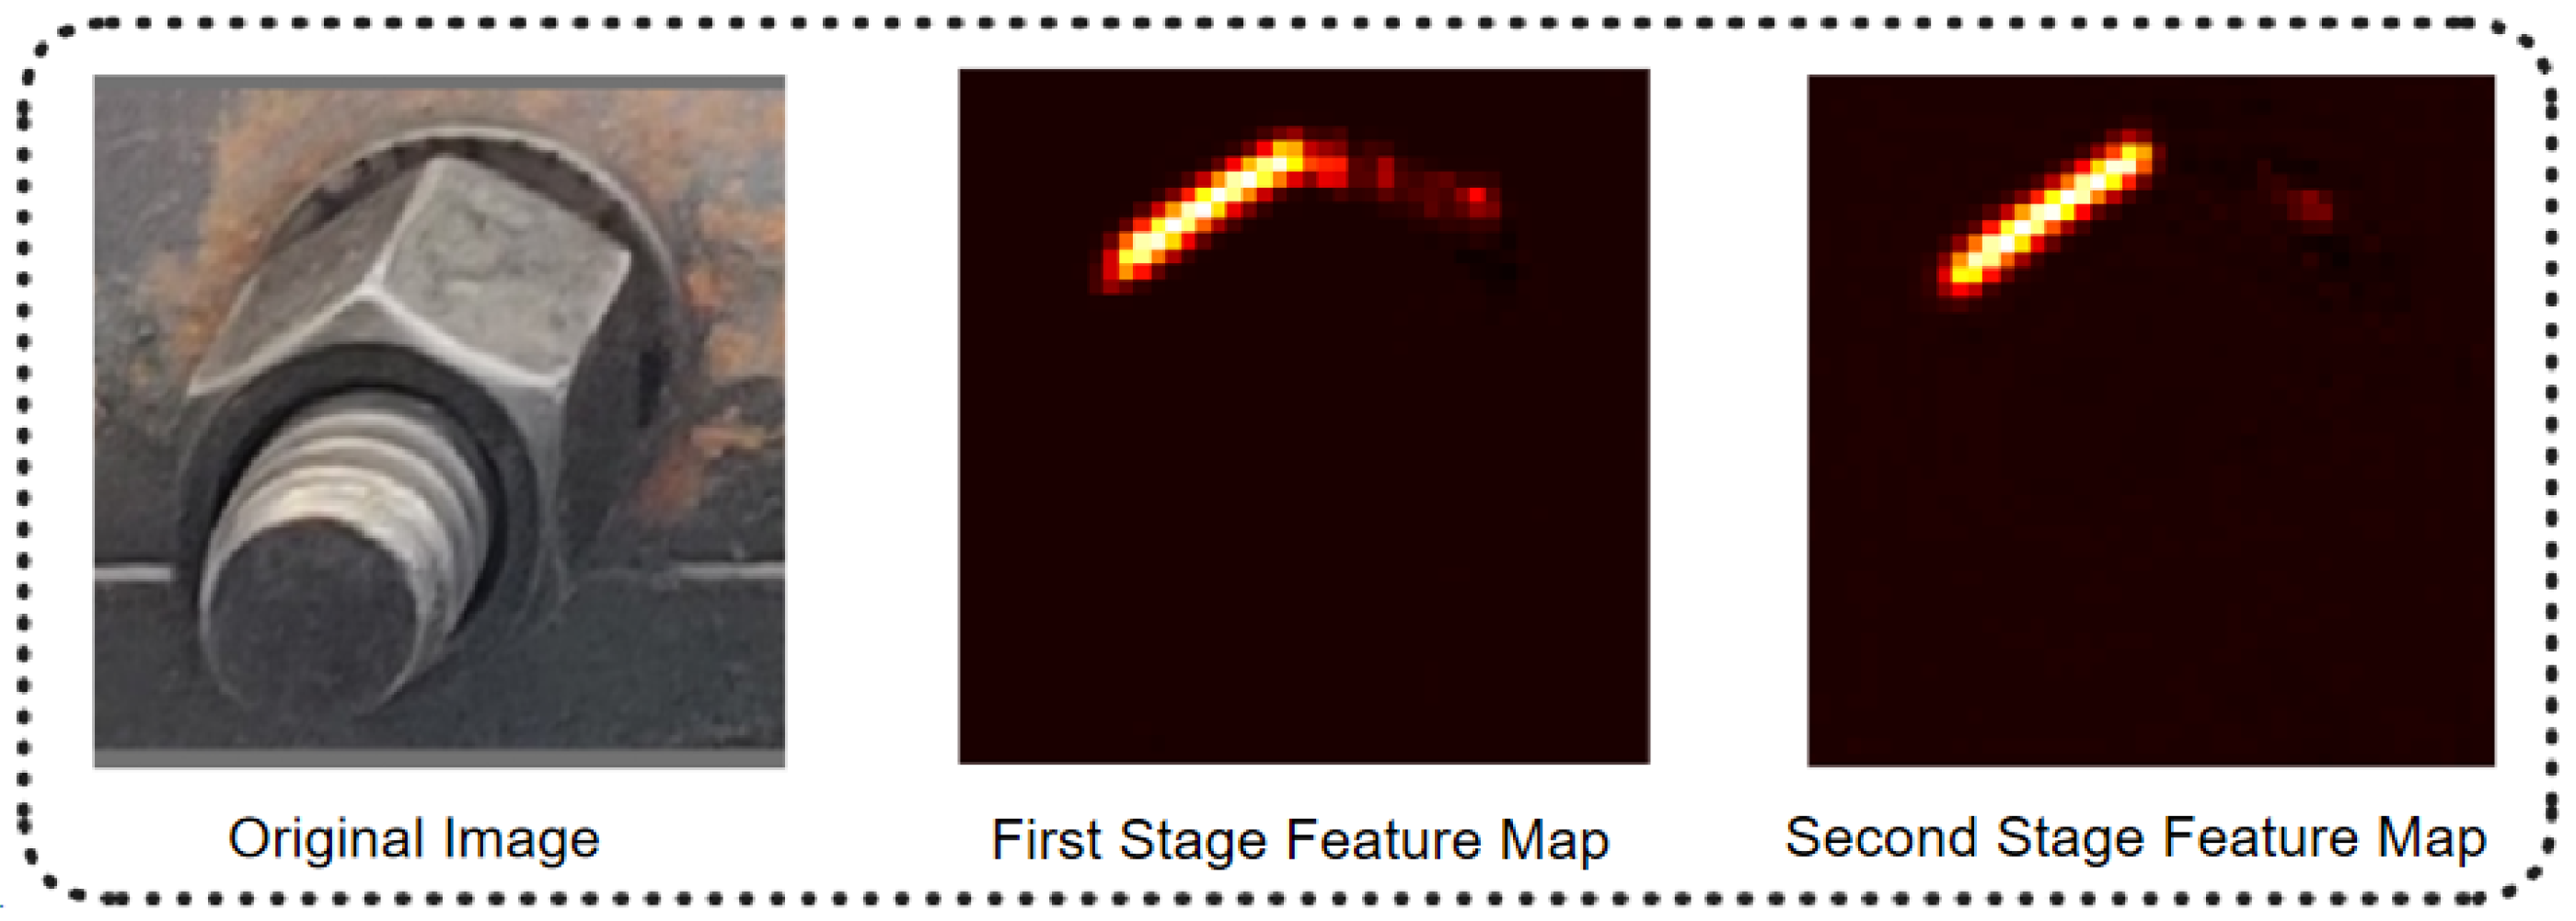
Figure 5, two types of feature maps are designed for each bolt key edge: a Gaussian heatmap and a Gaussian circular smooth label map. The Gaussian heatmap guides the network through multi-stage refinement by providing spatial positional features, while the Gaussian circular smooth label map predicts the angular orientation of the bolt key edge.
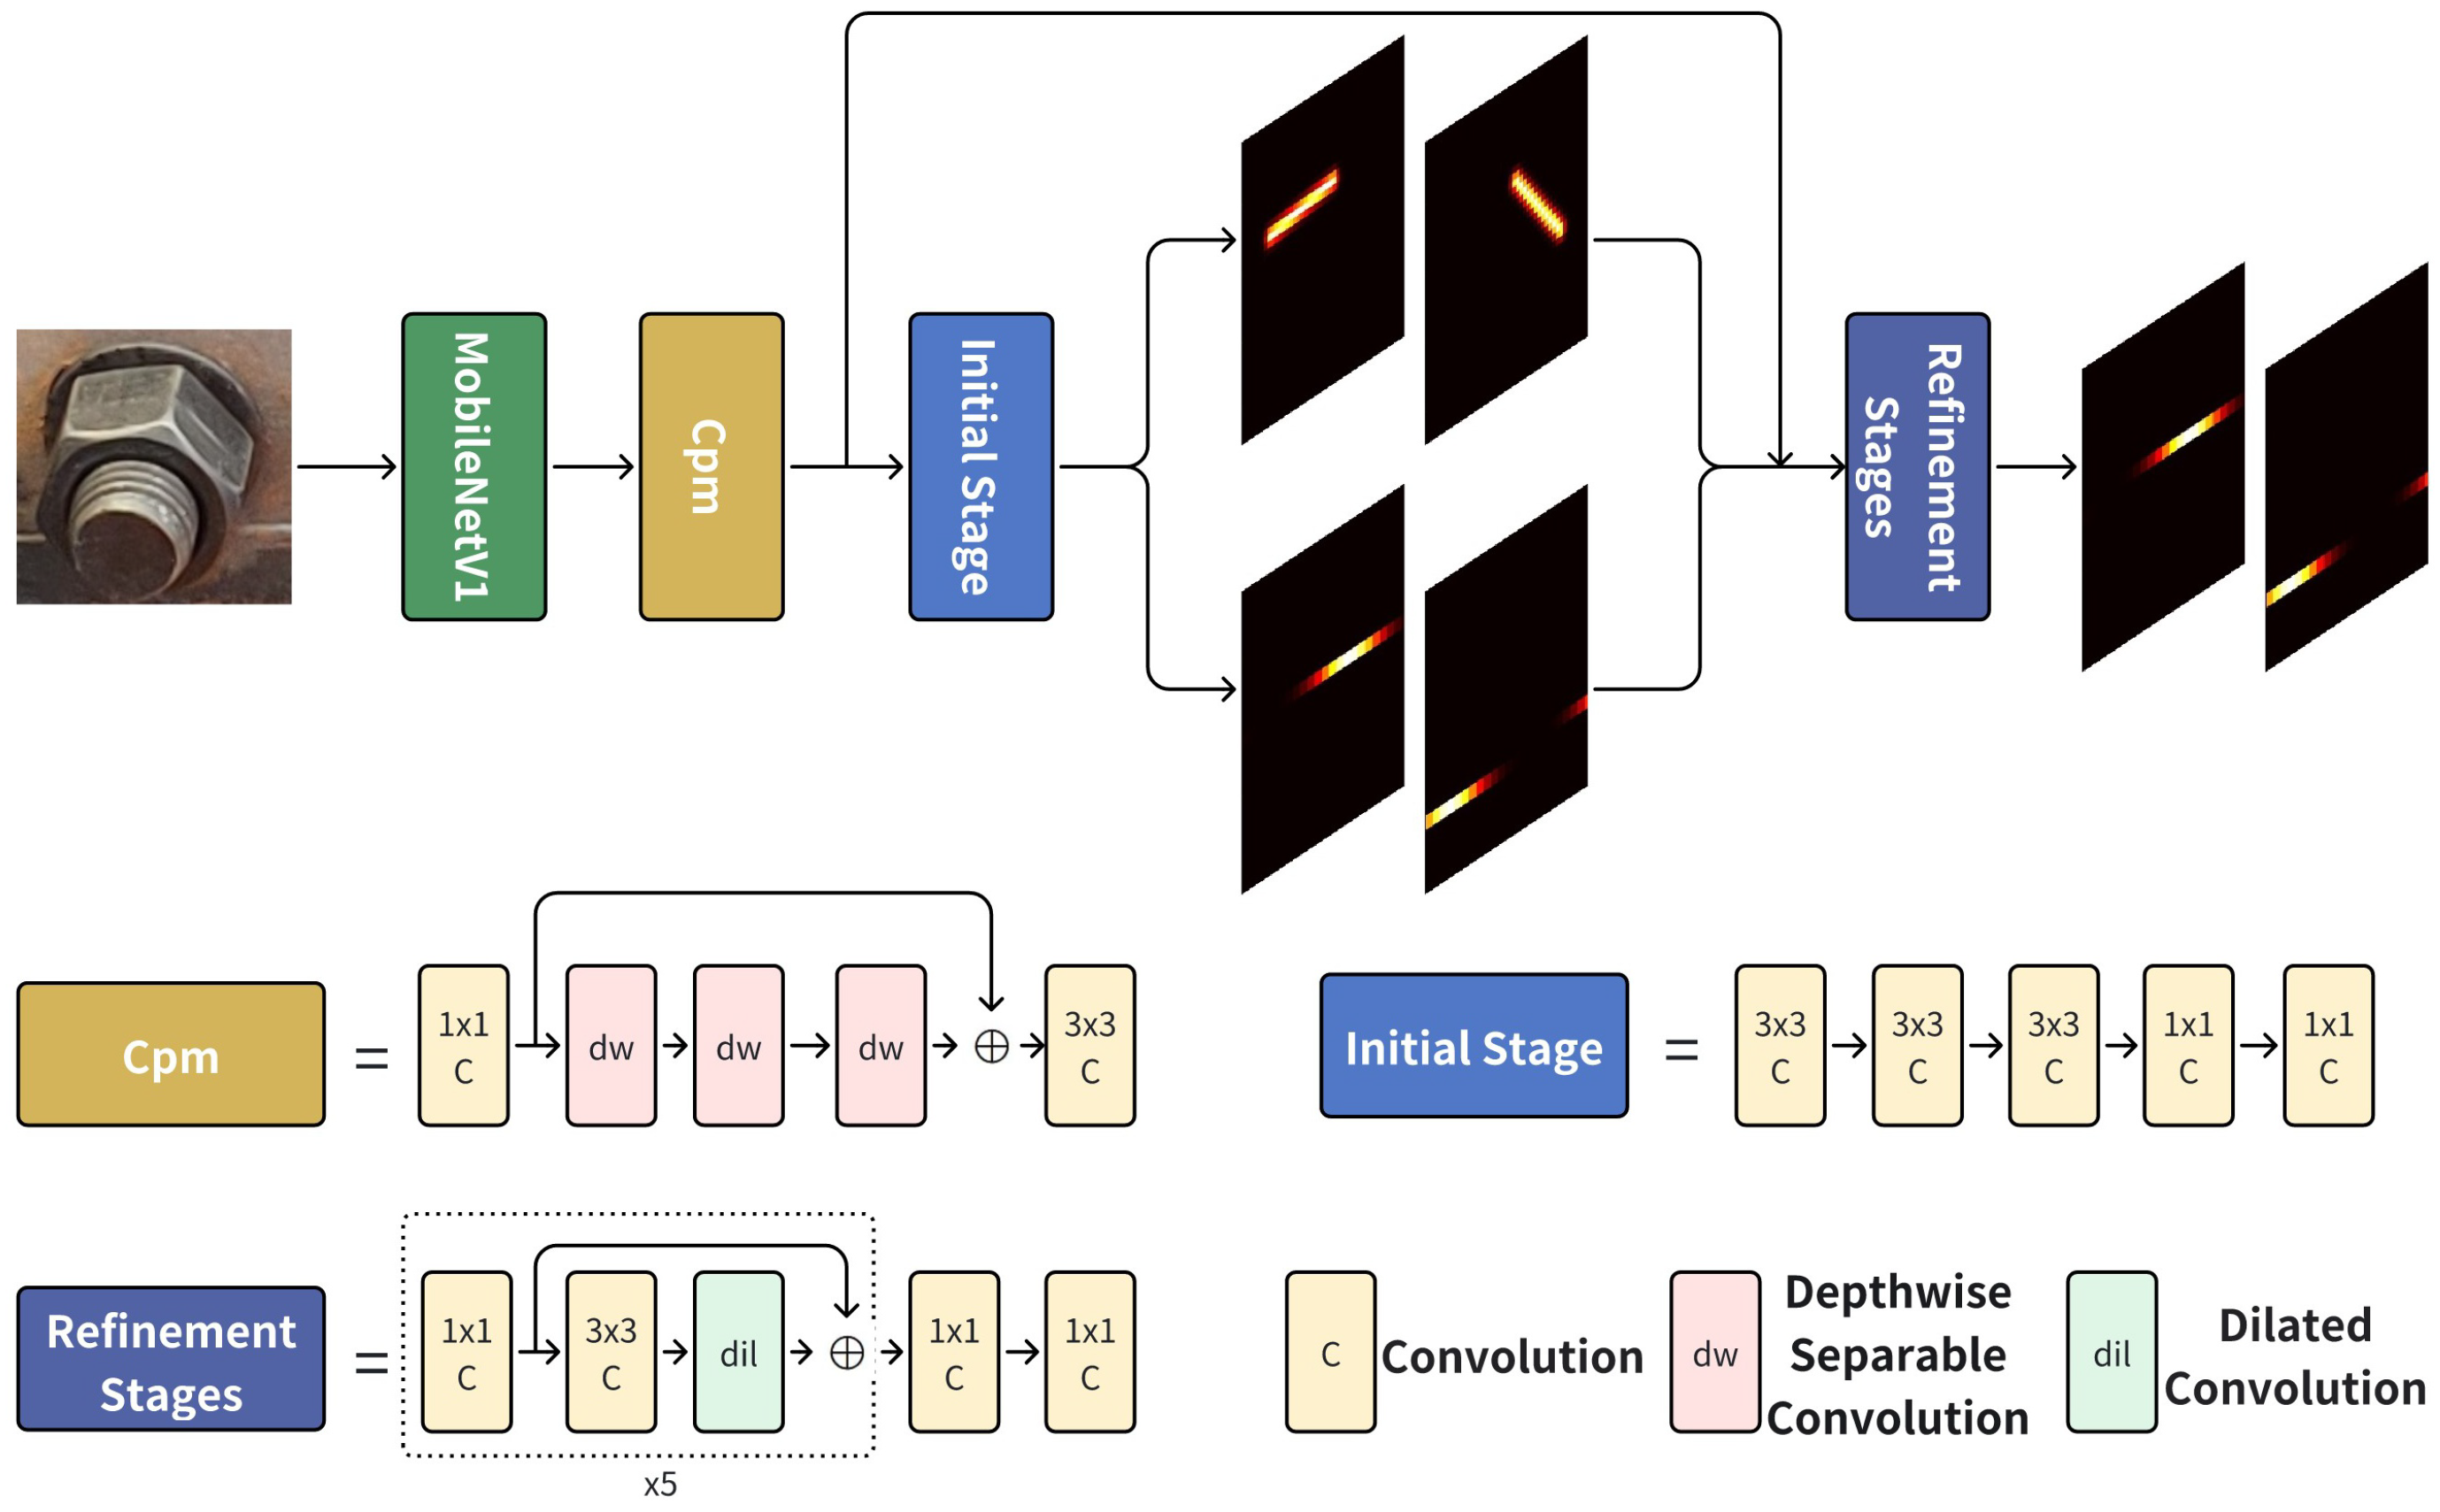
OpenPose is originally a multi-stage CNN architecture designed for human pose estimation, and Lightweight OpenPose represents its lightweight variant. In its original form, the network includes two output branches at each stage—one for predicting human keypoints and another for their interconnections. In this study, these branches are repurposed to predict spatial positional information and angular information of bolt key edges. However, since only angular comparisons are required in the final output, the last stage retains a single branch dedicated to angle prediction.
As shown in
Figure 6, the network operates in a cascaded manner. The first stage employs the lightweight MobileNetV1 backbone to extract hierarchical features from input images. In the second stage, depthwise separable convolutions are used to rapidly compress and reduce the feature dimensions, optimizing computational efficiency. The third stage generates the initial spatial position and angular information of the bolt key edges, based on the compressed features. In the fourth stage, the outputs from the second and third stages are fused and refined using dilated convolutions, expanding the receptive fields to capture broader contextual relationships. Ultimately, the network produces a Gaussian circular label map that encodes the angular deviations for each key bolt edge.
2.6. Bolt Loosening Detection
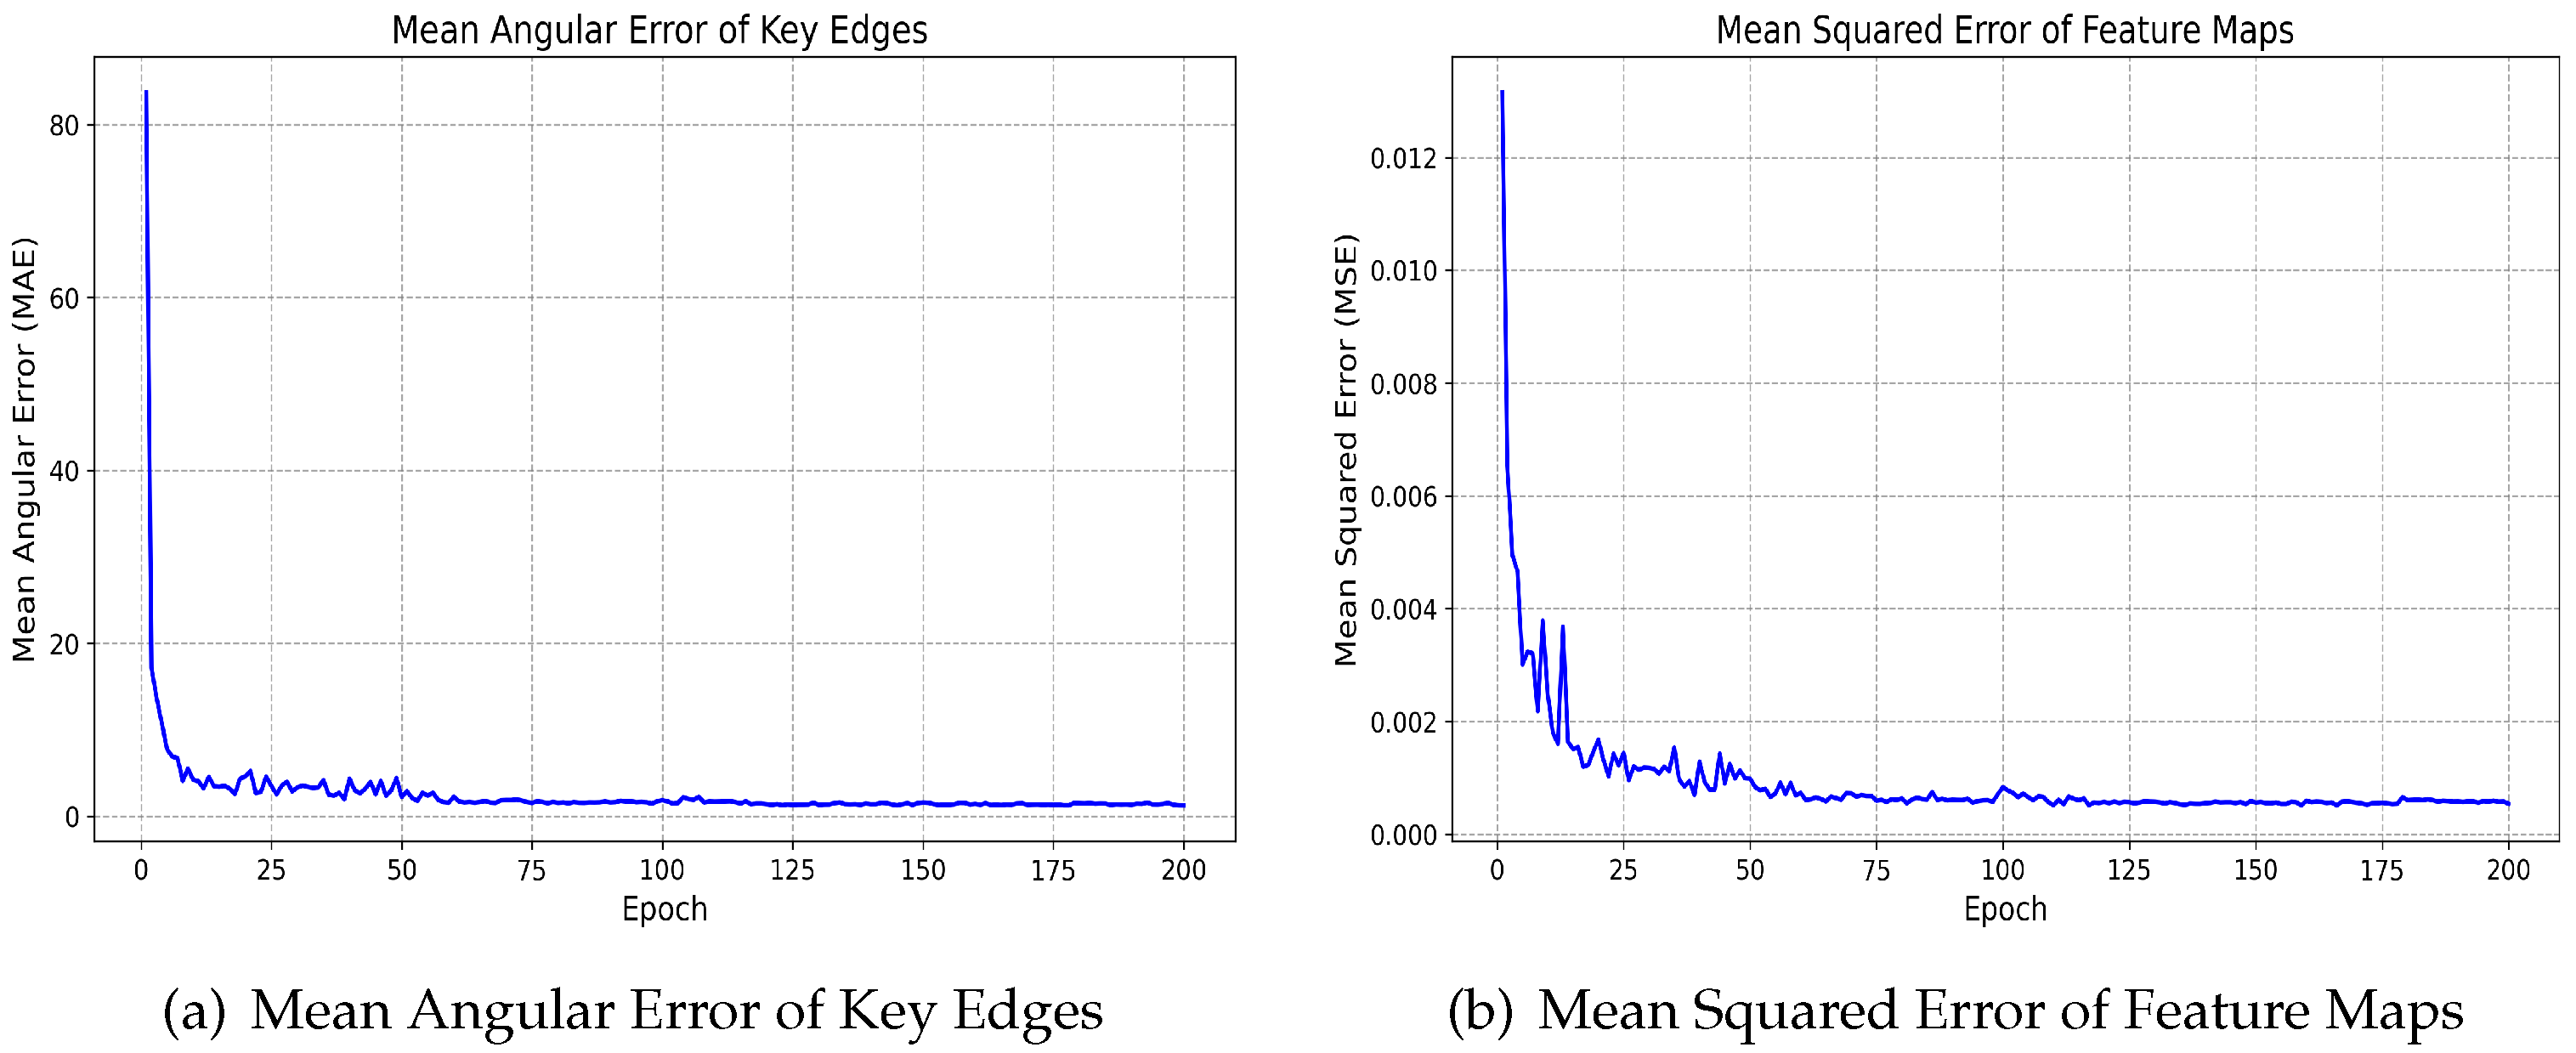
After processing with the bolt angle recognition model, Gaussian circular smooth label maps of the two highest-priority key edges of the bolt can be obtained. Prior to angle calculation, the feature maps are first flattened:
where
F represents the predicted Gaussian circular smooth label map, and
s denotes the side length of the feature map. The predicted key edge angle is then derived by projecting the maximum value in the smoothed label onto the angular interval:
Finally, the bolt loosening angle is determined by comparing the average angular difference of key edges across distinct temporal frames:
where
n is the number of key edges,
and
represent different temporal frames, and
corresponds to distinct key edges. Due to inherent errors in the angle recognition model, a threshold must be defined to identify bolt loosening. A bolt is flagged as potentially loosened when the loosening angle exceeds this threshold. In this study, the threshold is set to three times the mean error of the angle recognition model results.


